Presentation type:
BG – Biogeosciences

The amount of CO₂ taken up by plants (gross primary production) is the largest flux in the terrestrial carbon cycle. However, the uncertainty in how much CO₂ plants absorb is larger than annual anthropogenic CO₂ emissions. This means that small changes in plant uptake could drastically alter the carbon balance, making climate predictions more challenging. A better understanding of the terrestrial carbon cycle is essential for predicting future climate conditions and atmospheric CO₂ mole fractions. Stable isotope measurements of CO₂ (δ13C and δ18O) provide valuable insights into the magnitude of CO₂ fluxes between the atmosphere and biosphere.

Recent advancements in measurement techniques have made it possible to measure ∆′17O in atmospheric CO₂ with high precision. These high-precision measurements provide valuable constraints on terrestrial carbon fluxes that δ13C and δ18O alone could not achieve. This is because ∆′17O(CO₂) has a known stratospheric source, its variations are much smaller than those of δ18O, and conventional biogeochemical processes follow a well-defined three-isotope fractionation slope. Additionally, the triple oxygen isotope fractionation slopes for specific processes are independent of source water isotope composition, insensitive to temperature, and process specific.

In this talk, I will discuss the broader applications of ∆′17O in atmospheric CO₂ research, the challenges associated with high precision ∆′17O measurements, the latest advancements in measurement techniques, and future implications for studying the terrestrial carbon cycle.

How to cite: Adnew, G. A.: ∆′17O of Atmospheric CO2 as a tracer for gross fluxes of terrestrial carbon cycle, EGU General Assembly 2025, Vienna, Austria, 27 Apr–2 May 2025, EGU25-3819, https://doi.org/10.5194/egusphere-egu25-3819, 2025.

EGU25-9776 | Orals | MAL33-BG

Carbon storage by the ocean in a changing climate 

Corinne Le Quéré

The ocean carbon cycle is a critical component of the climate system. Each year, the ocean absorbs approximately a quarter of the CO2 emitted to the atmosphere from human activities, playing a vital role in mitigating climate change. The ocean will ultimately sequester the majority of these emissions over centuries and beyond, thus regulating atmospheric CO2 concentration and climate stabilisation in the long term. Understanding the mechanisms and drivers of the observed trends and variability in ocean carbon storage is therefore essential for reducing uncertainty in long-term climate projections.

Trends and variability in ocean carbon storage arise from a complex interplay of factors, including atmospheric CO2 growth, warming, ocean acidification, physical ocean dynamics, and marine ecosystem changes. While the physico-chemical effects of warming and ocean acidification on the ocean carbon cycle are well-known, the impacts of large-scale changes in ocean circulation remain less well understood. Notably, shifts in surface winds over the Southern Ocean and a weakening Atlantic Meridional Ocean Circulation could induce important changes in carbon storage that are poorly quantified. Changes in marine ecosystems under multiple stressors and their effect on the marine carbon cycle remain poorly constrained and were categorized as a “known-unknown” in the last four assessment reports of the Intergovernmental Panel on Climate Change (IPCC).

In this lecture, I will synthesise recent understanding of the drivers of trends and variability in ocean carbon storage, focusing on timescales ranging from years to centuries. I will present new insights into how marine ecosystem shape carbon dynamics and discuss how changes in ecosystems could influence the ocean carbon storage well beyond 2100. These insights underscore the need to develop new and better integrated “Ocean Systems Models” that include more detailed representations of marine ecosystems and their interactions with biogeochemical cycles.

How to cite: Le Quéré, C.: Carbon storage by the ocean in a changing climate, EGU General Assembly 2025, Vienna, Austria, 27 Apr–2 May 2025, EGU25-9776, https://doi.org/10.5194/egusphere-egu25-9776, 2025.

EGU25-208 | ECS | Posters virtual | VPS4

Mapping Alpine Treeline Ecotones in the Tungnath Himalaya Using Terrestrial Laser Scanning and GEDI LiDAR 

Jincy Mathew, Chandra Prakash Singh, Hitesh Solanki, and Dhruvi Sedha

Alpine treeline ecotones are extremely vulnerable to climate change, making them important early warning systems in climate research. Advanced remote sensing tools, such as Light Detection and Ranging (LiDAR), enable detailed mapping and monitoring of these high-altitude zones, offering critical baseline data for future change detection. This study combines ground-based Terrestrial Laser Scanning (TLS) and space borne Global Ecosystem Dynamics Investigation (GEDI)- LiDAR data to analyze the structural attributes and delineate the position of alpine treelines in the Tungnath Himalaya, India, located at elevations between 3252 and 3,590 meters above mean sea level (a.m.s.l).  TLS provided high-resolution three-dimensional data on alpine vegetation, including tree height, diameter at breast height (DBH), and canopy structure. Using an automated algorithm, 84.84% of individual trees were segmented from TLS data. TLS-derived tree height and DBH estimates achieved root mean square errors of 44.74 cm and 78.45 cm, respectively, compared to field-measured values. A semi-automated method using GEDI LiDAR identified trees taller than 3 meters to delineate the treeline, achieving a positional accuracy of ~ ±40 m a.m.s.l when validated against TLS-derived data.  The results show that combining TLS with GEDI provides a non-destructive and effective method for assessing treeline structure and location in the Indian Himalaya. Future research might use multi-temporal LiDAR datasets to track treeline movements and obtain a better understanding of the long-term effects of climate change on alpine ecosystems.

How to cite: Mathew, J., Singh, C. P., Solanki, H., and Sedha, D.: Mapping Alpine Treeline Ecotones in the Tungnath Himalaya Using Terrestrial Laser Scanning and GEDI LiDAR, EGU General Assembly 2025, Vienna, Austria, 27 Apr–2 May 2025, EGU25-208, https://doi.org/10.5194/egusphere-egu25-208, 2025.

EGU25-885 | ECS | Posters virtual | VPS4

Wetland Health in Transition: Resilience and Ecosystem Services Amid Urbanization and Land-Use Change 

Alka Yadav, Mitthan Lal Kansal, and Aparajita Singh

The accelerated pace of urbanization, population growth, and extensive land-use changes has significantly disrupted the ecological balance and functionality of riverine wetland ecosystems, leading to substantial degradation of wetland health. This study evaluates the health and resilience of the Upper Ganga Riverine Wetland (UGRW) in India, which has experienced significant land-use transformations over the past two decades. The analysis highlights the wetland's resilience to various natural and anthropogenic stresses and its ability to sustain critical ecosystem services, including provisioning, regulating, cultural, and supporting services. The findings reveal drastic land-use and land-cover (LULC) changes, with built-up areas increasing by 245%, while forest and wetland areas decreased by 41% and 8%, respectively, between 2000 and 2020. These transformations have led to a marked decline in ecosystem resilience (23%) and a substantial reduction in ecosystem service values (ESVs), which decreased from 2138.28 million USD in 2000 to 1769.16 million USD in 2020—an overall loss of 18%. Urban expansion, deforestation, and wetland fragmentation have further exacerbated the decline in wetland health, diminishing its ecological balance and capacity to deliver vital services. This study underscores the urgent need for integrated environmental management strategies to mitigate the impact of LULC changes, conserve wetland ecosystems, and enhance their resilience. By assessing ecosystem services and their dependence on sustainable land use, this research provides critical insights for policymakers and stakeholders. It emphasizes the necessity of balancing developmental priorities with ecological preservation, offering a strategic framework to foster sustainability and resilience in one of India’s most vital riverine landscapes.

How to cite: Yadav, A., Kansal, M. L., and Singh, A.: Wetland Health in Transition: Resilience and Ecosystem Services Amid Urbanization and Land-Use Change, EGU General Assembly 2025, Vienna, Austria, 27 Apr–2 May 2025, EGU25-885, https://doi.org/10.5194/egusphere-egu25-885, 2025.

EGU25-1026 | ECS | Posters virtual | VPS4

Meta-analysis of direct nitrous oxide emissions and ammonia volatilization from irrigated wheat in calcareous soils under semi-arid conditions 

Rayehe Mirkhani, Mahsa Jabbari Malayeri, Behnam Naserian Khiabani, Seyed Majid Mousavi, Mohammad Hadi Ghafariyan, Mohammad Sajad Ghavami, Gerd Dercon, Mehdi Shorafa, and Lee Kheng Heng

Nitrous oxide (N2O) is the most important stratospheric ozone-depleting gas of the 21st century. Most N2O emissions occur in soils and are associated with agricultural activities. Ammonia (NH3) is not a greenhouse gas, but it can indirectly contribute to greenhouse gas emissions. NH3 volatilization is an important indirect N2O emission pathway in agricultural systems. In addition, NH3 can have significant effects on both human health and the natural environment, and its emissions negatively affect biodiversity. A meta-analysis was conducted to evaluate NH3 and N2O losses and the effectiveness of adding urease and nitrification inhibitors on direct N2O emissions and NH3 volatilization. Data were used from 14 separate studies that simultaneously investigated direct N2O emissions and NH3 volatilization from irrigated wheat. All studies were conducted on irrigated wheat in semi-arid climates and on calcareous soils with urea application. The average direct N₂O emission factor for irrigated wheat was 0.4%. Our results showed that, on average, nitrification inhibitors reduced direct N2O emissions by 35% and increased NH3 volatilization by 29%. The average NH3 emission factor was 32% and urease inhibitors reduced NH3 volatilization by 41%. The results showed that indirect N2O emissions from NH3 volatilization should be considered in these conditions.

How to cite: Mirkhani, R., Jabbari Malayeri, M., Naserian Khiabani, B., Mousavi, S. M., Ghafariyan, M. H., Ghavami, M. S., Dercon, G., Shorafa, M., and Kheng Heng, L.: Meta-analysis of direct nitrous oxide emissions and ammonia volatilization from irrigated wheat in calcareous soils under semi-arid conditions, EGU General Assembly 2025, Vienna, Austria, 27 Apr–2 May 2025, EGU25-1026, https://doi.org/10.5194/egusphere-egu25-1026, 2025.

Seasonally different precipitation infiltration under monsoon humid areas may drive changes of groundwater flow systems and possible nitrate transformation processes in groundwater. In this study, dissolved greenhouse gases, noble gases concentrations (N2 and Ar) and isotopes of N2O were used to quantitively identify nitrification and denitrification to reveal spatial and temporal characterization of nitrate transformation in typical groundwater flow profiles in the Qingyi River basin, east China. In dry and wet seasons, the recharge altitudes of groundwater were distinctive and dominant nitrate transformation processes differed spatially and temporally. According to the N2-Ar estimation, the recharge altitudes of groundwater in dry season were higher than those in wet season, indicating obviously less proportion of precipitation from lower altitudes and relatively increased proportion of recharge from regional recharge areas in dry season, whereas local groundwater flow systems were preferentially developed in wet season. Denitrification is commonly observed in groundwater during the dry season, with positive Excess-N2 concentrations and phenomena that N2O concentrations initially accumulate with progress of denitrification but later decrease due to enhanced N2O reduction. In the wet season, nitrification is the dominant process in groundwater, with only a small portion of groundwater exhibiting denitrification, resulting in positive Excess-N2 concentrations. In this case, N2O concentrations initially increase during nitrification but later decline due to incomplete denitrification. Quantitative results based on δSP-N2O isotopes indicated that the maximum contribution of nitrification in groundwater during the wet season ranged from 52.8% to 100%, with an average of 77.3%. The contributions from denitrification and N2O reduction in wet season are limited, which is consistent with results identified by nitrate and ammonium isotopes. Spatially, due to more reducing redox environment in regional groundwater flow systems, the denitrification progress (DP) in most groundwater in discharge zones exceeds 99%, with denitrified NO3 concentrations reaching up to 25.72 mg/L, significantly higher than the average DP values in recharge zones (27.7%) and transition zones (31.6%).

How to cite: Huang, X.: Identification of nitrification and denitrification along groundwater flow paths using dissolved N2, Ar, and N2O in typical groundwater flow systems in the Qingyi River basin, EGU General Assembly 2025, Vienna, Austria, 27 Apr–2 May 2025, EGU25-1233, https://doi.org/10.5194/egusphere-egu25-1233, 2025.

EGU25-1419 | ECS | Posters virtual | VPS4

Mangroves and their services are at risk from climate-modified tropical cyclones and sea level rise  

Sarah Hülsen, Laura Dee, Chahan Kropf, Simona Meiler, and David Bresch

Climate change is expected to alter the frequency and intensity of extreme events, modifying the natural disturbance regimes to which ecosystems are currently adapted. Here, we present a spatially explicit risk index for mangroves and their associated biodiversity and ecosystem services based on projected frequency changes of tropical cyclone wind speeds and rates of relative sea level rise under SSPs 245, 370 and 585 by 2100.

To compute the risk index, we calculate the relative change of tropical cyclone frequency across different wind speed intensity categories based on probabilistic tropical cyclone tracks downscaled from 3 different CMIP6 models of varying climate sensitivity. This data is then combined with thresholds of sea level rise which are estimated to exceed mangrove adaptive capacity and mapped onto global mangrove extents.

Globally, approximately half of the total mangrove area (40-56% depending on the SSP) will be at high to severe levels of risk due to climate-modified tropical cyclone disturbance regimes. Further, we find mangrove areas with high levels of biodiversity and ecosystem services provision, including coastal protection for people and assets, carbon sequestration, and fishery benefits, are at proportionally higher levels of risk than mangrove forests generally. We also identify mangrove areas which are projected to experience non-analog tropical cyclone disturbances in the future. Our findings emphasize the need to anticipate changes in natural disturbance regimes to adapt ecosystem management, sustain ecosystem services in the future, and fully realize mangroves’ potential as nature-based solutions (NBS).

How to cite: Hülsen, S., Dee, L., Kropf, C., Meiler, S., and Bresch, D.: Mangroves and their services are at risk from climate-modified tropical cyclones and sea level rise , EGU General Assembly 2025, Vienna, Austria, 27 Apr–2 May 2025, EGU25-1419, https://doi.org/10.5194/egusphere-egu25-1419, 2025.

   Abstract

This study explores advanced remote sensing, geophysical, and geospatial methodologies applied to the geologically diverse Aït Semgane region in Morocco. A multi-disciplinary approach was adopted, combining (1) automated lineament extraction using Digital Elevation Models (DEMs) and various topographic indices, (2) lithological classification leveraging machine learning algorithms on multispectral data, and (3) the integration of magnetic data to enhance geological interpretation.

For lineament analysis, approaches such as the Topographic Position Index (TPI), Hillshade, and shading models were applied to datasets including SRTM, ALOS PALSAR, and Sentinel-1 InSAR. Results highlighted the TPI method’s high sensitivity in detecting tectonic features, especially in NE-SW and E-W orientations, aligning with established geological knowledge. Cartographic analysis revealed fault density concentrations in the NW and southern sectors, confirming the tectonic complexity of the region.

Lithological classification was conducted using Support Vector Machines (SVM), Random Trees (RT), and Artificial Neural Networks (ANN) applied to Landsat 9 and Sentinel-2 data. SVM, particularly with Minimum Noise Fraction (MNF) transformation, consistently outperformed other algorithms, achieving high classification accuracies and well-defined lithological boundaries. The integration of dimensionality reduction techniques like MNF proved crucial for enhancing classification quality, while PCA showed limited efficacy.

Magnetic data were incorporated to validate and refine the tectonic and lithological interpretations, offering additional insights into subsurface structures and enhancing the understanding of fault systems and mineralized zones.

This research demonstrates the synergy between automated lineament extraction, machine learning-based lithological mapping, and magnetic data for improving geological analysis. The methodologies applied here have practical implications for mineral exploration and tectonic studies, offering robust tools for mapping complex terrains. Future research will aim to refine dimensionality reduction techniques, explore hyperspectral datasets, and further integrate geophysical data to enhance geological mapping accuracy.

How to cite: El-Omairi, M. A. and El Garouani, A.: Integrating Automated Lineament Extraction, Magnetic Data, and Machine Learning-Based Lithological Mapping in the Anti Atlas, Morocco, EGU General Assembly 2025, Vienna, Austria, 27 Apr–2 May 2025, EGU25-2041, https://doi.org/10.5194/egusphere-egu25-2041, 2025.

Tidal wetland reclamation could profoundly alter ecological function and ecosystem service provision, but its impacts on sediment microbial communities and functions remain poorly understood. We investigated spatial and seasonal patterns of greenhouse gases (GHGs) production response to land-use changes in mangrove wetlands and unraveled the underlying mechanisms by integrating environmental parameters and microbial communities. Land-use changes substantially reduced microbial community richness and diversity and shaped their composition. Converting mangrove to drier orchard and vegetable field reduced sediment organic matter, carbon GHGs production rates, and microbial network complexity and stability, while increased N2O production rates. Converting mangrove to chronically flooded aquaculture pond increased sediment CH4 production rates, but reduced N2O and CO2 production rates. Although increasing anthropogenic disturbance in aquaculture pond have reduced microbial community richness and diversity compared to native mangrove wetland, they have increased complexity of species associations resulting in a more complex and stable network. Microbial community richness and network complexity and stability were strongly related to CH4 and N2O production rates, but not significantly associated with CO2 production rates, suggesting microbial community richness, network complexity and stability are better predictors of the specialized soil/sediment functions CH4 and N2O production). Therefore, preserving microbial “interaction” could be important to mitigate the negative effects of microbial community richness and diversity loss caused by human activities. Furthermore, as the residual bait accumulation is a severe issue in aquaculture activities, we especially focused on the influence of bait input at time scale through a 90-day incubation experiment, aiming to observe temporal variations of physicochemical properties, sediment microbial community, and GHGs production in response to different amounts of bait input. The results showed that dissolved oxygen of overlying water was profoundly decreased owing to bait input, while dissolved organic carbon of overlying water and several sediment properties (e.g., organic matter, sulfide, and ammonium) varied in reverse patterns. Meanwhile, bait input strongly altered microbial compositions from aerobic, slow-growing, and oligotrophic to anaerobic, fast-growing, and copiotrophic. Moreover, both GHGs production and global warming potential were enhanced by bait input, implying that aquaculture ecosystem is an important hotspot for global GHGs emission. Overall, bait input triggered quick responses of physicochemical properties, sediment microbial community, and GHGs production, followed by long-term resilience of the ecosystem. Future research should comprehensively consider microbial diversity, species composition and interaction strength, functions, and environmental conditions to accurately predict soil/sediment functioning and emphasize the necessity of sustainable assessment and effective management.

How to cite: Lin, G. and Lin, X.: Responses of greenhouse gases production to land-use change and the underlying microbial mechanisms in mangrove wetlands, EGU General Assembly 2025, Vienna, Austria, 27 Apr–2 May 2025, EGU25-2079, https://doi.org/10.5194/egusphere-egu25-2079, 2025.

EGU25-2383 | Posters virtual | VPS4

Hydrological responses to vegetation-climate interactions at two subtropical forested watersheds of Taiwan 

Chung-Te Chang, Jun-Yi Lee, Jyh-Min Chiang, Hsueh-Ching Wang, Cho-ying Huang, and Jr-Chuan Huang

Forested upstream watersheds support clean freshwater and maintaining stable hydrological conditions of ecosystem services. The associations between vegetation growth and climatic variations play a vital role on hydrological regimes that are region-dependent, but the associations of climate-phenology-hydrology have rarely been investigated in tropical/subtropical regions particularly. In this analysis, the hydroclimate records (1991-2020) at two long-term studied forest watersheds, Fushan (FS) and Leinhuachi (LHC) experimental forest, Taiwan were used, and showed that the incidences of meteorological and hydrological droughts are becoming prominent after 2001. We further investigated the effects of monthly climate variables (temperature and precipitation) on vegetation growth using monthly PV (photosynthetic vegetation fraction) of a watershed derived from MODIS (Moderate Resolution Imaging Spectroradiometer), and examined the effects of spring and summer rainfall on the variations of vegetation phenological patterns and subsequent watershed streamflow during 2001–2020. The PV and temperature showed a linear relationship without time-lag effect (R2 = 0.51-0.57, p < 0.001), whereas PV and precipitation exhibited no time-lag in FS but a log-linear relationship with 2-month lag (R2 = 0.15-0.59, p < 0.001) existed in LHC, indicating the accumulation of rainfall during relatively dry season (winter-spring) was critical for vegetation growth. Structural equation modeling (SEM) revealed that earlier start of growing season (SOS) caused by relatively high spring rainfall (February-March) led to longer growing season (LOS) and higher P-Q deficit (precipitation minus runoff) during the growing season in LHC. Nevertheless, the large amount of precipitation during growing season has no effect on the end of growing season (EOS), LOS and P-Q deficit. Neither EOS has influence on LOS and P-Q deficit. However, these patterns were not found in FS. Understanding the vegetation responses to climatic variations is required for future hydrologic regime projections, especially under changing climate.

How to cite: Chang, C.-T., Lee, J.-Y., Chiang, J.-M., Wang, H.-C., Huang, C., and Huang, J.-C.: Hydrological responses to vegetation-climate interactions at two subtropical forested watersheds of Taiwan, EGU General Assembly 2025, Vienna, Austria, 27 Apr–2 May 2025, EGU25-2383, https://doi.org/10.5194/egusphere-egu25-2383, 2025.

EGU25-2449 | Posters virtual | VPS4

Sorption Behavior of Rhamnolipid Biosurfactant on Peat 

ReddyPrasanna Duggireddy and Gilboa Arye

Surfactants are extensively utilized across agriculture, pharmaceuticals, and environmental remediation due to their ability to modify surface and interfacial properties. In horticulture, wetting agents and synthetic surfactants are commonly employed to mitigate water repellency in organic growing media, particularly peat-based substrates. These agents are known to aid the substrate’s wettability and improve physical and hydraulic properties, optimizing plant growth and productivity. However, environmental persistence and the potential ecotoxicity of synthetic surfactants have raised significant concerns, highlighting the need for sustainable alternatives. Biosurfactants, particularly rhamnolipids, have gained considerable attention for their biodegradability and surface-active properties both at the scientific and commercial levels. Despite their potential, a comprehensive understanding of the interaction between rhamnolipid and peat essential for assessing its environmental fate and behavior is inadequate. In this regard, the main objective of this study is to quantify the sorption and desorption dynamics of rhamnolipid in peat using batch equilibrium and kinetic experiments to evaluate its suitability as a surfactant for horticultural systems, optimize application strategies, and assess the transport behavior and environmental implications of residual surfactants. Kinetic analysis revealed rapid initial adsorption followed by a gradual approach to equilibrium, with the adsorption and desorption kinetics being well described by the Elovich equation, indicating a chemisorption-dominated process. Furthermore, desorption followed both the Elovich and pseudo-first-order models, illustrating a complex and rate-dependent release process likely influenced by heterogeneous retention of rhamnolipid on the peat surface. Equilibrium analysis demonstrated that the adsorption data were best fitted by the Freundlich model, reflecting the heterogeneous nature of the peat surface and the complexity of its adsorption sites. Sequential desorption experiments exhibited notable hysteresis with reduced desorption efficiency, suggesting strong retention of rhamnolipid on the peat particles. These findings highlight the potential of rhamnolipid as a sustainable alternative to synthetic surfactants for mitigating water repellency in peat-based growing media. Equilibrium and kinetic modeling results will be presented with a comprehensive discussion of their practical implications, providing critical insights into their environmental significance and potential applications in horticultural systems.

Keywords: Water repellant peat, sorption, rhamnolipid biosurfactant

How to cite: Duggireddy, R. and Arye, G.: Sorption Behavior of Rhamnolipid Biosurfactant on Peat, EGU General Assembly 2025, Vienna, Austria, 27 Apr–2 May 2025, EGU25-2449, https://doi.org/10.5194/egusphere-egu25-2449, 2025.

Human activities have increased nitrogen (N) and phosphorus (P) deposition, disrupting microbial activity and altering N-P cycling. Understanding how nutrient limitations and additions affect soil microbes is critical for predicting ecosystem succession and mitigating greenhouse gas emissions. Leveraging long-term N-P addition experiments in a subtropical forest, we developed an enhanced Microbial-ENzyme Decomposition (MEND) model by incorporating an enzyme-mediated P module. Following rigorous calibration and validation with multi-source data, we found that N-P addition has antagonistic effects on main fluxes, with P application mitigating N stimulation of fluxes and partially reducing N₂O emissions. On this basis, we refined the nitrogen saturation hypothesis (NSH) for subtropical ecosystems by attributing divergent nitrification patterns to ammonia inhibition, and we expanded the hypothesis to encompass denitrification and N fixation. By integrating microbiome data, we demonstrated the intrinsic effects of N addition on N cycle through differential expression of genes due to community change, while P addition can counteract effects of N increase by alleviating microbial P limitations. Additionally, we highlight the significance of microbial-enzyme activities feedback in regulating P cycle to maintain ecological balance. Integrating microbially-enabled C-N-P model with diverse experimental data, particularly microbiome information, enhances interpretability and reveals ecosystem mechanisms beyond direct experimental observation.

How to cite: Lv, Z.: Refining the nitrogen saturation hypothesis by accounting for microbial roles in nitrogen and phosphorus cycling, EGU General Assembly 2025, Vienna, Austria, 27 Apr–2 May 2025, EGU25-2779, https://doi.org/10.5194/egusphere-egu25-2779, 2025.

EGU25-4681 | ECS | Posters virtual | VPS4

Keystone taxa drive the synchronous production of methane and refractory dissolved organic matter in inland waters 

Xinjie Shi, Wanzhu Li, Baoli Wang, Meiling Yang, and Cong-Qiang Liu

Inland waters are an important source of greenhouse gas methane (CH4). The production of CH4 is influenced by various factors, including the concentration of dissolved organic matter (DOM), redox conditions, and the composition of microbial communities, with clear spatiotemporal heterogeneity in inland waters. Refractory DOM (RDOM) can resist rapid biodegradation and preserve up to thousands of years; therefore, it is important for assessing the natural carbon sequestration potential of aquatic ecosystems. As a critical part of carbon biogeochemical processes in inland waters, the production of CH4 and RDOM depends on the microbial successive processing of organic carbon. However, it is unclear yet the link of these two processes and the underlying microbial regulation mechanisms. Therefore, a large-scale survey was conducted in China’s inland waters, with the measurement of CH4 concentrations, DOM chemical composition, microbial community composition, and relative environmental parameters mainly by chromatographic, optical, mass spectrometric, and high-throughput sequencing analyses, to clarify the abovementioned questions. Here, we found a synchronous production of CH4 and RDOM linked by microbial consortia in inland waters. The increasing microbial cooperation driven by the keystone taxa (mainly Fluviicola and Polynucleobacter) could promote the transformation of labile DOM into RDOM and meanwhile benefit methanogenic microbial communities to produce CH4. This process was also influenced by environmental factors such as total nitrogen and dissolved oxygen concentrations. Future studies need to combine more field investigations and laboratory control experiments to fully understand these complex processes. This study deepened the understanding of microbial-driven carbon transformation and highlighted the role of microbial keystone taxa in these processes, providing some useful references for the future laboratory control experiments (e.g., the selection of microbial species). Considering that CH4 emission and RDOM production are closely related to the carbon source-sink relationship, this finding will help to more accurately evaluate the budget in inland aquatic ecosystems.

How to cite: Shi, X., Li, W., Wang, B., Yang, M., and Liu, C.-Q.: Keystone taxa drive the synchronous production of methane and refractory dissolved organic matter in inland waters, EGU General Assembly 2025, Vienna, Austria, 27 Apr–2 May 2025, EGU25-4681, https://doi.org/10.5194/egusphere-egu25-4681, 2025.

EGU25-4724 | Posters virtual | VPS4

Multiple Redevelopment of Brownfields 

Jurgen van der Heijden

Pollution places an 'everlasting' burden on brownfields, with a lot of money going towards the management of sites where nothing happens. Action is administratively unattractive, and managers and area developers find it difficult to connect. The development of the surrounding area is also halted. This limitation is becoming increasingly urgent with the growing spatial pressure due to the energy transition, climate adaptation, and housing needs. However, much more is possible than has been achieved so far; redevelopment is often indeed possible.

Public and private parties can work on upgrading brownfields. This can also generate money to better manage risks. In many places, developing parks to make surrounding residential areas more attractive is popular. Parks also play a role in climate adaptation and increasing biodiversity. Solar panels can be installed along the edges of the park in such a way that greenery is also possible underneath.

Altogether, there are twelve known functions that can upgrade brownfields. The value increases if two or more functions enable each other, such as greenery and solar panels. Upgrading brownfields can be done singly, but can also be multiple by stacking functions. What does this yield, and how do you do that, especially how do you finance a multiple project? The paper discusses the multiple redevelopment of former landfills and particularly the financing thereof.

How to cite: van der Heijden, J.: Multiple Redevelopment of Brownfields, EGU General Assembly 2025, Vienna, Austria, 27 Apr–2 May 2025, EGU25-4724, https://doi.org/10.5194/egusphere-egu25-4724, 2025.

EGU25-5122 | Posters virtual | VPS4

Assessing the application of random forest (RF) to predict water-table (WT) in selected Irish peatlands 

Alina Premrov, Jagadeesh Yeluripati, Florence Renou-Wilson, Kilian Walz, Kenneth A. Byrne, David Wilson, Bernard Hyde, and Matthew Saunders

Abstract
Peatlands are important global terrestrial carbon (C) sink. Most of Irish peatlands have been 
influenced in past by anthropogenic management, primarily through drainage for forestry, 
agriculture, or energy and horticultural extraction. Given the recent Irish peatland restoration 
activities, it is essential to deepen our understanding of the key drivers of peatland C-dynamics 
and to improve methodologies for reporting and verifying terrestrial CO2 removals/emissions 
from drained and restored peatlands. The dependency of CO2 fluxes on water-table (WT) levels 
in peatland ecosystems, under different land-use (LU), has been recognised in existing literature 
[1], indicating on the importance of accounting for WT variable in predictive models. This study 
focuses on assessing the application of random forest (RF) to predict WT in total eight Irish 
peatland sites under different LU (natural, rewetted, forest, grassland), which were monitored - 
i.e. low-level Irish blanket-bog sites from Co. Mayo and raised-bog sites from Co. Offaly [2]. The 
RF was chosen due to its ability to effectively manage mixed-data (numerical and categorical) and 
to provide robust predictions without the need for extensive data-preprocessing. Used were the 
data from ca. 2017 to 2020 on-site measurements [2], as well as the selected geospatial data 
derived from E-OBS daily grided-meteorological dataset [4]. The RF was applied to a number of 
numerical and categorical variables, by splitting the data into training- and testing-datasets. 
Hyperparameter tuning was done using ‘caret’ R-package [5]. Model evaluation (using 
performance metrics) was conducted on WT-predictions from testing-dataset. While findings 
from this study on selected eight Irish peatland sites indicate a relatively good potential of RF to 
predict WT (R² = 0.78), the work highlights the importance of assessing the ‘variable importance’ 
to reduce the number of variables in the model for practical applicability purposes, as well as to 
include more sites.


Acknowledgements
The authors are grateful to the Irish Environmental Protection Agency (EPA) for funding projects 
CO2PEAT (2022-CE-1100) and AUGER (2015-CCRP-MS.30) [EPA Research Programmes 2021-
2030 and 2014–2020], and to University of Limerick funding.


References
[1] Tiemeyer, B., et al., 2020. A new methodology for organic soils in national greenhouse gas inventories: Data synthesis, derivation and application,
Ecological Indicators, Vol. 109, 105838,  https://doi.org/10.1016/j.ecolind.2019.105838.
[2] Renou-Wilson, F., et. al, 2022. Peatland Properties Influencing Greenhouse Gas  Emissions and Removal (AUGER Project) (2015-CCRP-MS.30), EPA Research Report, Irish Environmental Protection Agency (EPA) https://www.epa.ie/publications/research/climate-change/Research_Report_401.pdf.
[3] Premrov, A., et.al, 2023. Insights into the CO2PEAT project: Improving methodologies for reporting and verifying terrestrial CO2 removals and emissions from Irish peatlands. IGRM2023, Belfast, UK. https://www.researchgate.net/publication/369061601_Insights_into_the_CO2PEAT_project_Im
proving_methodologies_for_reporting_and_verifying_terrestrial_CO2_removals_and_emissions
_from_Irish_peatlands.
[4] Copernicus Climate Change Service, Climate Data Store, (2020): E-OBS daily gridded meteorological data for Europe from 1950 to present derived from in-situ observations. Copernicus Climate Change Service (C3S) Climate Data Store (CDS). https://doi.org/10.24381/cds.151d3ec6.
[5] Kuhn, M. 2008. Building Predictive Models in R Using the caret Package. Journal of Statistical Software, 28(5), 1–26. https://doi.org/10.18637/jss.v028.i05.

How to cite: Premrov, A., Yeluripati, J., Renou-Wilson, F., Walz, K., Byrne, K. A., Wilson, D., Hyde, B., and Saunders, M.: Assessing the application of random forest (RF) to predict water-table (WT) in selected Irish peatlands, EGU General Assembly 2025, Vienna, Austria, 27 Apr–2 May 2025, EGU25-5122, https://doi.org/10.5194/egusphere-egu25-5122, 2025.

EGU25-6451 | Posters virtual | VPS4

Plant Trait-Based Modeling of Forest Succession 

Nikolay Strigul

Gap dynamics is one of the key drivers of forest succession in temperate forests. The primary successional trajectory involves the transition from early to late successional species, each with distinct trait characteristics. I will present a modeling approach to forest successional dynamics based on scaling plant traits from individual to community levels. In this work, the shade tolerance index is statistically linked with plant traits that characterize early and late successional species using the U.S. Forest Inventory dataset. Discrete and continuous mathematical models, represented by Markov chains and autoregressive models, are employed to predict forest dynamics. An individual-based model is also used to assess the robustness of this scaling approach under different disturbance regimes. Overall, modeling forest successional dynamics based on the scaling of shade tolerance-related functional traits from the individual to the ecosystem level addresses major limitations of models based on the traditional stand age metric.

How to cite: Strigul, N.: Plant Trait-Based Modeling of Forest Succession, EGU General Assembly 2025, Vienna, Austria, 27 Apr–2 May 2025, EGU25-6451, https://doi.org/10.5194/egusphere-egu25-6451, 2025.

EGU25-7236 | ECS | Posters virtual | VPS4

Assessment of In-situ Canopy Cover Measurement Techniques and GEDI Vertical Canopy Cover in the Indian Western Himalayan Region 

Akshay Paygude, Hina Pande, and Poonam Seth Tiwari

Global Ecosystem Dynamics Investigation (GEDI) mission, operating from International Space Station, is a full-waveform LiDAR measuring vertical 3-dimensional structure of terrestrial ecosystems. The vertical canopy cover (CC) available from the GEDI L2B product has applications in forest ecosystem, forest health and climate change studies, and management practices. Some studies have assessed the accuracy and uncertainty of the GEDI vertical canopy cover profile product using aerial LiDAR scans and in-situ measurements. However, in-situ measurements taken using angle-of-view effectively produces canopy closure whereas GEDI measures vertical CC. Cajanus tube, regarded as ideal canopy cover measurement technique, is time consuming and impractical for larger areas. In this study, suitable in-situ canopy cover measurement methodologies were assessed alongside GEDI vertical CC. Canopy cover measurements were taken under GEDI footprints in the Indian Western Himalayan region using spherical densiometer, hemispherical photographs and digital canopy photographs with narrow angle-of-view. The plot dimensions were adjusted to accommodate horizontal geolocation uncertainty of GEDI version 2 data products. Following data collection, measurement techniques were assessed based on R-squared, RMSE and MAE.

How to cite: Paygude, A., Pande, H., and Tiwari, P. S.: Assessment of In-situ Canopy Cover Measurement Techniques and GEDI Vertical Canopy Cover in the Indian Western Himalayan Region, EGU General Assembly 2025, Vienna, Austria, 27 Apr–2 May 2025, EGU25-7236, https://doi.org/10.5194/egusphere-egu25-7236, 2025.

Bound biomarkers, which are covalently linked to kerogen or asphaltene macrostructures, exhibit enhanced stability against mixing effects, contamination, and biodegradation. Although previous studies have noted that the results of bound and free biomarkers in assessing sedimentary environment and maturity are not exactly consistent, specific criteria for assessing bound biomarkers have not been proposed. In this study, microscale sealed vessel catalytic hydrogenation (MSSV-Hy) was used to extract bound biomarkers from shale and compare them with free biomarkers. The study demonstrates the reliability of bound biomarkers indices in evaluating depositional environments and maturity, and it systematically compares the differences between bound and free biomarkers. The results revealed that the maturity assessment of bound biomarkers is lower than that of free biomarkers. Additionally, C29 regular steranes are selectively consumed during rapid heating, resulting in a decrease in the input parameters from terrigenous sources. Adjusted criteria for bound biomarkers can more accurately evaluate the sedimentary environment and maturity of shale.

请在此处插入您的摘要 HTML。

How to cite: Yuan, L.: Application of Bound Biomarkers in the Evaluating the Deposition Environment and Maturity of Shale, EGU General Assembly 2025, Vienna, Austria, 27 Apr–2 May 2025, EGU25-7582, https://doi.org/10.5194/egusphere-egu25-7582, 2025.

EGU25-7982 | ECS | Posters virtual | VPS4

Estimating the Potential Greenhouse Gas Emission from Degraded Seagrass Meadows: A Case Study from Thailand's Seagrass Ecosystems 

Muhammad Halim, Milica Stankovic, and Anchana Prathep

The seagrass meadows are critical for organic carbon storage and play a significant role in mitigating climate change. However, the ongoing degradation of the seagrass meadows in Thailand reduces their ability to sequester carbon effectively, potentially contributing to greenhouse gas (GHG) emissions. This study examines variations in carbon storage, carbon metabolism, and GHG emissions across degraded, healthy seagrass and bare sand areas along Andaman Sea, Thailand. The average carbon storage within the surface sediment (top 10 cm) varies across seagrass conditions, with the highest carbon storage in heavy degraded (365.2 ± 206 g C m-2), followed by bare sand (289.5 ± 236 g C m-2) and healthy seagrass (86.47 ± 5.8 g C m-2). Furthermore, degraded seagrass and bare sand exhibited heterotrophic ecosystem functions with an average NCP value of 0.44 ± 0.49 and -0.13 ± 0.79 mmol C m⁻² d⁻¹, respectively. Conversely, healthy seagrass maintained autotrophic ecosystem functions with NCP 1.30 ± 0.508 mmol C m⁻² d⁻¹. The average total carbon sink varied among seagrass conditions, with the highest in degraded seagrass (4328 ± 2395 CO₂-eq m⁻² d⁻¹), compared to bare sand (3981 ± 4120 CO₂-eq m⁻² d⁻¹) and healthy seagrass (1630 ± 0 CO₂-eq m⁻² d⁻¹). The study also revealed that CH4 emissions dominated GHG fluxes in all seagrass conditions, with the highest mean CH₄ fluxes recorded in degraded seagrass (1.16 ± 0.51 µmol m⁻² h⁻¹), followed by bare sand (1.02 ± 0.41 µmol m⁻² h⁻¹) and healthy seagrass (0.48 ± 0.07 µmol m⁻² h⁻¹). On the other hand, the CO2 emissions remained consistently low in both seagrass meadows (healthy and degraded) and bare sand areas. These findings are important to indicate and provide the baseline of GHG emissions for healthy and degraded tropical seagrass meadows.

Keywords: Blue carbon, Climate Change, Emission, Greenhouse gas, Seagrass meadows

How to cite: Halim, M., Stankovic, M., and Prathep, A.: Estimating the Potential Greenhouse Gas Emission from Degraded Seagrass Meadows: A Case Study from Thailand's Seagrass Ecosystems, EGU General Assembly 2025, Vienna, Austria, 27 Apr–2 May 2025, EGU25-7982, https://doi.org/10.5194/egusphere-egu25-7982, 2025.

EGU25-8511 | Posters virtual | VPS4

Microbial phosphorus processing in a gradient of agricultural soil development following mining activity 

Nelly Sophie Raymond, Federica Tamburini, Astrid Oberson, Rüdiger Reichel, and Carsten W Mueller

Open-cast lignite mining significantly disrupts cultivated soils. Restoration and re-cultivation processes enable the conversion of these disturbed areas back into productive land. These processes involve mixing original topsoil (~20%) with parent material loess (~80%), diluting the organic carbon (C) and nitrogen (N) pools, as well as the soil's biological parameters. To restore soil fertility and physical structure, Phase I includes the cultivation of alfalfa to replenish C and N, re-establish biological functions, and the addition of mineral fertiliser (N:P:K, 15:15:15 kg ha-1). Following two to three years of Phase I, the restoration transitions to Phase II for three to five years, with an initial application of green waste compost (30 t ha-1) and annual basal mineral fertiliser (N:P:K, 200:80:60 kg ha-1). Phase III then involves returning the land to farmers with a typical rotation including sugar beet-winter wheat and a mix of organic and mineral fertilisation.

Previous studies have shown that soil C recovery and several key biological functions have only partially recovered, even after more than 50 years since re-cultivation. However, the evolution of P cycling, especially microbial-mediated P cycling, along this gradient remains unknown. This study aims to investigate interactions between soil P, soil microorganisms, and soil properties that affect microbial P cycling and P availability to plants following mining activity.

Hedley fractionation was employed to estimate various P pool sizes, while ion-exchange kinetics (IEK) assessed P exchangeability and reactivity in eight soils (soils restored from 2022 – year 0 – Phase I, 2020 – year 2 – Phase I, 2018 – year 5 – Phase II, 2014 – year 9 – Phase III, 2006– year 17 – Phase III, 1979 – year 44 – Phase III and 1964 – year 59 – Phase III and an original soil undisturbed). In three key soils (year 0 - Phase I; year 59 - Phase III; original undisturbed soil), 18O-labeled water was used in incubation to determine the degree of 18O integration within microbial biomass and in various P fractions.

In Phase I, a decrease in the relative size of the most labile-P pool was observed. In Phases II and III, this proportion increased, notably with a larger NaOH-extractable-P increase. P exchangeability decreased during Phase I, then significantly increased in older soils, surpassing that of the original undisturbed soil. Preliminary results indicate microbial P processing is highly correlated with total soil organic C. For instance, microbial P processing was nearly non-existent in newly formed soil (organic C: 0.54 g kg-1) and was found to be twice as low in 59-year-old soil (organic C: 1.24 g kg-1) compared to the original soil (organic C: 1.62 g kg-1).

The current findings demonstrate that despite measured P levels surpassing those of the original soil in the oldest soils, biologically-driven P cycling has not fully recovered more than 50 years after soil re-cultivation.

How to cite: Raymond, N. S., Tamburini, F., Oberson, A., Reichel, R., and Mueller, C. W.: Microbial phosphorus processing in a gradient of agricultural soil development following mining activity, EGU General Assembly 2025, Vienna, Austria, 27 Apr–2 May 2025, EGU25-8511, https://doi.org/10.5194/egusphere-egu25-8511, 2025.

The increasing frequency and intensity of drought events make them a growing threat for plants that are sensitive to water scarcity. It is therefore important to understand how plants react to drought stress. The willow trees from the short-rotation coppices (SRC) on the DTU-Risø Campus in Denmark (DK-RCW) are particularly sensitive to water shortage as they are rainfed. We address the following question: how do extremely dry conditions affect the willows growth? We study the plants response mechanisms to periods of water scarcity and examine how these responses impact their gross primary productivity (GPP). There is a particular relevance to this in the current context of global warming, where the SRC are used to produce bioenergy and can store carbon to mitigate climate change.

Field measurements were carried out at the DK-RCW site to gather information on canopy structure (leaf area index). These results were integrated into a modelled relationship with carbon flux data from an eddy covariance flux tower located onsite and providing continuous CO2 and H2O flux data in more than 10 years. The simple empirical model was used to contrast the GPP’s sensitivity to stomatal and non-stomatal processes by comparison of extreme drought conditions (summer 2018 in Denmark) and wetter conditions (summers 2015 and 2021). These years represent the same stage of the rotational cycle.

This new model enables us to highlight two complementary responses to drought: the trees immediately react by adapting their physiology (stomatal resistance, increased sensitivity to vapour pressure deficit under drought), but also by changing the canopy structure as the drought increases (reduction of the leaf area index) and other responses on canopy photosynthetic capacity. High vapour pressure deficit and the reduction of the leaf area index both reduced the photosynthesis of willow trees under dry conditions. The simulated data imply limited drought recovery after the dry period had ended. For these reasons, the carbon uptake by the willow SRC is lower during droughts and thus limits the SRC productivity and carbon sink strength. We conclude from the very clear results from this case study that different drought response mechanisms must be considered when trying to understand and predict plant responses to extreme drought.


How to cite: Jaujay, M. and Ibrom, A.: Drought sensitivity of gross primary productivity in willow: effects from physiological versus structural responses, EGU General Assembly 2025, Vienna, Austria, 27 Apr–2 May 2025, EGU25-10635, https://doi.org/10.5194/egusphere-egu25-10635, 2025.

EGU25-13963 | ECS | Posters virtual | VPS4

Ecological interactions in dioecious plants: implications for soil fungi and arthropods 

Ruddy Bradley Jimenez

Many dioecious plants are dominant foundational species (e.g., grasses, poplars, ginkgoes) that structure ecosystems and provide essential resources for diverse ecological communities. Due to their higher nutrient demands and reproductive costs, female plants generally appear more sensitive to environmental changes, such as increased temperatures and drought conditions. The soil ecosystem is critical for providing the substrate, nutrients, and habitat for terrestrial plant communities to exist. Male and female plants are likely to interact with the soil environment differently, with implications for ecosystem functioning. Recent research has shown that female and male plants differ in their soil microbial diversity and community composition. However, how plant sex affects soil communities is still unknown. This study investigated how female and male plants of Ilex vomitoria differ in fungal diversity and composition and subsequent cascading effects on soil arthropods. Fungal operational taxonomic units (OTUs) were identified from DNA sequencing data, and arthropods were extracted and identified from 91 soil samples collected under the canopies of female and male Ilex vomitoria individuals across three locations in southeastern Texas, USA. We found that male plants of I. vomitoria exhibit higher fungal diversity compared to female plants, with both sexes associating with distinct fungal communities. Conversely, soil arthropod diversity and community composition were affected by location but not plant sex. Our results provide valuable insights into the ecological interactions of dioecious plants, emphasizing the role of plant sex as a key trait that influences soil biodiversity and the associated functioning of ecosystems.

How to cite: Bradley Jimenez, R.: Ecological interactions in dioecious plants: implications for soil fungi and arthropods, EGU General Assembly 2025, Vienna, Austria, 27 Apr–2 May 2025, EGU25-13963, https://doi.org/10.5194/egusphere-egu25-13963, 2025.

EGU25-14217 | ECS | Posters virtual | VPS4

Greenhouse Gas Flux in Coastal Salt Marshes: Field Measurements along Estuarine Gradients in Northeastern USA 

Michael Norton, Serena Moseman-Valtierra, and Mark Stolt

Tidal Marshes are wetland ecosystems at the marine-terrestrial interface which serve as strong sinks for atmospheric carbon dioxide and large reservoirs of soil organic carbon (SOC). However, tidal marsh soils also produce and emit the potent greenhouse gas methane (CH4). Previous work has demonstrated that CH4 flux is inversely related to salinity, and that methane flux is negligible compared to carbon dioxide (CO2) uptake in marshes with salinities of >18 parts per thousand (ppt). However, in lower salinity tidal marshes, CH4 flux is highly variable, and can spike sharply following the depletion of sulfate supply. In order to better understand drivers of methane flux across a range of salinities, we established three transects along estuarine gradients in Rhode Island and Connecticut, USA. At landward and seaward sites along each transect, we measured methane flux, salinity, and conducted various porewater and soil chemical analyses. We found that methane flux was significantly higher and more variable in marshes where salinity is < 18 ppt. The highest magnitude methane fluxes occurred when sulfate was nearly depleted in marsh porewater, indicating that sulfate abundance dampens methane production, but demonstrating the need for further investigation into processes governing sulfate depletion and replenishment in salt marshes, and the degree to which salinity is a reliable proxy for sulfate concentration. Additionally, the lack of spatial data products which delineate tidal marshes according to salinity complicates efforts to estimate methane budgets in tidal estuaries. Our results indicate that spatial differences in salinity should inform wetland mapping in order to facilitate estimations of greenhouse gas budgets, but more high-resolution monitoring of salinity is needed to accurately delineate map units.

How to cite: Norton, M., Moseman-Valtierra, S., and Stolt, M.: Greenhouse Gas Flux in Coastal Salt Marshes: Field Measurements along Estuarine Gradients in Northeastern USA, EGU General Assembly 2025, Vienna, Austria, 27 Apr–2 May 2025, EGU25-14217, https://doi.org/10.5194/egusphere-egu25-14217, 2025.

         Blue carbon ecosystems (mangroves, seagrass beds, and salt marshes) are one of the most effective carbon sinks on Earth and are critical to climate change mitigation and adaptation. Hainan Province in China accounts for 82% of the country's mangrove area and 64% of the country's seagrass bed area. Hainan's blue carbon plays an important role in local and national carbon sink enhancement efforts. From the perspective of economics, Hainan's blue carbon system plays a major supporting role in the local economy. Existing research on the protection of China's blue carbon ecosystems focuses on carbon sink accounting and economic valuation, and rarely involves microeconomic impact analysis of blue carbon protection actions. In particular, there are few studies specifically conducted on the impact on residents' livelihoods and well-being in Hainan.

        In this context, we are attempting to conduct research in Hainan Province to answer the following questions: What impact does the protection and restoration of Hainan's blue carbon ecosystem have on the livelihoods of its coastal communities? We refined this question into three points: First, what are the livelihood sources and livelihood structures of Hainan's coastal and non-coastal communities; what changes have occurred around 2020? Second, has Hainan's special action on the protection and restoration of blue carbon ecosystems had an impact on the livelihoods of coastal communities? Third, through what channels does Hainan's special action on the protection and restoration of blue carbon ecosystems affect the livelihoods of coastal communities?

        According to preliminary research, Hainan Province's special action for the protection and restoration of blue carbon ecosystems has a two-way impact on the livelihoods of coastal communities. On the one hand, blue carbon protection can maintain and promote the local fishery economy and tourism; on the other hand, due to restrictive regulations on the relevant use of marine resources at the policy level, the protection and restoration of mangroves may have a negative impact on fisheries. Maintaining a balance between fishermen's livelihoods and blue carbon protection may be one of the difficulties in blue carbon conservation. Treating the special action for the protection and restoration of blue carbon ecosystems as a quasi-natural experiment, we are going to conduct policy evaluation in our study. We will conduct a community questionnaire survey and introduce the propensity matching difference-in-difference (PSM-DID) model to reveal the net effect of Hainan's blue carbon ecosystem protection on the livelihoods of coastal communities.

How to cite: Chen, Y.: Study on the Impact of Blue Carbon Ecosystem Protection on the Livelihoods of Coastal Communities in Hainan Province, EGU General Assembly 2025, Vienna, Austria, 27 Apr–2 May 2025, EGU25-14443, https://doi.org/10.5194/egusphere-egu25-14443, 2025.

EGU25-14511 | ECS | Posters virtual | VPS4

A flexible, multiscale quantification framework for river alkalinity enhancement 

Jennifer Yin, Jing He, Kevin Sutherland, and Sophie Gill

Alkalinity enhancement in rivers is a proposed carbon dioxide removal strategy which leverages physical and biogeochemical properties of rivers to promote uptake of atmospheric carbon dioxide. Robust monitoring, reporting and verification of carbon dioxide removal is necessary to instill trust in carbon credits and market activity stemming from river alkalinity enhancement. Rivers have the unique characteristic of reflecting integrated watershed characteristics along a one-dimensional trajectory. Depending on the size of the river, alkalinity dosing location and quantity, transit distance to the ocean and availability of monitoring locations, carbon dioxide uptake can be quantified through a hybrid approach leveraging direct measurements and models. In this poster, we propose a flexible, multiscale quantification framework which can be adapted to a wide range of rivers and deployment scenarios. 

How to cite: Yin, J., He, J., Sutherland, K., and Gill, S.: A flexible, multiscale quantification framework for river alkalinity enhancement, EGU General Assembly 2025, Vienna, Austria, 27 Apr–2 May 2025, EGU25-14511, https://doi.org/10.5194/egusphere-egu25-14511, 2025.

EGU25-14608 | ECS | Posters virtual | VPS4

Lack of blue carbon recovery in restored tropical seagrass ecosystems 

Milica Stankovic, Ratchanee Kaewsrikhaw, Pere Masqué, Mathew A Vanderklift, Tipamat Upanoi, and Anchana Prathep

Seagrass ecosystems are vital for coastal resilience, biodiversity, and as critical carbon sinks. With global seagrass declines, restoration has emerged as a key strategy for ecological and carbon recovery. Although through seagrass restoration, various ecosystem services return, there is a lack of information on the return of the carbon sequestration and accumulation. This study aims to assess the potential recovery of blue carbon benefits through seagrass restoration across various sites in Thailand. We analyzed carbon stocks and accumulation rates in restored Enhalus acoroides meadows at four sites, evaluating spatial variability in carbon recovery in restored versus natural meadows and unvegetated sediment. Despite successful seagrass establishment, the organic carbon (OC) content (%) within the surface sediment (top 20 cm) was not significantly different among restored, natural seagrass meadows, and bare sand, averaging 0.8 ± 0.1%, 0.9 ± 0.2%, and 0.9 ± 0.2% respectively. Although significant differences in OC content (%) were observed between sites, no differences were noted between the habitat types within each site. Predominantly sandy sediment (over 90%) with minimal mud content (1% or less) were found at all sites. The highest organic carbon stock in surface sediment was in unvegetated sediment, averaging 16.8 ± 3.4 Mg C ha-1. Significant differences in OC stocks were also observed across all site comparisons, with higher stocks generally found in bare sand compared to restored and natural seagrass meadows. Sediment accumulation profiles, indicated by the absence of excess 210Pb, suggest a lack of net fine sediment accumulation over the past decade or mixing of the upper sediment, precluding reliable sedimentation rate estimation. These findings suggest that these restored meadows are not forming depositional environments contributing to significant additional carbon sequestration, as evidenced by the minimal increase in OC stocks across the sites. Additionally, the low OC content (%) and minimal mud presence suggest overall low sedimentation rates, even in natural seagrass meadows. These results highlight the complexity of achieving carbon sequestration goals through seagrass restoration, emphasizing the need for site-specific restoration strategies that consider local sediment dynamics and ecological conditions to enhance carbon storage capabilities.

Keywords: organic carbon, carbon additionality, carbon accumulation, seagrass, restoration

How to cite: Stankovic, M., Kaewsrikhaw, R., Masqué, P., Vanderklift, M. A., Upanoi, T., and Prathep, A.: Lack of blue carbon recovery in restored tropical seagrass ecosystems, EGU General Assembly 2025, Vienna, Austria, 27 Apr–2 May 2025, EGU25-14608, https://doi.org/10.5194/egusphere-egu25-14608, 2025.

EGU25-14964 | ECS | Posters virtual | VPS4

Getting Out from Under: The Belowground Response of a Restored Grassland to Soil Disturbance and Resource Addition 

Amoi Campbell, Lauren Sullivan, Modeline Celestin, and Matt McCary

Disturbances resulting from anthropogenic global change pose ongoing threats to plant biodiversity. Functional trait-based approaches enable ecologists to observe species-level stress responses with implications for community-level adaptations to disturbances. DRAGNet (Disturbance and Resources Across Global Grasslands) leverages grassland restoration to explore the mechanisms driving disturbance recovery and community assembly. In this single-site study, we examine how plant composition and traits vary across disturbance (tillage) and soil resource (NPK+) gradients. Plant composition will be surveyed in 28 plots, with root and soil samples extracted for trait analysis and soil nutrient testing. We predict that plants in disturbed, nutrient-enriched plots will exhibit divergent functional traits, including reduced root biomass and specific root length, alongside changes in above-ground traits. Preliminary data illustrates the impact disturbance can have on community composition, particularly by promoting invasive species (PERMANOVA, p = 0.0576). This finding underscores the influence of disturbance on plant community assembly and highlights the potential vulnerability of restored grasslands to invasive species proliferation under human-induced disturbances. This study aims to uncover the root functional traits driving the recovery of a restored grassland across both soil disturbance and resource gradients.

How to cite: Campbell, A., Sullivan, L., Celestin, M., and McCary, M.: Getting Out from Under: The Belowground Response of a Restored Grassland to Soil Disturbance and Resource Addition, EGU General Assembly 2025, Vienna, Austria, 27 Apr–2 May 2025, EGU25-14964, https://doi.org/10.5194/egusphere-egu25-14964, 2025.

EGU25-14991 | ECS | Posters virtual | VPS4

Plant litter trait variation between native and nonnative species across steep climate gradient in Hawaiian Islands 

Manichanh Satdichanh, William Harrigan, Rebecca Ostertag, and Kasey Barton

Oceanic islands have high biodiversity due to high rates of endemicity, which is now severely threatened by global change, including biological invasions. Invasive plants are predicted to displace native plants via vigorous resource use associated with fast growth rates and population expansion. The corresponding dynamics associated with invasive plant litter offer important insights to bridge live foliage traits associated with competition with invasive plant effects on ecosystem function via litter decomposition. Evidence has accumulated to support the prediction that invasive species produce higher quality litter than native species, which decomposes more rapidly, in turn providing positive feedback that facilitates their expansion. However, litter quality can vary among and within species across climate gradients, which is likely to contribute to spatial variation in native-invasive plant interactions. In this study, we synthesize a large body of litter trait data using systematic review methods and quantitative analyses, to investigate litter trait differences between native island plants and non-native plants established in natural habitats across steep elevation (7.5 – 2660 m) and mean annual rainfall (272 – 6362 mm) gradients of the Hawaiian Islands. We found that litter traits are highly variable in both native and invasive species, with considerable overlap in multivariate trait space. Intraspecific and interspecific differences were the main sources of litter trait variation, which explained 40% and 41% of the total variance, respectively. Nonetheless, as predicted, invasive plants had litter that tended to be of higher nutritional quality and lower toughness than native plants, although this difference explained only 8% of the total variance across all traits. Interestingly, litter traits varied significantly with respect to temperature and rainfall, and the patterns differed between native and invasive plants. These results corroborate previous studies on live foliage traits that climate mediates invasive-native plant interactions across the heterogeneous environment of Hawaii. These patterns emphasize the importance of considering litter as part of the functional syndrome of plants and for a better understanding of how invasive plants may alter their novel ecosystems.

How to cite: Satdichanh, M., Harrigan, W., Ostertag, R., and Barton, K.: Plant litter trait variation between native and nonnative species across steep climate gradient in Hawaiian Islands, EGU General Assembly 2025, Vienna, Austria, 27 Apr–2 May 2025, EGU25-14991, https://doi.org/10.5194/egusphere-egu25-14991, 2025.

Plant-insect herbivore interactions are essential in shaping forest ecosystem health. The resource availability hypothesis (RAH) and the leaf economics spectrum (LES) theory predict that species in high-resource environments tend to adopt a "fast" strategy but are more susceptible to herbivory. However, this contradicts reports of increased insect herbivory in the context of global drought intensification, and hinders accurate prediction about how different plant species respond to herbivorous insect feeding.

To fill this knowledge gap, we conducted an observational study in two temperate forests dominated by Quercus mongolica and Betula platyphylla in eastern China to compare their leaf herbivory patterns and explore possible mechanisms. We measured three leaf herbivory proxies (consumed leaf area, percent consumed, and herbivory frequency), some leaf traits (leaf area, specific leaf area, leaf water content, leaf nitrogen, phosphorus and non-structural carbohydrate contents), and soil properties (pH, soil water content, soil organic carbon content, soil nitrogen and phosphorus contents).

We found that Q. mongolica, growing in poorer soil environments with lower water and nutrient contents, experienced higher leaf herbivory than B. platyphylla. Regarding leaf traits, Q. mongolica had a higher leaf area and non-structural carbohydrate content, but lower specific leaf area, leaf nutrient and water contents than B. platyphylla. At the leaf level, leaf area, rather than specific leaf area, of both tree species was positively correlated with leaf herbivory. At the tree level, species-specific patterns emerged, i.e., leaf herbivory of B. platyphylla was positively related to leaf area and negatively related to leaf nitrogen and water contents and soil phosphorus content, whereas that of Q. mongolica was only positively affected by soil phosphorus content.

These findings challenge the predictions of RAH and LES theory, as Q. mongolica that grows in resource-poorer soil environments with a conservative strategy suffers higher leaf herbivory than B. platyphylla, shedding some light on the proverb that trouble follows the needy. Moreover, water-related factors (i.e., leaf and soil water contents) and leaf area showed an important effect on driving interspecific and intraspecific leaf herbivory variations here, implying that climate-induced droughts may exacerbate herbivore pressure in temperate forests.

How to cite: Zhao, C. and Tian, D.: Trouble follows the needy: more severe leaf herbivory in the resource-poorer temperate oak forest than in the birch forest, EGU General Assembly 2025, Vienna, Austria, 27 Apr–2 May 2025, EGU25-17774, https://doi.org/10.5194/egusphere-egu25-17774, 2025.

EGU25-18429 | ECS | Posters virtual | VPS4

Quantifying Carbon and Water Use Efficiencies of Forest Ecosystems in Wallonia, Belgium: Insights from Species-Specific Responses to Thinning and Climate Change  

Arpita Verma, Benjamin Lanssens, Merja Tölle, Tarunsinh Chaudhari, Alain Hambuckers, and Louis Francois

Optimizing carbon use efficiency (CUE) and water use efficiency (WUE) is a critical challenge for temperate forests worldwide, particularly under changing climatic conditions. CUE refers to the proportion of carbon assimilated during photosynthesis that contributes to biomass, while WUE quantifies the carbon gained per unit of water lost through transpiration. The region of Wallonia, Belgium, with temperate forests covering 33% of its land, serves as an exemplary case for analyzing the relationship between CUE and WUE under varying ecological and climatic conditions. Globally, the coupling of CUE and WUE remains insufficiently understood, especially at the species level. This study investigates the dynamics of CUE and WUE across several dominant tree species in Wallonia. It utilizes outputs from the CARAIB dynamic vegetation model to evaluate species-specific responses to thinning practices and climate scenarios (RCP 8.5 and RCP 2.6) over the period 1980 to 2070.

Our analysis distinguishes between the isohydric and anisohydric behaviors of tree species, emphasizing their contrasting long-term responses to climatic changes and their influence on ecosystem efficiency. Trees such as Abies and Picea tend to be isohydric. They conserve water by closing their stomata early during drought. They benefit from thinning practices initiated at 40 years, with intervals of 3–9 years designed to manage competition as they mature. Conversely, trees like Quercus and Populus tend to be anisohydric. They maintain photosynthesis under stress by keeping their stomata open. Populus requires earlier thinning interventions, typically starting at 30 years, with shorter regrowth periods of 15 years to optimize light penetration and nutrient availability. In contrast, Quercus thinning is initiated at 40 years, with regrowth periods of 30 years, to support their growth and optimize resource utilization. Thinning reduces competition and reallocates resources, modulating trade-offs between WUE and CUE while supporting species-specific growth under varying climatic stressors. Tailored thinning practices enhance resource availability for both isohydric and anisohydric species. Isohydric species gain from improved water availability, complementing their inherent drought resilience, while anisohydric species benefit from increased carbon assimilation through enhanced access to light and nutrients.

These findings underscore the importance of aligning species composition and management strategies with localized environmental conditions to bolster forest resilience. With this study, we investigate species-specific management strategies to support sustainable forestry, identifying species that are better adapted to changing climatic conditions and capable of maintaining vital ecosystem services.

How to cite: Verma, A., Lanssens, B., Tölle, M., Chaudhari, T., Hambuckers, A., and Francois, L.: Quantifying Carbon and Water Use Efficiencies of Forest Ecosystems in Wallonia, Belgium: Insights from Species-Specific Responses to Thinning and Climate Change , EGU General Assembly 2025, Vienna, Austria, 27 Apr–2 May 2025, EGU25-18429, https://doi.org/10.5194/egusphere-egu25-18429, 2025.

An accurate representation of biomass burning aerosol emissions is essential in climate and Earth System Models to capture aerosol properties and their interactions. The sources of regional smoke plumes include the widespread prevalence of numerous small fires, which are  common across Savanahs, and larger more episodic wildfires, such as the extreme Californian wildfire event of September 2020. Capturing emissions from such a diverse range of fire activity is a major challenge and some atmospheric models, including the UK Earth System Model (UKESM) have scaled up aerosol emissions to ensure modelled AOD match observations. Past evaluations have struggled to provide a clear answer as to how to reconcile emissions and modelled aerosols, with contrasting outcomes for different regions and/or assessments of seasonal means versus individual smoke plumes. Our modelling study leverages observational data from the unprecedented wildfires in September 2020 to identify potential issues in capturing the aerosol from large / extreme wildfires in the global modelling system of UKESM. Running in nudged mode and with daily emissions from GFED4.1s emissions enables a realistic simulation of the thick smoke plumes that ensued across the continent and out into the Pacific, with little overall bias in AODs between UKESM and co-located observations (AERONET, VIRS, MAIAC). However, scaling emissions by a factor of 2 provides better agreement globally and across regions dominated by smaller fires. We therefore develop a means of differentiating between small and large fires based on the daily dry matter (fuel) consumption and apply this to enable scaling of emissions from small fires that seem to otherwise be underestimated in the model, whilst avoiding scaling those from large fires. Our results indicate a way forward to ensure a global simulation of biomass burning aerosol and fidelity in modelling extreme events.

How to cite: Johnson, B., Quaze, L., and Haywood, J.: Evaluating aerosol emissions from wildfires in the UK Earth System Model: What we have learnt from modelling the extreme wildfires in California during September 2020 , EGU General Assembly 2025, Vienna, Austria, 27 Apr–2 May 2025, EGU25-18758, https://doi.org/10.5194/egusphere-egu25-18758, 2025.

EGU25-19205 | ECS | Posters virtual | VPS4

Carbon accumulation, storage and provenance in the Portuguese continental shelf  

Marcio Martins, Vitor Magalhães, Emília Salgueiro, Lívia Gebara Cordeiro, Fátima Abrantes, Pere Masqué, Carmen B. de los Santos, and Rui Santos

The field of Blue Carbon research has traditionally focused on the carbon sequestration capacity of coastal vegetated habitats, despite these habitats comprising only a small fraction of oceanic sediment. However, continental shelf sediments also play a significant role in carbon sequestration and represent a significantly larger surface area. While the majority of organic carbon deposited in the shelf sediment is initially fixated by phytoplankton, and then potentially cycled through other marine organisms, some of it is originated from coastal and terrestrial producers, such as marine macroalgae, then transported, deposited and sequestered into shelf sedimentary basins. In this study, we investigated the sedimentary organic carbon (OC) stocks and sequestration rates at two sites of the continental shelf of Portugal, each adjacent to major wetland systems dominated by saltmash and seagrasses: the northern site is located off the Sado estuary at the Arrábida coast where macroalgae forests are also present, and the southern site off the Ria Formosa coastal lagoon. We also assessed the contributions of marine and terrestrial primary producers to sedimentary OC using various proxies such as C/N ratios, carbon isotopic signature (δ13 C), magnetic susceptibility, lipid contents and sedimentary DNA metabarcoding. Our findings revealed similar OC sequestration rates at both sites (23.3 ± 7.1 g OC m⁻² yr⁻¹ and 20.9 ± 5.7 g OC m⁻² yr⁻¹ for the northern and southern sites, respectively) and comparable OC stocks in the top 25 cm of sediment (29.5 ± 2.33 g OC cm⁻² and 21.1 ± 3.01 g OC cm⁻², respectively). Clear differences were observed on the contributions of terrestrial versus marine sources to the sediment organic matter, with the northern site showing lower terrestrial contribution as opposed to the southern site. This conclusion is supported by the different proxies used. For example, the northern site consistently exhibited higher OC contents at comparable particle sizes, indicative of a greater deposition rate of organic carbon not adhered to sediment particles, typical of oceanic primary productivity. Sedimentary DNA metabarcoding detected seagrass and saltmarsh genetic material in sedimentary organic matter from both sites, indicating that detritus from the two wetlands are being exported to the continental shelf. Further investigation is needed to quantify the relative magnitude of this export. Understanding this process is essential to accurately assess the role of coastal vegetated habitats in the global carbon cycle, as current estimates focus solely on in-situ sequestration and often overlook the potential contribution of exported organic matter. Our study highlights the need to expand our perspective on the interconnectedness of coastal and oceanic carbon dynamics.

How to cite: Martins, M., Magalhães, V., Salgueiro, E., Cordeiro, L. G., Abrantes, F., Masqué, P., de los Santos, C. B., and Santos, R.: Carbon accumulation, storage and provenance in the Portuguese continental shelf , EGU General Assembly 2025, Vienna, Austria, 27 Apr–2 May 2025, EGU25-19205, https://doi.org/10.5194/egusphere-egu25-19205, 2025.

EGU25-19333 | ECS | Posters virtual | VPS4

Spring-neap tidal variation of fluid mud occurrence in the hyper-turbid Ems estuary  

Jill Lehn, Aron Slabon, Dörthe Holthusen, Lorenzo Rovelli, Annika Fiskal, Thomas Hoffmann, and Christine Borgsmüller

Dredging of the fairway in the Ems estuary was driven by the need to accommodate the increasing draft of ships. This modification has had negative effects on the sediment balance and ecology of the estuary. The fairway deepening results in strong alterations of the tidal dynamics, such as tidal amplitude and duration, as well as hydrodynamics such as current velocity and turbulence. This results in increased fine sediment input, which, at high suspended sediment concentrations, contributes to the formation of fluid mud—a mixture of silt, clay, and organic matter. The dynamics of fluid mud, particularly the differences between spring and neap tides, are not yet fully understood.

We investigated the formation, dispersion, and entrainment of fluid mud during the semi-diurnal tidal cycle. Therefore, the influence of flow velocity and salinity at different water depths, and the differences between spring and neap tides based on two dedicated measurement campaigns in 2023 was analyzed using high-resolution spatiotemporal monitoring data. Salinity data were used as an indicator of stable stratification. Additionally, sediment samples have been collected using a sediment corer to analyze the composition and properties of the fluid mud layer.

Our Spring-neap tide analysis showed a reduction of the flow cross-section during neap tide leading to differences in hydrodynamics between spring and neap tide driven by high sediment concentrations and fluid mud occurrence. During neap tide fluid mud was found to cover a larger fraction of the water column than during spring tide. This further highlights the strong influence of flow velocity on the dynamics of fluid mud and the need to include spring-neap considerations for future sediment management plans for the Ems.

How to cite: Lehn, J., Slabon, A., Holthusen, D., Rovelli, L., Fiskal, A., Hoffmann, T., and Borgsmüller, C.: Spring-neap tidal variation of fluid mud occurrence in the hyper-turbid Ems estuary , EGU General Assembly 2025, Vienna, Austria, 27 Apr–2 May 2025, EGU25-19333, https://doi.org/10.5194/egusphere-egu25-19333, 2025.

EGU25-20449 | Posters virtual | VPS4

Effects of Biochar Substrate and Microbial Inoculation on the Development of Raphanus sativus L.  

Lorena da Paixão Oliveira and João Dos Anjos Verzutti Fonseca and the OLIVEIRA, Lorena da Paixão1; FONSECA, Dos Anjos Verzutti; CORTEZ, Christian Zenichi de Oliveira Ueji 1, Alexandre UEZU2 , SANTOS, Erika³; ARÁN, Diego³ e ESPOSITO, Elisa1 .

The use of substrates combined with biochar has been highlighted in agricultural and horticultural production, including the cultivation of Raphanus sativus L. (radish), due to the benefits in water retention, nutrient supply and stimulation of root development. This study evaluated the growth and development of radishes under different combinations of substrates with biochar, with or without microbial inoculation. The experiment was carried out between November 2024 and January 2025, in a greenhouse with automatic temperature control (18-42 °C) at the Federal University of São Paulo, São José dos Campos Campus. The treatments included: A) Substrate with biochar (SB-control); B) Substrate (S-control); C) Substrate with biochar inoculated with MELRC (SBI-MELRC); D) Substrate inoculated with MELRC (SI-MELRC); E) Substrate with biochar inoculated with MEU (SBI-MEU); F) Substrate inoculated with MEU (SI-MEU); G) Substrate with biochar inoculated with TSB (SBI-TSB); and H) Substrate inoculated with TSB (SITSB). The variables analyzed were number of leaves (NF), leaf area (AF), total length (CT), tuber weight (PT), tuber diameter (DT), root length (CR), fresh root mass (MFR), tuber height (HT) and root dry mass (MSR). Data were submitted to analysis of variance (ANOVA) and regression, and significant differences were evaluated by the F test at probability levels of 0.01 and 0.05. The results indicated that treatment D (SI-MELRC) had the greatest positive impact on all variables evaluated, standing out as the best combination for the development of Raphanus sativus L. The use of substrates combined with biochar and microbial inoculation showed promise in the cultivation of Raphanus sativus L. (radish), promoting significant improvements in the growth and development variables evaluated. Among the treatments tested, the substrate inoculated with MELRC (SI-MELRC) stood out, presenting the best results in all variables analyzed. These findings reinforce the potential of biochar as a substrate conditioner and highlight the importance of microbial inoculation to maximize the benefits of this system. Future studies can explore the replicability of the results under field conditions and with other agricultural crops.

Keywords: biochar, Raphanus sativus L., radish cultivation, microbial inoculation, substrate conditioner, agricultural production.

How to cite: da Paixão Oliveira, L. and Dos Anjos Verzutti Fonseca, J. and the OLIVEIRA, Lorena da Paixão1; FONSECA, Dos Anjos Verzutti; CORTEZ, Christian Zenichi de Oliveira Ueji 1, Alexandre UEZU2 , SANTOS, Erika³; ARÁN, Diego³ e ESPOSITO, Elisa1 .: Effects of Biochar Substrate and Microbial Inoculation on the Development of Raphanus sativus L. , EGU General Assembly 2025, Vienna, Austria, 27 Apr–2 May 2025, EGU25-20449, https://doi.org/10.5194/egusphere-egu25-20449, 2025.

Organic inputs in grasslands are known to enhance soil carbon sequestration. However, it remains unclear whether long-term organic inputs lead to greenhouse gas (GHG) emissions, specifically methane (CH4) from livestock and nitrous oxide (N2O) from soils, that outweigh the benefits of carbon sequestration. Addressing this issue is crucial, as it directly impacts the evaluation of organic farming practices for sustainable land management and climate change mitigation. In this study, we employed the process-based Denitrification-Decomposition (DNDC) model to estimate the fluxes of major greenhouse gases (GHGs) in a long-term grassland silage experiment established in 1969. The model was validated against measured data, effectively capturing the dynamics of N₂O emissions, soil temperature, biomass, and soil organic carbon (SOC). Simulations under different IPCC Shared Socioeconomic Pathway (SSP) scenarios of altered temperature, CO₂ concentrations, and radiative forcing were conducted. Treatments with high levels of cattle manure and pig manure under the SSP1-2.6 scenario exhibited a net GHG sink, whereas conventional fertilization resulted in a net GHG source under both SSP1-2.6 and SSP2-4.5. Grass yields decreased under conventional fertilization in both SSP2-4.5 and SSP5-8.5 scenarios. However, the application of organic matter inputs resulted in yield increases across all scenarios. These findings highlight the potential of organic farming practices, especially with high organic inputs, to mitigate GHG emissions and enhance productivity in grassland ecosystems. Therefore, adopting organic farming practices with adequate organic inputs could serve as a sustainable strategy for balancing food production and environmental conservation.

How to cite: Meng, X., Khalil, I., and Osborne, B.: Enhancing crop yield, carbon sequestration, and greenhouse gas mitigation through organic matter inputs: long-term grassland farming observations and DNDC model predictions, EGU General Assembly 2025, Vienna, Austria, 27 Apr–2 May 2025, EGU25-20890, https://doi.org/10.5194/egusphere-egu25-20890, 2025.

EGU25-21501 | Posters virtual | VPS4

Temporal variability in organic carbon fixation, export, sedimentation and utilisation in the Clarion Clipperton Zone 

Clare Woulds, Alastair Lough, and Will Homoky and the Carbon fixation, export, sedimentation and utilisation Team

There is interest in biogeochemical cycling and ecosystem functioning in the Clarion Clipperton Zone (CCZ, equatorial Pacific) due to the possibility in the near future of deep sea mining of polymetallic nodules. A set of important processes and ecosystem services relate to the fixation, export and deposition in sediment of organic carbon (C). This is important to understand both as a mechanism for C sequestration, and also as a set of processes which feeds deep sea biological communities. However, due to the remote nature of the CCZ, and the considerable resource required, it has rarely been possible to directly observe the coupling between processes from the sea surface all the way through the water column to the fate of organic C in sediments, nor how those linked processes vary over time or in response to mining disturbance.

Here we present data on C fixation, export, sediment composition and relationships with benthic community biomass. We show clear coupling between surface productivity, export and sinking flux, but that sediment organic C concentrations are not always closely coupled to water column processes. Repeated measurements over a period of ~18 months show inter-annual variability at the seafloor, rather than a stable seasonal pattern. Organic C delivery to the sediment is reflected in the biomass of faunal groups, with different temporal responses in the different groups (macrofauna, metazoan meiofauna and foraminifera) linked to factors such as competition, predation pressure and life cycle differences. Changes in sediment total organic carbon following a mining vehicle test will also be considered.

How to cite: Woulds, C., Lough, A., and Homoky, W. and the Carbon fixation, export, sedimentation and utilisation Team: Temporal variability in organic carbon fixation, export, sedimentation and utilisation in the Clarion Clipperton Zone, EGU General Assembly 2025, Vienna, Austria, 27 Apr–2 May 2025, EGU25-21501, https://doi.org/10.5194/egusphere-egu25-21501, 2025.

BG1 – General Biogeosciences

EGU25-1122 | ECS | Posters on site | BG1.1

Forest Fire Variability Over the Central India Region from 2001–2020 

Saurabh Sonwani, Pallavi Saxena, and Madhavi Jain

Large-scale, frequent forest fires have a detrimental effect on the environment, the quality of the air, and human health. In the present study, from 2001 to 2020, March (1,857.5 counts/month) and April (922.8 counts/month) saw around 70% of the region's annual forest fires. Unusually high numbers of forest fires have been reported in some years, including 2009, 2012, and 2017. A thorough investigation is conducted into the contribution of numerous climate extremes and persistently rising temperatures to the rise in forest fire activity over central India. Forest fire activity doubled and tripled during the non-fire (July–January) and forest fire (February–June) seasons, respectively, over the warmer period from 2006 to 2020. A severe heat wave, an unusual drought, and an exceptionally powerful El Nino occurred in central India between 2015 JASONDJ and 2018 FMAMJ. These events are thought to have contributed to an upsurge in forest fires. The quinquennial spatiotemporal changes in forest fire characteristics, including average fire intensity and fire count density, were also evaluated. Significantly high soil temperature, low soil moisture content, poor evapotranspiration, and low normalized difference vegetation index are statistically associated with high near-surface air temperature and low precipitation during FMAMJ. This makes the climate much drier, which encourages a lot of forest fires in the Central Indian region.

How to cite: Sonwani, S., Saxena, P., and Jain, M.: Forest Fire Variability Over the Central India Region from 2001–2020, EGU General Assembly 2025, Vienna, Austria, 27 Apr–2 May 2025, EGU25-1122, https://doi.org/10.5194/egusphere-egu25-1122, 2025.

EGU25-1314 | ECS | Orals | BG1.1

Exploring the effect of straw burning on urban ozone levels based on multi-source satellites in northern China 

Wannan Wang, Ronald van der A, Jieying Ding, Tianhai Cheng, and Chunjiao Wang

China is a significant region for crop cultivation. For a long time, there has been a common practice of burning crop residues during the post-harvest period (from May to October). The smoke emitted from straw burning contains both types of ozone precursors, including nitrogen oxides (NOx=NO+NO2) and volatile organic compounds (VOCs), and can be transported over long distances. During the transport process, secondary formation or consumption of ozone precursors occurs within the smoke plumes. After the smoke plume mixes with the atmosphere in the downwind urban area, it will lead to changes in the local ozone formation sensitivity. However, due to the nonlinear relationship between ozone and its precursors, the changes in ozone levels in downwind cities are not as straightforward as expected.

Here, we explore the temporal evolution of urban ozone and its precursors on smoke-affected days using multi-source satellite-derived fire event tracking datasets, which are screened by a semi-quantitative absorbing aerosol index (AAI), tropospheric NO2 and HCHO columns measurements from OMI, fire points from Himawari-8, and ground-level O3 monitoring dataset. We aimed to understand the associations between urban ground-level O3 concentrations and crop residue burning events in China. Our analysis revealed that no consistent changes were shown in urban O3 on smoke-affected days. In addition, there was an increase in NO2, while HCHO and O3 decreased in cities after mixing with smoke that had taken a long transport time. Our findings suggest that the O3 formation sensitivity within aged smoke tends to be controlled by VOC-limited regime. We hypothesize that the large amount of NOx carried by aged smoke consumes urban VOCs and O3, while producing NO2 locally. When fresh smoke, which is mainly controlled by the NOx-limited regime, enters urban environments rich in NOx, it leads to an increase in O3 concentration. Our analysis may contribute to an improved understanding of the influence of straw burning on urban ozone levels in China.

How to cite: Wang, W., van der A, R., Ding, J., Cheng, T., and Wang, C.: Exploring the effect of straw burning on urban ozone levels based on multi-source satellites in northern China, EGU General Assembly 2025, Vienna, Austria, 27 Apr–2 May 2025, EGU25-1314, https://doi.org/10.5194/egusphere-egu25-1314, 2025.

The global wildland fire management community faces pressing climate change and operational challenges and requires improved capabilities in existing modelling tools or the development of novel decision support tools to limit the negative impact of wildfires and to increase use of prescribed burning where appropriate. This presentation will discuss limitations in the existing approaches to incorporating fuel structure effects in different model types (empirical, semi-empirical, detailed physics-based). In particular, novel experimental data will be presented addressing previously identified limitations [1] in the description of surface fuel beds in one of the most widely-used semi-empirical models; the Rothermel model, which underpins many current operational models.

The Rothermel model [2] involves a conservation of energy approach, incorporating separate terms to describe energy release rate in the combustion zone (reaction intensity) and energy transferred to the unburnt fuel (propagating flux), and incorporates a number of empirical closure terms.  The reaction intensity is empirically based, with the underpinning experimental measurements described in Frandsen and Rothermel [3]. By measuring the mass loss rate in a section of a fuel bed, Frandsen and Rothermel were able to characterize the intensity distribution within the combustion zone. However, the interacting effects of simultaneously varying fuel loading and packing ratio were not systematically considered, complicating efforts to understand the interacting effects of fuel loading and bulk density.

This study presents a series of laboratory-based flame spread experiments (no wind) involving excelsior fuel beds of varying structural conditions (Fuel Height: 0.02 to 0.12 m, Bulk Density: 3.3 to 20 kg/m3, Fuel Loading: 0.2 to 0.4 kg). The reaction intensity was calculated via a similar procedure to that described by Frandsen & Rothermel [2] as ‘Method 2’, in which the longitudinal length of the mass measurement region is greater than or equal to the combustion zone depth.

Clear trends in the peak mass loss rate and profile with bulk density were observed with a significant reduction at lower fuel loadings (0.2 kg/m2), and the reaction time was observed to increase at higher bulk densities along with a lengthening in the reaction intensity distribution region (further behind the combustion wave front). These results, along with existing observations of the trailing, in-depth combustion region in porous fuel beds, can be used to further investigate the observed tendency for underprediction of spread rates when the Rothermel model is applied to compressed fuel bed scenarios and has practical implications for other fire behaviour modelling applications. For example, improved characterisation of the overall combustion wave may enable improved modelling of smoke generation, surface-to-crown fire transition, and fuel consumption (e.g. to evaluate prescribed fire effectiveness).

[1] Z. Campbell-Lochrie, M. Gallagher, N. Skowronski, R.M. Hadden, The effect of fuel bed structure on Rothermel model performance, Int. J. of Wildland Fire. 33 (2023).

[2] R.C. Rothermel, A Mathematical Model for Predicting Fire Spread in Wildland Fuels, Research Paper INT-115, USDA Forest Service.,1972.

[3] W.H. Frandsen, R.C. Rothermel, Measuring the energy-release rate of a spreading fire, Combust Flame 19 (1972) 17–24.

How to cite: Campbell-Lochrie, Z.: Revisting Intensity of Combustion Waves to Address Outstanding Issues in Wildfire Modelling, EGU General Assembly 2025, Vienna, Austria, 27 Apr–2 May 2025, EGU25-1390, https://doi.org/10.5194/egusphere-egu25-1390, 2025.

EGU25-1707 | ECS | Posters on site | BG1.1

Modeling Fire-Atmosphere Feedbacks: Insights from the 2019/2020 Australian Wildfires 

Lisa Muth, Bernhard Vogel, Heike Vogel, and Gholamali Hoshyaripour

Wildfire emissions are a significant environmental concern, especially as climate change is expected to increase the frequency and intensity of extreme wildfires. Numerical weather and chemical transport models often struggle to reliably capture the injection height of wildfire plumes, a key parameter for transport that determines the impact on air quality and climate.

This study uses the ICON-ART numerical model to analyze fire-atmosphere feedbacks and their impact on the aerosol plume. The Australian New Year’s wildfire event of 2019/2020, a period of extreme wildfires and pyro-convection, is chosen as the case study. The simulations are performed with a grid spacing of 6.6 km. At this resolution, convection cannot be resolved, so a plume rise model is employed to parameterize the injection height. However, the resolution is sufficiently fine to account for the impact of the fire on meteorological variables.

Our simulations reveal that fire-induced moisture release leads to increased cloud formation under near-saturation conditions, but the overall impact on plume development is small. In contrast, fire-induced heat release significantly increases the mass-weighted height from the start, driven by sensible heat release, increased injection height, and enhanced convective cloud formation.

Comparison with observations shows that accounting for the heat release by the fire enables the simulation of the observed plume heights. These implementations have the strongest effect on the first simulation day, when the fires are most intense, and are negligible on the last simulation day. For fires with lower intensity, the plume rise model performs well without additional implementations.

How to cite: Muth, L., Vogel, B., Vogel, H., and Hoshyaripour, G.: Modeling Fire-Atmosphere Feedbacks: Insights from the 2019/2020 Australian Wildfires, EGU General Assembly 2025, Vienna, Austria, 27 Apr–2 May 2025, EGU25-1707, https://doi.org/10.5194/egusphere-egu25-1707, 2025.

EGU25-1776 | ECS | Orals | BG1.1

Spatiotemporal changes in global cropland fire activity from 2003 to 2020 

Jiaming Wang, Jiasheng Li, Jie Zhao, Xiaoting Zhong, Mengyu Wang, Junhao He, and Chao Yue

Agricultural straw burning is a significant source of greenhouse gas emissions, adversely affecting regional human health and air quality. Understanding the spatiotemporal patterns of agricultural fires is crucial for developing effective emissions reduction strategies in cropland to mitigate climate change. Although it is reported that cropland fires have been decreasing over the past two decades, the trends of global cropland fires on seasonal and diurnal scales remain poorly quantified, limiting a complete understanding of their spatiotemporal dynamics. This study analyzes global cropland fire activity from 2003 to 2020 at annual, seasonal, and diurnal scales, using multiple satellite-based burned area datasets, active fire products, and cropland classification datasets. The results show that from 2003 to 2020, global cropland burned area, active fire detections, and fire intensity all exhibited significant decreasing trends (p < 0.05), with relative changes of -43.5%, -30.3%, and -3.5%, respectively. The most significant decreases in cropland burned area and active fire detections occurred in Africa, while the largest decline in fire intensity was observed in Asia. Moreover, cropland fire activity displayed notable seasonal and diurnal variations. On the seasonal scale, the largest declines in cropland burned area, active fire detections, and fire intensity were observed in December, August, and November, respectively. Notably, fire intensity showed a significant increasing trend (p < 0.05) in April and September. On the diurnal scale, the decrease in cropland active fire detections was primarily driven by daytime activity; however, the rate of decline in fire intensity at night was about 1.5 times that during the day. These findings offer valuable insights into the comprehensive spatiotemporal patterns of global cropland fires, providing a foundation for more effective cropland management and carbon mitigation strategies.

How to cite: Wang, J., Li, J., Zhao, J., Zhong, X., Wang, M., He, J., and Yue, C.: Spatiotemporal changes in global cropland fire activity from 2003 to 2020, EGU General Assembly 2025, Vienna, Austria, 27 Apr–2 May 2025, EGU25-1776, https://doi.org/10.5194/egusphere-egu25-1776, 2025.

EGU25-2016 | ECS | Posters on site | BG1.1

Wildfires and biomass burning in northern Thailand: Observations from ASIA-AQ Campaign 

Sayantee Roy, Francesca Gallo, Elizabeth B. Wiggins, Luke D. Ziemba, Carolyn Jordan, Edward L. Winstead, Michael A. Shook, Joshua P. DiGangi, Glenn S. Diskin, Yonghoon Choi, Jason A. Miech, Wojciech Wojnowski, Felix Piel, Stefan J. Swift, Armin Wisthaler, and Richard H. Moore

Southeast Asia experiences widespread wildfires and biomass burning events during the dry season (January to April), leading to poor air quality, haze, and smog. NASA conducted the Airborne and Satellite Investigation of Asian Air Quality (ASIA-AQ) flight campaign in February and March 2024 to study the contribution of smoke to urban air quality through a multi-faceted observational approach (aircraft, satellite, and ground). The campaign deployed the NASA DC-8 aircraft, equipped with instruments from the Langley Aerosol Research Group (LARGE) and other teams, to measure real-time aerosol microphysical and optical properties, trace gases, and meteorological parameters. During the campaign in the Philippines, South Korea, Thailand, and Taiwan, it was noted that the northern region of Thailand was predominantly impacted by agricultural residue burning and wildfires. Here, we present the variations of vertical and horizontal profiles of aerosol properties and biomass burning tracers, alongside meteorological data to assess the impacts of local conditions and potential pollution pathways. Key findings will include observed variability in aerosols properties, the role of absorbing and scattering aerosols, boundary layer dynamics, and regional pollution transport across the ASIA-AQ domain.

How to cite: Roy, S., Gallo, F., Wiggins, E. B., Ziemba, L. D., Jordan, C., Winstead, E. L., Shook, M. A., DiGangi, J. P., Diskin, G. S., Choi, Y., Miech, J. A., Wojnowski, W., Piel, F., Swift, S. J., Wisthaler, A., and Moore, R. H.: Wildfires and biomass burning in northern Thailand: Observations from ASIA-AQ Campaign, EGU General Assembly 2025, Vienna, Austria, 27 Apr–2 May 2025, EGU25-2016, https://doi.org/10.5194/egusphere-egu25-2016, 2025.

EGU25-2253 | ECS | Posters on site | BG1.1

Near-field atmospheric dispersion of a gas emitted from a hot source : a comparison between analytical modelling and in situ measurements 

Anthony Mendez, Gée Manon, Sylvain Dupont, and Philippe Laguionie

Incidents in nuclear facilities can lead to the emission of a radioactive plume dis-
persing into the atmosphere. In such events, the highest radionuclide concentration
is usually located near the source at distances ranging from a few meters to several
hundred meters. It is, therefore, crucial to be able to accurately predict these levels
of near-source concentrations.
One challenge arises from the thermal characteristics of the source, which regulate
the initial dispersion of the plume. In the case of a non-thermal gas release, the
dispersion of the plume is driven by atmospheric conditions, related to wind and
atmospheric instability, and is influenced by local surface characteristics such as
roughness and the presence of obstacles. In contrast, when the gas is emitted from
a hot source such as a fire, the released gas first rises in the atmosphere up to a
so-called ‘injection height’ due to buoyant forces. The injection height is reached at
a certain distance from the source and doesn’t only depends on the properties of the
hot source but also on the atmospheric conditions (e.g. downdraft effects). The gas
then disperses like in a non-thermal gas release.
While CFD modelling can offer an accurate description of the plume dispersion, its
processing speed is not suitable for use in emergency situations. In contrast, existing
analytical models can provide rapid results, but their injection height parametriza-
tions may lack comprehensive coverage. So far, analytical models have rarely been
validated against field measurements, and few field experiments have been conducted
to improve their parameterization.
The goal of this presentation is twofold, first to present a field experiment on the
atmospheric plume dispersal of a gas released from a hot source, and second to
evaluate an analytical model of plume dispersal against the experiment, with a
particular focus on the Atmospheric Transfer Coefficient of the released gas.
The field experiment was conducted in May 2024 on a flat terrain near Vire (Nor-
mandy, France), under unstable and neutral atmospheric conditions.

The source comprised a burner (PYROS) that generated a propane fire with an average heat
release rate of between 450 kW and 750 kW . Helium was injected into the plume
to serve as a tracer gas. During 15-minute observation periods, helium concentra-
tions in the air were measured at ground level at distances from the source ranging
from 40 m to 400 m, as well as at various altitudes, using air sampling points at-
tached to a rope lifted vertically by a drone. Additionally, atmospheric turbulence
characteristics were also measured using ultrasonic anemometers.
The analytical model employs Heskestad’s formulas to determine the fire character-
istics and Briggs’ dispersion parameters to characterise the Gaussian dispersion of
the plume when buoyant forces become negligible.


How to cite: Mendez, A., Manon, G., Dupont, S., and Laguionie, P.: Near-field atmospheric dispersion of a gas emitted from a hot source : a comparison between analytical modelling and in situ measurements, EGU General Assembly 2025, Vienna, Austria, 27 Apr–2 May 2025, EGU25-2253, https://doi.org/10.5194/egusphere-egu25-2253, 2025.

EGU25-2313 | ECS | Orals | BG1.1

Determining the human signal in burned area under a changing climate 

Bikem Ekberzade, Aydoğan Avcıoğlu, and Tolga Görüm

In this study, we report the preliminary findings from a series of sans-human wildfire simulations using a process based dynamic global to regional vegetation model (DGVM), LPJ-GUESS v 4.1, coupled with the SIMple FIRE Model (SIMFIRE) and the wildfire combustion model (BLAZE), where we investigate the performance of the DGVM to reenact a specific wildfire instance in a Mediterranean catchment. For this, we compared the simulated burned area (BAs) to that in the actual event (BAo) in Manavgat, Antalya, Türkiye. The DGVM spatially captured the fire instance, albeit with a much smaller BA as a result. In July 2021, the largest single wildfire incidence for this region for the last two centuries occurred. The wildfire scorched an area of 60.000 ha.s where the dominant vegetation types were fire adapted dry conifer forests (mainly Pinus brutia) and Mediterranean shrubs. Previous years’ precipitation patterns had encouraged fuel build up, and the extreme heat of the summer of 2021, coupled with the seasonal drought and strong winds provided suitable environmental conditions for the wildfire’s spread. The ignitions in this specific case were intentional, majority were targeted arsons, and a plausible reason behind the ultimate extent of the BA. Here, we show the simulation results from our sans-human model runs using ERA5-Land reanalysis dataset, and compare BAs to BAo for this catchment for 2021. Our ultimate aim in these series of experiments where the ignition source is non-human is initially to decipher the dynamics, and later to develop a methodology to assess the human influence in BA in Mediterranean type ecosystems in the Eastern Mediterranean Basin, under a changing climate. 

How to cite: Ekberzade, B., Avcıoğlu, A., and Görüm, T.: Determining the human signal in burned area under a changing climate, EGU General Assembly 2025, Vienna, Austria, 27 Apr–2 May 2025, EGU25-2313, https://doi.org/10.5194/egusphere-egu25-2313, 2025.

EGU25-2467 | ECS | Orals | BG1.1

The contribution of fires to PM2.5 and population exposure in Pacific Asia 

Hua Lu, Min Xie, Nan Wang, and Bojun Liu

Forest and vegetation fires are one of the major sources of air pollution and have triggered air quality issues in many regions of Pacific Asia. Here we isolate the fire-specific PM2.5 from monitoring concentrations using an observation-driven approach in the region. The total PM2.5 in Pacific Asia exhibited a rapid declining trend from 2014 to 2021, while fire-specific PM2.5 decreased in early years but begun to reverse, leading to an increasing proportions of fire-specific PM2.5 in recent years. The inconsistency between the decreasing number of fire points and the rising levels of fire-specific PM2.5 may be attributed to a shift in dominant sources of fire emissions in Pacific Asia, moving from anthropogenic agriculture fires to wildfires. Fire-related PM2.5 poses a significant public health threat in Pacific Asia, contributing to approximately 334,300 premature deaths each year. Our assessment highlights the disproportionate impact of fire-specific PM2.5 on poverty populations, indicating a pressing need for more attentions and researches in these regions. Based on the positive correlation between vapor pressure deficit and fire-specific PM2.5, this study suggests that without further regulation and policy intervention, the contributions of fire-specific PM2.5 to air pollution in Pacific Asia are likely to continue increasing under the influence of future climate change.

How to cite: Lu, H., Xie, M., Wang, N., and Liu, B.: The contribution of fires to PM2.5 and population exposure in Pacific Asia, EGU General Assembly 2025, Vienna, Austria, 27 Apr–2 May 2025, EGU25-2467, https://doi.org/10.5194/egusphere-egu25-2467, 2025.

EGU25-3090 | ECS | Orals | BG1.1

Identifying Ignition Drivers of Lightning-Ignited Wildfires in Boreal Forests 

Brittany Engle, Ivan Bratoev, Morgan A. Crowley, Yanan Zhu, and Cornelius Senf

Forest fires are the primary disturbance agent in global boreal forests, and they play a significant role in shaping their composition and structure. Boreal forests are also considered a carbon sink but rising temperatures in high-latitude regions are likely increasing wildfire activity, raising concerns that they may become net carbon emitters. Climate change has also increased the frequency and intensity of fire weather in high-latitude boreal forests and is expected to increase the frequency of lightning, a major source of ignition, which could potentially lead to a substantial increase in burned areas. Lightning-ignited wildfires (LIW) pose unique challenges due to their ability to (i) smoulder for long periods of time undetected, (ii) form fire clusters, and (iii) resist suppression efforts. Understanding drivers of ignition is critical for ignition prediction and for optimizing resource allocation for fire managers. Understanding the dynamics of LIWs is, however, challenging due to lack of spatially explicit data that would allow for pan-Boreal analyses of ignition drivers.  

Current LIW research is thus heavily concentrated in regions with detailed fire data (like North America). In a past study, we filled this data gap by introducing the Temporal Minimum Distance (TMin) method, a new approach to match lightning strikes to wildfires without ignition location data (Engle et al. 2024). The TMin method outperformed current methodologies like the Daily Minimum Distance and the Maximum Index A by identifying 74.71% of fires in boreal forests. Using this method, a comprehensive dataset - BoLtFire - was developed, encompassing 6,228 fires larger than 200 ha spanning across the entire boreal forest from 2012 to 2022. When benchmarked to agency reference datasets, BoLtFire performed reasonably well, with an overall commission error of 30.06% and omission error of 53.63%, but global extent. 

To model lighting ignition efficiency, the BoLtFire dataset was enhanced to include location data for over 6,000 lightning strikes that did not result in a fire. This expanded dataset also now integrates “ignition drivers,” identified through modelling over 80 different lightning characteristic, climatic, topographic, and fuel-related variables to identify the most influential factors in the ignition process. This enriched dataset provides valuable insights into why certain lightning events trigger wildfires, while others do not. It thus enables more accurate ignition prediction and improved wildfire management strategies. This expanded dataset provides new opportunities to model ignition and spread dynamics for wildfires in boreal forests, deepening our understanding of lightning-driven fire activity. By addressing key knowledge gaps and advancing methodological approaches, this research contributes to a more comprehensive framework for mitigating the growing risks of wildfires in boreal regions and their potential impacts on one of the most important land carbon sinks. 

References: 
Engle, B., Bratoev, I., Crowley, M. A., Zhu, Y., and Senf, C.: Distribution and Characteristics of Lightning-Ignited Wildfires in Boreal Forests – the BoLtFire database, Earth Syst. Sci. Data Discuss. [preprint], https://doi.org/10.5194/essd-2024-465, in review, 2024. 

How to cite: Engle, B., Bratoev, I., Crowley, M. A., Zhu, Y., and Senf, C.: Identifying Ignition Drivers of Lightning-Ignited Wildfires in Boreal Forests, EGU General Assembly 2025, Vienna, Austria, 27 Apr–2 May 2025, EGU25-3090, https://doi.org/10.5194/egusphere-egu25-3090, 2025.

EGU25-3113 | ECS | Posters on site | BG1.1

Biomass Burning Organic Aerosols as a Pool of Atmospheric Reactive Triplets to Drive Multiphase Sulfate Formation 

Zhancong Liang, Liyuan Zhou, Yuqing Chang, Yiming Qin, and Chak Keung Chan

Biomass-burning organic aerosol(s) (BBOA) are rich in brown carbon (BrC), which significantly absorbs solar irradiation and potentially accelerates global warming. Despite its importance, the multiphase photochemistry of BBOA after light absorption remains poorly understood due to challenges in determining the oxidant concentrations and the reaction kinetics within aerosol particles. In this study, we explored the photochemical reactivity of BBOA particles in multiphase S(IV) oxidation to sulfate. We found that sulfate formation in BBOA particles is predominantly driven by photosensitization involving the triplet excited states (3BBOA*) instead of iron, nitrate, and S(IV) photochemistry. Rates in BBOA particles are three orders of magnitude higher than those observed in the bulk solution, primarily due to the fast interfacial reactions. Our results highlight that the chemistry of 3BBOA* in particles can greatly contribute to the formation of sulfate, as an example of the secondary pollutants. Photosensitization of BBOA will likely become increasingly crucial due to the intensified global wildfires.

How to cite: Liang, Z., Zhou, L., Chang, Y., Qin, Y., and Chan, C. K.: Biomass Burning Organic Aerosols as a Pool of Atmospheric Reactive Triplets to Drive Multiphase Sulfate Formation, EGU General Assembly 2025, Vienna, Austria, 27 Apr–2 May 2025, EGU25-3113, https://doi.org/10.5194/egusphere-egu25-3113, 2025.

EGU25-3285 | ECS | Orals | BG1.1

Linking fire synchronicity in Europe to persistent weather regimes 

Xinhang Li, Raul Wood, and Manuela Brunner

Synchronous fires, that is fires co-occurring at different geographical locations within a few days of each other, challenge the distribution of firefighting resources among regions and can have more severe impacts on human health, infrastructure and environmental systems than individual fire events. However, so far very little is known about the occurrence, spatial patterns and the atmospheric drivers of synchronous fires in Europe.

In this work, we use fire observations from a global fire event dataset FRYv2.0 to (1) detect fire synchronicity between ten European regions during 2001–2020 and (2) link the occurrence of synchronous fires to seven dominant European-Atlantic weather regimes. To detect fire synchronicity, we apply complex network theory and an event synchronicity statistical framework to identify significant links between the ten regions. To analyze the relationship between synchronous fire events and dominant weather regimes, we use a conditional probability-based measure calculating the dependency of synchronous fires –between each region pair– on seven common European weather regimes. We perform 2000 block permutations to test the statistical significance of these dependencies. Lastly, we use the CERRA reanalysis data to analyze the seasonal anomalies of relevant atmospheric variables under each weather regime, including temperature, wind speed, precipitation and relative humidity.

We find multiple significant connections between regions across Europe showing fire synchronicity in spring, summer and fall. We show that (1) northern and western regions in Europe experience fire synchronicity in spring under the influence of blocking regimes (i.e., European and Scandinavian Blocking) which promote warm and dry conditions; (2) eastern regions show fire synchronicity in spring and fall during the Zonal Regime under warm and dry conditions; and (3) fire synchronicity in southern regions are significantly modulated by Scandinavian Troughs due to positive wind speed anomalies and dry conditions in spring and fall as well as by Atlantic Ridges due to positive wind speed anomalies in summer.

Our work reveals significant fire synchronicity across Europe with significant links to atmospheric circulation patterns. As the seven weather regimes have predictability on weekly to monthly time scales, our work might help to develop early warning systems for elevated risks of synchronous fires under climate change and improve fire emergency preparedness across different European regions. 

How to cite: Li, X., Wood, R., and Brunner, M.: Linking fire synchronicity in Europe to persistent weather regimes, EGU General Assembly 2025, Vienna, Austria, 27 Apr–2 May 2025, EGU25-3285, https://doi.org/10.5194/egusphere-egu25-3285, 2025.

EGU25-3308 | ECS | Orals | BG1.1

Global Drivers of Post-Fire Ecosystem Recovery: Insights from Solar-Induced Chlorophyll Fluorescence 

Yicheng Shen, Colin Prentice, and Sandy Harrison

The recovery time of ecosystems following wildfire significantly influences carbon sequestration rates, land-atmosphere exchanges, and hydrological processes. Post-fire recovery has been studied at local scales but there is a lack of comprehensive global-scale analyses. We used solar-induced chlorophyll fluorescence (SIF) to quantify the recovery of photosynthetic activity after more than 10,000 fires from diverse ecosystems. We used the relaxed lasso technique to identify key determinants of the length of time required for post-fire recovery, and used these to build a linear regression model. Our results show that vegetation characteristics, fire properties, and post-fire climatic conditions all influence recovery time. Gross primary production (GPP) is the most important determinant of recovery time: ecosystems with higher GPP recover faster. Fires with greater intensity and duration, which cause more extensive vegetation damage, are associated with longer recovery times. Post-fire climate also affects recovery time: anomalously high temperatures and temperature seasonality, and increased number of dry days, cause slower recovery, while above-average precipitation accelerates recovery. Recovery times vary between different biomes, potentially reflecting variations in plant fire adaptations: ecosystems with a higher abundance of resprouting plants recover more rapidly. These findings provide a global perspective on how vegetation responds to fire disturbances, offering insights into carbon and water cycle dynamics under changing climatic conditions.

How to cite: Shen, Y., Prentice, C., and Harrison, S.: Global Drivers of Post-Fire Ecosystem Recovery: Insights from Solar-Induced Chlorophyll Fluorescence, EGU General Assembly 2025, Vienna, Austria, 27 Apr–2 May 2025, EGU25-3308, https://doi.org/10.5194/egusphere-egu25-3308, 2025.

EGU25-3335 | Orals | BG1.1

A new probabilistic method to identify fire-igniting lightning events 

Jose V. Moris, Hugh G.P. Hunt, Pedro Álvarez-Álvarez, Marco Conedera, Francisco J. Gordillo-Vázquez, Jeff Lapierre, Francisco J. Pérez-Invernón, Nicolau Pineda, Gianni B. Pezzatti, Sander Veraverbeke, and Davide Ascoli

Lightning-induced ignitions play a major role shaping the frequency, patterns and characteristics of wildfires in several regions across the globe, including extreme wildfire events (e.g., Góis wildfire in 2017 in Portugal) and fire seasons, such as 2019-20 in Australia, 2020 in California, and 2023 in Canada. The attention to lightning-ignited wildfires has been growing in recent years. Studies on LIWs frequently associate lightning and wildfire data to discern or approximate the place and moment of fire ignition. This typically requires to select the lightning strike responsible for the ignition.

Currently, several methods are applied to select the most likely lightning strike causing the ignition. However, this selection is complicated by, at least, two aspects. First, the spatial uncertainty of fire and lightning data (e.g., the location errors of detected lightning events). Second, the holdover phenomenon. Holdover time, commonly defined as the time between lightning-induced fire ignition and fire detection, can range from a few minutes to several days, and more rarely to some weeks or even months. Long holdover times are associated to the presence of a smoldering phase that hinders the detection of these lightning fires.

Here, we present a novel method that uses location accuracy information from lightning location networks, as well as expected distributions of holdover time, to assess the probabilities of lightning igniting wildfires. Our method computes a probability metric, which is the product of two independent probabilities: a spatial and a temporal probability. The spatial component assesses the probability of a cloud-to-ground lightning event striking within a given area surrounding the fire discovery point, while the temporal component evaluates the probability of a lightning-ignited wildfire undergoing a certain holdover time. The lightning event with the maximum probability metric value is then selected as the most likely ignition source. We applied this method in three study areas: Switzerland, Catalonia (Spain), and California and Nevada (USA). The results were compared with lightning selections identified by the index of proximity, one of the currently most common methods to select the most likely ignition source of lightning-induced wildfires.

The initial results indicate that the probability metric yields a different selection of lightning events, in comparison with the index of proximity, for a great proportion of wildfires, with considerable differences across the study areas. We suggest that the probability metric provides a solid alternative to current methods. The probability metric offers some advantages: (1) it simplifies some methodological decisions despite the need for additional computations; (2) it is flexible and can be adapted to different types of lightning and fire data (e.g., fire perimeters); (3) it has a more robust theoretical basis than current methods; and (4) the lightning selection can be enhanced over time due to continuous improvements in lightning and fire databases.

How to cite: Moris, J. V., Hunt, H. G. P., Álvarez-Álvarez, P., Conedera, M., Gordillo-Vázquez, F. J., Lapierre, J., Pérez-Invernón, F. J., Pineda, N., Pezzatti, G. B., Veraverbeke, S., and Ascoli, D.: A new probabilistic method to identify fire-igniting lightning events, EGU General Assembly 2025, Vienna, Austria, 27 Apr–2 May 2025, EGU25-3335, https://doi.org/10.5194/egusphere-egu25-3335, 2025.

EGU25-4352 | ECS | Orals | BG1.1

Rising Synchronicity of Extreme Fire Weather Across Europe in a Warming Climate  

Andrina Gincheva, Miguel Ángel Torres-Vázquez, Francesca Di Giuseppe, Alberto Moreno Torreira, Sonia Jerez, and Marco Turco

Synchronous extreme fire weather significantly heightens wildfire ignition and spread risk, potentially overwhelming firefighting efforts. Despite evidence of increasing fire weather extremes in a warming climate, the spatial-temporal synchronicity of these conditions remains understudied outside North America. This research investigates historical and projected changes in the synchronicity of extreme fire weather in Europe, employing the Fire Weather Index (FWI) from 1981–2022 and climate scenarios representing temperature increases (1°C to 6°C) and precipitation changes (-40% to +60%). 

Our findings reveal Central Europe as a significant hotspot, with synchronicity increases up to 389%, and the Mediterranean region experiencing a 66% rise. Synchronicity trends are driven by rising temperatures and shifting atmospheric circulation patterns, particularly in summer and autumn. Future projections suggest compounded fire risks across broader regions, requiring enhanced transnational coordination. This study emphasizes the growing need for proactive fire management strategies tailored to increasing synchronicity, including shared resource mechanisms like RescEU, and highlights the value of integrating synchronicity assessments into regional climate adaptation planning. This abstract is based on findings from a study accepted for publication in Environmental Research Letters.  

Acknowledgements 

A.G. thanks to the Ministerio de Ciencia, Innovación y Universidades of Spain for Ph.D. contract FPU19/06536. A.G., M.A.T-V., and M.T. acknowledge the support of the ONFIRE project, grant PID2021-123193OB-I00, funded by MCIN/AEI/10.13039/501100011033 and by “ERDF A way of making Europe”. M.T. acknowledges funding by the Spanish Ministry of Science, Innovation, and Universities through the Ramón y Cajal Grant Reference RYC2019-027115-I. This work was supported by the project ‘Climate and Wildfire Interface Study for Europe (CHASE)’ under the 6th Seed Funding Call by the European University for Well-Being (EUniWell). 

How to cite: Gincheva, A., Torres-Vázquez, M. Á., Di Giuseppe, F., Moreno Torreira, A., Jerez, S., and Turco, M.: Rising Synchronicity of Extreme Fire Weather Across Europe in a Warming Climate , EGU General Assembly 2025, Vienna, Austria, 27 Apr–2 May 2025, EGU25-4352, https://doi.org/10.5194/egusphere-egu25-4352, 2025.

Fires have great ecological, social, and economic impact. However, fire prediction and management remain challenges due to a limited understanding of their roles in the Earth system. Fires over southern Mexico and Central America (SMCA) are a good example of this, greatly impacting local air quality and regional climate. Here we report that the spring peak (April–May) of fire activities in this region has a distinct quasi-biennial signal based on multiple satellite datasets measuring different fire characteristics. The variability is initially driven by quasi-biennial variations in precipitation. Composite analysis indicates that strong fire years correspond to suppressed ascending motion and weakened precipitation over the SMCA. The anomalous precipitation over the SMCA is further found to be mostly related to the East Pacific–North Pacific (EP-NP) pattern 2 months prior to the fire season. The positive phase of the EP-NP leads to enhanced precipitation over the eastern US but suppressed precipitation over the SMCA, similar to the spatial pattern of precipitation differences between strong and weak fire years. Meanwhile, the quasi-biennial signals in precipitation and fires appear to be amplified by their interactions through a positive feedback loop at short timescales. Model simulations show that in strong fire years, more aerosol particles are released and transported downstream over the Gulf of Mexico and the eastern US, where suspended light-absorbing aerosols warm the atmosphere and cause the ascending motion of the air aloft. Subsequently, a compensating downward motion is formed over the region of the fire source and ultimately suppresses precipitation and intensifies fires. Statistical analysis shows the different durations of the two-way interaction, where the fire suppression effect of precipitation lasts for more than 20 d, while fire leads to a decrease in precipitation at shorter timescales (3–5 d). This study demonstrates the importance of fire–climate interactions in shaping the fire activities on an interannual scale and highlights how precipitation–fire interactions at short timescales contribute to the interannual variability in both fire and precipitation.

How to cite: Liu, Y., Qian, Y., and Wang, M.: Fire–precipitation interactions amplify the quasi-biennial variability in fires over southern Mexico and Central America , EGU General Assembly 2025, Vienna, Austria, 27 Apr–2 May 2025, EGU25-5454, https://doi.org/10.5194/egusphere-egu25-5454, 2025.

EGU25-6847 | ECS | Posters on site | BG1.1

Changes in atmospheric oxidising capacity cause teleconnections between biomass burning and NH4NO3 formation 

Damaris Y. T. Tan, Mathew R. Heal, Massimo Vieno, David S. Stevenson, Stefan Reis, and Eiko Nemitz

Open biomass burning affects many aspects of the Earth system, including atmospheric chemistry and composition. Due to its impact on human health, we focus on the contribution of biomass burning emissions to fine particulate matter (PM2.5) concentrations on a global, annual mean basis, particularly the lesser-studied secondary inorganic component. We use the EMEP MSC-W WRF atmospheric chemistry transport model to show that biomass burning leads to increased ammonium nitrate (NH4NO3) concentrations in densely populated regions not necessarily associated with large-scale fire activity. This is prominent in the eastern USA, northwestern Europe, the Indo-Gangetic Plane and eastern China, where NH4NO3 contributes between 29 and 51% to annual mean biomass burning-derived PM2.5. Pyrogenic CO and NOx (NO and NO2) emissions alter the global-scale oxidising capacity of the atmosphere, affecting how local-scale anthropogenic NOx and NH3 emissions lead to formation of NH4NO3. These teleconnections can locally increase, by up to a factor of two, the contribution of biomass burning emissions to PM2.5 concentrations, which measurements alone cannot detect. This will become relatively more important as anthropogenic sources of PM2.5 are reduced, and with potentially intensified biomass burning occurrences under climate change.

How to cite: Tan, D. Y. T., Heal, M. R., Vieno, M., Stevenson, D. S., Reis, S., and Nemitz, E.: Changes in atmospheric oxidising capacity cause teleconnections between biomass burning and NH4NO3 formation, EGU General Assembly 2025, Vienna, Austria, 27 Apr–2 May 2025, EGU25-6847, https://doi.org/10.5194/egusphere-egu25-6847, 2025.

EGU25-7107 | ECS | Orals | BG1.1

Development of a Wildfire Risk Prediction System based on Deep Learning Methods and Remote Sensing 

Jhony Alexander Sanchez Vargas, Johannes Heisig, Marco Painho, and Mana Gharun

Wildfires pose a significant threat to ecosystems, human life, and infrastructure, particularly in South America, where diverse climatic and environmental factors contribute to their occurrence. Climate change has exacerbated extreme weather conditions such as intense heat and drought, leading to a global increase in the frequency and intensity of wildfires. Countries like Brazil have experienced significant rises in wildfire damage, highlighting the urgent need for predictive models that accurately assess future wildfire risks to mitigate their impact effectively. This thesis addresses this need by developing a wildfire risk prediction system leveraging deep learning methods and remote sensing data.

Using Earth Observation (EO) APIs, the system avoids downloading and storing vast amounts of satellite imagery, enabling efficient data acquisition and preprocessing. The study focuses on key variables that influence wildfire activity, including dynamic variables such as Land Surface Temperature (LST), Normalized Difference Vegetation Index (NDVI), Enhanced Vegetation Index (EVI), radiation, Leaf Area Index (LAI), evapotranspiration (ET), wind speed, and temperature, as well as static variables like land cover, Digital Elevation Model (DEM), and population density. The system is designed to predict wildfire risk for the next day and up to eight days, offering a robust tool for proactive wildfire management.

Given the stochastic and nonlinear nature of wildfire phenomena, this research employs advanced deep learning techniques, including Random Forests (RF), Long Short-Term Memory networks (LSTM), and Convolutional LSTM (ConvLSTM) models, to predict wildfire risk in near real-time. Active fire data from MODIS products, along with their burn dates, serve as the basis for training datasets. Non-fire points are generated by mapping the land cover distribution of fire points, ensuring balanced datasets for model training. Variables are extracted and classified into dynamic and static categories to capture both temporal variability and fixed geographical characteristics.

The objectives of this research are threefold: (1) to investigate existing remote sensing-based wildfire management methodologies and identify enhancements through the integration of data cubes and deep learning; (2) to develop a scalable platform for efficient data acquisition, preprocessing, and risk prediction using deep learning algorithms; and (3) to evaluate the system’s accuracy, efficiency, and scalability with real-world datasets and disaster scenarios.

Preliminary results highlight the effectiveness of integrating remote sensing data with deep learning models for wildfire risk prediction. Dynamic variables such as EVI, LST, and NDVI, along with human influence factors like Global Human Modification Index (gHM), emerged as key predictors, demonstrating the interplay of environmental and anthropogenic drivers in wildfire occurrences. Seasonal analysis from 2021 to 2024 revealed a strong correlation between fire activity, elevated temperatures, and declining vegetation indices from November to April. The Random Forest model achieved 83% accuracy, while the LSTM model showed promise with 75% accuracy, emphasizing the potential of both static and temporal data. These findings lay a robust foundation for enhancing wildfire risk management through advanced machine-learning approaches.

How to cite: Sanchez Vargas, J. A., Heisig, J., Painho, M., and Gharun, M.: Development of a Wildfire Risk Prediction System based on Deep Learning Methods and Remote Sensing, EGU General Assembly 2025, Vienna, Austria, 27 Apr–2 May 2025, EGU25-7107, https://doi.org/10.5194/egusphere-egu25-7107, 2025.

Wildfire smoke is increasingly recognized as a significant source of air pollution that leads to public health issues. Over the past few decades, air pollution in Canada has been reduced due to effective regulations. However, fine particulate emissions (i.e., particles with an aerodynamic diameter of less than 2.5 μm (PM2.5)) from wildfires have shown upward trends as climate change exacerbates the frequency and likelihood of wildfires. According to the Canadian Interagency Forest Fire Centre (CIFFC) in 2021, there were 18% more fire starts and nearly a 61% increase in the total area burned compared to the past 10-year average in Canada. The emissions inventories used for modeling the impact of fires on air quality and climate exhibit several discrepancies in emissions estimates, primarily due to the different types of satellite products used for identifying fires and measuring burned area, as well as differences in emission factors describing the vegetative fuels burned. This variability of fire emission inventories leads to uncertainties in  predicting air quality. Using the GEOS-Chem chemical transport model, we studied how differences in emissions estimates among three commonly used global biomass burning inventories—the Global Fire Emissions Database 4 (GFED4), the Global Fire Assimilation System (GFAS), and the Quick-Fire Emissions Database 2 (QFED2)—and a newly developed  regional biomass burning emission inventory, the Canadian Forest Fire Emissions Prediction System (CFFEPS), affect modeled concentrations of PM2.5 during the 2021 wildfire season in Canada. To examine the sensitivity of simulated PM2.5 to different biomass burning emission datasets, we compared them with ground based PM2.5 data from 70 NAPS (National Air Pollution Surveillance) stations across Canada, from east to west. The simulated PM2.5 concentrations showed significant variation in model performance based on the geographic location of the monitoring stations, particularly between the western and eastern regions of Canada. These findings indicate the importance of considering the strengths and weaknesses of each fire inventory, as some inventories may more accurately represent fire emissions in certain regions than others.

How to cite: Ashraf, S., Hayes, P., Stevens, R., and Chen, J.: Evaluating the Effect of Variability in Biomass Burning Emissions Inventories on Modeled Smoke Concentrations: Insights from the 2021 Canadian Wildfire Season, EGU General Assembly 2025, Vienna, Austria, 27 Apr–2 May 2025, EGU25-7351, https://doi.org/10.5194/egusphere-egu25-7351, 2025.

EGU25-8307 | ECS | Orals | BG1.1

Vegetation fires as a source of soil-dust particles – a global model perspective 

Robert Wagner, Ina Tegen, and Kerstin Schepanski

Vegetation fires are well known as an important source of aerosol particles originating from the combustion of carbonaceous material. Much less known is that these fires can also efficiently inject soil-dust particles into the atmosphere, raised by the strong fire-induced winds. These soil-dust particles and the likely co-emitted biogenic particles are potent cloud condensation nuclei (CCN) and ice nucleating particles (INPs), and can substantially alter the cloud microphysics and thus impact the Earth’s radiation budget. Fires are an integral component of the Earth system that affect different landscapes around the globe. As they are supposed to get more frequent and more severe along with the ongoing global warming, a better knowledge of these specific fire emissions is crucial to understand their impacts on weather and climate.

Therefore, this work investigates the potential of wildfires to emit soil-dust particles on a global scale as a part of the newly established Leibniz ScienceCampus “BioSmoke” (‘smoke and bioaerosols in a changing climate’). As this particular dust emission pathway is not considered by the state-of-the-art dust emission models, a parameterization describing fire-induced dust emission fluxes has been developed and implemented into the global aerosol-climate model ICON-HAM. Fire-dust emissions are modelled as a function of the fire radiative power (FRP), the ambient wind conditions, and further soil-surface properties, including the soil type and a vegetation-dependent surface roughness correction.

Multi-year ICON-HAM simulations have revealed that fire-related dust emissions can account for up to one fifth of the total global dust emissions with strong regional and seasonal variations, both as the result of a varying fire activity and the local soil-surface conditions that can foster or impede also fire-dust emission significantly. In regions where the classic wind-driven dust emissions from arid, unvegetated soil surfaces are rather low but wildfires occur frequently, e.g., in large parts of the Southern hemisphere, fire-related dust emissions can add substantially to the atmospheric aerosol load and affect the local radiation budget there.

How to cite: Wagner, R., Tegen, I., and Schepanski, K.: Vegetation fires as a source of soil-dust particles – a global model perspective, EGU General Assembly 2025, Vienna, Austria, 27 Apr–2 May 2025, EGU25-8307, https://doi.org/10.5194/egusphere-egu25-8307, 2025.

EGU25-8637 | Orals | BG1.1

The real drivers of the ML revolution in fire forecasting 

Francesca Di Giuseppe, Joe Mc Norton, Fredrik Wetterhall, and Anna Lombardi

Recent advancements in machine learning (ML) have significantly broadened its applications, including the potential to transition from forecasting fire weather to predicting actual fire activity. In this study, we demonstrate the feasibility of this transition using an operational forecasting system. By integrating data on human and natural ignitions along with observed fire activity, data-driven models effectively address the persistent overprediction of fire danger in fuel-limited biomes. This results in fewer false alarms and more informative outputs compared to traditional methods.

A key factor driving this improvement is the availability of global datasets for fuel dynamics and fire detection, which were not accessible during the development of earlier physics-based models. We find that the enhanced predictive skill of ML models stems largely from the comprehensive characterization of fire processes provided by these datasets, rather than from the complexity of the ML methods themselves.

As enthusiasm gather around  data-driven approaches, our findings highlight the critical importance of high-quality training data in improving forecast accuracy. While the rapid advancement of ML techniques generates excitement, there is a risk of undervaluing the essential role of data acquisition and, where necessary, its creation through physical modeling. Our results underscore that investing in robust datasets is indispensable and should not be overlooked in the pursuit of  very complex algorithm.

How to cite: Di Giuseppe, F., Mc Norton, J., Wetterhall, F., and Lombardi, A.: The real drivers of the ML revolution in fire forecasting, EGU General Assembly 2025, Vienna, Austria, 27 Apr–2 May 2025, EGU25-8637, https://doi.org/10.5194/egusphere-egu25-8637, 2025.

EGU25-8708 | Orals | BG1.1

Evaluation of fire emissions for HTAP3 with CAMS GFAS and IFS-COMPO 

Johannes Kaiser, Vincent Huijnen, Samuel Remy, Martin A. Ytre-Eide, Mark C. De Jong, Bo Zheng, and Christine Wiedinmyer

The Copernicus Atmosphere Monitoring Service CAMS is using ECMWF's Integrated Forecasting System IFS-COMPO with fire emissions from its Global Fire Assimilations System GFAS to monitor and forecast the effect of smoke from vegetation fires, resp. biomass burning, on atmospheric composition. The simulated atmospheric composition fields are routinely validated against observations including from satellites, aircraft and ground stations.

The emissions calculation by the operational GFAS version 1.2 have recently been updated for use in the upcoming HTAP3 multi-model, multi-pollutant study of fire impacts (Whaley et al. 2024), creating the dataset GFAS4HTAP. It is based on the dry matter burnt estimates of GFASv1.2, and uses an updated spurious signal mask, ESA CCI land cover data for 2018, a global peat map (Xu et al. 2018) and emission factors from NEIVA (Shahid et al. 2024) to calculate emission fluxes for various smoke constituents for 2003-2024. An additional GFAS-based dataset has been created by calibration against GFED5beta.

Global comparisons of dry matter, resp. biomass, combustion rates of the three GFAS-based inventories with GFED4s, GFED5beta, and the two variants of FINN2.5 reveal that these inventories can be roughly classified into one group of "traditional" inventories with lower fire activity, resp. emissions, and another of "more recent" inventories with higher fire activity. The pyrogenic carbon monoxide emission estimates from an inversion of satellite observations of atmospheric composition (Zheng et al. 2019) lie between these two groups in terms of global annual values. However, at a global level, they are more consistent with the "more recent" inventories during the late boreal summer peak of the global fire activity and with the "traditional" inventories during periods of lower fire activity.

In order to gain more insight from independent validation, we here present simulations with IFS-COMPO for 2019 based on the three GFAS-based inventories and compare these with atmospheric observations of carbon monoxide, nitrogen dioxide and aerosol optical depth. We find that the best agreement of simulation and observations is achieved by different inventories for different regions, seasons and smoke constituents. However, the emissions of the GFAS4HTAP dataset appears to lead to the overall most balanced atmospheric composition simulation. This supports the group of "traditional" inventories mentioned above.

How to cite: Kaiser, J., Huijnen, V., Remy, S., Ytre-Eide, M. A., De Jong, M. C., Zheng, B., and Wiedinmyer, C.: Evaluation of fire emissions for HTAP3 with CAMS GFAS and IFS-COMPO, EGU General Assembly 2025, Vienna, Austria, 27 Apr–2 May 2025, EGU25-8708, https://doi.org/10.5194/egusphere-egu25-8708, 2025.

As the climate warmings, the frequency and intensity of wildfires have escalated in recent decades.  While the adverse effects of wildfires on air quality are well-documented, their influence on atmospheric ozone in China remains unclear. Here, we apply deep learning and a trajectory-fire interception method (TFIM) to estimate wildfire contributions to ozone concentrations in Chinese cities from 2015 to 2023. Our findings indicate that wildfires influenced 15.1 ± 9.3% of all days during this period, with a wildfire-induced ozone concentration averaging 6.8 μg m-³. Over the nine-year study period, these concentrations exhibited a modest upward trend, increasing by 0.091 μg m⁻³ annually. Regions such as Southwest China, the Qinghai-Tibet Plateau, and Northwest China experienced the highest levels of wildfire-induced ozone. We further utilize SHapley Additive exPlanations algorithms to investigate driving factor behind wildfire-induced ozone. The burnt area, aging hour, and injection height of smoke have a large effect on wildfire-induced ozone concentrations. Finally, we evaluated the health impacts of wildfire-induced ozone, highlighting its significant implications for public health in affected regions.

How to cite: Liu, S.: Explainable deep learning reveal the contribution of wildfire to ozone in China, EGU General Assembly 2025, Vienna, Austria, 27 Apr–2 May 2025, EGU25-8751, https://doi.org/10.5194/egusphere-egu25-8751, 2025.

EGU25-9010 | ECS | Posters on site | BG1.1

Global fire regimes, their non-fire characteristics, and changes in time. 

Eleanor Butler, Sebastian Sippel, and Ana Bastos

Fires as a disturbance regime are an important component of ecosystems, and are involved in many feedback loops within these systems such as climate-carbon feedbacks. The changing climate can influence fire regimes in multiple ways, both directly and indirectly. For example, changing weather patterns can directly alter the occurrence and timing of fire weather days. Weather patterns also influence vegetation growth and ecosystem composition, leading to changes in fuel availability and flammability. Meanwhile, humans also partially shape fire regimes via accidental and managed ignitions as well as various suppression measures.

In this study, we use 35 years of remote sensing data to establish global pyromes; regions of similar fire regimes, via their fire characteristics. This length of data period allows for the allocation of pyromes across multiple time segments, and for changes in their prevalence and spatial distribution to be observed. We have found that the majority of pyrome transitions occurring are shifts towards smaller or less frequent fires, and these transitions are widespread across the globe. However, some regions such as the Northern high latitudes, the Western United States, and Northern Australia are shown to experience larger or more frequent fires in the final observation segment of the study.

Following on from this, we use statistical methods to investigate relationships between pyromes and a wide variety of non-fire properties, including climate, vegetation, and human influence. This allows for inference of the most relevant drivers of pyrome change, both climatic and non-climatic. Initial results suggest for example, that population density is a more important predictor for pyromes with small and medium sized fires. However, there are significant challenges to disentangling the effects of such complex drivers within a relatively short observational period. Nevertheless, it is possible to build a picture of plausible fire regime evolution in regions with shifting environmental components.

How to cite: Butler, E., Sippel, S., and Bastos, A.: Global fire regimes, their non-fire characteristics, and changes in time., EGU General Assembly 2025, Vienna, Austria, 27 Apr–2 May 2025, EGU25-9010, https://doi.org/10.5194/egusphere-egu25-9010, 2025.

EGU25-9049 | Posters on site | BG1.1

The Sensitivity of High Latitude Wildfires and their impacts on Atmospheric Composition to underlying driving processes in the UK’s Earth System Model (UKESM) 

Steven Turnock, João Teixeira, Chantelle Burton, Katie Blackford, Stephen Arnold, and Fiona O'Connor

Wildfires have a significant influence on the Earth system through perturbing the carbon cycle and also emitting large quantities of short lived climate forcers (SLCFs) such as aerosol precursors (black and organic carbon) and gases that can lead to ozone formation (carbon monoxide, nitrogen oxides). SLCFs are important as they affect the Earth’s radiative balance, influencing climate, and also can have important impacts on air quality in the near-surface atmosphere. Climate change and human interference also have important effects on the size, magnitude and duration of wildfires, which are important to understand further, particularly in the context of a changing climate. Such influences are potentially important in the northern high latitudes, where wildfires have been increasing in magnitude and frequency over the last few decades. Here, we present an evaluation of the representation of high latitude wildfires in a configuration of UKESM with an interactive fire module (INFERNO) coupled to chemistry, aerosol and radiation schemes.  We also show results from sensitivity studies analysing the influence of model process drivers on high latitude wildfires and their impacts on atmospheric composition over the recent past, including from changes in climate, socio-economic factors and underlying vegetation properties.

The baseline configuration of UKESM coupled with INFERNO shows an underestimation of burnt area from high latitude wildfires over the period 2000 to 2015 compared to that reported by GFED4s. The sensitivity scenarios show that this underestimation is found to be strongly driven by the human suppression factor included within INFERNO. The underestimation in burnt area is also reflected in the emission of SLCFs from high latitude wildfires e.g. CO, with implications for both climate and air quality. The INFERNO fire scheme does not currently include the representation of peat fires, which are important sources in the high latitude. When we include a representation of SLCF emissions from high latitude peat fires, the magnitude and temporal variability of such emissions are much improved in the model and compare better with those in GFED4s. Including this additional source also increases the contribution of wildfires to particulate air pollution and the degradation in surface air quality simulated by the model over the northern high latitudes. The interactive fire model coupled within UKESM is shown to underestimate high latitude wildfires due to missing sources and the representation of human interactions in this region. This has important consequences for regional air quality and climate in an area of the world experiencing rapid changes to its climate.

How to cite: Turnock, S., Teixeira, J., Burton, C., Blackford, K., Arnold, S., and O'Connor, F.: The Sensitivity of High Latitude Wildfires and their impacts on Atmospheric Composition to underlying driving processes in the UK’s Earth System Model (UKESM), EGU General Assembly 2025, Vienna, Austria, 27 Apr–2 May 2025, EGU25-9049, https://doi.org/10.5194/egusphere-egu25-9049, 2025.

The backscattering linear depolarization ratio (LDR) is a key parameter to identify particle types. Previous studies on smoke LDR have shown significant differences in their measurements, with the magnitudes varying widely under different study scenarios. Single-particle models involving internally mixed black carbon (BC) are applied to assess the LDR of smoke aerosols. However, handicaps have been found to apply such models to describe the bulk optical properties of aerosols, because of their overlook of the contribution of externally mixed organic carbon (OC) to the LDR. Smoke aerosols typically consist of a low proportion of BC particle population and a high proportion of externally mixed OC particle population. If the spherical assumption is applied to the calculation of smoke LDRs, the LDRs turned to be extremely low even approach zero. This leads to difficulties in explaining the observed variability and higher levels of smoke LDR. We conducted a prescribed burning experiment in Xichang, Sichuan Province, China, and did onsite measurement on the LDR of smoke at a wavelength (λ) of 532 nm using atmospheric laser lidar. Field smoke particles were collected using a single-particle sampler and the morphology of particles was then characterized by the transmission electron microscope (TEM). The results indicated that the LDR of local smoke varied between 0 and 20.1%, with rapid fluctuations. The TEM images confirmed the coexistence of both internally mixed BC and externally mixed OC in the smoke aerosols, with OC displaying an ellipsoidal morphology even on copper grids. Using the discrete dipole approximation, we subsequently evaluated the LDR of individual BC and OC. Based on light scattering theory, we further quantified the bulk LDRs of the aerosol aerosols. The results shown that the smoke LDR ranged from 0.0% to 28.2% in λ = 532 nm while accounting for the effect of externally mixed OC. The LDR is slightly influenced by BC and is significantly affected by the externally mixed OC. Furthermore, the LDR is primarily governed by the morphology and particle size distribution of the externally mixed OC. It is concluded that the high levels and rapid variations in the LDRs of smoke can be largely attributed by the non-sphericity and particle size distribution of externally mixed OC. This study advances the methodologies for LDR measurements and evaluations of smoke aerosols from biomass burning.

How to cite: Qin, Z., Zhang, Q., Wang, H., and Zhang, Y.: The role of non-sphericity of externally mixed organic carbon in altering the backscattering linear depolarization ratio of smoke aerosols from biomass burning, EGU General Assembly 2025, Vienna, Austria, 27 Apr–2 May 2025, EGU25-9452, https://doi.org/10.5194/egusphere-egu25-9452, 2025.

EGU25-10591 | Posters on site | BG1.1

Fire proneness of Mediterranean pyroregions is positively linked to tree functional traits indicative of fire-modulated responses 

José Maria Costa-Saura, Gabriele Midolo, Carlo Ricotta, Mara Baudena, Carlo Calfapietra, Mario Elia, Paolo Fiorucci, Simone Mereu, Costantino Sirca, Donatella Spano, Giana Vivaldo, and Gianluigi Ottaviani

Fire is a natural phenomenon that modulates form, function, diversity and distribution of plant species affecting ecosystem dynamics. Global warming and land use change are altering fire regimens potentially threating ecosystem functioning and species persistence. However, pyrogeographical studies aiming to understand differences across fire regimens are usually not considering the role played of plant functional traits. Here, based on a recent pyroregionalization in Italy and using species distribution data from the Italian National Forest Inventory and trait values from public databases we assessed if: 1) species distribution across different pyroregions is affected by fire regime, 2) species in different pyroregions exhibit distinct fire-related trait values, and, if so, 3) trait differences suggest better abilities to cope with fire in species distributed in more fire-prone regions (e.g. thicker bark). Our results tend to positively answer our questions suggesting the necessity of including fire-related traits when studying pyroregions. Noticeably, our study showed that the most fire-prone pyroregions collapse into one region from a functional perspective, with species characterized by highly similar trait values and indicative of fire adaptations.

How to cite: Costa-Saura, J. M., Midolo, G., Ricotta, C., Baudena, M., Calfapietra, C., Elia, M., Fiorucci, P., Mereu, S., Sirca, C., Spano, D., Vivaldo, G., and Ottaviani, G.: Fire proneness of Mediterranean pyroregions is positively linked to tree functional traits indicative of fire-modulated responses, EGU General Assembly 2025, Vienna, Austria, 27 Apr–2 May 2025, EGU25-10591, https://doi.org/10.5194/egusphere-egu25-10591, 2025.

EGU25-12104 | ECS | Orals | BG1.1

Large eddy simulations of the Williams Flat Fire: Aqueous chemistry in pyrocumulous clouds 

Simon Rosanka, Timothy Juliano, Ann Marie Carlton, and Mary Barth

Wildfires are an increasing concern for climate change, air quality and recognized for their substantial impacts on atmospheric composition. In addition to significant emissions of carbon dioxide (CO2) and particular matter (PM), biomass burning events are characterized by substantial non-CO2 emissions, which encompass a wide range of species. These emissions significantly influence atmospheric chemistry at a regional to global scale. Particularly in regions with ample fuel sources and hot, dry, or windy meteorological conditions, surface fires can lead to high-intensity crown fires and frequent downwind spotting. In certain circumstances, the intense formation of crown fires triggers the development of pyrocumulonimbus (PyroCb) atop smoke columns, which ascend to the upper troposphere and lower stratosphere (UTLS) and thus promote the dispersion of the fire emissions within wide regions. On August 2, 2019, the Williams Flats Fire ignited due to lightning from early morning thunderstorms in eastern Washington, USA. The main fire activity occurred between August 2 and August 9. On August 8, the high intensity crown fires led to the formation of a PyroCb. This event was observed and probed by the joint NOAA and NASA FIREX-AQ field campaign, providing a unique observation dataset. In this study, we utilize the Weather Research and Forecasting Model (WRF) to assess the impact of the Williams Flats fires on the atmospheric composition. In particular, we couple the representation of detailed multi-phase chemistry (WRF-CHEM) with WRF’s fire spread model (WRF-FIRE), employing WRF’s Large Eddy Simulation capabilities to resolve turbulence at resolutions of 100 m. In this presentation, results from WRF-FIRE-CHEM simulations with and without aqueous-phase chemistry will be shown to isolate its effects on the long-range transport of trace gases and aerosols.

How to cite: Rosanka, S., Juliano, T., Carlton, A. M., and Barth, M.: Large eddy simulations of the Williams Flat Fire: Aqueous chemistry in pyrocumulous clouds, EGU General Assembly 2025, Vienna, Austria, 27 Apr–2 May 2025, EGU25-12104, https://doi.org/10.5194/egusphere-egu25-12104, 2025.

Machine learning (ML) models are widely used to predict wildfire occurrence and susceptibility (Brys et al., 2025). However, while these models excel at prediction, they often fail to provide insights into their inner workings or uncover the causal pathways driving wildfires. This study addresses this limitation by extending ML models beyond prediction to explore the drivers and causal pathways underlying wildfire occurrence. Our primary aim is to identify meaningful, interpretable patterns from wildfire data.

We developed a novel multi-stage clustering methodology inspired by Cooper et al. (2021) and Cohen et al. (2024). This approach integrates feature attribution (SHAP values), dimensionality reduction (UMAP), hierarchical clustering (HDBSCAN), and causal discovery methods: PC and FCI (Spirtes et al., 2001), and DirectLiNGAM (Shimizu et al., 2011). The causal methods were enhanced with prior background knowledge to derive meaningful insights. We used datasets from Italy (Cilli et al., 2022) and the Netherlands.

A central feature of our methodology is the use of SHAP values to define subgroups and derive causal pathways. SHAP values reduce noise in the feature space while preserving critical information for clustering. By reducing multidimensional SHAP values to two dimensions with UMAP, we improved clustering performance and interpretability. The resulting clusters were described using concise, non-overlapping decision rules based on the original variables, eliminating the need for manual filtering commonly required in clustering raw feature space. The identified clusters revealed specific relationships between wildfire drivers and occurrence. For each cluster, we applied advanced causal discovery techniques to derive probable causal pathways, aligning the findings with the knowledge of stakeholders and domain experts. These actionable and interpretable explanations offer practical utility.

Findings from the case studies demonstrate that supervised clustering effectively characterizes wildfire occurrence by linking it to influencing factors. Furthermore, the approach provides valuable insights into cluster-specific causal pathways. The methodology translates complex relationships into simple causal logic, offering stakeholders and domain experts the necessary context to understand the model's behavior.


Brys, C., La Red Martínez, D.L. & Marinelli, M. Machine learning methods for wildfire risk assessment. Earth Science Informatics 18, 148 (2025). https://doi.org/10.1007/s12145-024-01690-z

Cilli, R., Elia, M., D’Este, M., Giannico, V., Amoroso, N., Sanesi, G., Lombardi, A., Pantaleo, E., Monaco, A., Tangaro, S., Bellotti, R. & Lafortezza, R. (2022). Explainable artificial intelligence (XAI) detects wildfire occurrence in the Mediterranean countries of Southern Europe. Scientific Reports 12, 16349. https://doi.org/10.1038/s41598-022-20347-9

Cohen, J., Huan, X. & Ni, J. (2024). Shapley-based explainable AI for clustering applications in fault diagnosis and prognosis. Journal of Intelligent Manufacturing, 35, 4071-4086. https://doi.org/10.1007/s10845-024-02468-2

Cooper, A., Doyle, O. & Bourke, A. (2021). Supervised clustering for subgroup discovery: An application to covid-19 symptomatology. Communications in Computer and Information Science, 1525, 408–422. https://doi.org/10.1007/978-3-030-93733-1_29

Shimizu, S., Inazumi, T., Sogawa, Y., Hyvärinen, A., Kawahara, Y., Washio, T., Hoyer, P. O., & Bollen, K. (2011). DirectLiNGAM: A direct method for learning a linear non-Gaussian structural equation model. The Journal of Machine Learning Research, 12, 1225–1248. https://doi.org/10.48550/arXiv.1101.2489

Spirtes, P., Glymour, C. & Scheines, R. (2001). Causation, Prediction, and Search. Second Edition. MIT Press. https://doi.org/10.7551/mitpress/1754.001.0001


How to cite: Korving, H. and Van Marle, M.: Decoding Wildfires - Extracting Interpretations and Causal Pathways of Catalysts for Wildfire Occurrence from Machine Learning Models, EGU General Assembly 2025, Vienna, Austria, 27 Apr–2 May 2025, EGU25-12889, https://doi.org/10.5194/egusphere-egu25-12889, 2025.

EGU25-13378 | ECS | Posters on site | BG1.1

Using AI-enabled wildfire risk maps to communicate risk: the role of labelling, information presentation, perceived trustworthiness and emotion in shaping perceived risk in Veluwe, Netherlands 

Milica Mijailovic, Alyson Ranucci, Christoph Geib, Bettina Nardelli, Eva Koppen, Futaba Tamura, and Paul Kandathil Parambil

Rising temperatures and changing climate conditions have increased wildfire risk across the world, including in regions such as The Netherlands that have not historically faced these threats. With this trend expected to continue, understanding risk perceptions among individuals with little to no wildfire experience becomes crucial for mitigating the impacts and designing effective risk communication strategies.

Recent advancements in Artificial Intelligence (AI) wildfire mapping tools have proven highly effective in identifying areas susceptible to wildfires, particularly in detecting low-probability incidents by uncovering subtle patterns often missed by traditional methods. For example, machine learning (ML) wildfire risk maps developed by MEJOR Technologies have accurately predicted wildfire locations in The Netherlands in the past. Despite the potential, the use of these tools as communication instruments to improve wildfire risk perception among the public remains largely unexplored.

Through an online randomised experiment conducted among a sample of residents in the Veluwe area of The Netherlands, we empirically assess how AI-generated labelling (AI label, ML label, or no label) and information presentation formats (map, text, or combined) affect individuals’ perceived wildfire risk. Additionally, we investigate whether perceived trustworthiness in technologies and emotion mediate these effects, providing deeper insights into the cognitive and affective processes that shape how individuals in this area perceive wildfire risk. By leveraging our results, policy makers and AI mapping developers can design effective communication interventions and improve public preparedness in the face of wildfires. While our findings are specific to wildfires in the Veluwe area, they may also hold relevance for understanding the perception of other low-probability hazards among individuals with little to no prior exposure.

How to cite: Mijailovic, M., Ranucci, A., Geib, C., Nardelli, B., Koppen, E., Tamura, F., and Kandathil Parambil, P.: Using AI-enabled wildfire risk maps to communicate risk: the role of labelling, information presentation, perceived trustworthiness and emotion in shaping perceived risk in Veluwe, Netherlands, EGU General Assembly 2025, Vienna, Austria, 27 Apr–2 May 2025, EGU25-13378, https://doi.org/10.5194/egusphere-egu25-13378, 2025.

EGU25-13774 | Orals | BG1.1

Modelling interactive fires: climate-fire feedbacks on fire characteristics and multi-model projects 

Cynthia Whaley, Ruth Digby, Vivek Arora, Jack Chen, Paul Makar, Kerry Anderson, Debora Griffin, Terry Keating, Tim Butler, Jacek Kaminski, and Rosa Wu

There are multiple feedback mechanisms between wildfires and climate, such as temperature, emissions, cloud interactions, deposition, and land cover changes. Wildfires can also have large societal and ecological impacts and are considered as an extreme climate event. Despite this, most Earth System Models have, until recently, used prescribed fire emissions and fire plume injection heights for input into their atmospheric models that were unresponsive to climate changes. Fire plume heights, in particular, have a great influence on the radiative forcing and long-range transport of pollutants. This presentation will show recent results from global modelling of interactive fires (land-atmosphere) in the Canadian Earth System Model (CanESM), with a focus on key wildfire characteristics, such as aerosol emissions and fire plume height. These model improvements introduce the capacity to more accurately simulate future projections of wildfire characteristics under different climate scenarios. The upcoming applications of these improvements include experiments for the Hemispheric Transport of Air Pollution (HTAP) Fires project, AerChemMIP2, and Aerocom. HTAP Fires is a multi-model, multi-pollutant study with the goal of improving global fire modelling and using the multi-model ensembles to provide estimates of fire-related pollution for impact studies and policy makers.

How to cite: Whaley, C., Digby, R., Arora, V., Chen, J., Makar, P., Anderson, K., Griffin, D., Keating, T., Butler, T., Kaminski, J., and Wu, R.: Modelling interactive fires: climate-fire feedbacks on fire characteristics and multi-model projects, EGU General Assembly 2025, Vienna, Austria, 27 Apr–2 May 2025, EGU25-13774, https://doi.org/10.5194/egusphere-egu25-13774, 2025.

EGU25-13861 | ECS | Posters on site | BG1.1

Interactive Fire Emissions Coupled with Climate and Chemistry in GFDL’s Earth System Model version 4.1 

Arman Pouyaei, Paul Ginoux, Elena Shevliakova, and Sergey Malyshev

Fire plays a critical role in the Earth system, both as a driver and responder to climate change. Variations in vegetation cover and ignition patterns, influenced by climate, affect fire behavior, while fire emissions impact climate by altering radiative fluxes and cloud properties. Despite these interactions, most global climate models fail to fully represent the dynamic interplay between vegetation, fire, and climate. In this study, we leverage the prognostic fire module from GFDL’s Land Model (LM4.1), which includes dynamic vegetation processes, to interactively calculate biomass burning emissions and injection heights. Emissions are then coupled with the atmospheric chemistry and aerosol component (AM4.1) in GFDL’s Earth System Model version 4.1 (ESM4.1). The model calculates fire radiative power (FRP) from fire spread rates and fuel content, using it alongside atmospheric parameters like boundary layer height and Brunt-Väisälä frequency in the Sofiev injection height scheme. Fire emissions are calculated using carbon release rates from biomass estimated by the land model and emission factors from Akagi et al. (2011) and Andreae and Merlet (2001), and these emissions are integrated directly into the atmospheric model for interactive coupling. 

We conducted a coupled simulation in AMIP mode and compared the modeled emissions with the observation-based Global Fire Emissions Database (GFED4.1s). Preliminary results show a promising agreement for global fire emissions of trace gases and aerosols during the 1997–2014 period, with seasonal variability falling within the error margins of observed emissions. We then compared results from interactive fire emissions experiment with a fixed fire emission experiment to analyze the direct radiative effects of fire-emitted aerosols. By treating fire emissions as an interactive component of the Earth system, rather than as a prescribed external forcing, this approach enables a more comprehensive representation of fire-climate feedback and enhances the assessment of radiative effects from fire aerosols.

How to cite: Pouyaei, A., Ginoux, P., Shevliakova, E., and Malyshev, S.: Interactive Fire Emissions Coupled with Climate and Chemistry in GFDL’s Earth System Model version 4.1, EGU General Assembly 2025, Vienna, Austria, 27 Apr–2 May 2025, EGU25-13861, https://doi.org/10.5194/egusphere-egu25-13861, 2025.

EGU25-14193 | ECS | Posters on site | BG1.1

Understanding Wildfire Emissions: From Composition to Variability, and their Link to Fire Characteristics  

Yingxiao Zhang, Mary Barth, Louisa Emmons, Makoto Kelp, Timothy Juliano, Wenfu Tang, Rebecca Hornbrook, and Eric Apel

Wildfires emit a complex mixture of trace gases and aerosols that significantly impact air quality, climate, and atmospheric chemistry. Key trace gases include carbon dioxide (CO₂), carbon monoxide (CO), nitric oxide (NO), methane (CH₄), and volatile organic compounds (VOCs). Wildfire-generated aerosols predominantly consist of organic carbon (OC), black carbon (BC), and secondary organic aerosols (SOA). Over recent decades, the frequency and intensity of wildfires, particularly in the western United States, have risen due to warmer temperatures and prolonged periods of drought. This trend has led to increased fire activity and smoke emissions, causing wildfires to be a growing contributor to regional and global aerosol forcing, in turn affecting the Earth's radiation budget and climate system. However, substantial uncertainties remain in estimating the composition and quantity of wildfire emissions.

Large variability in biomass burning aerosol estimates across different fire emission inventories poses challenges for accurate air quality and climate impact assessments. To address these challenges, we leverage observational data from the FIREX-AQ and WE-CAN campaigns to investigate how wildfire characteristics such as individual fire size, fire radiative power, and fuel composition influence the chemical composition of wildfire emissions, particularly VOCs. We then develop and apply an artificial neural network in tandem with dimensionality reduction methods to estimate smoke chemistry utilizing fire characteristics. Our machine learning model's results are compared with existing observations and current fire emission inventories to improve our understanding of wildfire emissions and their impacts.

How to cite: Zhang, Y., Barth, M., Emmons, L., Kelp, M., Juliano, T., Tang, W., Hornbrook, R., and Apel, E.: Understanding Wildfire Emissions: From Composition to Variability, and their Link to Fire Characteristics , EGU General Assembly 2025, Vienna, Austria, 27 Apr–2 May 2025, EGU25-14193, https://doi.org/10.5194/egusphere-egu25-14193, 2025.

EGU25-14573 | Orals | BG1.1

Intense transport of smoke to the Central Andes: Insights from a unique set of instruments located in the Bolivian Andean Cordillera 

Marcos Andrade, Laura Ticona, Fernando Velarde, Decker Guzman, Luis Blacutt, Ricardo Forno, Rene Gutierrez, Isabel Moreno, Fabricio Avila, Gaelle Uzu, Philippe Goloub, Michel Ramonet, Olivier Laurent, Alfred Wiedensohler, Kay Weinhold, Radovan Krejci, Diego Aliaga, David Whiteman, and Paolo Laj

In 2024, Bolivia experienced the worst year of fires since 2002, when Aqua MODIS began collecting data. According to estimates, more than 15 million hectares were burned this year. A sunphotometer sitting in the Bolivian lowlands recorded AOD values higher than two for several continuous days indicating the degradation of the air quality in the region. A unique set of instruments located in the Bolivian Andes recorded the transport of smoke produced by this biomass burning. Very high values of atmospheric tracers like carbon monoxide, equivalent black carbon, and others have been measured as high as 5240 m asl  at the Chacaltaya GAW station (CHC, 16.35ºS, 68.13ºW, 5240 m asl) and other sites around it both in the Altiplano and adjacent high altitude valleys. Although transport to these sites was observed previously, usually the events lasted one or two days. However, in 2024 longer periods of consecutive days with smoke arriving from the lowlands were observed for a second year in a row. Similar high values were observed in CHC in October of 2023, a year with less than half of fires in the country. The conditions that led to the transport of smoke to the mountains in the Andean Cordillera will be discussed, as well as the possible effects of the associated deforestation in terms of water availability for the central Andes.

How to cite: Andrade, M., Ticona, L., Velarde, F., Guzman, D., Blacutt, L., Forno, R., Gutierrez, R., Moreno, I., Avila, F., Uzu, G., Goloub, P., Ramonet, M., Laurent, O., Wiedensohler, A., Weinhold, K., Krejci, R., Aliaga, D., Whiteman, D., and Laj, P.: Intense transport of smoke to the Central Andes: Insights from a unique set of instruments located in the Bolivian Andean Cordillera, EGU General Assembly 2025, Vienna, Austria, 27 Apr–2 May 2025, EGU25-14573, https://doi.org/10.5194/egusphere-egu25-14573, 2025.

EGU25-15236 | ECS | Orals | BG1.1 | Highlight

Modelling global burned area with deep learning 

Seppe Lampe, Lukas Gudmundsson, Basil Kraft, Bertrand Le Saux, Stijn Hantson, Douglas Kelley, Vincent Humphrey, Emilio Chuvieco, and Wim Thiery

The temporal coverage from ˜2000 to present of global burned area satellite observations limits many aspects of fire research. As a result, global fire models are often being used to investigate past and future fire behaviour. Unfortunately, the limited temporal coverage of the observations also hinders the development and evaluation of these fire models. The current generation of global fire models are capable of simulating some characteristics of regional fire behaviour, such as mean state and seasonality, well. However, the performance of these models differs greatly from region to region, and aspects such as extreme fire behaviour are not well represented yet.

Here, we propose a new, data-driven fire model that predicts burned area from the same input parameters that are passed to global fire models. We trained LSTMs to model burned area from GFED5. We split our data according to the IPCC regions and perform a region-based cross-validation, that is, we train different LSTMs on different region-splits of the data. We then compose the predictions of these different models so that for each region the predictions are made by LSTMs that have never seen any data during training and validation from that region before. Our model outperforms all fire models on a global scale and in most IPCC regions. With our model, we can improve our understanding of past fire behavior and simulate future fire trends.

How to cite: Lampe, S., Gudmundsson, L., Kraft, B., Le Saux, B., Hantson, S., Kelley, D., Humphrey, V., Chuvieco, E., and Thiery, W.: Modelling global burned area with deep learning, EGU General Assembly 2025, Vienna, Austria, 27 Apr–2 May 2025, EGU25-15236, https://doi.org/10.5194/egusphere-egu25-15236, 2025.

EGU25-15318 | ECS | Orals | BG1.1

Carbon emissions of an unprecedented Greenland wildfire 

Sonja Granqvist, Lucas Diaz, Sander Veraverbeke, Elmiina Pilkama, Minna Väliranta, and Meri Ruppel

In recent years, large wildfires have spread in Arctic regions as a consequence of ongoing climate change. Arctic organic soils are comparatively shallow but may be ancient, thus thousands of years old carbon may be released in smoldering and deeply burning fires. In Greenland, a land known for its icy expanse, fires are extremely rare. However, in summer 2019, the second-largest wildfire ever recorded on the island occurred at the Kangerluarsuk Tulleq fjord in southwestern Greenland. This study aims to produce pioneering in-field data on this tundra fire, focusing on three key aspects: 1) combustion, 2) burn depth, and 3) the age of the carbon released. Understanding whether the released carbon is modern or old is crucial due to different implications for the global carbon cycle and climate. To estimate carbon losses from the Kangerluarsuk Tulleq tundra fire, we established 14 sampling plots in burned areas and at unburned control sites. The selection of sampling plots was guided by a differenced Normalized Burn Ratio (dNBR) map generated using Sentinel-2 data and field reconnaissance. Within each plot, we assessed fire severity to estimate the above-ground carbon loss. For below-ground carbon loss estimation and burn depth analysis, organic soil samples were collected at burned plots and compared with unburned ones. To explore the vegetation succession and burned vegetation type, organic soil profiles (n=10) were extracted down to the mineral ground using a soil box corer and were studied by light-microscopy. Subsamples (n=20) from burned soil horizons were selected for radiocarbon dating to determine the age of carbon released in the fire. Our preliminary results suggest that soil carbon loss was higher than previously reported at an Alaskan tundra fire site with a mean value of 6.718 ± 0.9 kg of C m-2. The mean burn depth was 9.0 ± 1.8 cm, and soil thaw depths during the 2024 summer were approximately 24 cm deeper in the 2019 burned area compared to unburned tundra. Expected radiocarbon results will indicate the maximum age of the carbon released by the fire. Vegetation succession measurements show that post-fire surfaces were predominantly colonized by pioneering non-Sphagnum bryophytes, Cyperaceae, and Ericaceae. The acquired results are first of a kind from a Greenland tundra fire and produce essential data for global climate modeling to assess the climate impacts of increasing Arctic wildfires.

How to cite: Granqvist, S., Diaz, L., Veraverbeke, S., Pilkama, E., Väliranta, M., and Ruppel, M.: Carbon emissions of an unprecedented Greenland wildfire, EGU General Assembly 2025, Vienna, Austria, 27 Apr–2 May 2025, EGU25-15318, https://doi.org/10.5194/egusphere-egu25-15318, 2025.

EGU25-15841 | ECS | Orals | BG1.1

Modeling peat burned area and understanding its drivers with machine learning 

Jonas Mortelmans, Gabrielle De Lannoy, Devon Dunmire, Sander Veraverbeke, James Waddington, Rebecca Scholten, and Michel Bechtold

Peatland fires pose significant environmental and societal challenges. We recently advanced the Canadian Fire Weather Index (FWI) system for northern peatlands by integrating peatland-specific hydrological data derived from assimilating Soil Moisture and Ocean Salinity (SMOS) L-band brightness temperature observations into the NASA Catchment Land Surface model with its peatland modules, ‘PEATCLSM’. This novel FWIpeat (Mortelmans et al. 2024) was evaluated using satellite-based fire presence data over boreal peatlands from 2010 through 2018, demonstrating improved estimation of peatland fire presence.

Here, we extend the use of this renewed FWIpeat system by integrating it into a machine learning framework to gain deeper insights into when, where, and why peatlands burn. We utilize an XGBoost algorithm trained on peatland burned area data from 2012-2023, incorporating a suite of predictors, including (i) peatland distribution characteristics, (ii) peatland groundwater table, (iii) lightning occurrence, (iv) meteorological data, (v) vegetation properties, and (vi) socio-economic factors. This approach enables proactive fire risk management strategies and contributes to a comprehensive assessment of peatland fire vulnerability and resilience. Preliminary results indicate the importance of peatland groundwater table and lightning occurrence in estimating peat burned area.

Mortelmans, J., Felsberg, A., De Lannoy, G. J. M., Veraverbeke, S., Field, R. D., Andela, N., and Bechtold, M.: Improving the fire weather index system for peatlands using peat-specific hydrological input data, Nat. Hazards Earth Syst. Sci., 24, 445–464, https://doi.org/10.5194/nhess-24-445-2024, 2024.

How to cite: Mortelmans, J., De Lannoy, G., Dunmire, D., Veraverbeke, S., Waddington, J., Scholten, R., and Bechtold, M.: Modeling peat burned area and understanding its drivers with machine learning, EGU General Assembly 2025, Vienna, Austria, 27 Apr–2 May 2025, EGU25-15841, https://doi.org/10.5194/egusphere-egu25-15841, 2025.

EGU25-16179 | ECS | Posters on site | BG1.1

Climate feedback of forest fires amplified by atmospheric chemistry 

Wei Chen, Yuzhong Zhang, Yufei Zou, and Zhen Zhang

The recent surge in forest fires has significantly impacted atmospheric chemistry, carbon cycles, and climate. Wildfires release CO2 along with various reactive species such as CO, volatile organics, and nitrogen oxides. While the effects of CO2 emissions on the carbon cycle and climate, as well as the impact of reactive species emissions on air quality and health, have been extensively studied, this research demonstrates that reactive species emitted from wildfires create a positive climate feedback through the “fire-chemistry-methane” mechanism. In this process, chemical reactions of reactive carbon species suppress the concentration of hydroxyl radicals, extending the lifetime of heat-trapping methane. The significance of this feedback is suggested by observations of multiple proxy gases for global atmospheric oxidation (i.e., methyl chloroform, methane, and CO) during recent extreme forest fire events. By coupling a fire-ecosystem model and an atmospheric chemistry model, we quantify the effect of this feedback in the future. We find that additional warming caused by this mechanism rivals that of wetland methane feedback and fire CO2 feedback by the 2050s under an intermediate climate scenario. Our analysis highlights the critical role of atmospheric chemistry in regulating fire-climate interactions and the methane budget.

How to cite: Chen, W., Zhang, Y., Zou, Y., and Zhang, Z.: Climate feedback of forest fires amplified by atmospheric chemistry, EGU General Assembly 2025, Vienna, Austria, 27 Apr–2 May 2025, EGU25-16179, https://doi.org/10.5194/egusphere-egu25-16179, 2025.

EGU25-16840 | ECS | Orals | BG1.1

Morphological drivers of flammability in canopy and litter contexts across conifer families 

Rebecca Koll and Claire Belcher

Wildfires have shaped ecosystems for millions of years, with plant functional traits playing a key role in fire behaviour and severity. Morphological and physiological traits, particularly at the leaf and shoot levels, influence flammability by determining fuel composition and structure within both canopy and litter layers. These traits are hypothesized not only to affect critical fire dynamics, such as the likelihood of surface fires transitioning into crown fires, with significant consequences for fire intensity and ecosystem impacts, but also influence the evolution of fire-related traits.

This study investigates how leaf- and shoot-level morphology influences flammability in canopy and litter contexts across six dominant conifer families: Araucariaceae, Cupressaceae, Pinaceae, Podocarpaceae, Taxaceae, and Taxodiaceae. Flammability properties were assessed using fire calorimetry to measure ignitability, flame spread, and variability in the rate of energy release from combustion. Results indicate that while shed plant parts (e.g., leaves and shoots) shape fire behaviour by influencing bulk density, aeration, and flame spread rate—ultimately affecting burn sustainability and total energy release—shoot-level traits in isolation, including leaf shape and the arrangement of leaves within shoots, do not consistently predict flammability in canopy material.

Our findings highlight the dynamic interplay between plant morphology, fire regimes, and evolutionary pressures. Traits such as leaf size, shape, and arrangement contribute to fuel structure, driving patterns of fire behaviour that influence long-term plant fitness and survival. This underscores the importance of reconciling fire behaviour, plant functional traits, and the evolutionary history of fire adaptations across phylogenies.

With global change drivers intensifying fire regimes, understanding the relationship between plant flammability, fire regimes, and the acquisition of fire-related traits is increasingly critical. Non-fire-adapted species may face heightened extinction risks, threatening ecosystem stability. Quantifying the intrinsic flammability of plant traits is therefore essential for informing fire management, guiding conservation strategies, and ensuring the long-term sustainability of vegetative communities in a changing climate.

How to cite: Koll, R. and Belcher, C.: Morphological drivers of flammability in canopy and litter contexts across conifer families, EGU General Assembly 2025, Vienna, Austria, 27 Apr–2 May 2025, EGU25-16840, https://doi.org/10.5194/egusphere-egu25-16840, 2025.

The interactions of different components of the Earth system, such as between the biosphere and the atmosphere, are still poorly understood. A major issue is understanding the consequences of increasing wildfire  activity in a changing climate. Smoke particles and gases emitted from such fires affect air quality and the Earth’s radiation balance, and can potentially affect the formation of clouds and precipitation. Understanding links between biodiversity and type of vegetation, smoke emission and the atmospheric distribution and processing of these particles and gases is key for assessing potential impacts and future changes. Addressing the depth of processes in the interconnected atmosphere-climate-vegetation system requires a combination of expertise from various scientific disciplines. The new Leibniz ScienceCampus “Smoke and bioaerosols: Release, processes, and impacts in a changing climate” (BioSmoke) located in Leipzig, Germany will combine expertise in atmospheric and biodiversity research as well as atmospheric processes at several research institutions including the Leibniz Institute for Tropospheric Research and Leipzig University to study effects of the release of aerosol particles from vegetation. To this end, combustion experiments in the laboratory, field measurements of aerosol properties, and remote sensing and modelling of particle emission, transport, and atmospheric effects are envisioned. We will present an overview of the planned projects within the ScienceCampus.

How to cite: Tegen, I., Wagner, R., and Tesche, M.: Introducing the Leibniz Science Campus “Smoke and bioaerosols: Release, processes, and impacts in a changing climate”, EGU General Assembly 2025, Vienna, Austria, 27 Apr–2 May 2025, EGU25-17284, https://doi.org/10.5194/egusphere-egu25-17284, 2025.

EGU25-17646 | ECS | Orals | BG1.1

Investigation of the intense wildfire events and NH3 levels over the Eastern Mediterranean 

Serra Saracoglu, Aykut Mehmet Alban, Seda Tokgoz, and Burcak Kaynak

South eastern Mediterranean region of Türkiye is well known with intense industrialization, shipping activities, agriculture and livestock production in addition to urban emission sources, thus struggle with significant air pollution problems. In addition to criteria pollutants, combination of these sources also results in high ammonia (NH3) levels in the region.

NH3 is released into the atmosphere mainly from agriculture, including nitrogen-based fertilizer applications and livestock farming as well as from several industries and from biomass burning. Atmospheric NH3 plays a significant role in the formation of secondary inorganic particulate matter (PM), which negatively impacts on human health and ecosystems and indirectly influences climate change by altering radiative forcing. Climate change has increased the frequency and intensity of wildfires globally, which became another significant source of NH3 over the Eastern Mediterranean, because the region is among the most sensitive regions. Besides wildfires, agricultural residue burning, although prohibited, also contributes to overall NH3 levels.

Biomass burning contributes to atmospheric pollutants, as the combustion process emits nitrogen and carbon compounds from organic matter. In this study, multi-satellite derived retrievals were utilized, including IASI Level-2 NH3 and CO, TROPOMI Level-2 NO2, CO, and HCHO along with VIIRS S-NPP Fire Radiative Power product to investigate biomass burning related NH3 levels. Products were processed at a 1x1km2 gridded resolution to analyse spatio-temporal variations from 2019 to 2023, especially focusing on intense fire time intervals. While NH3 levels were generally high during the summer over the region, the 2021 summer stood out with exceptionally high levels, coinciding with intense wildfires recorded that year. Similarly, CO levels revealed elevated levels during the same period, further strengthening the common impact of these extreme events. Further, fires detected over some areas by the VIIRS product were associated with residue-burning practices, as the area predominantly consists of agricultural lands.

The aim of the study is to investigate the impacts of fire-related NH3 levels and quantify NH3 enhancements during these fire events in the region. In this context, NH3 to other pollutant ratios will be examined and temporal variation between different biomes will be classified. Air quality and climate change impact studies over the Mediterranean are critically important, with the absence of ground-based NH3 measurements, satellite retrievals have to be utilized more to investigate the sensitivity of the region to extreme biomass burning events with the growing impacts of climate change.

Keywords: ammonia, carbon monoxide, nitrogen dioxide, biomass burning, wildfires

Acknowledgements: IASI is a joint mission of EUMETSAT and the Centre National d'Etudes Spatiales (CNES, France). The authors acknowledge the AERIS data infrastructure for providing access to the IASI data in this study and ULB-LATMOS for the development of the retrieval algorithms. This study was supported by the Scientific and Technological Research Council of Türkiye under the grant number 123Y364.

How to cite: Saracoglu, S., Alban, A. M., Tokgoz, S., and Kaynak, B.: Investigation of the intense wildfire events and NH3 levels over the Eastern Mediterranean, EGU General Assembly 2025, Vienna, Austria, 27 Apr–2 May 2025, EGU25-17646, https://doi.org/10.5194/egusphere-egu25-17646, 2025.

EGU25-17962 | Orals | BG1.1

Assessing the impact of climate change on boreal high latitude wildfire using a storyline approach 

Lars Nieradzik, Hanna Lee, Xavier Levine, Paul Miller, Priscilla Mooney, Ruth Mottram, and David Wårlind

Within the framework of the project PolarRES  (POLAR Regions in the Earth System) we assess the impact of climate change on the ecosystems of the terrestrial northern high latitudes by making use of a range of high resolution regional climate simulations. These regional simulations were themselves driven by global climate simulations selected following the storyline approach described in Levine et al. 2024 from the set of CMIP6 SSP3-7.0 simulations, namely NorESM2-MM and CNRM-ESM2-1. These define two extremes in the climatic envelope of the CMIP6 simulations. While NorESM2-MM shows a high warming of the Barents-Kara seas but a low Arctic tropospheric warming CNRM-ESM2-1 shows the opposite. The storyline approach is a comprehensive way of defining pathways for physical outcomes of climate change that are observable in the region of interest and can directly be linked to certain consequences.

The 2nd generation Dynamic Global Vegetation Model (DGVM) LPJ-GUESS with its wildfire model SIMFIRE-BLAZE was applied using the high-resolution meteorological forcing from the regional climate models (RCMs) to investigate the potential impacts on both vegetation and the development of wildfires as well as the role of uncertainty implied by the variability of the forcing data.

It can clearly be stated that wildfire activity will increase significantly under the given scenarios driven mainly by shifts in vegetation distribution, i.e. northward migration of both treeline as well as shrubs and grasses. These effects differ regionally, depending on both, the storyline and the RCMs.

We present the findings from an envelope of potential future climate forcings depicting the impact of climate depending on the regionally observable effects of Arctic tropospheric warming and the Barents-Kara Seas warming, making use of the storyline approach as a comprehensive indicator for regional future change.

The results of this assessment will directly influence the research conducted in the project GreenFeedBack (GREENhouse gas fluxes and earth-system FEEDBACKs), which focusses on enhancing the knowledge on GHG dynamics in the boreal high latitude terrestrial and marine ecosystems.


Levine, X. Jet al. : Storylines of summer Arctic climate change constrained by Barents–Kara seas and Arctic tropospheric warming for climate risk assessment, Earth Syst. Dynam., 15, 1161–1177, https://doi.org/10.5194/esd-15-1161-2024, 2024

How to cite: Nieradzik, L., Lee, H., Levine, X., Miller, P., Mooney, P., Mottram, R., and Wårlind, D.: Assessing the impact of climate change on boreal high latitude wildfire using a storyline approach, EGU General Assembly 2025, Vienna, Austria, 27 Apr–2 May 2025, EGU25-17962, https://doi.org/10.5194/egusphere-egu25-17962, 2025.

EGU25-18252 | Orals | BG1.1

Impact of wildfires on air quality as seen by IAGOS in-situ measurements 

Yasmine Bennouna, Hannah Clark, Pawel Wolff, Valérie Thouret, Romain Blot, Philippe Nédélec, and Damien Boulanger

For thirty years, the European Research Infrastructure IAGOS (In-Service Aircraft for a Global Observing System) has been equipping commercial aircraft with instruments to measure atmospheric composition on long-haul flights around the world.  Ten aircraft are currently equipped with IAGOS instruments to measure ozone, and the precursors carbon monoxide and nitrous oxides from the surface to the upper-troposphere during landing and take-off at worldwide airports,  and at cruise altitude where we observe the long-range transport of polluted airmasses. We analyse the transport of biomass burning pollutants from the intense Canadian wildfire seasons of 2023 and 2024 which impacted air-quality in North America and in Europe, and the extreme wildfires over the Amazon in 2024 that impacted air quality in South American cities.  The significance of these events is interpreted within the context of the 30-year climatology. The events will be compared with forecasts and analyses from the Copernicus Atmosphere Monitoring Service's global and regional models (projects CAMS2_82 and CAMS2_83) and we further  highlight the role of IAGOS  in developing air-quality networks in susceptible urban areas (project RI-URBANS) and the impacts of heatwaves and wildfires on air-quality in a changing climate (project IRISCC).

How to cite: Bennouna, Y., Clark, H., Wolff, P., Thouret, V., Blot, R., Nédélec, P., and Boulanger, D.: Impact of wildfires on air quality as seen by IAGOS in-situ measurements, EGU General Assembly 2025, Vienna, Austria, 27 Apr–2 May 2025, EGU25-18252, https://doi.org/10.5194/egusphere-egu25-18252, 2025.

EGU25-18640 | ECS | Orals | BG1.1 | Highlight

Adapting to fire in a warming climate: towards global assessment of prescribed grazing and prescribed fire 

Oliver Perkins, Olivia Haas, Matthew Kasoar, Doug Kelley, João C. M. Teixeira, Apostolos Voulgarakis, and James D.A. Millington

Whilst global burned area continues to decline, recent climate warming has led to an increase in the occurrence and intensity of extreme fires. Humanity must adapt to this new reality. Two proposed management options are a) prescribed livestock grazing, and b) prescribed fire use. Both methods promise cost-efficient means to reduce fire intensity, fire-induced vegetation mortality, and carbon emissions by reducing and fragmenting fuel loads. However, at present, there has been no systematic global assessment of the efficacy of these interventions. Reasons for this include a lack of data to understand their present-day distribution and impact as well as a lack of formal model structures to represent their uptake under future scenarios.

Here, we present two applications of the newly developed global, agent-based Wildfire Human Agency Model (WHAM!)1 to assess the potential effect of prescribed grazing and prescribed fire as adaptations to future fire regimes. Firstly, to explore the effect of prescribed livestock grazing on global fire regimes, we share a representation of livestock grazing intensity in WHAM! and its integration with the generalised linear models of Haas et al., (2). Secondly, we present work on a tight coupling of WHAM! with the JULES-INFERNO dynamic global vegetation model, focusing on parameterisation of how managed human fire use reduces fire-induced vegetation mortality.

Overall, early results suggest both management options already play a significant role in reducing global fire intensity and highlight the importance of considering dynamic human responses to a changing climate in global projections of future fire regimes.

1Perkins, O… et al. (2024). GMD.

2Haas, O. et al., (2022). Env. Res let.

How to cite: Perkins, O., Haas, O., Kasoar, M., Kelley, D., Teixeira, J. C. M., Voulgarakis, A., and Millington, J. D. A.: Adapting to fire in a warming climate: towards global assessment of prescribed grazing and prescribed fire, EGU General Assembly 2025, Vienna, Austria, 27 Apr–2 May 2025, EGU25-18640, https://doi.org/10.5194/egusphere-egu25-18640, 2025.

EGU25-18688 | ECS | Orals | BG1.1

Satellite observation of long-range transport of wildfires plumes in the northern hemisphere in 2008-2023 

Antoine Ehret, Solène Turquety, Gilles Lecomte, Bruno Franco, Maya George, Lieven Clarisse, Martin Van Damme, Cathy Clerbaux, and Pierre Coheur

Wildfires exert a important influence on the chemical composition of the atmosphere, thereby impacting air quality, ecosystem, and climate forcing. The substantial emission of pollutants from such fires, coupled with their long-range transport, has the potential to counteract the progress achieved in reducing anthropogenic emissions. Numerous studies show that the increase in the frequency and intensity of fires offsets the general trend towards improved air quality observed in regions influenced by wildfires. These studies also caution of an increasing risk of the population being exposed to extreme levels of aerosols and ozone. In addition to their regional impacts, the plumes from the most intense fires can be transported on a continental or even hemispheric scale, thereby imposing health constraints on regions that are not generally affected by widespread, frequent or intense fires.

The northern hemisphere is home to a group of biomes that are particularly sensitive to hydro-meteorological conditions, and therefore to the effects of climate change on burned areas. The majority of the most intense fires of the last two decades have occurred in North America and in the boreal regions of Asia.

This study assesses the impact of fires on the variability of total CO, total PAN and AOD in the Northern Hemisphere using 16 years (2008-2023) of observations from the IASI/MetOp and MODIS/Terra and Aqua satellite instruments. More specifically, the variability in the number of detected plumes of extreme values of CO, PAN and aerosol from fires is studied.

The trajectories of these plumes are estimated using only satellite observations and are used to assess the contribution of the different regions of the Northern Hemisphere to the variability of atmospheric composition. The potential impact of the long-range transport of the identified plumes on air quality is estimated using observations of the altitude of the plumes obtained from both active CALIOP observations and passive IASI observations.

The chemical composition of the identified plumes is characterised using IASI observations of ammonia (NH3), formic acid (HCOOH), methanol (CH3OH) and ozone (O3).

How to cite: Ehret, A., Turquety, S., Lecomte, G., Franco, B., George, M., Clarisse, L., Van Damme, M., Clerbaux, C., and Coheur, P.: Satellite observation of long-range transport of wildfires plumes in the northern hemisphere in 2008-2023, EGU General Assembly 2025, Vienna, Austria, 27 Apr–2 May 2025, EGU25-18688, https://doi.org/10.5194/egusphere-egu25-18688, 2025.

EGU25-18848 | ECS | Posters on site | BG1.1

An improved approach for simulating peat ignition probability using experimental data 

Dimitra Tarasi, Matthew Kasoar, Hafizha Mulyasih, Alexander Castagna, Guillermo Rein, and Apostolos Voulgarakis

Peatlands, despite covering only 3% of the terrestrial surface, are one of the world's most important carbon storage environments, accumulating around 25% of the total soil carbon. However, climate change is increasing the vulnerability of these carbon-rich ecosystems to fire, with potentially severe implications for the global climate. Warmer and drier conditions, driven by climate change, are expected to intensify and increase the frequency of peat fires, potentially transforming peatlands from carbon sinks into net sources of greenhouse gas emissions. Such a shift could trigger a positive feedback loop, accelerating climate change through the release of vast amounts of sequestered carbon into the atmosphere.

While incorporating peatland fire feedbacks into Earth System Models (ESMs) is essential for accurate climate projections, the majority of the existing models lack a representation of peat fires, limiting their ability to predict future climate dynamics effectively. Understanding the smouldering behaviour of organic soils, their ignition probability, and how these processes can be represented at a global scale is essential. The current state-of-the-art approach to compute peat combustibility, established by Frandsen (1997) and applied in recent peat fire modelling efforts (e.g., INFERNO-peat), relies on a parameterization derived from a single peat type, hampering its global applicability. Frandsen (1997), by conducting experiments on natural peat samples developed an empirical model for smouldering ignition probability based on three key properties of peat: moisture content, inorganic content, and bulk density.

Our study proposes an improved method for calculating peat combustibility by optimizing the coefficients in Frandsen’s model and investigating the ignition limits of diverse peat samples. The optimization process utilized experimental data from seven distinct peat types. First, we established through inverse modelling a link between inorganic content, bulk density and critical moisture content, the moisture threshold above which smouldering cannot be self-sustained. Then we determined the probability distribution of self-sustained smouldering, as a function of moisture content, around the critical moisture content, also employing inverse modelling. The combination of both optimizations yielded consistent coefficients, providing a more robust framework for modelling peat ignition probability.

By improving the representation of peat ignition probability using experimental data from both previous studies and our own experiments, this work aims to upgrade the simulation of peat fires in fire models and ESMs, enhancing our understanding of the impacts of such fires on future atmospheric composition, radiative forcing, and climate.

How to cite: Tarasi, D., Kasoar, M., Mulyasih, H., Castagna, A., Rein, G., and Voulgarakis, A.: An improved approach for simulating peat ignition probability using experimental data, EGU General Assembly 2025, Vienna, Austria, 27 Apr–2 May 2025, EGU25-18848, https://doi.org/10.5194/egusphere-egu25-18848, 2025.

EGU25-19104 | Orals | BG1.1

A new measurement site in northern Botswana to observe savanna fire plumes 

Ville Vakkari, Baagi T. Mmereki, Daniel Koolebogile, Christiaan P. E. van Niekerk, Viet Le, Mabala Letsatle, Kerneels Jaars, and Pieter G. van Zyl

Globally, approximately half of landscape fire emissions originate from savannas and grasslands. Furthermore, our observations in South Africa indicated major secondary aerosol formation in near-fire plume ageing. However, the measurements in South Africa are affected by anthropogenic emissions from the Highveld region, except for a clean sector towards the semi-arid Karoo region. Aiming for a savanna environment with minimal anthropogenic influence we set up a new measurement site in the Okavango delta area in northern Botswana in August 2024.

For the active savanna fire season in 2024, we operated online measurements of aerosol chemical composition with an aerosol chemical speciation monitor (ACSM), an online gas chromatograph coupled to an MS detector (GC-MS) for volatile organic compounds and a single particle soot photometer (SP2) for refractive BC. Measurements of aerosol particle size distribution with a differential mobility particle sizer (DMPS), aerosol absorption with a multi angle absorption photometer (MAAP), as well as CO and CO2 concentrations will continue for the next couple of years at least.

For fresh plumes, initial analysis shows a strong decrease in submicron aerosol emission factor (EFPM1) with increasing modified combustion efficiency, i.e. with increasing flaming fraction. The EFPM1 values are in good agreement with previous observations in southern African savanna and with recent laboratory experiments that we carried out in collaboration with University of Eastern Finland. Analysis of ageing effects on the fire plumes in a clean savanna environment is ongoing.

How to cite: Vakkari, V., Mmereki, B. T., Koolebogile, D., van Niekerk, C. P. E., Le, V., Letsatle, M., Jaars, K., and van Zyl, P. G.: A new measurement site in northern Botswana to observe savanna fire plumes, EGU General Assembly 2025, Vienna, Austria, 27 Apr–2 May 2025, EGU25-19104, https://doi.org/10.5194/egusphere-egu25-19104, 2025.

Wildfires increasingly threaten European ecosystems and communities, highlighting the necessity for effective predictive metrics to enhance fire risk management strategies. This study aims to compare the effectiveness of Vapor Pressure Deficit (VPD) and the Fire Weather Index (FWI) in forecasting wildfire occurrence and the extent of burned areas across various European forest types. Utilizing the European Forest Fire Information System (EFFIS) for comprehensive fire event data and the ERA5 reanalysis dataset from the European Centre for Medium-Range Weather Forecasts (ECMWF) for meteorological variables, daily VPD and FWI values will be derived for multiple fire seasons spanning from 2000 to 2024.

The research will explore how VPD and FWI each predict wildfire occurrence and burned area, with a focus on different forest types are categorized according to the CORINE Land Cover classification into broadleaf, conifer, and mixed forests while encompassing a range of climatic regions across Europe. VPD calculation methods are generally more straightforward and require fewer input parameters. In contrast FWI system is more complex, requiring a broader range of input data to compute its numerous indices.

By comparing these two metrics across diverse forest types and biomes, the study seeks to determine the most effective indicators for wildfire prediction in Europe. The findings are intended to inform policymakers and fire management agencies, aiding in the development of targeted early warning systems and adaptive fire management strategies. This comparative assessment will contribute to a deeper understanding of the climatic drivers of wildfires and support efforts to mitigate their impacts under changing environmental conditions.

How to cite: Shatto, C. and Samimi, C.: Comparative Assessment of Vapor Pressure Deficit and Fire Weather Index in Predicting Wildfire Occurrence and Burned Area Across European Forest Types Using EFFIS and ERA5 Data, EGU General Assembly 2025, Vienna, Austria, 27 Apr–2 May 2025, EGU25-19262, https://doi.org/10.5194/egusphere-egu25-19262, 2025.

EGU25-19493 | Orals | BG1.1

The role of dry and heat extremes on vegetation dynamics in the recent fire seasons in Southern Europe 

Célia Gouveia, Mariana Finuras, Ana Russo, and Tiago Ermitão

Rural fires are recurrent in Southern Europe due to climate conditions, land use change, or a combination of both. Wet and mild winters and dry and warm summers favour the growth of vegetation and its subsequent low moisture content, increasing fuel availability. In Portugal, between 15 and 20 September 2024, severe wildfires burned more than 145,000 hectares and caused the death of more than 9 people. In Greece a major fire, stated as the largest recorded in the EU, started near the city of Alexandroupolis on August 21, with around 80.000 hectares burnt, mainly affecting the Dadia Forest and causing the death of almost two tens of migrants. Despite the crucial role played by dry fuel conditions fostering the propagation of wildfires, favourable meteorological conditions and fuel accumulation are related to the recorded fire activity and burned area. The influence of spring meteorological conditions on fire season burned area through their effect on fuel accumulation and dryness is assessed. The link between hot temperature and water availability in spring and the increased risk of summer flammability and fire spread through their influence on vegetation gross productivity is evaluated using satellite-derived data. The important role of fuel accumulation during the early growing season in fire-prone regions is highlighted in the case of Portugal in 2024 and Greece in 2023 and reinforces the crucial importance of fuel management for the definition of effective fire prevention measures in the context of warmer and drier conditions forecasted for southern European Countries.

Acknowledgements: This work is supported by the Portuguese Fundação para a Ciência e Tecnologia, FCT, I.P./MCTES through national funds (PIDDAC): UID/50019/2025 and LA/P/0068/2020 https://doi.org/10.54499/LA/P/0068/2020 and also on behalf of DHEFEUS -2022.09185.PTDC and the project FAIR- 2022.01660.PTDC).

How to cite: Gouveia, C., Finuras, M., Russo, A., and Ermitão, T.: The role of dry and heat extremes on vegetation dynamics in the recent fire seasons in Southern Europe, EGU General Assembly 2025, Vienna, Austria, 27 Apr–2 May 2025, EGU25-19493, https://doi.org/10.5194/egusphere-egu25-19493, 2025.

EGU25-20164 | ECS | Posters on site | BG1.1

Assessing increased turbidity in reservoirs due to wildfires 

Andressa Karen da Silva Nemirovsky, Lino Augusto Sander de Carvalho, and Renata Libonati

After a wildfire event, ashes and pollutants from burns are transported to public supply reservoirs and other water systems, altering the physical and chemical properties of the water. Turbidity is a water parameter that can be applied in environmental monitoring studies to assess water quality in  public supply reservoirs, especially in fire-prone regions such as the Brazilian Cerrado. So, this work aims to answer the following question: What is the impact of the increase in burned area on water turbidity in public supply reservoirs? This study aims to investigate the relationship between environmental variables obtained through remote sensing, such as the burned area product (MODIS-MCD64A1) and turbidity data derived from the red band (620-670 nm) of MODIS Terra Surface Reflectance (Daily Global, 250m resolution), using a global algorithm and statistical analyses to derive insights over the period from 2001 to 2023 in public supply reservoirs of Cerrado.There is variability in both positive and negative turbidity anomalies from 2001 to 2023. However, in some years, positive turbidity anomalies were observed along burned areas. The insights provide the initial understanding of the relationship between burned areas and water quality, and also provide valuable support for water supply managers and the public. 

How to cite: da Silva Nemirovsky, A. K., Augusto Sander de Carvalho, L., and Libonati, R.: Assessing increased turbidity in reservoirs due to wildfires, EGU General Assembly 2025, Vienna, Austria, 27 Apr–2 May 2025, EGU25-20164, https://doi.org/10.5194/egusphere-egu25-20164, 2025.

EGU25-267 | ECS | Orals | BG1.2

Uncertainties in carbon emissions from land use and land cover change in Indonesia 

Ida Bagus Mandhara Brasika, Pierre Friedlingstein, Stephen Sitch, Michael O'Sullivan, Maria Carolina Duran-Rojas, Thais Michele Rosan, Kees Klein Goldewijk, Julia Pongratz, Clemens Schwingshackl, Louise Chini, and George Hurtt

Indonesia is currently one of the three largest contributors of carbon emissions from land use and land cover change (LULCC) globally, together with Brazil and the Democratic Republic of the Congo. However, until recently, there was only limited reliable data available on LULCC across Indonesia, leading to a lack of agreement on drivers, magnitude, and trends in carbon emissions between different estimates. Accurate LULCC should improve robustness and reduce the uncertainties of carbon dioxide (CO2) emissions from Land Use Change (ELUC) estimation. Here, we assess several cropland datasets that are used to estimate ELUC in Dynamic Global Vegetation Models (DGVMs) and Bookkeeping models (BKMs). Available cropland datasets are generally categorized as either census-based such as the Food and Agricultural Organization (FAO) annual statistical dataset, or satellite-based such as the Mapbiomas dataset, which is derived from Landsat Satellite images. Our results show that census-based and satellite-based estimates have little agreement on temporal variability and cropland area changes. In some islands, they show spatial similarity, but differences appear in the main islands such as Kalimantan, Sumatra and Java. These differences lead to spatio-temporal uncertainty in carbon emissions. The different land cover forcings (census-based vs satellite-based) in a single model (JULES-ES) result in ELUC uncertainties of about 0.08 [0.06 to 0.11]  PgC/yr. Furthermore, we found that uncertainties in ELUC estimates are also due to differences in the carbon cycle models in DGVMs, as DGVMs driven by the same land cover dataset show differences in ELUC estimates of 0.12 ± 0.02 PgC/yr with 95% confidence level and range [-0.04 to 0.35] PgC/yr. This is consistent with other product such as BKMs that estimates 0.14 [0.12 to 0.15] PgC/yr with both steady trend. We also compare emissions with those from the National Greenhouse Gas Inventory (NGHGI) product. The NGHGI estimates (based on BUR3; periodic official government report on Greenhouses Gas to UNFCCC) have much lower carbon emissions (0.06 ± 0.06 PgC/yr), though with an increasing trend. These numbers double when we include emissions from peat fire and peat drainage: the DGVM ensemble indicates emissions of 0.23 ± 0.05 PgC/yr and BKMs indicate emissions of 0.24 [0.22-0.25] PgC/yr. In contrast, emissions based on the Indonesian NGHGI remain much lower (BUR2: 0.18±0.07 PgC/yr BUR3: 0.13 ± 0.10 PgC/yr). Furthermore, emission peaks occur in year of moderate-to-strong El Nino events. Several improvements might reduce uncertainties in carbon emissions from LULCC in Indonesia, such as: combination of satellite-based dataset with census-based dataset, inclusion of peat-related emissions in DGVMs and potentially explicit inclusion of palm oil in the models as this is a major crop in Indonesia. Overall, the analysis shows that carbon emissions have no decreasing trend in Indonesia, Therefore, deforestation and forest fire prevention remain vital for Indonesia. 

How to cite: Brasika, I. B. M., Friedlingstein, P., Sitch, S., O'Sullivan, M., Duran-Rojas, M. C., Rosan, T. M., Goldewijk, K. K., Pongratz, J., Schwingshackl, C., Chini, L., and Hurtt, G.: Uncertainties in carbon emissions from land use and land cover change in Indonesia, EGU General Assembly 2025, Vienna, Austria, 27 Apr–2 May 2025, EGU25-267, https://doi.org/10.5194/egusphere-egu25-267, 2025.

EGU25-1596 | ECS | Posters on site | BG1.2

Hurricanes trigger ocean CO2 uptake and phytoplankton bloom in a high-resolution Earth system model simulation 

David M. Nielsen, Fatemeh Chegini, Nuno Serra, Arjun U. Kumar, Nils Brueggemann, Cathy Hohenegger, and Tatiana Ilyina

North Atlantic tropical cyclones (i.e. hurricanes) are observed to drive intense air-sea CO2 exchange and trigger primary production by phytoplankton. However, Earth system models (ESMs) with coarse spatial resolution are not able to capture such effects. Here, we address this limitation and resolve the impacts of hurricanes on the ocean carbon cycle in an ESM for the first time. We present the first 1-year global, coupled, high-resolution (5 km ocean, 5 km atmosphere) ESM simulation including ocean biogeochemistry with the ICON (ICOsahedral Non-hydrostatic) model framework. Our simulation realistically reproduces the effects of hurricanes at: 1) instantaneously increasing air-sea CO2 fluxes by a factor of 10-30 due to strong surface winds (>58 m/s, hurricane category 4); 2) promoting longer-lasting surface ocean cooling by 2-4°C, and thus decreasing surface ocean partial pressure of CO2 (pCO2); and 3) triggering large-scale phytoplankton blooms, spatially modulated by mesoscale ocean eddies. We show that the hurricane-driven sea-surface cooling is mainly caused by extreme latent heat loss (>1200 W/m2), whose impact on decreasing pCO2 outweighs the mixing and upwelling of dissolved inorganic carbon. Our simulated hurricanes contribute to inverting the direction of the local air-sea pCO2 imbalance, thus promoting ocean CO2 uptake. Intense wind speeds also trigger vertical diffusion of nutrients, as well as near-inertial oscillations, which become the dominant mode of subsurface ocean variability in the wake of the cyclones. While the proportion of intense tropical cyclones is projected to increase with climate change, their future role in the ocean carbon cycle remains unclear. Resolving tropical cyclones in ESMs will allow us to better understand their response and impact to ongoing climate change at regional and global scales.

How to cite: Nielsen, D. M., Chegini, F., Serra, N., U. Kumar, A., Brueggemann, N., Hohenegger, C., and Ilyina, T.: Hurricanes trigger ocean CO2 uptake and phytoplankton bloom in a high-resolution Earth system model simulation, EGU General Assembly 2025, Vienna, Austria, 27 Apr–2 May 2025, EGU25-1596, https://doi.org/10.5194/egusphere-egu25-1596, 2025.

EGU25-2043 | ECS | Posters on site | BG1.2

Increasing Methane Summer Diurnal Amplitude in Siberia: A 2010–2021 Analysis from the ZOtino Tall Tower Observatory (ZOTTO) 

Dieu Anh Tran, Jordi Vilà-Guerau de Arellano, Ingrid Luijkx, Santiago Botía, Kim Faassen, Christoph Gerbig, and Sönke Zaehle

Siberia’s extensive wetlands, permafrost, and boreal forests are significant sources of methane, positioning this region as crucial for global methane (CH4) monitoring. However, Siberia remains sparsely monitored by atmospheric and ecosystem observatories, highlighting the need to leverage existing datasets to refine CH4 budgets with better spatial and temporal precision. Utilising the ZOtino Tall Tower Observatory (ZOTTO; 60°48' N, 89°21' E) dataset, which provides continuous, high-resolution CH4 mole fraction and meteorological measurements from six heights up to 301 meters, combined with ERA5 meteorological data at 60°75' N, 89°25' E, we conducted a comprehensive analysis of long-term trends and variations in atmospheric CH4 at ZOTTO, examining its diurnal and seasonal patterns from 2010 to 2021. Our analysis reveals a significant increase in the summer diurnal amplitude of CH4, which could be driven by both forest and meteorological dynamics, through the effects of daytime mixing and nighttime stability on the CH4 mole fraction, and ecosystem CH4 flux. We found that while atmospheric dynamics showed no significant trends contributing to this diurnal amplitude increase, there was an increasing trend in nighttime CH4 ecosystem flux in summer (predominantly August) over the 11-year period, with high emissions predominantly originating from the west and southwest of the station. Additionally, episodic high methane CH4 was observed in 2012 and 2019, linked to wildfires, and in 2016, attributed to enhanced wetland activity. Lastly, there were significant positive correlations between the calculated CH4 surface flux and soil temperature and moisture at ZOTTO.

How to cite: Tran, D. A., Vilà-Guerau de Arellano, J., Luijkx, I., Botía, S., Faassen, K., Gerbig, C., and Zaehle, S.: Increasing Methane Summer Diurnal Amplitude in Siberia: A 2010–2021 Analysis from the ZOtino Tall Tower Observatory (ZOTTO), EGU General Assembly 2025, Vienna, Austria, 27 Apr–2 May 2025, EGU25-2043, https://doi.org/10.5194/egusphere-egu25-2043, 2025.

EGU25-2215 | ECS | Orals | BG1.2

Global trends in ocean fronts: impacts on air-sea CO2 flux and chlorophyll concentrations 

Kai Yang, Amelie Meyer, Peter G. Strutton, and Andrew M. Fischer

Ocean fronts are dynamic features that play a critical role in regulating marine ecosystems and influencing global carbon cycles. These regions, characterized by strong horizontal gradients in temperature, salinity, and other properties, enhance vertical mixing and advection, driving increased nutrient supply that supports elevated primary production. Despite their importance, the impacts of changing ocean fronts on the budget and trends of ocean CO2 uptake remain insufficiently understood. In this study, we perform a comprehensive global analysis of ocean fronts using 20 years of satellite observations (2003–2023), identifying key regions of intense frontal activity and areas undergoing rapid changes in frontal dynamics. Our results show that nearly 50% of global ocean CO2 uptake occurs in these key frontal areas, underscoring their disproportionate role in the ocean’s carbon sink. Furthermore, we observe that trends in sea surface chlorophyll concentration—a proxy for primary production—and ocean CO2 uptake are strongly correlated with local changes in frontal activity. Our findings provide critical insights into the role of ocean fronts as modulators of global biogeochemical processes and air-sea CO2 exchanges. By linking ocean fronts to changes in primary production and air-sea CO2 exchange, this study contributes to a more detailed understanding of how changing ocean dynamics may influence carbon cycles under future climate scenarios.

How to cite: Yang, K., Meyer, A., Strutton, P. G., and Fischer, A. M.: Global trends in ocean fronts: impacts on air-sea CO2 flux and chlorophyll concentrations, EGU General Assembly 2025, Vienna, Austria, 27 Apr–2 May 2025, EGU25-2215, https://doi.org/10.5194/egusphere-egu25-2215, 2025.

EGU25-2466 | ECS | Posters on site | BG1.2

Underestimation of Methane Emissions From the Sudd Wetland: Unraveling the Impact of Wetland Extent Dynamics 

Bogang Dong, Shushi Peng, Gang Liu, Tianjiao Pu, Cynthia Gerlein‐Safdi, Catherine Prigent, and Xin Lin

Tropical wetlands account for ∼20% of the global total methane (CH4) emissions, but uncertainties remain in emission estimation due to the inaccurate representation of wetland spatiotemporal variations. Based on the latest satellite observational inundation data, we constructed a model to map the long-term time series of wetland extents over the Sudd floodplain, which has recently been identified as an important source of wetland CH4 emissions. Our analysis reveals an annual, total wetland extent of 5.73 ± 2.05 × 10⁴ km2  for 2003–2022, with a notable accelerated expansion rate of 1.19 × 10⁴ km2 yr−1 during 2019–2022 driven by anomalous upstream precipitation patterns. We found that current wetland products generally report smaller wetland areas, resulting in a systematic underestimation of wetland CH4 emissions from the Sudd wetland. Our study highlights the pivotal role of comprehensively characterizing the seasonal and interannual dynamics of wetland extent to accurately estimate CH4 emissions from tropical floodplains.

How to cite: Dong, B., Peng, S., Liu, G., Pu, T., Gerlein‐Safdi, C., Prigent, C., and Lin, X.: Underestimation of Methane Emissions From the Sudd Wetland: Unraveling the Impact of Wetland Extent Dynamics, EGU General Assembly 2025, Vienna, Austria, 27 Apr–2 May 2025, EGU25-2466, https://doi.org/10.5194/egusphere-egu25-2466, 2025.

EGU25-6054 | ECS | Posters on site | BG1.2

Four decades of full-scale nitrous oxide emission inventory in China 

Minqi Liang, Zheyan Zhou, Peiyang Ren, Han Xiao, Ri Xu, Zhongmin Hu, Shilong Piao, Hanqin Tian, Qing Tong, Feng Zhou, Jing Wei, and Wenping Yuan

China is among the top nitrous oxide (N2O)-emitting countries, but existing national inventories do not provide full-scale emissions including both natural and anthropogenic sources. We conducted a four-decade (19802020) of comprehensive quantification of Chinese N2O inventory using empirical emission factor method for anthropogenic sources and two up-to-date process-based models for natural sources. Total N2O emissions peaked at 2287.4 (1774.82799.9) Gg N2O yr-1 in 2018, and agriculture-developed regions, like the East, Northeast, and Central, were the top N2O-emitting regions. Agricultural N2O emissions have started to decrease after 2016 due to the decline of nitrogen fertilization applications, while, industrial and energetic sources have been dramatically increasing after 2005. N2O emissions from agriculture, industry, energy, and waste represented 49.3%, 26.4%, 17.5%, and 6.7% of the anthropogenic emissions in 2020, respectively, which revealed that it is imperative to prioritize N2O emission mitigation in agriculture, industry, and energy. Natural N2O sources, dominated by forests, have been steadily growing from 317.3 (290.3344.1) Gg N2O yr-1 in 1980 to 376.2 (335.5407.2) Gg N2O yr-1 in 2020. Our study produces a Full-scale Annual N2O dataset in China (FAN2020), providing emergent counting to refine the current national N2O inventories.

How to cite: Liang, M., Zhou, Z., Ren, P., Xiao, H., Xu, R., Hu, Z., Piao, S., Tian, H., Tong, Q., Zhou, F., Wei, J., and Yuan, W.: Four decades of full-scale nitrous oxide emission inventory in China, EGU General Assembly 2025, Vienna, Austria, 27 Apr–2 May 2025, EGU25-6054, https://doi.org/10.5194/egusphere-egu25-6054, 2025.

EGU25-6416 | ECS | Posters on site | BG1.2

Analysis of ground-based column and in situ surface concentrations of CO2 at Xianghe, China, using WRF-Chem simulations 

Sieglinde Callewaert, Martine De Mazière, Minqiang Zhou, Ting Wang, Bavo Langerock, Pucai Wang, and Emmanuel Mahieu

Since June 2018, ground-based remote sensing measurements are performed at the suburban Xianghe site in China, situated in the heart of the densely populated Beijing-Tianjin-Hebei megalopolis. These observations are performed with Fourier Transform Infrared (FTIR) spectrometers and provide  column-averaged dry-air concentrations of gases such as CO2, CH4 and CO. They are affiliated to the international Total Column Carbon Observing Network (TCCON). Co-located with these measurements is a PICARRO cavity ring-down spectroscopy (CRDS) analyser observing in situ concentrations of CO2 and CH4 at an altitude of 60 m.

To gain a better understanding of the causes of the observed temporal variabilities at this site, we employed the Weather Research and Forecasting model coupled with Chemistry in its greenhouse gas configuration (WRF-GHG). Our study analyses both column-averaged (XCO2) and surface in situ CO2 concentrations and simultaneously evaluates the model’s performance at Xianghe.  The CO2 exchange with the biosphere is simulated with the integrated Vegetation Photosynthesis and Respiration Model (VPRM), while the anthropogenic emissions are taken from the global CAMS-GLOB-ANT inventory and transported in separate tracers according to their source sector. 

The model shows good performance, achieving correlation coefficients of 0.70 for XCO2 and 0.75 for afternoon in situ concentrations. For XCO2, a mean bias of -1.43 ppm relative to TCCON is found, primarily attributed to biases in the CAMS reanalysis used as initial and lateral boundary conditions. Anthropogenic emissions from the industry and energy sectors emerged as dominant contributors to CO2 concentrations, alongside the biosphere, which acts as a sink for XCO2 from April to September and becomes a source for the rest of the year. Synoptic weather patterns were shown to strongly determine the variation in CO2 levels, with enhanced impacts during summer due to the large spatial and temporal heterogeneity of biogenic fluxes in the region. Near the surface, the observed large diurnal variation associated to the evolution of the planetary boundary layer is  relatively well simulated by WRF-GHG.

Our analysis demonstrates the utility of WRF-GHG in simulating both column and surface CO2 concentrations, offering insights into the sectoral and meteorological drivers of variability at Xianghe and its surrounding region.


How to cite: Callewaert, S., De Mazière, M., Zhou, M., Wang, T., Langerock, B., Wang, P., and Mahieu, E.: Analysis of ground-based column and in situ surface concentrations of CO2 at Xianghe, China, using WRF-Chem simulations, EGU General Assembly 2025, Vienna, Austria, 27 Apr–2 May 2025, EGU25-6416, https://doi.org/10.5194/egusphere-egu25-6416, 2025.

EGU25-6427 | ECS | Orals | BG1.2

Improved air-sea CO2 flux estimates by adding sailboat measurements  

Jacqueline Behncke, Peter Landschützer, Fatemeh Chegini, and Tatiana Ilyina

Sailboats expand the observational network of sea surface partial pressure of CO2 (pCO2), particularly in the undersampled Southern Ocean through regularly repeating circumnavigations, however, their added value to the fCO2-product based ocean sink estimate (Socean) has thus far not been quantified. Here, we show through an observing system simulation study with different sampling schemes how integrating sailboat data from different race tracks improves air-sea CO2 flux estimates.
We find that neural network reconstruction of the air-sea CO2 flux used within the Global Carbon Budget, when reconstructing a model that mimics present-day real-world sampling, underestimates the ocean carbon sink. This is consistent with recent studies on the interior accumulation of carbon. Increased and continuous sampling by sailboats reveals a stronger carbon sink and improves present-day estimates from 0.06 to -0.02 mol C m⁻² yr⁻¹ (0.99 μatm to -0.32 μatm for the fCO2 estimate), particularly in the Southern Ocean between 40°S and 60°S. The improvement in reconstructions persists even when data from three circumnavigation tracks contain artificial measurement biases. However, the additional data remains insufficient to correct the overestimated air-sea CO2 flux trend. While sailboat data has the potential to improve air-sea CO2 flux reconstructions, expanding the observational network and maintaining long-term time series is crucial to minimize discrepancies between fCO2-products and Global Ocean Biogeochemical Models.

How to cite: Behncke, J., Landschützer, P., Chegini, F., and Ilyina, T.: Improved air-sea CO2 flux estimates by adding sailboat measurements , EGU General Assembly 2025, Vienna, Austria, 27 Apr–2 May 2025, EGU25-6427, https://doi.org/10.5194/egusphere-egu25-6427, 2025.

EGU25-6908 | ECS | Orals | BG1.2

Upscaling near-real-time biospheric CO2 fluxes over Europe with a modified Vegetation Photosynthesis Respiration Model (VPRM) 

Otto Briner, Hassan Bazzi, Philippe Ciais, and Diego Santaren

Monitoring ecosystem carbon dioxide (CO2) exchange is crucial for assessing the impacts of climate extremes and constructing carbon budgets to inform land management and enforce international climate treaties. To this end, we present here gridded hourly ecosystem CO2 fluxes upscaled from eddy covariance observations at 0.1° × 0.1° resolution and updated at low latency. Sentinel-2 indices are used to drive a modified Vegetation Photosynthesis Respiration Model (VPRM) following Bazzi et al. (2024) with a restructured Ecosystem Respiration equation and explicit soil moisture stress functions. VPRM parameters are optimized to half-hourly eddy covariance Net Ecosystem Exchange (NEE) and Gross Primary Production (GPP) datasets for each of 36 FLUXNET sites. Additionally we modify the temperature dependence of GPP by optimizing minimum and maximum temperatures as parameters and estimating optimum temperatures from mean annual temperature. We find these temperature modifications reduce RMSE for NEE and GPP respectively by 11% and 12% overall, 16% and 18% at evergreen needleleaf forests, 14% and 12% at grasslands, and 12% and 16% at mixed forests. Using site data on meteorology and vegetation, we train a random forest to produce mapped VPRM parameters representing the spatial heterogeneity in ecosystem characteristics. Gridded VPRM NEE estimates are presented based on both modeled parameter maps and multi-site optimizations by plant functional type, and upscaled products can be produced within hours of satellite data availability.


[1] Bazzi, H. et al. "Assimilating Sentinel-2 data in a modified vegetation photosynthesis and respiration model (VPRM) to improve the simulation of croplands CO2 fluxes in Europe." International Journal of Applied Earth Observation and Geoinformation 127 (2024): 103666.

How to cite: Briner, O., Bazzi, H., Ciais, P., and Santaren, D.: Upscaling near-real-time biospheric CO2 fluxes over Europe with a modified Vegetation Photosynthesis Respiration Model (VPRM), EGU General Assembly 2025, Vienna, Austria, 27 Apr–2 May 2025, EGU25-6908, https://doi.org/10.5194/egusphere-egu25-6908, 2025.

EGU25-7573 | Posters on site | BG1.2

Coupled Simultion of Atmospheric CO2 in CAS-ESM 

Jiawen Zhu, Juanxiong He, Duoying Ji, Yangchun Li, He Zhang, Minghua Zhang, Xiaodong Zeng, Kece Fei, and Jiangbo Jin

The atmospheric carbon dioxide (CO2) concentration has been increasing rapidly since the Industrial Revolution, which has led to unequivocal global warming and crucial environmental change. It is extremely important to investigate the interactions among atmospheric CO2, the physical climate  system, and the carbon cycle of the underlying surface for a better understanding of the Earth system. Earth system models are widely used to investigate these interactions via coupled carbon–climate simulations. The Chinese Academy of Sciences Earth System Model version 2 (CAS-ESM2.0) has successfully fixed a two-way coupling of atmospheric CO2 with the climate and carbon cycle on land and in the ocean. Using CAS-ESM2.0, we  conducted a coupled carbon–climate simulation by following the CMIP6 proposal of a historical emissions-driven experiment. This paper examines the modeled CO2 by comparison with observed CO2 at the sites of Mauna Loa and Barrow, and the Greenhouse Gases Observing Satellite (GOSAT) CO2 product. The results showed that CAS-ESM2.0 agrees very well with observations in reproducing the increasing trend of annual CO2 during the period 1850–2014, and in capturing the seasonal cycle of CO2 at the two baseline sites, as well as over northern high latitudes. These agreements illustrate a good ability of CAS-ESM2.0 in simulating carbon–climate interactions, even though uncertainties remain in the processes involved. This paper reports an important stage of the development of CAS-ESM with the coupling of carbon and climate, which will provide significant scientific support for climate research and China’s goal of carbon neutrality.

How to cite: Zhu, J., He, J., Ji, D., Li, Y., Zhang, H., Zhang, M., Zeng, X., Fei, K., and Jin, J.: Coupled Simultion of Atmospheric CO2 in CAS-ESM, EGU General Assembly 2025, Vienna, Austria, 27 Apr–2 May 2025, EGU25-7573, https://doi.org/10.5194/egusphere-egu25-7573, 2025.

EGU25-7650 | Posters on site | BG1.2

Characteristics of carbon sink and the influence factors in Ngoring Lake, Qinghai-Tibet Plateau 

Mengxiao Wang, Lijuan Wen, Zhaoguo Li, Xianhong Meng, and Dongsheng Su

Lakes, as a fundamental component of the Earth's surface system, play a crucial role in the carbon cycle, closely linked to climate change. However, understanding carbon flux in Qinghai-Tibet Plateau (QTP) lakes is restricted by environmental factors and limited observations, hindering insights into regional and global climate change. Continuous annual carbon dioxide (CO2) flux, encompassing ice-covered periods, has been monitored in the largest freshwater lake on the QTP. Utilizing continuous eddy system data, the characteristics and mechanisms influencing carbon flux at various temporal scales in this lake were investigated. Findings revealed Ngoring Lake as predominantly a carbon sink year-round, with two CO2 absorption peaks in spring and autumn, respectively. These peaks were associated with mixing state triggered by cooling processes. In spring, as temperatures rose above the lake water's maximum density temperature (3.98 ℃ for freshwater lake), subsequent rapid cooling and mixing occurred upon ice melt. In autumn, cooling and mixing were induced by decreasing air and water temperatures alongside strong winds. These cooling processes facilitated significant CO2 absorption. As the lake transitioned from stratification to mixing, lake mixing played a dominant role. Biochemical reactions driven by water temperature play a dominant role during stable stratification and complete mixing phases.

How to cite: Wang, M., Wen, L., Li, Z., Meng, X., and Su, D.: Characteristics of carbon sink and the influence factors in Ngoring Lake, Qinghai-Tibet Plateau, EGU General Assembly 2025, Vienna, Austria, 27 Apr–2 May 2025, EGU25-7650, https://doi.org/10.5194/egusphere-egu25-7650, 2025.

Freeze-thaw periods contribute disproportionately to annual N₂O emissionsrepresenting a critical yet understudied component of its global budget. Understanding drivers of these hot moments and their sensitivity to climate change is essential, but their episodic nature and great spatiotemporal variability pose substantial challenges. Combining cross-ecoregion soil core incubations with in-situ automated measurements, we explored snow regime shift effects on N2O emissions. Our findings revealed ~50-day pulse emissions during freeze-thaw periods, accounting for over 50% of annual fluxes, increasing nonlinearly with snow depth. Emissions were regulated by water-filled pore space (WFPS) thresholds: below 43%, soil moisture dominated; at 43%–66%, moisture and microbial attributes jointly triggered emissions; above 66%, microbial attributes, particularly N enzyme kinetics, prevailed. Hotspots of freeze-thaw-induced emissions were linked to high root production and microbial activity in cold, humid grasslands. This hierarchical control of WFPS and microbial processes provides a framework for predicting the location and magnitude of freeze-thaw-induced N₂O pulses, improving N₂O accounting and informing mitigation strategies.

How to cite: Liu, L. and Luo, J.: Moisture-microbial interaction amplifies N2O emission hot moments under deepened snow in grasslands, EGU General Assembly 2025, Vienna, Austria, 27 Apr–2 May 2025, EGU25-7905, https://doi.org/10.5194/egusphere-egu25-7905, 2025.

EGU25-7918 | Orals | BG1.2

New advances and new questions for atmospheric methane 

Martin Manning, Xin (Lindsay) Lan, Sylvia Michel, and Euan Nisbet

Scenarios to keep global warming below 2°C include significant decreases in short lived atmospheric methane to allow time for the much longer-lived atmospheric CO2 to decrease more slowly. A methane decrease during the 2020s decade has been built into SSP scenarios and the need for this is reinforced by recent studies [Reisinger, 2024; Shindell et al., 2024]. In reality, the atmospheric methane burden has been growing very rapidly since 2006.

Atmospheric methane destruction is predominantly through oxidation by hydroxyl (OH). There is now evidence that since 1997, OH has been increasing in the Southern Hemisphere [Morgenstern et al., 2025]. This is based on 30 years of data for cosmic-ray produced 14C in atmospheric carbon monoxide (CO). Although most atmospheric chemistry models expect an increase in OH, the observed Southern Hemisphere increase of about +5% per decade is significantly greater than expected. Unfortunately, 14CO data in the Northern Hemisphere are insufficient to compare with models there.

The increase in methane removal rate inferred from the 14CO data means that methane sources are larger than prior estimates based on an almost-constant removal rate. If so, this new finding reduces a long standing discrepancy between “top-down” estimates of methane emissions from wetlands and consistently larger “bottom-up” estimates [Saunois et al., 2024].

While the increasing availability of satellite data is leading to better determination of methane’s source distribution, it is also necessary to differentiate between fossil fuel and biogenic sources. The positive trend of atmospheric δ13CCH4 for two centuries prior to 2006 reflected methane emissions from fossil fuel sources, but the strongly negative trend in δ13CCH4 since 2006 is primarily driven by biogenic sources such as wetlands and agriculture [Michel et al., 2024]. The magnitude of the source increase, particularly when the OH increase is taken into account, implies strong growth in wetland emissions, especially from northern tropical Africa.

More recent δ13CCH4 data for 2023 have shown flattening of its post-2006 trend at many Northern Hemisphere sites. While something similar was seen in 2012 this apparent shift in methane sources now appears more pronounced.

Given the urgency of reducing atmospheric methane to keep to the 2°C target, the recent changes in δ13CCH4 show atmospheric methane is in a very dynamic period of change. Future changes in the global methane budget may be less predictable than is currently assumed.


References:

Michel, S.E., Lan, X., Miller, J., et al, 2024: Rapid shift in methane carbon isotopes suggests microbial emissions drove record high atmospheric methane growth in 2020–2022. Proceedings of the National Academy of Sciences - PNAS, 121(44), e2411212121.

Morgenstern, O., Moss, R., Manning, M., et al, 2025: Radiocarbon monoxide indicates increasing atmospheric oxidizing capacity. Nature Communications, 16, 249.

Reisinger, A., 2024: Why addressing methane emissions is a non-negotiable part of effective climate policy. Frontiers in Science, 2, 5.

Saunois, M., et al., 2024: Global Methane Budget 2000-2020. Earth System Science Data, https://doi.org/10.5194/essd-2024-115 Discussion started: 6 June 2024, 147.

Shindell, D., Sadavarte, P., Aben, I., et al , 2024: The methane imperative. Frontiers in Science, 2, 1349770.

How to cite: Manning, M., Lan, X. (., Michel, S., and Nisbet, E.: New advances and new questions for atmospheric methane, EGU General Assembly 2025, Vienna, Austria, 27 Apr–2 May 2025, EGU25-7918, https://doi.org/10.5194/egusphere-egu25-7918, 2025.

EGU25-8281 | Orals | BG1.2

Evolution of atmospheric methane under the global methane pledge: insights from an Earth system model 

Ulas Im, Kostas Tsigaridis, Susanne Bauer, Drew Shindell, Dirk Olivié, Simon Wilson, Lise Lotte Sørensen, Peter Langen, Sabine Eckhardt, Lena Hoglund Isaksson, Zig Klimont, and Lori Bruhwiler

The global methane pledge (GMP) aims to cut methane (CH4) emissions across all sectors by at least 30 percent below 2020 levels by 2030, which can thereby provide benefits in air quality and health, as well as in climate, relative to not cutting the emissions. We have used a fully coupled Earth system model (ESM) with interactive CH4 sources and sinks to study the future levels and trends of global atmospheric CH4 concentrations under different emission scenarios. Fully coupled simulations have been performed from 1995 to 2050, using multispecies emissions from the ECLIPSE V6b emissions database supplemented by new anthropogenic methane emissions estimates for Current Legislation (CLE), Maximum Feasible Reduction (MFR) and Global Methane Pledge (GMP) from IIASA/GAINS to simulate the future evolution of CH4 levels. In the baseline CLE scenario, global anthropogenic CH4 emissions increase from 298 Tg in year 2000 to 335 Tg in 2015, then continues to increase to 430 Tg in 2050 under CLE. Under MFR, anthropogenic CH4emissions first drop to 240 Tg in 2030, then slightly decrease to 220 Tg in 2050, while under the GMP scenario, they first drop to 300 Tg in 2030, then slightly increase to 320 Tg in 2050.

Preliminary results show that the interactive simulation slightly underestimates the observations on average by 2% between 1995-2022. All scenarios show an increase in the global CH4 concentrations, from 1.8 ppm in the present-day CH4 to 1.9 ppm (6%) in 2050 in the MFR scenario, 2.2 ppm (22%) in the CLE scenario, and 2.1 ppm (17%) in the GMP scenario. In addition, while anthropogenic CH4 emissions decrease, all simulations predict increasing wetland CH4emissions, by up to 10% in 2050 compared to 2020. Corresponding atmospheric CH4 lifetimes also increase in all simulations from 8.4 years in 2020 to lowest 8.5 years in CLE, 9.2 years in MFR, and 9.4 years in GMP. The increasing CH4 lifetime and concentrations in all scenarios despite reductions in emissions highlights that the response of concentrations are not necessarily linear with the changes in emissions as the chemistry is non-linear, and dependent on the oxidative capacity of the atmosphere due to other species such as CO and VOCs. In addition, missing sinks in ESMs such as halogens chlorine can lead to less chemical removal and longer lifetime compared to the box model.

We will further present the impact of these scenarios on the global surface temperatures and evaluate if the GMP will achieve its goal by 2050. However, preliminary results, compared with the recent 2021 AMAP SLCF assessment, suggest that despite the reduction in emissions, the atmospheric global CH4 levels simulated in the present study may not fulfil the larger goals of the GMP such as decreasing global CH4 concentrations and avoiding a 0.2°C warming by 2050 relative to 2020. However, reductions in emissions can still be achieved, which can lead to benefits in air quality and health. This work was accomplished through the Reduc(h4)e project funded by the Nordic Council of Ministers-and contributes to ongoing AMAP assessment work.

How to cite: Im, U., Tsigaridis, K., Bauer, S., Shindell, D., Olivié, D., Wilson, S., Sørensen, L. L., Langen, P., Eckhardt, S., Isaksson, L. H., Klimont, Z., and Bruhwiler, L.: Evolution of atmospheric methane under the global methane pledge: insights from an Earth system model, EGU General Assembly 2025, Vienna, Austria, 27 Apr–2 May 2025, EGU25-8281, https://doi.org/10.5194/egusphere-egu25-8281, 2025.

EGU25-9043 | Orals | BG1.2

Quantifying greenhouse gas emissions from landscape fires due to the Russo–Ukrainian War and the impact on the carbon sequestration capacity of forests 

Roman Vasylyshyn, Rostyslav Bun, Viktor Myroniuk, Lennard de Klerk, Oleksandr Soshenskyi, Sergiy Zibtsev, Svitlana Krakovska, Linda See, Mykola Shlapak, Volodymyr Blyshchyk, Lidiia Kryshtop, Zoriana Romanchuk, Orysia Yashchun, Eugene Kalchuk, and Yuriy Rymarenko

Vegetation acts as an essential land-based carbon sink, which can be affected by military conflicts and wars through landscape fires that can cover large territories and will lead to additional greenhouse gas (GHG) emissions into the atmosphere. To investigate this impact, we spatially analyzed the effect of the ongoing Russo–Ukrainian War on the GHG emissions from landscape fires and determined the change to the carbon sequestration capacity of the forests. Using remotely sensed data from 2022–2023, we first identified the fire perimeters in the territory of Ukraine. We then classified the burned areas into coniferous and deciduous forests, croplands, and other landscapes, and evaluated the distribution of the fires according to their intensity based on the differenced normalized burn ratio. We used several fire weather condition indices and calculated the attribution factor to identify the share of fires that were war related and were thus not caused by natural factors or human activity that would be typical in times of peace. We estimated the war-related biomass losses during the first two years of the war, considering the landcover type, the species and the age structure of the forest stands, the fire intensity, and the biomass content. The corresponding GHG emissions in the immediate term were estimated to be 9.08 Mt carbon dioxide equivalent (CO2e), with a relative uncertainty of ±46% (95% confidence interval). The estimated future (long-term) biomass losses due to current forest fires and their corresponding GHG emissions were calculated to be 16.86 Mt CO2e (±21%). Finally, losses in the carbon sequestration capacity of the burned forests during the first five years following the landscape fires were estimated to be 2.9 Mt CO2e.


How to cite: Vasylyshyn, R., Bun, R., Myroniuk, V., de Klerk, L., Soshenskyi, O., Zibtsev, S., Krakovska, S., See, L., Shlapak, M., Blyshchyk, V., Kryshtop, L., Romanchuk, Z., Yashchun, O., Kalchuk, E., and Rymarenko, Y.: Quantifying greenhouse gas emissions from landscape fires due to the Russo–Ukrainian War and the impact on the carbon sequestration capacity of forests, EGU General Assembly 2025, Vienna, Austria, 27 Apr–2 May 2025, EGU25-9043, https://doi.org/10.5194/egusphere-egu25-9043, 2025.

EGU25-9368 | ECS | Posters on site | BG1.2

Assessing the optimal drivers for flux data gap-filling using random forest networks 

Nicola Lieff, Daniel Metzen, Cacilia Ewenz, Peter Isaac, Ian McHugh, and Anne Griebel

The Terrestrial Ecosystem Research Network (TERN) OzFlux group operates a network of eddy covariance stations that collect long-term atmospheric and soil measurements for monitoring and understanding changes in climate and the environment. Ideally, all data collected would be gap-free, however, all real data has gaps where instruments have not recorded measurements or data has been discarded due to low turbulence. To allow this data to be used as a continuous time-series in further analysis, the missing data is gap-filled using PyFluxPro. The standard community approach uses a predefined set of variables (drivers) for gap-filling, which are the same variables for all stations irrespective of location. However, the stations are located in a large range of climate zones, hence the standard gap-filling drivers might not be ideal for all sites. This is because the drivers were chosen for a small set of initial sites and might not be representative for a heating and drying climate.

To identify which drivers were best suited for each station, we developed a random forest model to objectively assess the relative importance of input variables used to gap-fill ustar, carbon, and energy fluxes. We trained this model on the published TERN OzFlux data for all available Australian sites using a large range of input variables. This model then determined the relative importance of variables, mean absolute errors, and R2 for the accuracy of the model prediction for a target variable at each site. Next, we grouped the variables into atmospheric, energy, turbulence and soil categories of drivers, which highlighted a distinct variation in the contribution of each category of driver across sites. To assess the ecological significance of these trends, the model importances were sorted by the aridity index and grouped by the Köppen-Geiger classification of each site. There is a notable shift in the importance of energy, turbulence, and soil groups with decreasing aridity, and driver contributions were generally consistent within Köppen-Geiger classifications. Reprocessing the gap-filling of a representative subsample of sites demonstrated a marked improvement in predicting the gap-filled target variables, highlighting that this approach can inform driver selection at new and established sites and will improve the understanding of the ecological significance of different drivers in various climate regions.


How to cite: Lieff, N., Metzen, D., Ewenz, C., Isaac, P., McHugh, I., and Griebel, A.: Assessing the optimal drivers for flux data gap-filling using random forest networks, EGU General Assembly 2025, Vienna, Austria, 27 Apr–2 May 2025, EGU25-9368, https://doi.org/10.5194/egusphere-egu25-9368, 2025.

Methane (CH₄) emissions from the Tibetan Plateau, often referred to as the "Third Pole," are critical to understanding global methane dynamics due to the region's extensive wetland ecosystems and unique environmental characteristics. However, quantifying CH₄ fluxes in this region is challenging due to sparse observational data, complex topography, and highly variable climatic and hydrological conditions. This study introduces a high-resolution machine learning framework tailored for the Tibetan Plateau by integrating satellite-based observations, ground measurements, and modeled data. The framework incorporates a diverse set of environmental drivers, including temperature, soil moisture, vegetation indices, and hydrological factors. This approach aims to address spatial and temporal gaps in methane flux estimates while capturing the complex interactions governing CH₄ emissions in high-altitude mountainous ecosystems.

How to cite: Zhang, Z.: High-Resolution Wetland Methane Flux Modeling for the Tibetan Plateau Using Machine Learning, EGU General Assembly 2025, Vienna, Austria, 27 Apr–2 May 2025, EGU25-10099, https://doi.org/10.5194/egusphere-egu25-10099, 2025.

EGU25-10326 | ECS | Orals | BG1.2 | Highlight

Declining coral calcification to enhance twenty-first century ocean carbon uptake by gigatons 

Alban Planchat, Lester Kwiatkowski, Marc Pyolle, Charlotte Laufkötter, and Laurent Bopp

As the oceans warm and acidify, the calcification of coral reefs declines, with net calcium carbonate dissolution projected even under moderate emissions scenarios. The impact of this on the global carbon cycle is however yet to be accounted for. We use a synthesis of the sensitivity of coral reef calcification to climate change, alongside reef distribution products to estimate alkalinity and dissolved inorganic carbon fluxes resulting from reductions in reef calcification. Using the global ocean biogeochemical model NEMO-PISCES, we simulate the impact of these fluxes on ocean carbon uptake under different emissions scenarios, accounting for uncertainty in present-day calcification rates.

Reductions in global coral reef carbonate production could enhance the ocean anthropogenic carbon sink by 0.34 PgC yr-1by mid-century (0.13 PgC yr-1 median estimate) with cumulative ocean carbon uptake up to 110 PgC greater by 2300 (46 PgC median estimate). Under medium to high emissions scenarios, two critical aspects emerge: (i) the full potential for coral reef degradation to affect carbon fluxes is reached within decades, and (ii) air-sea carbon fluxes remain substantial for centuries, due to the imbalance between carbon and alkalinity sinks/sources for the global ocean.

Accounting for the coral reef feedback into Earth system models could revise upward remaining carbon budget estimates, increasing the likelihood of achieving net-zero emissions without relying on negative emissions. The coral reef feedback could have a 21st-century impact comparable in magnitude to boreal forest dieback, though opposite in sign. This underscores a critical paradox: conserving calcifying organisms, such as coral reefs, may counteract a natural mechanism for mitigating climate change, but at the cost of protecting vital biodiversity. This challenges the "all-carbon" framework often used to address environmental issues, highlighting the complex trade-offs between carbon cycle regulation and biodiversity conservation.

How to cite: Planchat, A., Kwiatkowski, L., Pyolle, M., Laufkötter, C., and Bopp, L.: Declining coral calcification to enhance twenty-first century ocean carbon uptake by gigatons, EGU General Assembly 2025, Vienna, Austria, 27 Apr–2 May 2025, EGU25-10326, https://doi.org/10.5194/egusphere-egu25-10326, 2025.

EGU25-10374 | Posters on site | BG1.2

Methane budget, seasonality and interannual variability of the three major river basins in Tropical South America 

Shrutika Wagh, Luana Basso, Ayan Fleischmann, Joao Amaral, John Melack, Hella Asperen, Stijin Hantson, Thorsten Schäfer, and Santiago Botia

Tropical wetlands are one of the largest natural methane sources but lack of in-situ observations and uncertainty in wetland extent leads to large uncertainly. In this study we analyze the methane budget from three major river basins in South America: the Orinoco, the Amazon, and the Pantanal basins using two atmospheric inversions:  the CAMS-CH4inversion, which assimilates satellite and in-situ data and the CarboScope methane inversion system constrained by in-situ data only. We make a comparative analysis focusing on the seasonal cycle, interannual variability, and the total methane budget from 2000 to 2019.

The budget difference in posterior estimates between CAMS-CH4 and CarboScope for these basins are as follows: Amazon Basin: -18.03 TgCH4/yr, Pantanal Basin: -11.65 TgCH4/yr, Orinoco Basin: -0.96 TgCH4/yr.  All together the total flux difference is -30.56 TgCH4/yr, indicating that CarboScope estimates larger total methane fluxes than the CAMS-CH4 inversion. Note that a similar difference (30.98 TgCH4/year) is also seen in the prior fluxes, suggesting that the optimization does not reduce the prior difference in the regions of interest.  While the Amazon Basin emits largest amount of methane, the Orinoco Basin exhibits the highest emissions per unit area, with 21.2 mgCH4/m²/day. In comparison, Amazon and Pantanal basins have emission of 19.26 mgCH4/m²/day and 13.36 mgCH4/m²/day. This shows the significant contribution of the smallest basin, in terms of methane flux density. Not surprisingly, both models indicate that wetlands are the primary methane source in the Amazon and Orinoco basins (~80%). In the Pantanal, CAMS-CH4 shows equal contributions from wetlands and anthropogenic sources, whereas CarboScope attributes dominance to anthropogenic emissions. Interestingly, seasonal patterns differ between the two models. In CAMS-CH4 there is a strong seasonality, with maximum methane emissions occurring during the wet season across all basins, in CarboScope, there is a double-peak in the Amazon Basin during March (wet) and August (dry). Finally, we investigate the inundation patterns and their relationship to methane emissions trends in these basins, as well as the factors influencing interannual variability to enhance our understanding of the processes driving these emissions.

How to cite: Wagh, S., Basso, L., Fleischmann, A., Amaral, J., Melack, J., Asperen, H., Hantson, S., Schäfer, T., and Botia, S.: Methane budget, seasonality and interannual variability of the three major river basins in Tropical South America, EGU General Assembly 2025, Vienna, Austria, 27 Apr–2 May 2025, EGU25-10374, https://doi.org/10.5194/egusphere-egu25-10374, 2025.

EGU25-11802 | ECS | Orals | BG1.2

Tracking methane across South America: an inversion of TROPOMI satellite observations to quantify emissions and sectoral contributions 

Aurélien Sicsik-Paré, Isabelle Pison, Audrey Fortems-Cheiney, Grégoire Broquet, Elise Potier, Adrien Martinez, Florencio Utreras-Diaz, and Antoine Berchet

Methane (CH4) emissions from South America have been estimated to account for approximately 15% of global emissions over the past decade. While natural emissions are predominantly driven by wetlands, anthropogenic emissions include contributions from livestock and landfills. However, bottom-up estimates remain highly uncertain, particularly for wetland contributions. The top-down approach, based on atmospheric transport inverse modeling, offers a critical tool for enhancing the monitoring of regional CH4 emissions. Given the sparse network of in-situ measurements and limited aircraft campaigns in the region, satellite observations of total column methane mixing ratios (XCH4) provide a valuable source of observations for inverse modeling.

The TROPOspheric Monitoring Instrument (TROPOMI) aboard the Sentinel-5 Precursor (S5P) satellite, launched in 2017, provides XCH4 with global daily coverage and a relatively high (5.5×7 km²) horizontal resolution. Three different products are derived from the raw spectra measurements and are used in this study: the official product by SRON, the WFMD product by the University of Bremen and the BLENDED product by the University of Harvard. While widely used for detecting localized methane plumes linked to super-emitters, TROPOMI CH4 data also support regional and global flux inversions, enabling improved mapping of CH4 emissions. In 2019, TROPOMI provided over 4 million observations across South America, though with uneven spatial coverage, particularly limited over the tropical region due to cloud cover.

We assimilate the TROPOMI XCH4observations into regional atmospheric inversions of CH4 emissions over South America at a 0.2°×0.2° resolution, for 2019. The inversions are performed with the CHIMERE transport model coupled with the inverse modeling platform Community Inversion Framework (CIF). We first compare prior emission dataset, evaluating sector-specific uncertainties and spatial-temporal correlations within the background error covariance (B). The study then assesses system sensitivity to key input datasets and parametrization, including deep convection modeling, prior datasets and TROPOMI product selection, and optimization parameters. Additionally, the response of simulated XCH4 to sectoral contributions is analyzed. Particular focus is given over the tropical region and especially the Amazon basin, where extensive wetland emissions and low satellite observation coverage pose significant challenges. Finally, posterior CH4 emission budgets are presented at local, country, and regional scale, with detailed analysis of sectoral contributions from livestock, landfills, and wetlands, offering insights into the drivers of South America’s methane emissions.

How to cite: Sicsik-Paré, A., Pison, I., Fortems-Cheiney, A., Broquet, G., Potier, E., Martinez, A., Utreras-Diaz, F., and Berchet, A.: Tracking methane across South America: an inversion of TROPOMI satellite observations to quantify emissions and sectoral contributions, EGU General Assembly 2025, Vienna, Austria, 27 Apr–2 May 2025, EGU25-11802, https://doi.org/10.5194/egusphere-egu25-11802, 2025.

EGU25-12730 | ECS | Posters on site | BG1.2

Refining methane emission estimates in the Amazon basin: Addressing spatiotemporal variability and habitat diversity 

Santiago Botía, Ayan Santos Fleischmann, Luana Santamaria Basso, Shrutika Wagh, Jost Lavric, Ahmad Al Bitar, and John Melack

Recent studies highlight the critical role of methane emissions from tropical wetlands in driving the accelerated atmospheric CH4 growth rate observed in the last decade. The Amazon lowland region, where up to 30% of the area can be seasonally flooded, is one of the largest natural methane sources. The total methane flux estimates for the Amazon basin from top-down and bottom-up approaches converge at 31–46 TgCH₄/year. However, understanding methane emission trends and interannual variability—such as inundation extent and seasonality—requires improved attribution of emissions to specific wetland types and habitats. In this study, we present a refined bottom-up estimate of methane fluxes for the lowland Amazon that addresses key challenges to regionalizing fluxes in the basin: i) the large seasonal variation in inundated areas and habitats, ii) the diversity of aquatic ecosystems across the Amazon, and iii) the spatiotemporal variability of methane fluxes. 

We link local methane flux measurements collected during more than 20 years of field campaigns to specific river and wetland types and incorporate seasonal variability in inundation extent using dynamic remote sensing products (i.e. open water data from the Global Surface Water for lakes, Global River Width from Landsat (GRWL) for rivers, and wetland inundation extent from the High-Resolution Surface WAterFraction (SWAF-HR, based on SMOS L-band imagery) for the Amazon basin, and (4) GIEMS-D15 (merge of multiple satellites) for the remaining portions of South America). Wetland types (herbaceous and woody vegetation) were obtained from the JERS-1 L-band based classification of Hess et al. (2015) for the Amazon Basin and ESA-CCI land cover for the rest of South America. The magnitude and seasonal variability of our bottom-up fluxes are evaluated against fluxes derived from atmospheric CH4 mole fraction measurements at two Amazonian sites, whose footprints go beyond the Amazon Basin. While our product successfully captures the seasonal variability at both sites, it underestimates the overall magnitude of emissions compared to other estimates, even when accounting for emissions from flooded forest tree stems. Our findings represent an important improvement of bottom-up estimates representing the diversity of wetland habitats and processes driving methane emissions, but further work is needed to understand the mismatch with other methane emissions products.

How to cite: Botía, S., Santos Fleischmann, A., Santamaria Basso, L., Wagh, S., Lavric, J., Al Bitar, A., and Melack, J.: Refining methane emission estimates in the Amazon basin: Addressing spatiotemporal variability and habitat diversity, EGU General Assembly 2025, Vienna, Austria, 27 Apr–2 May 2025, EGU25-12730, https://doi.org/10.5194/egusphere-egu25-12730, 2025.

EGU25-13556 | Posters on site | BG1.2

Let’s Investigate Methane for Climate Action 

Sander Houweling, Roxana Petrescu, Mekky Zaidi, Thomas Roeckmann, Jean-Daniel Paris, Torsten Sachs, Tuula Aalto, Manuel Gloor, Hartmut Boesch, Andreas Stohl, Hugo Denier van der Gon, Marielle Saunois, Rona Thompson, Sergey Gromov, Lena Höglund-Isakkson, and Ernest Koffi

2025 started with the launch of the H-Europe project IM4CA to enhance the quantification and understanding of methane emissions and sinks. A consortium of 25 partners joins forces to investigate pressing questions about the evolution atmospheric methane levels in recent decades, to reduce the uncertainty in future projections and design efficient solutions for monitoring and mitigating emissions in and outside of Europe. It will build new measurement and modelling infrastructure for improved monitoring of the progress toward short- and long-term emission reduction targets, with a prominent role for existing and upcoming satellite missions for measuring atmospheric composition and land surface properties.

The changing European methane emissions are an important focus of the project, which we keep track of with help of eastward extensions of the ICOS monitoring network in Poland and Romania. Intensive measurement campaigns in Rumania are conducted combining surface, aircraft, and total column measurements to improve the accuracy of emission quantification techniques using satellite data. The world-wide applicability of these techniques will extend the impact of our campaigns far beyond European borders.

Besides changing anthropogenic emissions, climate impacts on natural sources and sinks of methane are an important focus of IM4CA also. The four-year research program will initiate new measurement infrastructure in Congo to help characterize emissions from tropical wetlands in Africa. Campaigns will be conducted in Northern Scandinavia along a transect of disappearing permafrost to investigate impacts on vegetation and methane emissions using techniques that can be applied to high-resolution satellite instruments for circumpolar emission mapping.

This presentation will provide an overview of the planned activities and goals of IM4CA. The project offers a great opportunity to learn about methane in a cooperative spirit and to reach out and provide support to those who can turn knowledge about methane into climate action.    

How to cite: Houweling, S., Petrescu, R., Zaidi, M., Roeckmann, T., Paris, J.-D., Sachs, T., Aalto, T., Gloor, M., Boesch, H., Stohl, A., Denier van der Gon, H., Saunois, M., Thompson, R., Gromov, S., Höglund-Isakkson, L., and Koffi, E.: Let’s Investigate Methane for Climate Action, EGU General Assembly 2025, Vienna, Austria, 27 Apr–2 May 2025, EGU25-13556, https://doi.org/10.5194/egusphere-egu25-13556, 2025.

EGU25-14051 | ECS | Posters on site | BG1.2

Temporal variability in dissolved inorganic carbon, δ13CDIC, and anthropogenic CO2 in the North Indian Ocean from 1995 to 2016: assessing the influence of anthropogenic CO2 

Pasindi Kaluthotage, Amavi Silva, Maheshi Dheerasinghe, and Hashan Kokuhennadige

The dynamics of dissolved inorganic carbon (DIC), stable carbon isotopes of DIC (δ13CDIC), and anthropogenic CO2 (CO2ant) in the upper 500 m of the water column were examined in two upwelling-favourable regions: the Sri Lankan Dome (SLD) and the central Bay of Bengal (BOB) in the Northern Indian Ocean over the period 1995 to 2016. This study aimed to investigate the spatiotemporal variability of these carbon parameters and assess the influence of CO2ant in these oceanic environments. Data from the GLODAPv2.2022 database, including cruise-based biogeochemical bottle measurements, were utilized to examine temporal trends in DIC and δ13CDIC. The TrOCA (Tracer combining Oxygen, Carbon, and Alkalinity) approach was employed to calculate CO2ant. Although DIC concentrations showed minimal variability across the water column in both the SLD and central BOB, significant fluctuations in CO2ant and δ13CDIC were observed in the upper 50 m in both regions between 1995 and 2016. Specifically, δ13CDIC values in the upper 50 m decreased by 0.45 ‰ (at a rate of 0.021 ‰ yr-1) in the SLD and by 0.41 ‰ (at a rate of 0.02 ‰ yr-1) in the central BOB over the study period. This decline is likely attributable to the combined effects of upwelling of remineralized DIC and increased CO2ant invasion in the upper 50 m of these oceanic regions, occurring at rates of 0.93 µmol kg-1 yr-1 in the SLD and 1.97 µmol kg-1 yr-1 in the central BOB. Additionally, a weaker correlation between δ13CDIC and CO2ant was observed in the central BOB, whereas a stronger correlation in the SLDsuggests that the invasion of isotopically lighter CO2ant contributed significantly to the observed depletion of δ¹³CDIC in both regions from 1995 to 2016. These findings underscore the significant role of anthropogenic CO2 in influencing carbon dynamics in the upper ocean of these upwelling-prone regions.

How to cite: Kaluthotage, P., Silva, A., Dheerasinghe, M., and Kokuhennadige, H.: Temporal variability in dissolved inorganic carbon, δ13CDIC, and anthropogenic CO2 in the North Indian Ocean from 1995 to 2016: assessing the influence of anthropogenic CO2, EGU General Assembly 2025, Vienna, Austria, 27 Apr–2 May 2025, EGU25-14051, https://doi.org/10.5194/egusphere-egu25-14051, 2025.

EGU25-14074 | ECS | Orals | BG1.2

Net carbon exchange in the Amazon, Cerrado, and Caatinga: Challenges and Insights from the 2023/2024 Drought 

Santiago Botía and the Amazon drought 2023 team

Tropical South America plays a critical role in the global carbon cycle. On one hand, the Amazon stores large stocks of carbon (150-200 PgC), representing 50% of the tropical rainforest biomass.  On the other hand, the semiarid biomes of the neighbouring Cerrado and the Caatinga contribute largely to the inter-annual variability of the global land carbon sink. Both biomes are experiencing large threats due to deforestation, forest degradation, agricultural expansion and climate variability. While these threats in the Amazon have been largely studied, vegetation loss and associated carbon emissions from the Cerrado and Caatinga biomes have been somewhat overlooked. As a result, the mean and long-term trend in net carbon exchange in both biomes remains largely unknown. In this talk, I will give an overview of recent estimates in net carbon exchange and their uncertainty range for the Amazon and the Cerrado and Caatinga biomes. I will particularly focus on the development of the 2023/2024 drought and the carbon cycle response in the region. For this we leverage multiple data streams, from bottom-up models and top-down inversion systems, to remotely-sensed vegetation dynamics and in-situ flux and atmospheric measurements. I finalize highlighting the spatial heterogeneity of carbon fluxes across the region and emphasize on the remaining challenges to reduce the uncertainty in carbon cycle estimates and the need for enhanced atmospheric monitoring networks to improve our understanding of biome-specific drivers of net carbon exchange.

How to cite: Botía, S. and the Amazon drought 2023 team: Net carbon exchange in the Amazon, Cerrado, and Caatinga: Challenges and Insights from the 2023/2024 Drought, EGU General Assembly 2025, Vienna, Austria, 27 Apr–2 May 2025, EGU25-14074, https://doi.org/10.5194/egusphere-egu25-14074, 2025.

EGU25-14801 | Orals | BG1.2

Challenges and opportunities in atmospheric methane mitigation from freshwater and marine environments 

Lu Shen, Minghao Zhuang, Shushi Peng, Vincent Gauci, Wei Wei, Lidong Wu, and Michael MacLeod

Methane emissions from the aquatic environment exhibit distinct characteristics: while oceans, covering 70% of Earth’s surface, emit 9 Tg of methane annually, freshwater wetlands, which occupy only 2% of Earth’s surface, emit 150-200 Tg per year. This significant contrast raises important questions about the underlying mechanisms and potential strategies to mitigate methane emissions in these water systems. In this work, we explore the challenges and opportunities of methane mitigation in both freshwater and marine environments. 

For freshwater wetlands, existing projections of future methane emissions usually neglect feedbacks associated with global biogeochemical cycles. Here, we employ data-driven approaches to estimate both current and future wetland emissions, considering the effects of changing meteorology and biogeochemical feedbacks arising from atmospheric sulfate deposition and CO2 fertilization. We show that, under low-CO2 scenarios (1.5 and 2°C warming pathways), the suppressive effect of sulfate deposition on wetland methane emissions largely diminishes by 2100 due to clean air policies, resulting in an additional emission increase of 7 ± 2 Tg a-1. This increase account for 35% and 22% of total wetland emission changes under 1.5 and 2°C warming pathways, a factor not yet considered by current Integrated Assessment Models.

For marine waters, we assess the methane emissions from mariculture’s aquatic environment at 10-km resolution globally, using measurements from research cruises and satellite-observed net primary productivity. Mariculture’s aquatic emission intensity is estimated to be 1–6 gCH4 per kg of carcass weight (CW), >95% lower than freshwater systems, due to suppressed microbial production in marine waters and inefficient ventilation to the atmosphere. The life-cycle assessment shows that mariculture’s carbon footprints are ~40% lower than those of freshwater aquaculture, suggesting considerable climate benefits of mariculture expansion to meet future protein needs.

How to cite: Shen, L., Zhuang, M., Peng, S., Gauci, V., Wei, W., Wu, L., and MacLeod, M.: Challenges and opportunities in atmospheric methane mitigation from freshwater and marine environments, EGU General Assembly 2025, Vienna, Austria, 27 Apr–2 May 2025, EGU25-14801, https://doi.org/10.5194/egusphere-egu25-14801, 2025.

EGU25-14803 | ECS | Posters on site | BG1.2

Regional method to quantify coastal anthropogenic carbon changes 

Xinyu Li and Brendan Carter

The global ocean plays a critical role in mitigating climate change by sequestering atmospheric CO2, removing approximately 26% of anthropogenic carbon emissions since the Industrial Revolution. While significant progress has been made in estimating open-ocean anthropogenic carbon (Canthro), the coastal ocean remains less understood due to its dynamic nature and complex processes and shortage of long-term high-quality datasets. Hence it is challenging to quantify the coastal anthropogenic carbon from the observation data. In this study, we propose a regional empirical regression-based anthropogenic carbon estimation approach (RECA) tailored for coastal regions. Using synthetic data from six different global ocean biogeochemical models, we evaluate the uncertainties in Canthro estimation and assess the contributions of non-steady-state natural and anthropogenic components to estimation biases in the four North American coast oceans. We also compare RECA with established regression-based methods (CAREER and eMLR(C*)) that are widely used in open-ocean regions to determine their applicability in coastal settings. Our results demonstrate that RECA effectively captures overall Canthro with minimal large-scale biases. However, subregional analyses reveal challenges in separating anthropogenic and natural CO2 signals, emphasizing the influence of natural variability. This study provides a unified framework for high-resolution Canthro estimation in coastal waters, evaluates its uncertainties, and paves the way for improved coastal carbon monitoring and climate action.

How to cite: Li, X. and Carter, B.: Regional method to quantify coastal anthropogenic carbon changes, EGU General Assembly 2025, Vienna, Austria, 27 Apr–2 May 2025, EGU25-14803, https://doi.org/10.5194/egusphere-egu25-14803, 2025.

EGU25-15075 | ECS | Posters on site | BG1.2

Assessing Bottom-Up and Top-Down Methane Emission Estimates in Northern High Latitude Regions (2018–2021)  

Rebecca Ward, Maria Tenkanen, Aki Tsuruta, Sara Hyvärinen, Anteneh Mengistu, Hannakaisa Lindqvist, Johanna Tamminen, Tiina Markkanen, Maarit Raivonen, Antti Leppänen, and Tuula Aalto

The northern high latitudes (NHLs) are undergoing rapid environmental changes with global warming, which may trigger feedback mechanisms that amplify natural methane emissions from wetlands and increase contributions from wildfires. Studying year-to-year variations in these emissions can provide understanding of the key factors driving natural methane fluxes. In addition, the NHLs produce substantial methane emissions from fossil fuel production. However, the spatial heterogeneity and overlap of methane sources in the region complicates the attribution of emissions to specific sources. 

This study presents an intercomparison of methane emissions estimates across four NHL regions—Russia, Canada, Alaska, and Norway-Sweden-Finland—between 2018 and 2021, focusing on the magnitude and seasonality of emissions. Emissions are compared using a combination of bottom-up and top-down estimates. Bottom-up estimates for key sectors, including anthropogenic activities, biomass burning, and wetlands, are produced by inventories and process models. Top-down estimates are derived from an ensemble of atmospheric inversions that separately optimise anthropogenic and biospheric emissions. The inversions, derived from the CarbonTracker Europe-CH4 model, incorporate a range of prior estimates, uncertainties, and atmospheric methane measurements from in-situ surface stations and satellite observations from TROPOMI and GOSAT.  

Preliminary findings indicate that for all four regions, posterior natural emissions are strongly influenced by the choice of prior emissions in shaping both their seasonality and magnitude. The CarbonTracker Europe-CH4 ensemble produces posterior emissions estimates consistent with the Global Carbon Project ensemble, which utilised different inversion models.  

By integrating a wide range of emissions estimates, this study aims to improve our understanding of the NHL methane budget. The findings contribute to ongoing methane emission assessments under the Eye-CLIMA, IM4CA (Investigating Methane for Climate Action), ESA SMART-CH4 (Satellite Monitoring of Atmospheric Methane) projects and ESA-AMPAC (Arctic Methane and Permafrost Challenge). 

How to cite: Ward, R., Tenkanen, M., Tsuruta, A., Hyvärinen, S., Mengistu, A., Lindqvist, H., Tamminen, J., Markkanen, T., Raivonen, M., Leppänen, A., and Aalto, T.: Assessing Bottom-Up and Top-Down Methane Emission Estimates in Northern High Latitude Regions (2018–2021) , EGU General Assembly 2025, Vienna, Austria, 27 Apr–2 May 2025, EGU25-15075, https://doi.org/10.5194/egusphere-egu25-15075, 2025.

EGU25-15314 | ECS | Orals | BG1.2

The contribution of storm-induced outgassing to the CO2 air-sea flux in the Southern Ocean in a high-resolution, atmosphere-ocean simulation with ICON 

Arjun Kumar, David Nielsen, Nuno Serra, Fatemeh Chegini, Johann Jungclaus, and Tatiana Ilyina

The global ocean uptake of anthropogenic CO2 is sensitive to the uptake in the Southern Ocean, which accounts for 40-50% of the total uptake. At the same time, the Southern Ocean is the windiest region on the planet and experiences storms all year round. These storms, in turn, play an important role for the CO2 uptake in the Southern Ocean, because they can trigger outgassing of CO2 to the atmosphere. Storms induce outgassing by stirring the mixed layer via wind forcing, which leads to entrainment of waters rich in dissolved inorganic carbon into the mixed layer and elevates ocean pCO2 at the air-sea interface. However, since storms occur on synoptic time scales, such outgassing events are highly localised and short lived. Recent work based on in-situ measurements suggests that the magnitude of storm-induced outgassing and its contribution to the total Southern Ocean CO2 air-sea flux may have been severely underestimated by previous modelling studies, which do not sufficiently resolve storms and outgassing events. In this study, we take advantage of a cutting-edge simulation conducted with a fully-coupled, global, atmosphere-ocean model (ICON) with ocean biogeochemistry. Running on the assumption that the smaller grid spacing of 5 km better resolves storms and variability in wind forcing, we analyse the simulated contribution of storm-induced outgassing to the Southern Ocean uptake of CO2. 

How to cite: Kumar, A., Nielsen, D., Serra, N., Chegini, F., Jungclaus, J., and Ilyina, T.: The contribution of storm-induced outgassing to the CO2 air-sea flux in the Southern Ocean in a high-resolution, atmosphere-ocean simulation with ICON, EGU General Assembly 2025, Vienna, Austria, 27 Apr–2 May 2025, EGU25-15314, https://doi.org/10.5194/egusphere-egu25-15314, 2025.

EGU25-15370 | Orals | BG1.2

SOCOMv2: On the strengths and limits of pCO2 interpolations products to estimate the ocean carbon sink 

Alizée Roobaert, Daniel J. Ford, Christian Rödenbeck, Nicolas Gruber, Judith Hauck, Amanda R. Fay, Thea Hatlen Heimdal, Jacqueline Behncke, Abby Shaum, Gregor Luke, Andrew Watson, Laique M. Djeutchouang, Sreeush Mohanan, Marion Gehlen, Annika Jersild, Jiye Zeng, Yosuke Iida, Frederic Chevallier, Galen A. McKinley, and Jamie D. Shutler and the SOCOMv2 team

The ocean is an important sink for anthropogenic carbon dioxide (CO2), but recent data from the Global Carbon Budget (GCB) highlight discrepancies in ocean carbon uptake estimates. Since the early 2000s, reconstructions of in-water CO2 fugacity (fCO2) using advanced interpolation techniques (data-products) have shown a growing divergence from estimates derived from global hindcast model simulations. This offsets in the mean flux amounts to approximately 0.49 GtC per year in the decade 2014-2023. The reasons for this discrepancy are not fully understood but may stem from a combination of factors including insufficient data coverage, uncertainties in scaling measurement-based estimates, and errors in model simulations. Previous studies suggests that biases in the fCO2 data-products from the under-sampled Southern Hemisphere, may contribute significantly to this gap.

To address these concerns, the Surface Ocean CO2 Mapping project has launched its second phase (SOCOMv2). This initiative aims to identify and quantify the accuracy and uncertainties related to data availability, changing observational networks, and input data. SOCOMv2 includes four key experiments: 1) a comprehensive geospatial uncertainty analysis, and three subsampling studies employing: 2) GCB hindcast simulations to capture true climate variability, 3) large ensemble simulations representing multiple climate states, and 4) idealized carbon uptake scenarios without climate variation. These efforts aim to provide a clearer understanding of the underlying factors contributing to the observed discrepancies in ocean carbon uptake estimates.

Results from the GCB subsampling hindcast simulation experiments reveal that individual fCO2 data-product reconstructions can significantly overestimate or underestimate both the annual mean and the trend of the ocean carbon sink relative to the models ‘truth’. Nonetheless, the ensemble mean of the fCO2 data-products tends to exhibit only a small overestimation of the model ‘truth’ ocean carbon sink. These discrepancies highlight the impact of limited data coverage and the inherent challenges of extrapolating from sparse measurements but cannot fully explain the observed divergence between models and fCO2 reconstructions in the GCB.

SOCOMv2 aims to improve the accuracy and precision of ocean carbon flux estimates, contributing to improved observational approaches and guiding policy development for climate mitigation. SOCOMv2 efforts have been driven by the community, with supporting funding within a larger European Space Agency ocean carbon study (Ocean Carbon for Climate).

How to cite: Roobaert, A., Ford, D. J., Rödenbeck, C., Gruber, N., Hauck, J., Fay, A. R., Heimdal, T. H., Behncke, J., Shaum, A., Luke, G., Watson, A., Djeutchouang, L. M., Mohanan, S., Gehlen, M., Jersild, A., Zeng, J., Iida, Y., Chevallier, F., McKinley, G. A., and Shutler, J. D. and the SOCOMv2 team: SOCOMv2: On the strengths and limits of pCO2 interpolations products to estimate the ocean carbon sink, EGU General Assembly 2025, Vienna, Austria, 27 Apr–2 May 2025, EGU25-15370, https://doi.org/10.5194/egusphere-egu25-15370, 2025.

EGU25-15454 | Posters on site | BG1.2

Inverse modelling of global CH4 emissions using surface based measurements and GOSAT satellites retrievals. 

Francesco Graziosi, Giovanni Manca, Delia Segato, Srdan Dobricic, and Nicola Arriga

Atmospheric methane (CH₄) is a significant greenhouse gas with a warming potential 84 times greater than that of CO₂ over a 20-year time horizon. Given its relatively short atmospheric lifetime of approximately 10 years and its high warming potential, reducing anthropogenic methane emissions is crucial for limiting near-term increases in global temperatures. Methane is emitted from both natural and anthropogenic sources and is primarily consumed through reactions with hydroxyl (OH) radicals in the atmosphere. To a lesser extent, it is also removed through soil interactions. The limited understanding of the interplay between sources and sinks leads to an unclear explanation of the interannual variability in atmospheric methane concentrations over the past decades. Moreover, there are growing concerns about the possibility that climate change could amplify natural CH₄ fluxes. Here we present an inverse model-based reanalysis of global CH₄ emissions (2018-2021). To achieve this, we employ the TM5-4DVAR inverse model system, which is driven by ECMWF-ERA5 meteorological data at a resolution of 1° x 1° for both latitude and longitude, and encompasses 137 vertical levels. This four-dimensional inverse system generates monthly global fields of CH₄ fluxes across four source categories: wetlands, rice fields, biomass burning, and anthropogenic activities. The methane fluxes are optimized using high-resolution surface-based measurements from the NOAA Earth System Research Laboratory (ESRL) global cooperative air sampling network, as well as column-averaged dry mixing ratio XCH₄ data from the GOSAT satellite. The primary aim of this work is to identify the major geographical areas and source categories driving the interannual variability and trends of global CH₄ fluxes during the study period. Moreover, the temporal variability of natural methane fluxes is analysed in relation to physical parameters to investigate how natural CH4 emissions respond to climate factors (e.g. temperature).

How to cite: Graziosi, F., Manca, G., Segato, D., Dobricic, S., and Arriga, N.: Inverse modelling of global CH4 emissions using surface based measurements and GOSAT satellites retrievals., EGU General Assembly 2025, Vienna, Austria, 27 Apr–2 May 2025, EGU25-15454, https://doi.org/10.5194/egusphere-egu25-15454, 2025.

EGU25-15780 | ECS | Orals | BG1.2

Mitigation and implications of methane emissions from dairy cow barns 

Jonathan Buzan, Jens Terhaar, Fortunat Joos, Niels Iversen, and Peter Roslev

Reaching the Paris Agreement temperature goals of no higher than +1.5°C or +2.0°C of global mean temperature change is quickly becoming difficult to reach by the end of the century. Not making the Paris Agreement temperature targets will impact all aspects of human society.


Around 1/3rd of global mean surface temperature changes, is estimated to be caused by methane making it the second most powerful greenhouse gas released anthropogenically.  Anthropogenic sources emit 349 Tg of methane per year and are responsible for more than 50% of global methane emissions. The main emitters are the energy sector (>36% of emissions) and agriculture (40%). Fortunately, methane is a short-lived greenhouse gas, and removal of anthropogenic emissions sources may dramatically change the global concentrations on decadal timescales.


In response to the unlikelihood that methane emissions will be attenuated sufficiently in the coming decade by production reductions, methane emission mitigation technologies are under development. However, these technologies are yet to be rolled out on an industrial scale. New methane mitigation technologies can reduce a 50 ppm emissions source at ~60% efficiency and require an air volume rate of 4.36e13 m3/yr to remove 1 Tg CH4 per year. The volume of air required to process low concentrations to make a substantive impact on total emissions is major roadblock to their implementation. For example, for CO2 capture—a related carbon mitigation method—many test technologies are constructing large independent ventilation facilities. However, novel methane emission mitigation technologies are currently being tested and evaluated in several countries. These new technologies may capture CH4 and/or convert CH4 to molecules with less radiative forcing potential.


Here, we propose using dairy cow barns as a viable pathway for methane emission mitigation by utilizing existing infrastructure while targeting a major source of agricultural methane. Currently, there are ~264 M dairy cows worldwide. In Europe, there are 23 M dairy cows, and ~33% are housed in barns annually. For example, 70% of Denmark’s and 90% of Italy’s dairy cows are housed annually. For the health and welfare of the animals, barns are ventilated to maintain comfortable temperature and humidities, as well as ventilate abhorrent gases, such as methane. Standards for ventilation require 400 m3/hr/cow (high heat situations require 2500 m3/hr/cow), which is 3.5e6 m3/cow annually. A dairy cow emits between 55-100 kg CH4 per year. Which translates to 0.4-0.9 Tg CH4 per year for the ~7.59 M housed dairy cows in the European Union. The amount of air estimated to move through the EU dairy barns is 2.66e13 m3/yr and is within the estimated amount of air required to remove 1 Tg of CH4 from emerging technologies (4.36e13 m3/yr).  Implementation of this type of methane mitigation is feasible and with additional air recycling, potentially capture methane emissions from dairy cow barns.

How to cite: Buzan, J., Terhaar, J., Joos, F., Iversen, N., and Roslev, P.: Mitigation and implications of methane emissions from dairy cow barns, EGU General Assembly 2025, Vienna, Austria, 27 Apr–2 May 2025, EGU25-15780, https://doi.org/10.5194/egusphere-egu25-15780, 2025.

Accurate simulation of regional carbon dioxide (CO2) concentrations is essential for understanding carbon flux dynamics, refining emission inventories, and supporting climate mitigation policies. Using the WRF-Chem-VPRM model at 3 km resolution, this study simulated CO2 concentrations in Jiangsu Province, China, with hourly outputs. Model verification against nine ground-based CO2 monitoring stations confirmed its reliability.
Before integrating emission inventories into the model, we conducted a comprehensive analysis of six widely used emission inventories (ODIAC, EDGAR, MEIC, CHRED, GID, GRACED), revealing significant discrepancies in total emissions and spatial patterns in China. Provincial-scale annual carbon emissions discrepancies reached 52%, whereas urban-scale discrepancies averaged 137%, attributed to differences in emission proxies and spatial resolution. 
Sensitivity experiments for July and December 2022, representing summer and winter, assessed the impacts of spatial, temporal, and vertical allocation processes. Vertical allocation coefficients emerged as a critical factor, particularly under stable nighttime boundary layer conditions, where deviations exceeded 50 ppm. Their influence equaled or even surpassed that of emission inventory selection, underscoring the necessity of precise vertical parameterization.
Spatial allocation discrepancies primarily affected urban concentrations, where dense and diverse sources contributed to higher variability. Winter simulations exhibited increased uncertainties due to heightened heating emissions and limited vertical mixing.
These findings highlight the importance of refining vertical and spatial allocation in emission inventories to improve regional CO2 modeling. The study provides insights for advancing carbon inversion methodologies and supporting robust Monitoring, Reporting, and Verification (MRV) systems in urbanizing regions.
Emission inventories analyzed include:
•    ODIAC: Open-source Data Inventory for Anthropogenic CO2,
•    EDGAR: The Emissions Database for Global Atmospheric Research,
•    MEIC: The Multi-resolution Emission Inventory for China,
•    CHRED: China High-resolution Emission Database,
•    GID: Global Infrastructure emissions Detector,
•    GRACED: Global Gridded Daily CO2 Emissions Dataset.

How to cite: Feng, W., Tang, X., Zhu, J., and Zhou, X.: High-Resolution simulation of  CO2 Concentrations Over Jiangsu Province in China Based on WRF-Chem-VPRM and Six Emission Inventories, EGU General Assembly 2025, Vienna, Austria, 27 Apr–2 May 2025, EGU25-16464, https://doi.org/10.5194/egusphere-egu25-16464, 2025.

EGU25-16559 | ECS | Orals | BG1.2

Using atmospheric O2 to disentangle the natural and anthropogenic CO2 signals  

Kim Faassen, Joram Hooghiem, Auke van der Woude, Anne-Wil van den Berg, Boaz Hilman, Lucas Hulsman, Aleya Kaushik, Remco de Kok, Marnix van de Sande, Wouter Peters, and Ingrid Luijkx

Atmospheric oxygen (O2) allows to separate the natural and anthropogenic components in the atmospheric CO2 signal, thereby providing additional constraints on these processes in the global carbon cycle. This is enabled through the ratio of O2 and CO2 in carbon cycle processes: the Exchange Ratio (ER). This ER signal has distinct values for combustion of different fossil fuel types, as well as between photosynthesis and respiration processes. Using these ER signals, we aim to further explore the potential of using atmospheric O2 observations in CO2 emission verification. For that, we are developing a global scale data assimilation system that can, next to CO2, assimilate O2 observations. This is our new multi-tracer implementation, specifically aimed at decadal and annual timescales: the CarbonTracker Europe Long Window system. Additionally, we implemented O2 and the O2/CO2 exchange ratios into the Simple Biosphere model (SiB4) to further understand the influence of biosphere exchange on using Atmospheric Potential Oxygen (APO) as a tracer for fossil fuel emissions. We will present the results from this biosphere O2 and CO2 modelling to get a first theoretical assessment of the variability of the biosphere O2 and CO2 ER signals, both over space (related to the plant functional types) and time (related to seasonal patterns). These biosphere model results, are subsequently used in our first attempt of atmospheric inverse estimates of CO2 fluxes using O2 as a tracer. Finally, we will show our progress towards understanding the implications of the variability in the ERs for photosynthesis and respiration on APO calculations, as well as their influence on fossil fuel estimates using atmospheric O2.

How to cite: Faassen, K., Hooghiem, J., van der Woude, A., van den Berg, A.-W., Hilman, B., Hulsman, L., Kaushik, A., de Kok, R., van de Sande, M., Peters, W., and Luijkx, I.: Using atmospheric O2 to disentangle the natural and anthropogenic CO2 signals , EGU General Assembly 2025, Vienna, Austria, 27 Apr–2 May 2025, EGU25-16559, https://doi.org/10.5194/egusphere-egu25-16559, 2025.

EGU25-17087 | ECS | Posters on site | BG1.2

Assessment of Forest Carbon Management Using Net Primary Productivity on the Korean Peninsula 

Whijin Kim, Cholho Song, and Woo-Kyun Lee

The functions of terrestrial ecosystems are various, and recent study suggests the major three functions which are carbon, water, and energy cycling. They are all originated from land, the fundamental components of terrestrial ecosystems. Land consists of major five land cover: cropland, grassland, built-up area, wetland, and forest land. Forest land is described as high potential to remove Greenhouse gases under climate change era and thus the forest carbon management has been raised for effective land management in terms of carbon removal. Korean peninsula, South Korea and North Korea, has undergone the severe war between them and it damaged the whole territory, which consists of more than 60% of forest land. Therefore, two countries tried to revegetate and implemented forestation plans for recover the forest land over 50 years. Therefore, this study assessed the forest carbon management on the Korean Peninsula using Net Primary Productivity(NPP) from the 1980s to 2010s. To estimate NPP, Carnegie-Ames-Stanford Approach(CASA) model was applied. The study adopted the carbon demand and supply method for assessment. We defined carbon demand as amount of carbon loss from forest land in previous year due to forest land changes, and carbon supply as amount of newly updated carbon sink from forest land due to afforestation. According to research findings, even though South Korea achieved successful forest expansion, it only focused on the amount of forest area rather the quality of carbon management. However, the situation in North Korea described not only the failure of increasing forest area but also forest carbon management. Further research would be analyzed the outcomes with forest plans in South Korea and North Korea.

How to cite: Kim, W., Song, C., and Lee, W.-K.: Assessment of Forest Carbon Management Using Net Primary Productivity on the Korean Peninsula, EGU General Assembly 2025, Vienna, Austria, 27 Apr–2 May 2025, EGU25-17087, https://doi.org/10.5194/egusphere-egu25-17087, 2025.

EGU25-18709 | ECS | Posters on site | BG1.2

Emissions of climate-altering species from open vegetation fires in the Mediterranean region - A review on methods and data 

Rabia Ali Hundal, Saurabh Annadate, Rita Cesari, Alessio Collalti, Michela Maione, and Paolo Cristofanelli

The climate change over the Mediterranean region poses serious concerns about the role of open vegetation fires in the emissions of climate-altering species. The aim of this work is to review the current methodologies for quantifying the emissions of greenhouse gases and black carbon from open vegetation fires, as well as the data provided by four state-of-the-art inventories of emissions of carbon dioxide (CO2), methane (CH4), nitrous oxide (N2O) and black carbon (BC) in the Mediterranean region for the period 2003–2020.

A limited number of studies specifically addressed the quantification of emissions from open fires in the Mediterranean region. Our data review of fire emissions in the Mediterranean region, where “top-down” methods have not yet implemented, reveals discrepancies across the four inventories examined (GFED v4.1s, GFAS v1.2, FINN v2.5, and EDGAR v8.0). Among these, FINN v2.5 consistently reported the highest emissions, while GFED v4.1s reported the lowest. We observed that the relative ranking of total emissions between the inventories varied for the species considered (e.g. CO2 vs. CH4) and that different proportions of emissions were attributed to the individual countries included in the Mediterranean domain. We argued that these differences were related to the different spatial resolutions of the input data used to detect the occurrence of fires, the different approaches to calculating the amount of fuel available, and the emission factors used.

The three inventories reporting wildfire emissions were consistent in identifying the occurrence of peaks in the emissions for the years 2007, 2012 and 2017. We hypothesized that La Niña events could partially contribute to triggering the occurrence of these emission peaks.To increase the accuracy and consistency of climate-altering emission data related to open vegetation fires in the Mediterranean region, we recommend to integrate bottom-up approaches with top-down inversion methods based on satellite and in-situ atmospheric observations.

How to cite: Hundal, R. A., Annadate, S., Cesari, R., Collalti, A., Maione, M., and Cristofanelli, P.: Emissions of climate-altering species from open vegetation fires in the Mediterranean region - A review on methods and data, EGU General Assembly 2025, Vienna, Austria, 27 Apr–2 May 2025, EGU25-18709, https://doi.org/10.5194/egusphere-egu25-18709, 2025.

EGU25-18920 | ECS | Posters on site | BG1.2

Net community production in the Greenland Sea: a comparative case study using Argo data of nitrate, oxygen, and DIC 

Ingrid Sælemyr, Are Olsen, Meike Becker, Siv K. Lauvset, Kjell Arne Mork, Ailin Brakstad, and Filippa Fransner

In this case study, we derive and compare estimates of annual net community production (NCP) in the Greenland Sea from Argo float data of nitrate, oxygen, and dissolved inorganic carbon (DIC). We added tracers of the inorganic carbon system, nitrate, dissolved oxygen, and air-sea gas exchange to the 1-D Price-Weller-Pinkel mixing model (Price et al., 1986) tuned to the Greenland Sea (Moore et al., 2015; Brakstad et al., 2019). By reinitializing the model with every Argo profile, we were able to estimate NCP as the difference between the abiotic model output and the Argo profiles. This method has previously been employed in various other regions (Plant et al. 2016;  Briggs et al. 2017, Mork et al. 2024). While we here compare NCP estimates from both nitrate, oxygen, and DIC, previous work has considered maximum two of these concurrently. Through our comparison, we discovered quantitative discrepancies in the NCP and annual NCP (ANCP) estimates. These results were sensitive to trends in the raw data and artefacts deriving from processes that were unresolved in the model, such as internal waves. Effects from internal waves were challenging to remove without introducing new artefacts. Qualitatively, the NCP seasonal cycle was well resolved: the summer of 2019, NCP fluctuated between periods of weak net biological production and periods of weak net heterotrophy. NCP was close to zero through winter, before two strong blooms were observed in late April and May 2020. However, the amplitude of the NCP signal from DIC was somewhat larger than from nitrate and oxygen. DIC derived NCP also exhibited stronger signs of remineralization from November 2019 to January 2020 compared to the two other estimates. Thus, this work shows the importance of careful consideration when utilizing biogeochemical Argo data in the Greenland Sea.

How to cite: Sælemyr, I., Olsen, A., Becker, M., Lauvset, S. K., Mork, K. A., Brakstad, A., and Fransner, F.: Net community production in the Greenland Sea: a comparative case study using Argo data of nitrate, oxygen, and DIC, EGU General Assembly 2025, Vienna, Austria, 27 Apr–2 May 2025, EGU25-18920, https://doi.org/10.5194/egusphere-egu25-18920, 2025.

EGU25-19322 | ECS | Orals | BG1.2

Assessing the recent ocean carbon sink with data assimilation into a global ocean biogeochemistry model 

Frauke Bunsen, Lars Nerger, and Judith Hauck

Global ocean biogeochemistry models are a key tool for estimating the global ocean carbon uptake. These models are designed to represent the most important processes of the ocean carbon cycle, but the idealized process representation, uncertainties in the initialization of model variables and in the atmospheric forcing lead to errors in their estimates. To improve the agreement with observations, we use ensemble-based data assimilation into the ocean biogeochemistry model FESOM2.1-REcoM3. In addition to the recently implemented assimilation of temperature and salinity observations, which improves the physical model state and indirectly influences biogeochemical variables, we extend the set-up further. Here, we explicitly include the assimilation of biogeochemical observations. Specifically, in-situ sea surface pCO2 measurements, remotely sensed chlorophyll-a, and in-situ measurements of dissolved inorganic carbon, alkalinity, oxygen, and nitrate, are assimilated to reduce the uncertainty stemming from the ecosystem model. This directly affects the modelled air-sea CO2 flux. Here, we present an updated estimate of the ocean carbon uptake for the period 2010–2020 and compare it to prior estimates.

How to cite: Bunsen, F., Nerger, L., and Hauck, J.: Assessing the recent ocean carbon sink with data assimilation into a global ocean biogeochemistry model, EGU General Assembly 2025, Vienna, Austria, 27 Apr–2 May 2025, EGU25-19322, https://doi.org/10.5194/egusphere-egu25-19322, 2025.

EGU25-21437 | Orals | BG1.2

The ocean carbon sink under record-high sea surfacetemperatures in 2023/24 

Jens Daniel Müller, Nicolas Gruber, Aline Schneuwly, Dorothee C.E. Bakker, Marion Gehlen, Luke Gregor, Judith Hauck, Peter Landschützer, and Galen A. McKinley

In 2023, sea-surface temperatures (SST) reached record highs. Historically, the years with highest global mean SST anomalies were associated with a slight increase in oceanic CO₂ uptake, primarily due to reduced CO2 outgassing from the tropics during El Niño. In contrast, our observation-based estimates reveal that the global non-polar ocean absorbed about 10% less carbon in 2023 than expected (+0.16±0.28 PgC yr-1).


This weakening of the ocean carbon sink occurred although the CO2 outgassing in the tropics was indeed as low as expected. Instead, the decline in CO2 uptake was concentrated entirely in the extratropics, driven largely by elevated SSTs in the Northern Hemisphere. While thermally induced reductions in CO2 uptake are well-documented in the extratropics, our analysis using two ocean biogeochemical models highlights a mitigating process in the subtropical North Atlantic: the depletion of dissolved inorganic carbon in the surface mixed layer. Such negative feedbacks caused an overall muted response of the ocean carbon sink to the record high SSTs, but this resilience may not persist under long-term warming or more severe SST extremes.


By the time of this presentation, we anticipate confirming – or refining – our expectation that the ocean carbon sink in 2024 remained unusually weak, because the CO2 outgassing from the tropics revived, whereas remaining high SSTs in the extratropics continued to suppress the CO2 uptake.

How to cite: Müller, J. D., Gruber, N., Schneuwly, A., Bakker, D. C. E., Gehlen, M., Gregor, L., Hauck, J., Landschützer, P., and McKinley, G. A.: The ocean carbon sink under record-high sea surfacetemperatures in 2023/24, EGU General Assembly 2025, Vienna, Austria, 27 Apr–2 May 2025, EGU25-21437, https://doi.org/10.5194/egusphere-egu25-21437, 2025.

EGU25-466 | ECS | Posters on site | BG1.3

Effects of N fertilization on soil chemistry dynamics in Ferralsols of the High Potential Maize Zone, Kenya  

Kevin Churchil Oluoch, Abigael Otinga, Ruth Njoroge, Scholar Mutua, Turry Ouma, Phillip Agredazywczuk, Matti Barthel, Johan Six, Sonja Leitner, Collins Oduor, and Eliza Harris

Nitrogen-based inorganic fertilizers have been crucial in crop production globally. For a long time, SSA agriculture has been characterised by low fertilizer use and negative nutrient balances. However, recently fertilizer use has increased drastically. Unfortunately, increased use of synthetic N fertilizers alters soil properties directly and indirectly, and N losses to the ecosystem contribute to environmental degradation and climate change. Limited studies have focused on the effect of increased N application rates on agricultural soils in the tropical highlands. It is crucial to investigate and understand N flows in tropical soils to predict potential ecological impacts of increased synthetic N-fertilizer use while meeting the food demand in SSA.

This study aimed to investigate the effects of increasing N rates on soil N dynamics, chemical properties and N use efficiency in maize-monocrop systems in the tropical highlands of the Rift Valley region, Kenya. A field experiment consisting of six N-fertilizer rates (0, 25, 50, 75, 100 and 125 kg N ha-1) in triplicate was set up in Eldoret, Kenya. Soil samples were collected at depths of 0-20, 20-40 and 40-60 cm throughout the maize cropping season and analysed for mineral N (NH4+-N and NO3--N), soil organic carbon and pH. Results indicate a significant change in the soil chemistry due to fertilisation. The response magnitude varied across the three soil depths. For instance, NO3- -N increased with increased N application rate, which peaked at 14 (55.81 mg kg-1) and 42 (34.99 mg kg-1) days after treatment application in the top 20 cm and 20-40 cm depths, respectively. Similar trends were also observed in the NH4+-N concentration across different depths, with high N application rates tending to exhibit relatively high concentrations compared to treatments with lower N rates. We also observed a considerable decline in soil pH for plots treated with N fertilizer in the first 14 days, which then stabilized and rose gradually throughout the maize growing stages. However, the lower fertilizer plots tended to have higher pH in contrast to the other treatments. There was also a consistent increase in soil organic carbon (SOC), with slight fluctuations, throughout the cropping season.  

These results indicated low mineral N movement below the effective root zone depth during the active growth phase of the crop. Thus, a clear indicator of increased plant uptake and implies a reduced risk of loss through leaching in Ferralsols. We also expect that meteorological conditions coupled with crop phenological processes to play a significant role in the soil chemistry variability, as exhibited by the differences in response to the treatments. We will therefore consider crop phenological processes and how they influence soil nutrient cycles. The results of this study will help to inform sustainable N use in maize cropping systems and further improve understanding of N cycle in tropical soils.  

How to cite: Oluoch, K. C., Otinga, A., Njoroge, R., Mutua, S., Ouma, T., Agredazywczuk, P., Barthel, M., Six, J., Leitner, S., Oduor, C., and Harris, E.: Effects of N fertilization on soil chemistry dynamics in Ferralsols of the High Potential Maize Zone, Kenya , EGU General Assembly 2025, Vienna, Austria, 27 Apr–2 May 2025, EGU25-466, https://doi.org/10.5194/egusphere-egu25-466, 2025.

EGU25-880 | ECS | Orals | BG1.3

Insights into the sources of precursor and formation pathways of particulate NO3- during paddy-residue burning period through dual isotope proxies 

Chandrima Shaw, Ritwick Mandal, Atinderpal Singh, Prasanta Sanyal, and Neeraj Rastogi

Particulate nitrate (pNO3-) and its precursor gas nitrogen oxide (NOx) are among the most significant reactive nitrogen species in the atmosphere. NOx emissions over the Indian sub-continent especially the Indo-Gangetic Plain (IGP) have increased rapidly over the past decades. NOx, an atmospheric gaseous pollutant, plays important roles in the formation of tropospheric ozone, recycling of hydroxyl radicals (OH), etc. It also serves as a precursor to pNO3- formation. This has significant implications for air quality, climate, and human health. Rapid accumulation of pNO3- can also increase PM load by aiding in secondary aerosol formations. Identification of the major sources of NOx and the formation pathways of pNO3- is crucial for improving the accuracy of air quality models and effective mitigation strategies. In the atmosphere, pNO3- is known to form mainly via four distinct pathways: (P1) oxidation of NO2 by OH in gas phase, (P2) hydrolysis of N2O5 on existing aerosols, (P3) reaction between NO3 radicals and VOCs, and (P4) reaction of NO3 radical and ClO. However, studies on the sources and formation pathways of pNO3- are limited pertaining to the Indian subcontinent as well as the globe. Dual isotopes (δ15N and δ18O) of pNO3- are an excellent tool to understand the formation mechanisms and sources of pNO3- precursor (NOx) in the atmosphere. In this study, diurnal samples of PM2.5 were collected over a semi-urban site (Patiala) in the IGP during a large-scale paddy residue burning period (October-November). Dual isotopes (δ15N and δ18O) of pNO3- along with other major ions were measured. Average δ18O and δ15N of pNO3- were 57.2 ± 8 ‰and -1.9 ± 5 ‰, respectively. Significant diurnal differences in δ18O-NO3- and δ15N-NO3- were observed. δ15N-NO3- and δ18O-NO3- were -5.0 ± 2.4‰, 52.1 ± 6.2‰ and -0.13 ± 5.7‰, 60.0 ± 8.4‰ during day and night-time respectively. Enriched δ15N-NO3- during night-time was due to enhanced gas-particle partitioning owing to lower temperature. A significant negative correlation between Nitrate Oxidation Ratio (NOR), and temperature further supported the above statement. Stable isotope mixing model (MixSIAR) was used to estimate the contribution of different pathways to pNO3- formation and sources. The major pathways contributing to the formation of pNO3-  were  P1(OH)  (~ 92%) followed by P2 (N2O5) (~ 5%). P3 (VOCs) and P4 (ClO) had negligible contributions of ~1.3 and ~1.5% respectively. Relative contributions of P1 and P2 during day and night-time were calculated. P1 and P2 contributed to 95% and 5%, and 77% and 23% during day and night-time respectively. Presence of pNO3- formed via P1 during night-time could be due to the higher lifetime of pNO3- compared to sampling duration. Source apportionment showed biomass burning (32%) and traffic exhaust (35%) were the major contributors followed by combustion (18%) and soil emissions (15%) during the study period. Our study, first of its kind over India, is important for elucidating the formation mechanism of pNO3- from its precursor gas. Such studies are helpful in planning and developing mitigation strategies aiming to reduce NOx pollution over a specific region. 

How to cite: Shaw, C., Mandal, R., Singh, A., Sanyal, P., and Rastogi, N.: Insights into the sources of precursor and formation pathways of particulate NO3- during paddy-residue burning period through dual isotope proxies, EGU General Assembly 2025, Vienna, Austria, 27 Apr–2 May 2025, EGU25-880, https://doi.org/10.5194/egusphere-egu25-880, 2025.

EGU25-1042 | ECS | Orals | BG1.3

Investigating the sensitivity of modelled nitrogen inputs in the Mediterranean to dry deposition parameters 

André Barreirinha, Sabine Banzhaf, Michael Russo, Markus Thürkow, Martijn Schaap, and Alexandra Monteiro

There are several nitrogen-sensitive areas in Europe, some more sensitive than others, and the Mediterranean climate zone is where many of the highly sensitive areas are. One of these areas is Portugal, where very few studies focus on this issue. The lack of infrastructure to monitor nitrogen concentrations and deposition in the country, as well as policies to enforce nitrogen emission reductions, poses a challenge, as ammonia is the most critical pollutant to fulfil Portugal's future emission goals.
Currently, modelling is the only cost-effective option to effectively study nitrogen deposition in the Mediterranean. Due to the extent of agriculture in these areas, nitrogen (N) deposition assessments have been conducted for many years in other countries, such as the Netherlands and Germany, using Chemistry Transport Models (CTMs) to assess the dry deposition of reduced and oxidised N. Among these CTMs, LOTOS-EUROS is regarded as one of the most advanced models that includes a compensation point parametrization for ammonia. However, applying this model to a Mediterranean area requires some adaptation since its deposition parameters are mostly based on studies from North-Western Europe. Since vegetation parameters influence the surface resistance of gas-phase deposition, and this resistance is crucial for gas deposition, using these models in climates different from where they were initially developed will likely lead to inaccurate results. Due to this, there is a need for a CTM that better represents different climate zones. 
Here, we use a new version of the LOTOS-EUROS model incorporating a three-tiered vegetation approach. The three tiers considered are Tier 1—climate zones; Tier 2—land use classes; and Tier 3—vegetation type. This method incorporates 140 combinations of land use and vegetation types, allowing us to differentiate the Mediterranean from the standard temperate climate by changing vegetation parameters.
With this study, we aim to adapt and enhance the dry deposition module of LOTOS-EUROS by including specifications for the Mediterranean climate and vegetation. To achieve this goal, sensitivity runs were performed for multiple vegetation and climate-specific parameters to assess which are the most influential variables for the study region. Then, the most sensitive parameters were analysed to understand the variations.
This work found that adapting the maximum stomatal conductance is highly prone to introduce changes in the modelled deposition fluxes and concentrations of oxidised and reduced nitrogen and ozone. Maximum and minimum vapour pressure deficit and maximum, optimal and minimum temperature were also among the most susceptible to cause impacts in the model results over the Mediterranean. Also, the start and end of the growing season greatly impacted the modelled deposition fluxes since the growing season starts earlier and finishes later in the Mediterranean. Hence, adapting the deposition parameters to the Mediterranean climate and vegetation significantly impacts the modelled concentration and deposition fluxes of oxidised and reduced nitrogen compounds and ozone.

How to cite: Barreirinha, A., Banzhaf, S., Russo, M., Thürkow, M., Schaap, M., and Monteiro, A.: Investigating the sensitivity of modelled nitrogen inputs in the Mediterranean to dry deposition parameters, EGU General Assembly 2025, Vienna, Austria, 27 Apr–2 May 2025, EGU25-1042, https://doi.org/10.5194/egusphere-egu25-1042, 2025.

EGU25-1143 | ECS | Posters on site | BG1.3

Emissions of ammonia and nitrogen dioxide over the Iberian Peninsula estimated with satellite observations 

Daniel Helm, Enrico Dammers, Carla Gama, Martijn Schaap, and Alexandra Monteiro

Anthropogenic emissions of reactive nitrogen in Europe have increased significantly over the last two centuries. A large proportion of this reactive nitrogen is released into the atmosphere in the form of ammonia (NH3), which is generated from livestock farming activities and fertilizer use, and in the form of oxides of nitrogen (NOX) generated from the combustion of fossil fuels. 

The atmospheric deposition of reactive nitrogen can adversely impact ecosystems and biodiversity. This is particularly relevant to the Iberian Peninsula where ecosystems that have a low threshold for eutrophication, and are therefore highly sensitive to nitrogen levels, are found. 

In-situ measurements of reactive nitrogen species in this region are sparse and those that are available are measurements of NO2 concentrations and in some cases intermittent measurements of NHX & NOY wet deposition. This limitation in the availability of deposition data gives rise to a dearth of knowledge and a high degree of uncertainty in ascertaining the budget of nitrogen species in this region. 

Several approaches have been developed to estimate emissions of NO2 and NH3 utilizing earth observation. Here we present the application of a multi-gaussian plume inversion method in combination with satellite observations of NH3 from the Cross-Track Infrared Sounder instrument and observations of NO2 from the TROPOMI sensor to validate concentration distributions simulated by the LOTOS-EUROS chemistry transport model. 

Initially, a steady-state inversion scheme was applied over the Iberian Peninsula to derive spatial-temporal emission fields and evaluate these against inventory emissions and existing spatial and temporal distributions. An analysis of these results shows variations between the spatial distribution of inventory emissions and those obtained from the satellite observations. Then, the resulting emission fields are used within the LOTOS-EUROS model to simulate the concentration and deposition fields which will be evaluated with in-situ data. 

How to cite: Helm, D., Dammers, E., Gama, C., Schaap, M., and Monteiro, A.: Emissions of ammonia and nitrogen dioxide over the Iberian Peninsula estimated with satellite observations, EGU General Assembly 2025, Vienna, Austria, 27 Apr–2 May 2025, EGU25-1143, https://doi.org/10.5194/egusphere-egu25-1143, 2025.

EGU25-1792 | Orals | BG1.3

Determining the origin of nitrogen deposition in nature areas 

Roy Wichink Kruit, Kasper Brandt, Albert Bleeker, and Wim van der Maas

Nitrogen policy in the Netherlands has a long history. Since the 70’s of the last century, various measures have been implemented in an attempt to reduce emissions of different nitrogen compounds. A few examples of a wide range of measures implemented since then are the introduction of catalytic converters removing nitrogen oxides from fossil fuel burning, shallow injection of manure into the soil reducing ammonia emissions to air and lowering of the manure application rates. In 2019, the European High Court judged that the Dutch nitrogen policy with respect to nitrogen deposition onto protected nature areas was not in accordance with the European Habitats Directive. All infrastructural developments came to a halt: building houses, roads, etc. stopped. With a new Minister on Nitrogen in place since 2021, the focus became a drastic reduction of nitrogen emissions to get the nitrogen deposition below the nitrogen critical loads for 74% of the protected (Natura 2000) nature areas, which is laid down in a nitrogen law. This requires a drastic change in activities in and around these nature areas, mainly (but not exclusively) focusing on the agricultural sector. This because the contribution to the total nitrogen deposition of this sector is on average 50% in the Netherlands. To help policymakers take measures as efficiently as possible, RIVM has developed a tool that maps the origin of the nitrogen deposition in each nature area. In this presentation, the tool will be presented and it will be shown how the tool can help the government, provinces and other stakeholders to take dedicated regional measures to reduce the nitrogen emissions and eventually reduce the nitrogen deposition in nature areas.

How to cite: Wichink Kruit, R., Brandt, K., Bleeker, A., and van der Maas, W.: Determining the origin of nitrogen deposition in nature areas, EGU General Assembly 2025, Vienna, Austria, 27 Apr–2 May 2025, EGU25-1792, https://doi.org/10.5194/egusphere-egu25-1792, 2025.

EGU25-1999 | ECS | Orals | BG1.3

Contrasting physico-chemical and oxidative relationships to thalli nitrogen and metal ion contents in Usnea spp. and Hypotrachyna spp. from Himalayan forests of Nepal. 

Suman Prakash Pradhan, Hirendra Bista, Bishal Lamsal, Bishnu Prasad Pandey, Chitra Bahadur Baniya, Ajinkya Deshpande, Subodh Sharma, and Mark A Sutton

South Asian nations are facing the challenge of increasing nitrogen pollution with the Indo-Gangetic Plain having some of the highest levels of atmospheric ammonia pollution globally. However, there is a lack of in-country research to evaluate the possible impact of nitrogen-related pollutants on South Asian biodiversity. In the Himalayas, there is an opportunity to utilize lichens from natural habitats to establish field-based references for better future tracking of changes in ecosystem health relevant to the wider South Asian region. In this study, we assessed the natural chemical variability of two lichens (Usnea spp. and Hypotrachyna spp.) based on thallus nitrogen and metal ion contents along with their physico-chemical and oxidative responses in two 1-km long transects from two forests of Nepal representing local gradients. Our results revealed a moderate concentration of total Kjeldalh nitrogen (0.36-0.98 % DM in Chandragiri, KTM and 0.57-2.04 % DM in Ghorepani, ACA), as well as ammonium (40.42-159.84 mg/L in Chandragiri, KTM and 80.60-280.64 mg/L in Ghorepani, ACA) and considerable amount of metal ions in both lichens, though with the highest values for lichens collected from the Ghorepani, ACA (from Western Nepal). A noteworthy background concentration of atmospheric ammonia was also observed at both sites. The highest variation in physico-chemical responses, such as electrical conductivity, chlorophyll content, chlorophyll degradation, chlorophyll fluorescence, and phenolic content was observed in the lichens from the same area, consistent with the higher levels of air pollution. Moreover, there appeared to be associated impacts on oxidative responses such as radical scavenging and catalase activities. Furthermore, the metal ions in the lichen thalli were found to originate from both anthropogenic and natural sources in Chandragiri, KTM and few of the metal ions were deposited from long-range transport mechanisms in Ghorepani, ACA, which signifies the diverse sources of pollution in the study areas. The sampling line-wise variation in thallus chemistry signifies the local pollution gradient in both sites. Further, environmental covariables (slope, elevation, crown settings, wind pattern) were observed to affect the lichen abundance and accumulation of nitrogen and metal ions. In comparison, Hypotrachyna spp. showed greater potential to accumulate pollutants and variability in physico-chemical and oxidative responses. From this study, we conclude that a range of physico-chemical and biochemical responses of the target lichens can be used as proxies for the bioindication of nitrogen and metal ion pollution to assess lichen’s health and ecological functioning. Wider studies covering large spatial extent and cellular mechanisms of lichen response are now recommended to fully understand the functional biology explaining contrasting responses between lichen species in different geographic settings of Nepal and South Asia.


Keywords: Lichens; Bioindicators; Pollution; Ecosystem; Reference

How to cite: Pradhan, S. P., Bista, H., Lamsal, B., Pandey, B. P., Baniya, C. B., Deshpande, A., Sharma, S., and Sutton, M. A.: Contrasting physico-chemical and oxidative relationships to thalli nitrogen and metal ion contents in Usnea spp. and Hypotrachyna spp. from Himalayan forests of Nepal., EGU General Assembly 2025, Vienna, Austria, 27 Apr–2 May 2025, EGU25-1999, https://doi.org/10.5194/egusphere-egu25-1999, 2025.

EGU25-2297 | Posters on site | BG1.3

Acidification of European croplands by nitrogen fertilization: Consequences for carbonate losses, and soil health 

Kazem Zamanian, Ruhollah Taghizadeh-Mehrjardi, Jingjing Tao, Lichao Fan, Sajjad Raza, Georg Guggenberger, and Yakov Kuzyakov
Soil acidification is an ongoing problem in intensively cultivated croplands due to inefficient and excessive nitrogen (N) fertilization. We collected high-resolution data comprising 19,969 topsoil (0–20 cm) samples from the Land Use and Coverage Area frame Survey (LUCAS) of the European commission in 2009 to assess the impact of N fertilization on buffering substances such as carbonates and base cations. We have only considered the impacts of mineral fertilizers from the total added N, and a N use efficiency of 60 %. Nitrogen fertilization adds annually 6.1 × 107 kmol H+ to European croplands, leading to annual loss of 6.1 × 109 kg CaCO3. Assuming similar acidification during the next 50 years, soil carbonates will be completely removed from 3.4 × 106 ha of European croplands. In carbonate-free soils, annual loss of 2.1 × 107 kmol of basic cations will lead to strong acidification of at least 2.6 million ha of European croplands within the next 50 years. Inorganic carbon and basic cation losses at such rapid scale tremendously drop the nutrient status and production potential of croplands. Soil liming to ameliorate acidity increases pH only temporarily and with additional financial and environmental costs. Only the direct loss of soil carbonate stocks and compensation of carbonate-related CO2 correspond to about 1.5 % of the proposed budget of the European commission for 2023. Thus, controlling and decreasing soil acidification is crucial to avoid degradation of agricultural soils, which can be done by adopting best management practices and increasing nutrient use efficiency. Regular screening or monitoring of carbonate and base cations contents, especially for soils, where the carbonate stocks are at critical levels, are urgently necessary.

How to cite: Zamanian, K., Taghizadeh-Mehrjardi, R., Tao, J., Fan, L., Raza, S., Guggenberger, G., and Kuzyakov, Y.: Acidification of European croplands by nitrogen fertilization: Consequences for carbonate losses, and soil health, EGU General Assembly 2025, Vienna, Austria, 27 Apr–2 May 2025, EGU25-2297, https://doi.org/10.5194/egusphere-egu25-2297, 2025.

EGU25-3079 | Orals | BG1.3

Trends of inorganic nitrogen deposition in European forests during the period 2000-2020 

Arne Verstraeten, Andreas Schmitz, Aldo Marchetto, Nicholas Clarke, Anne Thimonier, Char Hilgers, Anne-Katrin Prescher, Till Kirchner, Karin Hansen, Tamara Jakovljević, Carmen Iacoban, Wim de Vries, Bernd Ahrends, Henning Meesenburg, Gunilla Pihl Karlsson, Per Erik Karlsson, and Peter Waldner

The input of nitrogen (N) into forests through atmospheric deposition has been determined for the main forest types within the ICP Forests Level II monitoring network and the Swedish Throughfall Monitoring Network (SWETHRO) since the 1990s from measured concentrations in continuously collected precipitation (bulk deposition) and throughfall (below tree canopy) samples. Recently, aggregated data sets have been created, containing gap-filled monthly and annual bulk and throughfall depositions (including stemflow in beech stands) for more than 500 forest stands. Total deposition was calculated from throughfall deposition accounting for canopy exchange. Here, we present trends for throughfall deposition of inorganic N, including ammonium (NH4+-N) and nitrate (NO3--N), for plots with a complete time series, during the period 2000-2020 and in the first and last decade separately. Furthermore, we highlight and discuss spatial trends of total inorganic N deposition across Europe.

How to cite: Verstraeten, A., Schmitz, A., Marchetto, A., Clarke, N., Thimonier, A., Hilgers, C., Prescher, A.-K., Kirchner, T., Hansen, K., Jakovljević, T., Iacoban, C., de Vries, W., Ahrends, B., Meesenburg, H., Pihl Karlsson, G., Karlsson, P. E., and Waldner, P.: Trends of inorganic nitrogen deposition in European forests during the period 2000-2020, EGU General Assembly 2025, Vienna, Austria, 27 Apr–2 May 2025, EGU25-3079, https://doi.org/10.5194/egusphere-egu25-3079, 2025.

EGU25-3928 | Posters on site | BG1.3

Synchronized N2O/CH4/H2O/NH3 plume mobile measurement system based on low-power open-path laser analyzers 

Songtao Hu, Weihao Shen, Ruisheng Jiang, Daniel Wilson, Ting-Jung Lin, and Yin Wang

In recent years, vehicle-based, multiple-gas mobile sensing platforms have been developed and extensively utilized for greenhouse gases (GHGs) and air pollutant emission studies. Closed-path analyzers are currently the primary equipment used for plume observations. However, the closed-path approach, poses sampling challenges for the species such as water vapor (H2O) and ammonia (NH3) that readily adsorb and desorb from the instrument inlets, tubings, and optical cells. Due to the different adsorption characteristics of each gas, the plume signals generated during the sampling process may become desynchronized. In addition, many mobile systems are deployed on fuel-powered vehicles, which emit exhaust that can contaminate the detected plume signals. These issues can increase the complexities in subsequent data processing tasks.

This work reports the field deployment of a multiple trace gas plume sensing platform, equipped with open-path N2O, CH₄, H2O and NH₃ quantum-cascade laser analyzers (model HT8500, HT8600P, HT8700, respectively) with a 10 Hz sampling time resolution. The plume monitoring system with a total power consumption of no more than 150W allows it to be easily driven by an electric vehicle. Utilizing the open-path N2O/CH4/H2O/NH3 gas analyzers eliminates the need for a pressure-controlled enclosed gas cell, the associated tubing systems, and power- hungry pump. The ambient air flows unrestricted through the optical path, enabling analyzers to achieve high temporal resolution, high response rates, and reduced sampling artifacts and power consumption compared to their closed-path gas analyzer counterparts. This open-path configuration not only eliminates the influence of exhaust emission signals from vehicles using fossil fuel engines, but also achieves perfect plume synchronization, which is crucial for the real-time identification of diffuse sources using correlations between different molecules in measured plumes.

The mobile platform has been field deployed in different field experiments including livestock farms, ammonia plants, cold storage facilities, wastewater treatment plants, and urban traffic roads in China. Our study has identified a substantial increase in ammonia concentrations adjacent to rivers, with an average increment of ~37 ppb relative to a few ppb background concentration. We observed that the peak methane concentration near a wastewater treatment plant reached 7539 ppb. Furthermore, the ratio of methane plume signal intensity to ammonia plume signal intensity in the vicinity of industrial areas is ~10, as opposed to non-industrial areas where this ratio is significantly reduced. The synchronized plume significantly enhances the efficiency of extracting effective plume data from the raw signals acquired from different gas analyzers.

How to cite: Hu, S., Shen, W., Jiang, R., Wilson, D., Lin, T.-J., and Wang, Y.: Synchronized N2O/CH4/H2O/NH3 plume mobile measurement system based on low-power open-path laser analyzers, EGU General Assembly 2025, Vienna, Austria, 27 Apr–2 May 2025, EGU25-3928, https://doi.org/10.5194/egusphere-egu25-3928, 2025.

Nitrogen holds a crucial place in maintaining the sustainability of the food-energy-water (FEW) nexus, essential pillars underpinning human society. Its vital role spans across food production, energy generation, and the preservation of water quality. Here based on CHANS model, we show that comprehensive nitrogen management strategies offer the dual benefits of satisfying China's food requirements and boosting nitrogen energy production from straw by 1 million tonnes (26%) compared to the baseline year of 2020. Simultaneously, these strategies could lead to a reduction of 8 million tonnes (-31%) in nitrogen fertilizer usage, a decrease of 3.8 million tonnes (-46%) in nitrogen-induced water pollution, and a halving of water consumption in agriculture, all relative to 2020 levels. These transformative changes within the FEW nexus could result in national societal gains of around US$140 billion, against a net investment of just US$8 billion. This emphasizes the cost-effectiveness of such strategies and highlights their significant potential in assisting China to meet multiple sustainable development goals, especially those related to hunger relief, clean energy advancement, and the protection of aquatic ecosystems.

How to cite: Chen, B.: Managing nitrogen to achieve sustainable food-energy-water nexus in China, EGU General Assembly 2025, Vienna, Austria, 27 Apr–2 May 2025, EGU25-4076, https://doi.org/10.5194/egusphere-egu25-4076, 2025.

EGU25-4177 | ECS | Orals | BG1.3

Validation and uncertainty quantification of three state-of-the-art ammonia surface exchange schemes using NH3 flux measurements in a dune ecosystem 

Tycho Jongenelen, Margreet van Zanten, Enrico Dammers, Roy Wichink Kruit, Arjan Hensen, Leon Geers, and Jan Willem Erisman

Deposition of reactive nitrogen causes detrimental environmental effects, including biodiversity loss, eutrophication, and soil acidification. Measuring and modeling the biosphere-atmosphere exchange of ammonia, the most abundant reduced nitrogen species, is complex due to its high reactivity and solubility, often leading to systematic discrepancies between model predictions and observations. This study aims to determine whether three state-of-the-art exchange schemes for NH3 can accurately model NH3 exchange in a dune ecosystem and detect factors causing the uncertainties in these schemes. The selected schemes are DEPAC by Van Zanten et al. (2010), and the schemes by Massad et al. (2010) and Zhang et al. (2010). Validation against one year of gradient flux measurements revealed that the Zhang scheme represented the NH3 deposition at Solleveld best, whereas the DEPAC scheme overestimated the total deposition while the Massad scheme underestimated the total deposition. Yet, none of these schemes captured the emission events at Solleveld, pointing to considerable uncertainty in the compensation point parameterization and possibly in the modeling of NH3 desorption processes from wet surface layers. The sensitivity analysis further reinforced these results, showing how uncertainty in essential model parameters in the external resistance (Rw) and compensation point parameterization propagated into diverging model outcomes. These outcomes underscore the need to improve our mechanistic understanding of surface equilibria represented by compensation points, including the adsorption-desorption mechanism at the external water layer. Specific recommendations are provided for future modeling approaches and measurement setups to support this goal.

How to cite: Jongenelen, T., van Zanten, M., Dammers, E., Wichink Kruit, R., Hensen, A., Geers, L., and Erisman, J. W.: Validation and uncertainty quantification of three state-of-the-art ammonia surface exchange schemes using NH3 flux measurements in a dune ecosystem, EGU General Assembly 2025, Vienna, Austria, 27 Apr–2 May 2025, EGU25-4177, https://doi.org/10.5194/egusphere-egu25-4177, 2025.

EGU25-5842 | Orals | BG1.3

Periodic Cicada Mass Mortality Events Drive Microbial-Mediated Gas Pulses from Forest Soils 

Ryan Mushinski, Megan Purchase, Richard Phillips, Jonathan Raff, Amy Phelps, Elizabeth Huenupi, and Jennifer Lau

Mass emergence of periodic cicadas (Magicicada spp.) represents a unique ecosystem disturbance with potential impacts on forest soil biogeochemistry and greenhouse gas emissions. During the 2021 Brood X emergence in Indiana, USA, we investigated how cicada emergence and subsequent decomposition affected soil microbial communities and their production of nitrous oxide (N2O) and ammonia (NH3). Using a combination of field measurements and controlled laboratory experiments, we discovered that the interface between cicada carcasses and soil surfaces creates hotspots of enhanced microbial nutrient cycling, leading to significant pulses of N2O and NH3 after approximately 10-15 days. Our study revealed that dissimilatory nitrate reduction to ammonia (DNRA) was the primary mechanism driving these emissions, evidenced by increased abundance of DNRA taxa on cicada carcass surfaces (the necrobiome) coinciding with peak gas fluxes. Notably, the abundance of Serratia marcescens, a bacteria capable of both chitin degradation and DNRA, was significantly positively associated with N2O pulses. Analysis of 16S rRNA amplicon sequencing data showed distinct microbial community compositions between soil and cicada necrobiome samples, with significantly higher abundances of chitinolytic and DNRA taxa in the necrobiome. Time series decomposition experiments demonstrated that soil respiration rates and nitrogen cycling were significantly enhanced in cicada-amended soils. Quantitative PCR revealed that bacterial ammonia oxidisers dominated over archaeal counterparts in soil samples, while the cicada necrobiome was characterised by high abundances of heterotrophic nitrifiers. The emergence tunnels created by cicadas also influenced soil conditions, potentially creating microsites that favour DNRA over conventional denitrification. While individual emergence events may contribute relatively small amounts of nitrogen compared to annual atmospheric deposition, the predictable nature and geographic extent of cicada emergences suggest they may represent an overlooked yet significant contributor to forest nitrogen cycling and greenhouse gas emissions. Our findings provide new insights into the complex microbiological mechanisms driving biogeochemical pulses following mass mortality events and highlight the need to consider periodic ecosystem disturbances in climate change models.

How to cite: Mushinski, R., Purchase, M., Phillips, R., Raff, J., Phelps, A., Huenupi, E., and Lau, J.: Periodic Cicada Mass Mortality Events Drive Microbial-Mediated Gas Pulses from Forest Soils, EGU General Assembly 2025, Vienna, Austria, 27 Apr–2 May 2025, EGU25-5842, https://doi.org/10.5194/egusphere-egu25-5842, 2025.

EGU25-6623 | ECS | Posters on site | BG1.3

Trade-offs between crop yield, soil organic carbon and greenhouse gas emissions under reduced tillage and rainfall exclusion 

Antonios Apostolakis, Paulina Englert, Oliver Lindunda Daka, Stefan Siebert, and Ana Meijide

Reduced tillage is often considered as an agroecological practice that promotes soil organic carbon (SOC) sequestration in the topsoil, offering potential for climate change mitigation. However, effective mitigation requires a comprehensive understanding of trade-offs among SOC stocks, greenhouse gas emissions, and crop yields. As climate change alters carbon and nitrogen cycling, these trade-offs must be evaluated under current and experimentally induced extreme conditions to assess the effectiveness of reduced tillage in a changing climate. In this study, we measured crop yields, soil carbon stocks and soil CO2 and N2O fluxes in a conventional tillage (CT) vs. reduced tillage (RT) field trial in central Germany. The long-term trial runs since 1970 in a field with Luvisol soil (73% silt, 15% clay, and 6.6 pH). The mean annual precipitation is 611±120 mm and the mean annual temperature is 9.6±0.7°C. The field trial follows a randomized block design and consists of 16 plots: eight under CT with inversion ploughing to a depth of 27-30 cm, and eight under RT with non-inversion harrowing to a depth of 7-10 cm. In 2022-23 and in 2023-24 we cultivated winter wheat and winter barley respectively. In February 2023, rain-out shelters (area =2 m × 2 m) designed to intercept 50% of the precipitation were installed in half of the plots, and we initiated the soil flux measurements with static chambers over permanently installed rings and portable gas analyzers. We measured crop yields in both years, and SOC in samples from 0-90 cm at 10 cm intervals sampled in August 2023. SOC traits were examined with by-size fractionation to particulate and mineral-associated organic matter and an incubation experiment with an automated respirometer. Winter wheat yield did not differ between tillage and precipitation treatments but, in the second year of our experiment, winter barley yield was lower under rainfall exclusion than ambient precipitation in the RT fields only (50% precipitation: 0.26±0.05 kg m-2 vs. 100% precipitation: 0.52±0.02 kg m-2). Regarding SOC, we found that fields under RT had higher stocks in the 0-10 cm depth than under CT (RT: 1.93±0.03 kg m-2 vs. CT: 1.53±0.02 kg m-2), but the opposite occurred in the 20-30 cm depth (RT: 1.16±0.04 kg m-2 vs. CT: 1.58±0.06 kg m-2). Comparing SOC stocks at 0-90 cm, there was no difference between the two tillage systems. Field soil N2O fluxes did not differ significantly between tillage and precipitation treatments when considering block, plot and date as random effects. In contrast, field soil CO2 fluxes were significantly lower in RT than CT fields under ambient precipitation but this did not result in higher SOC stocks under RT. Rainfall exclusion led to higher soil CO2 fluxes both in the RT (in average, 50%: 32.0±1.0 mg CO2-C m-2 h-1 vs. 100%: 30.6±0.9 mg CO2-C m-2 h-1) and CT (in average, 50%: 30.1±1.1 mg CO2-C m-2 h-1 vs. 100%: 24.2±0.7 mg CO2-C m-2 h-1) fields. Based on the above, RT seems to have no climate change mitigation potential in a productive fine textured soil of temperate central Europe.

How to cite: Apostolakis, A., Englert, P., Daka, O. L., Siebert, S., and Meijide, A.: Trade-offs between crop yield, soil organic carbon and greenhouse gas emissions under reduced tillage and rainfall exclusion, EGU General Assembly 2025, Vienna, Austria, 27 Apr–2 May 2025, EGU25-6623, https://doi.org/10.5194/egusphere-egu25-6623, 2025.

EGU25-6740 | ECS | Orals | BG1.3

Dynamics of N2O emissions from Amazonian tropical peat forest and partitioning N-processes using 15N isotopes. 

Mohit Masta, Fahad Ali Kazmi, Mikk Espenberg, Jaan Pärn, Kaido Soosaar, and Ülo Mander

Tropical peatlands are crucial for global nitrogen (N) cycling because they store large amounts of carbon and N. This study, conducted in November 2023, investigated the dynamics of N2O emissions from Amazonian peatland forests in Peru. It focused specifically on two peatland forest sites in Iquitos: the Quistococha and Zungarococha forests. We conducted static chamber gas measurements to assess soil greenhouse gas (GHG) fluxes. Additionally, we took soil samples for physical and chemical properties and soil microbiome (DNA & RNA). In order to investigate the source processes for N2O production and consumption, we applied 15N isotopes as tracers in soil. We also took samples for natural abundance of 15N in N2O gas. Our results indicate that both forests exhibited different trends in soil GHG fluxes and N substrates. Quistococha had higher levels of soil nitrate and ammonium compared to Zungarococha, which correlated with increased N2O emissions from Quistococha. A similar pattern was observed for CO2 emissions, with Quistococha producing higher levels than Zungarococha. Contrastingly, Zungarococha had higher soil moisture levels, which aligned with its lower N2O emissions. This forest also showed greater soil N2 emissions, suggesting the potential for complete denitrification. However, this site was also a significant source of CH4 emissions due to its higher soil moisture, which supports methanogenic activity. Overall, the two sites demonstrated distinct behaviors: Quistococha was a source of N2O and CO2, influenced by intermediate soil moisture. Zungarococha emitted higher levels of CH4 and N2 due to its high soil moisture conditions. The patterns in N2O fluxes are further supported by 15N isotopic mapping, correlating N2O emissions with their source processes. The site preference values fall within the denitrification zone at Zungarococha and the nitrification zone, with some hybrid processes in Quistococha.  The microbiome analyses show similar results, with denitrifying microbes dominating the Zungarococha soil and nitrifying microbes dominating the Quistococha soil.

How to cite: Masta, M., Kazmi, F. A., Espenberg, M., Pärn, J., Soosaar, K., and Mander, Ü.: Dynamics of N2O emissions from Amazonian tropical peat forest and partitioning N-processes using 15N isotopes., EGU General Assembly 2025, Vienna, Austria, 27 Apr–2 May 2025, EGU25-6740, https://doi.org/10.5194/egusphere-egu25-6740, 2025.

Soil organic matter (SOM) consists of carbon and nitrogen, both of which can contribute to the production of nitrous oxide (N2O). Currently, there is ample focus on increasing soil carbon content as a strategy for climate mitigation. Yet, the role of SOM on N2O production is poorly understood. We will present field flux N2O measurements from a hillslope cultivated to cereals with a natural gradient in SOM, pH and soil moisture. Additionally, eight rain exclusion shelters (~50% drought) were installed along the gradient, and N2O fluxes were measured both under 50% reduced and normal rainfall conditions. N2O fluxes have been measured for two growing seasons and will be presented alongside with soil and yield characteristics.

How to cite: Dörsch, P. and Kjær, S. T.: Influence of soil organic matter and reduced rainfall on nitrous oxide emissions along a cultivated hillslope , EGU General Assembly 2025, Vienna, Austria, 27 Apr–2 May 2025, EGU25-7923, https://doi.org/10.5194/egusphere-egu25-7923, 2025.

EGU25-8269 | Posters on site | BG1.3

Decreasing N deposition leads to significant decrease in foliar N concentrations in forest trees 

Inken Krüger, Andreas Schmitz, Catrin Stadelmann, and Tanja Sanders

Despite reduction of nitrogen emissions, deposition in German forests remain high. Eutrophication of ecosystems thus remains an important issue of scientific and socio-political interest. Here we analyse data from 78 intensive forest monitoring (Level II) sites operated by the forest research institutes of the German federal states as part of the ICP Forests network (International Co-operative Programme on Assessment and Monitoring of Air Pollution Effects on Forests). In the 2013-2022 period, mean annual bulk open field (inorganic + organic) deposition was between 4.4 and 13.5 kg N ha-1 a-1. Over the past twenty years, N deposition decreased by about 40 % which corresponds to a decrease of 2.5 % per year compared to the deposition in 2010. The decrease in N-NO3 (-3.1 % per year) was slightly higher than the decrease in N-NH4 (-2.7 %). Organic N deposition decreased by only 0.7 % per year. Canopy budget models show that N deposition (wet + dry + occult) to forest sites was between 10 and 31 kg N ha-1 a-1 over the same period.

The deposition data is used for reporting duties such as the German federal states’ core indicators of environmental quality (LIKI) and for scientific research e.g. to evaluate changes in biodiversity, dynamics of nutrient cycles and ensuing vulnerability of ecosystem services, or effects on tree vitality. We used the data to assess the impact of N deposition on foliar N concentrations, an import indicator of tree nutrition status. Tree nutrition influences vitality and trees’ resilience to climate extremes. A deterioration of foliar nutrients has been observed in forest ecosystems across Europe. At the German Level II sites, all main tree species (European beech, Norway spruce, Scots pine, sessile and pedunculate oak) show a significant decrease in foliar N concentration of 0.2-0.3 % per year. Besides nitrogen deposition, the reduction has been linked to various environmental factors, including increasing temperatures and changing precipitation patterns, as well as, the increase in atmospheric CO2 concentrations. At the spatial scale, nutrient availability can be explained by various site conditions such as parent material. Nonetheless, weak positive but significant relationships between mean foliar N and total N deposition for beech, oak, and pine for the 2013-2022 time period show that atmospheric deposition can explain part of the spatial variability between forest sites. The results indicate the importance of assessing deposition, trophy classes, and climate conditions at the same sites to fully understand their interaction.

How to cite: Krüger, I., Schmitz, A., Stadelmann, C., and Sanders, T.: Decreasing N deposition leads to significant decrease in foliar N concentrations in forest trees, EGU General Assembly 2025, Vienna, Austria, 27 Apr–2 May 2025, EGU25-8269, https://doi.org/10.5194/egusphere-egu25-8269, 2025.

EGU25-8306 | ECS | Posters on site | BG1.3

Investigating Nitrous Oxide Pathways and Soil Carbon-Nitrogen Interactions Using Isotopic Techniques to Mitigate Greenhouse Gas Emission 

Sobia Bibi, Barira Shoukat Hafiza, Wolfgang Wanek, Magdeline Vlasimsky, Mariana Rabello, Maria Heiling, Gerd Dercon, Sandén Taru, Spiegel Adelheid, and Rebecca Hood-Nowotny

Effective management of carbon (C) and nitrogen (N) in agricultural soils is crucial for mitigating greenhouse gas (GHG) emissions, particularly nitrous oxide (N2O) and carbon dioxide (CO2). This study investigates innovative dual C and N isotope-based methods to explore the mechanisms driving N2O and CO2 production and their potential mitigation, while maintaining soil fertility. By applying selectively labelled fertilizers with labelled in both fractions (15NH4NO3 or NH415NO3) the microbial transformations of N in soil are traced, allowing for the identification of conditions that promote N2O production or its reduction to the environmentally benign N gas (N2).

The impact of different labile and recalcitrant C sources on N cycling and GHG emissions is investigated by applying 13C-labelled maize-derived plant litter and biochar. The interaction between labile-C (e.g., plant litter) and recalcitrant C (e.g., biochar) with N in soils plays a critical role in regulating microbial processes and, consequently, GHG emissions. Plant litter, as a labile C source, stimulates microbial activity, (i) enhancing N-cycling and potentially increasing N2O emissions or, alternatively, (ii) stimulating microbial inorganic N immobilization thereby reducing N availability to gaseous and hydrological N loss processes. In contrast, recalcitrant C, such as biochar, provides a stable C form with long term C storage potential in soils. Biochar with its large specific surface area is recognized for its ability to sorb inorganic N such as ammonium and nitrate, reducing its availability for microbial processes that produce N2O and thereby may mitigate soil N2O emissions. However, how C inputs and N availability influence each other and affect microbial processes linked to GHG emissions remains poorly understood.

To address these challenges, a large-scale incubation study was initiated using soils sampled from a field experiment in Grabenegg, Austria, conducted by, The University of Natural Resources and Life Sciences, Vienna (BOKU) and Austrian Agency for Health and Food Safety, Vienna (AGES). One experimental soil was amended with NPK fertilizer, while the other received both NPK and hardwood- derived biochar since 2022. Soil samples were collected from the upper 10 cm of the root zone in October 2024 and used in a laboratory mesocosm experiment to trace litter-C and biochar-C processing and their effects on soil inorganic N cycling using 15N and 13C isotope tracing and isotope pool dilution measurements. Key measurements, including emissionsof 15N2O, 15N2, and 13CO2, 13C tracing into particulate organic 13C, mineral-associated organic 13C, and microbial biomass 13C and, 15N tracing in, mineral-N (15NH4, 15NO3) and microbial 15N will be performed at various intervals over one month, and data evaluated using numerical modelling. Findings from this study will greatly contribute to optimizing climate-smart soil management practices aimed at reducing GHG emissions from soil while maintaining its fertility.  

How to cite: Bibi, S., Hafiza, B. S., Wanek, W., Vlasimsky, M., Rabello, M., Heiling, M., Dercon, G., Taru, S., Adelheid, S., and Hood-Nowotny, R.: Investigating Nitrous Oxide Pathways and Soil Carbon-Nitrogen Interactions Using Isotopic Techniques to Mitigate Greenhouse Gas Emission, EGU General Assembly 2025, Vienna, Austria, 27 Apr–2 May 2025, EGU25-8306, https://doi.org/10.5194/egusphere-egu25-8306, 2025.

EGU25-9733 | ECS | Posters on site | BG1.3

Nitrogen transformation mediated by artificial root exudates derived from young alder and English oak trees 

Novalia Kusumarini, Iseult Lynch, Liam Cox, and Sami Ullah

Root exudates account for up to 17% of the carbon fixed from photosynthesis and are allocated belowground, where they significantly influence microbial communities that drive nutrient cycling, particularly nitrogen in the rhizosphere. Root C exudation for nitrogen acquisition may differ between tree types. This study aimed to investigate how root exudates from English oak (Quercus robur) influence nitrogen cycling in rhizosphere soils compared to soils under alder (Alnus glutinosa). We hypothesized that oak root exudates would prime faster N transformation, given that alder tree roots host nodules for biological nitrogen fixation and thus will not invest exudate C in nitrogen acquisition. We experimented to measure gross and net nitrogen mineralization rates in soils subjected to simulated oak- and alder-specific carbon exudation rates. The study was designed using three artificial root exudate concentrations: 0, 77, and 359 µg C g⁻¹ soil day⁻¹ for alder, and 0, 187, and 814 µg C g⁻¹ soil day⁻¹ for oak. Soils were collected from the top 15 cm of the mineral layer from a four-year-old monoculture plantation of oak and alder trees in Staffordshire, England. The artificial root exudates were based on the actual root exudate rates from alder and oak trees collected during the Summer of 2022 and Spring of 2023 and contained carbohydrates, amino acids, and organic acids. Nitrogen transformation responses in the incubated soils were measured on days 15 and 30. On day 15, half of the soils were recovered from the incubation chambers and subjected to 15N-N tracer addition to determine gross N mineralization. The study revealed that higher concentrations of root exudate significantly (p<0.001) enhanced microbial activity. This was evidenced by increased soil respiration (21-fold in the oak simulation and 10-fold in the alder), microbial biomass carbon (3-fold in both tree species), and microbial biomass nitrogen (6-fold in oak and 2-fold in alder simulations) compared to the control after 30 days of incubation. These changes contributed to a 282% increase in total dissolved nitrogen in the oak and a 140% increase in the alder simulations. Root carbon inputs altered both gross and net mineralization and nitrification rates. Higher exudate concentrations over longer incubation periods elevated gross mineralization rates by up to 20-fold in the oak but reduced by up to fivefold in the alder compared to controls. Net mineralization rates increased with exudate concentration in both species. In gross nitrification, oak exudates enhanced tenfold, while alder exudates increased eightfold compared to controls after 15 days. Gross mineralization strongly correlated with net mineralization (R²oak=0.92, R²alder=0.76) but showed weaker correlations with net nitrification (R²oak = 0.30, R²alder = –0.47). Oak root exudates exhibited higher responses across gross mineralization (lnRR=3.08), net mineralization (lnRR=2.50), and gross nitrification (lnRR=1.57) compared to alder. Our results demonstrate that higher oak exudation rates enhanced nitrogen cycling compared to alder, underscoring the importance of species-specific traits in shaping carbon allocation strategies and nutrient cycling in the rhizosphere. This research highlights the critical role of root exudation in regulating soil nutrient dynamics and has broader implications for forest management.

How to cite: Kusumarini, N., Lynch, I., Cox, L., and Ullah, S.: Nitrogen transformation mediated by artificial root exudates derived from young alder and English oak trees, EGU General Assembly 2025, Vienna, Austria, 27 Apr–2 May 2025, EGU25-9733, https://doi.org/10.5194/egusphere-egu25-9733, 2025.

EGU25-9997 | ECS | Orals | BG1.3

Trade-off analysis of conventional and organic crop rotations under current and future climate scenarios in Finland 

Roberta Calone, Elena Valkama, Marco Acutis, Alessia Perego, Marco Botta, and Simone Bregaglio

Maintaining agricultural productivity while reducing soil organic carbon (SOC) loss, greenhouse gas emissions and groundwater contamination is a major challenge for European agriculture. Organic farming practices are expected to improve soil health and have increased their share of European cropland, but their effects on soil biogeochemical properties, biodiversity and nitrogen dynamics are mixed. This study uses the process-based ARMOSA crop model to assess the impact of conventional and organic farming practices on yield, SOC stock, nitrate (NO3) leaching, and nitrous oxide (N2O) emissions in both crop and livestock farms.

The research was carried out using simulations under current and projected future climate conditions in the South Savo region of Finland, which is characterised by a subarctic climate (Köppen-Geiger classification). The soil type was loamy sand (sand 76%, clay 4%, silt 20%) with a SOC content of 3.5%, a carbon-to-nitrogen ratio of 17, and a pH of 6.2 in the top 30 cm of the soil.

Five-year crop rotations that reflect prevalent practices in the area were designed for both crop and livestock production systems. Crop production rotations included cereals (with fodder peas in organic management), oilseed rape, and grass. Livestock farm rotations featured two years of cereals followed by a three-year fescue and timothy meadow (including clover in organic management). Nine scenarios were simulated to explore residue management and fertilisation strategies. Conventional systems used mineral fertilisers alone or combined with slurry. Organic systems used slurry, green manure, and a commercial organic fertiliser.

To evaluate the productivity and the environmental impact of these rotations, a fuzzy logic-based trade-off analysis was employed for each climate scenario. This analysis quantifies the trade-offs between crop yield, N2O emissions, NO3 leaching, and SOC stock changes. The result is a composite index known as the ∑ommit index. This index rates these trade-offs on a scale from 0 (poor) to 1 (excellent).  To accommodate diverse evaluation criteria, alternative versions of this trade-off analysis were implemented. Each version varies the weightings assigned to the trade-off components to mirror the perspectives and priorities of different representative stakeholder categories.

Using the ∑ommit index to evaluate a five-year rotation, rather than analysing individual cropping cycles, offers a significant advantage. This approach takes into account the interconnected effects of each cycle and its interactions with preceding and subsequent cycles. By considering these cumulative effects, the index provides a more comprehensive view of the trade-off dynamics during crop transitions. This holistic perspective is essential for making informed decisions about sustainable farming practices and long-term crop rotation strategies.

How to cite: Calone, R., Valkama, E., Acutis, M., Perego, A., Botta, M., and Bregaglio, S.: Trade-off analysis of conventional and organic crop rotations under current and future climate scenarios in Finland, EGU General Assembly 2025, Vienna, Austria, 27 Apr–2 May 2025, EGU25-9997, https://doi.org/10.5194/egusphere-egu25-9997, 2025.

EGU25-10246 | ECS | Orals | BG1.3

Global net cooling effects of anthropogenic reactive nitrogen: the unneglectable roles of short-lived nitrogen components 

Cheng Gong, Hanqin Tian, Hong Liao, Sian Kou-Giesbrecht, Nicolas Vuichard, Yan Wang, and Sönke Zaehle and the NMIP2 contributors

Anthropogenic activities have substantially enhanced the loadings of reactive nitrogen (Nr) in the Earth system since pre-industrial times, contributing to widespread eutrophication and air pollution. Increased Nr can also influence global climate through a variety of effects on atmospheric and land processes but the cumulative net climate effect is yet to be unravelled. Here we show that anthropogenic Nr causes a net negative direct radiative forcing of −0.34 [−0.20, −0.50] W m−2 in the year 2019 relative to the year 1850. This net cooling effect is not only as a result of the increased terrestrial carbon sequestration, but also led by short-lived Nr components and the associated atmospheric chemical reactions, including increased aerosol loading and reduced methane lifetime induced by nitrogen oxide (NOx). Such cooling effect is not offset by the warming effects of enhanced atmospheric nitrous oxide (N2O) and ozone (O3). However, despite the significant climate impacts of the short-lived nitrogen components, in particular, NOx, the associated soil biogeochemical processes remain poorly constrained, thus leading to varied responses to N fertilizer application as well as the estimates of global soil emissions among different approaches. Our results highlight the urgent necessities to integrate knowledge between atmospheric chemistry and soil biogeochemistry to improve the understanding of the Nr climatic effects.

How to cite: Gong, C., Tian, H., Liao, H., Kou-Giesbrecht, S., Vuichard, N., Wang, Y., and Zaehle, S. and the NMIP2 contributors: Global net cooling effects of anthropogenic reactive nitrogen: the unneglectable roles of short-lived nitrogen components, EGU General Assembly 2025, Vienna, Austria, 27 Apr–2 May 2025, EGU25-10246, https://doi.org/10.5194/egusphere-egu25-10246, 2025.

EGU25-10603 | ECS | Orals | BG1.3

Landscape fluxes and dry deposition velocity of ammonia near a cattle feedlot using flux gradient approach 

Qingmei Wang, Thomas K. Flesch, and Deli Chen

Concentrated animal feeding operations (CAFOs) are emission hotspots of ammonia (NH3). The NH3 emitted from these hotspots can be locally recaptured by the surrounding vegetation, mainly due to dry deposition. This deposition can either have beneficial fertilizing effects for N-limited ecosystems or pose adverse impacts on sensitive ecosystems. However, there is a lack of direct measurements of NH3 deposition near hotspots. We conducted two field campaigns to investigate the landscape NH3 fluxes over the barley (winter), lentil (winter), and fallow (summer) fields adjacent to an intensive beef cattle feedlot in southeast Australia. The flux measurements were segregated into periods when the measurement location was upwind of the feedlot or downwind. Upwind of the feedlot, we observed upward fluxes (surface emissions) over the fallow and barley sites with daily means (± standard error) of 0.16 ± 0.02 and 0.007 ± 0.012 μg NH3 m-2 s-1, and downward fluxes (deposition) over the lentil site with a daily mean of -0.022 ± 0.007 μg NH3 m-2 s-1. These measurements indicated the NH3 compensation point for barley was approximately 6.2 μg m-3 (equivalent to the background atmospheric NH3 concentration), and the NH3 compensation point for lentils was lower than 3.4 μg m-3. Downwind of the feedlot, we observed downward fluxes at all sites with daily means of -0.57 ± 0.09 μg NH3 m-2 s-1 for the barley site, -1.26 ± 0.17 μg NH3 m-2 s-1 for the lentil site, and -0.58 ± 0.12 μg NH3 m-2 s-1 for the fallow site; the mean deposition velocities over the barley, lentil, and fallow sites were 0.74, 0.82 and 0.78 cm s-1. Based on the frequency of upwind and downwind periods, we estimate that the accumulated N inputs to the barley, lentil and fallow fields during each campaign were 4.5, 14.8 and 4.3 kg N ha-1, indicating that the deposition of NH3 emitted from the feedlot serves as a significant source of N input to its adjacent fields. Our study can provide valuable information on NH3 exchange between vegetation and atmosphere, and extend our understanding of the fate of NH3 emitted from hotspots.

How to cite: Wang, Q., Flesch, T. K., and Chen, D.: Landscape fluxes and dry deposition velocity of ammonia near a cattle feedlot using flux gradient approach, EGU General Assembly 2025, Vienna, Austria, 27 Apr–2 May 2025, EGU25-10603, https://doi.org/10.5194/egusphere-egu25-10603, 2025.

EGU25-11361 | Posters on site | BG1.3

Standardization of a resistance model for the calculation of nitrogen deposition in the updated German standard VDI 3782-5 

Ulf Janicke, Sabine Banzhaf, Christian Brümmer, Thomas Gauger, Thomas Krämerkämper, Helmut Lorentz, Klaus Maßmeyer, Karsten Mohr, Alexander Moravek, Wolfgang J. Müller, Joachim Namyslo, Julia Nickel, Andreas Prüeß, Beat Rihm, Martijn Schaap, Andreas Schmitz, Andreas Tilgner, and Alfred Trukenmüller

The German standard VDI 3782-5 "Deposition Parameters" (German/English, www.vdi.de) provides deposition velocities and washout rates for various gaseous substances and particles. It is applied in local and mesoscale dispersion modelling, for example in the context of the German regulation on Air Quality Control (TA Luft). The current version of the standard dates from 2006. It is based on findings from a limited number of studies that led to the implementation of relatively simple descriptions and only rough estimates of atmospheric nitrogen deposition. The standard is currently undergoing a rigorous scientific revision by the authors on behalf of the VDI.

The updated standard will specify, among others, a model for the calculation of surface resistances, including compensation points for NH3. The model is based on DEPAC (RIVM, Netherlands) and implemented in Java program (JDepac). JDepac allows parameter variations and time series calculations. Input parameters include date and time, geographical location, land use, meteorological data and, for NH3, information on current and past loads. Default options are provided for missing input. Output quantities are, among others, resistances, deposition velocities, and deposition fluxes of NH3, NO, NO2, HNO3, SO2, O3, Hg and particles.

JDepac is compared to various deposition measurements and results from mesoscale models. For NH3, effects of the compensation point on the resulting deposition velocities are investigated. JDepac is used to calculate temporal averages of deposition velocities for different land use classes. In combination with dispersion calculations, effective deposition velocities are derived from the calculated deposition fluxes and concentrations. These simpler parameters are straightforward to apply in local dispersion modelling. JDepac itself allows more sophisticated calculations and can be coupled to dispersion and chemical transport models.

The updated standard VDI 3782-5 and its OpenSource tool JDepac are intended to serve as a state-of-the art, practical, and transparent reference for both local and mesoscale calculations of nitrogen deposition. In addition, the standard contains descriptions for the calculation of deposition velocities and washout rates of particles, the calculation of deposition probabilities for Lagrangian particle models, and the effects of drop displacement in wet deposition.

The updated standard is expected to serve as a useful tool for example in the decision process of facility planning and its licensing procedure conducted by local authorities, which is especially critical for the impact assessment on ecosystems under the EU Habitats Directive. In addition, the updated standard is expected to support the harmonization of air pollution modelling within the implementation of the new (2024) EU Ambient Air Quality Directive.

How to cite: Janicke, U., Banzhaf, S., Brümmer, C., Gauger, T., Krämerkämper, T., Lorentz, H., Maßmeyer, K., Mohr, K., Moravek, A., Müller, W. J., Namyslo, J., Nickel, J., Prüeß, A., Rihm, B., Schaap, M., Schmitz, A., Tilgner, A., and Trukenmüller, A.: Standardization of a resistance model for the calculation of nitrogen deposition in the updated German standard VDI 3782-5, EGU General Assembly 2025, Vienna, Austria, 27 Apr–2 May 2025, EGU25-11361, https://doi.org/10.5194/egusphere-egu25-11361, 2025.

EGU25-11640 | ECS | Posters on site | BG1.3

Rhizobia inoculation to mitigate nitrous oxide (N2O) emissions from UK grasslands and herbal leys under intercropping systems. 

Katie Weir, Christopher Williamson, Tom Williams, and Fotis Sgouridis

N2O is a potent greenhouse gas, with ~300 times the warming potential of carbon dioxide.  The current trajectory for N2O emissions follows the highest warming RCP8.5 scenario, with agriculture accounting for ~70% of global emissions.  As demand for food and livestock feed is expected to increase, mitigation measures which reduce agricultural N2O emissions and simultaneously increase nitrogen use efficiency (NUE) are urgently required to limit warming below the 2°C target set by the Paris Agreement.

The promotion of biological nitrogen fixation (BNF) in crop and forage systems via the incorporation of legumes has been advocated as a N2O mitigation strategy because it reduces synthetic N fertiliser application and increases NUE.  However, novel strategies suggest that in addition to BNF, manipulation of the soil microbiota could hold the key to N2O mitigation.  Soybean studies have successfully identified strains of symbiotic N-fixing rhizobia which can reduce N2O because they possess the gene encoding for nitrous oxide reductase (nosZ).  The potential of N2O-reducing (NosZ+) rhizobia inoculums could therefore be critical to agricultural N2O emission mitigation; however, few studies have explored other legume-rhizobia associations for NosZ+ strains.  Most notable is the complete lack of research on permanent grassland ecosystems, which cover 40% of global land surface and account for 54% of global N2O emissions.

This study aims to investigate the potential of clover-rhizobia associations to mitigate N2O emissions from UK grasslands and herbal leys under intercropping systems.  Soils from five different land uses were sampled from FarmED (agroecology demonstration farm) and Pudlicote Farm in the Cotswolds, UK: unfertilised permanent pasture, unfertilised clover/grass sward, herbal ley (1st and 5th year) and conventionally farmed winter wheat.  Native rhizobia present in the soil samples were selected by the growth and nodulation of Red Clover (Trifolium pratense) plants.  Rhizobia extracted from the harvested root nodules were cultured on yeast mannitol agar to isolate individual strains.  Strains then underwent gDNA extraction and whole-genome sequencing using the Illumina NovoSeq X platform to determine the presence of the nosZ gene.  Biogeochemical analysis of the soils was related to the presence/absence of the nosZ gene to infer potential genotype environmental controls.

Finally, identified NosZ+ strains will undergo a phenotype assessment using a soil-plant-atmosphere mesocosm experiment, whereby N2O emissions from clover plants inoculated with NosZ+ strains will be monitored. Control strains; Rhizobium leguminosarum bv.trifolii T117 (nosZ+) and T132 (nosZ-) were obtained from the MIAE collection (INRAE, France) and will be tested alongside Bradyrhizobium diazoefficiens G49 (nosZ+) (soybean specific strain) and the identified native strains. The overall aim of the study is to create a rhizobia inoculum able to reduce N2O emissions when included in the intercropping sequence of leys and pastures, thus contributing to Net Zero global strategies.

How to cite: Weir, K., Williamson, C., Williams, T., and Sgouridis, F.: Rhizobia inoculation to mitigate nitrous oxide (N2O) emissions from UK grasslands and herbal leys under intercropping systems., EGU General Assembly 2025, Vienna, Austria, 27 Apr–2 May 2025, EGU25-11640, https://doi.org/10.5194/egusphere-egu25-11640, 2025.

EGU25-11830 | ECS | Orals | BG1.3

The role of tree pollen in forest nitrogen cycling: A laboratory perspective 

Ivan Limić, Samuel Bodé, Pascal Boeckx, Marijn Bauters, Johan Neirynck, Nicolas Bruffaerts, Stribor Marković, Elena Gottardini, and Arne Verstraeten

Pollen is a critical component of the nitrogen (N) cycle in forests, but its role in N uptake, release and transformation during precipitation events remains poorly understood, contributing to uncertainties in N deposition estimates. In the frame of the COST Action CLEANFOREST a laboratory experiment was conducted to assess the biochemical activity of tree pollen and its effects on N compounds in precipitation. Pollen from green alder (Alnus viridis), pedunculate oak (Quercus robur), European beech (Fagus sylvatica), silver birch (Betula pendula), Scots pine (Pinus sylvestris) and Norway spruce (Picea abies) was suspended in a synthetic nitrate (NO₃-) solution isotopically labelled with ¹⁵N under non-sterilized conditions and two sterilization treatments: addition of (i) thymol and (ii) a broad-spectrum antibiotic mixture (PSA) containing penicillin, streptomycin, and amphotericin B. Over one week, water samples were analysed daily for NO₃-, nitrite (NO₂-), ammonium (NH₄⁺) and total dissolved nitrogen (TDN) from which dissolved organic nitrogen (DON) was calculated. The results showed significant NO₃- removal from the solution in broadleaved species, particularly oak, beech, and alder, in all treatments, but most clearly in the non-sterilized treatment. Most species showed a significant decrease in DON during the first two-three days, in all treatments, but especially in the sterilized (PSA) treatment, which was subsequently converted into NH₄⁺ (mineralization). The use of 15N as a tracer clearly shows that the labelled N was actively taken up by the pollen in both the non-sterilized and PSA-treated samples. Notably, pollen from all tree species, predominantly the broadleaves, enzymatically transformed extracellular NO₃- into NO₂-, highlighting its active role in the N cycle. These findings offer valuable insights into N release, uptake, and transformation during precipitation events and reveal important interactions between pollen and microorganisms. The differences observed between sterilized and non-sterilized treatments underline the significant influence of microbial activity on N conversion. By expanding our understanding of canopy-level N processes, this research contributes to improving N deposition models and introduces innovative approaches to studying the forest N cycle. Further studies are essential to clarify the mechanisms by which pollen and microbial communities influence N transformations at ecosystem scales.

Keywords: Broadleaves; Conifers; Pollen; ¹⁵N; Ammonium; Nitrate; Nitrite

How to cite: Limić, I., Bodé, S., Boeckx, P., Bauters, M., Neirynck, J., Bruffaerts, N., Marković, S., Gottardini, E., and Verstraeten, A.: The role of tree pollen in forest nitrogen cycling: A laboratory perspective, EGU General Assembly 2025, Vienna, Austria, 27 Apr–2 May 2025, EGU25-11830, https://doi.org/10.5194/egusphere-egu25-11830, 2025.

Global changes caused by anthropogenic activities are altering the cycling of nitrogen (N) in terrestrial ecosystems. For example, droughts of increasing frequency and severity can stimulate large emission pulses of nitrous oxide (N2O; a powerful greenhouse gas) when dry soils wet up. Further, increased fire frequency can favor the colonization of novel pyrophilous or “fire-loving” fungi on soils with the capacity to produce N2O, yet N2O isotopic ranges have been characterized in few fungal species, making generalizations difficult. To better understand how global changes are altering the N cycle, we studied drylands in southern California that can experience >6 months without rain, burned experimental “pyrocosms” to assess impacts of fire severity on soil biogeochemistry, and used a culture collection of pyrophilous fungi isolated from wildfire-burned soils to characterize their δ15N2Obulk,δN218Obulk, and δ15N2OSP values. Despite the hot and dry conditions known to hinder denitrification, isotope tracers and natural abundance isotopologues of N2O indicated NO3- was reduced within 15 minutes of wetting dry desert soils and that N2O reduction to N2 occurred. In post-fire environments, we found that while N2O isotope values for Neurospora discreta and Fusarium tricinctum closely matched literature values when grown with NO2-, Aspergillus fumigatus, Coniochaeta hoffmannii, Holtermaniella festucosa, and R. columbienses did not. Further, Fusarium sp. δ15N2Obulk and δN218Obulk values fell outside literature-derived values when grown with NO3-. Overall, we find that despite the hot and dry conditions known to make denitrification thermodynamically unfavorable in many drylands, denitrifiers can endure through hot and dry summers and are key to producing the surprisingly large N2O emissions when dry desert soils wet up. Further, we find that novel pyrophilous fungi present an opportunity to further characterize the isotopic composition of N2O as well as the factors controlling fungal denitrification as ecosystems are impacted by global changes.

How to cite: Homyak, P.: Drought, wildfires, and “fire-loving” fungi effects on ecosystem nitrogen cycling: Understanding global change effects on denitrification using N2O isotopologues, EGU General Assembly 2025, Vienna, Austria, 27 Apr–2 May 2025, EGU25-12451, https://doi.org/10.5194/egusphere-egu25-12451, 2025.

EGU25-12860 | Orals | BG1.3

Impact of wet nitrogen deposition on soil nitrogen emissions in West African ecosystems 

Claire Delon, Corinne Galy-Lacaux, Dominique Serça, Money Ossohou, Moussa Zouré, Sébastien Barot, Xavier Le Roux, Ousmane Ndiaye, Silué Siélé, Adjon Kouassi, Eric Gardrat, Maria Dias-Alves, and Océane Lenoir

Human activities such as fertilization of agricultural lands and human-induced biomass burning strongly impact nitrogen (N) dynamics and losses, with many consequences on the environment. The quantification of N budgets (N inputs and outputs) between the surface and the atmosphere is a prerequisite to understand the N biogeochemical cycle, i.e. how N is transferred from the atmosphere to the biosphere, through the soil and back to the atmosphere from surface emissions. Sub Saharan Africa (SSA) is characterized by an increase in demography, with strong impacts on biodiversity, and on the sustainability of human activities including agriculture. In Africa, the increase in demography and the associated increased fertilizer inputs (to supply growing food and energy demands) will lead to increased emissions from amended soils, which will in turn increase atmospheric N deposition and induce feedbacks to the ecosystems and the atmosphere.

In this context, the NitroAfrica project (2023-2026) is designed to study the impact of N wet deposition on the soil – plant – atmosphere continuum. We make the hypothesis that changes of wet N deposition in West African ecosystems over the 21th centuries will induce important changes in biogenic emissions from the ecosystems to the atmosphere with impacts on regional atmospheric chemistry and further N deposition. Indeed, increasing trends of N wet deposition has already been observed, especially in the NH4+ form. Three ecoclimatic zones in West Africa are studied, in Guinean (Lamto, Côte d’Ivoire), Sudanese (Korhogo, Côte d’Ivoire) and Sahelian (Dahra, Senegal) zones, where solutions with different NH4+/NO3- partition are used to mimic the increase in N wet deposition.

Results on N (N2O, NO) and CO2 emissions from soils from plots amended with solutions as well as control plots will be presented. N wet deposition fluxes from recent years will also be presented within the context of existing long-term studies on N wet deposition. This comparison is particularly relevant for the Lamto station where the International Network to study Deposition and Atmospheric chemistry in Africa (INDAAF) is based and provides long-term data since 1995.

This study contributes to fill in the lack of studies in SSA, and to understand the processes involved in N emissions and deposition in tropical regions.

How to cite: Delon, C., Galy-Lacaux, C., Serça, D., Ossohou, M., Zouré, M., Barot, S., Le Roux, X., Ndiaye, O., Siélé, S., Kouassi, A., Gardrat, E., Dias-Alves, M., and Lenoir, O.: Impact of wet nitrogen deposition on soil nitrogen emissions in West African ecosystems, EGU General Assembly 2025, Vienna, Austria, 27 Apr–2 May 2025, EGU25-12860, https://doi.org/10.5194/egusphere-egu25-12860, 2025.

EGU25-14072 | Orals | BG1.3

Hotspots and hot moments of DNRA in the Vadose Zone of Agricultural Croplands  

Jun Shan, Xiaomin Wang, and Xiaoyuan Yan

High nitrogen (N) input in intensive cropping systems has resulted in significant nitrate (NO₃⁻) accumulation in agricultural soils of China. However, despite substantial N input (500-600 kg ha-1 y-1) in the Taihu Lake region, NO₃⁻ accumulation in soils and groundwater therein remains minimal with the mechanisms behind are unclear. Here, we investigated the spatiotemporal distribution and activity of dissimilatory nitrate reduction to ammonium (DNRA), anaerobic ammonium oxidation (anammox), and denitrification, and the associated microbial communities—in the vadose zones of rice-wheat, vegetable, and orchard fields of the Taihu Lake region. Results revealed NO₃⁻ content decreased progressively with soil depth, while NH₄⁺ levels increased, particularly in deeper soil layers. DNRA emerged as the primary pathway for NO₃⁻ reduction, contributing to over 50% of NO₃⁻ removal, especially in the 50–190 cm depth range. Seasonal variations indicated that DNRA activity was highest during spring and autumn, with lower rates observed in winter and summer. DNRA significantly contributed to NH₄⁺ accumulation, with rates strongly positively correlated with NH₄⁺ content, especially in rice-wheat rotation fields characterized by high OC/ NO₃⁻ ratios. Interestingly, DNRA rates were significantly negatively correlated with groundwater N₂O concentrations and the N₂O/(N₂ + N₂O) ratios. Microbial community analysis revealed that the nrfA gene, a marker for DNRA, exhibited higher diversity compared to genes related to denitrification. Additionally, the abundance of DNRA-specialist microbes was positively associated with DNRA rates, particularly in deep layer soils, emphasizing the role of microbial community composition in shaping DNRA activity. These findings demonstrate that DNRA plays a crucial role in facilitating NH₄⁺ accumulation, attenuating NO₃⁻ accumulation, and mitigating N₂O emission in the vadose zone of agricultural croplands in the Taihu Lake region.

How to cite: Shan, J., Wang, X., and Yan, X.: Hotspots and hot moments of DNRA in the Vadose Zone of Agricultural Croplands , EGU General Assembly 2025, Vienna, Austria, 27 Apr–2 May 2025, EGU25-14072, https://doi.org/10.5194/egusphere-egu25-14072, 2025.

EGU25-14338 | ECS | Posters on site | BG1.3

Estimating the Tipping Point between N2O Emissions and C Sequestration in Soil using the DNDC v. CAN Model 

Meng Kong, Huan Liu, Diego Abalos, Brian B. Grant, Ward N. Smith, Azhar Zhartybayeva, Johannes L. Jensen, Jørgen Eriksen, and Christian Dold

Increasing the grassland proportion in the crop rotation has been considered as an effective approach to sequester carbon (C) in the soil. However, its climate mitigation benefits may be overestimated because the associated impact of long-term C sequestration on nitrous oxide (N2O) emissions remains uncertain. Mechanistic models, such as the DeNitrification and DeComposition model (DNDC v. CAN 9.5.0), are used to simulate changes in soil organic carbon (SOC) and N2O emissions. This provides the opportunity to estimate future emission trends and to enhance our understanding of the interactions between SOC and N2O emissions under different levels of grass/clover proportion in arable crop rotations. We hypothesize that increases in N2O emissions will offset the benefits from the increased SOC over time. The objectives of this study are to (1) calibrate and validate the DNDC model, and (2) estimate and predict the potential tipping point at which the negative climate forcing of N2O emissions offsets the benefits of C sequestration over long-term timescales. For this, we used long-term measurements of biomass, SOC, and N2O emissions from two crop rotations with either two or four years of grass-clover in a six-year rotation in Denmark. Preliminary results showed that the DNDC model simulated crop biomass production with fair to high accuracy as indicated by an index of agreement (d) of 0.98, a Nash-Sutcliffe efficiency (NSE) of 1, and a normalized root mean square error (nRMSE) of less than 30%. The simulated biomass was slightly underestimated as shown by a negative mean bias error (MBE). Conversely, the simulations for N2O fluxes and SOC exhibited poorer agreement, with d-values below 0.7 and nRMSE exceeding 30%. These findings suggest that while the DNDC model effectively predicts crop growth, including annual crops and grass/clover ley, its ability to simulate SOC and N2O fluxes requires substantial improvement. Our future efforts will focus on refining and optimizing model parameters for SOC and N2O, with an emphasis on calibration to enhance the model performance and the capacity to predict management-induced long-term dynamics under future climate scenarios. Results of these updated model simulations will be shown at the conference.

How to cite: Kong, M., Liu, H., Abalos, D., Grant, B. B., Smith, W. N., Zhartybayeva, A., Jensen, J. L., Eriksen, J., and Dold, C.: Estimating the Tipping Point between N2O Emissions and C Sequestration in Soil using the DNDC v. CAN Model, EGU General Assembly 2025, Vienna, Austria, 27 Apr–2 May 2025, EGU25-14338, https://doi.org/10.5194/egusphere-egu25-14338, 2025.

Atmospheric nitrogen (N) deposition is a significant driver of global change and disrupts the carbon and nitrogen cycles in ecosystems. Volatile Organic Compounds (VOCs) emitted by plants play an important role in regional air quality and the carbon cycle. This study investigates the effects of different forms and doses of N deposition on Biogenic Volatile Organic Compounds (BVOCs) emissions, photosynthesis, growth, and non-structural carbohydrate (NSC) accumulation in the widespread subtropical bamboo species-Moso bamboo (Phyllostachys edulis). A pot experiment was conducted with three N doses: 100 kg(N)·hm⁻²·a⁻¹ (L1), 200 kg(N)·hm⁻²·a⁻¹ (L2), and 0 kg(N)·hm⁻²·a⁻¹ (L0), using ammonium N (AN), nitrate N (NN), and a mixed N form (AN+NN). Dynamic headspace sampling was used to assess the effects of N deposition on BVOC emissions and the relationships between N deposition, photosynthesis, plant growth, and NSC distribution throughout the growing season.

The results indicated that N deposition increased BVOC emissions, with the highest emissions occurring under NN treatment at L1 during March and June. Isoprene (ISO) emissions were significantly enhanced under AN treatment, with L2 doses increasing ISO emissions by 99.20% compared to L1. The AN+NN treatment resulted in higher ISO emissions at L2, with increases of 76.02% and 141.69% compared to AN and NN alone, respectively. N form and dose also influenced photosynthetic pigments, with the highest total chlorophyll content observed under AN+NN at L1. Photosynthetic parameters, including net photosynthetic rate (Pn), stomatal conductance (Gs), and carboxylation efficiency (CE), were significantly higher under L1 compared to L0. A positive correlation was found between chlorophyll content and VOC emissions, with Pn, Gs, and CE strongly correlating with ISO emissions. Growth responses varied by N form. AN+NN treatment significantly promoted the growth of Phyllostachys edulis, particularly in above-ground biomass, while AN inhibited root and whip growth. Biomass of leaves and culms was significantly higher under L1 treatment, with increases of 85.60% and 38.14%, respectively, compared to L0 under AN treatment. Soluble sugar content in leaves, culms, and roots was highest at L1, with decreases observed as the N dose increased. Soluble sugars in leaves, culms, and buds increased by 24.85%, 24.92%, and 21.20% under L1 compared to L0. Starch content in leaves and culms increased initially but declined under higher N doses. AN and NN treatments at L2 reduced starch content in leaves and culms, with significant reductions observed in both N forms.

NSC content was positively correlated with ISO emissions, especially for soluble sugars. Total NSC content and soluble sugars were also positively correlated with BVOC emissions, suggesting that NSCs play a key role in plant responses to environmental stress. In conclusion, N deposition—particularly in mixed forms (AN+NN)—enhances BVOC emissions, especially ISO emissions, promotes biomass accumulation, and improves photosynthetic capacity. Lower N doses support higher ISO emissions and NSC accumulation. This study highlights that appropriate levels of N deposition can support bamboo growth and improve resilience to atmospheric changes.

How to cite: Li, L., Jiang, M., and Wang, X.: Effects of nitrogen deposition on VOCs emission and its relationship with photosynthesis, growth, accumulation and distribution of NSC in Moso bamboo tree (Phyllostachys edulis) , EGU General Assembly 2025, Vienna, Austria, 27 Apr–2 May 2025, EGU25-14982, https://doi.org/10.5194/egusphere-egu25-14982, 2025.

EGU25-15249 | ECS | Posters on site | BG1.3 | Highlight

Changing patterns of global nitrogen deposition driven by socio-economic development 

Jianxing Zhu, Guirui Yu, and Qiufeng Wang

Advances in manufacturing and trade have reshaped global nitrogen deposition patterns, yet their dynamics and drivers remain unclear. Here, we compile a comprehensive global nitrogen deposition database spanning 1977–2021, aggregating 52,671 site-years of data from observation networks and published articles. This database show that global nitrogen deposition to land is 92.7 Tg N in 2020. Total nitrogen deposition increases initially, stabilizing after peaking in 2015. Developing countries at low and middle latitudes emerge as new hotspots. The gross domestic product per capita is found to be highly and non-linearly correlated with global nitrogen depositiondynamic evolution, and reduced nitrogen deposition peaks higher and earlier than oxidized nitrogen deposition. Our findings underscore the need for policies that align agricultural and industrial progress to facilitate the peak shift or reduction of nitrogen deposition in developing countries and to strengthen measures to address NH3 emission hotspots in developed countries.

How to cite: Zhu, J., Yu, G., and Wang, Q.: Changing patterns of global nitrogen deposition driven by socio-economic development, EGU General Assembly 2025, Vienna, Austria, 27 Apr–2 May 2025, EGU25-15249, https://doi.org/10.5194/egusphere-egu25-15249, 2025.

EGU25-15354 | ECS | Orals | BG1.3

The effect of drought and rewetting on nitrogen cycling and nitrous oxide emissions in a controlled experiment with different cover crop species 

Pauliina Turunen, Anne Viinikainen, Markku Koskinen, Asko Simojoki, Kristiina Karhu, and Mari Pihlatie

Cover crops are recognized as a climate-smart agricultural practice that increases soil organic carbon content (SOC). As carbon (C) and nitrogen (N) cycles are coupled, an increase in SOC can impact the N cycle and nitrous oxide (N2O) emissions. Another major driver affecting N cycling and N2O emissions is soil moisture. With the increasing risk of summer droughts and wetter conditions during the off-season in Northern Europe, it is important to understand how drying-wetting and agricultural practices together affect N cycling and N2O emissions.

To address this knowledge gap, we conducted a pot experiment with clay soil in controlled greenhouse conditions simulating summer drought with bare soil pots and oats sown either alone, with Italian ryegrass, or with alfalfa as plant treatments. The pots were initially watered to 70% degree of saturation to ensure that the plants start to grow, after which half the pots were let dry to 40% degree of saturation. The plants were grown for 36 days. At the end of the growth period, soil N2O emissions were measured over three days. Following this, the pots were sampled destructively, and total N in plants, roots, and soil, as well as mineral N in soil, were analysed. Additionally, a follow-up pool-dilution incubation experiment using 15N-labelling with bare soil and soil previously covered with oats was conducted to study the effect of moisture content and rewetting on gross N transformation rates.

Contrary to our expectations, the results from the pot experiment showed that N2O emissions in the plant treatments were higher in drought conditions than in moist conditions. This does not support our results from a cover crop field trial where reduced rainfall did not affect N2O emissions during the growing season. However, during off-season reduced rainfall in the field led to higher N2O emissions. Preliminary results from the incubation indicated lower N2O emissions under drought conditions, with increased emissions upon rewetting and the highest emissions under moist conditions. The presence of plants decreased soil N2O emissions in both experiments, but the plant species did not affect the emissions nor the total mineral N content in soil. As expected, in the pot experiment, total mineral N content in soil was higher in drought conditions than in moist soil as well as in bare soil compared with soil with growing plants. Results on the effects of drought and plants on gross N transformations during the incubation experiment with 15N labelling will be presented later.

How to cite: Turunen, P., Viinikainen, A., Koskinen, M., Simojoki, A., Karhu, K., and Pihlatie, M.: The effect of drought and rewetting on nitrogen cycling and nitrous oxide emissions in a controlled experiment with different cover crop species, EGU General Assembly 2025, Vienna, Austria, 27 Apr–2 May 2025, EGU25-15354, https://doi.org/10.5194/egusphere-egu25-15354, 2025.

EGU25-15383 | Orals | BG1.3

Mechanisms of soil emissions of NO and HONO produced by ammonia-oxidizing bacteria during drying 

Bettina Weber, Stefanie Maier, Jens Weber, Diego Leiva, Min Zhou, Xiaoyong Qian, Ulrich Pöschl, Yafang Cheng, Hang Su, and Minsu Kim

Nitric oxide (NO) and nitrous acid (HONO) are important reactive atmospheric trace gases. As part of the nitrogen (N) cycle, ammonia oxidizing nitrifiers in soils are recognized as key producers of these gases, impacting near-surface nitrogen oxide (NOx = NO + NO2) and ozone (O3) concentrations. The nitrification process results in the production of nitrite (NO2-), subsequently protonated in the liquid phase to form HONO, and NO, which are both emitted as gases. However, there is limited understanding of the coupled processes causing the simultaneous emission NO and HONO from drying soils incorporating ammonia oxidizing nitrifiers. Here, we combined experimental in-vitro studies of ammonia-oxidizing bacteria with a mechanistic modelling approach to investigate the mechanisms triggering gaseous NO and HONO emissions. We found out that several abiotic processes, such as NO auto-oxidation, Fe2+ catalysis, and soil moisture dynamics crucially influence the overall emission as well as the partitioning of reactive N. This, in turn, impacts the hydroxyl radical (OH) budget and soil N retention. Modelling allowed us to elucidate the interactions between biological and environmental processes under varying soil hydration conditions for different field scenarios, such as the effects of fertilization. This analysis suggests potential strategies for effectively managing the release of soil-derived NOx and OH emissions.

How to cite: Weber, B., Maier, S., Weber, J., Leiva, D., Zhou, M., Qian, X., Pöschl, U., Cheng, Y., Su, H., and Kim, M.: Mechanisms of soil emissions of NO and HONO produced by ammonia-oxidizing bacteria during drying, EGU General Assembly 2025, Vienna, Austria, 27 Apr–2 May 2025, EGU25-15383, https://doi.org/10.5194/egusphere-egu25-15383, 2025.

EGU25-15466 | Posters on site | BG1.3

Cover crop diversity and summer drought increase off-season N2O emissions from Finnish agricultural soil  

Mari Pihlatie, Pauliina Turunen, Markku Koskinen, Asko Simojoki, Anne Viinikainen, Osmo Virta, and Jussi Heinonsalo

The use of cover crops in agriculture is one of the climate-smart practices that have multiple benefits, such as increasing SOC, reducing N losses, and increasing biodiversity. Still the question whether cover crops and their diversity increase resilience against drought, and how the combined effects of cover crops, their diversity and drought affect N2O emissions, remain largely unknown. We study the combined effects of cover crop diversity and drought on cropland (oat) greenhouse gas emissions and belowground C and N processes in a field plot trial. The effect of drought on soil and crop C and N dynamics and greenhouse gas (CO2, N2O) emissions is studied with rainout shelters that remove 50% of incoming precipitation. The CO2 and N2O emissions are measured with the manual dark chamber method twice a week during the growing season and once a week during off-season, soil temperature and water content are measured continuously, and soil is sampled for mineral N and total C and N analysis seasonally.

The preliminary results show that reduced rainfall decreases CO2 emissions but does not affect N2O emissions significantly during the growing season. During off-season, reduced rainfall increases both CO2, and particularly N2O emissions irrespective of cover crop diversity treatments. During growing season there is a tendency of higher N2O emissions from diverse cover crop treatments compared to oat only treatment, and during off-season, a higher cover crop diversity significantly increases N2O emissions. Overall and in all treatments, off-season N2O emissions dominate the annual N2O balance. Our results highlight the need to include off-season measurements to the annual N2O balance estimation, and when assessing the effects of cover crops and future climate change scenarios such as summer drought on annual N2O emissions.


How to cite: Pihlatie, M., Turunen, P., Koskinen, M., Simojoki, A., Viinikainen, A., Virta, O., and Heinonsalo, J.: Cover crop diversity and summer drought increase off-season N2O emissions from Finnish agricultural soil , EGU General Assembly 2025, Vienna, Austria, 27 Apr–2 May 2025, EGU25-15466, https://doi.org/10.5194/egusphere-egu25-15466, 2025.

EGU25-16227 | ECS | Orals | BG1.3

Phosphorus addition impacts on soil nitrogen dynamics in a subtropical plantation 

Huijun Ye, Huiying Lin, Muhammed Mustapha Ibrahim, Leiru Chen, Yang Liu, Roland Bol, and Enqing Hou

Human activities have globally increased atmospheric nitrogen (N) deposition, which has enhanced the risk of ecosystem N losses. Phosphorus (P), as a macroelement required for life, is closely linked to the biogeochemical cycle of N. Therefore, quantifying how soil N cycle responds to different P supply levels is important. Here we examined the responses of soil N dynamics to altered P supply using a P addition experiment (+0, +25, +50, +100 kg P ha−1 yr−1) in an evergreen broadleaf mixed plantation in subtropical China. We found that P addition led to a more open soil N cycle in the forest ecosystem. The primary source of N2O emissions in the study plots was fungal denitrification, which accounted for 41%-52% of the total N2O emissions, based on δ18O-N2O, δ15Nα-N2O, δ15Nbulk-N2O and SP measurements. Nitrogen loss by gas or water and N assimilation by plants were found to be coupled processes at +25 kg P ha−1 yr−1 addition level. The δ15N-NO3 and δ18O-NO3 values in runoff and leaching water from different depths were all depleted from −10‰ to +0‰ in the wet season. This result indicates that soil N has a short residence time and rapid NO3-N loss in the forest ecosystem, and with fewer nitrogen conversions according to the isotope fractionation theory. These observed varied responses of soil N transformation, gaseous loss, and liquid loss to different P supply levels provide new insights into our understanding of N-P relationships in broadleaf forest plantations.

How to cite: Ye, H., Lin, H., Ibrahim, M. M., Chen, L., Liu, Y., Bol, R., and Hou, E.: Phosphorus addition impacts on soil nitrogen dynamics in a subtropical plantation, EGU General Assembly 2025, Vienna, Austria, 27 Apr–2 May 2025, EGU25-16227, https://doi.org/10.5194/egusphere-egu25-16227, 2025.

EGU25-17098 | ECS | Posters on site | BG1.3

Microbial nitrogen cycling in wetland forests with varying management statuses across Europe 

Laura Kuusemets, Kaido Soosaar, Maarja Öpik, Mika Aurela, Aldis Butlers, Laura Escarmena, Jyrki Jauhiainen, Sari Juutinen, Rana Kanaan, Tuula Larmola, Andis Lazdiņš, Ülo Mander, José Miguel Sánchez Pérez, Sílvia Poblador, Francesc Sabater, Sabine Sauvage, Thomas Schindler, Liisa Ukonmaanaho, and Mikk Espenberg

Temperature and oxygen content in soil are the well-known drivers of macronutrient cycling, as they influence the overall conditions that regulate microbial metabolism. However, the more detailed underlying aspects affecting nutrient cycling remain insufficiently understood.

This study focuses on different wetland forest types across Europe, aiming to investigate N cycling processes, the spatial distribution of N cycling genes and the linkage with soil greenhouse gas (GHG) emissions and relevant environmental parameters. The study sites were located in Finland, Estonia, and Latvia in Northern Europe, as well as in France and Spain in Southern Europe. The Northern Europe sites consisted of drained peatlands with varying management statuses, while the Southern Europe ones were alluvial forests. Soil samples were collected from three depths (0-10, 10-20, 20-40 cm) in autumn 2023, analysed using quantitative polymerase chain reaction (qPCR), and sequenced to assess processes and communities. In all samples, soil physico-chemical parameters were also determined and simultaneously with soil sampling, in-situ GHG emission measurements were done all as a part of Horizon Europe ALFAwetlands project.  

Preliminary results of the quantification of N cycle genes revealed differences in the microbiome across wetland forest types in Europe. Ammonia-oxidizing archaea appeared to be the primary nitrifiers in the soils of the study sites, compared to ammonia-oxidizing bacteria. The alluvial forest soils revealed a higher genetic potential for the DNRA (Dissimilatory Nitrate Reduction to Ammonium) process in soil. The abundance of genes responsible for the comammox process—complete ammonia oxidation by a single microorganism—was also higher in the soils of the alluvial forests. In the rewetted peatland forest of Latvia, the soil exhibited a greater genetic potential for denitrification and DNRA processes compared to the drained peatland forests. The further analyses will be exploring the links between N cycle genes, GHG emissions, and soil physico-chemical properties.


How to cite: Kuusemets, L., Soosaar, K., Öpik, M., Aurela, M., Butlers, A., Escarmena, L., Jauhiainen, J., Juutinen, S., Kanaan, R., Larmola, T., Lazdiņš, A., Mander, Ü., Sánchez Pérez, J. M., Poblador, S., Sabater, F., Sauvage, S., Schindler, T., Ukonmaanaho, L., and Espenberg, M.: Microbial nitrogen cycling in wetland forests with varying management statuses across Europe, EGU General Assembly 2025, Vienna, Austria, 27 Apr–2 May 2025, EGU25-17098, https://doi.org/10.5194/egusphere-egu25-17098, 2025.

EGU25-17316 | Posters on site | BG1.3

The GreenEO Project: Satellite-Based Services to Support Sustainable Land Use Practices Under the European Green Deal 

Paul Hamer, Lise Marie Frohn, Camilla Geels, Jesper Christensen, Bruce Rolstad Denby, David Simpson, Nicholas Hutchings, Susana Lopez-Aparicio, Philipp Schneider, Tuan-Vu Cao, Isadora Jiminez, Thais Fontenelle, Ronald van der A, Bas Mijling, Jieying Ding, Isabel Trigo, Jean-Christophe Calvet, Joanne Schante, Thomas Judes, and Leonor Tarrason and the GreenEO Consortium

We present a new Horizon Europe project titled GreenEO (2025-2029) as well as findings based on advances in modelling within the Nordic Nature & Nitrogen (Nordic Council of Ministers, 2021-2024) and the SEEDS (Horizon 2020, 2021-2023) projects. The ambition of GreenEO is to support governance approaches for the implementation of EU’s Green Deal. The implementation of which will rely on accessible, actionable environmental data for policymaking and monitoring. Success will be dependent on the usage of the latest observational data as well as on the level of uptake of these data by end-users. GreenEO addresses this by using observations from the Sentinel and newest meteorological (MTG and Metop-SG) satellites, and through co-creation with users of high-resolution services and novel indicators to directly meet user needs.

GreenEO will specifically address the environmental impacts of nitrogen deposition and advance the state of knowledge on this topic within the context of supporting the EU’s Green Deal and its ambition for protecting biodiversity.

Current data on nitrogen emissions, deposition, and biodiversity impacts are inconsistent and lack sufficient spatial resolution. GreenEO will therefore try to advance the state of knowledge in three areas:

  • Using advanced satellite data, data assimilation, modeling, and ancillary data, GreenEO will estimate high-resolution nitrogen emissions (NH3, NOx). These high-resolution emissions will then be used in turn as a basis for modelling downstream impacts.
  • GreenEO will advance the state of the art for nitrogen deposition modelling using findings from previous projects (Nordic Nature & Nitrogen and SEEDS projects). A bi-directional flux parameterization (Wichink-Kruit et al., 2012) was added to three regional scale air quality models (DEHM, MATCH, and EMEP) within the Nordic Nature and Nitrogen project. The findings were that this approach did not lead to consistent improvements in ambient concentration and flux modelling without commensurate improvements in land cover and vegetation data. For instance, bi-directional fluxes were shown to be highly sensitive to leaf area index (LAI) due to the dominating pathway being through external leaf water. Work within the SEEDS project to derive improved estimates of LAI by combining satellite observations of LAI in a land surface model using data assimilation, will serve as a basis for improving estimates of the bi-directional depositional fluxes of reactive nitrogen.
  • GreenEO will combine these methods and data with regional scale air quality models (DEHM and EMEP) in order to model the distribution of nitrogen deposition with high accuracy. Specific attention will be paid to deposition within vulnerable habitats. Via this approach, GreenEO will improve the estimation of nitrogen deposition and critical load exceedances in vulnerable ecosystems. Collaborating with stakeholders, we will link these outputs to biodiversity indicators, like plant species richness and butterfly indices, to create a nitrogen sensitivity index. This will identify high-recovery areas and support sustainable agricultural practices.

Wichink Kruit, R. J., Schaap, M., Sauter, F. J., van Zanten, M. C., and van Pul, W. A. J.: Modeling the distribution of ammonia across Europe including bi-directional surface-atmosphere exchange, Biogeosciences, 9, 5261–5277, https://doi.org/10.5194/bg-9-5261-2012, 2012.

How to cite: Hamer, P., Frohn, L. M., Geels, C., Christensen, J., Denby, B. R., Simpson, D., Hutchings, N., Lopez-Aparicio, S., Schneider, P., Cao, T.-V., Jiminez, I., Fontenelle, T., van der A, R., Mijling, B., Ding, J., Trigo, I., Calvet, J.-C., Schante, J., Judes, T., and Tarrason, L. and the GreenEO Consortium: The GreenEO Project: Satellite-Based Services to Support Sustainable Land Use Practices Under the European Green Deal, EGU General Assembly 2025, Vienna, Austria, 27 Apr–2 May 2025, EGU25-17316, https://doi.org/10.5194/egusphere-egu25-17316, 2025.

EGU25-17830 | Orals | BG1.3

Increasing soil nitrous acid emissions driven by climate and fertilization change aggravate global ozone pollution 

Yanan Wang, Qinyi Li, Ivonne Treb, Yurun Wang, Chuanhua Ren, Alfonso Saiz-Lopez, Likun Xue, and Tao Wang

Soil microbial nitrous acid (HONO) production is an important source of atmospheric reactive nitrogen that affects air quality and climate. However, long-term global soil HONO emissions driven by climate change and fertilizer use have not been quantified. Here, we derive the global soil HONO emissions over the past four decades and evaluate their impacts on ozone (O3) and vegetation. Results show that climate change and the increased fertilizer use enhanced soil HONO emissions from 9.4 Tg N in 1980 to 11.5 Tg N in 2016.  Chemistry-climate model simulations show that soil HONO emissions increased global surface O3 mixing ratios by 2.5% (up to 29%) and vegetation risk to O3, with increasing impact during 1980s-2016 in low-anthropogenic-emission regions. With future decreasing anthropogenic emissions, the soil HONO impact on air quality and vegetation is expected to increase. We thus recommend consideration of soil HONO emissions in strategies for mitigating global air pollution.

How to cite: Wang, Y., Li, Q., Treb, I., Wang, Y., Ren, C., Saiz-Lopez, A., Xue, L., and Wang, T.: Increasing soil nitrous acid emissions driven by climate and fertilization change aggravate global ozone pollution, EGU General Assembly 2025, Vienna, Austria, 27 Apr–2 May 2025, EGU25-17830, https://doi.org/10.5194/egusphere-egu25-17830, 2025.

Reactive nitrogen (N) deposition presents significant environmental challenges in India, where approximately 24% of the land is forested and agriculture plays a vital role in the economy. As a major contributor from South Asia—a global reactive nitrogen emissions hotspot—India's policy actions, or inactions, have far-reaching implications. Despite ongoing clean air initiatives, the scientific community has largely neglected the effects of reactive nitrogen deposition on terrestrial ecosystems. This study aims to compile and assess the current research status on reactive nitrogen deposition in India, underscoring its importance given the country's unique geography and agricultural reliance.

The study will provide indirect estimations of reactive nitrogen deposition based on nitrogen concentration measurements from various regions across the country. While wet deposition studies offer a broader understanding, research on dry deposition remains limited. Recent efforts, such as the South Asia Nitrogen Hub project led by CEH UK, have studied the forest ecosystem to explore the impact of reactive nitrogen on lichens. However, comprehensive data on reactive nitrogen deposition across diverse ecosystems is still lacking.

This research seeks to identify existing gaps and stimulate discussion on future research directions essential for the effective management of reactive nitrogen in India's varied ecosystems. By addressing these issues, we aim to inform policy and practice to mitigate the adverse effects of reactive nitrogen deposition while promoting sustainable development in the region.


How to cite: Singh, S.: Reactive Nitrogen Deposition in India: Impacts on Terrestrial Ecosystems and Current Research Status, EGU General Assembly 2025, Vienna, Austria, 27 Apr–2 May 2025, EGU25-17857, https://doi.org/10.5194/egusphere-egu25-17857, 2025.

EGU25-18103 | Posters on site | BG1.3

Atmospheric nitrogen deposition in Switzerland 

Mario Meier, Zaida Ehrenmann, and Eva Seitler

Increased atmospheric nitrogen (N) deposition into sensitive ecosystems is leading to soil acidification, nutrient imbalances and biodiversity losses. Therefore, N depositions were quantified throughout Switzerland in 2000, 2014, 2019 and 2024 measuring the concentrations of seven different inorganic N compounds in wet and dry gravitational as well as in dry non-gravitational deposition. For data collection passive (diffusion tubes and bulk sampler) and active sampling systems (denuder and filter sampler) were used. From the obtained measurement data, N depositions were calculated. The wet and dry gravitational deposition was obtained directly from the bulk samples. The dry non-gravitational deposition was calculated using the inferential method. By summing up the gravitational and non-gravitational N deposition, the total N deposition was obtained and compared to the critical loads for N (CLN). The results show that N inputs in Switzerland are largely around or above the CLN, regardless of the sensitive ecosystems considered. Considerable exceedances have been found near intensive agriculture. In the long-term comparison, a decrease in oxidized N components was observed. However, the total N deposition remained stable over time. The most important processes for the N deposition are the precipitation and the dry deposition of ammonia (NH3). In summary, the atmospheric N inputs into sensitive ecosystems in Switzerland are largely too high and therefore further measures to reduce N emissions are necessary.

We would like to thank to the Swiss Federal Office for the Environment (FOEN), Swiss Federal Institute for Forest, Snow and Landscape Research (WSL), Ostluft, the Swiss cantons and the University of Basel for financial support of the measurement campaigns. A special thank goes to the Swiss Federal Laboratories for Materials Science and Technology (EMPA) for the valuable cooperation.

How to cite: Meier, M., Ehrenmann, Z., and Seitler, E.: Atmospheric nitrogen deposition in Switzerland, EGU General Assembly 2025, Vienna, Austria, 27 Apr–2 May 2025, EGU25-18103, https://doi.org/10.5194/egusphere-egu25-18103, 2025.

EGU25-18590 | Orals | BG1.3 | Highlight

Dutch and EU consumption-based assessments of nitrogen losses throughout the global food system 

José M. Mogollón, Nicolas Navarre, and Kevin Kevin Morgan-Rothschild

The modern global food system is the largest driver of nitrogen imbalances across the world. These problems are exacerbated by excessive and resource-intensive food demand prone to large amounts of loss and waste throughout the food system. Increasing international trade is shifting the burden and upstream nitrogen demand and downstream eutrophication impacts beyond national borders and moving beyond the safe regional boundaries for their presence in the environment. To better understand drivers and solutions to close nitrogen loops, we use the global food input-output model FABIO, which monitors the movement of biomass and the land utilized across global supply chains, encompassing 191 countries, and 130 agricultural and food products. We couple FABIO to nitrogen crop demand, livestock manure management systems, and agricultural surpluses to assess the consumption-based drivers for nitrogen emissions stemming from the agricultural system. A substantial amount of nitrogen losses can be attributed to traded commodities especially toward high-income nations. We further show how policy measures in a high-income nation (the Netherlands) related to the taxation of meat and carbon emissions from the food sector can lead to significant reduction of manure application (up to 20 kt N/yr) and nitrogen losses (over 1 kt N/yr) on a global scale. However, as the Dutch food system relies heavily on manure, there may be a concomitant increase in the need for synthetic fertilizers to account for the significant drop in manure of nearly (14 kt N/yr). We provide similar scenarios for various, more ambitious dietary changes (e.g. the EAT-Lancet diet) at the EU level that can help ameliorate global nitrogen losses, focusing in areas sensitive to terrestrial and aquatic eutrophication and acidification.

How to cite: Mogollón, J. M., Navarre, N., and Kevin Morgan-Rothschild, K.: Dutch and EU consumption-based assessments of nitrogen losses throughout the global food system, EGU General Assembly 2025, Vienna, Austria, 27 Apr–2 May 2025, EGU25-18590, https://doi.org/10.5194/egusphere-egu25-18590, 2025.

EGU25-18703 | ECS | Orals | BG1.3

Effects of long-term nitrogen addition on changes in the functional composition of microbial communities after long-term N addition in a temperate beech forest 

Carme López Sánchez, Àngela Ribas, Rossella Guerreri, Jiesi Lei, Yunfeng Yang, Jizhong Zhou, and Stefania Mattana

Forests are integral to maintaining planetary health, serving as biodiversity reservoirs, carbon sink, and regulators of nutrient cycles, yet their capacity to sustain these functions is increasingly disrupted by global changes. Among them, the rise in atmospheric nitrogen (N) deposition, resulting from anthropogenic emissions of reactive N compounds during fertilizer production and fossil fuel combustion, occurs across terrestrial ecosystems and can alter microbial communities’ functional composition and diversity.

In this study, we evaluate the effects of long-term N fertilisation (simulating an increase in N deposition) on the taxonomic and functional diversity of soil microbial communities in a mature beech forest in Northern Italy. The experiment started in 2015, and it includes control (only ambient deposition, N0) and soil N addition (30 kg ha-1 yr-1, N30) each replicated in 3 plots. Soil biochemical variables including Nitrogen (N), Carbon (C) and Phosphorus (P) content and soluble ions were characterized for both treatments. In addition, GeoChip 5.0S, a microarray technology, was used to characterize the taxonomic and functional diversity of microbial communities.

Although no changes were detected in soil physicochemical characteristics between N30 and N0, there was a significant increase in the taxonomic richness and diversity (Shannon-Weiver and Simpson indices) in the fertilized plots. Moreover, the relative abundance of some functional genes related to the N, C and sulphur (S) cycles were significantly increased in N30 plots, whereas P cycling genes showed no significant changes between treatments. Preliminary results suggest a probable increase in the denitrification and assimilatory and dissimilatory nitrate reduction processes of the N-added soil microbiome. In addition, the results suggest an increase of both the C fixation and C degradation pathways in N30 plots. The higher stimulation of C degradation cycling genes in comparison to C fixation cycling genes, could be explained by the promotion of plant growth and the consequent increase in rhizosphere secretions and C input to the soil after N addition.

This study contributes to the description of microbial community dynamics and the resulting changes in soil biogeochemical processes in forests under increased N deposition conditions.

How to cite: López Sánchez, C., Ribas, À., Guerreri, R., Lei, J., Yang, Y., Zhou, J., and Mattana, S.: Effects of long-term nitrogen addition on changes in the functional composition of microbial communities after long-term N addition in a temperate beech forest, EGU General Assembly 2025, Vienna, Austria, 27 Apr–2 May 2025, EGU25-18703, https://doi.org/10.5194/egusphere-egu25-18703, 2025.

EGU25-18764 | Orals | BG1.3

Biochar as a sustainable amendment in fertilized agricultural soils; insights and trade-offs among nitrogen kinetics, carbon sequestration, and greenhouse gas emissions. 

Georgios Giannopoulos, Elpida Pasvadoglou, George Kourtidis, Eugenio Diaz-Pines, Fotis Sgouridis, Anne Boos, Glykeria Duelli, Vassileios Tzanakakis, Vassilis Aschonitis, George Arampatzis, and Ioannis Anastopoulos

Under European and International policies, organic soil amendments are highly promoted as a cost-efficient solution to improve soil C, quality, and agrosystem sustainability. Inorganic N application is an essential agronomic practice to increase and secure crop yields, however, its long-term application has led to serious environmental problems including deterioration of soil organic C, enhanced greenhouse gas emissions, and an overall decline in environmental quality. Consequently, the co-application of organic and inorganic fertilizers is advocated as a more effective and environmentally friendly fertilization regime. This study aims, to decipher the short-term N kinetics in agricultural soils amended with organic, inorganic, and a combined application of N fertilizer, with and without biochar, and to assess the trade-off balance of soil C and greenhouse gas emissions. Therefore, we investigated the short-term (90 d) soil N dynamics of sandy soil mesocosms (2 Kg) receiving municipal sewage sludge (MSS) amendments (50 t/ha), urea-N fertilization (U; 200 kg/ha), a combined application (MSS+U), without and with biochar (1.5% w/w). An unamended soil mesocosm was included as a control. The addition of urea-N (U), municipal sewage sludge (MSS), and their combined application (MSS+U) increased the availability of soil NH4+ by 3x, 5x and 12x times, relative to the control, respectively. Interestingly, we observed a tremendous release of soil NO2- only in the urea treatment (U; 128 mg kg-1), and not in the other remaining treatments. Throughout the incubation approx. 12.7x, 13.4x, and 19.7x more soil NO3- was observed for the U, MSS, and MSS+U treatment, relative to the control, respectively. Where biochar was applied, an approx. 40% reduction in soil available NO2- andNO3- was observed. Considering the gaseous emissions of CO2 and N2O, that are generally products of soil respiration, nitrification, and denitrification, the addition of MSS and its co-application (MSS+U), enhanced soil CO2 by 2.4x and 2.4x, and by 13.6x and 16.9x for soil N2O emissions, respectively. Though biochar addition reduced cumulative CO2 emissions by 24%, for all treatments except the control. Although biochar addition decreased cumulative N2O emission by 65% in the U, it had no effect on cumulative N2O emission for MSS and the combined treatment (MSS+U). Fertilization by U did not affect much soil CO2 (526 mg CO2-C kg-1) and N2O (1258 μg N2O-N kg-1) emissions when compared to the unamended soil treatment (C). The MSS+U reduced the N2O emission factor, by 5x when compared to MSS treatment, however, it was well above the IPPC emission factor of 1%. Municipal sewage sludge is a source of C, though we observed that MSS (74%) and the combined treatment (MSS+U, 96%) enhanced the CO2-equivalent emissions, indicating a complete loss of the added organic C through greenhouse gas emissions. Considering our key question, whether co-application of inorganic, and organic fertilizer with biochar is a double-edged sword, we conclude that co-application should be carefully evaluated case per case, as it affects several key soil parameters differently, and therefore we should seek new ways to minimize gaseous losses thus to improve sustainability in agrosystems.

How to cite: Giannopoulos, G., Pasvadoglou, E., Kourtidis, G., Diaz-Pines, E., Sgouridis, F., Boos, A., Duelli, G., Tzanakakis, V., Aschonitis, V., Arampatzis, G., and Anastopoulos, I.: Biochar as a sustainable amendment in fertilized agricultural soils; insights and trade-offs among nitrogen kinetics, carbon sequestration, and greenhouse gas emissions., EGU General Assembly 2025, Vienna, Austria, 27 Apr–2 May 2025, EGU25-18764, https://doi.org/10.5194/egusphere-egu25-18764, 2025.

EGU25-19141 | Posters on site | BG1.3

Long-term variations in nitrate leaching from ICP Forests Level II plots 

Peter Waldner, Stephan Raspe, Stefan Fleck, Lothar Zimmermann, Paul Schmidt-Walter, Carmen Iacoban, Bruno De Vos, Nathalie Cools, Heleen Deroo, Elena Vanguelova, Zoran Galic, Athanassios Bourletsikas, Henning Meesenburg, Tim Schütt, Lena Wohlgemuth, Kai Schwärzel, Katrin Meusburger, and Tiina Nieminen

Forests in Europe have been exposed to an increase in atmospheric deposition of nitrogen in the second half of the 20th century that potentially lead to nitrogen saturation and elevated leaching of nitrogen from forest soils potentially impacting water quality of drinking water resources. Nitrogen dynamics of forests, however, are complexe and still not fully understood.

Atmospheric deposition, soil solution, meteorology, soils, as well as stand and site characteristics have been continuously measured and analysed at several hundred intensive monitoring plots of the Level II plot network of the International Cooperative Programme on Assessment and Monitoring of Air Pollution Effects on Forests for many years.

We used the hydrological model LWFBrook90R to calculate water fluxes through the soils of these sites and calculated nitrogen input with atmospheric deposition and output fluxes with percolating soil water. We found high long-term variations on parts of the plots. Some of these variation patterns are in the time range of changes in the tree stands, e.g. mortality and subsequent biomass decomposition. We will discuss relations of found nitrate leaching patterns with nitrogen saturation indicators suggested in literature. 

How to cite: Waldner, P., Raspe, S., Fleck, S., Zimmermann, L., Schmidt-Walter, P., Iacoban, C., De Vos, B., Cools, N., Deroo, H., Vanguelova, E., Galic, Z., Bourletsikas, A., Meesenburg, H., Schütt, T., Wohlgemuth, L., Schwärzel, K., Meusburger, K., and Nieminen, T.: Long-term variations in nitrate leaching from ICP Forests Level II plots, EGU General Assembly 2025, Vienna, Austria, 27 Apr–2 May 2025, EGU25-19141, https://doi.org/10.5194/egusphere-egu25-19141, 2025.

EGU25-19168 | ECS | Orals | BG1.3

Atmospheric reactive nitrogen and its dry deposition regimes under anthropogenic influence: Insights from intensive and long-term monitoring in Switzerland 

Jun Zhang, Ali Waseem, Andrea Baccarini, Ghislain Motos, Christoph Hüglin, Siyao Yue, Benjamin Brem, Leila Simon, Lubna Dada, Kalliopi Violaki, Martin Gysel, Jay Slowik, and Athanasios Nenes

Excessive nitrogen deposition from anthropogenic activities poses significant challenges to ecosystems and air quality.1 The atmospheric deposition of ammonium and nitrate plays a critical role in regulating ecosystem productivity and driving particulate matter formation, with impacts that vary across spatial and temporal scales.

In this study, high time-resolution measurements of gas-phase nitric acid (HNO3) and ammonia (NH3), as well as particulate nitrate and ammonium were conducted at an agricultural site in Switzerland. These measurements were complemented by 15 years of long-term monitoring data at the same site, providing a comprehensive record of changes in atmospheric gas and aerosol species over time. Aerosol pH was estimated using the ISORROPIA thermodynamic model2 and evaluated using a well-established approach based on the agreement between observed and predicted partition ratios of nitrogen species. The intensive measurement shows that the diurnal cycles of HNO3 and NH3 partitioning exhibited distinct patterns. HNO3 tended to partition into the particle phase during the night, driven by cooler temperatures, while NH3 remained predominantly in the gas phase throughout the day and night, regulated by high aerosol pH characteristics at the sampling site.

The dry deposition regimes of HNO3 and NH3 were investigated in relation to aerosol liquid water content and acidity following the approach of Nenes et al. (2021).3 The findings indicate that NH3 deposition is rapid, meaning it tends to deposit near its sources, raising concerns about its localized ecological impacts. Aerosol mass formation was found to be primarily sensitive to HNO3 concentrations. Long-term monitoring data spanning 15 years revealed that reduction in SO2 emissions did not lead to increases in aerosol pH owing to the buffering effect of NH3 in the NH3-rich environment. The decline in sulfate concentration has driven a clear shift in aerosol mass sensitivity, transitioning from NH3-sensitive to NH3 -insensitive regime. Comparative measurements at forested sites in Switzerland provide further insight into the diurnal cycle of aerosol pH and reactive nitrogen deposition, highlighting the influence of anthropogenic activities on nitrogen dynamics across different ecosystems. These findings show the complex interplay between rapidly fluctuating diurnal aerosol acidity and reactive nitrogen deposition, offering important reference for designing effective pollutant mitigation strategies.

References:

(1) Wim de Vries.: Impacts of nitrogen emissions on ecosystems and human health: A mini review, Current Opinion in Environmental Science & Health, 2021, 21:100249, DOI: 10.1016/j.coesh.2021.100249. 

(2) Fountoukis, C. and Nenes, A.: ISORROPIA II: a computationally efficient thermodynamic equilibrium model for K+–Ca2+–Mg2+–NH4+–Na+–SO42−–NO3–Cl–H2O aerosols, Atmospheric Chemistry and Physics, 7, 4639–4659, DOI:10.5194/acp-7-4639-2007, 2007.

(3) Nenes, A., Pandis, S. N., Kanakidou, M., Russell, A. G., Song, S., Vasilakos, P., and Weber, R. J.: Aerosol acidity and liquid water content regulate the dry deposition of inorganic reactive nitrogen, Atmospheric Chemistry and Physics, 21, 6023–6033 DOI:10.5194/acp-21-6023-2021, 2021.

How to cite: Zhang, J., Waseem, A., Baccarini, A., Motos, G., Hüglin, C., Yue, S., Brem, B., Simon, L., Dada, L., Violaki, K., Gysel, M., Slowik, J., and Nenes, A.: Atmospheric reactive nitrogen and its dry deposition regimes under anthropogenic influence: Insights from intensive and long-term monitoring in Switzerland, EGU General Assembly 2025, Vienna, Austria, 27 Apr–2 May 2025, EGU25-19168, https://doi.org/10.5194/egusphere-egu25-19168, 2025.

EGU25-19982 | Orals | BG1.3

Cycling of nitrogen in soil organic matter pools in grasslands as influenced by land use intensity and soil diversity 

Steffen A. Schweizer, Anne Böhm, Julia Kepp, Ralf Kiese, Narda L. Pacay-Barrientos, Elisabeth Ramm, Michael Schloter, Ingo Schöning, Marion Schrumpf, Stefanie Schulz, and Michael Dannenmann

Soil organic matter (SOM) provides crucial storage for carbon but also contains a majority of soil nitrogen. Land use intensity (LUI) may affect the particulate and mineral-associated SOM pools having repercussions on the carbon and nitrogen storage and cycling. Soil organic matter dynamics and composition plays a key role for the extent of these processes, yet its interactions remain poorly understood preventing targeted mitigation measures for carbon and nitrogen-related soil functions. Here we provide insights investigating how LUI and soil properties affect the storage of carbon and nitrogen in functional SOM pools in the topsoil (0-30 cm) of grassland soils across three different regions in Germany. Furthermore, we present a conceptual framework integrating biological, mineral, and organic nitrogen pools to disentangle nitrogen cycling processes and their interactions with organic matter dynamics.

Across the land use intensity gradient, we isolated particulate organic matter (POM), which is part of  in the >20 μm fraction, and mineral associated organic matter (MOM) in the <20 μm fraction. Random forest and mixed model analysis showed that LUI did not significantly affect SOM storage, but led to reduced C/N ratios in POM and MOM, driven by increased N fertilization intensity. Rather than land use intensity, soil properties, such as clay and iron oxide content, and soil type diversity exerted most influence on SOM.

To reconcile the influences of soil properties on soil nitrogen cycling, we provide a novel conceptual framework integrating organic matter stabilization mechanisms, microbial N uptake and release as necromass, as well important processes catalyzed by the soil microbiome including  biological nitrogen fixation pathways. Our integrative nitrogen cycling framework stimulates different disciplines towards a new perception of the nitrogen cycle in unlocking multiple organic nitrogen pools as mediated by soil type and climatic conditions.

How to cite: Schweizer, S. A., Böhm, A., Kepp, J., Kiese, R., Pacay-Barrientos, N. L., Ramm, E., Schloter, M., Schöning, I., Schrumpf, M., Schulz, S., and Dannenmann, M.: Cycling of nitrogen in soil organic matter pools in grasslands as influenced by land use intensity and soil diversity, EGU General Assembly 2025, Vienna, Austria, 27 Apr–2 May 2025, EGU25-19982, https://doi.org/10.5194/egusphere-egu25-19982, 2025.

EGU25-20072 | ECS | Orals | BG1.3

Nitrate in water: Understanding the sources using δ15N and δ18O values 

Manoj Jakhar and Prasanta Sanyal

Nitrogen is a crucial component of nutrient dynamics in the environment and exists in multiple oxidation states. Nitrate (NO3-) is the most stable form of all the reactive nitrogen species and has a higher residence time in groundwater. Sources of nitrate include mainly fertilizers, sewage, manure, soil organic matter, and rain. In a country like India, where agriculture covers an area of about 60% of the total land and population with 2nd rank globally, contributes a huge fertilizer and sewage component to the environment. Also, nitrate in groundwater deteriorates the potable water quality. So, optimization of nitrogen use and sources estimation of nitrate in groundwater and surface water is very essential. Hindon River basin in the western Indo-Gangetic plain provides an opportunity to study nitrate dynamics in a huge populated and extensive agricultural area. Nitrate concentration in groundwater has been found from 0.1 ppm to 80 ppm, far apart from the permissible limit. Pre-monsoon groundwater shows higher nitrate concentration than that of post-monsoon groundwater at most of the places suggesting the dilution effect of rainwater after monsoon. Fluctuations in δ15N and δ18O values seasonally suggest a rapid change in contribution of nitrate source in groundwater. Contribution from each source of nitrate was estimated by Stable Isotope Mixing Models in R (SIMMR). As the dual isotope plot shows denitrification trend, the actual fertilizers contribution shifted towards manure and sewage end members evidenced by higher sewage and manure contributions (60-75% in pre and post-monsoon respectively) need to be optimized for sustainability.

How to cite: Jakhar, M. and Sanyal, P.: Nitrate in water: Understanding the sources using δ15N and δ18O values, EGU General Assembly 2025, Vienna, Austria, 27 Apr–2 May 2025, EGU25-20072, https://doi.org/10.5194/egusphere-egu25-20072, 2025.

EGU25-20384 | ECS | Posters on site | BG1.3

Nitrous oxide emissions in natural and managed wetlands across Europe 

Thomas Crestey-Chury, Romain Darnajoux, Rana Kanaan, Mika Aurela, Aldis Butlers, Tom De Dobbelaer, Laura Escarmena, Laure Gandois, Jyrki Jauhiainen, Sari Juutinen, Tuula Larmola, Ülo Mander, Sílvia Poblador, Maud Raman, Fransesc Sabater, Thomas Schindler, Kaido Soosaar, Liisa Ukonmaanaho, and José-Miguel Sánchez-Pérez and the French team (CRBE)

Wetlands play a complex role as both sources of greenhouse gases (GHGs) and carbon sinks, making it essential to understand their dynamics and effects on biodiversity. The increasing pressures from climate change and human activities can disrupt the natural balance of these ecosystems, potentially resulting in elevated GHG emissions. The intricate abiotic and biotic interactions that govern these processes remain poorly understood. Therefore, there is an urgent need to enhance our understanding of the factors influencing GHG production in wetlands and to improve our capacity to model these emissions on a larger scale. In this study, we investigated the emissions of N2O, CO2 and CH4, with a particular focus on N2O, which is primarily produced through the microbial process of denitrification, and for which a satisfactory large-scale model formulation is lacking. The objective of this study was to evaluate these GHG emissions under optimal conditions for denitrification and to identify unifying abiotic factors. To achieve this, we selected contrasting study sites that varied by wetland type and climate zone, thereby gathering extensive data essential for our modelling efforts.

The research was conducted across multiple wetland sites involved in the ALFAwetlands project (https://alfawetlands.eu/), a European initiative dedicated to the study and restoration of both natural and managed wetlands. A total of 21 sites were selected across five European countries, encompassing a range of climate zones from Mediterranean to arctic. These included floodplains, alluvial forests, drained forests, peatlands, and mountain peatlands (with four sites each in France and Spain, three in Belgium, and five each in Finland and Estonia). For each location, three core samples (10 cm depth and 10 cm diameter) were collected and stored in the dark at 4°C prior to conducting mesocosm experiments. The samples were then placed in a custom-designed “GHG-aquacosm”, which simulates the effect of flooding on wetlands soils. During the experiments, soil cores were submerged in heated water enriched with nitrate. GHG emissions, soil moisture, and soil temperature were continuously monitored until stabilization or end of emission.

While CO2 and CH4 emissions were recorded, they have not yet been analysed, as this study primarily focuses on N2O emissions. The results indicated that N2O emissions varied significantly based on wetland type and initial soil water content. Drained forests, located in cool sub-arctic regions in Finland, demonstrated the highest N2O fluxes, ranging from 500 to 2000 µmol/m²·h. In contrast, floodplains and peatlands in Belgium and Estonia showed the lowest fluxes, between 5 and 150 µmol/m²·h. Significant variability was noted even among replicates, highlighting the considerable spatial heterogeneities of soils. Additionally, N2O emissions began immediately after nitrate addition, and for most sites ended 30 to 40 hours after, indicating the short temporal scale of N2O production and the challenges associated with in situ measurement. Ongoing data analysis and measurements are focused on further elucidating the spatial and temporal heterogeneities of denitrification processes, with the goal of effectively incorporating these factors into our modelling efforts.

How to cite: Crestey-Chury, T., Darnajoux, R., Kanaan, R., Aurela, M., Butlers, A., De Dobbelaer, T., Escarmena, L., Gandois, L., Jauhiainen, J., Juutinen, S., Larmola, T., Mander, Ü., Poblador, S., Raman, M., Sabater, F., Schindler, T., Soosaar, K., Ukonmaanaho, L., and Sánchez-Pérez, J.-M. and the French team (CRBE): Nitrous oxide emissions in natural and managed wetlands across Europe, EGU General Assembly 2025, Vienna, Austria, 27 Apr–2 May 2025, EGU25-20384, https://doi.org/10.5194/egusphere-egu25-20384, 2025.

EGU25-21215 | ECS | Orals | BG1.3

Does nitrogen deposition affect plant community stability–area relationships? The role of biodiversity, area, and seasonal N addition 

Yuqiu Zhang, Carly J. Stevens, Weiyu Lu, Xu Chen, Zhengru Ren, and Yunhai Zhang

Nitrogen (N) deposition generally reduces the temporal stability of plant community (community stability) across spatial scales. Theory predicts that community stability increases with sampling area, leading to a positive community stability–area relationship (CSAR). However, because atmospheric N deposition exhibits a temporal pattern, little is known about how the responses of community stability differ under seasonal N deposition, or whether seasonal N deposition alters the CSAR and its underlying mechanisms. Understanding this is crucial for assessing multi-scale ecological sustainability under global change. We conducted an experiment with N input during autumn, winter, or the growing season in a temperate grassland. Based on six years of survey data across nested spatial scales ranging from 0.01 to 16 m2, we explored the potential impacts of seasonal N enrichment on the CSAR. Our results showed that community stability increased with sampling area, regardless of N addition. Each of the three seasonal N inputs caused a significant reduction in the CSAR intercept, while N addition in winter or the growing season also reduced the CSAR slope. Biodiversity had a stronger effect than area in maintaining the positive CSAR, and mediated the relationship between area and stability. High biodiversity preserved community stability by maintaining population stability and compensatory dynamics. By validating and extending the CSAR theory under seasonal N input, our research showed that N input in winter or the growing season caused a greater reduction in plant community stability at larger spatial scales. As global N deposition continues to increase, small-scale studies may undervalue the adverse impact of N input on stability, while large-scale studies based only on N input during the growing season may overestimate this effect. These findings highlight the need to consider both spatial scales and seasonality of N deposition for accurately predicting ecosystem responses to atmospheric N deposition.

How to cite: Zhang, Y., Stevens, C. J., Lu, W., Chen, X., Ren, Z., and Zhang, Y.: Does nitrogen deposition affect plant community stability–area relationships? The role of biodiversity, area, and seasonal N addition, EGU General Assembly 2025, Vienna, Austria, 27 Apr–2 May 2025, EGU25-21215, https://doi.org/10.5194/egusphere-egu25-21215, 2025.

In recent years, the severe impact of wildfires has sharply increased due to rising temperatures and drought-like conditions. Therefore, in addition to continuous wildfire monitoring, a long-term understanding of the climate-wildfire relationship is warranted. This study has explored the climate-wildfire relationship in the southern Taiwan region over the past two millennia, focusing on the influence of climate and human activities on wildfire occurrences and their subsequent impact on lake. To achieve this, carbon, nitrogen, carbon isotopic composition of organic matter, charcoal, and diatom assemblages were analysed in the Dongyuan Lake core sediments. Wildfires occurring between 1850 and 1050 cal years BP were largely caused by drier climate conditions. However, wildfires occurring during 750-500 cal years BP and from 350 cal years BP to the present, intervals characterized by wet climate conditions, coincided with a significant number of archaeological sites near Dongyuan Lake, suggesting human-induced burning in the region. The observed wet interval during 1050-750 cal years BP in southern Taiwan attributed to the Medieval Warm Period (MWP), and dry interval during 500-350 cal years BP linked to Little Ice Age (LIA). The low carbon content in Dongyuan Lake sediments coincided with peaks of charcoal accumulation, indicating the loss of carbon due to wildfires and the dilution of sediments. The principal component analysis (PCA) of diatom data showed that PC1 and PC2 represented the lake's acidic conditions, suggesting an increase in pH from 750 to 150 cal years BP. This variation in pH appeared to be linked with wildfire intensity and frequency. PC1 and PC2 also showed strong acidic conditions during the last 150 years, plausibly due to the increase in acid rain conditions in the last century.

How to cite: Rahman, A. and Wang, L. C.: Climate-fire-human interactions and their impact on the limnology conditions of the Dongyuan Lake, Southern Taiwan during the last 1800 cal years BP, EGU General Assembly 2025, Vienna, Austria, 27 Apr–2 May 2025, EGU25-593, https://doi.org/10.5194/egusphere-egu25-593, 2025.

EGU25-1579 | ECS | Posters on site | BG1.4

Prioritizing Areas for Post-Fire Restoration in Greece Using Mixed-Methods Spatial Analysis 

Elena Palenova, Sander Veraverbeke, Themistoklis Kontos, and Karin Ebert

The frequency and severity of wildfires are projected to increase in the Mediterranean region. Greece currently lacks a developed standardized system for identifying and prioritizing burnt areas in relation to their restoration needs. Prioritization of areas for post-fire restoration efforts using geographic information system (GIS) and remote sensing (RS) can be useful in decision-making. However, this approach is often insufficient in effectively integrating perspectives from multiple stakeholders and socio-ecological criteria. Combining qualitative methods such as interviews with GIS and RS methods can enhance the understanding of nuances in a local context. 

We designed an approach to identify high-priority areas for post-fire restoration. The identification was based on interviews with stakeholders and the application of GIS and RS. We conducted 15 interviews with stakeholders working on post-fire issues and selected criteria for the prioritization analysis based on their views. The expert interviews revealed perceptions regarding the necessity of vegetation restoration and rehabilitation efforts and helped to identify the key characteristics respondents consider essential for prioritizing burnt areas for restoration. These insights established an analysis using GIS and RS to select areas based on the identified characteristics. 

We selected the areas for restoration based on fire history, slope, and designation as part of the protected areas. The outcomes of the analysis helped to highlight three areas that potentially need special attention. We propose a prioritization system that considers the natural regeneration potential of the Mediterranean and on-the-ground socio-ecological limitations, and can help government agencies, local foresters, private consultancies, and NGOs plan restoration actions and optimize the effectiveness of restoration programs in Greece.

How to cite: Palenova, E., Veraverbeke, S., Kontos, T., and Ebert, K.: Prioritizing Areas for Post-Fire Restoration in Greece Using Mixed-Methods Spatial Analysis, EGU General Assembly 2025, Vienna, Austria, 27 Apr–2 May 2025, EGU25-1579, https://doi.org/10.5194/egusphere-egu25-1579, 2025.

EGU25-1986 | Orals | BG1.4

Forest fire size amplifies postfire land surface warming 

Chao Yue, Jie Zhao, Jiaming Wang, Stijn Hantson, Xianli Wang, Binbin He, Guangyao Li, Liang Wang, Hongfei Zhao, and Sebastiaan Luyssaert

Climate warming has caused a widespread increase in extreme fire weather, making forest fires longer-lived and larger. The average forest fire size in Canada, the USA and Australia has doubled or even tripled in recent decades. In return, forest fires feed back to climate by modulating land–atmospheric carbon, nitrogen, aerosol, energy and water fluxes. However, the surface climate impacts of increasingly large fires and their implications for land management remain to be established. Here we use satellite observations to show that in temperate and boreal forests in the Northern Hemisphere, fire size persistently amplified decade-long postfire land surface warming in summer per unit burnt area. Both warming and its amplification with fire size were found to diminish with an increasing abundance of broadleaf trees, consistent with their lower fire vulnerability compared with coniferous species. Fire-size-enhanced warming may affect the success and composition of postfire stand regeneration as well as permafrost degradation, presenting previously overlooked, additional feedback effects to future climate and fire dynamics. Given the projected increase in fire size in northern forests, climate-smart forestry should aim to mitigate the climate risks of large fires, possibly by increasing the share of broadleaf trees, where appropriate, and avoiding active pyrophytes.

How to cite: Yue, C., Zhao, J., Wang, J., Hantson, S., Wang, X., He, B., Li, G., Wang, L., Zhao, H., and Luyssaert, S.: Forest fire size amplifies postfire land surface warming, EGU General Assembly 2025, Vienna, Austria, 27 Apr–2 May 2025, EGU25-1986, https://doi.org/10.5194/egusphere-egu25-1986, 2025.

EGU25-2126 | ECS | Orals | BG1.4

Meteorological impacts on long-range spotting of firebrands 

Alberto Alonso Pinar, Jean-Baptiste Filippi, and Alexander Filkov

Firebrands, small pieces of burning vegetation, can be detached and transported far away from the main fire front during intense fires. The process of firebrand generation, transport and ignition of a fuel bed is known as spotting. Spotting can start new fires and plays an important role in wildfire spread, presenting critical challenges for containment strategies and risk management. This study utilizes a series of high-resolution simulations to evaluate the influence of wind speed, topographic features, fire intensity and atmospheric stability on firebrand transport and fuel ignition. By coupling a fire-atmosphere modeling with combustion and firebrand transport models, we analyze key processes affecting firebrand trajectories and ignition potential.

To obtain realistic conditions of an intense fire, we use the cloud resolving weather model MesoNH coupled with the fire propagation model ForeFire. Such coupled fire-atmosphere simulations are designed to have a computational domain of the same scale of large wildfires, here 80m resolution for 14 km wide, 28 km length and 16 km high. This coupled fire atmosphere model is run for 36 different conditions:

  • Three reference wind speeds (5, 10 and 15m.s-1)
  • Three head fire heat flux (40, 80 and 120 kW.m-2)
  • Three topographies (a flat terrain, a hill and a canyon)
  • Two atmospheric conditions: stable and unstable

Firebrands are modelled as point masses with three degrees of freedom (three translations), with a set of aerodynamic coefficients and a combustion model. By combining high-resolution LES simulations with detailed firebrand trajectory and combustion processes, we expect to obtain realistic firebrand trajectories.

The resulting different ground patterns distributions of potentially still burning firebrands show that high wind speeds significantly increase firebrand lofting and horizontal transport distances of up to several kilometers. The maximum spotting distance is increased when topographic elements, such as hills or canyons, are added to the simulation. Furthermore, atmospheric stability exerts a critical influence on firebrand behavior: unstable conditions encourage turbulent mixing, vortices, and upward lofting with increased maximum heights reached by the firebrands.

Our results also emphasize the interaction between fire intensity, terrain-driven wind patterns, and atmospheric conditions. This should allow to identify thresholds where long-range spotting becomes most likely. As a result, this research provides valuable insights into the mechanisms driving firebrand dynamics, advancing predictive wildfire modeling and improving hazard mitigation strategies.


These results contribute to the broader understanding of wildfire behavior and have practical implications for fire management, evacuation planning, and the development of tailored mitigation measures to address the growing threats posed by wildfires in a changing climate.

How to cite: Alonso Pinar, A., Filippi, J.-B., and Filkov, A.: Meteorological impacts on long-range spotting of firebrands, EGU General Assembly 2025, Vienna, Austria, 27 Apr–2 May 2025, EGU25-2126, https://doi.org/10.5194/egusphere-egu25-2126, 2025.

EGU25-2854 | ECS | Posters on site | BG1.4

Detecting Burned Area Anomalies with Isolation Forest in the Tropics: A Focus on Madagascar  

Shrijana Poudel, Robert Parker, Heiko Balzter, Tristan Quaife, and Douglas Kelley

Tropical forests are at high risk of dieback due to human-induced disturbances including forest fires, agricultural expansion, and logging. These disturbances can degrade the ecosystems, slow forest recovery, and disrupt the global carbon cycle, leading to irreversible changes or ‘tipping point’ in the Earth’s climate system – the point at which disruption to the climate potentially becomes irreversible. Early warning signals of tipping points for the Amazon rainforest and Greenland ice sheet have already been detected. Monitoring these forest ecosystems is crucial to mitigate future long-term consequences. In order to analyse the response of vegetation to disturbances, we must first identify such disturbances, ideally across the entire tropics over a long period of time. We must also carefully consider what we mean by a “disturbance” and it is not necessarily just the largest fire event. It may be that a significant disturbance is a modest fire event but in a region that does not typically experience burning or a fire event outside of the typical fire season. In both of those instances, we might expect the vegetation response to have different characteristics to those from regular, large burns.

In this study, we applied Isolation Forest (IF) algorithm to detect Burned Area (BA) anomaly and apply it to ESA FireCCI51 dataset (2001-2020) over IPCC AR6 defined land regions, with Madagascar as a case study region. IF identifies anomalies by considering how easily they can be isolated from the main distribution and allows us to introduce features beyond just the burned area itself (e.g., time and location of the fire). Explainable AI (SHAP) analysis was also performed to further understand the predicted BA anomaly. A higher number of BA anomalies were mostly linked to larger values of BA over the Tropics and in Madagascar, however, anomalies in BA are also affected by temporal and geographical factors other than the magnitude of BA. IF detected a high number of anomalies (>20) in the northern region of Madagascar which comparatively had lower BA values which could indicate deviation from seasonal fire patterns. These results were further explained by SHAP analysis which showed that BA was the main factor influencing prediction of BA anomaly but that time and location could play a significant role in some anomaly detections. This suggests that deviation from the typical fire seasonality was another factor contributing to anomaly detection. The high number of anomalies in these specific areas highlights the need for targeted fire management strategies so that policymakers can anticipate the long-term effects of climate change and human activity on tropical forests, guiding sustainable land use, conservation, and climate adaptation efforts in vulnerable regions.

How to cite: Poudel, S., Parker, R., Balzter, H., Quaife, T., and Kelley, D.: Detecting Burned Area Anomalies with Isolation Forest in the Tropics: A Focus on Madagascar , EGU General Assembly 2025, Vienna, Austria, 27 Apr–2 May 2025, EGU25-2854, https://doi.org/10.5194/egusphere-egu25-2854, 2025.

EGU25-4358 | ECS | Posters on site | BG1.4

Human Exposure to Wildfires in Mediterranean Environments: A Case Study from Catalonia (1992–2021) 

Miguel Ángel Torres-Vázquez, Matteo Dalle Vaglie, Nicholas Kettridge, Federico Martellozzo, Gonzalo Miguez-Macho, Antonello Provenzale, Dominic Royé, Filippo Randelli, and Marco Turco

The Mediterranean region is one of Europe’s most fire-prone and vulnerable areas, facing compounding risks from urban expansion and wildfire activity. This study examines the evolution of human exposure to wildfires in Catalonia, northeastern Spain, over three decades (1992–2021). Using high-resolution geospatial data, including fire perimeters, nighttime light (NTL) intensity as a proxy for human activity, population data, and historical settlement patterns, we analyze trends in exposure per unit of burned area (BA). Results reveal a 77% increase in human exposure per unit BA, driven by population redistribution and urban expansion into fire-prone areas, despite a non-significant decrease in BA of −0.43 km²/year.

A novel aspect of this research is the integration of NTL data to capture dynamic changes in human activity and exposure, validated against population and settlement datasets. Exposure trends were assessed using counterfactual scenarios to isolate the impact of population dynamics. Findings underscore the critical need to account for human activity changes in wildfire risk assessments, highlighting the increasing vulnerability of expanding urban landscapes in Mediterranean regions. These insights are essential for developing adaptive and proactive wildfire management strategies to mitigate future risks.

This methodology provides a replicable framework for assessing wildfire exposure in diverse geographical contexts, emphasizing the value of integrating population dynamics with environmental datasets.

This work is currently in preparation.

Acknowledgements:
This work was supported by the project ‘Climate and Wildfire Interface Study for Europe (CHASE)’ under the 6th Seed Funding Call by the European University for Well-Being (EUniWell). M.T. acknowledges funding by the Spanish Ministry of Science, Innovation and Universities through the Ramón y Cajal Grant Reference RYC2019-027115-I. M.A.T-V and M.T acknowledge funding through the project ONFIRE, Grant PID2021-123193OB-I00, funded by MCIN/AEI/10.13039/501100011033 and by “ERDF A way of making Europe”. AP acknowledges the support of the EU H2020 project “FirEUrisk”, Grant Agreement No. 101003890. The authors thank the Generalitat de Catalunya for access to fire perimeter data and Xavier Castro from the Forest Fire Prevention Service of the Generalitat de Catalunya for the helpful discussions on the matter.

How to cite: Torres-Vázquez, M. Á., Dalle Vaglie, M., Kettridge, N., Martellozzo, F., Miguez-Macho, G., Provenzale, A., Royé, D., Randelli, F., and Turco, M.: Human Exposure to Wildfires in Mediterranean Environments: A Case Study from Catalonia (1992–2021), EGU General Assembly 2025, Vienna, Austria, 27 Apr–2 May 2025, EGU25-4358, https://doi.org/10.5194/egusphere-egu25-4358, 2025.

It is becoming increasingly important to understand how ecosystems will recover from wildfires, which are increasing in frequency, severity and size, especially in coniferous forests. Megafires—defined as wildfires burning exceptionally large areas—are thought to have more negative effects on ecosystems than smaller fires. However, the effects of megafires vary substantially, and one hypothesis is that intra-fire heterogeneity of burn patches can dictate the recovery of ecosystems. We evaluated the role of spatial configuration of burn patches within megafires using remote sensing data of fires and vegetation at 30x30 m resolution across 36 years and field-survey data of forest recovery in the western USA. Megafires contributed 62% of total burned area, with their frequency explaining 83% of the variation in the inter-annual burned area from 1984-2020. However, megafire size alone did not inherently result in severe ecosystem transitions, with megafires that experienced large contiguous patches of severely burned forest taking longer to recover. Field surveys illustrated delayed recovery resulted from a tree dispersal-limitation threshold of ca. 150 m, such that increasing distance from intact coniferous forest significantly delayed recovery. Machine learning image classification revealed that the rate of recovery in the severely burned areas has declined by ca. 50% from 1984-2020, with distance from seed source being more important than all climate variables analysed. Consequently, spatial configuration of high-severity burn patches within fires—which have become both larger and more compact through time—are key for assessing the effect of megafires on forest resilience.

How to cite: Pellegrini, A. and Schoenecker, J.: Spatial configuration of severely burned patches within megafires explains ecosystem resilience , EGU General Assembly 2025, Vienna, Austria, 27 Apr–2 May 2025, EGU25-4739, https://doi.org/10.5194/egusphere-egu25-4739, 2025.

EGU25-5629 | Posters on site | BG1.4

An enhanced NHI algorithm configuration for fire detection and mapping 

Giuseppe Mazzeo, Alfredo Falconieri, Carolina Filizzola, Nicola Genzano, Nicola Pergola, and Francesco Marchese

The devastating fire events occurring during the intense fire season of 2023 have shown the importance of developing efficient fire detection methods capable of supporting the fire management activities. An enhanced configuration of the Normalized Hotspot Indices (NHI) algorithm has been developed in this direction to improve the fire mapping by satellite through near infrared (NIR) and short-wave infrared (SWIR) data (up to 20 m spatial resolution) from the Operational Land Imager (OLI/OLI2) and the Multispectral Instrument (MSI) aboard Landsat-8/9 (L8/9) and Sentinel-2 (S2) satellites, respectively. In this work, we show the results achieved by investigating the fire events occurring in California, Hawaii islands (USA), Yellowknife (Canada), Tenerife islands (Spain), Greece and Australia also through comparison with information from operational Landsat Fire and Thermal Anomaly (LFTA) product. Results of an extended validation analysis performed using information from well-established databases show that the enhanced NHI algorithm configuration enabled an accurate mapping of fire fronts with a very number of omission and commission errors. Moreover, the algorithm flagged up to 99% of fire pixels from the LFTA product over California and detected up to 70% of additional fire pixels, in night-time conditions, which better detailed the fire fronts and provided unique information about small-fire outbreaks. The effective integration of S2 (daytime) and L8/9 (daytime/night-time) observations, demonstrates that the enhanced NHI algorithm configuration may be used with success to analyse the dynamic evolution of flaming fronts by assessing/complementing information from satellite products at high-temporal/low-spatial resolution. The next implementation of the algorithm on from the Sea and Land Surface Temperature Radiometer (SLSTR) aboard Sentinel-3 satellite and the Flexible Combined Imager (FCI) of the Meteosat Third Generation (MTG) opens some interesting perspectives also regarding its usage for the near-real time monitoring of wildfires

How to cite: Mazzeo, G., Falconieri, A., Filizzola, C., Genzano, N., Pergola, N., and Marchese, F.: An enhanced NHI algorithm configuration for fire detection and mapping, EGU General Assembly 2025, Vienna, Austria, 27 Apr–2 May 2025, EGU25-5629, https://doi.org/10.5194/egusphere-egu25-5629, 2025.

EGU25-6292 | ECS | Orals | BG1.4

Overestimating Fire Weather Trends: Challenges in Using Daily Climate Data 

Alberto Moreno, Aurora Matteo, Sixto Herrera, Cesar Azorin-Molina, Joaquín Bedia, Antonello Provenzale, Robert J. H. Dunn, Ginés Garnés-Morales, Yann Quilcaille, Miguel Ángel Torres Vázquez, Francesca Di Giuseppe, and Marco Turco

The Fire Weather Index (FWI) is a widely used metric for assessing wildfire danger, relying on sub-daily meteorological data, typically recorded at local noon. However, most climate models and observational datasets only provide daily-aggregated variables, which can introduce biases in fire weather assessments under climate change. This study evaluates how approximating noon-specific calculations impacts the trends of extreme fire weather days (FWI95d), defined as the annual number of days exceeding the 95th percentile of daily FWI values (FWI95d).

Using global data from ERA5 for 1980–2023, we find that FWI95d have increased by 65% over 44 years, corresponding to an average of 11.66 additional extreme fire weather days per year. Daily approximations consistently overestimate this trend by 5–10%, with the largest differences observed in fire-prone regions such as the western United States, southern Africa, and parts of Asia. Among the tested proxies, the combination of daily mean values for air temperature, relative humidity, precipitation, and wind speed exhibits the lower biases, while proxies involving minimum relative humidity tend to overestimate trends more significantly.

Our findings emphasize the importance of sub-daily meteorological data for accurate wildfire risk projections. In its absence, we recommend prioritizing daily mean approximations over other proxies as the least-biased alternative in the absence of noon-specific data. These results underscore the potential for misrepresentation of future fire weather risks in climate models, particularly if systematic biases introduced by daily approximations are not addressed. Future climate model intercomparison projects should prioritize the inclusion of sub-daily meteorological outputs to enhance the reliability of fire weather assessments globally.

Acknowledgements
M.T. acknowledges funding by the Spanish Ministry of Science, Innovation and Universities through the Ramón y Cajal Grant Reference RYC2019-027115-I and through the project ONFIRE, Grant PID2021-123193OB-I00, funded by MCIN/AEI/10.13039/501100011033 and by “ERDF A way of making Europe”. This work was supported by the project ‘Climate and Wildfire Interface Study for Europe (CHASE)’ under the 6th Seed Funding Call by the European University for Well-Being (EUniWell).


How to cite: Moreno, A., Matteo, A., Herrera, S., Azorin-Molina, C., Bedia, J., Provenzale, A., Dunn, R. J. H., Garnés-Morales, G., Quilcaille, Y., Ángel Torres Vázquez, M., Di Giuseppe, F., and Turco, M.: Overestimating Fire Weather Trends: Challenges in Using Daily Climate Data, EGU General Assembly 2025, Vienna, Austria, 27 Apr–2 May 2025, EGU25-6292, https://doi.org/10.5194/egusphere-egu25-6292, 2025.

Haralamb Georgescu was a Romanian architect who fleed the communist rule and settled in the USA. After a brief period in the Eastern part, he settled in Los Angeles where not only did he build his most iconic buildings, but also was featured for futuristic utopic designs. Within the Romanian funded project "Future on the past" (featured at EGU 2023), which used digital humanities methods to develop innovative mapping techniques, including ontologies, for earthquake, flood and fire, also the buildings of Haralamb Georgescu were studied. This happened in conjunction with another Romanian sister project (both ended with the PNIII framework programme on the 31.12.2024) which focused on Romanian-American relationships in the interwar time in a publication of which first results were published. Haralamb Georgescu started his career in the interwar time in Romania. 2-7 January 2025 I visited Mangalia where is his last building built in Romania. Some others built in Bucharest were mapped before, and so were those in the USA, including Los Angeles. Materials on Los Angeles were available from two sources: the Getty archives and a book of drawings of building projects, catalogue of a past exhibition at the "Ion Mincu" University of Architecture and Urbanism, which was done after the rediscovery of Haralamb Georgescu following the restoration of the Pasinetti house, the most emblematic one, featured in a magazine of the time. The mapping in Google Maps of the buildings of Haralamb Georgescu was exported and imported in arcGIS online Living Atlas, the map on US current wildfires. This way three buildings of Haralamb Georgescu were identified (Bucharest restaurant next to the Eaton forest, Lark Arrow apartments in the same area, Rinaldi convalescent hospital) next to wildfires and one on a wildfire and this was the Pasinetti House in Beverly Hills. Unfortunately searching the news confirmed the mapping as the CBS reported dogs being rescued from the lost house of Pasinetti. Besides, during the project in frame of work for COST CA18135 - Fire in the Earth System: Science & Society (FIRElinks), as working group member of group 5 Socio-economic aspects of fire and fire risk management, an ontology of fire was developed and published. This contribution will test how the findings fit into this ontology. Current work is being done in the Climate change adaptation working group of ICOMOS ISCARSAH related to the structures of monuments which includes the effects of wildfire. The architecture of Haralamb Georgescu is Modernist architecture related in typology to that of the Cyclades, and the publication from the COST action also covered the relationship to fires in Greece, specifically Paros in 2022. Some more insights on this will be included after more site visits. This is in line with the research question of the project on how vernacular architecture may render Modernist buildings which include elements inspired by it more safe, through so-called local culture, extensively studied so far for seismic events and started for flood events, but scarcely so for wildfires. The ontology in computer science understanding helps this.

How to cite: Bostenaru Dan, M.: The impact of the January 2025 Southern California fires on the buildings of Haralamb Georgescu in Los Angeles, EGU General Assembly 2025, Vienna, Austria, 27 Apr–2 May 2025, EGU25-7664, https://doi.org/10.5194/egusphere-egu25-7664, 2025.

EGU25-8889 | Posters on site | BG1.4

Hydrological impacts of wildfires on a global scale: An analysis based on the fire-enabled models of ISIMIP. 

Manolis Grillakis and Apostolos Voulgarakis

Wildfires can significantly alter the hydrological regime of a watershed until vegetation is reestablished and the hydrological cycle returns to its pre-disturbance state. These wildfire-induced changes can disrupt flow patterns by reducing rainfall interception and evapotranspiration due to vegetation loss. Additionally, wildfires can affect soil permeability, either through ash deposition or, in boreal regions, by facilitating permafrost thaw.

Land surface models play a critical role in understanding and predicting interactions between the Earth's surface the atmosphere. They enable detailed assessments of water, energy, and carbon cycling, which are essential for climate modeling, ecosystem management, and policy development.

In this study, we analyze surface runoff simulated by six fire-enabled ISIMIP3a land surface models for the period 1850–2019. We identify changes in the runoff coefficient between the most fire-active and least fire-active decades in the timeseries. To isolate the role of long-term climatic trends, we utilize counterfactual simulation outputs driven by detrended observational climate data, where the signal of global warming has been removed.

Our preliminary results reveal consistent patterns between the modeled results and observed runoff changes reported in other studies, though substantial variability exists among the different land surface models. This work aims to assess the ability of state-of-the-art land surface models to represent a complex interaction on the land surface, while also enhancing our understanding of the hydrological impacts of wildfires and contributing to improving the representation of fire-hydrology processes in modeling frameworks.

This work is supported by Leverhulme Centre for Wildfires, Environment, and Society through the Leverhulme Trust, grant number RC-2018-023.

How to cite: Grillakis, M. and Voulgarakis, A.: Hydrological impacts of wildfires on a global scale: An analysis based on the fire-enabled models of ISIMIP., EGU General Assembly 2025, Vienna, Austria, 27 Apr–2 May 2025, EGU25-8889, https://doi.org/10.5194/egusphere-egu25-8889, 2025.

EGU25-9817 | ECS | Posters on site | BG1.4

Causal Attribution of Arctic Wildfire Events in the 21st Century to Anthropogenic Forcing 

Lukas Fiedler, Armineh Barkhordarian, Victor Brovkin, and Johanna Baehr

As an imprint of its rapid climatic transformation over the last two decades, the pan-Arctic region has experienced increasingly extreme fire events. However, a systematic and regionally comprehensive assessment of the recent extreme fire events in the pan-Arctic and the role played by human emissions is still pending. In this study, we employ an extreme event-attribution framework to assess the extent to which anthropogenic forcing affects the magnitude (Burned Area) and likelihood of favourable conditions of extreme fire events (Canadian Forest Fire Weather Index) in the pan-Arctic region throughout the 21st century. Therefore, we utilise large ensemble simulations conducted with the Community Earth System Model version 2 (CESM2), which are capable of isolating anthropogenic external climate forcings and observations from distinct remote sensing products as well as reanalysis data. Our results indicate that the presence of anthropogenic forcing throughout the 21st century was necessary to enable the observed extreme fire events in the pan-Arctic region. We find less than a 20% chance, that the extreme wildfire events occurred during recent fire seasons could have happened in the absence of human-induced external forcings. We can state that such wildfires have become 5 to 10 times more likely in comparison to pre-industrial climatic conditions. Furthermore, our findings indicate that the impact of anthropogenic forcings has significantly elevated the risk of high-latitudes experiencing severe fire-weather conditions by up to an order of magnitude. However, our study reveals the recent elevation in human-induced external forcings does not appear to be enough to explain the occurrence of observed extreme pan-Arctic wildfire events throughout the 21st century. We further explore the underlying mechanisms that drive changes in extreme fire-weather risk. We identify the relative contribution of maximum temperature, precipitation, relative humidity, and surface wind speed on the changes in extreme fire-weather risk.

How to cite: Fiedler, L., Barkhordarian, A., Brovkin, V., and Baehr, J.: Causal Attribution of Arctic Wildfire Events in the 21st Century to Anthropogenic Forcing, EGU General Assembly 2025, Vienna, Austria, 27 Apr–2 May 2025, EGU25-9817, https://doi.org/10.5194/egusphere-egu25-9817, 2025.

EGU25-10833 | ECS | Posters on site | BG1.4

Large-scale impacts of the 2023 Canadian wildfires on the Northern Hemisphere atmosphere 

Iulian-Alin Rosu, Matt Kasoar, Rafaila-Nikola Mourgela, Eirini Boleti, Mark Parrington, and Apostolos Voulgarakis

The study of wildfires is crucial to understanding the Earth system, as severe wildfire events can lead to intense degradation of nature and property. The record-breaking 2023 Canadian wildfire event best represents this, with approximately 5% of the total forest area of Canada burned [1] [2], resulting in biomass burning (BB) emissions quantitatively comparable to the annual fossil fuel emissions of large nations [3], and with the highest Canadian carbon emissions on record [4]. Increased mean temperatures along with decreased humidity in the region due to climate change are considered responsible for this record series of wildfires [5], as increasing mean temperatures along with decreasing humidity in the region led to increased fire risk.

Large amounts of carbonaceous aerosols can exert substantial atmospheric radiative forcing, thus it is important to study the consequences of these emissions on large-scale atmospheric composition and meteorological behavior. In this work, global and local atmospheric impacts of this historic wildfire event are analyzed using the EC-Earth3 earth system model [6] in its standard AerChem configuration. BB emissions from the Copernicus Atmosphere Monitoring Service (CAMS) Global Fire Assimilation System (GFAS) were used as input in the model to produce two 10-member ensembles simulations, with and without the 2023 Canadian wildfire emissions. The results are analyzed, and the differences in various modelled atmospheric quantities between the two ensembles are spatially cross-correlated to determine connections between atmospheric anomalies and wildfire intrusions.

Modelled monthly changes in radiative effects, cloud cover, large-scale circulation, and temperature patterns throughout the North Hemisphere and Canada are found as a result of the 2023 BB emissions, and the mechanisms via which these can be caused are discussed and explained. These changes include the long-range transport of the BB pollutants in the troposphere and the stratosphere with marked impacts on cloud cover and on temperatures at low and high altitudes, differential cooling over the Canadian region due to a dual influence of direct and indirect effects of AOD increases, and even large-scale circulation anomalies which led to cooling as far as in Eastern Siberia. We find that the modelled temperature anomalies between the two ensembles caused by the wildfire-generated aerosols can be as intense as -5.44 °C locally, while the modelled average hemispheric temperature anomaly is equal to -0.91 °C.

[1] "Fire Statistics". Canadian Interagency Forest Fire Centre. Retrieved January 4, 2024.

[2] “The State of Canada’s Forests: Annual Report”. 2022. Canadian Minister of Natural Resources.

[3] Byrne, Brendan, et al. "Carbon emissions from the 2023 Canadian wildfires" Nature. 2024 835-839.

[4] “Copernicus: Emissions from Canadian wildfires the highest on record – smoke plume reaches Europe”. Atmosphere Monitoring Service, Copernicus. Retrieved January 4, 2024.

[5] Barnes, Clair, et al. "Climate change more than doubled the likelihood of extreme fire weather conditions in eastern Canada" 2023.

[6] Döscher, Ralf, et al. "The EC-earth3 Earth system model for the climate model intercomparison project 6." Geoscientific Model Development Discussions. 2021 1-90.

How to cite: Rosu, I.-A., Kasoar, M., Mourgela, R.-N., Boleti, E., Parrington, M., and Voulgarakis, A.: Large-scale impacts of the 2023 Canadian wildfires on the Northern Hemisphere atmosphere, EGU General Assembly 2025, Vienna, Austria, 27 Apr–2 May 2025, EGU25-10833, https://doi.org/10.5194/egusphere-egu25-10833, 2025.

EGU25-12890 | Posters on site | BG1.4

Assessing the Impact of Climate Change on Forest Fire Weather Index Using Downscaled Climate Model Data 

Anton Laakso, Meeri Palokangas, Taijin Park, Antti Lipponen, Laura Utriainen, and Tero Mielonen

In recent years, fire activity at high latitudes has reached unprecedented levels, driven in part by global warming, which increases fire danger. Climate projections of fire risk rely on indices like the Canadian Forest Fire Weather Index (FWI), which are often derived from coarse-resolution climate models. Thus, there is the need for finer-scale fire weather projections to enable more effective planning and resource allocation as wildfire threats grow. High-resolution climate projections can be achieved through various methods, including dynamical and statistical downscaling, each potentially yielding different estimates of FWI and its future changes. We calculated the FWI based on HCLIM - Nordic Convection Permitting Climate Projections (NorCP) over Fennoscandia. The simulations include 12 x 12 km resolution models using HCLIM-ALADIN and convection-permitting simulation at 3 x 3 km resolution with HCLIM-AROME, covering both historical and future periods under the RCP8.5 scenario. Results were compared against FWI estimates from other climate datasets, such as CORDEX and statistically downscaled NASA Earth Exchange Global Daily Downscaled Projections (NEX-GDDP).


As expected, all the simulations indicate that the annual and summer mean FWI indices will increase significantly in warmer future climates, along with an increase in days with moderate and high fire weather risk. However, the magnitude of the risk depends heavily on the climate dataset used. For instance, HCLIM-AROME simulations generally show higher FWI values in the historical period even when compared to the future projections of HCLIM-ALADIN, due to generally lower summer precipitation in the former model. Additionally, there are notable regional disparities between the HCLIM simulations, with the highest FWI values observed in coastal areas of southern Finland and Sweden. According to the HCLIM-AROME simulations under the RCP8.5 scenario, these regions experience a moderate fire risk (FWI > 11) on roughly one out of three summer days, whereas HCLIM-ALADIN simulations indicate an average of 7–20 days per summer with such risk. There are also differences in the magnitude and regional distribution of FWIs calculated from HCLIM, NEX-GDDP, and CORDEX simulations. However, all future FWI predictions consistently indicate that, without effective mitigation of global warming, conditions for forest fires will worsen in the future.

How to cite: Laakso, A., Palokangas, M., Park, T., Lipponen, A., Utriainen, L., and Mielonen, T.: Assessing the Impact of Climate Change on Forest Fire Weather Index Using Downscaled Climate Model Data, EGU General Assembly 2025, Vienna, Austria, 27 Apr–2 May 2025, EGU25-12890, https://doi.org/10.5194/egusphere-egu25-12890, 2025.

Each year brings new stories of extreme wildfires and megafires, highlighting the tragic loss of lives, destruction of homes and livelihoods, reduced air quality over vast regions, economic disruption, and cascading impacts on ecosystems and the services they provide. Science has an essential role to play in addressing these challenges, offering tools for better prediction, preparedness, mitigation, and management.
 
As I write this, wildfires in Los Angeles have captured public attention and dominated the news over the past week. Amidst the coverage, it is worth noting that scientific tools enabled warning of these events to be issued up to a week in advance. This is a clear example of the potential for science to reduce harm and save lives.
 
Once the flames settle, science also plays a key role in understanding the factors driving such events, including the contributions of climate change, land use, and management practices. These studies are crucial for highlighting the actions at both global and local scales that can help to mitigate wildfire risk to society and the environment. The quick turnaround of such studies increasingly allows scientists to provide timely insights to policymakers and other stakeholders while the events are still in the public memory.
 
This invited talk will introduce an exciting session on recent advances in understanding extreme wildfire characteristics, drivers, prediction, impacts, and mitigation strategies. I will summarise recent compelling evidence for changes in fire behaviour, including shifts towards the extreme end of historic fire regimes and differences between trends in forested and non-forested regions. I will also discuss attribution studies, which often—but not always—identify climate change as a key factor in extreme fire events. I will highlight breakthroughs in fire observation and modelling that show great potential to generate a step-change in our ability to predict extreme wildfires at the global scale.
 
Finally, I will discuss the ambitions of the State of Wildfires project to deliver annual reports that retrospectively dissect the extremes of the prior fire season globally, to keep the issue prominent in public and policy discussions, and to encourage action on climate and land use policies.

How to cite: Jones, M.: Navigating the Era of Extreme Wildfires: Scientific Solutions and Future Directions, EGU General Assembly 2025, Vienna, Austria, 27 Apr–2 May 2025, EGU25-13652, https://doi.org/10.5194/egusphere-egu25-13652, 2025.

EGU25-13730 | Orals | BG1.4

Canadian wildfire in a changing climate from the 2023 wildfire season to the 2100s 

Salvatore Curasi, Joe Melton, Vivek Arora, Elyn Humphreys, and Cynthia Whaley

Wildfire influences the carbon cycle and impacts property, harvestable timber, and public health. The year 2023 saw a record area burned of 14.9 Mha in Canada, compared to an average of ~2 Mha between 1959 and 2015. Boreal wildfire is a critical process that is difficult to represent in land surface models. To enhance our understanding of historical and future wildfire regimes in Canada and their impact on carbon cycling we implement two methods of representing boreal wildfire in the Canadian Land Surface Scheme Including Biogeochemical Cycles (CLASSIC). These include a new dynamic wildfire model that represents fire weather and lightning ignitions as well as a fire model which is forced by historical observations of burned area. We find that in 2023 simulated wildfire emissions were eight times their 1985 - 2022 mean with consequences for the annual net carbon balance in Canada. Moving into the future we find that climate change below a 2°C global target (shared socioeconomic pathway [SSP] 126) yields burned area near modern (2004 - 2014) norms by end-century (2090 - 2100). However, under rapid climate change (SSP370/585), the end-century mean annual burned area increases 2 - 4 times, compared to present-day values, approaching the burned area seen in Canada in 2023. This work illustrates the historical implications of Canadian wildfires on the carbon cycle and the future implications of climate change for area burned in Canada.

How to cite: Curasi, S., Melton, J., Arora, V., Humphreys, E., and Whaley, C.: Canadian wildfire in a changing climate from the 2023 wildfire season to the 2100s, EGU General Assembly 2025, Vienna, Austria, 27 Apr–2 May 2025, EGU25-13730, https://doi.org/10.5194/egusphere-egu25-13730, 2025.

EGU25-13777 | ECS | Posters on site | BG1.4

The Intensifying Threat of Wildfires in the Mediterranean: Quantifying the Role of Climate Change in Extreme Fire Weather Events from the Past, Present to the Future 

Zhongwei Liu, Jonathan Eden, Bastien Dieppois, Matthew Blackett, and Robert Parker

Wildfires are an increasing environmental and societal threat across the Mediterranean region. While the widespread incidence of fires during recent summers has raised significant public concern, the impact of climate change on such events is challenging to quantify, and the evolving nature of extreme wildfires in general remains underexplored. Recent work has shed light on the link between extreme fire weather and climate change, particularly with respect to diagnosing uncertainties and sensitivities, but there are few studies directly linking individual wildfire events to the changing climate and its future implications.

This study employs an established statistical method applied to a large ensemble of climate model simulations as part of a seamless probabilistic approach to quantify how past, present and future risk in extreme fire weather has and will continue to change in the future. Using climate model projections to quantify the trends of likelihoods at different global warming levels offers great potential to support probabilistic assessment of future wildfire risks in a warmer world. Results reveal that fire weather conditions associated with the particularly damaging 2022 wildfires at ten independent locations across the Mediterranean regions of southern Europe and northern Africa have collectively become 80% more likely to occur compared to a century ago due to externally-forced warming temperatures. Further increases in likelihood of 60% and 80% are projected under +1.5°C and +2°C global warming levels, respectively, with the most pronounced increases observed in Spain and southern France. The findings emphasize the profound influence of climate change on the 2022-type wildfire events, manifesting the urgency of combining individual attribution studies further with future risk assessment to help enhance post-disaster resilience to the fire-prone regions.

How to cite: Liu, Z., Eden, J., Dieppois, B., Blackett, M., and Parker, R.: The Intensifying Threat of Wildfires in the Mediterranean: Quantifying the Role of Climate Change in Extreme Fire Weather Events from the Past, Present to the Future, EGU General Assembly 2025, Vienna, Austria, 27 Apr–2 May 2025, EGU25-13777, https://doi.org/10.5194/egusphere-egu25-13777, 2025.

EGU25-13787 | ECS | Posters on site | BG1.4

Probabilistic Analysis of Extreme Wildfire events in Italy Using Data-Cube Technology 

Farzad Ghasemiazma, Andrea Trucchia, Giorgio Meschi, Nicolo Perello, Marj Tonini, Silvia Degli Esposti, and Paolo Fiorucci

Wildfires are a critical component of natural ecosystems, contributing to biodiversity by shaping habitat structures and promoting species adaptation, but also posing significant risks to human life, infrastructure, and air quality. Wildfires can be characterized by both their impact and the drivers of their occurrence. Historical data exploration is essential for researchers to build data-driven models for wildfire risk assessment and also to capture the characteristics of extreme wildfire events (EWE). Such data may include fire perimeter records, weather observations, vegetation types, and topographic details, all of which contribute to understanding the conditions that lead to extreme fire behavior. 

The first step toward achieving this goal involves establishing a comprehensive data-cube that integrates all relevant datasets for wildfire risk assessment. A data-cube framework simplifies data exploration and querying by organizing static and dynamic data (in terms of time varying) in a structured format. The data-cube stores multi-dimensional arrays, allowing for efficient analysis of spatial and temporal variations in complex datasets. Static data (e.g., digital elevation model) represent constant landscape features, while dynamic data (e.g., relative humidity or temperature) capture temporal variations. Cloud storage solutions are vital for managing the high memory requirements of data-cube structures, enabling cheaper storage and open-source availability.  

The primary aim of this study is to utilize available data-cubes to identify the conditions that characterize EWE across historical records. By analyzing spatial and temporal dynamic data related to both wildfire occurrences and predisposing meteorological factors, we want to find patterns and signatures of extreme wildfires. Furthermore, additional datasets from various domains and resolutions will be structured into a similar data-cube format for broader analysis.  

Focus will be on the Italian peninsula, leveraging on climatic data at a 3 km spatial resolution with hourly temporal intervals (Chapter Dataset, https://doi.org/10.25927/0ppk7-znk14) allowing for detailed capture of conditions surrounding extreme wildfire events. The outcomes of this study will contribute to the development of probabilistic risk assessment models, providing valuable insights for wildfire risk management and mitigation strategies. 

Keywords: Extreme Wildfire Events, Probabilistic Wildfire Risk Assessment, Data-Cube, Meteorological indices in Wildfire Risk Assessment 

How to cite: Ghasemiazma, F., Trucchia, A., Meschi, G., Perello, N., Tonini, M., Degli Esposti, S., and Fiorucci, P.: Probabilistic Analysis of Extreme Wildfire events in Italy Using Data-Cube Technology, EGU General Assembly 2025, Vienna, Austria, 27 Apr–2 May 2025, EGU25-13787, https://doi.org/10.5194/egusphere-egu25-13787, 2025.

EGU25-14597 | Orals | BG1.4

Who dies in wildfires? Common denominators of fatal wildfires in the US 

Crystal Kolden and John Abatzoglou

In the United States, catastrophic wildfires have killed hundreds of people in recent years, including two high fatality events in the 2018 Camp Fire in California and the 2023 Lahaina Fire in Hawaii. These disasters were astounding not only because so many died so quickly, but also because they represent a shift in understanding of who dies in contemporary wildfires. For much of the 20th century, the primary lives lost in wildfires were the front line firefighters at the greatest risk. Over the last two decades, however, climate change has increased the extremity of wildfire behavior and resulted in numerous catastrophic wildfire events globally where dozens of civilians were killed. Here we evaluate both the biophysical drivers of fatal wildfires in the US and the social characteristics of wildfire fatalities. Downslope winds during drought conditions at the wildland-urban interface are the primary indicators of civilian fatalities, particularly in specific forest-shrubland interface Mediterranean fuel types and in complex terrain. Social vulnerability of the resident population was also a key driver of fatalities, as older populations with lower levels of mobility struggled to evacuate with no advanced notice. Fires that killed civilians stood in stark contrast to fires that killed firefighters, which occur primarily during peak fire season during extreme heat events and in rural, relatively forested areas. These differences highlight a critical gap in understanding how to mitigate civilian wildfire fatalities.

How to cite: Kolden, C. and Abatzoglou, J.: Who dies in wildfires? Common denominators of fatal wildfires in the US, EGU General Assembly 2025, Vienna, Austria, 27 Apr–2 May 2025, EGU25-14597, https://doi.org/10.5194/egusphere-egu25-14597, 2025.

EGU25-17607 | Orals | BG1.4

Global Data-Driven Prediction of Fire Activity 

Joe McNorton

In recent years, newly available observations, and modelling systems as well as advancements in machine learning have transformed the capabilities of fire danger prediction systems. The European Centre for Medium-Range Weather Forecasts (ECMWF) has set out to forecast wildfire probability on a global scale up to a week in advance. A key milestone was the development of the SPARKY-Fuel Characteristics dataset, released in 2024, which provides the first long-term, high-resolution record of real-time fuel status.

This study evaluates ECMWF’s operational data-driven fire prediction system over its first year. Through analysis of major wildfire events, including the extensive fires in Canada in 2023 and the fires in Los Angeles in 2025, we demonstrate the potential of data-driven methods to outperform traditional fire danger metrics. The results highlight the role of dynamic, global fuel assessments and machine learning in improving the accuracy and timeliness of fire probability forecasts.

Our findings underscore the importance of integrating both innovative data-driven approaches and key variables into operational forecasting systems, providing critical support for fire management and mitigation efforts worldwide.

How to cite: McNorton, J.: Global Data-Driven Prediction of Fire Activity, EGU General Assembly 2025, Vienna, Austria, 27 Apr–2 May 2025, EGU25-17607, https://doi.org/10.5194/egusphere-egu25-17607, 2025.

EGU25-18268 | ECS | Posters on site | BG1.4

Poleward transport of smoke aerosol from extreme boreal wildfires 

Swetlana Paul and Bernd Heinold

In recent decades, surface air temperatures in the Arctic increased faster than average global temperatures. At the same time, weather conditions that favor wildfires became more frequent globally and will likely continue to do so in a warming climate. This might lead to an increase in fire activity in most areas of the world, but particularly in regions with moderate moisture supply that are rich in biomass, such as North American temperate forests and boreal forests.

Extreme wildfires potentially emit large quantities of smoke that can be elevated as high as to the stratosphere, thereby possibly leading to a long-lasting atmospheric perturbation. Smoke aerosol is mostly composed of black carbon (BC) and organic carbon (OC). While BC mainly impacts the climate by heating the atmosphere through absorption of solar radiation, OC particles are important as cloud condensation nuclei, affecting cloud and precipitation formation. In light of the rapid Arctic warming, it is crucial to understand the role of smoke aerosol from wildfires in the Arctic climate system.

Using multidecadal simulations with the global aerosol-climate model ECHAM6.3.0-HAM2.3., it is analyzed on which pathways BC and OC emitted during extreme boreal wildfire events are transported towards the Arctic and how their transport patterns differ from those of smoke particles originating from moderate boreal wildfires. The contribution from the wildfire aerosol to the total poleward aerosol flux is calculated, and it is quantified which fraction of boreal wildfire aerosol reaches the Arctic region in the course of extreme fires. Transport heights, the accurate representation of which still poses a challenge to current climate models, are compared to height-resolved measurements of smoke aerosol.

How to cite: Paul, S. and Heinold, B.: Poleward transport of smoke aerosol from extreme boreal wildfires, EGU General Assembly 2025, Vienna, Austria, 27 Apr–2 May 2025, EGU25-18268, https://doi.org/10.5194/egusphere-egu25-18268, 2025.

EGU25-18657 | ECS | Orals | BG1.4

Burning In Pantanal Driven By Wetland Degradation And Lower Precipitation 

Maria Barbosa, Douglas Kelley, Chantelle Burton, Renata Libonati, Renata Da Veiga, Igor Ferreira, and Liana Anderson

The Brazilian Pantanal, renowned for its rich ecosystems and biodiversity, is under increasing threat from more frequent and intense fires. These wildfires endanger the region's ecology, wildlife, and critical role as a carbon sink. The catastrophic fires of 2020, which burned approximately 4 million hectares, highlighted the pressing need to better understand the Pantanal’s fire vulnerability and to develop effective strategies for protecting its ecosystems and carbon storage capacity.

Using the FLAME model, we evaluated the Pantanal’s fire susceptibility in the context of climate and land cover changes. Our analysis identified shifting precipitation patterns as a key driver of fire activity. Wetland cover emerged as a mitigating factor, with regions exhibiting a doubled wetland extent requiring half as much rainfall to avoid extreme burning levels. However, reducing wetland areas due to agricultural expansion and water management has significantly increased the region's fire vulnerability. The extreme fires of 2020 were linked to a critical threshold of reduced wetland extent and precipitation; without prior wetland degradation, the fires would likely have been less severe.

Our findings emphasize the necessity of integrating wetland cover dynamics and climate extremes into the Pantanal's fire management and conservation planning. This approach is vital for bolstering the region's resilience to fire and climate change, preserving its ecological integrity, and maintaining its carbon storage potential. The FLAME model facilitates the rapid assessment of burning scenarios, providing valuable insights for early preparedness and response strategies to protect this unique and irreplaceable ecosystem.

How to cite: Barbosa, M., Kelley, D., Burton, C., Libonati, R., Da Veiga, R., Ferreira, I., and Anderson, L.: Burning In Pantanal Driven By Wetland Degradation And Lower Precipitation, EGU General Assembly 2025, Vienna, Austria, 27 Apr–2 May 2025, EGU25-18657, https://doi.org/10.5194/egusphere-egu25-18657, 2025.

EGU25-19519 | Posters on site | BG1.4

The State of Wildfires report: an annual review of fire activity and extreme events  

Douglas I Kelley, Matthew W Jones, Chantelle Burton, and Francesca Di Giuseppe and the State of Wildfires Report Co-authors

The 2023/24 fire season was marked by record-breaking burnt areas and carbon emissions in Canada, deadly blazes in Hawaii, extreme drought and smoke in the Amazon, burning in the Pantanal wetlands, and Europe's largest wildfire on record.  These events exemplify extreme wildfires' growing prevalence and far-reaching impacts on societies, ecosystems, and global climate systems. Each year, the emergence of such events raises urgent questions from policymakers, fire management agencies, and the public:

  •   How much was climate to blame?
  •   Was it caused by humans?
  •   Who is affected?
  •   How does this year compare to previous years?
  •   Will we see more fires like this in the future?
  •   What can we do to prevent or prepare for them?

The inaugural State of Wildfires report addresses these questions by systematically analysing extreme fire events from the March 2023–February 2024 fire season. It links anomalies in burned area and emissions to drivers such as high fire weather and fuel abundance. Attribution analyses revealed that climate change amplified burned area by up to 40%, 18%, and 50% in Canada, Greece, and Amazonia, respectively. The report also projects an increasing risk of future extreme fires, even under ambitious emissions pathways aimed at limiting warming to 1.5–2°C. However, impacts at these emission levels are still projected to be less severe than those in higher warming scenarios. In Canada, for example, projections suggest that fires like those of 2023 could become 6–11 times more frequent by the end of the century under medium–high emissions scenarios.

Here, we present the main insights from the report, celebrate advances in fire science that are helping to meet the challenge of extreme fires, and invite feedback from the scientific community. We seek perspectives on missing analyses, overlooked impacts, and underexplored regions to enhance future reports.

How to cite: Kelley, D. I., Jones, M. W., Burton, C., and Di Giuseppe, F. and the State of Wildfires Report Co-authors: The State of Wildfires report: an annual review of fire activity and extreme events , EGU General Assembly 2025, Vienna, Austria, 27 Apr–2 May 2025, EGU25-19519, https://doi.org/10.5194/egusphere-egu25-19519, 2025.

EGU25-19925 | Posters on site | BG1.4

Assessing the influence of climate on wildfire impacts across Mediterranean Europe 

Luiz Galizia, Christelle Castet, and Marcos Rodrigues

Wildfires occurring under warmer and drier conditions are likely to be destructive to infrastructure causing economic losses and affecting population. While climate, represented through fire weather, has been shown to be the dominant driver of wildfires there is still a lack of analyses exploring to what extent climate influences wildfire impacts. Here we examine the statistical relationship between fire weather conditions and wildfire impacts at an interannual scale across Mediterranean Europe. To do so, we combined Fire Weather Index (FWI) with burned area from the European Forest Fire Information System, as well as wildfire economic losses and affected population extracted from the EM-DAT disaster database over the period 2000–2023. Overall, most of the wildfire impacts were dominated by a few iconic events that have occurred during extreme fire seasons. Nearly 90% of the affected population and economic losses occurred when the FWI aggregated over the fire season exceeded 23 and 30 respectively. Additionally, the analysis highlighted the FWI as the main driver of burned area, showing strong positive correlations in all analyzed countries. FWI also showed moderate positive correlations with wildfire economic losses and population affected, yet these relationships varied by country. Countries more severely impacted by wildfires, such as Portugal, Spain, and Greece, exhibited stronger correlations than those less affected. These results emphasized the importance of climate variability in enabling wildfire activity and influencing impacts across Mediterranean countries. 

How to cite: Galizia, L., Castet, C., and Rodrigues, M.: Assessing the influence of climate on wildfire impacts across Mediterranean Europe, EGU General Assembly 2025, Vienna, Austria, 27 Apr–2 May 2025, EGU25-19925, https://doi.org/10.5194/egusphere-egu25-19925, 2025.

EGU25-1244 | ECS | Orals | BG1.6

Riparian zone heterogeneity influences the production and fate of biodegradable dissolved organic carbon across land-water interfaces  

Melissa Reidy, Martin Berggren, Anna Lupon, Hjalmar Laudon, and Ryan Sponseller

Transport of biodegradable organic carbon (bDOC) across land-water interfaces supports the ecological and biogeochemical functioning of northern freshwater ecosystems. Yet, we know little about how the generation and supply of terrestrial bDOC to boreal headwaters is regulated by the physical, biological, and hydrological properties of the riparian interface. We used 7-, 14- and 28- day bDOC incubations on eight occasions during the northern growing season to assess how terrestrial and aquatic bDOC concentrations differ along flowpaths connecting riparian soils to a headwater stream. We found that bDOC quantity declined along the transition from land to water, and that riparian soils had higher concentrations of bDOC compared to aquatic landscape components. Additionally, these differences corresponded to changes in the optical and chemical properties of the dissolved organic matter pool. Further, the generation of bDOC in riparian soils varied across interface types and reflected hydrogeomorphically determined differences in soil organic matter storage, groundwater level dynamics and soil microbial activity. In particular, the potential transfer of bDOC from soils to groundwater appeared largely regulated by the degree of contact between soils and lateral subsurface flowpaths. Riparian interfaces with near-constant opportunity to deliver resources laterally to streams by shallow, preferential groundwater flowpaths were found to have a relatively poor capacity to generate bDOC within local soils. At the same time, groundwater within these same interfaces had higher concentrations of bulk DOC and bDOC, likely due to connections with larger contributing hillslopes which serve as important support systems to streams during baseflow periods. Collectively, our results show that boreal headwaters are comprised of a continuum of interface types that differ in capacity to generate bDOC in near-stream soils, and in opportunity to mobilize and convey bDOC laterally. Ultimately this leads to wider variability in when and where within the broader stream network these inputs may be most important to aquatic ecosystems.

How to cite: Reidy, M., Berggren, M., Lupon, A., Laudon, H., and Sponseller, R.: Riparian zone heterogeneity influences the production and fate of biodegradable dissolved organic carbon across land-water interfaces , EGU General Assembly 2025, Vienna, Austria, 27 Apr–2 May 2025, EGU25-1244, https://doi.org/10.5194/egusphere-egu25-1244, 2025.

EGU25-1459 | ECS | Posters on site | BG1.6

Role of natural organic matter and iron(III) for methanogenesis and methane oxidation in thawing permafrost soils 

Eva Voggenreiter, Edgardo Valenzuela, Sigrid van Grinsven, and Andreas Kappler

Permafrost soils store about twice as much organic carbon as the atmosphere. In the future, certain permafrost regions will develop anoxic soil conditions due to thaw-induced soil subsidence and waterlogging. Under these conditions, methane (CH4) emissions due to decomposition of newly thawed organic carbon will likely increase. The net release of CH4 from soil depends on the availability of more energetically favorable electron acceptors than CO2, which could on the one hand suppress methanogenesis and on the other hand act as an electron acceptor for anaerobic CH4 oxidation. Since many common inorganic electron acceptors (sulfate, nitrate) are present only in low concentrations in permafrost soils, we hypothesize that natural organic matter (NOM) and/or ferric iron (Fe(III)) are more abundant and can act as significant electron acceptors. However, to which extent NOM fractions such as dissolved organic matter (DOM) and particulate organic matter (POM) as well as Fe(III) minerals influence methane production and methane oxidation in permafrost soils is unknown. In this project, we therefore aim (i) to characterize the redox-active moieties of DOM and POM fractions from permafrost soils, (ii) to quantify the effect of these NOM fractions on methanogenesis suppression and/or CH4 oxidation, and (iii) to identify the microorganisms that are able to oxidize CH4 coupled to NOM or Fe(III) reduction by performing enrichment culture experiments. To achieve this, we collected and isolated NOM from a thawing permafrost peatland in Sweden (Stordalen Mire, Abisko) across multiple thaw stages. We analyzed the changes in electron accepting and donating capacity of NOM fractions across permafrost thaw stages via mediated electrochemical reduction and oxidation, respectively. Enrichments targeting anaerobic CH4-oxidizers were set up using an inoculum from partly thawed and fully thawed permafrost thaw stages, amended with poorly crystalline Fe(III) minerals, AQDS (a model compound for redox-active moieties in NOM) and POM. In the future, microcosm experiments with isolated NOM fractions and 13C-labeled CH4 or 13C-labeled CO2 will be performed in order to quantify the influence of NOM on methane oxidation or methanogenesis suppression, respectively. Spectroscopic, isotope-tracing and molecular biology techniques will be used to track the reduction of amended electron acceptors, concentration of labeled gases and the change in abundance of targeted microorganisms. Overall, this work will help to assess the role of NOM and Fe(III) in influencing CH4 cycling in thawing permafrost peatlands.

How to cite: Voggenreiter, E., Valenzuela, E., van Grinsven, S., and Kappler, A.: Role of natural organic matter and iron(III) for methanogenesis and methane oxidation in thawing permafrost soils, EGU General Assembly 2025, Vienna, Austria, 27 Apr–2 May 2025, EGU25-1459, https://doi.org/10.5194/egusphere-egu25-1459, 2025.

In my talk, I propose that stoichiometric imbalances between microbial metabolic needs and carbon (C) : nitrogen (N) : phosphorus (P) ratios affect reactive macronutrient flows between ecosystems and in landscapes, much like how stoichiometric imbalances of macronutrients affect organism growth and nutrient cycling at smaller scales. More specifically, I hypothesize that the mismatch between microbial C : N : P ratios and biologically reactive macronutrient ratios modulates macronutrient retention and export. When microbial C : N : P matches nutrient availability, reactive macronutrients should be retained or transformed, reducing downstream transport. Conversely, stoichiometric imbalances between microbial C : N : P and reactive macronutrient C : N : P lead to excess reactive macronutrients being exported to downstream ecosystems

These stoichiometric imbalances are strongly modified by dissolved organic matter (DOM) quantity and especially by DOM composition, which defines the microbial reactivity of DOM. With laboratory microcosm and stream mesocosm experiments, colleagues and myself provide first mechanistic evidence for the importance of DOM composition for the stoichiometric modification of macronutrient flows. Furthermore, comparing global published C : N : P data from soils, lakes, and marine ecosystems, we find evidence that microbial activity uniformly modulates reactive DOM and macronutrient ratios across environments, affecting macronutrient cycling and flows, with probable secondary effects on ecosystem functioning and eutrophication. 

The proposed concept links small-scale mechanistic understanding to ecosystem-scale patterns of macronutrient cycling in inland-water ecosystem networks. This cross-scale perspective highlights the need for integrated stoichiometric experimental and monitoring research to better understand reactive macronutrient cycling and flows, with high potential for improved macronutrient management.

How to cite: Graeber, D.: Dissolved organic matter composition may be a key modifier of ecosystem-scale macronutrient reactivity and flows across the terrestrial - aquatic continuum, EGU General Assembly 2025, Vienna, Austria, 27 Apr–2 May 2025, EGU25-1926, https://doi.org/10.5194/egusphere-egu25-1926, 2025.

EGU25-5582 | ECS | Posters on site | BG1.6

How do vertical and topographic riparian soil moisture patterns shape headwater dissolved organic carbon dynamics? 

Paul D. Burkhardt, Andreas Musolff, and José L. J. Ledesma

Dissolved organic carbon (DOC) plays a fundamental role for the aquatic ecosystem and the global carbon cycle. It also interferes with drinking water treatment processes. Its removal is costly and depends on its quantity and quality, i.e. its concentration and molecular composition. Riverine DOC concentrations have increased in Europe and North America in recent decades, primarily driven by reductions in acid deposition. Currently, changing climatic conditions such as increasing temperatures, heavy rainfall events and droughts are gaining importance in determining DOC concentrations. However, the specific mechanisms by which climate variability drives riverine DOC concentrations and its chemical composition at different time scales are not sufficiently understood. Therefore, reliable forecast about future developments are challenging. In forested headwater catchments, where riparian soils are major sources of DOC export, riparian soil moisture might be paramount to determine DOC quantity and quality. Soil moisture is driven by climate variability and controls subordinate and interdependent processes that can shape DOC quantity and quality. However, limited data of soil moisture from forested headwaters and specifically from their riparian zones are available. In this context, we will study the upper Rappbode catchment in the Harz mountains, which drains into Germany’s largest drinking water reservoir. We will relate high-frequency soil moisture observations at multiple depths (vertical dimension) at different riparian profiles with differing wetness characteristics (topographic dimension) to the corresponding DOC quantity and quality over temporal scales, including short-term, seasonal/annual, and long-term by modeling. We hypothesize that currently and in future patterns of soil moisture in the vertical and topographic dimension play a pivotal role as drivers of the temporal dynamics of DOC quantity and quality in riparian soils and subsequently in the corresponding surface waters. Initial results from our sampling campaigns highlight differences in riparian soil water chemistry between the locations of different wetness characteristics, but also distinct vertical heterogeneities. We will present further findings and results that improve the understanding of how soil moisture drives riverine DOC quantity and quality, with special consideration of vertical heterogeneities in the riparian profiles.  With a refined understanding of DOC dynamics, more reliable forecasts can be made to derive targeted adaptation strategies for safe drinking water supplies and to better assess future impacts on aquatic ecosystems and the global carbon cycle.

How to cite: Burkhardt, P. D., Musolff, A., and Ledesma, J. L. J.: How do vertical and topographic riparian soil moisture patterns shape headwater dissolved organic carbon dynamics?, EGU General Assembly 2025, Vienna, Austria, 27 Apr–2 May 2025, EGU25-5582, https://doi.org/10.5194/egusphere-egu25-5582, 2025.

EGU25-5834 | Posters on site | BG1.6

Carbon removal mechanisms and microbial dynamics in constructed wetlands of differing depths 

Johanna Sjöstedt, Kevin Jones, Jasmin Borgert, and Antonia Liess

Climate change has intensified the mobility of dissolved organic matter (DOM) from land into aquatic ecosystems leading to increased brownification and hypoxia. Constructed wetlands (CWs) offer a potential mitigation strategy but optimal wetland design with respect to DOM removal remains underexplored. This study examined how depth and water residence time (WRT) affect DOM processing in experimental CWs during summer and fall. Organic matter was added to mimic brownification, and DOM changes were tracked using fluorescence spectroscopy and microbial activity measurements. A key finding was that labile DOM degrades rapidly within the first two days. At longer WRT shallow CWs released terrestrial-like fractions potentially increasing downstream brownification, while deep CWs showed sustained DOM degradation and slower internal production, potentially reducing downstream brownification. Based on spectral ratios it was found that microbial processes dominated DOM degradation, although photodegradation played a significant role during summer. Strong correlations between bacterial processes and DOM composition, highlight the critical role of labile carbon in driving microbial activity. Bacterial production correlated strongly with labile DOM fractions (Peaks T and M), while bacterial respiration, correlated with both labile and humic-like DOM fractions. Our results suggest that CWs can be optimized as tools for mitigating climate change impacts and improving water quality, ensuring long-term ecological sustainability. In addition, our findings advocate for integrating shallow and deep systems in series to maximize carbon removal, minimize brownification, and adapt to seasonal variability.

How to cite: Sjöstedt, J., Jones, K., Borgert, J., and Liess, A.: Carbon removal mechanisms and microbial dynamics in constructed wetlands of differing depths, EGU General Assembly 2025, Vienna, Austria, 27 Apr–2 May 2025, EGU25-5834, https://doi.org/10.5194/egusphere-egu25-5834, 2025.

EGU25-6561 | ECS | Posters on site | BG1.6

Climate-change impacts on dissolved organic matter in glacier-fed streams 

Jingyi Hou, Hannes Peter, Nicola Deluigi, Oriana LIanos-Paez, and Tom Battin

Mountain glaciers are vanishing worldwide because of climate change, triggering cascading downstream effects. Today, glaciers are recognized as stores of dissolved organic matter (DOM), which once released, can support the microbial metabolism and food webs in glacier-fed streams. This glacier-derived DOM is often reported to be ancient and highly bioavailable. However, our understanding of how such DOM may change in the future, as mountain glaciers continue to melt, remains limited.

We aimed to determine whether the quantity and quality of DOM in glacier-fed streams are shifting as glaciers retreat. Leveraging DOM data from the Vanishing Glaciers project and using a space-for-time substitution approach, we investigated how both DOM quantity and quality may change across a wide range of glacier-fed streams worldwide. We analyzed optical properties of DOM sampled as close to the glacier snout as possible in 181 glacier-fed streams draining the world’s major mountain ranges. Dissolved organic carbon (DOC) concentrations in these streams were very low (median: 146.3 ppb, interquartile range (IQR): 99.4-211.7 ppb). Parallel Factor Analysis (PARAFAC) identified six major DOM components, highlighting a dominance of proteinaceous compounds in the glacier-fed streams. Furthermore, by integrating additional optical measures, such as fluorescence (median: 1.5, IQR: 1.3-1.7), humification (median: 0.4, IQR: 0.2-0.5) and biological (median: 1.6, IQR: 1-2.3) indices, we will characterize DOM composition and potential sources. These data will be compared to glacier coverage, stream water stable isotopes, major ions, the mineralogical composition of suspended sediments and benthic chlorophyll a. Our unique large-scale dataset allows us to improve current understanding of DOM dynamics and related carbon cycling in glacier-fed aquatic ecosystems, which are now changing at an unprecedented pace because of climate change.

How to cite: Hou, J., Peter, H., Deluigi, N., LIanos-Paez, O., and Battin, T.: Climate-change impacts on dissolved organic matter in glacier-fed streams, EGU General Assembly 2025, Vienna, Austria, 27 Apr–2 May 2025, EGU25-6561, https://doi.org/10.5194/egusphere-egu25-6561, 2025.

Land use is a primary driver of the spatial distribution of soil organic carbon (SOC) and significantly influences the terrestrial carbon cycle. This study used the SWAT-C model to simulate the export of SOC, dissolved organic carbon (DOC), and particulate organic carbon (POC) in the Wu River Basin, analyzing the effects of land use on SOC spatial distribution. Model calibration with 2012–2017 total organic carbon (TOC) data achieved Nash-Sutcliffe efficiency values above 0.7, confirming reliability. The simulated results showed an average annual TOC export of 17.3 kgC/ha, with DOC and POC contributing 10.38 kgC/ha and 6.9 kgC/ha, respectively. Bare land had the highest POC export (66.7 kgC/ha), followed by dry cropland (32.3 kgC/ha), while urban areas and coniferous forests exhibited the highest DOC exports (15.1 and 12.4 kgC/ha, respectively). SOC storage was highest in rice field (313 tonC/ha) and lowest in bare land (175 tonC/ha). Sub-watersheds dominated by bare land and dry cropland recorded TOC exports exceeding 21 kgC/ha, marking them as future SOC export hotspots. These findings highlight the significant influence of land use on SOC distribution and provide a scientific basis for ecosystem service preservation, and sustainable watershed management.

Key words: Soil organic carbon, SOC storage, SWAT-C model, land use, Taiwan

How to cite: Lin, G.-Z. and Chiang, L.-C.: Evaluating the impact of land use on soil organic carbon spatial distribution by SWAT-C model – a case study of the Wu River Basin, Taiwan, EGU General Assembly 2025, Vienna, Austria, 27 Apr–2 May 2025, EGU25-7919, https://doi.org/10.5194/egusphere-egu25-7919, 2025.

EGU25-8762 | Orals | BG1.6

Does DOM composition help explain bioavailable macronutrient concentrations in organic matter-rich freshwaters? 

Martin Berggren, Mayra P. D. Rulli, Ann-Kristin Bergström, Ryan A. Sponseller, and Geert Hensgens

Dissolved organic matter (DOM) is a major source of macronutrients in freshwaters, yet has variable and poorly understood bioavailability to bacteria and other organisms. Because intrinsic variation in bioavailability is caused by chemical structures of organic nutrients, DOM composition data should improve predictions of bioavailable resource pool sizes. We hypothesized that bioavailable organic carbon (C) and nitrogen (N) fractions are made up of freshly produced humic- and protein-like DOM, respectively, whereas bioavailable phosphorus (P) is linked to microbially-derived DOM with potential organophosphate content and/or to chemical structures associated with DOM-Fe-phosphate complexes. These ideas were tested in eight, unproductive and organic matter-rich stream and lake sites, where we performed C, N and P bioassays with bacteria in combination with analyses of DOM composition using fluorescence excitation-emission matrix (EEM) analysis. Bioavailable C followed the predicted patterns, with strong links to fluorescent features indicating recently produced DOM. Surprisingly, bioavailable N was poorly related to DOM composition, including protein-like fluorescence, and was instead driven mainly by the amount of inorganic N. Bioavailable P was best linked to microbially-derived organic components. The standard nutrient variables explaining most of the bioavailable total dissolved C, N and P, respectively, were dissolved organic carbon, dissolved inorganic nitrogen and total phosphorus. In addition, DOM composition variables made significant unique contributions to explaining the variance in bioavailable C (19%), N (13%) and P (18%). Overall, DOM composition analysis is a promising tool to improve prediction and develop our understanding of bioavailable macronutrients in organic matter-rich freshwaters.

How to cite: Berggren, M., Rulli, M. P. D., Bergström, A.-K., Sponseller, R. A., and Hensgens, G.: Does DOM composition help explain bioavailable macronutrient concentrations in organic matter-rich freshwaters?, EGU General Assembly 2025, Vienna, Austria, 27 Apr–2 May 2025, EGU25-8762, https://doi.org/10.5194/egusphere-egu25-8762, 2025.

EGU25-9125 | ECS | Posters on site | BG1.6

Modelling Total Organic Nitrogen Concentrations in Danish Streams using Machine Learning 

Rasmus R. Frederiksen, Søren E. Larsen, and Brian Kronvang

Total organic nitrogen (TON) constitutes almost 20% of the total nitrogen (TN) riverine loadings to Danish coastal waters. Thus, knowledge about the TON concentrations in streams and its spatial variation is essential to accurately assess the importance of TON for TN loadings to coastal waters and thereby achieving a more precise basis for calculation of the sources of TON in catchments.

We used environmental monitoring data from 390 stream stations across Denmark for the period 2018-2021to calculate indirectly measured annual and seasonal average TON concentrations (~1,500 samples) along with a wide range of predictor variables. TON samples showed a mean annual TON concentration in Danish streams amounting to 0.70 mg L-1 with a standard deviation of 0.31 mg L-1 and revealed a relatively high spatial variability.

We trained a machine learning model to learn spatial and temporal patterns in our TON data set for prediction of spatially distributed annual and seasonal average TON concentrations in Danish streams in ungauged basins. Furthermore, we utilized quantile regression to estimate the uncertainty on model predictions, and we utilized quantile regression in combination with the Shapley additive explanations (SHAP) approach to investigate how the importance and influence of predictor variables vary across TON’s entire distribution.

The annual TON concentration is modelled with a root-mean-squared error of 0.20 mg L-1. The new national annual average TON concentration model is largely driven by the mean elevation (negative), the percentage of agricultural land (positive), the percentage of tile drained areas (positive), and the percentage of lakes (positive).

The predicted annual average TON concentrations were generally higher than the measured average annual TON concentrations, with an overall mean of 0.84 mg L-1, probably because catchments in the training data generally had higher mean elevations (DEM) than the prediction catchments as many ungauged catchments are located near the coast

The developed model and national TON maps contribute to our understanding of annual TON concentrations in streams supporting national-scale land-use and water management.

How to cite: R. Frederiksen, R., E. Larsen, S., and Kronvang, B.: Modelling Total Organic Nitrogen Concentrations in Danish Streams using Machine Learning, EGU General Assembly 2025, Vienna, Austria, 27 Apr–2 May 2025, EGU25-9125, https://doi.org/10.5194/egusphere-egu25-9125, 2025.

It is generally known that one of the important objectives of EU countries is to improve the quality of water in water bodies.  The quality of the water in the Gulf of Tallinn is poor. Nitrogen and phosphorus compounds in coastal water and stormwater discharges have been studied, but very little is known about the role of dissolved organic matter, chemical properties and relationship with pollutants. It is important to be aware of the role of carbon compounds as nutrients, the high content and inflows into the coastal sea can lead to the proliferation of algae and bacteria, the reduction of dissolved oxygen in water, etc. The impact of algae on the water quality in the Tallinn Bay is a significant problem and can also worsen the water quality of Pirita beach. The main concern of bad water quality has been considered eutrophication, which causes algal bloom near coastline of Tallinn Bay.   

In recent years, stormwaters from Tallinn are believed to be the main cause of high nutrient levels. In present study the intention was to investigate different factors by measuring the concentrations of organic carbon, total, inorganic and organic phosphorus and nitrates in different locations of the coastal seawater. The concentrations of phosphorus and nitrate were determined by spectrophotometry, organic carbon by HPLC.  Detailed characterization of dissolved organic matter was carried out in order to identify sources of organic matter that has entered the water. As a result, it should become clear whether, in addition to the study of nitrogen and phosphorus compounds in coastal water, it would be expedient and necessary to monitor and characterize natural organic matter.

The aims of present study were:  to determine the organic carbon, phosphorus and nitrate in coastal seawater near the stormwater discharge outlets; to investigate the climatic factors (rainfall, temperature), and freshwater inflow (River Pirita); to compare the results with average nutrient levels in the Gulf of Finland; to assess the condition of Tallinn Bay according to legislation.

The study results indicated that nutrient levels in the coastal seawater of the Tallinn Bay area were remarkably higher than average nutrient levels in the Gulf of Finland. According to legislation, the status class of Tallinn Bay is mainly poor, based on total phosphorus data and bad or even worse, based on nitrate data. Stormwaters did not increase nitrate and total phosphorus contents substantially and they mainly affected total phosphorus concentrations near the discharge outlets. River Pirita was identified as the major source of nitrates, but not of phosphorus. Further studies are required to obtain a complete picture about nutrient flows to Tallinn Bay.

How to cite: Lepane, V.: The coastal seawater quality evaluation based on organic carbon, nitrogen and phosphorus data of Tallinn Bay, Estonia, EGU General Assembly 2025, Vienna, Austria, 27 Apr–2 May 2025, EGU25-10057, https://doi.org/10.5194/egusphere-egu25-10057, 2025.

EGU25-11554 | Orals | BG1.6

Impact of agriculture and water paths on organic nitrogen loss to Danish headwater streams 

Brian Kronvang, Rasmus J. Petersen, Jonas Rolighed, Mette Thorsen, Rasmus R. Frederiksen, Søren E. Larsen, Anne Hasselholt, Birgitte Hansen, Hyojin Kim, Tobias Goldhammer, Daniel Graeber, and Dominik Zak


Worldwide, farming activities exert strong impacts on the amount and molecular composition of dissolved organic matter (DOM), which constitutes an important vector of organic nitrogen (ON) transport from soils to the aquatic environment (Graeber et al., 2015). However, there are major knowledge gaps on the drivers of ON loss to water courses. In Denmark, stream data from the Danish national monitoring program (NOVANA) shows that total ON currently accounts for nearly 20 % of the annual total N loading to Danish coastal waters. In a recently initiated research project ‘orgANiC’ we are investigating the loss and fate of ON forms in five smaller agricultural catchments across Denmark (Petersen et al., 2021).

We are measuring dissolved ON (DON) and particulate ON as well as dissolved organic matter (DOM) and particulate organic matter (POM) in various source waters (soil water and groundwater), pathways (tile drains and surface runoff), and receiving streams using a comprehensive array of sampling technologies. In soil water we utilize suction cups taking weekly composite water samples, in groundwater we sample from near-surface (app. 1-5 m below surface) screens in boreholes using the Montejus principle, and in tile drains, surface runoff from fields and streams we are taking both grab samples and automated ISCO samples. These are activated when the hydrograph levels and hydrograph gradients exceed certain thresholds, determined from analysis of the long-term hydrograph data.

We are performing both indirect (total N minus inorganic N) and direct analysis of DON (size exclusion chromatography) on water samples from the different hydrological compartments. The loss of particulate ON (PON) is also monitored in tile drainage water, surface runoff and streams as these three hydrological paths are believed to be of increasing importance with the observed increase in extreme weather conditions. In the presentation we will share our current insights into the challenges of indirect DON measurements across different hydrological pathways by comparing it with direct measurements of DON and PON. We will also demonstrate how the concentrations and composition of ON fractions vary across the agricultural catchments under investigation as they represent different soil types, climate conditions and agricultural management (crops, fertilization, etc.).


References

Graeber, D., I. G. Boëchat, F. Encina-Montoya, and others. 2015. Global effects of agriculture on fluvial dissolved organic matter. Scientific Reports 5: 16328. doi:10.1038/srep16328.

Petersen, RJ, Blicher-Mathiesen, G, Rolighed, J, Andersen, HE & Kronvang, B 2021, 'Three decades of regulation of agricultural nitrogen losses: Experiences from the Danish Agricultural Monitoring Program', Science of the total Environment 787: 147619. https://doi.org/10.1016/j.scitotenv.2021.147619


How to cite: Kronvang, B., Petersen, R. J., Rolighed, J., Thorsen, M., Frederiksen, R. R., Larsen, S. E., Hasselholt, A., Hansen, B., Kim, H., Goldhammer, T., Graeber, D., and Zak, D.: Impact of agriculture and water paths on organic nitrogen loss to Danish headwater streams, EGU General Assembly 2025, Vienna, Austria, 27 Apr–2 May 2025, EGU25-11554, https://doi.org/10.5194/egusphere-egu25-11554, 2025.

EGU25-12105 | ECS | Orals | BG1.6

Low-Intensity Surface Fires and Dissolved Organic Matter: Unraveling Post-Fire Carbon Dynamics in Northern European Boreal Forest Soils 

Mathilde Rebiffé, Lukas Kohl, Egle Köster, Markku Keinänen, Frank Berninger, and Kajar Köster

Recent studies highlight a concerning reality: wildfires are becoming more frequent and intense, particularly in northern high-latitude regions where temperatures are rising fastest. Boreal forests, vital carbon (C) reservoirs, play a key role in long-term C storage and climate regulation. However, climate change-driven increases in wildfire frequency, intensity, and severity threaten to turn these soils from C sinks into sources, disrupting soil biogeochemical cycles and hindering forest recovery and ecosystem resilience. Fire significantly alters soil organic matter (SOM) and C cycling processes, particularly impacting soil dissolved organic matter (DOM). In boreal forests of Northern Europe, low-intensity surface fires are common, but their short-term effects on soil DOM dynamics remain poorly understood. We aimed to investigate the short-term effects of a low-intensity surface fire on post-fire DOM properties and dissolved organic carbon (DOC) content in boreal forest soils.
Fieldwork was conducted in a dry Scots pine boreal forest of Eastern Finland (Ruunaa, North Karelia) that underwent a prescribed restoration fire on June 30th, 2022. The burning resulted in a non-stand replacing surface fire of low intensity and severity. To capture short-term post-fire responses, we compared DOC content, δ¹³CDOC, and DOM absorbance properties in soil water and throughfall collected from burned and unburned control plots during the first growing season following the burning (from July to October 2022). DOM was analyzed for changes in concentration and isotope composition with a coupled elemental analyzer and mass spectrometer (EA-IRMS), while changes in DOM chemical composition were characterized using UV-visible absorbance spectrophotometry.
Our results indicated that soil DOC contents declined immediately after the fire in burned plots compared to control ones, accompanied by slight enrichment of burned soils DOM in ¹³C. These findings suggest reduced availability of labile C substrates following SOM and biomass combustion, fire-induced reduction of the microbial biomass, and introduction of newly formed pyrogenic carbon (PyC), which has a lower proportion of lignin-derived ¹³C. Additionally, the soil DOM from burned soils showed slightly higher degrees of aromaticity and molecular weights, indicating a shift towards more aromatic and recalcitrant compounds, suggesting the presence of a more stable C pool in the soil water of fire-affected soils.
Our findings emphasize the crucial role of low-intensity surface fires in influencing DOM dynamics and provide vital insights for understanding the post-fire soil C cycling and ecosystem recovery in boreal forests of Northern Europe. Understanding these dynamics is crucial for improving C balance models in these forests and equipping policymakers and forest managers with the tools needed to enhance resilience in one of the planet’s most vital ecosystems.

How to cite: Rebiffé, M., Kohl, L., Köster, E., Keinänen, M., Berninger, F., and Köster, K.: Low-Intensity Surface Fires and Dissolved Organic Matter: Unraveling Post-Fire Carbon Dynamics in Northern European Boreal Forest Soils, EGU General Assembly 2025, Vienna, Austria, 27 Apr–2 May 2025, EGU25-12105, https://doi.org/10.5194/egusphere-egu25-12105, 2025.

EGU25-12124 | ECS | Orals | BG1.6

Long-term manuring of soil results in divergent responses of dissolved and particulate organic matter on the molecular level 

Carsten Simon, Konstantin Stumpf, Klaus Kaiser, Marcel Lorenz, Thomas Maskow, Anja Miltner, Ines Mulder, Sören Thiele-Bruhn, and Oliver Lechtenfeld

Manure addition increases amounts of soil organic matter (SOM), water-extractable organic matter (WEOM), microbial biomass, and microbial activity. Mass balances have shown that soil organic C build-up is paralleled by a comparatively low retention of the added manure C, which also declines substantially with time. The implications for SOM’s molecular composition are not fully understood, but imply transformation of manure-derived organic matter as a main driver of C accumulation. We studied four long-term manured soils (24-118 years) to unravel potential mechanisms of manure turnover and SOC build-up on the molecular level. Soils were sampled a year after the last manure application.

Bulk SOM and manure were studied directly via solid-state laser desorption ionization Fourier transform ion cyclotron resonance mass spectrometry (LDI-FT-ICR-MS). The LDI-FT-ICR-MS results indicated that manure increased SOM's energetic potential by +0.9 ± 0.2 kJ/mol C (1.5 ± 0.4%), and this trend was confirmed by bulk elemental analysis (+5.4 ± 2.8 kJ/mol C; 12.6 ± 6.5%).  The addition of manure changed the composition of SOM components corresponding to 3–16 % of the total ion abundance compared to the controls, with the higher proportions found in longer running field trials. However, marker compounds directly related to manure explained only 2–12% of the molecular changes, while markers unrelated to the original manure signatures explained 67–84%. Long-term manure addition resulted in increased saturation, oxidation, and molecular weight, and decreased aromaticity of SOM as compared to unfertilized soils. Accumulated molecules had a higher energetic potential and, despite being chemically similar to the original manure, a higher mass, suggesting that manure-derived building blocks were used for the microbial synthesis of larger molecules. Molecules with lower energetic potential disappeared in manured soil samples, mirrored by a higher oxidation state of WEOM. Consequently, we also found higher water-extractable organic C yields (normalized to soil organic C) in manured samples.

To reveal potential sources of these oxidized compounds, WEOM was studied by liquid-state FT-ICR-MS coupled with liquid chromatography, and compared to representative necromass extracts (plant, fungal, bacterial). Our results indicated a clear shift towards a more bioavailable, complex, necromass-dominated but oxidized WEOM fraction in manured soils. This finding markedly differs from the tendency towards more strongly reduced SOM, which was determined by solid-state measurements. The overlap with necromass FT-ICR-MS signatures suggested a dominant bacterial control of the changes in WEOM properties and also resulted in a stronger imprint of oxidized plant markers. Yet, the dominant fraction (83% of ion abundance) explaining the shift in oxidation state was not associated to any necromass type. This indicates an oxidation of the existing SOM reserves (“priming”).

Together, the combination of solid- and liquid-state FT-ICR-MS techniques provided complementary insight, demonstrating how manure addition affects the long-term SOC balance mirrored by SOM and WEOM composition. The comparison with potential endmembers (necromass extracts, manure) provided valuable insight into pathways of SOM turnover and will allow to identify novel process markers for future studies.

How to cite: Simon, C., Stumpf, K., Kaiser, K., Lorenz, M., Maskow, T., Miltner, A., Mulder, I., Thiele-Bruhn, S., and Lechtenfeld, O.: Long-term manuring of soil results in divergent responses of dissolved and particulate organic matter on the molecular level, EGU General Assembly 2025, Vienna, Austria, 27 Apr–2 May 2025, EGU25-12124, https://doi.org/10.5194/egusphere-egu25-12124, 2025.

EGU25-12453 | Orals | BG1.6

The role of dissolved organic carbon for the export of iron from catchments 

Stefan Peiffer, Luisa Hopp, Angelika Kölbl, Burkhard Beudert, and Oliver Lechtenfeld

Export of dissolved organic carbon (DOC) from catchments to streams has increased in the last decades in many catchments across the Northern hemisphere. Mobilisation of DOC from riparian soils and wetlands is highly dependent on discharge and is triggered by storm events. In many cases a very strong correlation between DOC and Fe concentrations during storm events can be observed in the streams suggesting joint source areas and mobilisation mechanisms. In this contribution we will discuss causes and mechanisms of Fe transfer from catchments into aquatic systems. Analyses of Fe species from a 40-years sample archive from the Große Ohe Catchment in the Bavarian Forest National Park indicated that between 60 and 100 % of the dissolved Fe determined were in the reduced form Fe(II). Thus, a substantial amount of redox equivalents will thus be exported from catchments, and the implications for e.g. the oxygen budget of streams will be discussed.

How to cite: Peiffer, S., Hopp, L., Kölbl, A., Beudert, B., and Lechtenfeld, O.: The role of dissolved organic carbon for the export of iron from catchments, EGU General Assembly 2025, Vienna, Austria, 27 Apr–2 May 2025, EGU25-12453, https://doi.org/10.5194/egusphere-egu25-12453, 2025.

EGU25-12630 | Orals | BG1.6

Mineral associated organic matter in practice 

Mark Smits

Soil organic matter (SOM) plays a vital role in most soil functions related to agriculture. It is a building block of soil structure, it buffers pH and nutrient availability, and it supports the soil food web. Up to now in agricultural practices, including agriculture labs, SOM has only been characterized as one pool. Recently, more attention has been on the fractionation into particulate organic matter (POM) and mineral associated matter (MAOM) in relation to SOM dynamics. MAOM will be the most stable pool of SOM and mineralization is probably dominated by rhizosphere processing, and therefore controlled by plant nutrient demand. Based on the idea that microbial biology plays a key role in both the formation and degradation of MAOM, we propose that adjusting agricultural management to optimize the build-up of MAOM is the way forward in minimizing nutrient losses to surface waters.

In this study we measured POM and MAOM, based on size fractionation, in pairs of agricultural plots with contrasting soil management. Furthermore we followed mineralization rate via continuous measurements of EC, moisture content and soil temperature, and based on ion-binding resin bags placed at 10, 30 and 60 cm depth.

Overall, texture is a strong predictor of the amount of MAOM, but on top the application of compost appears to have a positive effect, both on grass- and cropland. But we have indications that in some cases our MAOM fractions are dominated by fine POM, probably caused by the practice of incorporation of organic manure into the soil. Initial results show that nitrogen leaching is more associated with POM than with MAOM.

How to cite: Smits, M.: Mineral associated organic matter in practice, EGU General Assembly 2025, Vienna, Austria, 27 Apr–2 May 2025, EGU25-12630, https://doi.org/10.5194/egusphere-egu25-12630, 2025.

EGU25-12677 | ECS | Orals | BG1.6

Carbon Cycling in Estuarine Marshes: A Focus on DOC Stabilization and Mobilization Pathways 

Sharjeel Ashfaq, Friederike Neiske, Joscha N. Becker, and Annette Eschenbach

Coastal wetlands are vital to global carbon cycling because they can store large amounts of Soil Organic Carbon (SOC). These ecosystems are influenced by complex interactions between salinity, flooding frequency and vegetation, which affect the formation, stabilization and mobilization of Dissolved Organic Carbon (DOC). Stabilization mechanisms, including mineral association and aggregation, are critical for long-term SOC storage, with Mineral-Associated Organic Matter (MAOM) being the dominant mechanism. However, the mechanisms driving DOC mobilization in estuarine marshes, particularly spatial and seasonal variabilities and the effects of climate and vegetation, remain poorly understood.

This study addresses these gaps by examining how seasonal fluctuations driven by biotic factors impact DOC concentrations in marsh soils along salinity and flooding gradients. As a part of 12 months field study, pore-water samples are being collected monthly using suction cups in nine marsh zones along the Elbe Estuary, representing a salinity gradient (salt, brackish, and freshwater marshes) and flooding gradients (pioneer, low, and high zones) at depths of 10 cm and 30 cm. The collected samples are analyzed for Non-Purgeable Organic Carbon (NPOC), anions, and Iron (Fe) concentration. Preliminary results revealed that NPOC concentrations were consistently higher in salt marshes compared to brackish and freshwater marshes. Pioneer zones exhibited the highest NPOC concentrations, particularly at 30 cm depth, highlighting the interaction of site and elevation as key factors driving spatial variability. Seasonal trends showed elevated NPOC levels during summer, followed by declines in autumn, likely driven by increased organic matter decomposition during warmer periods. Our results indicate a negative correlation between NPOC and Fe concentrations, suggesting that redox-driven mechanisms, such as Fe reduction, play a critical role in DOC stability and release. In conclusion, DOC mobilization in the Elbe Estuary is strongly influenced by salinity and flooding gradients, with higher concentrations in salt marshes and during summer. Understanding DOC dynamics in tidal marshes is essential for predicting the impacts of climate change on carbon cycling within estuarine ecosystems. As global sea levels rise and salinity gradients shift, this research provides important baseline knowledge to inform strategies for protecting the carbon sinks of coastal wetlands.

How to cite: Ashfaq, S., Neiske, F., Becker, J. N., and Eschenbach, A.: Carbon Cycling in Estuarine Marshes: A Focus on DOC Stabilization and Mobilization Pathways, EGU General Assembly 2025, Vienna, Austria, 27 Apr–2 May 2025, EGU25-12677, https://doi.org/10.5194/egusphere-egu25-12677, 2025.

EGU25-13097 | ECS | Orals | BG1.6

Bioavailability of dissolved organic carbon in Icelandic glacial streams changes seasonally and with distance from the glacier 

Ann-Kathrin Wild, Christina Fasching, Jonas Baum, and Peter Chifflard

Glaciers impact carbon cycling in downstream ecosystems by releasing diverse and bioavailable dissolved organic carbon (DOC). However, our understanding of organic carbon (OC) dynamics in Icelandic glaciers remains limited, as most studies have focused on other glacial regions and often lack seasonal-scale resolution.

In this study, we investigate the bioavailability of glacial OC from Icelandic streams using incubation experiments. We sampled Virkisá on a seasonal scale (a total of 72 incubation experiments) and supplemented these samples with additional data from the glacial streams Skaftafellsá, Svínafellsá, Kvíárjökull, and Fjallsá for comparison. In the glacial stream Virkisá, DOC concentrations were highest in spring at the onset of the melt season (0.18 ± 0.11 mg/L) and lowest in autumn (0.08 ± 0.02 mg/L). Notably, we observed not only seasonal variability in DOC concentrations but also in the bioavailability of glacial OC. At the glacier outlet, DOC bioavailability was consistently negative throughout the year (-18.18%), indicating DOC production during incubation experiments. Similarly, negative BDOC values (ranging from -1.44% to -24.1%) were confirmed in four other glacier-fed streams during summer, discharging from the ice cap Öræfajökull. However, further downstream, incubation experiments revealed seasonal shifts: negative bioavailable DOC (BDOC) values in spring (-18.04% at 900 m from the glacier outlet) and positive values in summer (55.55% at the same site), likely reflecting increased biological activity and DOC consumption during summer.

Overall, BDOC values showed a positive correlation with distance from the glacier. At the furthest sampling point, 3000 m from the glacier outlet, BDOC averaged +8.21% in spring and 57.02% in summer. These findings challenge previous reports of high glacial OC bioavailability and underscore the need for a more in-depth understanding of the chemical and biological processes in glacier-fed streams, particularly at a seasonal scale—a factor often neglected in studies due to the difficult accessibility of glaciers during winter.

How to cite: Wild, A.-K., Fasching, C., Baum, J., and Chifflard, P.: Bioavailability of dissolved organic carbon in Icelandic glacial streams changes seasonally and with distance from the glacier, EGU General Assembly 2025, Vienna, Austria, 27 Apr–2 May 2025, EGU25-13097, https://doi.org/10.5194/egusphere-egu25-13097, 2025.

EGU25-13310 | Orals | BG1.6

Redox and pH driven mobilisation of dissolved organic carbon from boreal wetlands 

Benny Selle, Klaus-Holger Knorr, Fredrik Lidman, Anja Hortmann, Martin Škerlep, and Hjalmar Laudon

Boreal and subarctic wetland soils accumulated at least 550 Gt of organic carbon (OC) over the last 10,000 years, a large part of which is associated with Fe and Al (hydr)oxides as coprecipitates and via adsorption processes. Mobilisation of some of these pools via dissolved organic carbon (DOC) from soils to streams could be enhanced by reduction of ferric iron - triggered by rising water tables and oxygen depletion - via two distinct processes. Fe reduction can (i) directly release coprecipitated OC if iron (hydr)oxides are reductively dissolved and (ii) release OC by desorption from mineral surfaces if pH increases with Fe reduction, which is referred as to indirect (redox driven) mobilisation here. Both redox driven direct and indirect mobilisation likely occur under relatively wet and warm conditions such as during rewetting in the vegetation period. However, the relative importance of reductive dissolution of Fe-OC associations versus desorption of OC and its controlling factors are still unclear under field conditions as they were only investigated in the lab so far. Therefore, the relative importance of direct versus indirect mobilisation of OC and its controlling factors was studied for twelve catchments of the Krycklan research site in boreal Sweden. From long term monitoring data on stream discharges, DOC and Fe, molar DOC/Fe ratios of riparian soil waters released into the stream during rewetting of catchments in summer were computed using Generalised Additive Models. From these ratios, the relative importance of desorption for total DOC mobilisation via Fe reduction was calculated assuming a constant DOC/Fe ratio for direct mobilisation, i.e. the ratio at which OC and Fe occur in coprecipitates. DOC/Fe ratios were found to be positively correlated with average DOC concentrations in streams (coefficient of linear correlation of ρ = 0.78), and with the fraction of forest covered by spruce (ρ = 0.81). Higher reactive Fe/Al contents and hence larger mineral surfaces may be linked to spruce forest promoting intense weathering of soil’s primary minerals. Both high DOC in porewater (DOC in the stream as a proxy) and large mineral surfaces (spruce cover as a proxy) are required for desorption (indicated by relatively high DOC/ Fe ratios) to happen. If direct release of DOC with Fe reduction was accompanied by additional indirect mobilisation via a pH dependent desorption, up to twelve times more DOC was released for the same amount of Fe (hydr)oxides being reduced - compared to direct mobilisation via dissolution of iron (hydr)oxides alone. Mobilisation processes driven by Fe reduction and subsequent pH increase may intensify with climate change by enhanced drying and wetting cycles in boreal systems such as Krycklan.

How to cite: Selle, B., Knorr, K.-H., Lidman, F., Hortmann, A., Škerlep, M., and Laudon, H.: Redox and pH driven mobilisation of dissolved organic carbon from boreal wetlands, EGU General Assembly 2025, Vienna, Austria, 27 Apr–2 May 2025, EGU25-13310, https://doi.org/10.5194/egusphere-egu25-13310, 2025.

From a limnological perspective, dissolved organic matter (DOM) can originate from allochthonous sources on the landscape or from autochthonous sources within the water body itself. In many streams and lakes, allochthonous organic materials contributing to the DOM are derived from terrestrial plants, plant litter, and soil organic material, which all include some products of microbial growth and decay. The many streams in the McMurdo Dry Valleys (MDV) provide an opportunity to understand the biogeochemistry of DOM derived solely from microbial phototrophs and heterotrophic bacteria because of the absence of plants on the barren landscape and the abundant perennial microbial mats in the stream channels. Analysis of the 20-year record of dissolved organic carbon concentrations in the streams indicates that biogeochemical processes in microbial mats and the hyporheic zone support chemostasis for DOC in these streams. Even though the stream DOC concentrations are typically quite low, about 1 mg C/L or less, we were able to use fluorescence spectroscopy to chemically characterize the DOM samples from a broad array of meltwater streams.  Many streams had a distinct “humic-like” signature and some presence of an “amino-acid like” signature. In contrast,  a short dilute stream that does not support mats and primarily receives DOM from the surface of the glacier had an “amino-acid like” and only a weak “humic-like” fluorescence signature. The presence of a “humic-like” signature may indicate a source from organic matter pools in the hyporheic zone which accumulate due to advection of microbial mat material from the channel. Autochthonous organic matter pools may also influence DOC concentrations in temperate streams.  In addition, stream DOM may represent a labile DOM source to the lakes that contributes to supporting the mixotrophic phytoplankton communities.

How to cite: McKnight, D. and Zeglin, L.: Dissolved organic matter biogeochemistry in the McMurdo Dry Valleys, Antarctica: varying chemical quality of microbially-derived DOM in glacial meltwater streams , EGU General Assembly 2025, Vienna, Austria, 27 Apr–2 May 2025, EGU25-14768, https://doi.org/10.5194/egusphere-egu25-14768, 2025.

EGU25-15543 | ECS | Orals | BG1.6

Tracing the export of terrestrial biospheric carbon from source-to-sink through molecular 14C analyses in two large Alpine catchments 

Benedict Mittelbach, Davide Calvarese, Margaux Moreno Duborgel, Timo Rhyner, Stephan Wartenweiler, Margot White, Thomas Blattmann, Negar Haghipour, Martin Wessels, Nathalie Dubois, and Timothy Eglinton

The residence time of organic carbon (OC) in terrestrial reservoirs, particularly soils and freshwater systems, plays a crucial role in modulating the dynamics of the global carbon cycle. Radiocarbon (14C) is an invaluable tool for tracing the time since the biosynthesis of organic matter, enabling the quantification of carbon residence times in these terrestrial pools. While the majority of carbon fixed through terrestrial primary productivity rapidly returns to the atmosphere, a stabilized fraction of OC escapes (re-)mineralization. This OC may subsequently be exported from terrestrial ecosystems and buried in marine and terrestrial sedimentary sequences over longer timescales, effectively sequestering atmospheric CO2.

Mineral association has been identified as a key mechanism of this stabilization. Consequently, source-specific biomarkers targeting terrestrial, mineral-associated OC are of particular interest for tracking especially resistant OC species. In our study, we apply compound-specific 14C analysis on leaf wax fatty acids (n-alkanoic acids). These long-chain fatty acids (C24+) are exclusively produced by vascular plants. Moreover, their highly hydrophobic nature promotes mineral association, making them ideal molecular markers of stabilized soil OC that can be traced through export and burial.

We employ a source-to-sink approach, targeting mineral soil profiles, fluvial sediment, and lake sediment within two Alpine sediment routing systems: the Alpine Rhine and Alpine Rhone catchments. Additionally, we analyze selected depths from well-dated deltaic sediment cores spanning the past 120 years to estimate catchment-averaged transit times of long-chain fatty acids and to assess temporal variability in these trends.

Initial results indicate significant pre-aging of OC in soil profiles, Δ14C from -100‰ to below -500‰, combined with rapid and efficient fluvial export of our target compounds. Sediment core data reveal millennial-scale catchment transit times for long-chain fatty acids. Further, they show the impact of anthropogenic disturbances, which have led to an increase in the age of exported soil OC across the investigated period.

How to cite: Mittelbach, B., Calvarese, D., Moreno Duborgel, M., Rhyner, T., Wartenweiler, S., White, M., Blattmann, T., Haghipour, N., Wessels, M., Dubois, N., and Eglinton, T.: Tracing the export of terrestrial biospheric carbon from source-to-sink through molecular 14C analyses in two large Alpine catchments, EGU General Assembly 2025, Vienna, Austria, 27 Apr–2 May 2025, EGU25-15543, https://doi.org/10.5194/egusphere-egu25-15543, 2025.

EGU25-15664 | Posters on site | BG1.6

Introduction to the project OrgCarbon: Organic carbon in rivers – characterization, origin, and degradability – first results from the Ems estuary 

Annika Fiskal, Steffen Amann, Anjela Vogel, Lorenzo Rovelli, Christine Borgsmüller, Georg Dierkes, Arne Wick, and Helmut Fischer

Organic carbon drives key processes in estuaries and rivers like (micro)biological production, oxygen consumption, transport of pollutants, and the flocculation/agglomeration of suspended particulate matter. The OrgCarbon project aims for an in‑depth characterization of organic carbon in field samples by using both established and innovative methods. Oxygen consumption, microbial respiration, potential for sorption of pollutants, origin and composition of the organic matter will be determined. By testing a variety of cross-disciplinary methods, we aim to develop a standardized protocol for studying organic carbon in estuaries and rivers. The goal is to develop an easy-to-use and cost-effective protocol that can be implemented in existing monitoring programs. As a result, knowledge about the origin and degradability of organic carbon and thus oxygen consumption rates could, in future, be determined routinely and included in water quality management.

First results from the highly turbid Ems Estuary show strong gradients in dissolved organic carbon (DOC) and total organic carbon (TOC) along the salinity gradient. TOC, but also the ratio of DOC to particulate organic carbon (POC), increases along the gradient from marine to freshwater. Spectroscopic measurements and absorption indices (e.g., SUVA254, SR, S275-295) provided first insights into organic carbon origin and composition and are easy to use and inexpensive. Additional analysis of microbial respiration and enzyme activity will provide information on organic carbon degradability and its role for the oxygen budget of rivers and estuaries.

How to cite: Fiskal, A., Amann, S., Vogel, A., Rovelli, L., Borgsmüller, C., Dierkes, G., Wick, A., and Fischer, H.: Introduction to the project OrgCarbon: Organic carbon in rivers – characterization, origin, and degradability – first results from the Ems estuary, EGU General Assembly 2025, Vienna, Austria, 27 Apr–2 May 2025, EGU25-15664, https://doi.org/10.5194/egusphere-egu25-15664, 2025.

Mobilisation of dissolved organic carbon (DOC) links fluxes from terrestrial ecosystems via streams to the oceans. The increase in mobilisation that has been observed as a browning of headwaters during the last decades, resulted in ecosystem change of receiving waters and had implications for drinking water production and carbon storage. Riparian soils at the groundwater/ surface water interface are hotspots of biogeochemical transformations shaping water entering the streams. Preferential flow paths, where larger areas of the watershed drain through a distinct point to the stream, have been described as discrete riparian inflow points (DRIP). DRIPs have high watertables, mostly organic soils and strongly influence stream discharge and chemistry. They have been identified as major sources of DOC to streams, making them key areas for studying DOC mobilisation mechanisms. High watertables connect highly conductive and organic rich top soil layers to streams, but also influence redox conditions in the ground. If oxygen and nitrate availability decreases, ferric iron gets reduced and could release DOC previously bound to iron (oxy) hydroxides. Reduction processes consume protons and thus increase pH, in turn increasing solubility for negatively charged organics.

We hypothesized that redox induced mobilisation of DOC plays an important role especially after drying and rewetting cycles occuring after warm and dry summers with the onset of late summer rains. During snowmelt, we hypothesized redox induced mobilisation to be less important due to cold conditions and a large fraction of surficial flow paths. In this study, data from sampling campaigns in a small forested headwater stream with adjacent riparian wetlands (DRIPs) located in the Krycklan Catchment Study in boreal Sweden, conducted during snowmelt 2024 and two late summer seasons in 2023 and 2024, is presented. Samples were analysed for DOC quantity and quality, iron speciation and concentration, oxygen saturation and pH, among others. We show that stream- and groundwater have distinct chemical properties. The role of riparian soils as source areas of solutes differs between seasons with a more diluting effect during peak discharge at snowmelt and concentrations being transport limited in summer and autumn. In groundwater, DOC and iron are co-mobilised with higher concentrations under reducing conditions. Oxygen saturation changes with watertables depending on whether they exceed ground level, resulting in different effects of watertable changes depending on small scale topography. We find some indication of DOC mobilisation due to redox induced pH increase in some DRIPs especially during snowmelt. DOC concentrations are higher pre- and during early snowmelt in the stream, maybe due to release of older, more reduced groundwater before the diluting effect of freshly melted snow dominates.

In conclusion ground- and streamwater chemistry relate differently dependent on season. Small scale topography results in non-uniformal effects of elevated watertables and thus groundwater chemistry is to some degree site specific. However, iron and DOC are jointly mobilised especially under low oxygen availability. In spring water that might have been subject to reducing conditions in late autumn, might still be present in the groundwater and could be released early on during snowmelt.

How to cite: Hortmann, A., Knorr, K.-H., Selle, B., and Laudon, H.: Links of ground- and streamwater in discrete riparian inflow points in boreal Sweden – DOC mobilisation and the role of reducing conditions during snowmelt and summer, EGU General Assembly 2025, Vienna, Austria, 27 Apr–2 May 2025, EGU25-16430, https://doi.org/10.5194/egusphere-egu25-16430, 2025.

EGU25-17013 | ECS | Posters on site | BG1.6

Development of a Model to Estimate the Spatial Distribution of Soil Carbon Sinks in Watersheds 

Shao-Wei Wu, Ji-Huan Huang, Fu-Jun Tu, and Chao Yuan Lin

In recent years, soil has emerged as a central focus in natural carbon sink research. Past studies have largely concentrated on how plants capture atmospheric carbon through photosynthesis and progressively store it in the soil as they grow. This process is known as the "vertical process" of soil organic carbon accumulation.

However, in subtropical monsoon climates, soils in hillside regions are often subject to water erosion, which causes soil organic carbon to accumulate not only vertically but also laterally through the transport of terrestrial materials. This lateral movement represents the "horizontal process" of soil organic carbon accumulation. At the watershed scale, understanding the horizontal transport and accumulation of soil organic carbon is essential for accurate carbon budget assessments.

The movement of soil organic carbon plays a vital role in soil carbon dynamics within terrestrial ecosystems. This study focuses on gaining a deeper understanding of soil erosion processes and soil carbon storage in watersheds. The primary aim is to develop a slope soil carbon sink assessment model to evaluate the spatial distribution of soil carbon sinks within watersheds. Additionally, the study seeks to validate the model and assess its feasibility for practical applications.

How to cite: Wu, S.-W., Huang, J.-H., Tu, F.-J., and Lin, C. Y.: Development of a Model to Estimate the Spatial Distribution of Soil Carbon Sinks in Watersheds, EGU General Assembly 2025, Vienna, Austria, 27 Apr–2 May 2025, EGU25-17013, https://doi.org/10.5194/egusphere-egu25-17013, 2025.

EGU25-17388 | ECS | Orals | BG1.6

Exploring the effects of nutrients, carbon, and water darkening on coastal phosphorus bioavailability 

Mayra P. D. Rulli, Aurélie Garnier, Magnus Huss, Ryan A. Sponseller, Ann-Kristin Bergström, Hani Younes, Olivia Bell, and Martin Berggren

Coastal ecosystems are increasingly influenced by the lateral transport of organic matter, where pigmented dissolved organic carbon (DOC) contributes to water darkening and affects nutrient dynamics. These changes coincide with rising dissolved organic phosphorus (DOP) inputs, which have implications for eutrophication and carbon cycling. However, it is unclear how the bioavailable DOP (BDOP) pool responds to the individual and interactive ecosystem-level effects of water darkening, increased DOC, and higher inorganic nutrient concentrations. To explore these interactions, we conducted bioassays to estimate BDOP in a fully factorial mesocosm experiment manipulating the supply of inorganic nutrients, labile DOC (glucose) and pigmented compounds causing darkening. Results showed that while labile DOC had limited influence on bioavailable BDOP, nutrient enrichment increased BDOP in clear water. In darkened waters, added inorganic phosphorus persisted largely in its inorganic form, reflecting decreased conversion to BDOP. These findings reveal the complex interplay between light availability, organic matter inputs, and phosphorus bioavailability. By highlighting the impact of water darkening on nutrient and carbon dynamics, this study underscores the need for integrated management approaches to mitigate eutrophication and support ecosystem resilience across the terrestrial-aquatic continuum.

How to cite: P. D. Rulli, M., Garnier, A., Huss, M., Sponseller, R. A., Bergström, A.-K., Younes, H., Bell, O., and Berggren, M.: Exploring the effects of nutrients, carbon, and water darkening on coastal phosphorus bioavailability, EGU General Assembly 2025, Vienna, Austria, 27 Apr–2 May 2025, EGU25-17388, https://doi.org/10.5194/egusphere-egu25-17388, 2025.

EGU25-18115 | ECS | Posters on site | BG1.6

Seasonal changes of organic carbon and nutrient fluxes in intermittent spring catchments 

Annika Feld-Golinski, Christina Fasching, and Peter Chifflard

Comprehensive, high-resolution data on intermittent natural springs with low discharge are still rare, although they represent an important interface between terrestrial and aquatic environments, and form the basis of our water systems. Due to their connection to groundwater, springs have been considered quite stable in terms of both hydro-biogeochemistry and water quality. However, with climate change, spring systems are subject to significant hydrological dynamics, partly due to changes in water availability. Currently, spring discharges are decreasing or drying up during more frequent droughts. The amount of nutrients exported to headwater streams is closely linked to hydrological processes. For intermittent springs, a significant change in biogeochemistry with increased nutrient export can be expected due to the temporary cessation of groundwater inflow combined with longer residence times of organic matter in the surrounding soil substrate. However, little is known about the role of intermittent springs in carbon cycling and their role in downstream carbon and nutrient export.

In order to fill this research gap, this study aims to asses and quantify the seasonal variability of carbon and nutrient composition and fluxes of intermittent or highly variable discharge springs as a function of climatic, site and biogeochemical parameters. We investigate a range of spring areas (44 springs) spread across the German low mountain ranges of the Ore Mountains, Sauerland, Black Forest and Rhenish Slate Mountains.

We measure the export of organic carbon based on high resolution data in selected springs, and complement these measurements with nutrient (nitrogen and phosphorus) samples on a seasonal basis. In addition, we investigate the composition of dissolved organic matter (DOM) to identify contributing carbon sources.

First results show that the spring flow regime determines carbon and nutrient concentrations, modulated by the characteristics of the spring type. Our study emphasizes the sensitivity of springs to hydrological shifts, particularly in the balance between groundwater and surface water contributions. A shift favoring surface water inputs, can increase nutrient exports, likely due to enhanced surface runoff carrying nutrients from the surrounding landscape. Climatic changes, with extreme rainfall events are becoming more frequent and intense, may alter the balance between groundwater inputs and surface water runoff in springs may result in higher carbon and nutrient fluxes into receiving waterbodies. 

How to cite: Feld-Golinski, A., Fasching, C., and Chifflard, P.: Seasonal changes of organic carbon and nutrient fluxes in intermittent spring catchments, EGU General Assembly 2025, Vienna, Austria, 27 Apr–2 May 2025, EGU25-18115, https://doi.org/10.5194/egusphere-egu25-18115, 2025.

EGU25-18316 | Posters on site | BG1.6

Dissolved organic carbon in a drinking water catchment in the western Ore Mountains, Germany: How much, Where from, When and Why – first insights 

Erik Nestler, Tobias Houska, Tobias Krause, Livia Vieira Carlini Charamba, Annelie Ehrhardt, Ingo Müller, Anne Stephani, Klaus Kaiser, Klaus-Holger Knorr, Maximilian Lau, Conrad Jackisch, and Karsten Kalbitz

Increasing concentrations of dissolved organic carbon (DOC) in tributaries threaten the water quality of drinking water reservoirs in Europe and North America. Understanding the key factors influencing DOC dynamics in streams is essential for effective water resource management. This study is part of a concerted effort to determine the major sources of DOC entering a reservoir and to identify the key biogeochemical processes within the terrestrial-aquatic continuum that affect DOC concentrations.

We conducted a four-year multi-scale observational study in a small, heterogeneous catchment (8.5 km²) in the western Ore Mountains, Germany. The research design combined low-resolution (biweekly) measurements of soil water variables (e.g., DOC, pH, Al, Fe) with high-resolution (15-minute) sensor-based monitoring of environmental variables (e.g., temperature, precipitation, soil water content) at representative locations within the catchment. End-member mixing analysis (EMMA) quantified the contributions of peat, forest floor, and mineral soil horizons as sources of DOC, based on previous findings by Charamba et al. (2024), who qualitatively identified these sources within the catchment. In addition, relationships between DOC concentrations and potential explanatory variables were analyzed using Spearman correlations and Random Forest modeling.

In total, 16.5 kg DOC/ha*a were exported from the catchment to the reservoir. EMMA showed that peat soils contributed to about 85 % of the DOC in a tributary adjacent to these soils, corresponding to the highest area-related DOC load of 53 kg/ha*a. Nevertheless, across the entire catchment, mineral soils were the dominant source of DOC, contributing the most to the total DOC load exported to the reservoir (78 %; 13 - 18 kg/ha*a), while forest floors made the smallest contribution. At the temporal level, the contribution of the forest floor to DOC runoff increased under high flow conditions, highlighting the dynamic nature of DOC translocation from different soil sources to stream. Preliminary results of the correlation analysis highlight the influence of soil water chemistry, particularly Al and pH in C-rich horizons, on stream water DOC concentrations. Environmental variables such as precipitation and soil moisture were only moderately correlated with DOC concentrations. Random Forest analysis provided limited insights into key predictors, highlighting the complexity of the catchment and the processes underlying DOC production and translocation. Our results suggest that even bi-weekly sampling intervals may be insufficient to capture the temporal variations in soil processes affecting stream DOC concentrations. The variable time lag between soil processes and their hydrological expression poses a significant analytical challenge. Future research should focus on integrating high-resolution sensor data of DOC concentrations and water fluxes from hydrological monitoring stations. To address the limitations of Random Forest, we will use structural equation modelling (SEM) to refine conceptual models and identify causal relationships. Significant Spearman correlations between DOC and environmental and soil water parameters guide variable selection. The refinement of our conceptual model by SEM will be the basis for process-based modeling to predict the future development of DOC concentrations and fluxes in heterogeneous catchments.

How to cite: Nestler, E., Houska, T., Krause, T., Vieira Carlini Charamba, L., Ehrhardt, A., Müller, I., Stephani, A., Kaiser, K., Knorr, K.-H., Lau, M., Jackisch, C., and Kalbitz, K.: Dissolved organic carbon in a drinking water catchment in the western Ore Mountains, Germany: How much, Where from, When and Why – first insights, EGU General Assembly 2025, Vienna, Austria, 27 Apr–2 May 2025, EGU25-18316, https://doi.org/10.5194/egusphere-egu25-18316, 2025.

EGU25-19961 | ECS | Posters on site | BG1.6

Organic carbon pathways from the Cuvette Centrale peatlands to the Congo River network 

Johanna Menges, Yannick Garcin, Gaël U. D. Bouka, Carolia Abaye, Mélanie Guardiola, Steven Bouillon, Yannick Stroobandt, Gesine Mollenhauer, Hendrik Grotheer, Simone Kasemann, and Enno Schefuß

The storage of organic carbon on land and its transfer to the ocean via rivers plays a critical role in the global carbon cycle. As the second-largest river system on Earth, the Congo Basin is a key region for carbon storage and export, with extensive wetlands and tropical forests contributing to a significant aboveground organic carbon reservoir. Recent discoveries have identified the Cuvette Centrale, a low-gradient depression in the center of the Congo Basin, as the world’s largest tropical peat complex, storing approximately 29 petagrams of carbon belowground. Despite its importance, key processes governing the export of carbon from these peatlands to the Congo River network remain poorly understood. Previous studies have shown that despite its low sediment load, the Congo River has a high dissolved organic carbon (DOC) and particulate organic carbon (POC) export—around 2 Tg POC and 12.5 Tg DOC annually. Aged organic matter observed in offshore marine sediment cores suggests, peatlands may significantly contribute to carbon export, but direct evidence remains incomplete. Here, we present a data set comprising surface peat and soil, as well as water, suspended sediment, and river bank samples. These were collected from the surface and small water bodies (pools) in the peatlands, tributaries within and outside the Cuvette Centrale, and the Congo River mainstem. We measured stable carbon and hydrogen isotopes of plant waxes and bulk organic carbon and nitrogen concentrations and stable isotopes, as well as radiocarbon content on a subset of samples. Based on these data, we aim to investigate the significance and the pathways of carbon export from these peatlands and their respective contributions to riverine DOC and POC, alongside other sources such as standing vegetation and in-situ aquatic production. This study provides new insights into the role of the Cuvette Centrale peatlands in the Congo Basin’s carbon dynamics.


How to cite: Menges, J., Garcin, Y., Bouka, G. U. D., Abaye, C., Guardiola, M., Bouillon, S., Stroobandt, Y., Mollenhauer, G., Grotheer, H., Kasemann, S., and Schefuß, E.: Organic carbon pathways from the Cuvette Centrale peatlands to the Congo River network, EGU General Assembly 2025, Vienna, Austria, 27 Apr–2 May 2025, EGU25-19961, https://doi.org/10.5194/egusphere-egu25-19961, 2025.

EGU25-20215 | ECS | Orals | BG1.6

Peatland ditching as a driver of dissolved organic matter mobilization - the role of fungal communities 

Antonis I Myridakis, Håkan Wallander, Dimitrios Floudas, and Emma Kritzberg

Ditching of peatlands has been used extensively in Scandinavia with the purpose to promote tree growth. Studies show that concentrations of dissolved organic matter (DOM) are higher in waters exported from ditched peatlands compared to pristine systems, suggesting that ditching may contribute to browning observed in surface waters in forested regions.

After ditching and when trees are established, the peat will be colonized by ectomycorrhizal (EM) fungi, which supply the trees with nutrients. We hypothesize that EM-fungi will mobilize DOM to the soil water while mining the peat for nutrients and saprotrophic fungi will become more active when the peat gets aerated, which will also result in mobilization of DOM. In the current project we are exploring the link between fungal communities and DOM mobilization in a peatland gradient, spanning from pristine conditions with high water level and lack of trees, to strongly drained conditions with low water level and established pine forest. Along this gradient, soil water was sampled from ground water tubes. Water and peat samples were analyzed for organic matter concentrations and the fungal community was characterized by metabarcoding.

DOM concentrations in the soil water were increasing towards the ditch - where the water level was lower and the tree growth higher - as was the fungal biomass. While these results are in line with our hypothesis, the results on fungal community composition will provide important information to assess the link between fungal processes and DOM mobilization.

This study will bring much needed information on succession of fungal communities with different decomposition strategies along peatland ditching gradients and potential links to DOM mobilization and surface water browning.

How to cite: Myridakis, A. I., Wallander, H., Floudas, D., and Kritzberg, E.: Peatland ditching as a driver of dissolved organic matter mobilization - the role of fungal communities, EGU General Assembly 2025, Vienna, Austria, 27 Apr–2 May 2025, EGU25-20215, https://doi.org/10.5194/egusphere-egu25-20215, 2025.

EGU25-626 | ECS | Posters on site | BG1.7

Optimized CTAB-Modified Nanofibrillated Cellulose for Phosphate Recovery: Adsorption Mechanisms and Performance Insights 

Archana Pandey, Yogesh Chandra Sharma, and Ajay S Kalamdhad

To address the environmental challenges posed by eutrophication, removal of excess phosphorus from aquatic ecosystems is imperative. This study presents a cationic adsorbent synthesized by modifying nanofibrillated cellulose (NFC), derived from agrowaste, using surfactant cetyltrimethylammonium bromide (CTAB). Comprehensive characterization techniques, including XRD, FTIR, HR-SEM, SEM-EDX, BET, and XPS, confirmed successful introduction of quaternary ammonium groups, significantly enhancing the surface chemistry of NFC. This modification imparted a positive ζ potential over a wide pH range, ensuring a strong affinity for negatively charged phosphate ions. Increased surface roughness and improved active site availability resulted in a nearly threefold improvement in phosphate removal efficiency compared to pristine NFC. The adsorption followed a pseudo-second-order kinetic model and Sips isotherm, achieving a maximum capacity of 21.78 mg P/g within 120 minutes. The adsorbent displayed pH-dependent behavior, retaining stability and optimal performance under weakly acidic to neutral conditions, with minimal desorption (12.61%) after three cycles. Mechanistic insights from XPS and FTIR revealed that electrostatic interactions and hydrogen bonding were the primary drivers of phosphate adsorption.

How to cite: Pandey, A., Sharma, Y. C., and Kalamdhad, A. S.: Optimized CTAB-Modified Nanofibrillated Cellulose for Phosphate Recovery: Adsorption Mechanisms and Performance Insights, EGU General Assembly 2025, Vienna, Austria, 27 Apr–2 May 2025, EGU25-626, https://doi.org/10.5194/egusphere-egu25-626, 2025.

EGU25-2226 | Posters on site | BG1.7

Multifunctionality of Alkaline Phosphatase in Ecology and Biotechnology 

Federico Baltar and Daniel E.M. Saavedra

Multifunctional enzymes can significantly impact biotechnological applications by performing activities beyond their primary functions. This presentation explores the role of the multifunctionality of alkaline phosphatase, a key enzyme in the phosphorus cycle, focusing on the molecular mechanisms influencing its activity, and its biotechnological potential. Based on these findings we argue that understanding these aspects can enhance the utility of alkaline phosphatase in research and industry, fostering innovations in enzyme engineering, environmental biotechnology, and metabolic engineering. Furthermore, by exploring enzyme promiscuity, we highlight alkaline phosphatase’s versatility, paving the way for advancements in sustainable agriculture, environmental remediation, clinical diagnostics in particular, and in ecological and biotechnological progress in general.

How to cite: Baltar, F. and Saavedra, D. E. M.: Multifunctionality of Alkaline Phosphatase in Ecology and Biotechnology, EGU General Assembly 2025, Vienna, Austria, 27 Apr–2 May 2025, EGU25-2226, https://doi.org/10.5194/egusphere-egu25-2226, 2025.

EGU25-2511 | ECS | Posters on site | BG1.7

A synthesis of phosphorus stocks and fluxes in natural and agricultural environments 

Julian Helfenstein, Bruno Ringeval, Federica Tamburini, Vera Mulder, Daniel Goll, Xianjin He, Edwin Alblas, Yingping Wang, Alain Mollier, and Emmanuel Frossard

Estimates of phosphorus (P) fluxes at the global scale were already available in the early 2010s and led to the establishment of planetary boundaries for P.  In the meantime, estimates of P stocks and fluxes have been revised and updated for natural biomes, agriculture, fishery, and global biogeochemical models. However, improvements toward attaining P-related sustainable development goals requires policies informed by the situation at the corresponding scales, ranging from plot to national to global scale. Here, we bridge this gap by synthesizing the relative sizes of P stocks and fluxes in natural and agricultural terrestrial environments from existing literature, focusing on the plot scale. Though the P cycle is context specific, our analysis of roughly 790 empirical flux measurements from 27 studies supports drawing several general conclusions about relative magnitudes of P stocks and fluxes. For example, in both natural and agricultural systems, empirical data on P stocks tend to follow the pattern soil >> microbial biomass > plant biomass. Similarly, we summarize empirical measurements of P fluxes and show that in natural ecosystems, fluxes between P pools within soil >> fluxes between soils-plants > system inputs (weathering, atmospheric deposition) and losses (erosion, leaching). We also discuss specific contexts where these general patterns do not hold, and what that means for management. Finally, we will discuss how a better understanding of P stocks and fluxes is relevant for science-informed management of P resources, for example through improved representation of P in vegetation or crop models. 

How to cite: Helfenstein, J., Ringeval, B., Tamburini, F., Mulder, V., Goll, D., He, X., Alblas, E., Wang, Y., Mollier, A., and Frossard, E.: A synthesis of phosphorus stocks and fluxes in natural and agricultural environments, EGU General Assembly 2025, Vienna, Austria, 27 Apr–2 May 2025, EGU25-2511, https://doi.org/10.5194/egusphere-egu25-2511, 2025.

EGU25-5234 | Posters on site | BG1.7

Direct foliar phosphorus uptake from wildfire ash  

avner gross, daniel palchan, and anton lokshin

Atmospheric particles originating from combustion byproducts (burned biomass or wildfire ash) are highly enriched in nutrients such as P, K, Ca, Mg, Fe, Mn, Zn and others. Over long time scales, deposited wildfire ash particles contributes to soil fertility by replenishing soil nutrient reservoirs. However, the immediate nutritional effects of freshly deposited fire ash on plants are mostly unknown. Here we study the influence of fire ash on plant nutrition by applying particles directly on plant leaves or onto the roots of chickpea, which was used as our model plant. The experiment was conducted under ambient and elevated CO2 levels, (412 and 850 ppm) that reflect both current and future climate scenarios. We found that plants can uptake fire ash P only from their leaves, through direct nutrient uptake from particles captured on their foliage, but not via their roots. In a future climate scenario, foliar nutrient uptake pathway may be even more pronounced for plants, due to the partial inhibition of key root uptake mechanism. Our findings highlight the effectiveness of the foliar nutrient uptake mechanism under both ambient and elevated CO2 levels, with fire ash P being the sole nutrient absorbed by the foliage.  These findings demonstrate the substantial contribution of fire ash to the nutrition of plants. The role of fire ash is expected to increase in a future world, thus giving a competitive advantage to plants that can utilize fire ash P from the foliar pathway.


How to cite: gross, A., palchan, D., and lokshin, A.: Direct foliar phosphorus uptake from wildfire ash , EGU General Assembly 2025, Vienna, Austria, 27 Apr–2 May 2025, EGU25-5234, https://doi.org/10.5194/egusphere-egu25-5234, 2025.

EGU25-6465 | ECS | Orals | BG1.7

Understanding the Long-term Spatial and Temporal Dynamics of Phosphorus Surplus Across Europe 

Masooma Batool, Fanny J. Sarrazin, and Rohini Kumar

Phosphorus (P) is an essential nutrient for plant growth, yet much of the P in agricultural soils remains inaccessible to plants, necessitating external inputs. Since the 1920s, agricultural intensification in Europe has led to significant P accumulation in soils, resulting in P surpluses (the difference between P inputs and outputs) that exceed plant needs. These surpluses contribute to environmental issues, including water quality degradation, biodiversity loss, and breaches of planetary boundaries. Despite regulatory efforts, elevated P levels persist in European water bodies, highlighting the need for long-term understanding of soil P surplus to guide future land and water management practices.

The goal of this study is to characterize the spatial and temporal pattern of the P surplus across Europe1. To achieve this goal, we constructed a long-term (1850-2019) yearly P surplus dataset across Europe at a 5 arcmin spatial resolution for agricultural and non-agricultural soils. Our gridded dataset allows for aggregating P surplus at different spatial scales of interest for soil and water management. Specifically, the dataset includes 48 P surplus estimates addressing uncertainties in key components such as fertilizers, manure, and P removal rates, acknowledging the inherent variability in nutrient budgets.

Our results show that P surplus (evaluated as one standard deviation around the mean of the 48 estimates) in the EU-27 has tripled over 170 years, increasing from 1.19±0.28 kg ha⁻¹ of physical area in 1850 to 2.48±0.97 kg ha⁻¹ of physical area in recent years. Spatially, our analysis indicates that Central European countries mainly rely on mineral fertilizers, except regions like the Netherlands, Belgium, and Denmark, where animal manure dominates due to high livestock densities. Furthermore, the long-term database allowed us to identify four distinct phases of P surplus: 1850–1920 (Pre-modern agriculture), (ii) 1921–1960 (Industrialization before the Green Revolution), (iii) 1961–1990 (Green Revolution and synthetic fertilizer expansion), and (iv) 1991–2019 (Environmental awareness and policy intervention phase). Complimenting our earlier Nitrogen (N) surplus dataset2, this work emphasizes the importance of long-term analyses to address persistent nutrient-related environmental challenges.

1Batool, M., Sarrazin, F. J., and Kumar, R.: Century Long Reconstruction of Gridded Phosphorus Surplus Across Europe (1850–2019), Earth Syst. Sci. Data Discuss. [preprint], https://doi.org/10.5194/essd-2024-294, in review, 2024.

2Batool, M., Sarrazin, F.J., Attinger, S. et al. Long-term annual soil nitrogen surplus across Europe (1850–2019). Sci Data 9, 612 (2022). https://doi.org/10.1038/s41597-022-01693-9


How to cite: Batool, M., Sarrazin, F. J., and Kumar, R.: Understanding the Long-term Spatial and Temporal Dynamics of Phosphorus Surplus Across Europe, EGU General Assembly 2025, Vienna, Austria, 27 Apr–2 May 2025, EGU25-6465, https://doi.org/10.5194/egusphere-egu25-6465, 2025.

EGU25-6642 | ECS | Orals | BG1.7

Export of groundwater-borne geogenic phosphorus from a drained wetland into surface water 

Xingyu Liu, Markus Winkler, Oliver Sass, and Stefan Peiffer

Groundwater-derived geogenic phosphorus (P) plays a significant but often overlooked role in surface water eutrophication. Geogenic P differs from anthropogenic P in its release mechanisms, seasonal variability and magnitude of release. While many studies have addressed the spatial distribution of geogenic P,  its temporal dynamics, transport and export mechanisms remain insufficiently understood. This study was conducted in a small study site (~1ha) located in a drained riparian wetland in southeastern Germany, where anthropogenic P input is minimal. The combination of a P-rich geological background, dynamic redox conditions and a drainage network provided an ideal setting to study the P mobilization and export processes. Hydrogeochemical monitoring of groundwater and drainage water over two years, complemented by vertical profile sampling of dissolved and solid phases, revealed significant P enrichment in the subsurface. About 70% of groundwater and drainage water samples exceeded the German Environment Agency’s threshold of 0.1 mg/L. Soluble reactive phosphorus (SRP) concentrations in groundwater reached up to 16 µmol/L (0.5 mg/L) in two of four wells, showing minimal seasonal variation. Drainage water SRP ranged from 6 to 15 µmol/L, with some interannual variability due to dilution during wet periods, and closely matched the chemistry of high-P groundwater wells. Both high spatial and low temporal variability were attributed to the site-specific geochemical settings. A strong correlation between P and iron (Fe) in groundwater and drainage water highlighted the critical role of Fe-P interactions in controlling P dynamics. Electrical resistivity tomography confirmed a subsurface preferential flow channel aligned with the high-P wells. These findings proposed a conceptual model: geogenic P, probably originating from the weathering of P-bearing minerals, reductive dissolution of Fe oxides, and organic matter mineralization, is stored in the subsurface. Preferential flow paths transport Fe-P-rich, anoxic groundwater to drainage systems, which further accelerate P export by creating direct groundwater-surface water connections, reducing residence time, and acting as hotspots for P accumulation and event-driven transport. This study provides novel insights into the processing of geogenic P in groundwater and its continuous contribution to surface water eutrophication. While concentrations may be lower than those from surface runoff or agriculture, geogenic P remains a long-term and persistent source of P loading. These results underscore the need for eutrophication mitigation strategies to address both geogenic and anthropogenic P sources. 

How to cite: Liu, X., Winkler, M., Sass, O., and Peiffer, S.: Export of groundwater-borne geogenic phosphorus from a drained wetland into surface water, EGU General Assembly 2025, Vienna, Austria, 27 Apr–2 May 2025, EGU25-6642, https://doi.org/10.5194/egusphere-egu25-6642, 2025.

EGU25-6643 | Orals | BG1.7

Effects of Nitrogen addition on Soil Phosphorus Pools in an Ombrotrophic Bog in South-Eastern Ontario, Canada 

Christian von Sperber, Camille Jones, Camille Brais, Tim Moore, Cynthia Kallenbach, and Meng Wang

Peatlands store about one third of the global soil organic carbon. This carbon storage is partly controlled by the availability of nitrogen (N) and phosphorus (P) in peat, which affects primary productivity, decomposition, plant community composition, and microbial community composition in these ecosystems. While extensive research has been conducted on the N cycle in peatlands, much less is known about the biogeochemistry of P. To date, little is known about how an increase of atmospheric N deposition affects the availability and biogeochemistry of P in peat. To fill this gap of knowledge, we studied the effect of increased N additions on soil P pools in an ombrotrophic bog in Canada. For this purpose, soil samples were taken from a 20 year old fertilization trial at Mer Bleue Bog in south-eastern Ontario and subjected to Hedley sequential fractionation. In unfertilized peat, P concentrations were highest in the available and highly recalcitrant pools, with little between them. This U-shaped distribution of P along the gradient of availability contrasts with established patterns in mineral soils. In plots which received PK and NPK fertilizers, concentrations of both available P and highly recalcitrant P doubled. In plots receiving N fertilization alone, available and total P concentrations decreased, which may indicate increased demand for P by plants and microorganisms when N status is high. In all plots receiving fertilizer, concentrations of highly recalcitrant P increased, which may indicate increased decomposition of peat. In addition, fertilization led to changes aboveground. Chamaedaphne calyculata leaves in plots receiving PK and NPK were enriched in P compared to Chamaedaphne calyculata leaves in unfertilized plots and plots receiving N alone. These findings indicate, that formerly N limited peatlands may become P limited due to anthropogenically enhanced atmospheric nitrogen depositions which may impact their potential to store soil organic carbon in the future.

How to cite: von Sperber, C., Jones, C., Brais, C., Moore, T., Kallenbach, C., and Wang, M.: Effects of Nitrogen addition on Soil Phosphorus Pools in an Ombrotrophic Bog in South-Eastern Ontario, Canada, EGU General Assembly 2025, Vienna, Austria, 27 Apr–2 May 2025, EGU25-6643, https://doi.org/10.5194/egusphere-egu25-6643, 2025.

The competitive adsorption of glyphosate and phosphate (PO43-) on mineral surfaces mutually affects their mobility in the environment. Iron hydroxides, such as goethite and ferrihydrite, are abundant in soils and serve as important sinks for both glyphosate and phosphate. The adsorption of these compounds is modulated by pH which affects their surface complexation and mineral surface charge. Moreover, the release of ferrous ions (Fe2+) from the natural iron cycle may further impact glyphosate adsorption by altering surface complexation equilibria. Understanding these interactions is crucial for developing predictive models of glyphosate transport and retention in the environment.

In this study, we employed a surface complexation model (SCM) to evaluate adsorption data of glyphosate and PO43- in aqueous suspensions of goethite and ferrihydrite, focusing on their pH-dependent processes, competitive interactions, and binding modes. Additionally, the influence of Fe2+ on glyphosate adsorption at pH 7 and the adsorption mechanism of Fe2+ on iron hydroxides were examined. Surface complexation constants (log K) for glyphosate, PO43-, and Fe2+ were estimated, providing a robust thermodynamic basis for modeling interactions with the two iron minerals. The surface complexation of glyphosate and PO43- varied with pH, concentration and competitive interactions. Despite the strong competition by PO43-, complete desorption of glyphosate by PO43- was only observed under alkaline conditions, indicating partial retention of glyphosate on iron hydroxides in most natural environments. Notably, Fe2+ and glyphosate mutually promote their adsorption on ferrihydrite at pH 7, indicating synergistic interactions or co-complexation, whereas on goethite Fe2+ has minimal influence on glyphosate adsorption. Structural modeling revealed that Fe2+ adsorption is dominated by monodentate complexes, highlighting the uniformity of adsorption mechanisms across these iron hydroxides.

Our findings underscore the significance of PO43- in attenuating glyphosate retention in soils, while Fe2+ appears to play a dual role, enhancing glyphosate adsorption under specific conditions. This study contributes to a more comprehensive understanding of glyphosate dynamics in iron hydroxide-rich soils and provides directions for environmental management strategies aimed at mitigating glyphosate leaching and optimizing soil remediation practices.

How to cite: Wang, M. and Haderlein, S.: Modeling pH-dependent Adsorption of Glyphosate on Iron Hydroxides: Competition with Phosphate and Influence of Fe2+, EGU General Assembly 2025, Vienna, Austria, 27 Apr–2 May 2025, EGU25-8402, https://doi.org/10.5194/egusphere-egu25-8402, 2025.

Long-term applications of organic fertilizers significantly influence soil organic matter (SOM) and phosphorus (P). However, the interactions between SOM and P remain poorly understood. A better understanding of these interactions is important for efficient fertilization strategies. Methods of size and density fractionation of SOM have been used to study the fate of carbon from organic inputs and have been instrumental in understanding the mechanisms of SOM processing, storage, and interaction with soil minerals.

The Danish long-term field experiment CRUCIAL (Closing the Rural-Urban Nutrient Cycle – Investigations through Agronomic Long-term Experiments) was established to explore the soil impacts of excessive organic material applications (e.g., sewage sludge, compost, cattle manure) over more than two decades. These amendments have provided annual P inputs of up to 621 kg·ha-1, greatly exceeding crop P requirements (~25 kg·ha-1), significantly increasing soil carbon stocks, total and organic P stocks, microbial biomass, and reducing soil bulk density.

To investigate the associations of SOM and P in fractions that serve as proxies for SOM with different degradation levels and interactions with specific soil minerals, we are employing size and density fractionation techniques. However, optimized protocols for fractionating SOM with a focus on P are lacking. We are currently optimizing such a method. Soils fertilized with compost, sewage sludge, cattle manure, or unfertilized controls were fractionated as follows:

20g air-dried soils were dispersed in water using glass beads. Thereafter, soils were wet-sieved into two size fractions: (A) 2 mm - 100 µm and (B) <100 µm. Density fractionation was conducted by suspending fractions A and B in a sodium polytungstate solution (density 1.8 or 2.4 g·ml-1), separating the lighter fraction (a) and progressively denser fractions (b and c). Fraction Bb was further sonicated and centrifuged.

Preliminary results highlight the influence of organic fertilizers on SOM fraction size and P distribution. In compost-fertilized soils, fraction Aa contained visible plant fragments, roots, and coarse composted material (P concentration: 0.7 g·kg-1), while fraction Ab, comprising darker and finer plant material, had a higher P concentration (4.6 g·kg-1). Fraction Ac, likely consisting of sand, contained no detectable P. Fraction Ba, finely particulate organic matter of gray color, had 2.8 g·kg-1 P, while fraction Bb, dark black in color, contained 4.1 g·kg-1 P.

Compost applications increased the size of all SOM fractions compared to unfertilized soils, whereas sewage sludge treatment resulted in significantly smaller Aa, Ab, and Ba fractions compared to soils treated with compost. Preliminary findings suggest that soil P and SOM fractions are influenced by organic amendments. Currently, we are optimizing the fractionation method to enhance P recovery in each fraction and avoid chemical interference. Future work will study isotopes and concentrations of carbon and nitrogen in the SOM fractions, along with microscopy techniques to identify organic macromolecules and porous structures.

How to cite: Álvarez Salas, M. and Magid, J.: Understanding Phosphorus Association with Soil Organic Matter: Size and Density Fraction Analysis in Intensively Fertilized Soils with Organic Materials, EGU General Assembly 2025, Vienna, Austria, 27 Apr–2 May 2025, EGU25-8490, https://doi.org/10.5194/egusphere-egu25-8490, 2025.

EGU25-8646 | Orals | BG1.7

Limitation of potential yield by phosphorus at the global scale 

Bruno Ringeval, Josephine Demay, Julian Helfenstein, Marko Kvakic, Alain Mollier, Thomas Nesme, Mounir Seghouani, and Sylvain Pellerin

Phosphorus (P) is one of the key limitations to crop yields. However, the relationship between soil P and yield is far to be understood at the global scale, given some difficulties in global soil P mapping [Helfenstein et al., 2024], complexities to model soil P dynamics and spatially variable interactions between P and other sources of yield gap (nitrogen, water, pest and diseases).

To better understand the P limitation of crop yield at the global scale, we developed here a simple but mechanistic approach (called GPCROP) to simulate the interaction between plant and soil P at daily time-step for one year. The model assumes no other limitation (water, N), and thus allows quantifying the P limitation of potential yield by the current soil P. Simulations are performed for maize at half-degree latitude x longitude spatial resolution.

GPCROP combines and builds on four previously developed models that we here combined: a model of potential growth for maize (SIM, [Ringeval et al., 2021]), a model describing the soil P dynamics (GPASOIL, [Ringeval et al., 2024]), a parametrization for the P supply by root (following [Kvakic et al., 2018]), and a model describing the allocation of C and P among plant organs, inspired of [Kvakic et al., 2020]. In particular, the soil P dynamics model allows us to represent the resplenishment of the soil P solution by more stable soil P pools, the parametrization for the P supply by root allows us to represent the diffusion of P in soil and the allocation model, based on an optimization procedure, allows us to represent plant adjustments to P limitation such as change in root:shoot ratio and change in leaf P concentration.

Thanks to GPCROP, we quantified the limitation of potential yield by P at the global scale. An uncertainty related to key model parameters and model input was also provided. Simulations underlined the importance of the begin of the growing season when roots are poorly developped in the magnitude of the limitation on final yield. Plant adjustements do particularly matter at that moment of the growing season as they allow (at least partly) to alleviate the P limitation, and we estimated their contribution in the reduction of the global P limitation.

References:
Helfenstein et al., 2024 : Understanding soil phosphorus cycling for sustainable development: A review. One Earth, S2590332224003737.
Kvakic et al., 2018 : Quantifying the Limitation to World Cereal Production Due To Soil Phosphorus Status. Global Biogeochemical Cycles, https://doi.org/10.1002/2017GB005754.
Kvakic et al., 2020 : Carbon and Phosphorus Allocation in Annual Plants: An Optimal Functioning Approach. Frontiers in Plant Science, 11:149, https://doi.org/10.3389/fpls.2020.00149.
Ringeval et al., 2021 : Potential yield simulated by global gridded crop models: using a process-based emulator to explain their differences. Geoscientific Model Development, 14(3):1639–1656, https://doi.org/10.5194/gmd-14-1639-2021, 2021.
Ringeval et al., 2024 : A global dataset on phosphorus in agricultural soils. Scientific Data, 11(1):17, https://doi.org/10.1038/s41597-023-02751-6.

How to cite: Ringeval, B., Demay, J., Helfenstein, J., Kvakic, M., Mollier, A., Nesme, T., Seghouani, M., and Pellerin, S.: Limitation of potential yield by phosphorus at the global scale, EGU General Assembly 2025, Vienna, Austria, 27 Apr–2 May 2025, EGU25-8646, https://doi.org/10.5194/egusphere-egu25-8646, 2025.

Baltic Sea is a geologically young semi-enclosed brackish-water body whose water exchange with the ocean has gradually declined. Approximately 85 million people live in the Baltic Sea's catchment area, resulting in significant human impact on the basin's ecosystem. Eutrophication due to anthropogenic discharge of nutrients is considered the most serious environmental problem, leading to greater growth of phytoplankton and algae, deterioration of water quality, and lack of oxygen in near-bottom water masses. As a result of recent large-scale nutrient input, phosphorus has accumulated into the seabed sediments from where it has been remobilizing and releasing into the water column under favorable conditions. Marine sediments contain phosphorus in various components, i.e. fractions, but not all of them are affected by remobilization. The release of phosphorus from sediments is affected by different oxygen conditions in the bottom water layer. Therefore, understanding the principles of phosphorus release and the distribution of phosphorus fractions in seabed sediments is extremely important.

Phosphorus fractions, porewater chemistry, and their vertical distribution were studied from the sea-bottom sediments from three locations in western Estonia in the northern Baltic Proper. The amount of mobile phosphorus fraction (mobile in hypoxic and anoxic conditions) stored in the surface sediments of the northern Baltic Proper is lower than expected, which indicates that most of the mobile phosphorus fraction has already been released back into the water column. In two out of three locations, the content of mobile phosphorus fraction in the sediment surface has decreased close to the natural background, which on average is less than 200 mg/kg (dw). Constant hypoxic conditions prevail at the sediment-water interface in all three locations. In the near future, oxygen levels can only increase in these areas due to Major Baltic Inflow (MBI) events, which introduce dense, salty, oxygen-rich water into the Baltic Sea. During sufficiently large inflow events, oxygen-rich water can reach areas previously characterized by stable hypoxic conditions, temporarily altering the deep-water oxygen levels. Under oxygen-rich conditions, organic material (including organic phosphorus) begins to decompose. The sediments in the study area contain up to 32.8% (dw) organic matter, holding substantial amounts of organic phosphorus. The released phosphorus is converted to a mobile phosphorus fraction, which becomes mobile again when oxygen conditions return to hypoxic.

How to cite: Ausmeel, M., Liira, M., and Suuroja, S.: Mobile phosphorus in the seabed sediments of the northern Baltic Proper, Baltic Sea: hypoxic conditions limit large-scale phosphorus release, EGU General Assembly 2025, Vienna, Austria, 27 Apr–2 May 2025, EGU25-12722, https://doi.org/10.5194/egusphere-egu25-12722, 2025.

Phosphorus (P) is a bio-critical and non-substitutable element, essential for life, forming the backbone of DNA, RNA, and ATP, playing a vital role in agricultural productivity. Unlike nitrogen, P lacks an atmospheric cycle, relying solely on slow rock weathering or finite geological reserves for replenishment. The challenges surrounding phosphorus are less about its geological availability and more about socio-economic factors, such as limited access to fertilizers, and environmental concerns, including water pollution. These challenges emphasize the importance of adopting sustainable agricultural practices to optimize phosphorus use and reduce environmental impact. The instability of the phosphorus market, as demonstrated during the 2007-2008 global food crisis and the recent 2020-2022 and ongoing price surges, further underscores the need for effective phosphorus management, particularly in countries like India, which relies heavily on imports to sustain agricultural productivity [1][2].

We examined two contrasting soil types, ultisols and vertisols, collected from the Western Ghats, India. These soils were characterized physiochemically, geochemically and mineralogically. Ultisols, with slightly acidic pH, are enriched in iron and aluminium oxides, oxyhydroxides, and 1:1 type clay minerals. In contrast, vertisols, which are alkaline, are dominated by primary basaltic minerals, 2:1 and 1:1 type clay, with minor amounts of iron oxides and hydroxides. We performed sorption isotherm, bioavailability, and fractionation experiments on representative samples of each soil type. Sorption experiments were fitted using Langmuir and Freundlich isotherm models, revealing significantly higher adsorption maxima for phosphorus in ultisols than vertisols. Bioavailability tests reveal greater phosphorus availability in vertisols compared to ultisols, both pre-and post-fertilizer application. Hedley fractionation revealed that phosphorus in ultisols is mainly partitioned in moderately available fractions, while in vertisols, it is predominantly in readily available fractions, explaining the higher phosphorus bioavailability in vertisols than in ultisols. This difference is linked to the mineralogical composition of the soils; ultisols, enriched with iron and aluminium oxides, oxyhydroxides, bind phosphorus to high-energy sites associated with Fe and Al, thereby restricting its availability. In contrast, the near absence of these minerals in vertisols allows for greater phosphorus bioavailability. These findings underscore the importance of considering soil mineralogy in developing efficient and sustainable fertilizer application strategies. Currently, we are investigating the interactions between individual minerals prevalent in these soils and bacteria isolated from the same soils to understand the role of microbes in phosphorus dynamics.

References:

[1] Cordell, D., Drangert, J. O., & White, S. (2009). The story of phosphorus: global food security and food for thought. Global environmental change19(2), 292-305.

[2] Brownlie WJ, Sutton MA, Cordell D, Reay DS, Heal KV, Withers PJA, Vanderbeck I and Spears BM (2023) Phosphorus price spikes: A wake-up call for phosphorus resilience. Front. Sustain. Food Syst. 7:1088776. doi: 10.3389/fsufs.2023.1088776

How to cite: Mehta, S. and Mathew, G.: Influence of Soil Mineralogy on Phosphorus Sorption, Partitioning, and Bioavailability in Contrasting Tropical Soils of India, EGU General Assembly 2025, Vienna, Austria, 27 Apr–2 May 2025, EGU25-14701, https://doi.org/10.5194/egusphere-egu25-14701, 2025.

EGU25-15675 | ECS | Orals | BG1.7 | Highlight

Why have we fertilized the world? Global drivers of NPK fertilization in major crops since 1961 

Fernando Coello, Jordi Sardans, and Josep Peñuelas

Since the second half of the 20th century, NPK (nitrogen, phosphorus, and potassium) inorganic fertilizers have been pivotal in boosting global crop yields. These fertilizers have supported the growth of the global population, facilitated dietary shifts towards protein-rich foods, and expanded industrial applications, such as biofuel production. However, the extensive use of fertilizers has disrupted natural biochemical cycles, leading to environmental impacts and raising social and economic concerns.

Four crops—maize, rice, soybean, and wheat—currently occupy over 50% of global croplands, account for more than 60% of global agricultural fertilizer inputs, and produce two-thirds of the proteins consumed by humans. Rice and wheat are primarily used for direct human consumption (food), whereas maize and soybean are also used for livestock feeding (feed) and other industrial applications. The debate over food versus feed versus other uses has typically centered on land occupation, labour, and water usage. However, the regional and temporal drivers of fertilizer use among these major crops remain poorly understood. We hypothesized that, in recent decades, larger fractions of fertilizers have been allocated to feed and other uses compared to food. Furthermore, we aim to discern whether the changes in fertilizer consumption for each use have been driven by expansions in crop areas, increased fertilizer intensification, or a greater proportion of crops being allocated to each use.

To investigate the temporal changes in total fertilizer use across the three main nutrients and four key crops, while distinguishing between their final uses (food, feed, and other uses), we adopted a comprehensive approach: First, we integrated national-level temporal data from 1961 onwards concerning crop fertilization, production, consumption, and trade, and second, we accounted for uncertainty in our estimates using Monte Carlo simulations. Finally, we performed a multiplicative factor decomposition to analyze the drivers behind the variations in total nutrient consumption for each nutrient and use category.

We found a significant increase in fertilizer use among the four main crops for the three nutrients and across all use categories over the past six decades. Globally, increases in fertilizer use for food and feed purposes are relatively balanced. However, at the national level, most countries have shifted towards a higher proportion of fertilizer use for feed compared to food. These shifts were driven by different crops: increases in fertilizer use for food were primarily linked to rice and wheat, for feed with maize and soybean, and for other uses predominantly with maize. Notably, for soybeans, the allocation of fertilizers between feed and food uses more than doubled during the studied period. Across all nutrient-use combinations, changes in total fertilizer consumption were mainly driven by increased fertilizer intensity rather than expanded cropped area or crop usage. However, for feed use, changes in total phosphorus and potassium consumption were equally influenced by increases in cropped area. The increase in fertilizer use for other uses, primarily driven by maize since 1990, appears closely linked to bioethanol production, especially in the United States, the leading producer.

How to cite: Coello, F., Sardans, J., and Peñuelas, J.: Why have we fertilized the world? Global drivers of NPK fertilization in major crops since 1961, EGU General Assembly 2025, Vienna, Austria, 27 Apr–2 May 2025, EGU25-15675, https://doi.org/10.5194/egusphere-egu25-15675, 2025.

Worldwide rapid industrial growth is leading to heavy urbanization in the coastal areas. Therefore coastal areas are becoming critically contaminated with heavy metal and nutrients, which is serious environmental concern as they are bio-accumulative in nature. Due to its non-biodegradable in nature trace metal is toxic to biotic communities and environment (Gong et al., 2020, Parul and Rina, 2021). The present study has been carried out in India’s second largest mangrove cover in the world. The study area is witnessing rapid urbanization as the area is inhabiting the Asia’s largest fertilizer refinery IFCO along with multiple seaports, with large number of chemical and petroleum industries, and the region is the prime gateway of trade and commerce. Besides this extensive salt producing units with extensive agricultural and aquaculture activities are present which are posing severe threat to the mangroves. The gulf is also inhabiting the complex geomorphological setup such as alluvial plains, tidal mudflats, lagoons creek and stabilized dune area (Deshraj et al. 2012). Construction of saltpan/aquaculture is deteriorating the mangroves health, impairing productivity (Jigar et al, 2022). Phosphorus (P), is one of the important macronutrients that governs the primary productivity and it affects both the terrestrial and marine biogeochemical cycling.  P is released in dissolved or suspended forms, holding both inorganic and organic forms, which undergo a continuous transformation. Knowledge of P speciation in sedimentary environments is crucial to understand the P cycling, bioavailability, and the mechanism of their release, which will help to assess the ecological risk associated with P enrichment. Along with Phosphorous, metal fractionation study is also important to determination of bioavailability and mobility of trace metals in geochemical fractions and ecological risk to the ecosystem. Results suggested that Total sedimentary P was found beyond the global limit and consists of inorganic-P fraction predominantly. PEI values suggest higher P loading in sediment which leads to higher eutrophication risk.

Metal fraction study suggested, a considerable variation in the speciation pattern of trace metals. In the study area, highest proportion of trace elements was associated with the residual phase (F4), which manifested that metals bounded with the alumino-silicate mineral and detritus matter in sediments was highest. Therefore, Present study would be helpful to the policymakers in the view of the current Land use-land cover change and contamination level in Gulf of Kachchh, mangroves for implementation of protection strategies for this precious natural resources.

Keywords:

Phosphorus Fractionation, Metal Fractionation, Sequential extraction, Mangroves Sediment, Ecological risk, Gulf of Kachchh, India


How to cite: Kumari, R. and Maurya, P.: Assessing the Geochemical Fractionation of Phosphorous and Heavy metal in Surface Sediments of Mangroves and assertaining its Ecological Risk, Gulf of Kachchh, Second largest mangrove cover of India., EGU General Assembly 2025, Vienna, Austria, 27 Apr–2 May 2025, EGU25-16447, https://doi.org/10.5194/egusphere-egu25-16447, 2025.

Phosphate contamination in water bodies is a global environmental issue that can result in eutrophication, affecting sectors like agriculture and fishing and thereby jeopardizing the long-term viability of water resources. Phosphate, a non-renewable resource, is a crucial mineral for crop production and a key component of NPK (Nitrogen, Phosphorus, and Potassium) fertilizer. Only 16% of the applied phosphate as fertilizer is utilized by crops; the rest is lost through soil erosion and aquatic runoff, increasing the risk of eutrophication. Therefore, environmental concerns and phosphate depletion have increased the need for phosphate recovery and recycling. This study explored the potential of engineered sewage sludge biochar for the sorption of aqueous phosphate. Biochar was obtained after pyrolyzing sewage sludge at 500°C, which was modified using coprecipitation of FeCl3.6H2O and ZnCl2. At pH 6, the engineered biochar exhibited around 92% phosphate sorption compared to 20% by pristine sewage sludge biochar. The highest sorption capacity (using Langmuir isotherm) was 129 mg/g at 15°C. Phosphate-laden biochar can further be utilized in agricultural fields, where it will act as a slow-release fertilizer to improve soil fertility or restore contaminated soil, thereby providing a sustainable solution for waste management and enhancing soil fertility. This will help achieve SDG 2 (Zero hunger) and SDG 6 (Clean water and sanitation).

Keywords: Eutrophication, Sorption, Engineered biochar, Sewage sludge, Sustainable Development Goals

How to cite: Kapoor, S. and Mohan, D.: Enhancing sustainability by utilizing engineered sewage sludge biochar for aqueous phosphate sorption, EGU General Assembly 2025, Vienna, Austria, 27 Apr–2 May 2025, EGU25-16738, https://doi.org/10.5194/egusphere-egu25-16738, 2025.

EGU25-18632 | ECS | Orals | BG1.7

Linking phosphorus entrapment and release potential in fluvial biofilms to carbon and light availability in natural environments 

Simon Wentritt, Markus Weitere, David Kneis, and Nuria Perujo

In the global phosphorus (P) cycle, aquatic ecosystems play a crucial role, as there, long-term retention of P through sedimentation and subsequent burial of P containing minerals takes place. This study zooms into a rather overlooked section of the aquatic part of the global P cycle: The P entrapment pathways of benthic microbial biofilms. Benthic microbial biofilms are able to entrap P in its various forms, biochemically transform it, and contribute to internal loading via the release of P. The importance and the dynamics of P entrapment and P release in fluvial benthic microbial biofilms are, as of now, not completely understood.

For this field study, we performed a longitudinal sampling campaign along a 25 kilometer stretch of a third order Central European river, with the aim of investigating P entrapment patterns of benthic microbial biofilms. We distinguished between extracellular P entrapment and intracellular P entrapment and recorded metabolic characteristics of the sampled biofilm, as well as environmental variables.

We found that the ratio of intracellular P to extracellular P differed greatly between sampling sites. High values for this ratio (on average, 26.7) were related to relatively pristine sampling sites with rather recalcitrant allochthonous carbon inputs. Further downstream, at sampling sites exposed to anthropogenic disturbances, the ratio declined sharply (on average below, 1). These biofilms were subject to P-rich wastewater treatment plant effluent and labile dissolved organic matter of rather autochthonous origin. Measurements of the equilibrium P concentration, as a measure for P release potential from the sediment, showed that sites with benthic biofilms with a higher share of extracellular P have a highly increased P release potential from the sediment. We further found distinguishable carbon use metabolic profiles of the biofilms between different sampling sites, though a higher carbon use functional diversity did not necessarily contribute to a higher overall P entrapment in the biofilm.

Our results show clear patterns of benthic biofilm P entrapment along the sampled river stretch. These patterns seem to be connected to the changing environmental variables along the sampled river stretch. Furthermore, the P release potential from the sediment was highly correlated with an increased share of extracellular P in the biofilms.

How to cite: Wentritt, S., Weitere, M., Kneis, D., and Perujo, N.: Linking phosphorus entrapment and release potential in fluvial biofilms to carbon and light availability in natural environments, EGU General Assembly 2025, Vienna, Austria, 27 Apr–2 May 2025, EGU25-18632, https://doi.org/10.5194/egusphere-egu25-18632, 2025.

EGU25-21512 | Orals | BG1.7

Oxygen Stable isotopes in phosphate: what is next? 

Federica Tamburini, Thomas Hofstetter, Nora Bernet, Elena Evertz, Cheng Shi, Maja Siegenthaler, Christian von Sperber, and Chiara Pistocchi

Oxygen isotopes in phosphate (δ¹⁸Oₚ) have rised interest as powerful tracers for environmental studies, offering valuable insights into phosphorus cycling, biological activity, and potential phosphate source tracing in diverse environments. By January 2025, more than 180 peer-reviewed studies have explored δ¹⁸Oₚ applications in Environmental Sciences, underscoring the interest in this tool, but also its limited application. Broader adoption of δ¹⁸Oₚ analysis is hindered by challenges such as the complexity of sample preparation, uncertainties in isotopic data interpretation, and the difficulty of identifying all endmembers in field-based studies.

Recent advancements in high-resolution mass spectrometry (HRMS), allowing the isotopic measurements of oxyanions at natural abudances, have addressed key technical limitations. This innovation facilitates the analysis of smaller samples, but recent research highlights the critical need for thorough sample preparation to ensure reliable results. These advances lay the groundwork for more extensive δ¹⁸Oₚ applications, particularly since HRMS are becoming more and more widespread.

Central to δ¹⁸Oₚ studies is the process of phosphoryl transfer, a fundamental mechanism in numerous biological processes. Changes in the isotopic composition of oxygen in phosphate promoted by phosphoryl transfer is considered to reflect the metabolic status of living cells, positioning δ¹⁸Oₚ as a potential “thermometer” for assessing organism metabolic “health”. This capability is particularly evident in soil incubation experiments, where the extent of oxygen exchange during phosphoryl transfer recorded in the microbial phosphate pool correlates with respired CO₂. Such findings highlight δ¹⁸Oₚ's potential to link phosphorus cycling to carbon cycling, providing new perspectives on ecosystem functioning.

To harness this potential, future research should prioritize 18O labelling approaches in controlled incubation experiments integrating ancillary data, such as CO₂ flux measurements, to elucidate the mechanistic links between metabolic activity and changes in isotopic values. Complementary field studies, incorporating detailed assessments of δ¹⁸Oₚ alongside CO₂ and other environmental parameters, are essential for validating laboratory findings and expanding their relevance to complex natural systems.

By addressing these challenges and leveraging recent technical innovations, δ¹⁸Oₚ can emerge as a robust tool for deciphering phosphorus dynamics, their connection with metabolic processes, and their broader role in environmental systems.

How to cite: Tamburini, F., Hofstetter, T., Bernet, N., Evertz, E., Shi, C., Siegenthaler, M., von Sperber, C., and Pistocchi, C.: Oxygen Stable isotopes in phosphate: what is next?, EGU General Assembly 2025, Vienna, Austria, 27 Apr–2 May 2025, EGU25-21512, https://doi.org/10.5194/egusphere-egu25-21512, 2025.

EGU25-21599 | Posters on site | BG1.7

Reaction-transport modeling of centennial-scale phosphorus accumulation and internal loading in a human-impacted boreal lake 

Tom Jilbert, Siqi Zhao, Xiaole Sun, and Juha Niemistö

Legacy anthropogenic phosphorus (P) accumulated in sediments influences nutrient cycling in eutrophic lakes through so-called internal loading. However, due to the complexity of processes influencing P mobility in the sediment column, the temporal response of internal loading to reduction of external P inputs is difficut to predict. In this study, we use a comprehensive set of porewater and sediment geochemical data to constrain a reaction-transport model simulating long-term anthropogenic inputs and processing of P in Lake Hiidenvesi, a eutrophic lake in southern Finland. The 180 cm sediment core used to train the model encompasses over 800 years of accumulation, including the transitions into and out of the Little Ice Age when land use in the region changed considerably. By defining top 6 cm of sedimentary P as "freshly-deposited" (within the past 10 years) and deeper layers as "legacy P", we find that at any given point in time, the freshly deposited material contributes the majority of regenerated P in porewaters, with an additional contribution from legacy P. A set of linear regressions between P deposition and diffusion rates indicate that internal P loading is primarily controlled by particulate P deposition of organic-P and Fe-P, which may be directly derived from catchment exports or autochthonously produced through in-lake biogeochemical processes. The Little Ice Age is shown by the model to be a period of relatively lower external P inputs an consequently also lower internal loading rates. However, the overall retention of P in sediments is sufficient to suggest that sediment P content can be used as an indicator for historical anthropogenic impacts in catchment areas of lakes in the boreal region.

How to cite: Jilbert, T., Zhao, S., Sun, X., and Niemistö, J.: Reaction-transport modeling of centennial-scale phosphorus accumulation and internal loading in a human-impacted boreal lake, EGU General Assembly 2025, Vienna, Austria, 27 Apr–2 May 2025, EGU25-21599, https://doi.org/10.5194/egusphere-egu25-21599, 2025.

EGU25-21769 | Orals | BG1.7

Assessing the global phosphorus cycle and opportunities for closing the loop 

Nicolas Navarre and José M. Mogollón

Phosphorus (P) and phosphate rock have been included in the list of EU’s critical raw materials, due to their importance in agricultural production and food security. However, over the latter 20th century and up to today, P use in agriculture has increased much faster than population growth (from 4.5 Tg P and 3.0 billion people in 1961 up to 18 Tg P in 2022 and 8.0 billion people in 2022)1. These growing inefficiencies in global phosphorus use are coupled with a linearized economic model of produce, use, waste, completely short circuiting the global phosphorus cycle. Indiscriminate use of P (has increased global P cropland soil stocks by over 1 Pg P over the aforementioned time period, despite cropland soils having over 100 Tg Olsen P (readily available P)2. Conversely, in many low-income nations, a volatile phosphorus market (a doubling and a halving over the past 5 years) is leading to disruptions in their phosphorus supply chain and threatening their food security. In addition, humanity’s changes to the phosphorus cycle are leading to both upstream pressures for phosphorus fertilizer production, including millions of tons of phosphogypsum waste, and downstream eutrophication pressures, as phosphorus is a limiting nutrient in many aquatic environments.


Nevertheless, increasing scientific understanding of the global phosphorus cycle, plant-nutrient interactions and mycorrhizal network, the biogeochemical interactions of P in aquatic and soil environments, phosphorus recovery and immobilitzation from wastewater and from eutrophic systems, is growing in to a strong, yet fragmented phosphorus community. Further, clear policies and regulation for phosphorus use and recovery on for closing phosphorus loops are lacking at a global level. This presentation will showcase some low-hanging fruits that can help us move toward a closing of phosphorus loops by highlighting local phosphorus balances, food and fertilizer phosphorus use and trade patterns, soil phosphorus stocks, and potential for eutrophication. Finally, it provides a call to bring together European scientists, food producers, the waste(water) sector, and policymakers together to form a coalition that can move phosphorus toward circularity, ameliorating its environmental impacts, and ultimately establishing a resilient and sustainable global food system.


1Mogollón, JM, Bouwman, AF , Beusen, AHW, Lassaletta, L, van Grinsven, HJM, Westhoek, H. (2018) More efficient phosphorus use can avoid cropland expansion

Nature Food, 2, 509-518.


2McDowell, RW, Noble, A, Pletnyakov, P, Haygarth, PM (2023) A global database of soil plant available phosphorus, Scientific Data, 10, 125.

How to cite: Navarre, N. and Mogollón, J. M.: Assessing the global phosphorus cycle and opportunities for closing the loop, EGU General Assembly 2025, Vienna, Austria, 27 Apr–2 May 2025, EGU25-21769, https://doi.org/10.5194/egusphere-egu25-21769, 2025.

EGU25-31 | ECS | Posters on site | BG1.8

Developing a method for measuring mercury photoreduction in snow with a LED Solar Simulator  

Giuditta Celli, Andrea Spolaor, Warren Cairns, Debbie Armstrong, Zhiyuan Gao, and Feiyue Wang

The investigation of mercury photoreduction in snow can be challenging due to the complex nature of the snowpack and of the surrounding environment from both physical proprieties and chemical composition1. The mercury air-snow interaction and exchange driven by the photoreduction in snow plays a central role in its geochemical cycling. Experiments in natural world snowpack have clearly demonstrate the occurrence of mercury re-emission2. However, the influences from different physical proprieties and chemical composition is virtually impossible to be disentangle in studies carried out in the natural environment.  Laboratory studies in a closed photochemical reactor provide valuable proof of concept to better understand the photoreduction process and its reaction kinetics in a controlled environment where chemical and physical parameters can be (semi)controlled and modified1–3. Here we propose an experimental scheme to simulate the photochemical emission of gaseous mercury from urban snow at cold temperatures, using a custom-made LED solar simulator. Multiple factors such as the irradiating wavelengths were examined and their role in affecting the determined mercury photoreduction process was studied. Specific attention was made in the cleanliness of the experimental set-up and on the air flow above the snow to optimise the condition in which experiment will be perform. The system development was tested at the University of Manitoba (Winnipeg, Canada) for multiple experiments. They showed the role of the UV radiation in the mercury photoreduction activation, with an increase in GEM concentration when the light was on and a decrease over time, supporting that the experiment set up is valid to evaluate the UV driven mercury photoreduction in the snow, and the collection and measurement of the produced GEM. The estimation of a preliminary reduction rate constant (kr) was also possible, finding a rate constant ranging from 0.712 h-1 to 0.757 h-1. The system represents the technical base to further mercury laboratory snow photochemical experiment in different conditions including the possibility to modify the chemical composition of the snow, the inlet air composition (for ex. by implementing an ozone producer system) and physical parameters (temperature, solar radiation, relative humidity).

  • Dommergue, A., Bahlmann, E., Ebinghaus, R., Ferrari, C. & Boutron, C. Laboratory simulation of Hg0 emissions from a snowpack. Anal Bioanal Chem 388, 319–327 (2007).
  • Lalonde, J. D., Poulain, A. J. & Amyot, M. The Role of Mercury Redox Reactions in Snow on Snow-to-Air Mercury Transfer. Environ. Sci. Technol. 36, 174–178 (2002).
  • Mann, E. A., Mallory, M. L., Ziegler, S. E., Tordon, R. & O’Driscoll, N. J. Mercury in Arctic snow: Quantifying the kinetics of photochemical oxidation and reduction. Science of The Total Environment 509–510, 115–132 (2015).

How to cite: Celli, G., Spolaor, A., Cairns, W., Armstrong, D., Gao, Z., and Wang, F.: Developing a method for measuring mercury photoreduction in snow with a LED Solar Simulator , EGU General Assembly 2025, Vienna, Austria, 27 Apr–2 May 2025, EGU25-31, https://doi.org/10.5194/egusphere-egu25-31, 2025.

EGU25-642 | ECS | Posters on site | BG1.8

Evaluation of mercury concentrations in Svalbard surface snow based on meteorological parameters 

veronica amoruso, azzurra spagnesi, federico scoto, and andrea spolaor

Over recent decades, Svalbard's climate has undergone significant transformation, driven by Arctic Amplification. Rising temperatures, retreating sea ice, and the intensification of extreme events have become increasingly prevalent. However, within this nearly consistent trend of warming, 2020 emerged as an anomaly, marked by unusually low temperatures, a strong polar vortex, and extensive sea ice coverage throughout the year. Two sampling campaigns were conducted during the snow season in Ny-Ålesund (Svalbard): one during a “warm” year (November 2018 to May 2019) and the other during a “cold” year (November 2019 to May 2020). These campaigns aimed to investigate the potential effects of the distinct climatic conditions of the “cold year” on the biogeochemical cycle of mercury (Hg) in surface snow. Mercury, a toxic element, has been extensively studied in polar regions. While many studies have sought to address changes in the Hg biogeochemical cycle under shifting climatic and atmospheric conditions, uncertainties remain—particularly regarding how variations in sea ice extent and duration may influence Hg deposition in the Svalbard archipelago and the Arctic as a whole. It is well known that sea ice releases reactive bromine species during spring, which can directly influence Hg deposition through atmospheric mercury depletion events (AMDEs) or, more broadly, by promoting Hg oxidation and deposition. Using the “warm” and “cold” years as case studies, we explored whether the significant increase in sea ice extent observed in the Kongsfjord during the cold year influenced Hg deposition. Although we observed an increase in ozone depletion events (which are primarily linked to bromine release from sea ice) during the cold year, we found no direct evidence of a corresponding increase in Hg content in snow. This suggests either that the sea ice increase during the cold year was insufficient to enhance Hg deposition through bromine emissions or that sea ice and its associated emissions do not play a primary role in controlling the Hg biogeochemical cycle.

How to cite: amoruso, V., spagnesi, A., scoto, F., and spolaor, A.: Evaluation of mercury concentrations in Svalbard surface snow based on meteorological parameters, EGU General Assembly 2025, Vienna, Austria, 27 Apr–2 May 2025, EGU25-642, https://doi.org/10.5194/egusphere-egu25-642, 2025.

EGU25-928 | ECS | Orals | BG1.8

Catchment Properties control Mercury Speciation in Streams and Lakes across a Sub-Arctic Climate Gradient  

Sonja Gindorf, Carluvy Baptista-Salazar, Van Liem-Nguyen, Reiner Giesler, Carl-Magnus Mörth, and Sofi Jonsson

Catchment properties may influence the mercury (Hg) cycle by affecting Hg speciation, transport, and bioavailability, though their role is not fully understood. In aquatic systems, the bioaccumulation of methylmercury (MeHg) poses significant risks to wildlife and human health. Despite its importance, our understanding of the relationships between catchment properties and the concentrations of total Hg and MeHg in the environment and at the base of the aquatic food web remains incomplete.

In this study, we explore how catchment properties relate to Hg concentrations and speciation in high-latitude Swedish catchments encompassing tundra, birch, and boreal forest ecosystems. Sampling was conducted in August 2020 across 18 streams and 8 lakes distributed along a climatic and vegetation gradient (67.5°–68.5°N, 18°–21.5°E). We measured Hg species and over 60 ancillary parameters and employed a PARAFAC model to examine the role of dissolved organic matter (DOM) characteristics in aquatic Hg dynamics.

Using multivariate analysis, we found distinct differences in water type and catchment systems based on the ancillary parameters. Total Hg and MeHg concentrations followed the trend boreal > birch > tundra for both lakes and streams, with lakes generally showing higher MeHg levels and MeHg% compared to streams. Our findings suggest that terrestrial humic-like DOM plays a key role in transporting Hg from terrestrial systems to and within aquatic environments, thereby influencing aquatic Hg concentrations. Microbial and algal DOM, on the other hand, appears to promote Hg methylation processes.

How to cite: Gindorf, S., Baptista-Salazar, C., Liem-Nguyen, V., Giesler, R., Mörth, C.-M., and Jonsson, S.: Catchment Properties control Mercury Speciation in Streams and Lakes across a Sub-Arctic Climate Gradient , EGU General Assembly 2025, Vienna, Austria, 27 Apr–2 May 2025, EGU25-928, https://doi.org/10.5194/egusphere-egu25-928, 2025.

EGU25-1167 | ECS | Posters on site | BG1.8

Comparison of Calibration Approaches for Mercury in Emissions and Ambient Air 

Igor Zivkovic, Jan Gacnik, and Milena Horvat

Mercury (Hg) emissions into the atmosphere have significant environmental and health impacts, making accurate measurement and calibration of Hg crucial for effective monitoring and mitigation strategies. Measuring the different forms of atmospheric mercury, such as gaseous elemental mercury (GEM), gaseous oxidized mercury (GOM) and particulate-bound mercury (PBM), and their behavior in both emissions and ambient air is essential for developing comprehensive approaches to control mercury pollution. Currently, common calibrations for GOM in emissions rely on liquid evaporative calibrators, such as HovaCal and Optoseven. However, new calibration methods are emerging to address the limitations of existing approaches. The challenges associated with GOM calibration become even more pronounced at ambient GOM concentrations, where accurate calibration is essential for reliable measurements. In our work, we validated and compared multiple GEM and GOM calibration sources over several years. We also developed a novel nonthermal plasma source that can be used for GOM calibration at both ambient and emission concentrations of Hg. Our research highlights the importance of precise calibration techniques to enhance the comparability of Hg measurement results across different studies and regions. By improving calibration accuracy, we can better evaluate the effectiveness of the Minamata Convention and other efforts aimed at reducing mercury emissions globally.

How to cite: Zivkovic, I., Gacnik, J., and Horvat, M.: Comparison of Calibration Approaches for Mercury in Emissions and Ambient Air, EGU General Assembly 2025, Vienna, Austria, 27 Apr–2 May 2025, EGU25-1167, https://doi.org/10.5194/egusphere-egu25-1167, 2025.

EGU25-1284 | ECS | Posters on site | BG1.8

International trade shapes global mercury–related health impacts 

Ruirong Chang and Yanxu Zhang

Mercury (Hg) is a strong neurotoxin with substantial dangers to human health. Hg undergoes active global cycles, and the emission 
sources there of can also be geographically relocated through economic trade. Through investigation of a longer chain of the global 
biogeochemical Hg cycle from economic production to human health, international cooperation on Hg control strategies in Minamata 
Convention can be facilitated. In the present study, four global models are combined to investigate the effect of international trade on 
the relocation of Hg emissions, pollution, exposure, and related human health impacts across the world. The results show that 47% of 
global Hg emissions are related to commodities consumed outside of the countries where the emissions are produced, which has 
largely influenced the environmental Hg levels and human exposure thereto across the world. Consequently, international trade is 
found to enable the whole world to avoid 5.7 × 10⁵ points for intelligence quotient (IQ) decline and 1,197 deaths from fatal heart 
attacks, saving a total of $12.5 billion (2020 USD) in economic loss. Regionally, international trade exacerbates Hg challenges in less 
developed countries, while resulting in an alleviation in developed countries. The change in economic loss therefore varies from the 
United States (−$4.0 billion) and Japan (−$2.4 billion) to China (+$2.7 billion). The present results reveal that international trade is a 
critical factor but might be largely overlooked in global Hg pollution mitigation.

How to cite: Chang, R. and Zhang, Y.: International trade shapes global mercury–related health impacts, EGU General Assembly 2025, Vienna, Austria, 27 Apr–2 May 2025, EGU25-1284, https://doi.org/10.5194/egusphere-egu25-1284, 2025.

EGU25-1297 | ECS | Posters on site | BG1.8

Instights from Atmospheric Mercury Isotopes: Analytical Considerations 

Jan Gačnik, Igor Živković, and Milena Horvat

Studying atmospheric mercury (Hg) isotopic composition is crucial for understanding the complex biogeochemical cycling of mercury, a global pollutant with significant environmental and health impacts. Mercury isotopes provide valuable information about the sources, transformation processes, and deposition pathways of Hg in the environment, allowing researchers to trace its movement and identify the contributions from natural versus anthropogenic sources. Studies of atmospheric Hg isotopic composition have gained significant momentum in recent years, with over 80% of the relevant literature published within the past 7 years. While the analytical capabilities of multicollector inductively coupled plasma mass spectrometry (MC-ICP-MS) for Hg isotopic measurements have been extensively investigated and reviewed, certain analytical challenges remain, particularly related to the preconcentration methods used prior to MC-ICP-MS analysis. Our study investigates these constraints, focusing on which preconcentration techniques are optimal for measuring isotopic compositions of various atmospheric Hg forms. The results indicate that direct gold sampling, which is typically used to measure gaseous elemental mercury (GEM), also captures 20-80% of gaseous oxidized mercury (GOM) unintentionally. Thereby, a fraction between GEM and total gaseous mercury (TGM) is measured. Similarly, particulate-bound mercury (PBM) membrane sampling not only measures PBM but also inadvertently captures over 50% of GOM. These findings suggest that many current datasets may not represent pure end-members but rather mixed samples of GEM/TGM or PBM/GOM, potentially leading to inaccuracies in isotopic mixing models. Based on our findings, we offer several recommendations for future analyses to improve the accuracy and reliability of atmospheric Hg isotope studies.

How to cite: Gačnik, J., Živković, I., and Horvat, M.: Instights from Atmospheric Mercury Isotopes: Analytical Considerations, EGU General Assembly 2025, Vienna, Austria, 27 Apr–2 May 2025, EGU25-1297, https://doi.org/10.5194/egusphere-egu25-1297, 2025.

Mercury (Hg) progressively accumulates in soils through processes such as vegetation uptake, litterfall, throughfall, and direct deposition. Soils constitute the largest reservoir of Hg, with surface soil stocks estimated at 235 to 1150 Gg. Despite its significance as a toxic neuropollutant, current environmental policies often overlook the remobilization of legacy Hg stocks stored in soils. However, the stability of soils Hg stocks, as well as the pathways and magnitudes of potential remobilization, remain poorly quantified. Due to the strong affinity of Hg for organic carbon (OC), their cycles are tightly coupled. Consequently, changes affecting OC stability have direct implications for soil Hg stocks. This is particularly critical for permafrost soils, which hold substantial amounts of OC and of Hg (72 Gg in the top 0-30 cm) but are highly vulnerable to climate change-driven thawing.

To address this gap, we are extending the ORCHIDEE-MICT-PEAT-LEAK land surface model, which mechanistically represents the production, transport, and transformation of OC in soils and permafrost, by integrating the Hg cycle. The model will be evaluated against observational data, such as regional surface Hg stock maps and vertical soil core profiles.

Once validated, the model will enable quantification of Hg fluxes emitted into the atmosphere or leaching into rivers. Additionally, simulations under various CMIP6 climate change scenarios will assess the stability of soil Hg stocks across temperate and permafrost regions. This work aims to improve understanding of Hg dynamics in a warming climate and inform strategies for managing Hg risks.

How to cite: Sereni, L., Guenet, B., and Angot, H.: Modeling the stability and remobilization of mercury in temperate and permafrost soils under climate change with ORCHIDEE-MICT-PEAT-LEAK, EGU General Assembly 2025, Vienna, Austria, 27 Apr–2 May 2025, EGU25-2710, https://doi.org/10.5194/egusphere-egu25-2710, 2025.

EGU25-3061 | Posters on site | BG1.8

Trend and inter-annual variability of atmospheric mercury concentrations at a mountain site in Taiwan 

Guey-Rong Sheu, Po-Ting Hsiao, Ly Sy Phu Nguyen, and Ming-Cheng Yen

Concentrations of gaseous elemental mercury (GEM) have been monitored at the Lulin Atmospheric Background Station (LABS; 120.87ºE, 23.47ºN, 2862 m a.s.l.), a high mountain forest site in central Taiwan, since April 2006. A significant decreasing trend in GEM at a rate of -1.1% yr-1 (-0.018 ng m-3 yr-1) was found between 2007 and 2022, comparable to the decreasing trends observed in other regions. Multiscale temporal variations of GEM concentrations were studied and distinguished by the application of the Hilbert-Huang transformation (HHT). Diurnal, monthly, annual, and inter-annual GEM cycles were identified. Daily GEM variability at the LABS is controlled by the local upslope movement of boundary layer air, whereas seasonal variability is driven by regional air mass origins and transport paths. The amplitude of the GEM concentration inter-annual variability (IAV) is greater than those of diurnal and seasonal variabilities, highlighting the importance of GEM IAV and the associated driving factors. The IAV cycles for the SOI were similar in frequency to the GEM IAV cycles but negatively correlated, revealing the dependency of GEM IAV on climatology variations (e.g., ENSO). Large-scale atmospheric circulation played an important role in modulating GEM IAV. In El Niño years, the westerly was enhanced with more air masses passing India, northern Indochina Peninsula, and southwest and southeast China before arriving LABS, causing elevated levels of atmospheric Hg. On the other hand, the westerly weakened and deviated from Taiwan in La Niña years. This caused more air masses from the Pacific Ocean, resulting in lower atmospheric Hg concentrations. Furthermore, the relationship between ENSO and GEM is sensitive to extreme events (e.g., 2015−2016 El Niño), resulting in perturbation of the long-term trend and atmospheric Hg cycling. Future climate change will likely increase the number of extreme El Niño events and, hence, could alter atmospheric Hg cycling and influence the effectiveness evaluation of the Minamata Convention on Mercury.

How to cite: Sheu, G.-R., Hsiao, P.-T., Nguyen, L. S. P., and Yen, M.-C.: Trend and inter-annual variability of atmospheric mercury concentrations at a mountain site in Taiwan, EGU General Assembly 2025, Vienna, Austria, 27 Apr–2 May 2025, EGU25-3061, https://doi.org/10.5194/egusphere-egu25-3061, 2025.

EGU25-3218 | Posters on site | BG1.8

Speciation and interconversion of atmospheric mercury 

Alexei Khalizov

Speciation of atmospheric gaseous oxidized mercury (GOM) and particle-bound mercury (PBM) controls the rate of deposition of these two forms to the land and oceans. What chemicals lurk behind the acronyms GOM and PBM? What processes interconvert these forms between each other and gaseous elemental mercury (Hg)? These questions cannot be answered independently of each other, as they are tightly coupled. Even in the case of GEM, in addition to direct emissions from land and oceans it can be formed directly in the atmosphere, e.g., by thermal dissociation of labile Hg(I) intermediates and photochemical dissociation of relatively stable Hg(II) compounds, GOM and PBM, whose chemical makeup is still poorly known.The challenge of chemically speciating Hg(II), in addition to its ultra-trace concentration levels, is compounded by its labile nature. Furthermore, it is highly likely that there are two kinds of GOM in the atmosphere: the first comes directly from the photochemical oxidation of GEM while the second is a result of volatilization of PBM. In essence, GOM of the second kind is formed when the first kind, taken by aerosol particles, undergoes particle-phase processing and then re-enters the gas phase in a different chemical form. For instance, following this scheme, BrHgOH from the photochemical oxidation of GEM mediated by Br, ozone, and volatile organic compounds can be taken by sea-salt aerosol and converted to mercuric chloride, which would re-enter the gas phase to be identified as GOM. A similar uptake-reemission process to form mercuric chloride might be even possible on continental urban aerosols, depending on the values of rate constants and equilibrium constants of relevant reactions, not all of which have been fully identified. This presentation will provide an overview of the above mentioned processes and their roles in controlling the speciation of atmospheric mercury in all of its forms.

How to cite: Khalizov, A.: Speciation and interconversion of atmospheric mercury, EGU General Assembly 2025, Vienna, Austria, 27 Apr–2 May 2025, EGU25-3218, https://doi.org/10.5194/egusphere-egu25-3218, 2025.

EGU25-4562 | ECS | Orals | BG1.8

Regional drivers of Hg loadings informed by spatially and temporally dense observations 

Eric M. Roy, David A. Gay, and Noelle E. Selin

Mercury (Hg) is a neurotoxic element that can bioaccumulate in aquatic food webs, posing risks to high trophic level species, including humans. While continental-scale gradients of atmospheric Hg concentration and deposition can be evaluated using national monitoring networks, regional gradients of Hg loadings remain poorly defined. Evaluation of regional Hg gradients has been limited by coarse spatial coverage of observations along with differences in standard operating procedures between measurement sites, hindering quantitative inter-site comparison.

Here, we use Hg observations in the northeastern United States coordinated by the National Atmospheric Deposition Program (NADP) to identify regional variability in Hg loadings and quantify the range of surface, chemical, and physical fluxes that can explain observed seasonal and diurnal trends. Elemental Hg (Hg0) concentration measurements between 2014 and 2020 at four key sites are used, two representing the New York City (NYC) metropolitan area (Bronx, NY and New Brunswick, NJ), and two representing rural conditions approximately 350 km north of NYC (Huntington Wildlife Preserve NY and Underhill VT). These measurements are supplemented by wet deposition measurements at several sites throughout the region along with two sites that have directly quantified Hg0 surface fluxes over northern forests for greater than one year. We construct a box model representing the NYC metropolitan area that accounts for horizontal advection, boundary layer entrainment, and wet deposition to evaluate the range of surface, chemical, and meteorological fluxes required to reproduce observed diel and seasonal Hg variability. These updated fluxes are then implemented in the GEOS-Chem-Hg chemical transport model, and its impact on regional and global deposition are evaluated.

We find that Hg0 concentrations were consistent at rural (1.22 and 1.30 at Huntington and Underhill, respectively) and urban (1.67 and 1.72 at New Brunswick and Bronx, respectively) sites but demonstrated a noteworthy difference across the urban to rural gradient. Interestingly, we find that diel variations differed across region type, with maximum summertime concentrations at urban (rural) sites occurring during the night (day). Furthermore, despite the large average gradient between sites, concentrations at urban and rural sites approached one another during turbulent daylight hours, suggesting a synoptic scale forcing on atmospheric concentrations. Despite obvious spatial and temporal gradients in observations, we find that these patterns are absent from current versions of the GEOS-Chem chemical transport model, underscoring the need to reevaluate surface, chemical, and meteorological fluxes controlling regional gradients of Hg atmospheric loadings.

How to cite: Roy, E. M., Gay, D. A., and Selin, N. E.: Regional drivers of Hg loadings informed by spatially and temporally dense observations, EGU General Assembly 2025, Vienna, Austria, 27 Apr–2 May 2025, EGU25-4562, https://doi.org/10.5194/egusphere-egu25-4562, 2025.

Significant knowledge gaps exist in the fate of mercury (Hg) and its isotopic fractionation in forests and limit the understanding of the global Hg mass budget. This study, for the first time, conducted a whole-ecosystem Hg isotope study to depict the Hg biogeochemical processes in a subtropical evergreen forest. Results show that atmospheric Hg0 is the primary source of Hg in foliage, woody biomass, throughfall water, runoff water and the food chains of birds. The studied subtropical evergreen forest is an atmospheric Hg0 sink of 57.6±43.9 μg m-2 year-1, and an atmospheric Hg2+ sink of 11.5± 6.2 μg m-2 year-1. The Hg mass-dependent fractionation Hg0 driven by the biogeochemical processes leads to a -0.69±0.58‰ in δ202Hg of atmospheric Hg0 but an insignificant shift for Δ199Hg. This study provides a protocol for quantifying the atmospheric Hg0 and Hg2+ sink over the whole forest ecosystem and the impact of vegetation on Hg0 isotopic shift; and demonstrates the use of stable Hg isotopes in tracing atmospheric Hg cycle in terrestrial ecosystems.   

How to cite: Feng, X., Wang, X., Yuan, W., and Lin, J.: Cycling of elemental mercury vapor controls the sink and isotopic fractionation of atmospheric mercury in forest ecosystems, EGU General Assembly 2025, Vienna, Austria, 27 Apr–2 May 2025, EGU25-4610, https://doi.org/10.5194/egusphere-egu25-4610, 2025.

EGU25-8361 | ECS | Posters on site | BG1.8

Methylmercury in surface runoff from beaver- and human-induced inundations in the forest landscape 

Mengxi Wang, Kirstine Andersson, Marcus Wallin, Frauke Ecke, and Karin Eklöf

Rewetting of previously drained wetlands is a strategy to mitigate the effects of climate change via increased carbon sequestration as well as improve water holding capacity and biodiversity in the forest landscape. The damming of watercourses by beavers creates similar water retention features. In both cases, the inundation of forest soils may affect the mobilization of mercury (Hg), and subsequent production of toxic and bioavailable methylmercury (MeHg), due to the generation of anoxic conditions where microbial methylators can proliferate. Elevated MeHg concentrations in water may accumulate in the food web and increase the already high Hg levels in inland fishes in Sweden. Here, we studied the impacts of rewetting and beaver ponds on total Hg (THg) and MeHg concentrations in runoff water collected throughout Sweden.

A total of 72 sites were sampled, comprising rewetted sites (n=15), beaver dams (n=15), and pristine wetlands (n=12). Each of the inundated sites was paired with a nearby reference, i.e. rewetted sites were compared to drained wetlands (n=15) and beaver ponds to watercourses without beaver dams (n=15).

Concentrations of MeHg were higher in runoff from both rewetted and beaver-impacted sites compared to natural wetlands, but only beaver ponds exhibited significantly higher MeHg concentrations relative to their reference sites. Meanwhile, THg concentrations were significantly higher in rewetted sites compared to drained sites. A critical difference between rewetted sites and inundations caused by beavers is that the latter will be found on a wide variety of land types, whereas the former typically represent previously drained wetlands, often peatlands. These results indicate that rewetting drained wetlands increases the mobilization of THg but does not promote the formation of MeHg to the same extent as inundation of other terrestrial soils, including upland soils, by beavers.

How to cite: Wang, M., Andersson, K., Wallin, M., Ecke, F., and Eklöf, K.: Methylmercury in surface runoff from beaver- and human-induced inundations in the forest landscape, EGU General Assembly 2025, Vienna, Austria, 27 Apr–2 May 2025, EGU25-8361, https://doi.org/10.5194/egusphere-egu25-8361, 2025.

EGU25-8515 | Orals | BG1.8

Effects of rewetting and ditch cleaning on total- and methylmercury concentrations in surface water  

Karin Eklöf, Alberto Zannella, Ulf Sikström, Mengxi Wang, Eliza Maher Hasselquist, Hjalmar Laudon, and Marcus Wallin

The management options for historical drainage to improve forest productivity are highly politicized in many high latitude regions, often related to potential climate and biodiversity values. However, important consequences of this legacy and current management to mercury (Hg) mobilization and the microbial formation of methylmercury (MeHg) should also be considered. As the historical ditches age, ditch cleaning could be an option to maintain forest growth rates. However, reducing the drainage capacity by rewetting peatlands are also a viable option, to increase water holding capacity, carbon sequestration and biodiversity. While ditch cleaning may cause erosion influencing Hg mobilization, flooding of peat soil during rewetting may increase the microbial formation of MeHg. Here, we studied how both recent rewetting and ditch cleaning influence MeHg and total Hg (THg) in stream runoff across Sweden.

We used two field infrastructures, (a) a spatial study where 25 rewetted wetlands and 25 cleaned ditches distributed from north to south of Sweden were sampled during two (rewetting) or three (ditch cleaning) campaigns and (b) a temporal study where two rewetted wetlands and two cleaned ditches located in Trollberget Experimental Area in the north of Sweden that were sampled at a monthly basis both before (>1 year) and after (>2 years) rewetting or ditch cleaning. All sites at both (a) and (b) had nearby references, i.e. non-restored and non-cleaned ditches.

In the spatial study (a) THg concentrations, but not MeHg concentrations, were elevated in rewetted wetlands compared to references. Concentrations of MeHg were lower in cleaned ditches than in non-cleaned, but only in those located in forests, and not in clear-cuts. THg concentrations did not differ between cleaned and non-cleaned ditches. In the temporal study in Trollberget (b), rewetting and ditch cleaning had more pronounced effects. Both THg and MeHg increased after rewetting in one of the two wetlands, and decreased after ditch cleaning.

We suggest that the observed changes on MeHg and THg concentrations were largely driven by changes in groundwater levels, where rewetting resulted in higher levels and ditch cleaning in lower levels, which resulting in altered redox conditions stimulating or inhibiting MeHg formation. Also, altered groundwater levels affected dominating hydrological flowpaths, which influenced MeHg and THg mobilization from soils to water.

Although MeHg and THg concentrations may increase initially after rewetting, these sites may also benefit from enhancing other important ecosystem services, such as promoting carbon sequestration and providing a diversity of plants, animals, and microorganisms. This research will be an important contribution when forming guidelines concerning where and how wetlands can be restored to maximize benefits and reduce potential negative impacts.  

How to cite: Eklöf, K., Zannella, A., Sikström, U., Wang, M., Maher Hasselquist, E., Laudon, H., and Wallin, M.: Effects of rewetting and ditch cleaning on total- and methylmercury concentrations in surface water , EGU General Assembly 2025, Vienna, Austria, 27 Apr–2 May 2025, EGU25-8515, https://doi.org/10.5194/egusphere-egu25-8515, 2025.

EGU25-8960 | Posters on site | BG1.8

Mercury emissions trends over five decades in a technology-based global inventory. 

Marilena Muntean, Monica Crippa, Diego Guizzardi, Federico Pagani, William Becker, Manjola Banja, Edwin Schaaf, and Andrea Simonati

Accurate emissions estimation is essential for the impact evaluation and for designing effective mitigation actions. The Emissions Database for Global Atmospheric Research (EDGAR) provides independent estimates of speciated mercury emissions by sector at global and national levels, and emissions gridmaps of 0.1 x 0.1 degree resolution for the period 1970-2022. The trend analysis shows that in this period mercury emissions increased by 123% reaching the level of 1863 tonnes in 2022. At sectorial level, the emissions from chlor-alkali, which had a great share in 1970 (14%), decreased by 96% whereas the emissions from cement production, which had a share of 4% in 1970 increased by 421% contributing to the total global emissions in 2022 by 10%. Special attention is given to the artisanal small-scale gold mining (ASGM) sector due to its significant share of 16% in 1970 and of 47% in 2022; we will provide an insight on the uncertainty related to the methodology and data availability, the drivers leading to an increase of 567%, and on global spatial distribution of mercury emissions.

The impact of increases in fuel consumption (303%) together with the implementation of mitigation technologies on the levels of mercury emissions is investigated for power generation sector, which showed an increase of 100% in the period 1970-2022. We developed a “no end-of-pipe (EoP) ex-post scenario” to analyse the impact of the mitigation of mercury emissions by end-of-pipe abatement measures in the power generation sector. Figure 1 illustrates the global mercury emissions from fuel combustion in power generation over five decades together with the levels of emissions in the “no end-of-pipe (EoP) ex-post scenario”. The mitigation measures implementation in this sector accounted for 437 tonnes of avoided mercury emissions in 2020.

The trend analysis will be extended to look at the regional particularities focusing on the ten IPCC Continental Regions. The relevant findings will be presented together with the uncertainties for each sector.

Figure 1. Mercury emissions from fuel combustion in power generation: a) mercury emissions over five decades are represented in green and the emissions from no end-of-pipe (EoP) ex-post scenario are represented in blue; the bars on the graph illustrate the fuel share by type, b) emissions shares by sector in 2020 for the three continents for which the contribution from power generation sector is important.

How to cite: Muntean, M., Crippa, M., Guizzardi, D., Pagani, F., Becker, W., Banja, M., Schaaf, E., and Simonati, A.: Mercury emissions trends over five decades in a technology-based global inventory., EGU General Assembly 2025, Vienna, Austria, 27 Apr–2 May 2025, EGU25-8960, https://doi.org/10.5194/egusphere-egu25-8960, 2025.

EGU25-9059 | Posters on site | BG1.8

Mercury in Coastal-Marine Environments: A Case Study in the Port of Llanes, Asturias (Northern Spain) 

Efrén García Ordiales, Jose Ignacio Barquero, Jherson Antonio Morales Laurente, Enol Navarro Murillo, Pelayo Rico Fernandez, Pablo Cienfuegos Suarez, and Pablo Higueras

Mercury is one of the most problematic elements in the environment due to its persistence, bioaccumulation, and transfer across different trophic levels of the food chain. One of the environments where this element poses the greatest challenges is the coastal-marine ecosystem, owing to its rich biodiversity. Within these environments, anthropized estuarine areas, such as port zones, present increased issues because of the significant accumulation of sediments that act as reservoirs for this contaminant.

In Asturias (northern Spain), the Port of Llanes, located in a small town in the eastern part of the region, has shown elevated mercury concentrations in sediments over the last 20 years, requiring detailed monitoring and investigation. This study provides an initial approach to the issue, examining mercury concentrations, dispersion, associations, and speciation in sediments collected from the port.

The results revealed that mercury concentrations in the sediments ranged from 0.07 to 2.98 µg g⁻¹, with higher concentrations associated with finer-grained sediments and increased organic matter content. These concentrations exceed contamination thresholds established by Spanish legislation regarding port dredging, and certain samples tested exhibited toxicity levels harmful to organisms. Granulometric fractionation of the samples showed that 70% of the mercury was associated with particle sizes <63 µm, while up to 85% was associated with particles <125 µm.

Thermal speciation analysis was conducted to identify the predominant mercury species and their potential association with the observed toxicity. The results indicated three main mercury species in the sediments. Mercury associated with oxides was the most abundant, followed by mercury bound to organic matter. Finally, mercury associated with sulfur (e.g., cinnabar) was the least abundant of the three.

These findings validated the results of mercury granulometric fractionation, as the identified species were closely linked to finer sediment fractions. Furthermore, they allowed the formulation of a hypothesis regarding the origin of mercury in these sediments. In this context, since there is no identifiable local source of mercury release into the coastal environment, the hypothesis of a natural origin for these mercury concentrations gains relevance. Studies on groundwater in the area have reported significant mercury levels, suggesting that the geological substrate is the most likely source of these anomalous concentrations.

Future research should focus on conducting a more detailed study of the immediate coastal strip surrounding the port to validate these preliminary findings.

How to cite: García Ordiales, E., Barquero, J. I., Morales Laurente, J. A., Navarro Murillo, E., Rico Fernandez, P., Cienfuegos Suarez, P., and Higueras, P.: Mercury in Coastal-Marine Environments: A Case Study in the Port of Llanes, Asturias (Northern Spain), EGU General Assembly 2025, Vienna, Austria, 27 Apr–2 May 2025, EGU25-9059, https://doi.org/10.5194/egusphere-egu25-9059, 2025.

EGU25-9385 | ECS | Posters on site | BG1.8

Potential biotransformations of mercury in marine sediments across marginal slope to hadal zone 

Zhuobo Li, Haifeng Qian, Yong-Guan Zhu, and Yong Wang

Mercury accumulates in the deep sea, but its ecological impact on deep-sea ecosystems remains poorly understood. We conducted an analysis of 32 sediment cores, comprising 101 layers for the study of metagenomes, and additional 41 global reference sediment metagenomes. These sediment cores were collected from two deep-sea regions: the South China Sea (SCS) and Mariana Trench (MT), followed by revealing high mercury accumulation in the SCS. In these metagenomes, we found that the mercury methylation genes hgcA/B as detoxification regulators were abundant in marginal seas but negligible in open oceans. Instead of taking the Wood-Ljungdahl pathway as methyl group donor, some Hg-methylating microorganisms affiliated with Desulfobacterota, Spirochaetota, and Zixibacteria in the deep-sea sediments have the potential to utilize osmolyte-derived trimethylamine for methylation. The demethylation gene merB was widely distributed and exhibits higher abundance in the open ocean. Moreover, we identified a large number of novel Hg demethylating taxa that are associated with horizontal transfer of the merB gene potentially involving methane generation. Our results expand the diversity of Hg-metabolizing taxa and reveal their unique ecophysiological adaptations in deep-sea sediments.

How to cite: Li, Z., Qian, H., Zhu, Y.-G., and Wang, Y.: Potential biotransformations of mercury in marine sediments across marginal slope to hadal zone, EGU General Assembly 2025, Vienna, Austria, 27 Apr–2 May 2025, EGU25-9385, https://doi.org/10.5194/egusphere-egu25-9385, 2025.

EGU25-9890 | Orals | BG1.8

Role of the stratosphere in the global mercury cycle  

Alfonso Saiz-Lopez, Carlos A. Cuevas, A. Ulises Acuña, Juan A. Añel, Anoop S. Mahajan, Laura de la Torre, Jeroen E. Sonke, Aryeh Feinberg, Juan Carlos Gomez Martin, Julian Villamayor, Oleg Travnikov, Feiyue Wang, Johannes Bieser, Joseph S. Francisco, and John M. C. Plane and the Et. al

Mercury (Hg) is a global pollutant with substantial risks to human and ecosystem health. By upward transport in tropical regions, mercury enters into the stratosphere, but the contribution of the stratosphere to global mercury dispersion and deposition remains unknown. Here, we find that between 5% and 50% (passing through the 400K adiabatic layer and tropopause, respectively) of the mercury mass deposited on Earth's surface is chemically processed in the lower stratosphere. Our results show the stratosphere as a unique chemical environment where elemental mercury is efficiently converted to long-lived oxidised species. Subsequent downward transport contributes substantially to the oxidised mercury burden in the troposphere. The results show that the stratosphere facilitates the global dispersion of large amounts of mercury from polluted source regions to Earth's remote environments. We find that stratospheric transport is as important as tropospheric transport in interhemispheric mercury dispersion. Future projections suggest that expected changes in atmospheric circulation will increase the transport of mercury into the stratosphere.


How to cite: Saiz-Lopez, A., Cuevas, C. A., Acuña, A. U., Añel, J. A., Mahajan, A. S., de la Torre, L., Sonke, J. E., Feinberg, A., Gomez Martin, J. C., Villamayor, J., Travnikov, O., Wang, F., Bieser, J., Francisco, J. S., and Plane, J. M. C. and the Et. al: Role of the stratosphere in the global mercury cycle , EGU General Assembly 2025, Vienna, Austria, 27 Apr–2 May 2025, EGU25-9890, https://doi.org/10.5194/egusphere-egu25-9890, 2025.

EGU25-12800 | ECS | Posters on site | BG1.8

Dissolved gaseous mercury in peat porewater increases as trophic status decreases 

Chuxian Li, Wei Zhu, Stefan Osterwalder, Ulf Skyllberg, and Kevin Bishop

Peatlands are long-term sinks of mercury (Hg) and hotspots of neurotoxic methyl-Hg production. Dissolved gaseous mercury (DGM or Hg0aq) is a key component in peatland Hg cycling due to its high volatilization and potential oxidation to HgII, the precursor of neurotoxic methyl-Hg (MeHg). Despite the importance of DGM in Hg cycling, DGM dynamics in peatlands remain poorly understood. Here, we present temporal changes in porewater DGM concentrations in six different boreal peatlands with a gradient of trophic levels and chronologies. DGM concentrations are significantly higher in older, more oligotrophic ones (> 2500 years) than in younger, more mesotrophic peatlands (< 1500 years). There is also a more pronounced seasonal variation in older, more oligotrophic peatlands, with a marked DGM peak in summer. The lower DGM concentrations in younger, more mesotrophic peatlands are likely due to stronger oxidation capacity in the presence of chloride and more nutrients, leading to less DGM production in the porewater and more bioavailable HgII for methylation. Our study suggests that older, more oligotrophic peatlands with lower MeHg concentrations likely have the potential to evade more Hg0 into the atmosphere in the boreal landscape.

How to cite: Li, C., Zhu, W., Osterwalder, S., Skyllberg, U., and Bishop, K.: Dissolved gaseous mercury in peat porewater increases as trophic status decreases, EGU General Assembly 2025, Vienna, Austria, 27 Apr–2 May 2025, EGU25-12800, https://doi.org/10.5194/egusphere-egu25-12800, 2025.

Since humans began utilizing mercury, pollution has increased atmospheric Hg seven-fold. Mercury (Hg) contamination is the single largest cause of waters in the European Union failing to meet the standards of the EU Water Framework Directive. Peatlands, which have accumulated a legacy of past atmospheric Hg pollution, are major sources of Hg contamination in downstream aquatic ecosystems. Despite peatlands having accumulated Hg for millennia, independent lines of research indicate that some northern peatlands are now returning Hg to the atmosphere. This raises questions about what controls the fate of the pollution legacy Hg stored in peatlands. We hypothesize that legacy Hg accumulated in peat during earlier periods of higher atmospheric Hg pollution is no longer in balance with the lower Hg levels of the contemporary atmosphere, leading to net Hg evasion. Several methodological advances were applied to test this hypothesis on a 2000-year chronosequence of mires created by isostatic uplift along the northern coast of Sweden as well as the nearby Degerö peatland that is even older. Despite uniform climate and atmospheric Hg concentrations across the 15 km extent of the chronosequence, the stock of Hg differs by a factor of two. Novel Hg eddy covariance quantified the Hg exchange between the land and atmosphere. Distributed measurements of dissolve gaseous elemental mercury (GEM) in shallow peat groundwater quantified seasonal variation in a potential source of the evading Hg. Natural abundance of Hg isotopes and community-level expression profiling of microbial metabolisms identified the role of specific processes in the transformation of Hg within peat profiles along the chronosequence. This paper reports on puzzle pieces that have fallen into place, such as isotopic evidence for the role of photoreduction in producing GEM, and the challenges that remain to complete the picture.  

How to cite: Bishop, K., Li, C., and Osterwalder, S.: The fate of industrial-era mercury in peatlands revealed with micrometeorology, isotopes, paleoecology, genomics, and an ice-age, EGU General Assembly 2025, Vienna, Austria, 27 Apr–2 May 2025, EGU25-13151, https://doi.org/10.5194/egusphere-egu25-13151, 2025.

EGU25-15007 | ECS | Orals | BG1.8

Mercury Emission Dynamics in India: Insights from Sensitivity Analysis 

Hema Bhatt and Asif Qureshi

India, as the second-largest global emitter of mercury, faces significant environmental challenges despite being a signatory to the Minamata Convention. Mercury’s toxic nature, coupled with its long-lasting presence and tendencies to bioaccumulate and biomagnify, underscores the urgency of monitoring its emissions and impacts. However, India lacks robust ground-based observation data to assess mercury's distribution and deposition comprehensively. In this study, we utilized the GEOS-Chem model with the latest inventory available at 0.25° × 0.3125° to simulate mercury dynamics over India (2015 to 2017). The results reveal that regions hosting coal-based thermal power plants and brick kilns exhibit the highest mercury deposition (100-140 µg m-2 a-1) and atmospheric concentrations (10-20 ng m-3). Sensitivity analyses further delineated the contributions of natural and Indian anthropogenic emissions to mercury deposition across India and Asia. Additionally, we evaluate the impact of Asian emissions on India’s mercury burden. This study provides insights into the spatial dynamics of mercury in India and highlights the regional interdependence of emissions. These findings can guide policymakers in formulating targeted mitigation strategies to reduce mercury emissions and their transboundary impacts effectively. Further research is needed to examine the transformation of deposited mercury into its bioaccumulative form, methylmercury, and its implications for human health.

How to cite: Bhatt, H. and Qureshi, A.: Mercury Emission Dynamics in India: Insights from Sensitivity Analysis, EGU General Assembly 2025, Vienna, Austria, 27 Apr–2 May 2025, EGU25-15007, https://doi.org/10.5194/egusphere-egu25-15007, 2025.

EGU25-15308 | ECS | Posters on site | BG1.8

Mercury deposition and bioaccumulation in coastal Antarctic ecosystems controlled by sea ice dynamics 

Yulu Xue, Ruoyu Sun, Guangyi Sun, Yi Liu, Chuanjin Li, Shiyu Wang, Xueying Wang, and Xiaodong Liu

Mercury (Hg) enters terrestrial ecosystems through vegetation uptake, yet the sources, bioaccumulation, and influencing factors of terrestrial Hg in the Antarctic remain unclear. Cryptogams (e.g., mosses and lichens) are conventional Hg biomonitors and major vegetation types in polar regions. Here, we measured Hg concentrations and isotope compositions in cryptogams from continental and maritime Antarctica. The results show large variability in Hg concentrations (40 to 1128 ng/g) and mass-independent fractionation (denoted by  Δ199Hg: -1.94 to 0.87‰)  depending on geographical distribution. Cryptogams near first-year sea ice show elevated Hg bioaccumulation and significant negative  Δ199Hg, possibly due to promoting atmospheric Hg depletion events (AMDEs) through active halogen chemistry. In contrast, multi-year sea ice inhibits oceanic evasion and weakens halogen chemistry, resulting in lower Hg bioaccumulation and positive Δ199Hg values in cryptogams. These findings suggest that sea ice dynamics play a dual role in Hg cycling in the Antarctic coastal ecosystem. In the context of global warming, declining sea ice would lead to greater loading of Hg to the Antarctic coastal ecosystem.

How to cite: Xue, Y., Sun, R., Sun, G., Liu, Y., Li, C., Wang, S., Wang, X., and Liu, X.: Mercury deposition and bioaccumulation in coastal Antarctic ecosystems controlled by sea ice dynamics, EGU General Assembly 2025, Vienna, Austria, 27 Apr–2 May 2025, EGU25-15308, https://doi.org/10.5194/egusphere-egu25-15308, 2025.

EGU25-15520 | ECS | Orals | BG1.8

Methylmercury formation in an ice-covered fjord system with redox stratified water column 

Thibaut Cossart, Júlia Dordal-Soriano, Meifang Zhong, Tove Bratthäll, Eric Capo, Andrea G. Bravo, and Erik Björn

Oxygen deficiency is increasing in coastal zones and the global ocean, potentially promoting methylmercury (MeHg) formation. Intensive work has been done to understand the factors controlling the methylation of Hg(II) to MeHg in open seas and oceans, but these processes are understudied in fjord systems which also undergo oxygen decreases. We hypothesized that in oxygen-deficient fjords, MeHg formation is influenced by (i) the Hg(II) bioavailability, as mainly controlled by Hg(II) complexes with sulfide and, (ii) the presence of microorganisms able to do Hg methylation (i.e., carrying and expressing hgcAB genes). We studied a fjord in northern Norway with a 40 m deep redox stratified water column to better understand the underlying factors/processes driving MeHg concentrations in zones affected by oxygen deficiency. Along the 40 m depth water column, O2 concentrations decreased from 440 µM to non-detectable, and H2S concentrations increased with depth from non-detectable to >600 µM concentrations. Total Hg and MeHg concentrations, methylation (km) /demethylation (kd) rate constants and hgcAB gene abundance were determined at several depths along the vertical redox gradient. MeHg concentrations varied from 0.1 to 5.1 pM with a peak at 10 m depth, after the redox transition zone (6 – 10 m). The MeHg production, determined as the Hg(II) methylation rate constant (km), followed a similar vertical pattern with negligible km in the oxic zone and an increase with depth up to a maximum of ≈0.0001 h-1 under anoxic condition. Statistical analysis showed a positive relationship between km and the concentration of dissolved Hg(II)-sulfide complexes revealing the importance of these compounds in regulating the Hg(II) availability for MeHg formation in this environment. Metagenomic analysis detected hgcAB genes in samples with low oxygen concentrations, highlighting the possible presence of Hg methylators in this ecosystem. Coupling the chemical and microbial analyses, both Hg(II) availability and the presence and abundance of hgcAB-carrying microorganisms suggest the in-situ MeHg formation in this redox stratified fjord system. The spread of oxygen-deficient coastal zones, e.g. due to global warming and nutrient inputs, is expected to increase Hg(II) bioavailability and expand the niches for Hg methylators. Both these consequences are expected to promote higher MeHg concentrations in coastal areas.

How to cite: Cossart, T., Dordal-Soriano, J., Zhong, M., Bratthäll, T., Capo, E., G. Bravo, A., and Björn, E.: Methylmercury formation in an ice-covered fjord system with redox stratified water column, EGU General Assembly 2025, Vienna, Austria, 27 Apr–2 May 2025, EGU25-15520, https://doi.org/10.5194/egusphere-egu25-15520, 2025.

EGU25-20239 | ECS | Orals | BG1.8

Using enriched stable isotopes to elucidate marine phytoplankton cellular uptake mechanisms and bioavailability of MMHg bound to different natural DOM composition 

Isabel Garcia Arevalo, Sonja Gindorf, Jean Baptiste Bérard, Bastien Thomas, Sofi Jonsson, and Joël Knoery

Understanding the mechanisms governing mercury (Hg) bioavailability to marine phytoplankton is crucial for evaluating its ecological and biogeochemical impacts. Dissolved organic matter (DOM) plays a central role in modulating the mobility, complexation, and bioavailability of monomethylmercury (MMHg), a highly toxic Hg species. This study investigates how the origin of DOM (terrestrial, marine, and phytoplankton-derived exudates) affects MMHg complexation and cellular uptake by marine phytoplankton under controlled laboratory conditions.

Using a single phytoplankton culture and enriched stable Hg isotopes, we simultaneously tracked the uptake dynamics of MMHg complexed with different DOM sources as well as uncomplexed MMHg ions. Our results revealed that total MMHg uptake decreased with increasing dissolved organic carbon (DOC) concentrations, regardless of DOM origin. Notably, no significant differences were observed in MMHg uptake dynamics when comparing DOM of different origins at similar MMHg concentrations. However, we observed increased internalization of MMHg when complexed with both terrestrial and marine DOM. Specifically, organic complexation with DOM from both terrestrial and marine sources reduced MMHg's ability to bind to ligands on the algal surface (phycosphere) but did not hinder its passage across the cell membrane, ultimately enhancing its bioavailability.

These findings offer novel insights into the interaction between DOM composition and MMHg bioavailability, advancing our understanding of mercury dynamics in marine ecosystems. The study underscores the critical role of DOM characteristics in influencing MMHg bioaccumulation and provides valuable data for refining models of mercury cycling in aquatic environments.

How to cite: Garcia Arevalo, I., Gindorf, S., Bérard, J. B., Thomas, B., Jonsson, S., and Knoery, J.: Using enriched stable isotopes to elucidate marine phytoplankton cellular uptake mechanisms and bioavailability of MMHg bound to different natural DOM composition, EGU General Assembly 2025, Vienna, Austria, 27 Apr–2 May 2025, EGU25-20239, https://doi.org/10.5194/egusphere-egu25-20239, 2025.

There exists a plethora of pollutants of global concern for whom the ocean is a key part in their environmental cycle. Namely, mercury (Hg) and several persistent organic pollutants (POPs) which are subject to international treaties (e.g. Minamata Convention, Stockholm Convention) are actively exchanged between atmosphere and ocean and subsequently accumulated in the marine food web. Thus, modeling their environmental fate requires a numerical representation of atmospheric and marine physics, chemistry, and biology

Over the last 5 years 15 PhDs have been dedicated to unravel unknown processes in the global mercury cycle in the course of the EU project GMOS-Train. Many of these findings are now actively used for the ensemble modeling study performed in support of the Minamata Convention effectiveness evaluation. This multi-compartment Hg model and analysis project MCHgMAP is the first study dedicated to modeling the complete global cycle of mercuy.

In my presentation I will give an overview on recent findings on global Hg cycling in atmosphere, ocean and land and show first results of the MCHgMAP multi-compartment modeling study.

How to cite: Bieser, J.: Overview of recent advances modeling in the global mercury cycle, EGU General Assembly 2025, Vienna, Austria, 27 Apr–2 May 2025, EGU25-21840, https://doi.org/10.5194/egusphere-egu25-21840, 2025.

EGU25-181 | ECS | Posters on site | CL2.4

Shifting Seasons, Rising Risks: Spring Frost Predictions for Pedunculate Oak in Hesse, Germany 

Bella Luca Smekal, Bernd Ahrends, Maximilian Axer, Johannes Sutmöller, and Henning Meesenburg

Advanced bud burst in deciduous trees extends the growing season to an earlier date, increasing their vulnerability to spring frost damage. Such frost events, though understudied in current research, can cause long-term damage by compromising the recovery capacity of trees and adding stress to their carbon and water balance. The resilience of pedunculate oak (Quercus robur L.) to the increasingly dry and warm climate positions them as crucial tree species in the planning of climate-adapted forests. Understanding the balance between drought resilience and frost vulnerability is essential for informed decisions about future forest management strategies. In this study, we used a dense monitoring network of phenological observations to i) highlight a significant increase in spring frost risk in recent years and ii) calibrate two phenological models and apply them to the output of seven coupled RCP8.5 climate projections. The models predict a mean advance in oak bud burst by 2-2.7 days per decade, consistent with a 2 days per decade advance observed historically. Despite the general warming trend, last spring frost events have not preponed to earlier dates in the observations. This is probably linked to stable high-pressure systems in spring with enhanced radiative cooling at the surface during the night. However, the projections fail to accurately capture the last frost, likely linked to a known weakness in blocking events. Consequently, we suggest that future frost risk may be underestimated in current projections.

How to cite: Smekal, B. L., Ahrends, B., Axer, M., Sutmöller, J., and Meesenburg, H.: Shifting Seasons, Rising Risks: Spring Frost Predictions for Pedunculate Oak in Hesse, Germany, EGU General Assembly 2025, Vienna, Austria, 27 Apr–2 May 2025, EGU25-181, https://doi.org/10.5194/egusphere-egu25-181, 2025.

Climate change is one of the greatest challenges facing the agricultural sector in the 21st century. In recent decades, extreme heat, uncharacteristic for Latvia, prolonged drought, particularly in spring, and extremely heavy rainfall in the second half of summer have significantly impacted the development of cereals. An example is May 2023, which was the driest May in the history of observations in Latvia. The aim of the study was to describe how uncharacteristic weather conditions caused by climate change impact the phenology and yield stability of summer barley (Hordeum vulgare L.) in two distinct locations, Priekuli (climate type—Dfb) and Stende (climate type—Cfb), from 2000 to 2023. Spring barley in Latvia is usually sown in late April or early May. The analysis of the data revealed a moderately close relationship between the average air temperature in April and the barley sowing time in both Priekuli and Stende. For the most part, in years when the average air temperature in April has been higher, sowing has begun earlier. Early varieties typically require a minimum of 90 days from sowing to full maturity, whereas late varieties usually need an average of 100 to 110 days. However, in certain years, both early and late varieties have experienced a significantly shorter growing season. Years where the average air temperature during the growing season exceeds the norm typically witness a shorter growing season. This was the case, for example, in 2010, 2018, and 2021, when none of the varieties in Priekuli exceeded 89 days between sowing and full maturity. The data from the study show that if the transition from the vegetative growth phases to the generative growth phases occurred very rapidly, the plants had a low tillering rate, there were few productive stems, and the plants were short; hence, the yields were also low. For instance, in 2021, the variety ‘Ansis’ in Priekuli yielded 2.72 t ha-1, approximately twice as low as in years when the weather was optimal for development. If drought and heat accelerate the development of cereals, then frequent precipitation and lower air temperature during the ripening period hinder the onset of full ripeness. Observing adverse weather conditions, such as heavy rainfall, during the full ripeness stage delays harvesting and deteriorates crop quality, as demonstrated in 2017. Based on the results obtained, it is possible to select varieties and breeding lines that, regardless of the influence of weather conditions on the length of the growing season, maintain relatively high yield stability and good yield quality. An analysis of the 24-year data series shows that the increasingly frequent uncharacteristic weather conditions affect the phenology of spring barley. Furthermore, the study results do not show regional differences, as the impact of extreme weather conditions is similar at both observation locations.

How to cite: Dzedule, L., Kalvane, G., and Legzdina, L.: Impact of uncharacteristic weather conditions on the phenology and yield stability of spring barley (Hordeum vulgare L.) in Latvia: a 24-year study (2000–2023), EGU General Assembly 2025, Vienna, Austria, 27 Apr–2 May 2025, EGU25-2233, https://doi.org/10.5194/egusphere-egu25-2233, 2025.

EGU25-4238 | ECS | Posters on site | CL2.4

Variability of autumn tropical Pacific yellowfin tuna tied to the spring North Atlantic Tripole  

Gongjun Zhang and Jianping Li

Climate change affects the spatial distribution and abundance of yellowfin tuna (Thunnus albacares, YFT) in the tropical Pacific, yet the mechanisms linking remote climate modes to YFT dynamics remain unclear. This study finds that the variability of autumn tropical Pacific YFT is tied to the spring sea surface temperature anomalies (SSTAs) of the North Atlantic Tripole (NAT), mediated by the Victoria Mode (VM), the second dominant mode of North Pacific SSTAs variability. The result shows that the spring NAT is significantly positive correlated with the subsequent autumn tropical Pacific YFT catch per unit effort (CPUE). The spring NAT triggers eastward-propagating Rossby waves, inducing VM-like SST anomalies (SSTAs) in the North Pacific. These anomalies modify YFT habitat conditions in the tropical Pacific through coupled oceanic-atmospheric bridge (COAB) mechanism, ultimately affecting autumn CPUE. This study unveils a teleconnection-driven mechanism influencing tropical Pacific YFT CPUE, with important implications for fisheries management and forecasting. 

How to cite: Zhang, G. and Li, J.: Variability of autumn tropical Pacific yellowfin tuna tied to the spring North Atlantic Tripole , EGU General Assembly 2025, Vienna, Austria, 27 Apr–2 May 2025, EGU25-4238, https://doi.org/10.5194/egusphere-egu25-4238, 2025.

EGU25-5103 | Posters on site | CL2.4

Exploring the control of diurnal cycles on chilling and forcing accumulation in tree bud dormancy release 

Yann Vitasse, Günter Hoch, Steeve Pepin, and Francesco Giardina

Cold temperatures (known as ‘chilling’) are perceived by tree buds in winter and are responsible for dormancy release after species-specific exposure times, which marks the start of the buds' sensitivity to warmer temperatures (known as ‘forcing’). Temperate trees are also sensitive to changing daylength, but it remains unresolved whether the accumulation of chilling and forcing is related to the diurnal cycle. This study explores whether trees "count" chilling based on night/day cycles rather than purely through temperature accumulation or exposition, and whether forcing temperatures are more effective during daylight.

We harvested twigs from four temperate tree species with contrasting chilling and forcing requirements for dormancy release in late November 2024 , i.e. before they would experience significant periods of cold. Twig cuttings were then placed into transparent boxes filled with water and kept in climate chambers at 2°C/4°C (night/day) under three diurnal cycles: 12h/12h, 6h/6h (2 cycles per day), and 4h/4h (3 cycles per day) for one month (short chilling) or two months (long chilling). After these six treatments, all cuttings were transferred to forcing conditions with 12h daylight under two temperature regimes: 10°C/25°C and 15°C/20°C, i.e. with the same mean temperature but warmer or colder temperature during daytime. The timing and success of bud break were visually monitored twice a week.The experiment is ongoing. We hypothesize that chilling accumulation is influenced by diurnal cycles, with faster dormancy release for twigs exposed to shorter diurnal cycles. Additionally, we anticipate that daytime temperatures play a more significant role in forcing accumulation, leading to faster budburst in the 10°C/25°C treatment compared to the 15°C/20°C, especially for species known to be photoperiodic sensitive such as European beech. 

Our study will provide insights into how trees perceive and respond to temperature in relation to daylight, which is crucial for understanding and predicting phenological responses accurately in the context of climate change.

How to cite: Vitasse, Y., Hoch, G., Pepin, S., and Giardina, F.: Exploring the control of diurnal cycles on chilling and forcing accumulation in tree bud dormancy release, EGU General Assembly 2025, Vienna, Austria, 27 Apr–2 May 2025, EGU25-5103, https://doi.org/10.5194/egusphere-egu25-5103, 2025.

EGU25-5852 | ECS | Orals | CL2.4

Spring Phenology Models for Temperate Apple Cultivars 

Thomas Ohnemus, Simon Paasch, and Hannes Mollenhauer

The annual dormancy cycle of apple trees is highly temperature dependent, with photoperiod deemed irrelevant for dormancy induction or breaking. In fall, cold days induce endodormancy. Endodormancy, in turn, is overcome by further accumulation of chill, when a cultivar-specific chill requirement is met. To further overcome ecodormancy, a cultivar-specific heat requirement must be met, allowing for bud break and subsequent phenology phases to occur. Thus, compared to species where photoperiod is relevant for the dormancy cycle, apple tree dormancy and spring phenology phases are especially susceptible to climate change.

Chill and heat requirements reported in the literature vary between cultivars, within cultivars with location and even for the same cultivar and location depending on the methodological approach. This is, inter alia, related to an imprecision regarding terminology. The minimum chill and heat to respectively overcome endodormancy and ecodormancy are referred to as chill requirement and heat requirement. Yet, studies often report a chill or heat accumulation that – if a phenological phase occurred – at least met the respective requirement. Thus, the existing literature can provide approximations of the actual chill and heat requirements. However, a large database of phenology observations might include instances at the limit for the occurrence of specific phenological phases. Thus, such a database may most accurately approach a cultivar’s actual chill requirement.

In this work we capitalize on a phenology database by the German Weather Service (DWD) that is openly available. This database entails over 50,000 observations for each bud break, bloom start and full bloom spanning the years 1996 to 2024. While there are data on over 60 apple cultivars, we deemed the data for 23 cultivars sufficient for model development. As source for temperature data, we used a temperature grid with 1x1 km spatial resolution developed by the DWD. As underlying modelling approach, we used the chill overlap model. This model is not merely fitting data statistically, but provides a biological meaningful framework.

This biological footing is crucial to extrapolate findings to different climatic conditions. Therefore, the spring phenology models developed in this work will allow to predict onset of spring phenology phases in a warmer future. Consequently, in the future the risk of late frost events or the risk of approaching climatic conditions that will hinder bud break can be investigated for each cultivar. Thus, a cultivar-specific risk assessment regarding likely future conditions can inform planting decisions.

How to cite: Ohnemus, T., Paasch, S., and Mollenhauer, H.: Spring Phenology Models for Temperate Apple Cultivars, EGU General Assembly 2025, Vienna, Austria, 27 Apr–2 May 2025, EGU25-5852, https://doi.org/10.5194/egusphere-egu25-5852, 2025.

EGU25-7960 * | Posters on site | CL2.4 | Highlight

PEP725: Celebrating 15 Years of this Phenological Research Infrastructure 

Hans Ressl, Markus Ungersböck, and Thomas Hübner

Phenology—the study of the timing of seasonal activities of animals and plants—provides a vital window into ecological responses to climate change (IPCC 2007). Since its inception 15 years ago, PEP725, the Pan-European Phenological Database, has developed into an essential resource for phenological research across Europe.

With support from ZAMG / now Geosphere Austria, the Austrian Ministry of Education, Science and Research, and EUMETNET, PEP725 has built an open-access database that now boasts over 13 million phenological records across many countries of Europe - all classified with a single scale. These records, which trace back to 1775, offer a unified and comprehensive view of phenological observations across Europe. The project continues to overcome challenges posed by disparate data sources and formats, enabling harmonized, large-scale studies and fostering international collaboration.

Throughout its evolution, PEP725 has faced and overcome many challenges, from the integration of different datasets to the creation of a focal point and collaboration platform for European phenological research. PEP725 enables large-scale studies and fostering international cooperation. Since its’s beginning user engagement has steadily increased, with registrations and data downloads reaching new highs, and the database has supported an impressive number of peer-reviewed publications, demonstrating its scientific impact.

In this presentation, we will present the current status of PEP725, including milestones achieved, lessons learnt and challenges encountered along the way. Moreover, we want to express our gratitude to all our indispensable project partners who have accompanied us along the way. We are also pleased to provide an insight into the development of our new website, which aims to improve usability and widen access to this invaluable resource.

How to cite: Ressl, H., Ungersböck, M., and Hübner, T.: PEP725: Celebrating 15 Years of this Phenological Research Infrastructure, EGU General Assembly 2025, Vienna, Austria, 27 Apr–2 May 2025, EGU25-7960, https://doi.org/10.5194/egusphere-egu25-7960, 2025.

EGU25-8123 | Posters on site | CL2.4

The phenological information in the Annual Bulletin of Climate Information of the Meteorological Service of Catalonia 

Montserrat Busto, Jordi Cunillera, Xavier de Yzaguirre, Marc Prohom, Antonio Barrera-Escoda, and Mònica Herrero

The Meteorological Service of Catalonia (SMC) publishes regularly the Annual Bulletin of Climate Indicators with the aim to communicate the state of the climate in Catalonia based on the climate series, the series of sea temperature and sea level, and the phenological series, all of them managed by this institution.

The Annual Bulletin of Climate Indicators (known by the acronym 'BAIC' according to its name in Catalan) has eight chapters: air temperature (data from 27 climate series), precipitation (data from 72 climate series), extreme climate indices (based on Expert Team on Climate Change Detection and Indices standards), synoptic patterns (surface and 500 hPa), phenology (information from the Phenological Network of Catalonia), insolation (data from 8 series), secular observatories (information from specific observatories in Catalonia with more than 100 years of daily data) and sea (one series of sea temperature at different depths, mean sea level and sea storms), apart from the introduction, the executive summary (key points of the bulletin) and the references.

The SMC created the Phenological Network of Catalonia (Fenocat) in 2013, a citizen science network where 79 observers monitor 25 plant species, 14 bird species and 6 butterflies. 37 of these observers have registered information from the very beginning of the Fenocat, and the results shown are based mostly on their information.

The phenology chapter of the Annual Bulletin of Climate Information describes the state of the phenological network, explains the most characteristic features of the phenological situation during the last year and shows the evolution of the onset of the main phenophases from 2013 to the present, as well as the intra-annual variability. Tables are also provided with the value of the trend and its statistical significance.

The main results of the latest BAIC will be shown, providing examples of graphics, charts and tables used to convey these results to the society, with the main goal of reporting the state of the climate to the society in the clearest and most rigorous way possible.

How to cite: Busto, M., Cunillera, J., de Yzaguirre, X., Prohom, M., Barrera-Escoda, A., and Herrero, M.: The phenological information in the Annual Bulletin of Climate Information of the Meteorological Service of Catalonia, EGU General Assembly 2025, Vienna, Austria, 27 Apr–2 May 2025, EGU25-8123, https://doi.org/10.5194/egusphere-egu25-8123, 2025.

EGU25-8512 | ECS | Orals | CL2.4

Dynamics in non-structural carbohydrates of trees might influence the variation of leaf phenology 

Yunpeng Luo, Constantin Zohner, Thomas W. Crowther, Günter Hoch, Andrew D. Richardson, Yann Vitasse, and Arthur Gessler

Plant phenology is a key driver of plant growth and ecosystem-climate interactions, influencing canopy structure, surface albedo, and carbon and water fluxes. While the effects of environmental factors on phenology are well-documented, less attention has been given to intrinsic plant physiological processes. Non-structural carbohydrates (NSC), including sugars and starch, are essential for growth, metabolism, and osmotic regulation, serving as indicators of carbon availability. They reflect the balance between photosynthetic carbon supply (source activity) and the demands of growth and respiration (sink activity), suggesting that NSCs may influence phenological stages such as spring leaf-out and autumn senescence. However, the relationship between NSC dynamics in various plant organs and leaf phenology remains poorly understood.

By synthesizing current knowledge on the interplay between NSCs and leaf phenology, we outline seasonal NSC variations in deciduous and evergreen species. We further propose hypotheses on their interactions with phenological stages, namely leaf-out and autumn leaf senescence, and assess their alignment with existing conceptual carbon allocation models. To address existing gaps, we advocate for integrating NSC dynamics into carbon allocation models by leveraging insights from manipulative experiments, multi-scale observational networks, and remote sensing. These approaches will enable a more comprehensive understanding of NSC-phenology relationships across spatial and temporal scales. This could help us improve the modelling of plant phenology responses and carbon dynamics in diverse ecosystems.

How to cite: Luo, Y., Zohner, C., W. Crowther, T., Hoch, G., D. Richardson, A., Vitasse, Y., and Gessler, A.: Dynamics in non-structural carbohydrates of trees might influence the variation of leaf phenology, EGU General Assembly 2025, Vienna, Austria, 27 Apr–2 May 2025, EGU25-8512, https://doi.org/10.5194/egusphere-egu25-8512, 2025.

EGU25-11008 | ECS | Orals | CL2.4

Premature leaf senescence in temperate trees is strongly driven by pre-solstice heat and drought while post-solstice effects disappeared over recent decades 

Dominic Rebindaine, Thomas W. Crowther, Lidong Mo, and Constantin M. Zohner

Over recent decades, autumn leaf senescence of temperate deciduous trees has generally been delayed. Whilst post-summer solstice warming slows the progression of senescence, pre-solstice warming has been shown to advance senescence onset by increasing developmental rates. Severe heat and drought events, which have been increasing in frequency and intensity, can also advance senescence through stress. Yet, it remains unclear whether premature senescence is primarily driven by faster development or by climatic stress, limiting accurate projections of future premature leaf senescence frequencies. We analysed leaf senescence observations for four dominant deciduous tree species (horse chestnut, silver birch, European beech, and English oak) across >3000 sites in central Europe from 1951–2023. For all species, the proportion of premature senescence events (occurrences within the earliest 5% percentile) has slightly decreased over time (trend: -0.11-0% yr-1). Pre-solstice climate variables had the largest effects on premature senescence likelihood, with post-solstice effects diminishing over time. Pre-solstice growing degree days were the most influential factor, associated with a 30-40% increase in premature senescence likelihood per standard deviation (sd) increase. Nighttime temperatures were as important as daytime temperatures. Leaf-out date was the next most significant factor (25% increase per sd). Water deficit had smaller effects (5-12% sd-1), aligning with our experimental results showing that drought conditions do not cause premature senescence when nutrient availability is high. These results suggest that pre-solstice developmental processes exert a larger effect on premature senescence than summer climatic stress. Nevertheless, ongoing early-season warming and the increasing frequency of heatwaves and droughts is likely to intensify premature leaf senescence in European trees. Such shifts could have key impacts on biogeochemical cycles and community interactions within forest ecosystems.

How to cite: Rebindaine, D., W. Crowther, T., Mo, L., and M. Zohner, C.: Premature leaf senescence in temperate trees is strongly driven by pre-solstice heat and drought while post-solstice effects disappeared over recent decades, EGU General Assembly 2025, Vienna, Austria, 27 Apr–2 May 2025, EGU25-11008, https://doi.org/10.5194/egusphere-egu25-11008, 2025.

EGU25-11953 | ECS | Posters on site | CL2.4

Spatial shifts of seasonal vegetation cycles in Europe over time 

Juliane Brügelmann, Josephin Kroll, and René Orth

Seasonal cycles of vegetation functioning are changing as a consequence of climate change. For example, a widespread greening of the northern hemisphere is observed, with an earlier start of the growing season and a later end of the growing season in some regions. However, in other regions, the growing season is actually ending earlier due to water limitations or more frequent extremes.

In this study, we focus on Europe and calculate seasonal cycles of vegetation indices at each grid cell during a past time period, and determine where most similar seasonal cycles are observed during a more recent time period. This way, we examine how the seasonal vegetation cycle at grid cells has shifted in space over the past decades by analyzing satellite-derived Leaf Area Index (LAI) data. The spatial shift is calculated for each grid cell as the difference between the locations with (i) most similar seasonal cycles during 2010-2018 and (ii) most similar seasonal cycles during 1982-1989. Similarity is assessed based on the RMSE between the seasonal cycles. First results show a widespread eastward and northward shift of seasonal cycles across Europe. The variability of determined shifts is high across regions. Calculations of spatial shifts using MODIS LAI data during more recent time periods are used to validate the long-term results. Finally, we compare the determined spatial shifts to respective trends in hydro-meteorological conditions. 

Our detection of large-scale shifts in seasonal vegetation cycles can help to better understand vegetation response and adaptation to global change, and thereby improve the prediction of future shifts.

How to cite: Brügelmann, J., Kroll, J., and Orth, R.: Spatial shifts of seasonal vegetation cycles in Europe over time, EGU General Assembly 2025, Vienna, Austria, 27 Apr–2 May 2025, EGU25-11953, https://doi.org/10.5194/egusphere-egu25-11953, 2025.

EGU25-12319 | Orals | CL2.4

 Late frosts weaken spring leaf onset carryover effect on autumn senescence  

Sofia Bajocco, Carlotta Ferrara, Lorenzo Crecco, Simone Bregaglio, and Marco Bascietto

Frosts occurring after spring leaf onset significantly jeopardize tree growth, forest productivity, and ecosystem functions. As the climate warms, earlier leaf onset has become increasingly common, exposing plants to heightened risks of frost damage. However, the impacts of spring frosts occurring after leaf onset on later senescence phenology in deciduous forests remain largely unexplored. Using 20 years of remotely sensed phenology data, we demonstrate that, in European beech forests, late spring frost events disrupt predictable patterns of leaf onset and senescence, weakening the carryover effect between the start and end of the growing season. Interestingly, the frequency and intensity of these frost events did not significantly exacerbate this disruption. In contrast, favorable summer conditions were found to partially restore the natural interdependency between leaf onset and senescence. Our findings reveal how plant phenology is profoundly affected by climate change not only as an emerging process but also in terms of its internal dynamics. We aspire for our study to lay the groundwork for highlighting the key role of biological start-end of season carryover effects in the phenology responses to climate change, advocating for their incorporation into the development of phenology models.

How to cite: Bajocco, S., Ferrara, C., Crecco, L., Bregaglio, S., and Bascietto, M.:  Late frosts weaken spring leaf onset carryover effect on autumn senescence , EGU General Assembly 2025, Vienna, Austria, 27 Apr–2 May 2025, EGU25-12319, https://doi.org/10.5194/egusphere-egu25-12319, 2025.

EGU25-12728 | ECS | Orals | CL2.4

Evaluation of high-resolution imagery for monitoring the flowering of holm oak trees 

Ana Calbet, Mª Pat Gonzalez-Dugo, M. Dolores Carbonero, Alma Mª García-Moreno, María J. Muñoz-Gómez, and Ana Andreu

The Mediterranean oak savanna is Europe's most extensive agroforestry system, with significant economic, social, and ecological relevance. Climate models indicate that the Mediterranean region is particularly vulnerable to the impacts of global warming, which include increased frequency and severity of droughts. Consequently, there is a pressing need for conservation measures to prevent the degradation of this ecosystem, reduce uncertainty about production, and ensure its sustainable development. One of the most valuable resources of this system is the acorn of holm oaks, which significantly contributes to the quality of extensive livestock products. The intensity of oak flowering is a key factor limiting maximum acorn production, and it is usually monitored by visual sampling in the field, a costly and time-consuming method. To address this challenge, this study aims to evaluate the potential of remote sensors onboard UAVs (unmanned aerial vehicles) and high-resolution satellite sensors for monitoring the flowering of holm oak trees. This approach aims to scale up the monitoring effort, simultaneously providing valuable information to many farmers.


Previous works have explored the use of digital cameras for monitoring phenology, particularly in combination with airborne data. Gómez-Giráldez et al. (2021) proposed an index designed to automatically quantify the male flowering intensity of holm oaks based on the closeness to pure yellow in RGB images captured by UAVs. This index showed sufficient accuracy in differentiating between various flowering intensity levels and providing intensity maps. However, the index requires further validation before it can be applied on a larger scale. 


This study extends the validation of the proposed index using UAV data and high-resolution satellite imagery. It was conducted on six plots located in southern Spain. During 2022 and 2024, 11 images were taken over the three previously studied plots and three additional plots to enhance the validation. The results indicated that trees with lower flowering intensity were concentrated in areas with higher yellow distances, which confirmed previous results. However, due to the high phenological variability among individuals, we observed the importance of synchronizing the image acquisition date with the peak flowering period. Two high-quality orthoimages with a resolution of 1.5 m were acquired from the SPOT 6 satellite in 2024 to extend the methodology to larger areas and provide intensity maps. 


The expanded evaluation and visual verification showed promising results. The index, which can be derived using just an RGB image, shows potential for future applications related to phenology and productivity. Furthermore, developing an automated tool for this task would be beneficial in covering large areas and improving the representativeness of the estimates.

How to cite: Calbet, A., Gonzalez-Dugo, M. P., Carbonero, M. D., García-Moreno, A. M., Muñoz-Gómez, M. J., and Andreu, A.: Evaluation of high-resolution imagery for monitoring the flowering of holm oak trees, EGU General Assembly 2025, Vienna, Austria, 27 Apr–2 May 2025, EGU25-12728, https://doi.org/10.5194/egusphere-egu25-12728, 2025.

In the Piedmont region, located in northwestern Italy, meteorological data are available from two regional databases: the stations belonging to the agrometeorological network (RAM) and those belonging to the regional meteorological service (ARPA). The former are located in areas of agricultural interest, and the latter everywhere. By combining the two series, and adopting interpolation procedures for missing or unmeasured data, it was possible to reconstruct a complete database of hourly observations in the period 2004-2024 relating to the following quantities: temperature, humidity and pressure at the screen level, precipitation, solar radiation, and wind speed in about fifty stations located in the most renowned wine-growing areas. These data were integrated with the soil texture values ​​available in the SoilGrids database, which is a system for digital soil mapping based on a global compilation of soil profile data and environmental layers. Although the period does not have the necessary temporal dimension (30 years) to be considered strictly climatic, its length is sufficient to be able to make some preliminary considerations in this sense. Using the above mentioned data, it was possible to perform twenty-year simulations on each station using the land surface model UTOPIA (University of TOrino land surface Process Interaction model in Atmosphere), in order to obtain the energy and mass fluxes in the vegetation layer, and the subsoil temperatures and humidity in the root layer. In turn, the inputs and outputs of the previous simulations were used to perform further simulations with the crop growth model IVINE (Italian Vineyard Integrated Numerical model for Estimating physiological values), in order to obtain the trend of the main pheno-physiological parameters for each station in the twenty-year period considered. During the presentation, the evolution over the period of some variables relevant to vineyard cultivation practices will be shown, such as some components of the energy and hydrological balances (such as heat fluxes and evaporation), temperatures and humidity of the subsoil, as well as the main phenological phases and some physiological values ​​(sugar content, mass, yield, ...) in a selection of stations showing the most significant results.

How to cite: Cassardo, C. and Andreoli, V.: Behavior of pheno-physiological parameters and surface-layer variables on vineyard environments in Piedmont (Italy) using numerical models, EGU General Assembly 2025, Vienna, Austria, 27 Apr–2 May 2025, EGU25-13031, https://doi.org/10.5194/egusphere-egu25-13031, 2025.

Vegetation spring phenology in arid mountain regions is undergoing profound changes as a result of recent climate anomalies. While shifts in the timing of growth onset have been widely attributed to temperature and precipitation, interacting effects of these two climate variables on phenology have not been explored. To better understand whether an interaction between temperature and precipitation may be present, and how it may affect phenology, we first determined the influence of preseason temperature and precipitation on the starting date of vegetation growing season (SOS), and then investigated the spatial pattern of climatic sensitivity of SOS and its relation to preseason temperature/precipitation. We used satellite-derived estimates of SOS for the Qilian Mountains (QLMs) in northwestern China. Our results revealed a significant interaction between temperature and precipitation, contributing up to 30% of total variability in predicted ecosystem-level SOS. This interacting effect was likely achieved through the influence on climatic sensitivity of SOS; we found a close relationship between temperature sensitivity and preseason cumulative precipitation, and a significant association between precipitation sensitivity and preseason temperatures. Spatially, SOS was more sensitive to variability in preseason temperature in wetter than in dryer areas; likewise, a spatial increase in thermal accumulation often corresponded to an enhancement in precipitation sensitivity of SOS. These findings highlight the importance of interacting effects of climatic variables in model projections of future spring phenology, and indicate that unexpected shifts in vegetation phenology in response to climatic extremes may occur under the influence of strong interactions of climatic factors.

How to cite: He, Z.: Interacting effects of temperature and precipitation on climatic sensitivity ofspring vegetation green-up in arid mountains of China, EGU General Assembly 2025, Vienna, Austria, 27 Apr–2 May 2025, EGU25-14181, https://doi.org/10.5194/egusphere-egu25-14181, 2025.

Climate change has caused asynchronous phenological shifts between most plants and their pollinators, resulting in an earlier or later appearance of peak flowering relative to peak pollinator abundance. The fitness impact of these two mismatch patterns may not be simply equivalent, but the information has so far been limited. To explore how differently plant fitness responds to the distinct mismatch patterns, we conducted a seed-setting comparative study at the individual level in an alpine grassland community in the Qilian Mountains of China. By monitoring flowering abundance and insect visits, we measured the phenological matching relationship between plants and their key pollinators, and evaluated the impact of mismatches on plant productivity. We found that the pattern of “pollinator peaks earlier” accounted for a relatively high proportion in the natural community, with a significantly stronger fitness impact on plants than that of the “flower peaks earlier” pattern. The asymmetry in the fitness impacts between phenological mismatch patterns is related to the length of flowering period. Specially, the shorter the flowering duration, the greater the difference in influence between the two patterns. Our results suggest that plants with shorter flowering periods may be confronted with more severe pollination limitations if climate warming cause insects to forage further ahead. Therefore, the asymmetric effects of phenological mismatch patterns should be considered in phenological models to improve the predictive performance of plant responses to climate change.

How to cite: Du, J.: Pollinator peaking earlier than flowering is more detrimental to plant fecundity, EGU General Assembly 2025, Vienna, Austria, 27 Apr–2 May 2025, EGU25-14304, https://doi.org/10.5194/egusphere-egu25-14304, 2025.

EGU25-16191 | ECS | Posters on site | CL2.4

Northern Phenology Under Climate Warming: Evaluating TRENDY Models Against Remote Sensing Data with the Plant Phenology Index 

Hanna Marsh, Hongxiao Jin, Zheng Duan, and Wenxin Zhang

Phenology, encompassing the timing of the start, end, and duration of the growing season, is influenced by climate warming in northern regions. Altered phenological patterns carry significant implications for the global carbon cycle by disrupting the seasonal balance between gross primary productivity (GPP) and ecosystem respiration and complicating vegetation reproductive cycles. However, many current Earth system models, including those used in the “Trends and drivers of the regional scale terrestrial sources and sinks of carbon dioxide” (TRENDY) project, may inadequately capture recent phenological trends in northern ecosystems (Sitch et al., 2024). In this study, we aim to present a comprehensive analysis of phenology patterns across northern latitudes (>45°N) over the past two decades, using outputs from twelve state-of-the-art vegetation models included in the TRENDY project. These outputs, along with the TRENDY model ensemble average, are intercompared with a remote sensing-based phenology dataset derived using the Plant Phenology Index (PPI) and MODIS data. Compared with the in-situ measurements, the PPI has demonstrated improved accuracy in capturing northern phenology, particularly for boreal evergreen forests, by reducing the confounding effects of snowmelt and soil background signals (Jin et al., 2017). Furthermore, the PPI has proven effective in estimating large-scale GPP across diverse northern ecosystems, providing a robust benchmark for evaluating the performance of vegetation models (Marsh et al., 2024). We further examine the primary climatic drivers of phenological shifts (air temperature, precipitation and radiation) and assess the extent to which TRENDY models capture these drivers and the associated phenological responses to climate warming. Our findings highlight the current gap between model projections and observed phenology, offering insights into the limitations of current carbon cycle models in representing northern ecosystem dynamics. Our study contributes to advancing our understanding of the roles of northern ecosystems in the global carbon cycle.

References

Jin, H., Jönsson, A. M., Bolmgren, K., Langvall, O., & Eklundh, L. (2017). Disentangling remotely-sensed plant phenology and snow seasonality at northern Europe using MODIS and the plant phenology index. Remote Sensing of Environment198, 203-212.

Marsh, H., Jin, H., Duan, Z., Holst, J., Eklundh, L., & Zhang, W. (2025). Plant Phenology Index leveraging over conventional vegetation indices to establish a new remote sensing benchmark of GPP for northern ecosystems. International Journal of Applied Earth Observation and Geoinformation136, 104289.

Sitch, S., O’sullivan, M., Robertson, E., Friedlingstein, P., Albergel, C., Anthoni, P., ... & Zaehle, S. (2024). Trends and drivers of terrestrial sources and sinks of carbon dioxide: An overview of the TRENDY project. Global Biogeochemical Cycles38(7), e2024GB008102.

How to cite: Marsh, H., Jin, H., Duan, Z., and Zhang, W.: Northern Phenology Under Climate Warming: Evaluating TRENDY Models Against Remote Sensing Data with the Plant Phenology Index, EGU General Assembly 2025, Vienna, Austria, 27 Apr–2 May 2025, EGU25-16191, https://doi.org/10.5194/egusphere-egu25-16191, 2025.

EGU25-16628 | Orals | CL2.4

Plant macrophenological dynamics - variations in plant group behaviour revealed by citizen science data 

Karin Mora, Michael Rzanny, Jana Wäldchen, Hannes Feilhauer, Claudia Guimarães-Steinicke, Teja Kattenborn, Guido Kraemer, Patrick Mäder, Daria Svidzinska, Sebastian Wieneke, Sophie Wolf, and Miguel D. Mahecha

Phenological changes are key indicators of climate change. While most studies focus on individual species, plant macrophenology examines large-scale patterns and processes in the timing of plant life cycle events, such as flowering, across extensive spatial and temporal scales. Traditional methods often struggle to capture the complexity of these patterns. To address this, we developed a pioneering methodological approach using nonlinear dimension reduction [1], which effectively extracts spatio-temporal patterns from large and diverse phenological datasets.

Our approach reveals ecological gradients that capture underlying structures and relationships missed by linear methods [1,2]. A primary objective is to quantify synchronised behaviour across thousands of plant species, offering insights into the collective responses of plant communities to climate variability and change. By identifying and analysing synchronisation patterns, we aim to detect shifts in plant phenology and understand their broader ecological impacts

We demonstrate the versatility of our approach by applying it to datasets collected by citizen scientists using mobile applications such as Flora Incognita [3], a plant identification app. Additionally, we explore phenological changes across annual cycles and propose linking these findings to large-scale measurements such as eddy covariance and satellite data.

Incorporating citizen science datasets enhances the resolution and accuracy of our analyses, enabling robust conclusions about the impact of climate variability on plant phenology. This framework advances plant macrophenology, providing researchers with practical tools to quantify and monitor climate change effects on plant life cycles.

[1] Mora et al. (2024) Methods Ecol Evol, http://doi.org/10.1111/2041-210X.14365
[2] Mahecha et al. (2021) Ecography, 44: 1131-1142 https://doi.org/10.1111/ecog.05492
[3] Mäder et al. (2021) Methods Ecol Evol, 12: 1335-1342 https://doi.org/10.1111/2041-210X.13611

How to cite: Mora, K., Rzanny, M., Wäldchen, J., Feilhauer, H., Guimarães-Steinicke, C., Kattenborn, T., Kraemer, G., Mäder, P., Svidzinska, D., Wieneke, S., Wolf, S., and Mahecha, M. D.: Plant macrophenological dynamics - variations in plant group behaviour revealed by citizen science data, EGU General Assembly 2025, Vienna, Austria, 27 Apr–2 May 2025, EGU25-16628, https://doi.org/10.5194/egusphere-egu25-16628, 2025.

EGU25-16936 | Posters on site | CL2.4

Predicting Climatic Niche Shifts and Future Range Dynamics of Antarctic Rock-Dwelling Lichens Under Climate Change Scenarios 

Anna Götz, Mikhail Andreev, Lea Maislinger, Leo Sancho, Wolfgang Trutschnig, and Ulrike Ruprecht

Saxicolous lecideoid lichens form a major part of the existing terrestrial vegetation in Antarctica. Lichens are formed by an association between a fungal (mycobiont) and a photosynthesizing (photobiont) symbiont. Adapted to extreme habitats, their distribution is primarily determined by macroclimatic conditions, with climate change presenting a significant challenge to these specialized organisms. In our study we assessed the current climatic niches of 9 circumantarctic mycobiont species and their associated photobiont OTUs and predicted the niche shifts of this species under two contrasting climate forcing scenarios (RCP2.6 and RCP8.5).

Our findings do not indicate a distinct climatic differentiation between the current niches of the symbiont pairs. However, the changes in potential niche areas suggest a general trend of niche expansion for all species under both climate scenarios (RCP2.6 andRCP8.5). For each species, the projected area gain is predicted to exceed the corresponding area losses due to climate warming. The niche expansion is primarily driven by the shift of niches inland, as new areas become suitable. While newly exposed rock surface due to snowmelt may contribute to the niche expansion for specific species on the Antarctic Peninsula, the overall impact on the continental Antarctic is insignificant. Our analysis indicates a general increase of niche overlap between species across all regions, except in the maritime Antarctic, where the complete loss of species niches was predicted. A broader pattern emerges in which regions with higher probable species richness are expected to shift inland, while coastal areas are likely to experience a decline in species numbers.

How to cite: Götz, A., Andreev, M., Maislinger, L., Sancho, L., Trutschnig, W., and Ruprecht, U.: Predicting Climatic Niche Shifts and Future Range Dynamics of Antarctic Rock-Dwelling Lichens Under Climate Change Scenarios, EGU General Assembly 2025, Vienna, Austria, 27 Apr–2 May 2025, EGU25-16936, https://doi.org/10.5194/egusphere-egu25-16936, 2025.

EGU25-17138 | ECS | Orals | CL2.4

Seasonal warming and global land surface phenology 

Jelle Lever, Luis Gilarranz, Petra D'Odorico, Achilleas Psomas, Christian Ginzler, Stefan Simis, Alexander Damm, Arthur Gessler, Daniel Odermatt, and Yann Vitasse

Emerging evidence suggests that temperature increases due to climate change not only differ strongly between regions but also across seasons. As a rule of thumb, one could argue that colder seasons (e.g., winter) tend to warm up faster than warmer seasons, although there are notable exceptions to this rule (e.g., due to changes in the polar vortex). The implications of such seasonal differences in warming trends for plant phenology, i.e., the timing of key events during the plant seasonal cycle, however remain poorly understood. A gap in knowledge that arises, in part, because we lack a global overview of the period(s) of the year during which changing temperatures impact on the phenological cycle of plants the most.

Here, we provide a global analysis of the interrelationships between seasonal temperature changes and global land surface phenology using satellite data from the period 2001-2019. More specifically, we determined the annual period of highest correlation between temperature fluctuations and the onset of different phenological stages within a 100km radius around 10.000 point locations. We found that, across most of the Northern Hemisphere’s mid and high latitudes, a wide range of these stages, i.e., from the onset of ‘greenup’ to ‘greendown’, correlate strongly with temperature fluctuations during roughly the same period of the year, i.e., up until a few weeks before or after the onset of greenup. We found that warming rates during this period were roughly 1.5-2.5 times faster than regional mean annual temperature increases, which, in turn, were roughly 1.5-2.0 times faster than the increase in global mean annual temperature (which includes air above the oceans).

When assessing the impact of global mean annual temperature changes on global land surface phenology, it is thus crucial to consider seasonal differences in warming. These differences are likely to affect not only plant phenology but also many other key processes related to plant growth and development.

How to cite: Lever, J., Gilarranz, L., D'Odorico, P., Psomas, A., Ginzler, C., Simis, S., Damm, A., Gessler, A., Odermatt, D., and Vitasse, Y.: Seasonal warming and global land surface phenology, EGU General Assembly 2025, Vienna, Austria, 27 Apr–2 May 2025, EGU25-17138, https://doi.org/10.5194/egusphere-egu25-17138, 2025.

EGU25-17199 | ECS | Orals | CL2.4

Accounting for overwintering life-histories in an online pest risk assessment tool 

Paul Brett, Tamara Hochstrasser, Klara Finkele, Padraig Flattery, Barry Coonan, Catriona Duffy, Deborah Hemming, Neil Kaye, Conor McGee, and Jon Yearsley

The OPRAM (Online Pest Risk Analysis Model) project is developing an open source web application, which will be used in guiding risk assessment and surveillance of high priority plant pests across Ireland. Current models predict the timing of adult emergence during the year using an accumulative growing degree day model, but overwintering is not typically included (for example : https://www.usanpn.org/vis-tool). The inclusion of overwintering is particularly important when predicting a plant pest’s end-of-year phenology and for making predictions across multiple years.

We developed template models for the three main overwintering life-histories for insects. Quiescence implies that an insect may be present all year round if temperatures are high enough;e.g.  Spodoptera frugiperda may not reach the required threshold.. In addition, the inclusion of the fractional number of generations per year is especially important as it indicates regions which maybe close to completing a generation based on the threshold rather than presenting a null value.

The inclusion of obligate and facultative diapause imply the season will end earlier due to the decrease in photoperiod or because of the combined effects of photoperiod and temperature for species like Leptinotarsa decemlineata and Oulema melanopus. This would impact the overall risk assessment depending on how many generations of a species may appear during the year and the mitigative measures undertaken. For instance, Ips typographus, has greater damage if a second generation were to emerge. If diapause were not ncluded in these models then this variation in year-to-year seasonal length may not be captured. 

We give examples for six template species: Agrilus anxius, Spodoptera frugiperda, Leptinotarsa decemlineata, Oulema melanopus, Ips typographus and Halyomorpha halys. We used mean temperature and photoperiod from the Republic of Ireland from 1961 until present. Future climate scenarios were incorporated using projections across three RCP scenarios (RCP 26, 45 & 85) across two future periods : 2021 – 2050 and 2041 – 2070. 

Future climate scenarios indicate that more generations will occur; where for instance, Agrilus anxius would increase from three generations to four generations as its season is solely temperature based. Whereas, other such as Leptinotarsa decemlineata that undergo obligative diapause may not have an increase in generations as a decrease in photoperiod serves as a limiting factor for their length of season. While for Halyomorpha halys, no generations would appear despite the warmer conditions. 

The goal of this project is to have an open access web application that could then be developed further in the future. This readily could serve as a template for initiatives in other countries. This online tool will provide the decision support to allow actions to be taken in the event of high risk of the modelled pest and can be expanded to if a new pests that may emerge over time in the Republic of Ireland. 


How to cite: Brett, P., Hochstrasser, T., Finkele, K., Flattery, P., Coonan, B., Duffy, C., Hemming, D., Kaye, N., McGee, C., and Yearsley, J.: Accounting for overwintering life-histories in an online pest risk assessment tool, EGU General Assembly 2025, Vienna, Austria, 27 Apr–2 May 2025, EGU25-17199, https://doi.org/10.5194/egusphere-egu25-17199, 2025.

EGU25-18180 | ECS | Posters on site | CL2.4

Exploring the relationships between ground observations and remotely sensed hazelnut spring phenology 

Mara Di Giulio, Sofia Bajocco, Mohamed Sallah Abdullah, and Simone Bregaglio

Crop phenology is very important in regular crop monitoring. Generally, phenology is monitored through field observation surveys or satellite data. The relationships between ground observations and remotely sensed derived phenological data can enable near-real-time monitoring over large areas, which has never been attempted on hazelnuts. In this study, we extracted phenological metrics derived from MODIS Enhanced Vegetation Index (EVI) in hazelnut production regions and compared them with the spring ground phenological data (BBCH scale) from orchards located in the same area of Turkey over the period from 2019 to 2022. We observed a specific temporal dynamic between remote sensing phenometrics and ground observations. The metrics Greenup, Upturning Date, and Threshold 20% metrics corresponded to the early of EVI growth and were synchronous with the female flowering of hazelnut and ending before bud break. The metrics Threshold 50% and Start of season were associated with the steepest portion of the EVI curve, i.e., canopy greening and thickening, and occurred between ovaries enlargement and leaves unfolding. The metrics Peak of Season, Stabilization Date, and Maturity corresponded to the end of spring vegetative growth. The main outcomes are that (i) female flowering occurred before 20% of vegetation development (BBCH 64P occurred about one month before Threshold 20%), (ii) phenometrics from satellite remote sensing (i.e., Upturning Date and Threshold 20%) well-reflected leaf emergence (rs = 0.30 and rs = 0.32, respectively; p < 0.05) and unfolding (rs = 0.35 and rs = 0.39, respectively; p < 0.05), and (iii) cluster appearance temporally aligned with the peak of the EVI curve (Stabilization Date and BBCH 71P differed by around 4 days). Our method is transferable to operational phenology monitoring, and future applications will consider the senescence season and the effect of environmental variability on the comprehension of vegetation dynamics.

How to cite: Di Giulio, M., Bajocco, S., Abdullah, M. S., and Bregaglio, S.: Exploring the relationships between ground observations and remotely sensed hazelnut spring phenology, EGU General Assembly 2025, Vienna, Austria, 27 Apr–2 May 2025, EGU25-18180, https://doi.org/10.5194/egusphere-egu25-18180, 2025.

EGU25-970 | ECS | PICO | CL4.14

Studies to Control Resuspension of Dust from Playgrounds 

Umangi Mehta, V.S. Vamsi Botlaguduru, Manaswita Bose, and Virendra Sethi

Dust resuspension from playgrounds can be a major contributor to urban air pollution. To address this issue, mitigation strategies such as the use of windscreens, water sprinkling, and dust suppressants have been reported in literature (Dong et al., 2007; Jeon et al., 2021; Taylor et al., 2015). However, the effectiveness of these measures is dependent on the soil type, wind patterns affected by green cover and surrounding. This study aims to provide insights into the effectiveness of different dust control strategies and offer potential solutions for widespread application in urban playgrounds. Laboratory-scale experiments were conducted to evaluate the influence of particle size distribution, wind speed and moisture content on dust resuspension from three different soil types. Numerical simulations will be performed to simulate the wind patterns that influence dust resuspension for a selected playground in Mumbai.

How to cite: Mehta, U., Botlaguduru, V. S. V., Bose, M., and Sethi, V.: Studies to Control Resuspension of Dust from Playgrounds, EGU General Assembly 2025, Vienna, Austria, 27 Apr–2 May 2025, EGU25-970, https://doi.org/10.5194/egusphere-egu25-970, 2025.

EGU25-1057 | ECS | PICO | CL4.14

Dust Aerosol and Water Vapor Radiative Effects: A Multi-Campaign Analysis of ASKOS and ORCESTRA/PERCUSION Over the Atlantic 

Dimitra Kouklaki, Alexandra Tsekeri, Anna Gialitaki, Kyriakoula Papachristopoulou, Panagiotis-Ioannis Raptis, Bernhard Mayer, Claudia Emde, Silke Groß, Eleni Marinou, Vassilis Amiridis, and Stelios Kazadzis

Aerosols significantly attenuate solar radiation and influence atmospheric thermodynamic stability, particularly over regions like the Atlantic, impacting Earth's energy budget and climate through radiative heating or cooling. Quantifying these effects is challenging due to aerosol diversity and complexity. For desert dust particles, the difficulty lies in defying their optical properties and accurately monitoring their extensive distribution.

This study aims to assess the radiative effects of dust aerosols and water vapor (WV), and their impact on atmospheric heating rates, by adopting non-spherical particle shapes and their intrinsic microphysical and optical properties during severe dust events. To achieve this, ground-based, airborne, and satellite observations are employed along with Radiative Transfer (RT) modeling, and more precisely the libRadtran RT package (Mayer and Kylling, 2005; Emde et al., 2016). The study utilizes data from two experimental campaigns – ASKOS and ORCESTRA/PERCUSION – both conducted in the Atlantic region during peak trans-Atlantic dust transport periods, in summers of 2022 and 2024.

In the frame of the ASKOS ESA Joint Aeolus Tropical Atlantic Campaign (JATAC), we utilized ground-based remote sensing and airborne in-situ observations, including solar radiation and airborne meteorological profiles. Microphysical properties from UAVs, MOPSMAP (Gasteiger and Wiegner, 2018) and TAMUdust2020 (Saito et al., 2021) scattering databases were used to derive dust optical properties considering a mixture of spheroidal and irregular-hexahedra shapes. Multi-wavelength lidar measurements contributed to the validation of the optical properties and dust vertical distribution. RT simulations incorporated WV concentration, to investigate dust-WV-solar radiation interactions under clear sky conditions. The simulated broadband shortwave radiation was, finally, compared with the ground-based solar radiation measurements.

A second case study was performed, leveraging ORCESTRA/PERCUSION campaign (https://orcestra-campaign.org/percusion.html) synergistic airborne measurements. This campaign incorporated a comprehensive suite of airborne instruments, providing, amongst others, radiation measurements, meteorological profiles, and extensive lidar measurements. Radiation at the top of the atmosphere (TOA) from the EarthCARE ESA mission supported comprehensive closure studies at TOA and at aircraft level.

Acknowledgements

This research was financially supported by the PANGEA4CalVal project (Grant Agreement 101079201) funded by the European Union, the CERTAINTY project (Grant Agreement 101137680) funded by Horizon Europe program and the AIRSENSE project which is part of Atmosphere Science Cluster of ESA’s EO Science for Society programme. DK, ΑΤ, ΚP, PR and SK would like to acknowledge COST Action HARMONIA (International network for harmonization of atmospheric aerosol retrievals from ground-based photometers), CA21119, supported by COST (European Cooperation in Science and Technology).

References

Mayer, B., Kylling, A.: Technical note: The libRadtran software package for radiative transfer calculations - description and examples of use. Atmos. Chem. Phys., 5(7), 1855–1877, 2005.

Emde, C., et al.: The libRadtran software package for radiative transfer calculations (version 2.0.1), Geoscientific Model Development, 9(5), 1647–1672, 2016.

Gasteiger, J. and Wiegner, M.: MOPSMAP v1.0: a versatile tool for the modeling of aerosol optical properties, Geosci. Model Dev., 11, 2739–2762, https://doi.org/10.5194/gmd-11-2739-2018, 2018.

Saito, M., et al.: A comprehensive database of the optical properties of irregular aerosol particles for radiative transfer simulations, J. Atmos. Sci., in press, https://doi.org/10.1175/JAS-D-20-0338.1, 2021.


How to cite: Kouklaki, D., Tsekeri, A., Gialitaki, A., Papachristopoulou, K., Raptis, P.-I., Mayer, B., Emde, C., Groß, S., Marinou, E., Amiridis, V., and Kazadzis, S.: Dust Aerosol and Water Vapor Radiative Effects: A Multi-Campaign Analysis of ASKOS and ORCESTRA/PERCUSION Over the Atlantic, EGU General Assembly 2025, Vienna, Austria, 27 Apr–2 May 2025, EGU25-1057, https://doi.org/10.5194/egusphere-egu25-1057, 2025.

EGU25-1247 | ECS | PICO | CL4.14

Vertical Profiling of Dust Layers in the Eastern Mediterranean: Sources, Dynamics, and Impacts 

Irina Rogozovsky, Albert Ansmann, Kevin Ohneiser, Holger Baars, Ronny Engelmann, Julian Hofer, and Alexandra Chudnovsky

Dust pollution is a critical environmental challenge with far-reaching impacts on climate and health. Despite its significance, no unified methodology exists for identifying dust-contaminated days, leading to inconsistencies across disciplines. The most widely used approaches often rely on ground-based measurements to classify dust events. However, these methods may overlook lofted dust layers. We used a ground-based lidar system to detect and classify dust layers and compared the results to widely adopted methods. Surprisingly, at least 50% of dust-contaminated days identified by lidar were missed by traditional surface-based methods. This gap underscores the critical role of vertical profiling in accurately capturing dust presence, which is vital for improving health impact studies and climate models. Our results highlight the challenges of distinguishing between anthropogenic and natural dust events using only ground-based measurements, as many measurement approaches classify mixed aerosols as dust, potentially leading to biased exposure estimates. In addition, vertical profiling and layering data revealed distinct pollution configurations in the Eastern Mediterranean (EM) region, ranging from purely anthropogenic layers to complex mixtures of marine aerosols, anthropogenic pollution, and desert dust. Results reveal that dust layers in the EM often extend vertically up to 10 km, with depths reaching 6.3 km. We used air masses back trajectory analysis to identify the source of particles for each layering type, and found 2 distinct dust sources, North African mostly pure dust and Middle Eastern dust with anthropogenic component. Finally, we analysed the uncertainties of the conventional satellite-derived AOD measurements. It was found the presence of lofted dust layers or mixed aerosols challenge the retrieval accuracy, gaining crucial insights into the limitations of satellite-derived AOD in representing complex atmospheric environments, especially in dust dominated regions. The holistic approach applied in our study is essential for understanding the dynamic interplay between pollution sources and atmospheric interactions, particularly in regions like the EM, which serve as a crossroads for diverse aerosol types.

How to cite: Rogozovsky, I., Ansmann, A., Ohneiser, K., Baars, H., Engelmann, R., Hofer, J., and Chudnovsky, A.: Vertical Profiling of Dust Layers in the Eastern Mediterranean: Sources, Dynamics, and Impacts, EGU General Assembly 2025, Vienna, Austria, 27 Apr–2 May 2025, EGU25-1247, https://doi.org/10.5194/egusphere-egu25-1247, 2025.

EGU25-2589 | PICO | CL4.14

Can we infer a mineralogical signature of dust hot spots using EMIT hyperspectral data? 

Paul Ginoux, Philip G. Brodrick, Maria Gonçalves Ageitos, Greg S. Okin, Carlos Pérez Garcia-Pando, David R. Thompson, and Robert O. Green

With more than 20 years of MODIS twice daily global measurements, dust hot spots have been
located using the extrema of frequency of occurrence of Dust Optical Depth (DOD) derived from
MODIS Deep Blue aerosol products. We know that these hot spots have a geomorphological signature (cf. Prospero et al., 2002; Baddock et al., 2016) but does it also imply that they have a mineralogical signature? This is important to know as mineralogy controls the sign and amplitude of dust interactions with the Earth's climate systems, in particular in terms of radiative forcing, ice cloud formation, rain water acidity, snow albedo, ocean bio-geochemistry. By overlaying over the dust hot spots, the soil mineralogy retrieved from the hyperspectral instrument NASA-JPL Earth Surface Mineral Dust Source Investigation (EMIT) over almost 3 years, our presentation will show that mineralogical content of dust hot spots is region specific.

How to cite: Ginoux, P., Brodrick, P. G., Gonçalves Ageitos, M., Okin, G. S., Pérez Garcia-Pando, C., Thompson, D. R., and Green, R. O.: Can we infer a mineralogical signature of dust hot spots using EMIT hyperspectral data?, EGU General Assembly 2025, Vienna, Austria, 27 Apr–2 May 2025, EGU25-2589, https://doi.org/10.5194/egusphere-egu25-2589, 2025.

EGU25-3373 | ECS | PICO | CL4.14

Analysis of PM2.5 Impacts from Agricultural Vinyl Waste Treatment Processes and Uncollected Waste 

Hyunjun Park, Minseon Park, Namhoon Lee, and Hui-Young Yun

The treatment of agricultural plastic waste is a critical source of fine dust (PM2.5) emissions, contributing significantly to air pollution. Uncollected plastic waste, predominantly subjected to open-air incineration, exacerbates this issue, underscoring the need for comprehensive management strategies.

This study aims to predict PM2.5 emissions from agricultural plastic waste treatment processes and quantify the contribution of uncollected plastic waste to air pollution, providing a novel analysis of the relative environmental impact of these two waste management pathways. Using the CAPSS model and process-specific emission factors, PM2.5 emissions from shredding, crushing, and sorting processes were estimated based on the annual average agricultural plastic waste generation of 314,000 tons from 2016 to 2021.

Predicted PM2.5 emissions per ton of treated waste were 0.00012 kg, 0.00075 kg, and 0.00043 kg for shredding, crushing, and sorting processes, respectively. By 2030, cumulative emissions from these processes are expected to reach 25.09 kg, 156.84 kg, and 89.92 kg. In contrast, uncollected vinyl waste subjected to open-air incineration is estimated to generate approximately 725,779.45 kg of PM2.5 by 2030, a figure nearly 2,600 times higher than emissions from treated waste.

The findings highlight the disproportionate environmental impact of uncollected vinyl waste compared to treated waste. This study underscores the urgency of improving collection rates and optimizing treatment processes for agricultural vinyl waste. Policy recommendations include expanding treatment facilities, fostering private-sector recycling initiatives, and enforcing stricter regulations on open-air incineration to mitigate fine dust emissions effectively. Future research should explore the comprehensive evaluation of waste management systems and the development of advanced technologies for reducing PM2.5 emissions.

Acknowledgments

This research was supported by Particulate Matter Management Specialized Graduate Program through the Korea Environmental Industry & Technology Institute(KEITI) funded by the Ministry of Environment(MOE)

How to cite: Park, H., Park, M., Lee, N., and Yun, H.-Y.: Analysis of PM2.5 Impacts from Agricultural Vinyl Waste Treatment Processes and Uncollected Waste, EGU General Assembly 2025, Vienna, Austria, 27 Apr–2 May 2025, EGU25-3373, https://doi.org/10.5194/egusphere-egu25-3373, 2025.

EGU25-4448 | ECS | PICO | CL4.14

Detection of seasonal-specific potential source areas of mineral dust on Crete (Greece) based on isotope measurements and mineralogical investigations 

Simon Bitzan, Cécile L. Blanchet, Georgios E. Christidis, Kerstin Schepanski, and Fabian Kirsten

The Sahara is the Earth’s largest dust source, producing dust plumes that impact the whole planet. The eastern Mediterranean is one of the areas significantly affected by Saharan dust and its deposition.
The geochemical and mineralogical composition of the deposited mineral dust particles depend on their source area and on spatiotemporal variability of the source areas.
Although being of great importance for local soil formation and soil distribution, the impact of changes in dust provenance has not been extensively studied in the eastern Mediterranean. Thus, further research is required to characterize dust deposition fluxes, transport trajectories and the geochemical and mineralogical composition of deposited mineral dust.
Modelled trajectories of dust events provide good insights on aeolian transport routes, but if larger distances are covered over land, the exact source area of the deposited material cannot be traced with certainty. The question also arises as to whether the composition of the mineral dust deposited differs due to spatial sorting and thus its influence on the deposition area.
In order to gain insight into the dynamics of dust deposited on Crete, we present results from eight passive deposition traps (marble samplers) that were installed in western Crete at various sites around the Lefka Ori mountains. Monthly sampling was performed between March 2023 and June 2024, which provides us a unique temporal and spatial coverage.
Here we used a multi-proxy fingerprinting approach including Nd-Sr isotopic composition, mineralogy and grain-size distribution. The isotope analyses show a temporal shift in the potential source areas over the year, but no significant spatial differences. This spatial homogeneity in the isotopic signature of deposited dust suggests a minor influence of local inputs, which are characterized by distinct geological contexts, which is confirmed by the mineralogy. Samples with a coarser and well-sorted grain-size distribution likely track larger dust events, as a relatively larger proportion originates from the same source. The aim is to combine the results and thus to highlight and classify the intensity of influence of different source areas on the soil development of western Crete. In the long term, an analysis of back-tracking trajectories is to be carried out and combined with the results of the isotope analyses, which we expect to improve the informative value of the potential source areas.

How to cite: Bitzan, S., Blanchet, C. L., Christidis, G. E., Schepanski, K., and Kirsten, F.: Detection of seasonal-specific potential source areas of mineral dust on Crete (Greece) based on isotope measurements and mineralogical investigations, EGU General Assembly 2025, Vienna, Austria, 27 Apr–2 May 2025, EGU25-4448, https://doi.org/10.5194/egusphere-egu25-4448, 2025.

EGU25-4494 | PICO | CL4.14

Unraveling Late Quaternary Climate Dynamics: Insights from the Velika Vrbica Loess-Palaeosol Sequence, Wallachian Basin 

Zoran Perić, Cathal Ryan, Warren Thompson, Milica Radaković, Petar Krsmanović, Helena Alexanderson, and Slobodan Marković

The Velika Vrbica loess-palaeosol sequence (LPS) in northeastern Serbia, located at the westernmost boundary of the Wallachian Basin, provides a high-resolution terrestrial archive of palaeoenvironmental changes spanning Marine Isotope Stages (MIS) 3 to MIS 1. This study integrates optically stimulated luminescence (OSL) dating, magnetic susceptibility (χ), and mass accumulation rates (MAR) to reconstruct climatic and environmental dynamics over the last ~41,000 years. The OSL chronology reveals consistent loess deposition from ~41 ka to 3 ka, with peak accumulation rates during MIS 3 and late MIS 2. Notably, MARs are higher during the interstadial MIS 3 compared to the Last Glacial Maximum (MIS 2), challenging conventional models that associate intensified dust deposition solely with colder glacial phases. This pattern highlights the influence of regional factors such as sediment source proximity, wind dynamics, and variations in sediment trapping efficiency. The χ record highlights fluctuations in pedogenesis and aeolian activity, which broadly correspond to climatic oscillations captured in the NGRIP δ¹⁸O ice core record. These global cold periods align with intensified dust deposition, but substantial MAR values observed during warmer interglacial phases suggest that sedimentation processes in southeastern Europe were influenced by additional, localized drivers. The Velika Vrbica LPS captures detailed environmental responses to Dansgaard-Oeschger (D-O) events, marked by rapid warming and subsequent cooling phases. These responses reflect the sensitivity of southeastern Europe to abrupt climatic shifts and reveal the nuanced relationship between global climatic drivers and regional environmental processes. Notably, the sandy layer deposited between ~32 ka and ~15 ka reflects intensified palaeowind activity during the Last Glacial Maximum, further illustrating the interplay between climate and sedimentation dynamics. Comparison with other LPSs in southeastern Europe highlights the distinct depositional patterns of Velika Vrbica, with pronounced MAR peaks during MIS 3 and considerable variability during MIS 2. These findings diverge from the widely accepted model of loess formation, emphasizing the importance of site-specific factors and regional climatic influences. For example, while most models predict lower dust input during interglacial periods, the Velika Vrbica LPS records substantial dust deposition even during MIS 3 interstadials. This challenges established paradigms and underscores the complexity of loess formation processes in dynamic semi-arid environments. By integrating high-resolution geochronological data with sedimentological and palaeoclimatic analyses, this research provides critical insights into late Quaternary climate dynamics in southeastern Europe. The Velika Vrbica LPS not only enhances our understanding of the region’s environmental history but also contributes to refining global models of loess deposition and dust dynamics. These findings emphasize the need for further site-specific investigations to disentangle the interplay between global climate systems and local environmental processes, thereby advancing our understanding of past climatic variability and its implications for future environmental changes.

How to cite: Perić, Z., Ryan, C., Thompson, W., Radaković, M., Krsmanović, P., Alexanderson, H., and Marković, S.: Unraveling Late Quaternary Climate Dynamics: Insights from the Velika Vrbica Loess-Palaeosol Sequence, Wallachian Basin, EGU General Assembly 2025, Vienna, Austria, 27 Apr–2 May 2025, EGU25-4494, https://doi.org/10.5194/egusphere-egu25-4494, 2025.

EGU25-4612 | ECS | PICO | CL4.14

Westerly jet variations over East Asia since the Last Glacial Maximum: Evidence from Asian dust records in the Mariana Trench  

Yanning Wu, Yifeng Liu, Tao Wu, Chun-Feng Li, Wancang Zhao, Taoran Song, and Liyan Tian

The seasonal migration of the westerly jet (WJ) over East Asia is recognized as a substantial factor in the historical climate of the region, especially regarding spatial and temporal variability of regional rainfall and the dust cycle in the Northern Hemisphere. However, the evolution of East Asian WJ since the Last Glacial Maximum (LGM) remains debated. To enhance our understanding, we investigate the changes in Asian dust sources in sediments from the southern Mariana Trench utilizing trace elements and Sr-Nd isotopes.

According to the geochemical analyses, the eolian dust from the Taklimakan desert is the major dust source to the southern Mariana Trench during most of the LGM. Nevertheless, the Mongolian Gobi Desert became the dominant dust contributor during partial periods of the early LGM. This result can be attributed to changes in the timing of the seasonal WJ transition and the meridional distribution of the WJ. During the LGM, low boreal summer insolation kept the WJ axis south of the Tibetan Plateau throughout the year, which should be accompanied by broad meridional distribution of the WJ affecting mid-to-high latitudes. However, extensive Northern Hemisphere ice sheets prevented the occurrence of the WJ over mid-to-high latitudes. Therefore, the WJ mainly transported the Taklimakan dust. The smaller ice sheets in the early LGM than in the late LGM allowed the WJ to appear over the Mongolian Gobi Desert, favoring the local dust export.

During the mid-Holocene, the trench received a mixed contribution of the Taklimakan and the Mongolian Gobi dust. Strong boreal summer insolation during this period caused the WJ axis to frequently shift to a southwest-northeast orientation and an earlier seasonal WJ transition. This facilitated the transport of dust from both deserts. In the late Holocene, the Taklimakan desert became the dominant dust source, due to a reoriented WJ axis with a west-east orientation and a delayed seasonal transition driven by declining boreal summer insolation.

How to cite: Wu, Y., Liu, Y., Wu, T., Li, C.-F., Zhao, W., Song, T., and Tian, L.: Westerly jet variations over East Asia since the Last Glacial Maximum: Evidence from Asian dust records in the Mariana Trench , EGU General Assembly 2025, Vienna, Austria, 27 Apr–2 May 2025, EGU25-4612, https://doi.org/10.5194/egusphere-egu25-4612, 2025.

EGU25-4644 | ECS | PICO | CL4.14

Intermediate-mode mineral dust aerosols efficiently scatter solar radiation 

Chen Cui, Pengfei Tian, Binrui Wang, and Wenfang Wang

Dust aerosols emitted naturally into the atmosphere play a crucial role in the climate system by scattering and absorbing radiation, which may alter regional aerosol radiative forcing. Aerosol size distributions exhibit a widespread trimodal pattern globally, and the presence of this trimodal distribution affects the scattering properties of the aerosol population. Here, we identify an intermediate mode in the African dust aerosol size distribution, previously overlooked, located between the fine and coarse modes. In regions with high dust loads, dust particles undergo physical processes, including surface fragmentation due to external forces, generating fine fragments with a characteristic size of approximately 0.6 µm. These fragments exhibit strong scattering properties, with a scattering efficiency factor roughly five times that of the fine mode, making them significant contributors to regional cooling effects. However, in recent years, the concentration of the intermediate mode has been gradually decreasing due to regional economic development and desert management, impacting both regional and global environmental and climate effects. This study provides new insights into dust aerosol emissions and improves the parameterization of dust in global climate models. These findings are crucial for enhancing the accuracy of global climate simulations and better quantifying the impact of dust aerosols on the climate.

How to cite: Cui, C., Tian, P., Wang, B., and Wang, W.: Intermediate-mode mineral dust aerosols efficiently scatter solar radiation, EGU General Assembly 2025, Vienna, Austria, 27 Apr–2 May 2025, EGU25-4644, https://doi.org/10.5194/egusphere-egu25-4644, 2025.

EGU25-4775 | PICO | CL4.14

Paleoclimate informed simulations for constraining aerosol radiative effects 

Samuel Albani, Natalie M. Mahowald, Longlei Li, Douglas S. Hamilton, and Jasper F. Kok

Aerosol radiative effects are still one of the major sources of uncertainty in terms of a quantitative understanding of climate changes across time scales, despite many advances in the field. Yet, paleodata databases offer the opportunity to constrain to some extent past natural aerosol emissions, allowing to account for aerosol radiative effects in a more realistic way in simulations with Earth System Models, at least from the point of view of amounts and spatial distributions of different aerosol species.

Here we first present the results of simulations conducted with CESM1.0 using paleodust constrained emissions for different equilibrium climate states, then broaden our discussion on the importance of historical and paleoclimate aerosol radiative effects, considering the published literature. We estimated that preindustrial to present-day aerosol radiative effects are affected by emission uncertainties that are just as large as model spread uncertainties (2.8 W m−2). We advocate that more efforts are put into improving and expanding existing paleodata collections and that those available should be taken into account when assessing uncertainties related to aerosol radiative effects. In particular we propose a new intercomparison project (AERO-HISTMIP) that compares outcomes when using multiple emission pathways in CMIP historical simulations.  

How to cite: Albani, S., Mahowald, N. M., Li, L., Hamilton, D. S., and Kok, J. F.: Paleoclimate informed simulations for constraining aerosol radiative effects, EGU General Assembly 2025, Vienna, Austria, 27 Apr–2 May 2025, EGU25-4775, https://doi.org/10.5194/egusphere-egu25-4775, 2025.

EGU25-5652 | ECS | PICO | CL4.14

From Sahara Desert to Ukraine: an integrated study of mineral dust transport 

Yuliia Yukhymchuk, Gennadi Milinevsky, Vassyl Danylevsky, Philippe Goloub, Xuhui Gao, and Xuanyi Wei

In April 2024, the transport of mineral dust from the Sahara Desert was observed over Ukraine. This phenomenon, unusual for the region, resulted in reduced visibility, "red rain," degraded air quality, and altered atmospheric aerosol properties over Kyiv. To better understand the impact of this event, sun photometers and modeling efforts were used to analyze the changes in aerosol characteristics and the atmospheric influence of mineral dust transport. Observations from the AERONET Kyiv station indicated significant changes in aerosol characteristics. Specifically, there was an increase in aerosol optical depth (AOD) and coarse-mode AOD, while the Angstrom exponent (AE) and fine-mode AOD showed a decline. Cluster analysis of these parameters revealed temporal patterns and correlations between the observed changes. The size distribution analysis highlighted the dominant influence of coarse particles. Additionally, the single scattering albedo (SSA) and refractive index values were affected, reflecting the presence of mineral dust compared to typical conditions. The GEOS-Chem chemical transport model further indicated changes in mineral dust concentrations, suggesting its notable impact on Ukraine's territory. Additionally, the HYSPLIT model was utilized in this study to analyze backward trajectories of air masses, providing crucial information about their movement before reaching the territory of Ukraine and identifying their origins.

How to cite: Yukhymchuk, Y., Milinevsky, G., Danylevsky, V., Goloub, P., Gao, X., and Wei, X.: From Sahara Desert to Ukraine: an integrated study of mineral dust transport, EGU General Assembly 2025, Vienna, Austria, 27 Apr–2 May 2025, EGU25-5652, https://doi.org/10.5194/egusphere-egu25-5652, 2025.

EGU25-5908 | ECS | PICO | CL4.14

Towards Convection-Resolving Dust Emission Modelling 

Pascal Kunze, Matthias Faust, Kerstin Schepanski, and Ina Tegen

Dust emissions are closely associated with wind speed and are affected by a variety of meteorological drivers and factors that have effects across different spatial and temporal scales. Global or regional atmospheric dust models employing parameterized convection often encounter difficulties in accurately replicating observed dust emissions. Recent investigations by Garcia-Carreras et al. (2021) have demonstrated significant discrepancies when modeling Northern African dust emissions across various grid scales using either parametrized convection or resolved convection. In order to further clarify the influence of model resolution on dust emissions, an investigation was conducted employing surface winds from two different model studies: the coarse-resolution CMIP-6 model intercomparison study [Eyring et al. (2016)] with parameterized convection and the high-resolution ICON model  simulation that was part of the DYAMOND project [Stevens et al. (2019)], which was computed with explicit convection. Two different dust products were computed using the modelled surface winds: the Dust Uplift Potential (DUP) derived from wind data and an offline dust emission model based on Tegen et al. (2002), which incorporates soil and vegetation effects to simulate dust emission fluxes utilizing gridded surface wind fields. The dust emissions from the different models are evaluated across various source regions, including Northern Africa, the Arabian Peninsula, Central Asia, the Gobi Desert, and the Taklamakan Desert. Convective events such as haboobs particularly necessitate explicit modeling at convection-resolving resolution, which is e.g an important cause of dust emissions in the southern Sahara in northern hemisphere summer. Other local wind systems can be discerned by both high and low-resolution models, albeit at varying magnitudes. In the Gobi region, there is negligible impact of model resolution on dust emissions. These findings could inform further research on modeling dust emission and  transport by providing a basis for improved dust emission parameterizations in large-scale models.

How to cite: Kunze, P., Faust, M., Schepanski, K., and Tegen, I.: Towards Convection-Resolving Dust Emission Modelling, EGU General Assembly 2025, Vienna, Austria, 27 Apr–2 May 2025, EGU25-5908, https://doi.org/10.5194/egusphere-egu25-5908, 2025.

EGU25-6183 | ECS | PICO | CL4.14

Meteorological Drivers of East Asian dust activity in spring 2001-2022 

Feifei Mu and Stephanie Fiedler

East Asian dust storms from the Gobi and the Taklamakan Desert occur frequently in spring. Dust aerosols influence climate through effects on radiation and clouds, and impair air quality with impacts on human health. However, large uncertainties in model simulations of dust aerosols persist. An estimation of the relative contributions of different meteorological drivers to dust activities can help to improve the representation of dust storms in models.

Mongolian cyclones, which form East of the Altai-Sayan Mountains, are important for dust-emitting winds in the Gobi Desert. Utilizing an automated detection algorithm of extratropical cyclones and multiple datasets for dust aerosol for 2001–2022, the contribution of Mongolian cyclones to East Asian dust emission and dust optical depth is quantitatively estimated (Mu and Fiedler). The results highlight that springtime dust storms in East Asia are primarily associated with a low-pressure system over Mongolia. Mobile Mongolian cyclones explain almost half of the total spring dust emission amount of the Gobi Desert. The calculated relative contributions of Mongolian cyclones to dust emissions in the Gobi Desert are similar from two different products, despite differences in the physical parameterization schemes for dust emission, number and location of the prescribed potential dust sources, and in the absolute dust emission amount by a factor ten. Dust emissions in the Gobi Desert and dust aerosol optical depth in the region downwind have decreased in the past decades, with Mongolian cyclones contributing to reductions of 10%-18% decade-1 and 11%--15% decade-1, respectively. The reduction of dust emissions and dust aerosol optical depth is at least in part explained by weaker and fewer Mongolian cyclones over time. 

Mongolian cyclones may also affect the dust activity in the Taklamakan Desert to the west of the Gobi Desert. The passage of the Mongolian cyclone in mid-March 2021 has led to a cold air intrusion into the Taklamakan Desert. The cold air favored the nighttime near-surface temperature inversion. The stable stratification near the surface allows the development of Nocturnal Low-Level Jets (NLLJs). The breakdown of NLLJs results in a strengthening of near-surface winds, which are sufficiently strong for dust emissions in many parts of the Taklamakan Desert (Mu et al., 2023). The Taklamakan dust was elevated by deep mixing and transported eastwards by prevailing mid-level westerlies, impacting air quality primarily in western China. Ongoing work addresses the link of cyclones and NLLJs in the Taklamakan Desert from the climatological perspective.

References:

Mu, F., Luiz, E.W., Fiedler, S., 2023. On the dynamics and air-quality impact of the exceptional East Asian dust outbreak in mid-March 2021. Atmos. Res. 292, 106846.
Mu, F. and Fiedler, S., in review. How much do atmospheric depressions and Mongolian cyclones contribute to East Asian spring dust activities?

How to cite: Mu, F. and Fiedler, S.: Meteorological Drivers of East Asian dust activity in spring 2001-2022, EGU General Assembly 2025, Vienna, Austria, 27 Apr–2 May 2025, EGU25-6183, https://doi.org/10.5194/egusphere-egu25-6183, 2025.

EGU25-6741 | ECS | PICO | CL4.14

The contribution of haboobs to the dust direct radiative effect 

Andreas Baer, Rumeng Li, and Martina Klose

Mineral dust is the most abundant type of atmospheric aerosol in terms of mass. Dust models at non-storm resolving resolutions are usually able to capture the dust load on diurnal or longer-term average, but perform worse in capturing its diurnal variability. A main reason for this deficit is the fact that phenomena smaller than the grid size cannot be represented and are therefore lacking in the simulations. A major dust-event type that can only be represented at single-digit kilometer resolution are haboobs – intense dust storms created by the cold-pool outflow of moist convection. Haboobs mostly occur during the afternoon and thus their representation in models at storm resolving resolutions increases dust emissions during the afternoon hours, especially in regions where haboobs typically occur. As a significant amount of global dust emissions can be attributed to haboobs, their impact, e.g. on interactions of dust aerosol with radiation, on the continental to global scale is of special interest.

Here we investigate the contribution of haboobs to the direct radiative effect (DRE) of dust through their modulation of the dust diurnal cycle and vertical and horizontal distributions. For this purpose, we performed a set of annual simulations of the year 2020 using the ICON-ART model at 5km and 80km grid resolution for a domain covering North Africa and the Arabian Peninsula, as these regions are strong dust sources and haboob hotspots. A radiation multiple call scheme in ICON-ART was used to assess the DRE from a single simulation. We analyze differences in DRE and the vertical and horizontal dust distribution between the simulations and link them to the spatial distribution of haboob occurrence in the high-resolution simulation.

By assessing the impact of haboobs on the radiation balance of the earth, we aim to contribute to evaluating the benefits of storm-resolving simulations on a global scale with online treatment of aerosols; and to test the importance of representing meso-scale phenomena for quantification of dust-climate impacts.

How to cite: Baer, A., Li, R., and Klose, M.: The contribution of haboobs to the dust direct radiative effect, EGU General Assembly 2025, Vienna, Austria, 27 Apr–2 May 2025, EGU25-6741, https://doi.org/10.5194/egusphere-egu25-6741, 2025.

EGU25-7106 | ECS | PICO | CL4.14

Another one traps the dust: Central Svalbard Lake sediments track 8,000 years of High Arctic wind strength 

Zofia Stachowska, Willem G. M. van der Bilt, Mateusz C. Strzelecki, and Jan Kavan

The Arctic warms faster than any other region on Earth. As sea ice diminishes in response, wind speeds increase due to reduced drag over open waters. Lake sediments offer valuable records of these processes and their relation to past climate change through the deposition of wind-blown grains and elements. This study reconstructs 8,000 years of Arctic eolian activity using laminated sediments from closed Lake Dunsappietjørna on the Svalbard archipelago. The site faces North Atlantic Westerlies as well as Easterly winds. By integrating geochemical (X-Ray Fluorescence – XRF), visual (Computed Tomography – CT and Scanning Electron Microscope – SEM), and granulometric (End Member Modeling Analysis – EMMA) fingerprints in a geostatistical (Principal Component Analysis – PCA) framework, we link clastic lacustrine input to sediment sources in the catchment, and unravel the imprint of Westerly and Easterly wind systems throughout the Holocene.

How to cite: Stachowska, Z., van der Bilt, W. G. M., Strzelecki, M. C., and Kavan, J.: Another one traps the dust: Central Svalbard Lake sediments track 8,000 years of High Arctic wind strength, EGU General Assembly 2025, Vienna, Austria, 27 Apr–2 May 2025, EGU25-7106, https://doi.org/10.5194/egusphere-egu25-7106, 2025.

The 2.3-million-year grain-size records of detrital components from IODP Site U1430 in the East (Japan) Sea illustrate the influence of East Asian Winter Monsoon variations on Asian dust transport and deposition. Dust transport was driven by two distinct wind systems: low-level northwesterly winter monsoon winds and upper-level westerlies. Using end-member (EM) modeling of grain-size distributions, five EMs were identified: fine-mode dust transported by upper-level westerlies (EM1), coarse-mode dust carried by northwesterly surface winds (EM2), and marine tephra components (EM3, EM4, EM5). After excluding marine tephra contributions, a refined dust-size distribution model was developed, focusing on EM1 and EM2. The cyclic patterns and amplitudes of dust-size variations at Site U1430 closely align with size records from the Chinese Loess Plateau (CLP), where sedimentation is predominantly influenced by northwesterly surface winds. This agreement suggests that dust deposition at Site U1430 was similarly controlled by the intensity of these winds, rather than upper-level westerlies. Additionally, variations in loess size across the CLP and modern dust observations indicate that vertical and lateral sorting processes during atmospheric transport contributed to the finer dust sizes recorded at Site U1430. These findings highlight the critical role of surface wind intensity and atmospheric sorting in shaping long-term dust deposition patterns in the East (Japan) Sea. 

How to cite: Jang, J.-H., Bahk, J.-J., and Lee, D. E.: IODP Site U1430 Asian Dust Size Records in the East (Japan) Sea Since the Early Pleistocene: The Role of Northwesterly Surface Winds and Upper Westerlies , EGU General Assembly 2025, Vienna, Austria, 27 Apr–2 May 2025, EGU25-7600, https://doi.org/10.5194/egusphere-egu25-7600, 2025.

EGU25-8292 | ECS | PICO | CL4.14

Saharan dust deposition in the eastern Mediterranean Sea: ballasting agent or fertilizer? 

Anouk van Boxtel, Addison Rice, Gert J. de Lange, Francien Peterse, and Jan-Berend Stuut

Dust deposition can increase the strength of the biological pump through fertilizing and ballasting effects of the deposited dust, in particular in (ultra-)oligotrophic oceans such as the eastern Mediterranean Sea (EMS). However, dust characteristics, such as nutrient content and bioavailability, organic-matter content, and grain-size distribution, and thus its fertilizing and ballasting potential, can vary between dust events.

Here, we present a long-term (1999-2011), high-resolution (14-21 days) sediment-trap record of dust fluxes, dust grain-size distributions, and fluxes of plant leaf waxes at 500, 1500, and 2500m water depth to assess seasonal and interannual variation in the amount and characteristics of dust deposited in the EMS.

We find that dust events mainly occur during late spring and summer, although their exact timing and magnitude varies between years. Differences in grain-size distribution and plant wax content between dust events indicate that the provenance, transportation, and/or deposition mode of the dust varied between events. The dust events archived in the sediment traps are preceded by atmospheric dust transport, indicated by increased Aerosol Optical Depth (AOD) values recorded by satellites in the weeks before dust fluxes increase. However, several major atmospheric dust outbreaks observed by satellites do not appear in the sediment trap record. This indicates that not all material that passes the EMS through the atmosphere is actually deposited on the sea surface and/or reaches the traps at larger water depths.

Most dust events in the sediment traps can be traced through the water column, indicating relatively rapid vertical export. The dust events coincide with increases in organic carbon flux, supporting the proposed role of dust in the biological pump through ballasting. However, while coarse-grained dust is consistently transferred to the deepest trap, regardless of the absolute flux, finer-grained dust is primarily detected in the upper trap. We will use our dataset to further investigate whether export of fine-grained dust is also linked to ballasting or is mediated by productivity in the surface ocean through the formation of organic aggregates and fecal pallets, either as a result of dust fertilization or natural processes.

How to cite: van Boxtel, A., Rice, A., de Lange, G. J., Peterse, F., and Stuut, J.-B.: Saharan dust deposition in the eastern Mediterranean Sea: ballasting agent or fertilizer?, EGU General Assembly 2025, Vienna, Austria, 27 Apr–2 May 2025, EGU25-8292, https://doi.org/10.5194/egusphere-egu25-8292, 2025.

EGU25-8963 | PICO | CL4.14

Evaluating the impact of improved dust representation and atmospheric iron chemistry in marine primary production and subsurface iron stocks  

Joan Llort, Elisa Bergas-Massó, Raffaelle Bernardello, Valentina Sicardi, Maria Gonçalves Ageitos, Carla Pons, Stelios Myriokefalitakis, and Carlos Pérez García-Pando

The impact of dust deposition on the fertilisation of marine ecosystems has been studied for decades. Despite the relevance of this air-sea interaction, aerosol chemical transformation, deposition over the ocean, and the eventual influence on ocean biogeochemistry (including carbon export) are poorly represented in most Earth System Models (ESM). For instance, the deposition of soluble iron (the chemical iron forms that phytoplankton can uptake) is often estimated in ESM as a constant fraction of deposited dust. This type of simplistic formulation underrepresents the interannual and spatial variability of the aeolian input of nutrients in marine ecosystems. 

In this work, we present a reconstruction of global ocean biogeochemistry for the last 30 years, where we evaluate the impact of newly produced iron deposition fields derived from the state-of-the-art atmospheric model EC-Earth3-Fe, which explicitly resolves the mineralogy of dust sources, includes a detailed representation of the atmospheric Fe dissolution processes and accounts for the contribution of other sources of Fe, such as anthropogenic combustion and biomass-burning. When compared to a standard run using climatological atmospheric inputs and constant dissolution rates the new simulation shows a contrasted response of marine primary production where production increases above 10% in large areas of the Pacific and the South Atlantic, while other smaller regions show an equivalent decrease. 

We also analysed the impact of the monthly resolved historical reconstruction of dust deposition (i.e., atmospheric model forced with observed meteorology) on the primary production’s interannual variability. Results showed no immediate impact of dust deposition variability on marine primary production. However, we found a replenishment of the subsurface stock of dissolved iron associated with the increase in dust deposition over the Equatorial Atlantic, the Indian Ocean and the subtropical Pacific. As this subsurface stock is one of the main seasonal inputs of iron through winter vertical mixing, it can induce delayed responses in marine ecosystems. Ongoing work is evaluating this hypothesis and comparing the simulated vertical distribution of dissolved iron in the water column against observations acquired by the GEOTRACES program.

In this presentation, we will also describe the efforts made in the new project BIOTA to understand how changes in aerosol transformation and deposition interact with the projected increase in upper ocean stratification, potentially enhancing the relative importance of aeolian nutrient inputs.

How to cite: Llort, J., Bergas-Massó, E., Bernardello, R., Sicardi, V., Gonçalves Ageitos, M., Pons, C., Myriokefalitakis, S., and Pérez García-Pando, C.: Evaluating the impact of improved dust representation and atmospheric iron chemistry in marine primary production and subsurface iron stocks , EGU General Assembly 2025, Vienna, Austria, 27 Apr–2 May 2025, EGU25-8963, https://doi.org/10.5194/egusphere-egu25-8963, 2025.

EGU25-8965 | ECS | PICO | CL4.14

Photovoltaic production in West Africa: Impact of dust and water footprint of cleaning operations 

Amy Tamunoibinyemiem Banigo, Benoit Hingray, Louise Crochemore, Béatrice Marticorena, and Sandrine Anquetin

To achieve universal electricity access and comply with Paris Agreement, one large-scale objective of the Economic Community of West African States (ECOWAS) is the deployment of +8 to +20 GWp of solar energy systems by 2030 (IRENA, 2018). ECOWAS is located south of the Saharan region and close to the Bodélé depression, which has been observed to have the largest atmospheric dust production activity on Earth (Isaacs et al., 2023). Once deposited on panels, dust reduces the transmission of solar radiation to the panels and, consequently, the energy production (Sarver et al., 2013). Annual losses of solar energy production of up to 54% have been observed in the region due to dust (Chanchangi et al., 2022). These production losses can be mitigated by regularly cleaning solar panels. In West Africa, cleaning operations commonly use water but many areas are water-scarce. It is thus important to ensure that water resources are not further strained by water cleaning operations associated with the expected large-scale deployment of solar energy systems in the region.

In the present work, we aim to assess the water footprint of different cleaning strategies of virtual solar plants in the ECOWAS region. A first step towards this aim consists in regionally assessing how dust would accumulate on Photovoltaic (PV) panels and, in turn, what the associated production losses would be. We present a dust accumulation model allowing to simulate, over a long time period and across the region, the temporal sub daily variations of dust accumulation on virtual PV panels. The model uses as input the particulate matter concentration of different particle sizes. Dust data from the CAMS and MERRA2 reanalyses are considered. Both datasets are first compared to observations of regional particulate matter concentration available from a set of four stations from the INDAAF network. CAMS data were found to better agree with observations (> 0.8 correlation for a 1-week temporal resolution). Time series of dust accumulation simulated from CAMS data were then compared to time series of dust deposit observations available for the same four INDAAF stations. Results show fair agreement but highlight significant differences, likely due to uncertainties in various variables and model assumptions. Lastly, simulated accumulated dust amounts are used as input to a PV soiling loss model to derive the transmission reduction and the mean PV production losses for different cleaning operation strategies.

References

Chanchangi et al., 2022. Soiling mapping through optical losses for Nigeria. Renewable Energy, 197, 995–1008. https://doi.org/10.1016/j.renene.2022.07.019

IRENA (2018), Renewable Energy Statistics 2018, The International Renewable Energy Agency, Abu Dhabi.

Isaacs et al., 2023. Dust soiling effects on decentralized solar in West Africa. Applied Energy, 340, 120993. https://doi.org/10.1016/j.apenergy.2023.120993

Sarver et al.,2013. A comprehensive review of the impact of dust on the use of solar energy: History, investigations, results, literature, and mitigation approaches. Renewable and Sustainable Energy Reviews, 22, 698–733. https://doi.org/10.1016/j.rser.2012.12.065

How to cite: Banigo, A. T., Hingray, B., Crochemore, L., Marticorena, B., and Anquetin, S.: Photovoltaic production in West Africa: Impact of dust and water footprint of cleaning operations, EGU General Assembly 2025, Vienna, Austria, 27 Apr–2 May 2025, EGU25-8965, https://doi.org/10.5194/egusphere-egu25-8965, 2025.

EGU25-9134 | PICO | CL4.14

Coordinated vertical tandem-profiling of a Saharan dust intrusion over Central Europe on 20 June 2024 based on balloon-borne soundings from two different sites. 

Ralf Weigel, Konrad Kandler, Monika Scheibe, Katie Smith, Luis Valero, Luca K. Eichhorn, Sina Jost, Kristin Röck, Sonja Gisinger, Alexandre Baron, Troy Thornberry, Adrienne Jeske, and Holger Tost

When favourable synoptic conditions prevail, desert dust is transported from North Africa to Central Europe. Between June 19 and 21, 2024, air from North and Northwest Africa spread from Algeria across the south-coast of France with predicted dust load > 1200 mg m-2 over an area limited by the Rhone Valley, extending to the coasts of Belgium and the Netherlands. The intrusion reached as far as the Skagerrak and the Kattegat and stretched across parts of Poland and the Czech Republic to the Aegean Sea and Greece, and it entirely covered Italy. On June 20, 2024, time-coordinated balloon-borne vertical soundings were carried out over Germany from two locations: 1) at 13:18 CEST from Oberpfaffenhofen (OPH - near Munich) and 2) at 14:15 CEST from Spielberg (SPb - near Frankfurt/Main, in the framework of “TPChange”, DFG TRR301) with the aim to analyse the same (intermediately transported) air mass. The SPb balloon payload included (a. o.) a radiosonde (RS41 SGP by VAISALA), a set of dual-stage impactors to perform particle sampling for offline physico-chemical analyses, and optical particle counters (OPC) such as the Portable Optical Particle Spectrometer (POPS). The OPH payload consisted of an OPC-N3 (by Alphasense) and the RS41 SGP.

Qualitative agreement was obtained from the independent profiles: from 1.5 km to 4.8 km height, a layer of increased particle number concentration (N) with 100 to 1000 cm-3 stands out from the background (N < 20 cm-3) in the vertical profile for particles with a diameter (Dp) from 0.14 µm to 2.6 µm (POPS-detected sized range). While below ~ 4.5 km (OPH) and ~ 4.8 km (SPb), the relative humidity (RH) remains below 87 %, the region of particle enhancement is effectively capped by a cloud layer (RH exceeding 100 %) of about 200 m vertical thickness above ~ 4.5 km (OPH) and ~ 4.8 km (SPb), respectively. Aloft, N drops abruptly and temporarily reaches background values < 20 cm-3. The impactor sample taken throughout passage of the particle layer showed considerable presence of mineral dust (generally > 75 % of all particles collected), the largest of which have estimated Dp of 10 µm and smallest Dp were estimated with 0.1 µm. Admixtures of sea salt (particle fraction Dp > 500nm) and sulphates (fraction Dp < 500 nm) were also identified. We will present more specific microphysical properties of the mineral dust aerosol, including morphology and chemical composition, and discuss these in the context of the atmospheric conditions at both measurement sites.

How to cite: Weigel, R., Kandler, K., Scheibe, M., Smith, K., Valero, L., Eichhorn, L. K., Jost, S., Röck, K., Gisinger, S., Baron, A., Thornberry, T., Jeske, A., and Tost, H.: Coordinated vertical tandem-profiling of a Saharan dust intrusion over Central Europe on 20 June 2024 based on balloon-borne soundings from two different sites., EGU General Assembly 2025, Vienna, Austria, 27 Apr–2 May 2025, EGU25-9134, https://doi.org/10.5194/egusphere-egu25-9134, 2025.

EGU25-9264 | PICO | CL4.14 | Highlight

The shadow of the wind: photovoltaic power generation under Europe's dusty skies 

György Varga, Fruzsina Gresin, András Gelencsér, Adrienn Csávics, and Ágnes Rostási

The impact of the Sahara dust storm events on photovoltaic power generation in Europe will be presented. In recent years, driven by global sustainability, climate and energy security objectives, photovoltaic power generation has been expanding worldwide, with a particular focus on the European continent. We are also witnessing a change in the frequency and intensity of Saharan dust storm events. Atmospheric particulate matter significantly reduces irradiance through its direct and indirect effects, with energy flux changes sometimes having serious economic and security of supply implications. 

In a diverse energy mix, which varies significantly from state to state, weather-dependent renewable generation must be forecasted to meet the delicate balancing needs of electricity supply, which poses a major challenge to the system operator. Analysis of the accuracy of the forecasts has shown that this is subject to significant errors and that the magnitude of these errors is larger during dust storm events than during non-dust storm situations. In the photovoltaic power generation data series of the southern (Portugal, Spain, France, Italy, Greece) and central European (Hungary) countries  presented here, we characterise episodes where atmospheric dust caused irradiance and electricity production to deviate significantly from the predicted levels.

Key Takeaways:

(1) The influence of atmospheric particulate matter is substantial for both photovoltaic (PV) production and generation forecasting. This effect is likely more pronounced with meridional (south-north) dust transport due to a steeper thermal gradient, which intensifies cloud formation processes through warm air advection and increased fine-grained particulate mass.

(2) Accurate PV production forecasts cannot be achieved using coarse-resolution aerosol climatology data without aerosol-cloud coupling. Instead, calculations should integrate up-to-date dust load data and relevant cloud physics relationships.

(3) The quantities of atmospheric dust, the dynamics of its transport, and the mineralogical and physical properties (such as grain size and shape) of the dust are not well understood. These factors have diverse impacts on cloud formation processes, necessitating further research for better comprehension.

(4) Due to climate change and the inherent variability of the climate system, forecasts are made under fluctuating hydrometeorological and atmospheric conditions, which inherently carry uncertainties. These errors are expected to become more significant with increasing PV capacity, thus managing them will require expanding electricity storage capacities alongside more precise forecasts.

The research was supported by the NRDI projects FK138692 and by the Sustainable Development and Technologies National Programme of the Hungarian Academy of Sciences (FFT NP FTA). This work has been implemented by the National Multidisciplinary Laboratory for Climate Change (RRF-2.3.1-21-2022-00014) project within the framework of Hungary's National Recovery and Resilience Plan supported by the Recovery and Resilience Facility of the European Union.

How to cite: Varga, G., Gresin, F., Gelencsér, A., Csávics, A., and Rostási, Á.: The shadow of the wind: photovoltaic power generation under Europe's dusty skies, EGU General Assembly 2025, Vienna, Austria, 27 Apr–2 May 2025, EGU25-9264, https://doi.org/10.5194/egusphere-egu25-9264, 2025.

EGU25-10547 | PICO | CL4.14

Dust emission from dust sources in Iceland: Insights from the High-Latitude Dust Experiment in summer 2021 

Kerstin Schepanski, Konrad Kandler, Mara Montag, Kilian Schneiders, Agnesh Panta, Adolfo González-Romero, Cristina González-Flórez, Martina Klose, Xavier Querol, Andrés Alastuey, Jesús Yus-Díez, Sylvain Dupont, Pavla Dagsson-Waldhauserová, and Carlos Pérez García-Pando

Mineral dust is one of the most prominent natural aerosols and is almost ubiquitous in the atmosphere, where it substantially interacts, modulates and alter atmospheric processes. Although research on dust aerosol is carried out since many decades by means of different approaches and techniques, knowledge on mineral dust emitted at high latitudes or in cold climate regions is still limited despite its pivotal impact on polar environments. Within a warming climate, dust emitted from sources located in cold climate zones is expected to increase due to the retreat of the ice sheets and increasing melting rates. Therefore, and for its extensive impacts on different aspects of the climate system, a better understanding of the atmospheric dust cycle at high latitudes/cold climates in general, and the spatio-temporal distribution of dust sources in particular, are essential.

We will present results from the HiLDA measurement campaign which took place in summer 2021 in the Dyngjusandur in Iceland. The measurements were set up to observe dust concentration variability across the Dyngjusandur and near-source dust transport areas in order to eventually conclude on the variability in dust source emissivity. We have measured aerosol size distributions and meteorological parameters distributed over different dust source areas at high temporal resolution for a period of eight weeks in summer 2021 and spring 2022. During this time, we observed a couple of intense dust events as well as background conditions. Ultimately, the analysis of our measurement data addresses the complex web of interactions which is defined by the variability of dust source characteristics and wind speed distribution in concert. Findings from this study contribute to the understanding of dust emission in cold climate regions and its spatio-temporal variability, which is essential with respect to the quantification of dust-associated feedbacks in the Earth system.

How to cite: Schepanski, K., Kandler, K., Montag, M., Schneiders, K., Panta, A., González-Romero, A., González-Flórez, C., Klose, M., Querol, X., Alastuey, A., Yus-Díez, J., Dupont, S., Dagsson-Waldhauserová, P., and Pérez García-Pando, C.: Dust emission from dust sources in Iceland: Insights from the High-Latitude Dust Experiment in summer 2021, EGU General Assembly 2025, Vienna, Austria, 27 Apr–2 May 2025, EGU25-10547, https://doi.org/10.5194/egusphere-egu25-10547, 2025.

EGU25-11653 | PICO | CL4.14

Earth Observations and Atmospheric Dust: unveiling Atlantic Ocean deposition 

Jan-Berend Stuut, Emmanouil Proestakis, Vassilis Amiridis, Carlos Pérez Garcia-Pando, Svetlana Tsyro, Jan Griesfeller, Antonis Gkikas, Thanasis Georgiou, Maria Gonçalves Ageitos, Jeronimo Escribano, Stelios Myriokefalitakis, Elisa Bergas Masso, Enza Di Tomaso, Sara Basart, and Angela Benedetti

The global ocean is a key component to the Earth’s climate system, absorbing atmospheric energy in excess and exchanging as a sink climate-relevant gases with the atmosphere. More specifically, through the uptake of atmospheric CO2 and acting as carbon storage, through the processes of biological pump and solubility pump, helps to mitigate anthropogenic CO2 increase. Moreover, the ocean enables phytoplankton photosynthesis, impacts ocean color, light penetration into deeper layers, and sea surface temperature, eventually modulating weather and resulting to feedback effects on climate. However, primary production highly depends on the spatial distribution of input nutrients from the atmosphere, with iron (Fe) availability the most important limiting factor for phytoplankton growth. Across the open ocean, the principal source of Fe is considered atmospheric mineral dust, transported over distances of thousands of kilometers prior removal through wet deposition or gravitational settling.

The present study provides quantification of the amount of atmospheric dust deposited into the broader Atlantic Ocean. Based on Cloud–Aerosol Lidar with Orthogonal Polarization (CALIOP) routine observations on atmospheric dust, the primary instrument onboard Cloud–Aerosol Lidar and Infrared Pathfinder Satellite Observations (CALIPSO), and meridional and zonal wind components provided by the European Centre for Medium-Range Weather Forecasts (ECMWF) reanalysis (ERA5), the atmospheric dust fluxes and the dust deposited component across the tans-Atlantic transits are estimated. On the basis of more than sixteen years (12/2006-11/2022) of Earth Observations, and for the Atlantic Ocean region extending between latitudes 60°S and 40°N, the annual-mean amount of deposited dust is estimated at 274.79 ± 31.64 Tg, of which 243.98 ± 23.89 Tg is deposited into the North Atlantic Ocean and 30.81 ± 10.49 Tg into the South Atlantic Ocean. Moreover, a negative statistically significant decreasing trend in dust deposition into the Atlantic Ocean for this period is revealed, characterized by slope -13.35 Tg yr-1 and offset 306.97 Tg.

The climate data record is evaluated against high quality sediment-trap measurements of deposited lithogenic material implemented as reference dataset, demonstrating the protentional of the established dataset to be used in a wide range of applications, including filling geographical and temporal gaps in sediment-trap measurements, aiding model simulation evaluations, uncovering physical processes in the dust cycle from emission to deposition, and enhancing our understanding of dust's biogeochemical impacts on ocean ecosystems, as well as its effects on weather and climate.


Acknowledgements

This research was supported by the Dust Observation and Modelling Study (DOMOS) under ESA contract number 4000135024/21/I-NB. Emmanouil Proestakis acknowledges support by the AXA Research Fund for postdoctoral researchers under the project entitled “Earth Observation for Air-Quality – Dust Fine-Mode (EO4AQ-DustFM)”.

How to cite: Stuut, J.-B., Proestakis, E., Amiridis, V., Pérez Garcia-Pando, C., Tsyro, S., Griesfeller, J., Gkikas, A., Georgiou, T., Gonçalves Ageitos, M., Escribano, J., Myriokefalitakis, S., Bergas Masso, E., Di Tomaso, E., Basart, S., and Benedetti, A.: Earth Observations and Atmospheric Dust: unveiling Atlantic Ocean deposition, EGU General Assembly 2025, Vienna, Austria, 27 Apr–2 May 2025, EGU25-11653, https://doi.org/10.5194/egusphere-egu25-11653, 2025.

EGU25-12087 | ECS | PICO | CL4.14

From fine to giant: Multi-instrument assessment of the particle size distribution of emitted dust during the J-WADI field campaign 

Hannah Meyer, Martina Klose, Konrad Kandler, Sylvain Dupont, and Carlos Pérez García-Pando and the J-WADI Team

Mineral dust, a key component of Earth’s aerosols, impacts atmospheric processes and climate. Emitted from dry soil, these particles travel long distances, influencing atmospheric radiation, cloud dynamics, and biogeochemical cycles. Dust effects are size-dependent. Larger particles, for example, tend to warm the atmosphere, whereas smaller ones (diameter dp < 2.5 µm) typically cool it. Understanding dust transport and impacts requires detailed particle size distribution (PSD) data at emission, but measurements are sparse and larger particles (dp > 10 µm) are understudied due to low concentrations and sampling challenges.

The Jordan Wind Erosion and Dust Investigation (J-WADI) campaign, conducted in September 2022 near Wadi Rum, Jordan, provides the platform for this study, in which we characterize the PSD at emission, focusing on super-coarse (10 < dp ≤ 62.5 µm) and giant (dp > 62.5 µm) particles. This study is the first to comprehensively characterize the size distribution of mineral dust directly at the emission source, covering diameters between 0.4 and 200 µm. Using a suite of aerosol spectrometers, the overlapping size ranges enabled systematic intercomparison and validation across instruments, improving PSD reliability and addressing challenges in detecting larger particles, such as inlet efficiencies or size range restrictions.

Results show significant PSD variability over the course of the campaign. During periods with friction velocities (u*) above 0.25 ms⁻¹, super-coarse and giant particles were observed, with concentrations increasing with u*. These large particles account for about two-thirds of the total mass during the campaign, with contributions of 90% during an active emission event, emphasizing the importance of including super-coarse and giant particles in PSD analyses. A prominent mass concentration peak was observed near 50 µm. While particle concentrations for dp < 10 µm show strong agreement among most instruments, discrepancies appear for larger dp due to reduced instrument sensitivity at the size range boundaries and sampling inefficiencies. Despite these challenges, physical samples collected using a flat-plate sampler largely confirm the PSDs derived from aerosol spectrometers.

These findings advance the characterization of PSD over a large size range at emission sources and lay the foundation to further improve our understanding of the mechanisms facilitating super-coarse and giant dust particle emission and transport.

How to cite: Meyer, H., Klose, M., Kandler, K., Dupont, S., and Pérez García-Pando, C. and the J-WADI Team: From fine to giant: Multi-instrument assessment of the particle size distribution of emitted dust during the J-WADI field campaign, EGU General Assembly 2025, Vienna, Austria, 27 Apr–2 May 2025, EGU25-12087, https://doi.org/10.5194/egusphere-egu25-12087, 2025.

EGU25-13198 | PICO | CL4.14

Giant Particle Size Distribution and Composition Near and In Dust Sources 

Konrad Kandler, Agnesh Panta, Mara Montag, Melanie Eknayan, Hannah Meyer, Martina Klose, Kerstin Schepanski, Cristina González-Flórez, Adolfo González-Romero, Andres Alastuey, Pavla Dagsson Waldhauserová, Xavier Querol, and Carlos Pérez García-Pando

Mineral dust is one of the key players in the Earth’s atmosphere with respect to climate and atmospheric nutrient transport. Dust spans a large size range of particle diameters, reaching from around 100 nm to more than 100 µm. While it has been assumed for a long time that the super-coarse (10 - 62.5 µm) and giant (> 62.5 µm) particles are not widely dispersed from the sources, more recent observations show that they can travel on a regional up to even intercontinental scale. Owing to the negligence and difficulty in measurement, not much information is available on this dust size range.

In the present work we have collected dust by means of a simple flat-plate deposition sampler and analyzed the collected material with electron microscopy and X-ray fluorescence, yielding information on particle size distributions and elemental composition. Samples were collected during intensive field campaigns of the FRAGMENT project in Morocco in 2019, a joint field campaign with the HiLDA project in Iceland in 2021, and the Jordan Wind erosion And Dust Investigation (J-WADI) in 2022. During all campaigns, severe dust conditions were observed with mass concentrations ranging into the tens of milligrams per cubic meter.

All observed number size distributions have in common a decrease towards submicron particles and a monotonic decrease with increasing particle size starting from 5 µm diameter. Both features are in general corroborated by online size distribution measurements in the overlap region, while the decrease towards smaller particle sizes is enhanced in the deposition sampling, most probably linked to the lower deposition speed of these particle sizes. The mean size distribution observed in Iceland has relatively more larger particles, followed by Jordan and lastly Morocco. Besides modes at around 1 µm and 5 µm, in Morocco a tertiary mode at around 70 µm in diameter gets pronounced. Mineral composition was estimated for each particle from the elemental composition. Morocco and Jordan have a similar composition with a slightly higher amount of Ca-accreted and feldspar particles in Jordan and more illite-/muscovite-like ones in Morocco. Expectedly, the composition of Icelandic dust is different, with volcanic glass, feldspars, and pyroxene/amphibole-like particles dominating. Comparing the coarse (sub-10-µm) with the super-coarse/giant (>10 µm) size range, we observe in the hot deserts less calcite for the larger particles as a common feature. The trend of a decreasing relative contribution of Fe-rich particles starting at the submicron range continues. In Iceland, we see the dominance of glassy particles still increase with increasing particle size. A big change in composition between these size classes is not observed unlike, for example, in previous measurements in Morocco, which showed a strong increase of quartz-like particles for the giant particle range. That indicates a considerable small-scale variability in freshly emitted dust plumes, dependent on their source.

How to cite: Kandler, K., Panta, A., Montag, M., Eknayan, M., Meyer, H., Klose, M., Schepanski, K., González-Flórez, C., González-Romero, A., Alastuey, A., Dagsson Waldhauserová, P., Querol, X., and Pérez García-Pando, C.: Giant Particle Size Distribution and Composition Near and In Dust Sources, EGU General Assembly 2025, Vienna, Austria, 27 Apr–2 May 2025, EGU25-13198, https://doi.org/10.5194/egusphere-egu25-13198, 2025.

EGU25-13655 | ECS | PICO | CL4.14

Modelling of Dust Emissions from Agricultural Sources in Europe 

Matthias Faust, Robert Wagner, Ralf Wolke, Steffen Münch, Roger Funk, and Kerstin Schepanski

Mineral dust emissions from arable land are a significant environmental concern. Fugitive dust emissions commonly arise during mechanical activities such as tilling and harvesting, while aeolian emissions occur from sparsely vegetated cropland, particularly during the transitional phases between fresh tillage and substantial vegetation growth and hence coverage of the bare soil. Suspended in the atmosphere, dust aerosol particles originating from arable land suposedly affect human health, reduce air quality, and can economically impact agricultural productivity due to soil degradation and reduced yields.

Agricultural dust emissions are often overlooked in coupled atmosphere-aerosol models, perhaps due to the complex conditions that lead to emissions. Fugitive emissions are highly variable, influenced by unpredictable human activities, while aeolian emissions require accurate descriptions of vegetation dynamics during transitional periods.

To address these gaps, we developed modelling strategies to simulate both fugitive and aeolian emissions. Fugitive emissions were analysed using a Lagrangian particle dispersion model designed to capture the turbulent mixing of dust particles in the atmospheric boundary layer. A case study based on measured tilling emissions demonstrated how atmospheric stratification can limit or amplify dust plumes and their range of transport.

For aeolian emissions, a new parameterisation was implemented in the atmosphere-aerosol model COSMO-MUSCAT, utilising high-resolution satellite data to represent vegetation cover. We tested our model for a dust emission event in Poland in 2019, where the model showed good agreement with satellite observations and ground-based measurements.

Ultimately, our modelling efforts provide insights into the dynamics, spatial distribution, and broader impacts of agricultural dust emissions, contributing to a more comprehensive understanding of their role in the atmosphere.

How to cite: Faust, M., Wagner, R., Wolke, R., Münch, S., Funk, R., and Schepanski, K.: Modelling of Dust Emissions from Agricultural Sources in Europe, EGU General Assembly 2025, Vienna, Austria, 27 Apr–2 May 2025, EGU25-13655, https://doi.org/10.5194/egusphere-egu25-13655, 2025.

EGU25-16684 | ECS | PICO | CL4.14

Enhancing Aerosol Modeling: Integrating the Mineralogy of Mineral Dust into ECHAM_HAMMOZ 

Elisabeth Hofmann, Robert Wagner, and Kerstin Schepanski

Dust aerosols are a key component of the climate system due to their interactions with radiation, their influence on atmospheric chemistry, and their role in biogeochemical cycles. Despite this importance, many climate models treat mineral dust particles as a homogeneous entity, overlooking their inherent variability regarding mineralogical composition. In reality, dust aerosols consist of fine particles entrained by wind from sparsely vegetated soil surfaces, originating from geographically diverse regions of the Earth and shaped by local climate and geological conditions. These particles are a complex mixture of various mineralogies with distinct size distributions.

In this study, we discuss the global distribution of mineral dust aerosol concentrations with regard to the dust particles’ mineralogical composition, using the atmosphere-aerosol model ECHAM-HAMMOZ (ECHAM6.3.0-HAM2.3-MOZ1.0). The model has been enhanced by integrating 12 minerals derived from the database of Journet et al. (2014), as modified by Gonçalves Ageitos et al. (2023). This implementation allows for a more detailed representation of the mineralogical diversity of atmospheric dust aerosols as a function of soil mineralogy at the contributing dust source areas. The results of the model simulations are evaluated against observational data in order to assess the model's accuracy and performance with regard to the representation of the mineralogical composition of dust aerosol plumes.

This work highlights the importance of incorporating mineralogical diversity in climate models to better understand the role of dust aerosols in the Earth system.


  • Gonçalves Ageitos, María & Obiso, Vincenzo & Miller, Ron & Jorba, Oriol & Klose, Martina & Dawson, Matt & Balkanski, Yves & Perlwitz, Jan & Basart, Sara & Tomaso, Enza & Escribano, Jerónimo & Macchia, Francesca & Montané Pinto, Gilbert & Mahowald, Natalie M & Green, Robert O & Thompson, David & Pérez García-Pando, Carlos. (2023). Modeling dust mineralogical composition: sensitivity to soil mineralogy atlases and their expected climate impacts. Atmospheric Chemistry and Physics. 23. 8623-8657. 10.5194/acp-23-8623-2023.

  • Journet, E., Balkanski, Y., and Harrison, S. P.: A new data set of soil mineralogy for dust-cycle modeling, Atmos. Chem. Phys., 14, 3801–3816, https://doi.org/10.5194/acp-14-3801-2014, 2014.

How to cite: Hofmann, E., Wagner, R., and Schepanski, K.: Enhancing Aerosol Modeling: Integrating the Mineralogy of Mineral Dust into ECHAM_HAMMOZ, EGU General Assembly 2025, Vienna, Austria, 27 Apr–2 May 2025, EGU25-16684, https://doi.org/10.5194/egusphere-egu25-16684, 2025.

EGU25-16882 | ECS | PICO | CL4.14

Magnetic minerals in atmospheric Saharan dust  

Iida Kostamo, Johanna Salminen, Anu Kaakinen, Outi Meinander, Antti Penttilä, and Karri Muinonen

Atmospheric dust is an important component of the global climate system. It has large-scale effects on the planetary radiation budget, the albedo of snow/ice, and biogeochemical cycles. Despite this, particularly the magnetic minerals in atmospheric dust have been poorly described in aerosol models. The absorption effects of magnetic particles can be comparable to black carbon, they promote ice nucleation and therefore play a role in cloud formation, and they increase the input of iron into ocean ecosystems. We aim to contribute to characterizing these dust particles and their source areas, long-range transport, and scattering effects.  

The research material consists of Saharan dust deposited on snow in Finland, collected as an extensive citizen science campaign by the Finnish Meteorological Institute during 2021. The first results regarding the dust samples were published by Meinander et al. (2023). The multidisciplinary study showed that the dust originated from the Sahara and the Sahel regions (south of Sahara), based on the magnetic properties of the particles, and the System for Integrated modeLling of Atmospheric coMposition (SILAM) model. The results form the basis for the present project.  

A detailed magnetic characterization of the dust samples is one of the main objectives. Identifying properties such as the types and grain sizes of the magnetic particles is crucial in indicating the source area of the dust and improving the light scattering and absorption models of dust. Magnetic measurements, including initial susceptibility with two frequencies, anhysteretic remanence, and isothermal remanence, have been carried out for a set of 47 dust samples. The preliminary results are in good agreement with the previously published magnetic analyses (Meinander et al. 2023), showing signs of the presence of both Saharan and anthropogenic dust.  

In the future, the scattering and absorption of light by the dust particles will be studied both experimentally and theoretically. The existing numerical methods will be extended for the treatment of magnetic particles, particularly. 


Meinander, O., Kouznetsov, R., Uppstu, A. et al. African dust transport and deposition modelling verified through a citizen science campaign in Finland. Sci Rep 13, 21379 (2023). https://doi.org/10.1038/s41598-023-46321-7 

How to cite: Kostamo, I., Salminen, J., Kaakinen, A., Meinander, O., Penttilä, A., and Muinonen, K.: Magnetic minerals in atmospheric Saharan dust , EGU General Assembly 2025, Vienna, Austria, 27 Apr–2 May 2025, EGU25-16882, https://doi.org/10.5194/egusphere-egu25-16882, 2025.

EGU25-17479 | ECS | PICO | CL4.14

A 21-year evaluation of MODIS Aerosol Optical Depth retrievals during Icelandic dust events 

Sam Poxon, Matthew Baddock, and Joanna Bullard

The wind-blown entrainment, transportation, and deposition of mineral dust originating in the high latitudes plays a significant role in atmospheric, cryospheric, marine and terrestrial environments at the regional scale. However, the intermittent nature of dust events occurring over broad spatial scales is difficult to capture from field studies alone. Remote sensing datasets are well-suited to overcoming some of these spatial limitations, and while they have been effectively used to characterise and understand dust activity across the major global hotspots, they lack application in high latitude dust regions. The use of surface observations of dust, such as those recorded at meteorological stations, is an important step in assessing the value of data retrieved from space. Meteorological observations have an established application in monitoring wind erosion and dust activity at broad spatial and temporal scales, however their use as a comparative method for evaluating data retrieved from remote sensing remains under explored.

This research presents the first systematic comparison of remotely-sensed data and ground-based present weather dust codes for a high latitude region, using Iceland as a case study. Remote sensing datasets including Aerosol Optical Depth, Angstrom Exponent and Single Scattering Albedo are derived from the MODIS Level-2 Aerosol Product at 10 km resolution, has and have been evaluated against coded present weather reports of dust obtained from 23 Icelandic meteorological stations for the study period 2001 – 2022. Preliminary analysis indicates that Aerosol Optical Depth is elevated for dust constrained days which allows some inference about the seasonality of dust activity.  Further comparative testing of ground-based and remotely-sensed data may create opportunities for better understanding the opportunities and limitations associated with remote sensing of high latitude dust activity in regions where ground-based data are not available.

How to cite: Poxon, S., Baddock, M., and Bullard, J.: A 21-year evaluation of MODIS Aerosol Optical Depth retrievals during Icelandic dust events, EGU General Assembly 2025, Vienna, Austria, 27 Apr–2 May 2025, EGU25-17479, https://doi.org/10.5194/egusphere-egu25-17479, 2025.

EGU25-20931 | ECS | PICO | CL4.14

Is there a link between modelled mineral dust hematite content and lidar measured intensive optical properties? 

Sofía Gómez Maqueo Anaya, Dietrich Althausen, Julian Hofer, Moritz Haarig, Ulla Wandinger, Bernd Heinold, Ina Tegen, Matthias Faust, Holger Baars, Albert Ansmann, Ronny Engelmann, Annett Skupin, Birgit Hesse, and Kerstin Schepanski

Mineral dust aerosols are composed of a complex mixture of various minerals that vary by source region. Notably, the iron oxide fraction differs yielding to differences in the dust absorbing properties in the UV-VIS spectrum due to changes in the imaginary parts of the complex refractive index.

This study investigates whether variations in the Saharan dust’s iron oxide content have led to measurable variations in the backscattering properties of dust particles, which is indicated by laboratory measurements and theoretical models. This work combines modelled mineralogical data using the regional dust model COSMO-MUSCAT with vertically resolved lidar measurements conducted in Cabo Verde, located in the tropical Atlantic Ocean off the west coast of Northern Africa.

The results include comparisons between the modelled iron oxide content and lidar resolved intensive optical properties, such as the lidar ratio (extinction-to-backscattering ratio), the backscatter-related Ångström exponent (ÅE), and the particle depolarization ratio. Dust plumes were analysed over two northern hemispheric summer campaign periods in 2021 and 2022. The findings reveal that the strongest correlations were observed between the modelled iron oxide mineral content and the backscatter-related ÅE. This supports the idea that variations in dust iron oxide content influence this intensive optical property at UV-VIS wavelengths, even though the backscatter-related ÅE is regarded to indicate mainly the particle size.

This study provides a framework for further exploring the influence of a varying hematite content on the backscattering properties of dust in the UV-VIS wavelength range. Establishing certainty with regards to dust optical properties, particularly at these wavelengths, is essential for improving calculations of dust radiative impact.

How to cite: Gómez Maqueo Anaya, S., Althausen, D., Hofer, J., Haarig, M., Wandinger, U., Heinold, B., Tegen, I., Faust, M., Baars, H., Ansmann, A., Engelmann, R., Skupin, A., Hesse, B., and Schepanski, K.: Is there a link between modelled mineral dust hematite content and lidar measured intensive optical properties?, EGU General Assembly 2025, Vienna, Austria, 27 Apr–2 May 2025, EGU25-20931, https://doi.org/10.5194/egusphere-egu25-20931, 2025.

BG0 – Inter- and Transdisciplinary Sessions

EGU25-1469 | Orals | EOS3.1

Cata de Ciencia: Bridging the Gender Gap in STEM Through Community Engagement and Visibility 

Carme Huguet and Soraya Polanco Palomar

Cata de Ciencia: Bridging the Gender Gap in STEM Through Community Engagement and Visibility

The persistent gender gap in Science, Technology, Engineering, and Mathematics (STEM) has hindered diversity and innovation for decades. Women and girls are consistently underrepresented in these fields, limiting their career trajectories and obstructing the development of inclusive, diverse solutions for global challenges. Increasing the visibility of female role models has been identified as a critical strategy to address this disparity (e.g. Carter et al., 2018; Halili & Martin, 2019). However, studies show that women in STEM are often more vulnerable to stereotypes and biases, particularly when presenting their work in public forums (e.g. Carter et al., 2018; McKinnon & O’Connell, 2020). Cata de Ciencia aims to foster a supportive environment to promote women in STEM by showcasing their achievements and engaging a diverse local audience. This initiative combines public science communication with gender equity goals. Monthly events held in Segovia, Spain, feature presentations by local women scientists, followed by interactive discussions with the audience in an informal setting accompanied by wine and tapas. The format promotes accessibility, relatability, and inclusivity, addressing the stereotype that scientific excellence is exclusive to men or specific cultures (Carter et al., 2018; McKinnon & O’Connell, 2020). The project pursues two main objectives: increasing the visibility of women in STEM within the region of Castilla y León and promoting the dissemination of science to the public in a welcoming, interactive format. 

References
Carter, A. J., Croft, A., Lukas, D., & Sandstrom, G. M. (2018). Women’s visibility in academic seminars: Women ask fewer questions than men. PloS one, 13(9), e0202743.
Halili, M. A., & Martin, J. L. (2019). How to Make the Invisible Women of STEM Visible. Australian Journal of Chemistry, 73(3), 75-77.
McKinnon, M., & O’Connell, C. (2020). Perceptions of stereotypes applied to women who publicly communicate their STEM work. Humanities and Social Sciences Communications, 7(1).

How to cite: Huguet, C. and Polanco Palomar, S.: Cata de Ciencia: Bridging the Gender Gap in STEM Through Community Engagement and Visibility, EGU General Assembly 2025, Vienna, Austria, 27 Apr–2 May 2025, EGU25-1469, https://doi.org/10.5194/egusphere-egu25-1469, 2025.

EGU25-5760 | Posters on site | EOS3.1

The evolving diversity of the geodynamics community: Ada Lovelace workshop participants from 1987 to 2024 

Juliane Dannberg, Iris van Zelst, Anne Glerum, Adina Pusok, Fabio Crameri, and Cedric Thieulot

STEM fields in Europe and across the globe are not balanced in terms of gender, ethnic and racial groups, sexual orientation and other aspects of diversity (e.g. Fry et al. 2021, Freeman 2018). For example, in 2018, women made up over 40% of European academic staff, but in 2019 only 26.2% of full professors were women, less than 25% were heads of institutes, and only 31.1% board members (EC She figures 2021). This under-representation has caused academic institutions to implement new hiring practices, unconscious bias training, and intervention programs (e.g. Palid et al. 2023), as science and innovation thrive on diversity in expertise and experience. However, diversity varies across fields, and understanding field specific data is critical to propose and evaluate effective measures. Here, we wish to look inward and assess our own scientific discipline of computational geodynamics. We specifically use a recurring international conference in our fieldnow called the Ada Lovelace Workshop on Modelling Mantle and Lithosphere Dynamicsas a proxy for our field. This conference series has taken place in various European countries at a roughly two-year interval since 1987. 

For all listed attendees, we have collected gender, year of highest degree obtained, primary country and institute of affiliation at the time of the conference, presentation type and organisational role in the conference based on information available online, such as the workshop program booklets and institute, ORCID, Google Scholar and social media profiles. Using this dataset, we analysed the diversity in gender, career stage and country of affiliation of each conference overall, of the local and science organization committees and of the invited speakers. Based on the available data, we cannot make any inferences about other aspects of diversity. 

We show that over the last 38 years, the participation of women has increased from about 10% to about 35%. The percentage of women attendees has increased across all career stages, but fluctuates for established scientists. The number of invited woman speakers has also increased: whereas between 2000 and 2010, three out of the five conferences did not have any woman invitee, from 2015 to 2024, consistently more than 25% of the invited speakers were women. The number of primary countries of affiliation has approximately doubled over three decades. As expected, the majority of attendees work in Europe and a substantial fraction of participants is from North America, but contributions from scientists in Asia and Africa have increased. Given the rate over the last four decades, we project that gender equality in participants will be reached in 2040.


European Commission RTD, She figures 2021Gender in research and innovation: Statistics and indicators, 2021, https://data.europa.eu/doi/10.2777/06090.

Freeman, J. (2018). LGBTQ scientists are still left out. Nature 559, 27-28.

Fry, R., Kennedy, B., & Funk, C. (2021). STEM jobs see uneven progress in increasing gender, racial and ethnic diversity. Pew Research Center1.

Palid, O., Cashdollar, S., Deangelo, S., Chu, C., & Bates, M. (2023). Inclusion in practice: A systematic review of diversity-focused STEM programming in the United States. Int. J. STEM Educ., 10(1), 2.

How to cite: Dannberg, J., van Zelst, I., Glerum, A., Pusok, A., Crameri, F., and Thieulot, C.: The evolving diversity of the geodynamics community: Ada Lovelace workshop participants from 1987 to 2024, EGU General Assembly 2025, Vienna, Austria, 27 Apr–2 May 2025, EGU25-5760, https://doi.org/10.5194/egusphere-egu25-5760, 2025.

EGU25-6072 | Orals | EOS3.1

Autistic Voices in Geoscience: Lessons to enhance inclusive practice 

Adam Jeffery, Steven Rogers, Kelly Jeffery, Mark Lucherini, Julie Hulme, Martin Griffin, Elizabeth Derbyshire, Kristopher Wisniewski, Jamie Pringle, Catherine Hallam, Isobel Stemp, Lisa Lau, and Liam Bullock

Autism is a lifelong developmental condition which impacts how individuals communicate and interact with the world around them and is simultaneously recognised broadly as a form of neurodivergence and protected legally as a disability (e.g. U.K. Equality Act 2010). Autism frequently remains under-represented and un-disclosed in academia, despite it having no impact on intelligence. In fact, many autistic traits such as problem-solving skills and thinking ‘outside the box’ should be conducive to success in academia.

The field of Geoscience is currently facing significant scrutiny for a lack of diversity. This study contributes to this by investigating the experiences of geoscience students in U.K. higher education, using a novel qualitative methodology designed to be inclusive for autistic participants. Forty self-identified autistic geoscience students took part in semi-structured asynchronous discussions over a period of one month, sharing their self-perceptions, experiences of learning in geoscience, university life, support in higher education, and other issues that they wished to discuss.

Data were analysed using reflexive thematic analysis, generating three themes: (1) Being me; (2) Interacting with the world around me; (3) Facilitating change. Participants stressed the need to recognise the diversity of autistic experiences, and suggested a number of recommendations that would improve their learning and wider higher education experiences, including training to enhance the fundamental understanding of autistic people. The outcomes of this study can help provide actionable recommendations for educators and institutions to better address the challenges faced by autistic learners. This will ultimately facilitate better inclusivity in geoscience-based higher education and lead to improved success and well-being for autistic people in the geosciences.

How to cite: Jeffery, A., Rogers, S., Jeffery, K., Lucherini, M., Hulme, J., Griffin, M., Derbyshire, E., Wisniewski, K., Pringle, J., Hallam, C., Stemp, I., Lau, L., and Bullock, L.: Autistic Voices in Geoscience: Lessons to enhance inclusive practice, EGU General Assembly 2025, Vienna, Austria, 27 Apr–2 May 2025, EGU25-6072, https://doi.org/10.5194/egusphere-egu25-6072, 2025.

No geoscientist is an island. It is not good practice for a geoscientist to act in isolation; rather, geoscientists need to be part of a welcoming community to thrive.  How a professional geoscientist interacts with other geoscientists, non-geoscientists and society is essential for building a culture and environment of conscious inclusion by celebrating the diversity of one and all.  This means proactively creating environments where geoscientists and others can collaborate and feel comfortable communicating openly. Recognizing and understanding how unconscious bias and privileges can create divisions and foster negative professional (toxic) environments.  The presentation will look beyond professional bodies’ codes of conduct, and it will introduce what Equity, Diversity, and Inclusion and Accessibility (EDIA) means. These concepts are vital to consider from the attraction, retention, and progression of professional geoscientists and the reputation of the communities we represent. Several self-awareness exercises will also be shared to explore potential, implicit bias.


How to cite: Griffin, M.: Embedding Equity, Diversity, Inclusion and Accessibility (EDIA) within a Professional Geoscientist’s Lifestyle, EGU General Assembly 2025, Vienna, Austria, 27 Apr–2 May 2025, EGU25-6886, https://doi.org/10.5194/egusphere-egu25-6886, 2025.

EGU25-6932 | Posters on site | EOS3.1

Status and Progress of Equality, Diversity and Inclusivity at EGU General Assemblies 

Johanna Stadmark, Alberto Montanari, and Lisa Wingate

The EGU recognises the importance of equality, diversity, and inclusion as a crucial foundation for scientific research. The increasing diversity of our membership in all its facets fosters collaborative research and discovery that benefits humanity and our planet and contributes to reaching the goal of addressing global challenges.

The EGU EDI Committee, since its foundation in 2021, is actively promoting diversity in the EGU initiatives and community. The aim of the EDI Committee is to promote equality, diversity and inclusivity with a broad vision and a global approach, by working with sister associations.

The EDI Committee tasks currently include: (1) Promoting the EGU vision of EDI via an integrated, co-ordinated and constructive approach; (2) 
Raising awareness of the value of EDI within the scientific community; (3) Organising sessions and meetings dedicated to EDI issues as part of the EGU General Assembly, and at other conferences and meetings organised by EGU and its sibling societies; (4) Representing EGU on relevant initiatives focusing on EDI in the geosciences; (5) Providing constructive suggestions and ideas to the EGU Council to promote EDI within the organisation, and the geosciences in general.

The most recent achievements of EDI@EGU are the Champion(s) for Equality, Diversity and Inclusion Award that is bestowed to recognize excellent contributions to put into exemplary practice the principles of EDI. Furthermore, a new travel support scheme to promote diversity at the EGU General assemblies, is first activated in 2025.

The above actions resulted in a more diverse attendance at EGU General Assemblies along the years. The total number of presenters has increased over the time period 2015-2024, and this increase was observed throughout all career stages. The proportion of women presenters has increased from 2015 to 2024.

In the hybrid meeting in 2024 approximately 90% of the participants attended in Vienna. A slightly higher proportion of the oldest (>75 years) and youngest (18-25 years) participants attended online. While there were no differences in how women and men participated (online or physically), there are differences connected to the country affiliations. The great majority of participants from countries in most of western Europe, Asia and North America attended in Vienna, while more participants from other continents attended online.

We aim to analyse the changes in demographics with regards to gender, career stage as well as to geographical distribution of the presenters and participants also in coming years to better understand the potential impacts of meetings organized online or physically, or as a combination of both these modes.

How to cite: Stadmark, J., Montanari, A., and Wingate, L.: Status and Progress of Equality, Diversity and Inclusivity at EGU General Assemblies, EGU General Assembly 2025, Vienna, Austria, 27 Apr–2 May 2025, EGU25-6932, https://doi.org/10.5194/egusphere-egu25-6932, 2025.

EGU25-6963 | ECS | Posters on site | EOS3.1

A new hybrid video & seminar series: Season 3 of Science Sisters is on its way!  

Marina Cano Amoros and Iris van Zelst

Science Sisters is a YouTube video and seminar series hosted by Dr. Iris van Zelst. Lighthearted in tone, it explores different career paths, academic life, and science communication in the planetary and geosciences. The guests on the show represent a range of role models to celebrate the diversity of people working in STEM. They are interviewed by Iris on their personal experiences on different topics. Past seasons have included topics like ethical fieldwork, switching careers, science communication, postdoc life, leadership, women in science, job applications, postdoc hopping, outreach, publishing, feeling incompetent, astronaut training, toxic academia, and how to build a research group.

We are now proud to announce that the production of season 3 of Science Sisters has wrapped and post-production, such as the editing of the videos, is in full swing. Anticipated to launch in fall 2025, the new season of Science Sisters will consist of the traditional interview videos and a hybrid online seminar where a viewing party of the episode is combined with an after-show discussion between Iris, the guest, and any research groups and individuals interested in joining.

This hybrid form of Science Sisters has proven to kickstart conversations in institutes and increase the cohesion within institutes by creating a more understanding atmosphere. Early career scientists in particular say that Science Sisters is extremely useful to learn about life as a researcher and they enjoy the chatty, entertaining quality of the interviews.

In season 3, the main topics across our 7 episode series are:

• PhD life

• Failure (and how to deal with it)

• Working at NASA

• Motivation (or lack thereof)

• Science management

• Lab work

• Academic motherhood

Of course, each episode also features individual experiences of (non-)academic career paths to show the diversity of ways in which people can interface with science and work in academia.

Using the hybrid form of videos and online webinars, Science Sisters therefore continues to contribute to promoting and supporting inclusivity in the planetary and geosciences. 

How to cite: Cano Amoros, M. and van Zelst, I.: A new hybrid video & seminar series: Season 3 of Science Sisters is on its way! , EGU General Assembly 2025, Vienna, Austria, 27 Apr–2 May 2025, EGU25-6963, https://doi.org/10.5194/egusphere-egu25-6963, 2025.

For many geoscientists, participating in conferences are vital for their career as they provide access to state-of-the-art knowledge in their research field but also provide opportunities to share their own results whilst expanding their research network.

However, the opportunity to attend large geoscience conferences for many researchers often comes at a significant financial burden. In particular, researchers that have caring responsibilities, disabilities or experience temporary unemployment often find it a financial challenge to cover the extra costs incurred for conference participation from research project budgets or from their affiliated research institutions. This not only places a strain on those geoscientists already facing financial hardship, but it also leads to the exclusion of researchers from career-defining meetings.

In 2025, the EGU launched a new EDI Participation Support Scheme for EGU members with the aim of addressing this inequity. This support scheme aims to provide financial assistance to scientists in the Earth, planetary, and space sciences who encounter significant EDI-related financial barriers that prevent them from participating to the EGU General Assembly because of caregiving responsibilities, disability and special needs as well as temporary geoscience career transitions. In this presentation, we will provide valuable information about this new support scheme and encourage the community to raise awareness of these financial burdens with their colleagues, research institutions and research funders.

How to cite: Wingate, L., Hart, J., Turton, J., and Jacobs, P.: Tackling EDI-related financial barriers that reduce inclusivity at geoscience conferences with the EGU EDI Participation Support Scheme, EGU General Assembly 2025, Vienna, Austria, 27 Apr–2 May 2025, EGU25-7140, https://doi.org/10.5194/egusphere-egu25-7140, 2025.

EGU25-7701 | Orals | EOS3.1

Inclusive scientific meetings need alternative modes of participation 

Jens Klump, Vanessa Moss, Rika Kobayashi, Lesley Wyborn, Stefanie Kethers, and Coralie Siegel

Major sporting events, like the Summer Olympics or the FIFA World Cup, attract a global audience of billions of spectators. While many agree that watching the Olympic Games in one of its venues is the best way to experience the event, less than one per mille of the billions worldwide audience can attend in person. The majority watch such events at public events, at home with families and friends, or by themselves on their mobile devices. All these different modes of watching the Olympics allow a global audience access to a major sporting event.

International research meetings were forced into mainly online modes by the COVID-19 pandemic during 2020-2022. While the availability of online formats was initially high, it has since dropped, and only a small fraction of meeting organisers have made efforts to develop new formats that offer value to online participants. At the same time, the poor quality of virtual options and the “rush back to normal” contributed to a drop in virtual participant numbers. This is a missed opportunity; it disregards the high environmental costs of large international meetings and favours those who can afford the high costs and time commitment of international travel and are, therefore, already advantaged. For many in the Global South, attending international conferences offered as in-person-only events is almost impossible, widening the gap in their ability to participate in global science.

While technologies for alternative modes of participation exist, many organisers of conferences cite the excessive cost and a lack of interest as barriers. Financial modelling by a major conference provider showed that offering alternative participation modes adds approximately five to ten per cent to the cost of running a conference, which can be easily offset by attracting additional participants. However, conflicting aims exist between conference organisers wanting to offer alternative participation modes but also having to be financially sustainable, as well as conference venues and tourism boards, who want to maximise the number of participants on-site. It has been reported that tourism boards and conference venues use subsidies and overpriced equipment to discourage alternatives to on-site participation.

For their 2024 Annual Scientific Meeting, the Astronomical Society of Australia organised an “online-first” conference with a location-specific “Hub Day” during the week to offer space for in-person interactions. As this example shows, there are many opportunities to innovate by blending in-person, hybrid, and online formats and adopting new technologies (see, e.g., https://thefutureofmeetings.wordpress.com), including local or regional hubs where participants can gather to discuss and network. Alternative modes are already being used successfully by communities in other areas of society to bring people together and the scientific community is lagging behind. We could draw inspiration from completely different types of events, like games, international sports or cultural events. This presentation is about how we can make research meetings more accessible, inclusive, and sustainable by being more creative about modes of participation and thinking outside the box. 

How to cite: Klump, J., Moss, V., Kobayashi, R., Wyborn, L., Kethers, S., and Siegel, C.: Inclusive scientific meetings need alternative modes of participation, EGU General Assembly 2025, Vienna, Austria, 27 Apr–2 May 2025, EGU25-7701, https://doi.org/10.5194/egusphere-egu25-7701, 2025.

EGU25-9552 | ECS | Posters on site | EOS3.1

Positive and Negative Academic Workplace Behaviors:  Experiences Gathered at a Scientific Conference 

Nahid Atashi, Anni Hartikainen, Laura Salo, Ilona Ylivinkka, Muhammad Shahzaib, Miikka Dal Maso, and Katja Anniina Lauri

We organized an informal equality, diversity and inclusion (EDI) themed reception for the attendees of the European Aerosol Conference (EAC) 2024 to encourage reflection and sharing of both positive and negative behaviors observed in academic workspaces. 

The event was held in a private venue near the conference site. The three-hour event featured a combination of short talks, a presentation on current and past EDI initiatives within the Finnish aerosol science community, and informal discussions in small groups. The relaxed setting fostered open dialogue and active participation. 

During the event, attendees were invited to anonymously write about their personal experiences at their workspace on sticky notes and attach them to a poster displayed throughout the reception. This interactive approach provided a safe space for participants to voice their thoughts and experiences, which remained visible for collective reflection until the event concluded. 

The collected messages were categorized into two main themes. Positive Aspects included respect and inclusion, supportive environments, social connections, and practical guidance. Negative Aspects highlighted challenges such as discrimination, exclusion, judgment, and unproductive atmospheres. Combined insights collected within this activity provide a clear understanding of workplace dynamics, offering valuable perspectives for promoting equity and addressing areas of concern within academic environments.

How to cite: Atashi, N., Hartikainen, A., Salo, L., Ylivinkka, I., Shahzaib, M., Dal Maso, M., and Lauri, K. A.: Positive and Negative Academic Workplace Behaviors:  Experiences Gathered at a Scientific Conference, EGU General Assembly 2025, Vienna, Austria, 27 Apr–2 May 2025, EGU25-9552, https://doi.org/10.5194/egusphere-egu25-9552, 2025.

Transition services are essential for supporting students with intellectual disabilities (ID) as they prepare for independent adult lives. While special education teachers in both the United States and Korea acknowledge the importance of providing these systematic services, their actual implementation varies widely due to differing teacher backgrounds and numerous barriers. This study examines these barriers through the lens of Windschitl's framework, which categorizes dilemmas into four types: conceptual, pedagogical, cultural, and political. These dilemmas serve as a foundation for understanding why teachers struggle to implement transition services, even when they recognize their significance.

Focusing on the Korean context, this study explored the experiences of special school teachers working with students with ID and identified additional dilemmas beyond those categorized by Windschitl. To achieve this, qualitative in-depth interviews were conducted with 35 special school teachers currently implementing transition services. Using the constant comparative method, the data was analyzed to uncover key categories, their properties, and how these elements interconnect.

The findings revealed that Korean teachers viewed transition services as vital for equipping students with ID with the skills necessary for employment, societal integration, and independence. However, despite understanding their importance, teachers reported low implementation levels due to various challenges. These included limited resources, insufficient professional development, lack of collaboration among stakeholders, and inadequate institutional support.

Rather than placing blame on teachers for the low implementation of transition services, the study emphasizes the need to create supportive environments. Collaborative efforts among school administrators, parents, policymakers, and disability organizations are critical to fostering conditions where teachers can succeed. Furthermore, investing in professional training and strengthening educational and social infrastructure would significantly enhance teachers’ capacity to provide effective transition services.

By addressing these systemic issues, this study underscores the importance of supporting special educators in their efforts to improve outcomes for students with ID, ultimately enabling them to transition successfully into adulthood.

How to cite: park, Y.: Exploring Barriers and Dilemmas in Transition Services: Insights from Korean Special Education Teachers for Students with Intellectual Disabilities, EGU General Assembly 2025, Vienna, Austria, 27 Apr–2 May 2025, EGU25-10224, https://doi.org/10.5194/egusphere-egu25-10224, 2025.

EGU25-10372 | Posters on site | EOS3.1

Inclusive excellence at the ERC: demographic data on external reviewers and eligibility extensions 

Claudia Jesus-Rydin, Luis Fariña-Busto, Maria Ruiz, Benoit Le Noir de Carlan, and Eystein Jansen

The European Research Council (ERC), Europe’s premier funding agency for frontier research, views equality of opportunities as an essential priority and a vital mission to ensure fairness in the review process. The ERC monitors various demographic data yearly on every call and has taken actions to tackle imbalances and potential implicit and explicit biases.

Demographic gender and geographical distribution data on external reviewers is presented. External reviewers are experts who support ERC evaluation panels by externally reviewing proposals in their fields of specialization. The analysis focuses on the rates of nomination and invitation of these experts, as well as rates of acceptance and completion of the reviews. The data is presented by call and by scientific domain. In the current framework programme (Horizon Europe, 2021-2027), 24% of nominated external reviewers were women, 75% were men and 1% are non-binary. Acceptance and completion rates for men and women are similar.

Furthermore, data on requests of the eligibility window extensions are included. During the grants’ application process, the ERC allows potential grantees to extend the eligibility window, both for Consolidator and Starting Grants. These extensions are conditional on certain circumstances (e.g. parental leave, long-term illness, or clinical training). These circumstances and conditions constantly evolve. In this way, to better comprehend and monitor these requests, the ERC recently started an in-depth analysis of such data, gathered between 2021 and 2024. The data are disaggregated by year, gender, and by grant type. The analysis shows that there is a clear disparity between women researchers and men researchers when requesting extensions; both in terms of numbers and circumstances.

The ERC knows that work to ensure inclusive excellence and equality of opportunities is never-ending. This presentation analyses the institutional efforts, procedures and critically discusses the results.

How to cite: Jesus-Rydin, C., Fariña-Busto, L., Ruiz, M., Le Noir de Carlan, B., and Jansen, E.: Inclusive excellence at the ERC: demographic data on external reviewers and eligibility extensions, EGU General Assembly 2025, Vienna, Austria, 27 Apr–2 May 2025, EGU25-10372, https://doi.org/10.5194/egusphere-egu25-10372, 2025.

EGU25-11159 | ECS | Orals | EOS3.1

The Citation Gap: An overview of academic output in the field of Natural Hazards and Climate Extremes analysed through Google Scholar data 

Shakti Raj Shrestha, Leonardo Olivetti, Shivang Pandey, Koffi Worou, and Elena Rafetti

There has been a significant increase in both the number of publications and number of citations in the last decade partly fueled by the increased exposure to research papers and such as Google Scholar, Web of Science, ResearchGate, etc. The large data set of scientific literature and respective authors in these platforms can be utilized to get a broad overview of academic discourse. This project aims to investigate the state of academia in the field of Natural Hazards and Climate Extremes using Google Scholar data. A comprehensive set of relevant tags (such as earthquake, volcano, natural hazards, climate extremes etc.) were used to filter the researchers. Additionally, a threshold of 500 citations or more was applied to focus on the most influential academics in this field. We limited the analysis to the period 1990-2023 and subsequently stratified the obtained results by gender (as perceived by the authors) and country of affiliation of the researchers. Data for number of publications was also collected for each of the researchers.

Among 2612 researchers identified, 77.2% are male, 22.6% female, and 0.2% could not be categorized into male or female. Male researchers, on average, received a larger median number of citations compared to women even though the gender citation gap in percentage has been decreasing over the last decade. Notably, regression analysis showed that, there is limited difference in number of citations per publication between the two genders. The data also shows that 78.5% of citations are attributed to researchers in high-income countries, 14.4% for those in middle-income countries, and 7.1% for those in low-income countries despite researchers in low- and middle-income countries publishing more papers per year, on average, than their counter parts in high-income countries. The researchers from high-income countries also get larger number of citations per author, on average, even when controlling for number of publications. However, the citation gap between high-income and low- and middle-income countries has narrowed in recent years. Interestingly, the observed citation gap between researchers is more pronounced due to income group than gender. In conclusion, even though disasters affect poor countries and women disproportionately, the fact that the field of natural hazards and climate extremes is largely high-income country and male-dominated raises fundamental questions on teh epistemology and legitimacy of the scientific knowledge that has been generated. 

How to cite: Shrestha, S. R., Olivetti, L., Pandey, S., Worou, K., and Rafetti, E.: The Citation Gap: An overview of academic output in the field of Natural Hazards and Climate Extremes analysed through Google Scholar data, EGU General Assembly 2025, Vienna, Austria, 27 Apr–2 May 2025, EGU25-11159, https://doi.org/10.5194/egusphere-egu25-11159, 2025.

EGU25-12317 | Orals | EOS3.1

Equity in Geoscience Publishing: Indigenous Data Governance and Tackling Parachute Science 

Tanya Dzekon, Matt Giampoala, Paige Wooden, and Mia Ricci

Addressing under-representation and inequity in geoscience requires action from all participants of the scientific ecosystem. The collaborative and global nature of our science impels us to create systemic changes to better include historically marginalized voices. This work includes correcting the power imbalances that exist within scholarly publishing through equity-focused policy changes and through collaborations with communities. We will highlight AGU Publications’ recently launched Inclusion in Global Research Policy (an authorship policy to improve equity and transparency in international research collaborations and to help address the issue of parachute science), as well as work to create Guidelines for the Governance of Indigenous Data in Scientific Publishing (a partnership between the Collaboratory for Indigenous Data Governance, ENRICH, Te Kotahi Research Institute, the American Geophysical Union, the National Information Standards Organization, and AGU).

How to cite: Dzekon, T., Giampoala, M., Wooden, P., and Ricci, M.: Equity in Geoscience Publishing: Indigenous Data Governance and Tackling Parachute Science, EGU General Assembly 2025, Vienna, Austria, 27 Apr–2 May 2025, EGU25-12317, https://doi.org/10.5194/egusphere-egu25-12317, 2025.

EGU25-13088 | ECS | Orals | EOS3.1

Practical implementation of diversity and inclusion measures in large EU Horizon projects: lessons learned from Geo-INQUIRE. 

Elif Türker, Iris Christadler, Fabrice Cotton, Alice-Agnes Gabriel, Fatemeh Jalayer, Mateus Litwin-Prestes, Angelo Strollo, Stefanie Weege, Elisabeth Kohler, Mariusz Majdański, and Laura Sandri

Geo-INQUIRE, an EU Horizon project starting in 2022, brings together 51 partners, including high-level research institutes, universities and European consortia from different EU countries. The project aims to improve access to selected key data, products and services to monitor and model the dynamic processes within the geosphere at new levels of spatial and temporal detail and accuracy. With 150 Virtual Access (VA) and Transnational Access (TA) facilities, together with tailored mentoring programs, including workshops (both online and face-to-face), trainings and seminars, Geo-INQUIRE has brought together over 2,300 researchers in the past two years, offering 20 training events and 7 workshops attended by participants from over 70 countries. While in total 44% of these participants have been female, this number reflects the project’s ongoing commitment to gender balance, inclusion and diversity, but also acknowledges that further progress is still desired.

Despite the projects complexity due to high number of partner institutions, several strategies have been implemented to foster inclusion. These include the unique establishment of an independent advisory committee (EDIP), assigning an EDIP member (by rotation) as ex-officio member of Transnational Activity Review Panel (TARP), thinking of strategies to reduce unconscious bias in review of TA applications, setting targets for female participation and researchers from Horizon’s widening countries, offering travel support and affordable accommodation to reduce financial barriers, recording of online training events to enable access and maximise flexibility. Additionally, novel recruitment practices, supportive workplace policies and efforts to increase female representation in leadership roles have been introduced. Geo-INQUIRE also fosters inclusion across a wide range of career backgrounds (including less conventional career paths) and brings together researchers from diverse scientific disciplines—such as solid earth, marine science, and carbon capture and storage - as well as those with technical expertise in IT. Strategies such as seminars have proven effective in bridging these gaps and reducing barriers between different fields. We will present examples of these actions, discuss lessons learned and propose example guidelines for promoting diversity in large-scale research projects.

How to cite: Türker, E., Christadler, I., Cotton, F., Gabriel, A.-A., Jalayer, F., Litwin-Prestes, M., Strollo, A., Weege, S., Kohler, E., Majdański, M., and Sandri, L.: Practical implementation of diversity and inclusion measures in large EU Horizon projects: lessons learned from Geo-INQUIRE., EGU General Assembly 2025, Vienna, Austria, 27 Apr–2 May 2025, EGU25-13088, https://doi.org/10.5194/egusphere-egu25-13088, 2025.

The geosciences are at a pivotal moment as institutions, organizations, and individuals confront long-standing inequities to create a more inclusive and representative future. As a geoscientist actively engaged in equity, diversity, and inclusion (EDI) initiatives, I have witnessed both the barriers and breakthroughs shaping this transformation. Notably, the geosciences have some of the poorest metrics for diversity, equity, and inclusion (DEI) in STEM disciplines. Guided by the principle, “What gets measured, gets done,” my work has focused on quantifying EDI impacts to drive meaningful progress.
Drawing on my role as an executive member of the Canadian Geophysical Union’s EDI Committee, I will present key findings from a comprehensive EDI report on representation statistics from Canadian Geophysical Union conferences since 2018. As a director on the board of Women Geoscientists in Canada, a prominent organization supporting women in technical roles, I will highlight the challenges and successes in addressing gender imbalance and improving diversity within the mining industry.
Lastly as a federal research scientist working on critical mineral exploration and green energy transitions, I will explore how EDI efforts can advance community engagement, inclusive excellence, interdisciplinary collaboration, ethical fieldwork, and environmental justice. By sharing these experiences across government, industry, and academia, this presentation will offer actionable strategies to address barriers and inspire collaboration for a more equitable future in Canadian geosciences.

How to cite: Dave, R.: Advancing Equity in Geosciences: Insights and Actions from the Canadian EDI Landscape, EGU General Assembly 2025, Vienna, Austria, 27 Apr–2 May 2025, EGU25-14621, https://doi.org/10.5194/egusphere-egu25-14621, 2025.

EGU25-18414 | Posters on site | EOS3.1

An EDI time capsule from the 2023 Karthaus Summer School: Where do we want the glaciological community to be in 50 years? 

Lena Nicola, Rebekka Frøystad, Antonio Juarez-Martinez, Maxence Menthon, Ana Carolina Moraes Luzardi, Katherine Turner, Sally F. Wilson, and Benjamin Keisling and the Karthaus 2023 EDI team

Despite the increased awareness towards Equality, Diversity, and Inclusion (EDI), the glaciological community still experiences and perpetuates numerous examples of inappropriate and discriminatory behavior, adding to the systemic inequalities embedded in the scientific community. What are the EDI challenges we currently face within the glaciological research community? How can we overcome them? Where do we want our research community to be in fifty years? These questions were used as a starting point for a first-of-its-kind workshop at the 2023 Karthaus Summer School on Ice Sheets and Glaciers in the Climate System. Drawing on the outcomes of that workshop, we discuss the answers and challenges to addressing these questions, in the form of both actionable steps forward and imaginative visions of the future. We identified common threads from the workshop responses and distilled them into collective visions for the future. Having consulted additional literature, while formulating suggestions for improvement, stating our own commitment, and highlighting existing initiatives, contributions to this “time capsule” exercise were sorted into three main challenges we want and need to face: making glaciology more accessible, equitable, and responsible (Nicola et al, in review).

How to cite: Nicola, L., Frøystad, R., Juarez-Martinez, A., Menthon, M., Moraes Luzardi, A. C., Turner, K., Wilson, S. F., and Keisling, B. and the Karthaus 2023 EDI team: An EDI time capsule from the 2023 Karthaus Summer School: Where do we want the glaciological community to be in 50 years?, EGU General Assembly 2025, Vienna, Austria, 27 Apr–2 May 2025, EGU25-18414, https://doi.org/10.5194/egusphere-egu25-18414, 2025.

EGU25-20423 | Orals | EOS3.1

Working towards more equitable  recomendations and nomination letters: Equitable Letters for Space and Physics 

Alexa Halford, Angeline Burrell, John Coxon, McArthur Jones, Kate Zawdie, and Julie Barnam

Equitable Letters in Space and Physics (ELSP) is an organization that aims to encourage merit-based recommendations and nominations in the space physics community by providing resources and reviews. Recommendation and award nomination letters are a known source of bias that affect education and job opportunities, career progression, and recognition for scientists from underrepresented backgrounds.  ELSP was founded to combat this bias within the current system by providing a proof-reading service that focuses on identifying phrasing and structure within letters that unintentionally undermines the purpose of the missive.  If you are writing a recommendation letter for someone you know professionally, you can send it to us and we will send it out to our reviewers. They will provide recommendations on how you can make your letter more equitable and less biased, using a combination of the techniques and resources described on our site, with the aim to make unbiased recommendation letters more accessible to all. If you are interested in being a reviewer or having your writing reviewed, please reach out to us.

How to cite: Halford, A., Burrell, A., Coxon, J., Jones, M., Zawdie, K., and Barnam, J.: Working towards more equitable  recomendations and nomination letters: Equitable Letters for Space and Physics, EGU General Assembly 2025, Vienna, Austria, 27 Apr–2 May 2025, EGU25-20423, https://doi.org/10.5194/egusphere-egu25-20423, 2025.

EGU25-20788 * | Orals | EOS3.1 | Highlight

Failure to Act:  Universities’ Promising EDI Template Withering on the Vine 

Holly Stein and Judith Hannah

The triumphant implementation of equity, diversity, and inclusivity (EDI) programs in academia after more than a decade of increasing pressure and promise has brought hope to many but, unfortunately, justice to few. Enough time has passed to reveal the fraught inner workings of academia and their ability to make effective change, even as universities might be expected to lead with exemplary behavior. Sadly, the reverse is true. Failure of universities to act or react appropriately has seriously crippled EDI efforts in many academic settings. University administrators and even university presidents have lost their employment for taking EDI seriously. Those facts severely degrade the EDI landscape in academia going forward.

Stepping back and turning a scientific lens on the university environment, what are the flaws in implementation? They are rooted in human behavior and decision-making in adversarial surroundings, the recipe for fear. One might line up the course of action in three steps: (1) identifying the issues, (2) building a structure and path toward solution, and (3) establishing a university-sanctioned outcome that removes perpetual perpetrators and enables, even celebrates, those with the courage to speak up. A power relationship is almost always part of the play. Alas, though the first step is generally mastered, the second step is better known as “protecting the university at all costs”, and completion of the third step is dead rare. Rather, the rare settlement involves a victim signing away their right to talk to the press, so as not to damage the university’s reputation. This obvious three-act opera loses footing in the second act. The outcome is driven by “what is the easiest path for the university” and is too rarely driven by doing the right thing. The EDI system at most universities presents the ultimate conflict-of-interest: university lawyers are paid by the university or its governing body and thus, are indebted to them for employment and the outcomes of EDI decisions they make.

Failure to Act is a three-act play that explores the darker workings behind the academic scenery.  Can we change the storyline so that students and faculty will believe that the system works for them, should they ever need it? That is far from the standard we have now, even as sometimes generous funding has been diverted to build up EDI programming in academia. 

How to cite: Stein, H. and Hannah, J.: Failure to Act:  Universities’ Promising EDI Template Withering on the Vine, EGU General Assembly 2025, Vienna, Austria, 27 Apr–2 May 2025, EGU25-20788, https://doi.org/10.5194/egusphere-egu25-20788, 2025.

Statistical models are a frequently used tool in hydrology, especially when it comes to estimating design floods, i.e. flood events that used to design flood protection systems or reservoirs. The often complex hydrological data, which are affected by e.g. missing values, extremes or time-varying processes, require sophisticated statistical models that take these challenges into account. As a scientist, developing such models can be a lot of fun and provide interesting insights. After months of thinking about the best model under certain statistical assumptions, proving asymptotic theorems and testing the model with synthetic data, you are happy and proud to have developed a new model. This model will hopefully be widely used in future research. The next step is to apply the model to a large real data set. The results look good on average. The results will be shared with practitioners, because of course you want the model to be useful for science and practice. And then: the phone call. You are told that your results are not plausible for a certain catchment area. And in general, the new model is not needed in practice because there is an established model. This example describes such a case and discusses ways of dealing with it. It is intended to illustrate the importance of communication between science and practice and a general understanding between both sides.

How to cite: Fischer, S.: When practical considerations impact your scientific model, EGU General Assembly 2025, Vienna, Austria, 27 Apr–2 May 2025, EGU25-1620, https://doi.org/10.5194/egusphere-egu25-1620, 2025.

EGU25-1660 | Orals | EOS4.8

The Minkowski–Bouligand dimension of a clay brick 

Nick van de Giesen and John Selker

In the early 1990's, fractals and chaos were hot. In 1987, James Gleick had published "Chaos: Making a New Science", popularizing non-linear dynamics. Hydrologists played an important role in the development of fractal theory. Hurst had discovered that sequences of dry and wet years for the Nile showed very long memory effects. Instead of the chance of a dry year following a dry year being 50%, Hurst found that there were surprisingly many long series of dry or wet years. Seven fat years, seven lean years, as it is noted in Genesis. Scott Tyler found fractals in soils ("Fractal processes in soil water retention"). At Cornell, where we were at the time, David Turcotte described "Fractals in geology and geophysics". A few years later, Ignacio Rodríguez-Iturbe and Andrea Rinaldo would publish "Fractal River Basins: Chance and Self-Organization". In short, fractals were exciting scientific gold.

A fractal is not just an obscure mathematical object but something that can actually be found everywhere in nature. Early on, a paper was published in Nature with the title "Fractal viscous fingering in clay slurries" by Van Damme, Obrecht, Levitz, Gatineau, and Laroche. They "only" did an experiment on a fractal embedded in 2D; we should be able to do one better and find the fractal dimension of the surface of cracking clay embedded in 3D. So out we went, collected some clay, mixed it with water in a cement mixer, siliconed together a shallow "aquarium", and poured in the slurry. To observe the cracking of the drying slurry, a video camera was mounted above the experiment, looking down and taking time-lapse images. To access the views from the sides, mirrors were installed at 45 degrees at each of the four sides. Lights made sure the camera captured high quality images. The whole set-up was enclosed in a frame with dark cloth to ensure that lighting was always the same.  We already had some box-counting code ready to calculate the fractal dimension of the surface, called the Minkowski–Bouligand dimension. One variable needed some extra attention, namely the boundary between the clay slurry and the glass sides. If the clay would cling to the sides, it would be difficult to understand the effects that this boundary condition had on the outcome of the experiment. Moreover, the cracks may not have become visible in the mirrors when the sides were covered with mud. So, instead, it was decided to make the sides hydrophobic with some mineral oil. This ensured that when the clay would start to shrink, it would come loose from the sides. Now, all we had to do was wait. It took only a week or so before the consolidated slurry started to shrink and to come loose from the sides. After that, the clay continued shrink for many weeks. This is how we learned that the fractal dimension of a shrinking brick of clay is (very close) to 3.0. 

How to cite: van de Giesen, N. and Selker, J.: The Minkowski–Bouligand dimension of a clay brick, EGU General Assembly 2025, Vienna, Austria, 27 Apr–2 May 2025, EGU25-1660, https://doi.org/10.5194/egusphere-egu25-1660, 2025.

EGU25-5035 | Orals | EOS4.8

Landslides and hillslope erosion increase relief 

Stefan Hergarten and Jörg Robl

In 2018, we found exciting new results in landform evolution modeling by coupling the two simplest models of fluvial erosion and hillslope processes. While the stream-power incision model is the simplest model for detachment-limited fluvial erosion, the diffusion equation is the simplest description of hillslope processes at long timescales. Both processes were added at each grid cell without an explicit separation between channels and hillslopes because fluvial erosion automatically becomes dominant at large catchment sizes and negligible at small catchment sizes.

We found that increasing diffusion reduces the relief at small scales (individual hillslopes), but even increases the large-scale relief (entire catchments). As an immediate effect, the hillslopes become less steep. In turn, however, we observed that the network of the clearly incised valleys, which indicates dominance of fluvial erosion over diffusion, became smaller. So a smaller set of fluvially dominated grid cells had to erode the material entering from the hillslopes. To maintain a morphological equilibrium with a given uplift rate, the rivers had to steepen over long time. This steepening even overcompensated the immediate decrease in relief of the hillslopes.

This result was counterintuitive at first, but we were happy to find a reasonable explanation. So we even prepared a short manuscript for a prestigious  journal. We just did not submit it because we wanted to explain the effect quantitatively from the physical parameters of the model. From these theoretical considerations, we found that our numerical results did not only depend on the model parameters, but also on the spatial resolution of the model and noticed that this scaling problem was already discussed in a few published studies. Beyond the scaling problem, we also realized that applying the concept of detachment-limited fluvial erosion to the sediment brought from the hillslopes into the rivers is quite unrealistic. A later study including fluvial sediment transport and a model for hillslope processes that avoids scaling problems did not predict any increase in large-scale relief. So we finally realized that our original findings were mainly the result of a specific combination of models that should not be coupled this way and are not  as relevant for landform evolution as we thought.

This example illustrates many of the pitfalls of numerical modeling beyond purely technical issues. In particular, combining models that are widely used and make sense individually may still cause unexpected problems.


How to cite: Hergarten, S. and Robl, J.: Landslides and hillslope erosion increase relief, EGU General Assembly 2025, Vienna, Austria, 27 Apr–2 May 2025, EGU25-5035, https://doi.org/10.5194/egusphere-egu25-5035, 2025.

EGU25-5091 | ECS | Orals | EOS4.8

(Re)(De)bugging tragedies with Hector 

Guillemette Legrand

In this presentation, I will discuss my research into the simple climate model Hector, which calculates temperature change based on the impact of various climate scenarios. More specifically, I will discuss how an artistic-led approach through (un)voluntary-caused computational bugs can help document the model's logic and socio-political implications. I will describe methods for collective 'debugging' to produce transdisciplinary knowledge (beyond solely scientific inquiry) to foster conversation about the potential and limits of current climate infrastructure to foster concrete climate actions. This research investigates the field of climate science through artistic practice, software and infrastructure studies, and participatory methods. To expand on the role of bugs in my investigation, I will elaborate on concrete examples of differences in perception of 'error' in the fields of arts and science, looking at case studies where mistakes or glitches have been valorised and mobilised through artistic practice to grapple with, appropriate, and/or repurpose scientific instruments.

How to cite: Legrand, G.: (Re)(De)bugging tragedies with Hector, EGU General Assembly 2025, Vienna, Austria, 27 Apr–2 May 2025, EGU25-5091, https://doi.org/10.5194/egusphere-egu25-5091, 2025.

EGU25-5951 * | Orals | EOS4.8 | Highlight

Improving extreme temperature definitions until they are wrong 

Lukas Brunner, Maximilian Meindl, and Aiko Voigt

"Doesn't this look a bit strange?" 

It began with an innocent question during one of our Master's colloquia. And it could have ended there. "We were just following an approach from the literature". And who could argue against following the literature?

But it bugged me. During a long train ride, I began to think about the issue again. 10 hours and many papers later, I was only more confused: was it really that obvious, and why had no one picked up on it before? But sometimes the most obvious things are the most wicked, and after a few conversations with knowledgeable colleagues, I was sure we were in for an unexpected surprise. 

A commonly used approach to defining heat extremes is as exceedances of percentile-based thresholds that follow the seasonal cycle. Such relative extremes are then expected to be evenly distributed throughout the year. For example, over the 30-year period 1961-1990, we expect three (or 10%) of January 1s to exceed a 90th percentile threshold defined for the same period - and the same for all other days of the year. In a recent study, we show that there are many cases where this does not hold, not even close (Brunner and Voigt 2024).

Here, we tell the story of how this blunder spread in the literature out of the desire to improve extreme thresholds. We show that seemingly innocent changes can sometimes have unintended consequences and that taking the time to check the obvious can help avoid mistakes in science. 


Brunner L. and Voigt A. (2024): Pitfalls in diagnosing temperature extremes, Nature Communications, https://doi.org/10.1038/s41467-024-46349-x

How to cite: Brunner, L., Meindl, M., and Voigt, A.: Improving extreme temperature definitions until they are wrong, EGU General Assembly 2025, Vienna, Austria, 27 Apr–2 May 2025, EGU25-5951, https://doi.org/10.5194/egusphere-egu25-5951, 2025.

When economists estimate the expected economic damages from current-day CO2 emissions, they usually calculate the social cost of carbon – that is, the aggregated damage caused by the emission of an additional ton of CO2. Several cost-benefit integrated assessment models (IAMs) are built to assess this quantity, and among them is the META model. This model is built specifically to assess the effects of tipping points on the social cost of carbon, and it usually operates stochastically. When integrating a deterministic, but small carbon cycle tipping point into the model, however, the social cost of carbon seems to explode: a few gigatons of additional emissions almost double the impact estimates of CO2 emissions! Well, maybe. In fact, these results are a pure artifact of two things: 1) the way in which social cost of carbon estimates are calculated with IAMs; and 2) the way that tipping points are implemented in the META model. And, of course, 3): a lack of initial thoughtfulness on behalf of myself. A thorough look into this issue shows that, as expected, a marginal change in emissions leads to a marginal change in damage estimates. While that result is rather boring, the previous blunder can actually be instructive about the scarcely-known methods used to obtain economic impact estimates of climate change.

How to cite: Schaumann, F.: Drastic increase in economic damages caused by a marginal increase in CO2 emissions?, EGU General Assembly 2025, Vienna, Austria, 27 Apr–2 May 2025, EGU25-9145, https://doi.org/10.5194/egusphere-egu25-9145, 2025.

EGU25-10285 | ECS | Orals | EOS4.8

How robust are modeled non-local temperature effects of historical land use changes really? 

Felix Jäger, Petra Sieber, Isla Simpson, David Lawrence, Peter Lawrence, and Sonia I. Seneviratne

Historically, large areas across the globe have been affected by deforestation or irrigation expansion. The replacement of forests with agricultural land and increased water availability in irrigated croplands altered the land’s surface properties, leading to influences of biogeophysical changes on near-surface temperature. From limited observations and mostly idealized simulations, we know that sufficiently large alterations of land surface properties can theoretically lead to systematic temperature and precipitation changes outside and even far from the altered areas. Not only the advection of temperature anomalies, but also changes in circulation and ocean feedbacks have been shown to be potential drivers of such non-local responses in single and multi-model studies.

We tested the robustness of non-local temperature signals to internal variability in the fully coupled Community Earth System Model 2 (CESM2) simulations of the historical period (1850 – 2014) with all forcings vs. all-but-land-use-change forcings. Doing so, we first found seemingly robust non-local temperature effects of land use change on the global and regional scale. But when accounting for the sampling of internal variability in the model using a large initial condition ensemble, the global scale signal was found to be indistinguishable from noise. Only regionally in some hotspots, we found robust and historically important non-local temperature signals. Through increasingly rigorous analysis, we reached a partly negative and unexpected but important finding, which may have implications for future assessments of comparably weak or spatially heterogeneous forcings to the Earth system.

How to cite: Jäger, F., Sieber, P., Simpson, I., Lawrence, D., Lawrence, P., and Seneviratne, S. I.: How robust are modeled non-local temperature effects of historical land use changes really?, EGU General Assembly 2025, Vienna, Austria, 27 Apr–2 May 2025, EGU25-10285, https://doi.org/10.5194/egusphere-egu25-10285, 2025.

EGU25-10615 | Orals | EOS4.8

Think twice – pitfalls in hydrological modelling 

Jan Seibert, Franziska Clerc-Schwarzenbach, Ilja van Meerveld, and Marc Vis

Failures are only common in science, and hydrological modelling is no exception. However, we modellers usually do not like to talk about our mistakes or our overly optimistic expectations and, thus, “negative” results usually do not get published. While there are examples where model failures indicated issues with the observational data, in this presentation the focus is on modelling studies, where some more (realistic) thinking could have helped to avoid disappointments. Examples include the unnecessary comparison of numerically identical model variants, naively optimistic expectations about increasing the physical basis of bucket-type models and excessively hopeful assumptions about the value of data.

How to cite: Seibert, J., Clerc-Schwarzenbach, F., van Meerveld, I., and Vis, M.: Think twice – pitfalls in hydrological modelling, EGU General Assembly 2025, Vienna, Austria, 27 Apr–2 May 2025, EGU25-10615, https://doi.org/10.5194/egusphere-egu25-10615, 2025.

EGU25-11357 | Orals | EOS4.8

Two steps forward, one step back: four years of progress and setbacks on invisible ship tracks 

Peter Manshausen, Anna Tippett, Edward Gryspeerdt, and Philip Stier

The idea of invisible ship tracks for the study of aerosol-cloud interactions sounds promising: We have been studying the effects of aerosols on clouds for many years, among others by investigating the bright lines of clouds left in low marine clouds by ships. However, only a small fraction of ships leaves behind visible tracks. This means we can only study aerosol-cloud interactions under certain meteorological conditions, biasing our understanding. Instead, by studying all clouds polluted by ships ('invisible ship tracks') with a methodology we developed, we should be able to get a full picture of aerosol-cloud interactions. A number of interesting and impactful results have come out of this research, along with several setbacks and corrections to initial results. Here, we examine them in order, showing how correcting for one identified bias can introduce two new ones. Unexpected glitches arise from sources as varied as: choices regarding ship track definition, retrieval geometry, specific weather systems biasing results, and mathematical subtleties. What can we conclude after four years of progress on this methodology? While some results still stand, others had to be significantly corrected. This makes us see invisible ship tracks as an example of research that is closer to a method of 'tinkering' than to a 'magnificent discovery'.

How to cite: Manshausen, P., Tippett, A., Gryspeerdt, E., and Stier, P.: Two steps forward, one step back: four years of progress and setbacks on invisible ship tracks, EGU General Assembly 2025, Vienna, Austria, 27 Apr–2 May 2025, EGU25-11357, https://doi.org/10.5194/egusphere-egu25-11357, 2025.

EGU25-12720 | ECS | Posters on site | EOS4.8

Physical understanding of bugs to improve the representation of the climate system   

Hans Segura, Cathy Hohenegger, Reiner Schnur, and Bjorn Stevens

Earth system models are important tools used to understand our climate system and project possible changes in our climate due to anthropogenic and natural forcings. Human errors can occur in the development of Earth System models, i.e., bugs, giving an unphysical representation of our climate. A way to identify and solve bugs is to apply physical concepts. Here, we present an experience that occurred in the development of the ICOsahedral Non-hydrostatic model (ICON) as a kilometer-scale Earth System model, in which physically understanding a bug in the surface energy budget fixed land precipitation. 

In a simulation of ICON, referred to as ICON-bug, precipitation over tropical land continuously decreased across the simulation. This led to a ratio of land-ocean precipitation in the tropics of less than 0.7, which, otherwise, should be more than 0.86. As part of the possible explanations, the surface energy budget over land was targeted as a culprit. This idea relies on the influence of the interaction between soil moisture, surface heat fluxes, and winds to generate circulation favoring precipitation over dry land surfaces (Hohenegger and Stevens 2018). Indeed, the surface energy budget over dry surfaces in the ICON-bug showed an error in sensible heat flux. The sensible heat flux transmitted to the atmosphere was 70% of what was calculated for the surface module. Fixing this error closed the surface energy budget and increased land precipitation over the tropics, leading to a ratio of land-ocean precipitation of 0.94, close to observations. 

How to cite: Segura, H., Hohenegger, C., Schnur, R., and Stevens, B.: Physical understanding of bugs to improve the representation of the climate system  , EGU General Assembly 2025, Vienna, Austria, 27 Apr–2 May 2025, EGU25-12720, https://doi.org/10.5194/egusphere-egu25-12720, 2025.

Whenever you study a phenomenon of mm to a few cm-scale in the laboratory which involves an interface, the question of surface tension arises. Surface tension is due to the fact that molecules prefer to stay with their own kind. Therefore, the creation of an interface between two fluids requires energy, and this influences the dynamics around the interface.

Surface tension can be a blessing: it produces the round shape of rain drops or the nice bubble shapes of colorful liquid in a lava lamp. It allows objects with a higher density to float on a liquid (such as an insect on water, or a silicone plate on sugar syrup). It can generate flow up a capillary.

However, it can also be a curse in the case of thermal convection. Purely thermal convection  develops when a plane layer of fluid is heated from below and cooled from above. The engine of motion is the thermal buoyancy of the fluid. This is what is happening in a planetary mantle on scales of hundreds to thousands kilometers. This is also what is happening in a closed box in the laboratory. But as soon as an interface exists, either between an upper and a lower experimental mantle, or in the case of a free surface at the top of the fluid layer, surface tension effects can become important. For exemple, the variation of surface tension with temperature was responsible for the beautiful honey-comb patterns imaged by Benard (1901) in the first systematic study of thermal convection with a free-surface. Surface tension is also going to act against the initiation of subduction (which acts to break the surface). 

We shall review in this presentation the signatures of surface tension in a convective context, and the different ways to minimize and/or remove the effects of surface tension in convection experiments, such as using miscible liquids, or a layer of experimental « sticky air ».

How to cite: Davaille, A.: Analog studies of mantle convection: the curse of surface tension (or not) ?, EGU General Assembly 2025, Vienna, Austria, 27 Apr–2 May 2025, EGU25-15059, https://doi.org/10.5194/egusphere-egu25-15059, 2025.

EGU25-15457 | Orals | EOS4.8

The crux with variability: too much or too little 

Markus Weiler

In hydrology we measure and follow the water. What if there is too much or too little? It happens a lot. As a field hydrologist, I frequently have to determine the location of a measurement, the time to take the measurement, the location to set up a field experiment, or the amount of a tracer to inject to study a hydrological system. However, this is a very bumpy road, as variability is often not in favor of my decisions because the distribution is wider than expected, bimodal instead of unimodal, or the probability of an event is theoretically small, but still an extreme event occurs during our experiment. I will showcase some examples to demonstrate what I mean and what I experienced, as well as how frequently the PhD students or Postdocs have suffered as a result of my decisions or of the unexpected variability: Climatic variability resulted in a winter without snow, just as new sensors were already deployed. Or the winter snowpack was extremely high, preventing any work at high altitudes in the Alps until mid of July, thereby reducing our field season by half. An ecohydological study to observe the effects of drought in a forest with a rainout shelter was ineffective because it occurred during an extremely dry year, making the control just as dry as our drought treatment. The automatic water sampler was set-up to collect stream water samples, but it was washed away four weeks later by the 50-year flood. The calculated amount of artificial tracer was either way too low, because the transit times of the system were much longer than expected, or it was far too high, resulting in colored streams or samples that had to be diluted by a factor of 100 due to much faster transit times Finally, and most expensively, we installed many trenches along forest roads to measure subsurface stormflow but after three years, we abandoned the measurements because we never measured a drop of water coming out of the trenches, as the bedrock permeability was much higher due to many high permeable fissures that prevented the formation of subsurface stormflow.  These experiments or observations failed because of unexpected variability in input, system properties or a lack of technical variability in the equipment. I will reflect on residual risk of failure in fieldwork related to that crux and discus approaches to reduce this risk.

How to cite: Weiler, M.: The crux with variability: too much or too little, EGU General Assembly 2025, Vienna, Austria, 27 Apr–2 May 2025, EGU25-15457, https://doi.org/10.5194/egusphere-egu25-15457, 2025.

EGU25-15826 | ECS | Posters on site | EOS4.8

Output regridding can lead to Moiré pattern in km-scale global climate model data from ICON 

Benjamin Poschlod, Lukas Brunner, Benjamin Blanz, and Lukas Kluft

The emergence of global km-scale climate models allows us to study Earth's climate and its changes with unprecedented local detail. However, this step change in spatial resolution to grid spacings of 10 km or less also brings new challenges to the numerical methods used in the models, the storage of model output, and the processing of the output data into actionable climate information. The latest versions of the ICON-Sapphire model developed in the frame of the NextGEMS project address these challenges by running on an icosahedral grid while outputting data on the so-called HEALPix grid. Both grids are unstructured grids, which avoids, for example, the issue of longitude convergence. In addition, HEALPix allows data to be stored in a hierarchy of resolutions at different discrete zoom levels, making it easier for users to handle the data.  

The transition from the native 10 km grid to the output grid is made by a simple but very fast nearest-neighbour remapping. An advantage of this simple remapping approach is that the output fields are not distorted, i.e. the atmospheric states in the output remain self-consistent. As HEALPix only provides discrete zoom levels in the setup of the run, it was decided to remap to the closest available resolution of 12 km rather than to the next finer resolution of 6 km. This decision was made to avoid artificially increasing the number of grid points and to avoid creating duplicates through the nearest neighbour remapping.

As a consequence of this approach, wave-like patterns can emerge due to the Moiré effect that can result from the interaction of two grids. We find these patterns when looking at certain derived precipitation extremes, such as the annual maximum daily precipitation, the 10-year return level of hourly precipitation, or the frequency of dry days. At first, we interpreted these patterns as a plotting issue, as the figures might have too low resolution to cope with the high-resolution global plot (aliasing) leading to a Moiré pattern.

However, zooming in on the affected regions and closer examination of the data revealed that the pattern is in fact in the data. Further investigation with synthetic data confirmed the suspicion that the Moiré pattern was indeed caused by the remapping of the native 10 km icosahedral grid to the slightly coarser 12 km HEALPix grid. We hypothesise that precipitation is particularly affected by this issue, as it typically contains many grid cells with zero precipitation, with local clusters of non-zero values at the 15-minutely output interval. Yet, we cannot exclude the possibility that other variables are also affected.

As a consequence, if remapping is required, it is recommended to first remap from the native resolution to a finer resolution grid. As a next step, the conservative nature of the HEALPix hierarchy can be used to compute the coarser level. In this way it is likely to be possible to avoid aliasing and still keep the amount of output data the same.

How to cite: Poschlod, B., Brunner, L., Blanz, B., and Kluft, L.: Output regridding can lead to Moiré pattern in km-scale global climate model data from ICON, EGU General Assembly 2025, Vienna, Austria, 27 Apr–2 May 2025, EGU25-15826, https://doi.org/10.5194/egusphere-egu25-15826, 2025.

EGU25-17676 | ECS | Posters on site | EOS4.8

What river plastic hotspots do not have in common 

Rahel Hauk, Adriaan J. Teuling, Tim H.M. van Emmerik, and Martine van der Ploeg

Plastic pollution is a global issue, across all environmental compartments. Rivers connect the terrestrial with the marine environment, and they transport various materials, among these plastic pollution. Rivers not only transport plastic, but also accumulate and store it, especially on riverbanks. In fact, plastic deposition and accumulation on riverbanks is a common occurrence. However, our understanding of why plastic is deposited on a certain riverbank is rather limited. Riverbanks along all major Dutch rivers have been monitored for plastic and other litter twice a year by citizen scientists, in some locations since 2018. This provides an extensive dataset on plastic accumulation, and we used these data with the aim of understanding the factors determining plastic concentration/accumulation variability over time and space. We tested multiple riverbank characteristics, such as vegetation, riverbank slope, population density, etc., hypothesized to be related to plastic litter. After having exhausted a long list of auxiliary data and analysis strategies, we found no significant results. Ultimately, we had a close look at ten consistent hotspots of macroplastic litter, along the Meuse, and Waal river. And once again, they seem to have nothing in common. But, there is a pattern, because some riverbanks have consistently very high densities of plastic litter so it does not seem completely random. We have been looking to explain spatial variability, whereas we might have to look at temporal consistency, and we shall not give up our efforts to bring order to this chaos.

How to cite: Hauk, R., Teuling, A. J., van Emmerik, T. H. M., and van der Ploeg, M.: What river plastic hotspots do not have in common, EGU General Assembly 2025, Vienna, Austria, 27 Apr–2 May 2025, EGU25-17676, https://doi.org/10.5194/egusphere-egu25-17676, 2025.

EGU25-17811 | Posters on site | EOS4.8

Temporal variation of ambient noise at the Grande Dixence reservoir recorded by a nodal deployment 

Mita Uthaman, Laura Ermert, Angel Ling, Jonas Junker, Cinzia Ghisleni, and Anne Obermann

Grande Dixence, the tallest gravity dam in the world, is located in the Swiss Alps on the Dixence River with a catchment area of 4 km2 at a towering elevation of 2000m. The lake serves as a collecting point of melt water from 35 glaciers and reaches full capacity by late September, subsequently draining during winter and dropping to lowest levels in April. For a reservoir as large as the Grande Dixence, the variation in hydrological load can be expected to induce changes in crustal stress. The goal of this study was to harness the loading effect of the time-varying level of reservoir load as a source of known stress to investigate the variation in seismic velocity of the bedrock due to changes induced in crustal stress and strain rates. 22 seismic nodes were thus deployed along the banks of the reservoir which were operational from mid-August to mid-September, corresponding to the time period when the lake level reaches its maximum. Of the 22 nodes, 18 were deployed in closely spaced patches of six in order to carry out coherent stacking and to increase the signal-to-noise ratio, besides one group of three nodes and one single node. Measurement quality appears satisfactory: small local earthquakes are recorded well, and the probabilistic power spectral densities (PPSDs) computed for data quality validation evidence the ambient noise levels to be well within the global noise limits. However, the recorded noise is unexpectedly complex and, at periods shorter than 1 second, varies strongly by location. The 0.5--5s (0.2--2 Hz) period band at lakes generally records a diurnally varying noise level, often associated with lake generated microseism. Diurnal variations around 1 second of period are observed in our study as well. The amplitude of ambient noise level around 1 second of period is observed to be highest when the lake level changes, along with the prominent diurnal variation. A similar variation is observed in the seismic velocity variation (dv/v) computed from cross-correlated and auto-correlated ambient noise filtered between 0.5--1 Hz, with dv/v exhibiting a drop with rising lake level. These results provide preliminary evidence for possible change in crustal stress state with changing hydrological load. Future direction of this study consists of analytically modeling the results to quantify the influence of thermobarometric parameters on PPSDs and dv/v, and deconvolve it from the lake induced variations.

How to cite: Uthaman, M., Ermert, L., Ling, A., Junker, J., Ghisleni, C., and Obermann, A.: Temporal variation of ambient noise at the Grande Dixence reservoir recorded by a nodal deployment, EGU General Assembly 2025, Vienna, Austria, 27 Apr–2 May 2025, EGU25-17811, https://doi.org/10.5194/egusphere-egu25-17811, 2025.

EGU25-18185 | Orals | EOS4.8

Advancing river plastic research through serendipity and stupidity 

Tim van Emmerik and the WUR-HWM River Plastic Team

Rivers play an important role in the global distribution of plastic pollution throughout the geosphere. Quantifying and understanding river plastic pollution is still an emerging field, which has advanced considerably thanks to broad efforts from science, practice, and society. Much progress in this field has been achieved through learning from failures, negative results, and unexpected outcomes. In this presentation we will provide several examples of serendipity and stupidity that has led to new insights, theories, methods, and completely new research lines. We will share what we learned from rivers flowing in the wrong direction, sensors that disappear, equipment blocked by invasive plants, and dealing with suspicious local authorities. Pushing the science sometimes requires an opportunistic approach, embracing surprises and chaos you may face along the way.

How to cite: van Emmerik, T. and the WUR-HWM River Plastic Team: Advancing river plastic research through serendipity and stupidity, EGU General Assembly 2025, Vienna, Austria, 27 Apr–2 May 2025, EGU25-18185, https://doi.org/10.5194/egusphere-egu25-18185, 2025.

With the advent of parallel programming in the late 1990s. A port of the than available Max Planck Institutes for Meteorology spectral atmospheric model echam5 to MPI and OpenMP was done. For testing and validation of the hybrid parallelization a coherence algorithm was developed. The implementation has been incorporated into todays NWP and climate model ICON as well. The coherence algoritm consists of several stages: first one MPI rank is running the serial model against an n-task MPI parallelized model. During runtime the state vector is checked for binary-identity. If successfull a m-task MPI version can be compared to an m-task MPI version for high processor counts. The same schema can be used OpenMP parallelization. ONe MPI task runs the model serial using one OpenMP thread and a second MPI task runs k OpenMP threads. Again, the results are compared for binary-identity. As the testing needs to be done automatically, bit-identity is important for testing not necessarily for production.

The tesing revealed plenty of problems during the initial parallelization work of echam5 and showed constant appearing problems in the ICON development phase.

However, far in a couple of century long simulation the bit-identity was just by accident found to be broken: the search of the cause started!

How to cite: Kornblueh, L.: MPI and OpenMP coherence testing and vaildation: the hybris of testing non-deterministic model code, EGU General Assembly 2025, Vienna, Austria, 27 Apr–2 May 2025, EGU25-18400, https://doi.org/10.5194/egusphere-egu25-18400, 2025.

EGU25-18981 | ECS | Posters on site | EOS4.8

Publishing BUGS: Insights from the Journal of Trial and Error 

Stefan Gaillard

Addressing positive publication bias and clearing out the file drawer has been at the core of the Journal of Trial and Error since its conception. Publishing the trial-and-error components of science is advantageous in numerous ways, as already pointed out in the description of this panel: errors can lead to unexpected insights and warning others about dead ends can prevent wasted time and other resources. Besides those advantages, publishing negative and null results facilitates conducting robust meta-analyses. In addition, predictive machine learning models benefit from training on data from all types of research rather than just data from studies with positive, exciting results; already researchers are reporting that models trained on published data are overly optimistic.

Besides publishing negative and null results as well as methodological failures, the Journal of Trial and Error couples each published study with a reflection article. The purpose of these reflection articles is to have a philosopher, sociologist or domain expert reflect on what exactly went wrong. This helps contextualize the failure, helping to pinpoint the systematic factors at play as well as helping the authors and other scientists to draw lessons from the reported research struggles which can be applied to improve future research.

Publishing failure brings with it some practical challenges: convincing authors to submit manuscripts detailing their trial-and-error; instructing peer reviewers on how to conduct peer review for the types of articles; differentiating between interesting … and uninformative, sloppy science; and determining the best formats to publish various failure-related outcomes in. Authors are still hesitant to publish their research struggles due to reputational concerns and time constraints. In addition, authors often fear that peer reviewers will be more critical of articles describing research failures compared to articles reporting positive results. To counteract this (perceived) tendency of peer reviewers to be more critical of research without positive results, we provide specific instructions to peer reviewers to only assess the quality of the study without taking into account the outcome. This then also ensures that we only publish research that adheres to the standards of the field rather than sloppy science. Whether submitted research provides informative insights is assed by the editor-in-chief and the handling editor.

Finally, we are constantly evaluating and innovating the types of articles we publish. Various types of errors and failures benefit from differing ways of reporting. For example, recently we introduced serendipity anecdotes, a format where scientists can anecdotally describe instances serendipity which occurred during their research. This format allows researchers to focus on the conditions which allowed for the serendipitous discovery rather than the research itself.    

How to cite: Gaillard, S.: Publishing BUGS: Insights from the Journal of Trial and Error, EGU General Assembly 2025, Vienna, Austria, 27 Apr–2 May 2025, EGU25-18981, https://doi.org/10.5194/egusphere-egu25-18981, 2025.

It is common to perform two-dimensional simulations of mantle convection in spherical geometry. These have commonly been performed in axisymmetric geometry, i.e. (r, theta) coordinates, but subsequently we (Hernlund and Tackley, PEPI 2008) proposed using (r, phi) spherical annulus geometry and demonstrated its usefulness for low-viscosity-contrast calculations. 

When performing scaling studies in this geometry, however, strange results that did not match what is expected from Cartesian-geometry calculations were obtained when high-viscosity features (such as slabs) were present. It turns out that this is because the geometrical restriction forces deformation that is not present in 3 dimensions. Specifically, in a 2-D spherical approximation, a downwelling is forced to contract in the plane-perpendicular direction, requiring it to extend in the two in-plane directions. In other words, it is "squeezed" in the plane-perpendicular direction.  If the downwelling has a high viscosity, as a cold slab does, then it resists this forced deformation, sinking much more slowly than in three dimensions, in which it could sink with no deformation. This can cause unrealistic behaviour and scaling relationships for high viscosity contrasts. 

This problem can be solved by subtracting the geometrically-forced deformation ("squeezing") from the strain-rate tensor when calculating the stress tensor. Specifically, components of in-plane and plane-normal strain rate that are required by and proportional to the vertical (radial) velocity are subtracted, a procedure that is here termed "anti-squeeze". It is demonstrated here that this "anti-squeeze" correction results in sinking rates and scaling relationships that are similar to those in 3-D geometry whereas without it, abnormal and physically unrealistic results can be obtained for high viscosity contrasts. This correction has been used for 2-D geometries in the code StagYY (Tackley, PEPI 2008; Hernlund and Tackley, PEPI 2008) since 2010.

How to cite: Tackley, P.:  Adventures in Modelling Mantle Convection in a Two-Dimensional Spherical Annulus and Discovering the Need for "Anti-Squeeze”, EGU General Assembly 2025, Vienna, Austria, 27 Apr–2 May 2025, EGU25-19890, https://doi.org/10.5194/egusphere-egu25-19890, 2025.

EGU25-20057 | Posters on site | EOS4.8

Some Perfectly Reasonable Ideas that Didn’t Work: Snow Hydrology 

Ross Woods

The science question: how can we use hydrological process knowledge to understand the timing and magnitude of seasonal streamflow in snow-influenced catchments.

What was known: in general, catchments with colder climates have later and larger seasonal streamflow peaks, because more snow tends to accumulate in colder catchments, and it melts later because the time when melt can occur is later in the year in colder climates. Numerical models with fine space and time resolution were able to resolve these phenomena, but there was no theory which directly linked long term climate to seasonal streamflow.

In 2009 I published a very simple deterministic theory of snow pack evolution. I tested it against snow observations at 6 locations in the western USA and it apparently worked well (although I later discovered that I'd been lucky).

In 2015 I used the snowmelt derived from this deterministic theory to predict timing and magnitude of seasonal streamflow. It did poorly, and revealed untested assumptions in my theory. I tried making the theory slightly more complicated by considering within-catchment variation in climate. This did not help.

In 2016 I created a stochastic version of the theory (a weakness identified in 2015), and then also considered the within-catchment variation in climate. It did better at reproducing measured snow storage, but did not help in understanding seasonal streamflow.

My next step will be to consider all forms of liquid water input, i.e. not just snowmelt but also rainfall.

What survived: I will continue to use the stochastic version of the theory as it is clearly an improvement. I will continue to examine whether within-catchment climate variability is important, but it seems unlikely after two negative results. But whether introducing liquid water input will be sufficient, who can say? I will also try to examine in more detail how it is that the finely-resolved numerical models can do an adequate job, but the theory cannot - it is in this gap that the answer probably lies.  However the models are very complicated, and it is not easy to get a good understanding of exactly what they are doing, even though we know which equations the are implementing.


How to cite: Woods, R.: Some Perfectly Reasonable Ideas that Didn’t Work: Snow Hydrology, EGU General Assembly 2025, Vienna, Austria, 27 Apr–2 May 2025, EGU25-20057, https://doi.org/10.5194/egusphere-egu25-20057, 2025.

EGU25-20866 | ECS | Posters on site | EOS4.8

A case for open communication of bugs in climate models 

Jan Gärtner, Ulrike Proske, Nils Brüggemann, Oliver Gutjahr, Helmuth Haak, Dian Putrasahan, and Karl-Hermann Wieners

Climate models are not only numerical representations of scientific understanding but also human-written software, inherently subject to coding errors. While these errors may appear minor, they can have significant and unforeseen effects on the outcomes of complex, coupled models. Despite existing robust testing and documentation practices in many modeling centers, bugs broader implications are underexplored in the climate science literature.

We investigate a sea ice bug in the coupled atmosphere-ocean-sea ice model ICON, tracing its origin, effects, and implications. The bug stemmed from an incorrectly set logical flag, which caused the ocean to bypass friction from sea ice, leading to unrealistic surface velocities, especially in the presence of ocean eddies. We introduce a concise and visual approach to communicating bugs and conceptualize this case as part of a novel class of resolution-dependent bugs - long-standing bugs that emerge during the transition to high-resolution models, where kilometer-scale features are resolved.

By documenting this case, we highlight the broader relevance of addressing bugs and advocate for universal adoption of transparent bug documentation practices. This documentation complements the robust workflows already employed by many modeling centers and ensures lessons from individual cases benefit the wider climate modeling community.

How to cite: Gärtner, J., Proske, U., Brüggemann, N., Gutjahr, O., Haak, H., Putrasahan, D., and Wieners, K.-H.: A case for open communication of bugs in climate models, EGU General Assembly 2025, Vienna, Austria, 27 Apr–2 May 2025, EGU25-20866, https://doi.org/10.5194/egusphere-egu25-20866, 2025.

EGU25-1190 | ECS | Orals | ITS1.7/BG0.3

Unraveling Microbial Activity in Alpine Snow using metatranscriptomics: A 24-Hour Study of Diurnal Variations 

Francesca Schivalocchi, Sophie Darfeuil, Armelle Crouzet, Jean Martins, Dielleza Tusha, Jean Luc Jaffrezo, Christine Piot, and Catherine Larose

Understanding microbial activity in snowpacks is essential for unveiling the dynamics of cold ecosystems, yet little is known about how this activity changes between day and night. To address this knowledge gap, we conducted a 24-hour study on a snowpack located in the French Alps, sampling snow at five-hour intervals across different layers —from the surface to the basal layer in contact with soil.

For each layer and time point, we sampled snow to assess microbial activity using omic techniques, like metagenomic and metatranscriptomics, coupled to the analysis of environmental parameters, including sunlight duration, snow pH and temperature. Our results revealed significant diurnal variations: sunlight, pH and temperature fluctuated throughout the 24-hour period, with microbial activity showing corresponding changes. For example, algae affiliated with Chlorella and Volvox, or fungi affiliated with Rhizophagus and Penicillium, showed different transcriptomic responses to diurnal changes in surface and basal samples. These findings highlight the influence of environmental factors on microbial processes in snow and provide the first insights into how microbial activity adapts to the diurnal cycle in snowpacks.

This study contributes to understanding microbial dynamics in snow-covered ecosystems, shedding light on the interplay between microorganisms and their environment over short temporal scales.

How to cite: Schivalocchi, F., Darfeuil, S., Crouzet, A., Martins, J., Tusha, D., Jaffrezo, J. L., Piot, C., and Larose, C.: Unraveling Microbial Activity in Alpine Snow using metatranscriptomics: A 24-Hour Study of Diurnal Variations, EGU General Assembly 2025, Vienna, Austria, 27 Apr–2 May 2025, EGU25-1190, https://doi.org/10.5194/egusphere-egu25-1190, 2025.

The metabolic potential and activity of deep-sea microbes have not been fully explored by metatranscriptomics using the samples obtained by different sampling methods. Here, we report active deep-sea microbes obtained by the methods of Multiple in situ Nucleic Acid Collection (MISNAC), in situ microbial filtration and fixation (ISMIFF), in situ microbial filtration without fixation (ISMIFU) and the Niskin bottle at 1,038-m depth in the South China Sea. Higher biodiversity and different dominant active microbial taxa in the metatranscriptomes were detected in the MISNAC and ISMIFF samples, compared with the other two approaches. The transcriptional profiles of 40 conserved genes were similar between the MISNAC and ISMIFF samples, while expression of a quarter of these genes was not detected in the ISMIFU sample. Genes related to the CO oxidation and nitrification processes were highly transcribed in the MISNAC and ISMIFF transcriptomes, whereas genes for chemotaxis and low-oxygen adaptation were highly transcribed in the Niskin samples. Overall, our result highlights the importance of in situ sampling and preservation for more precise quantification of the ecological function of active deep-sea microbiomes.

How to cite: Wang, Y. and He, Y.: Transcriptional difference of deep-sea microorganisms under different sampling methods, EGU General Assembly 2025, Vienna, Austria, 27 Apr–2 May 2025, EGU25-1494, https://doi.org/10.5194/egusphere-egu25-1494, 2025.

EGU25-3250 | ECS | Orals | ITS1.7/BG0.3

Soil microbial community response to glacial rock flour amendment: insights from a microcosm experiment 

Kara Sampsell, Bastien Wild, Timothy Vogel, and Catherine Larose

The use of glacial rock flour as an agricultural soil amendment gained increasing interest due to its fine particle size, potential to deliver crop-essential nutrients, and capacity for Mg or Ca-rich silicates to enhance rock weathering to capture atmospheric CO2 in carbonate form. Additionally, some studies have observed that rock flour amendments can reduce N2O flux. Plant growth, carbon storage, and soil emissions are all influenced by microorganisms in soil, which actively participate in biotic weathering processes that release plant-essential nutrients like phosphate, potassium, and sulfur from minerals. Furthermore, microorganisms drive nitrogen and carbon cycling, which influences soil fertility and greenhouse gas emissions. Thus, the unknown impact of glacial flour application to soil microbial communities must be investigated. Our study aimed to assess a French agricultural soil microbial community responds to varying glacial rock flour application rates during a 12-week microcosm experiment. The granitic glacial flour selected for study originated from Mer de Glace (French Alps). To understand the microbial community’s response, we focused on taxonomic shifts, relative abundance of genes related to nitrogen cycling and nutrient access, and geochemical shifts between baseline and 12-week samples. We hypothesized that glacial flour amendment would select for a community that would reduce nitrogen losses through N2O and demonstrate improved ability to access flour-bound nutrients particularly at higher application rates compared to the control soil. To test this hypothesis, we conducted a 12-week microcosm study where glacial rock flour was added to 50 g of agricultural soil at rates of 0, 0.5, 2, 5, 10, 20, 30, 50, 80, 115, and 157 t ha-1. Each treatment had 12 replicates and one replicate per treatment was destructively sampled each week for analysis. For the higher application rates (30-157 t ha-1), a quartz powder control was included to account for potential changes in soil structure. Replicates remaining in the experiment were watered once per week up to 80% of water holding capacity to simulate agricultural irrigation or rainfall events. DNA was extracted from all samples for downstream analyses and subsamples from baseline and endpoint were retained for geochemical analyses. Quantitative polymerase chain reaction (qPCR) was performed on the 16S and 18S genes to quantify bacterial and fungal abundance, respectively. Metabarcoding of the v3-v4 region of the 16S rRNA gene (rrs) was done to track taxonomic changes in the bacterial population over the course of the experiment. Inorganic nitrogen species were quantified in the baseline and 12-week samples. Preliminary results showed that bacterial communities exhibited differential growth in response to amendments above 5-10 t ha-1 compared to those below, with shifts occurring at week 4 and week 10 of the experiment. Glacial flour application of 30 and 50 t ha-1 resulted in the lowest percent loss of inorganic nitrogen from baseline to week 12 compared to other application rates. These initial findings indicate that glacial rock flour application rates may significantly influence the soil microbial community, with important implications for nitrogen cycling and nutrient accessibility.

How to cite: Sampsell, K., Wild, B., Vogel, T., and Larose, C.: Soil microbial community response to glacial rock flour amendment: insights from a microcosm experiment, EGU General Assembly 2025, Vienna, Austria, 27 Apr–2 May 2025, EGU25-3250, https://doi.org/10.5194/egusphere-egu25-3250, 2025.

EGU25-4787 | Orals | ITS1.7/BG0.3 | Highlight

Organic matter variability in algal dominated habitats on the Western Greenland Ice Sheet  

Pamela E. Rossel, Runa Antony, Rey Mourot, Thorsten Dittmar, Alexandre M. Anesio, Martyn Tranter, and Liane G. Benning

Microbiological activity on glacier and ice sheet surfaces can be a major factor responsible for their darkening. Among microbes, pigmented snow- and glacial ice-algae increase light absorption, further accelerating melting and supporting the development of pigmented algal blooms on the Greenland Ice Sheet (GrIS). The relationship between carbon-fixing algae and carbon-respiring heterotrophic microorganisms influences the amount and composition of organic matter (OM). Yet, the dynamics of the OM derived from these microbes on the GrIS remain unclear. To address this gap, we incubated algae-dominated snow and ice surface samples in situ in vented bottles under light and dark conditions. We evaluated the initial microbial community composition (via 16S and 18S rRNA gene sequencing) and characterized the changes in both dissolved and particulate OM (DOM and POM) via ultrahigh-resolution Fourier transform ion cyclotron resonance mass spectrometry. We show that glacier ice-algae habitats dominated by Ancylonema, have higher abundance of highly unsaturated and aromatic compounds resistant to bio- and photo-degradation. In contrast, snow-algae habitats dominated by Chloromonas, are enriched in bioavailable and more photosensitive unsaturated aliphatics and sulfur- and phosphorus-containing compounds. Light exposure increased water-soluble DOM compounds derived from POM, which accounted for large proportion of the initial DOM composition of both algae dominated habitats. Of these initial DOM pools, up to 50% were heterotrophically degraded in the dark, while light alone photodegraded less than 20%. The significant accumulation of light-absorbing aromatics from both POM and DOM pools at the end of the ice-algae experiments, emphasize ice-algae larger effect on altering glacier color compared to snow-algae, and thus on decreasing glacier albedo and accelerating melting.

How to cite: Rossel, P. E., Antony, R., Mourot, R., Dittmar, T., Anesio, A. M., Tranter, M., and Benning, L. G.: Organic matter variability in algal dominated habitats on the Western Greenland Ice Sheet , EGU General Assembly 2025, Vienna, Austria, 27 Apr–2 May 2025, EGU25-4787, https://doi.org/10.5194/egusphere-egu25-4787, 2025.

EGU25-7658 | ECS | Orals | ITS1.7/BG0.3

Understanding soil properties conducive for Coccidioides ssp. presence in the United States  

Yahaira D. Álvarez-Gandía, Cari Lewis, Bridget M. Barker, Jovani Catalán-Dibene, Kimberly A.  Kaufeld, Daniel Kollath, Antje Lauer, Heather Mead, Hanna Oltean, Marieke Ramsey, Adriana Romero-Olivares, Andrew W. Bartlow, and Morgan E. Gorris

Coccidioides immitis and C. posadasii are closely related fungal pathogens that cause coccidioidomycosis, a respiratory disease also known as Valley fever. In general, Coccidioides are regarded to grow in arid to semi-arid soils in North and South America. If a person inhales these spores, they can become sick with Valley fever. The soil properties conducive for the presence of Coccidioides are not currently well defined, including whether there are differences in the soil properties conducive for each species. Recent efforts, especially over the last decade, to collect soil samples positive for Coccidioides now provide the data to begin examining these questions. We compiled Coccidioides spp. occurrence data from both previous studies and studies published on the National Center for Biotechnology Information (NCBI) database to examine the generalized soil properties associated with the presence of the pathogen. We analyzed 13 different soil properties from the California Soil Resource Lab at University of California Davis database derived from USDA-NCSS soil data and one measure of ecoregions from the US Environmental Protection Agency. Comparing the two species, we found that C. immitis was present in soils with a statistically significant higher water holding capacity and silt content than C. posadasii. Additionally, C. immitis was found in soils with significantly higher soil organic matter and calcium carbonate content than C. posadasii. This may suggest that C. immitis is more likely to grow in wetter and more productive soils compared to C. posadasii. Understanding the soil properties conducive for each Coccidioides species will allow us predict areas prone to their presence, enabling the creation of higher resolution risk maps for Valley fever and preventative messaging to at-risk populations. 


How to cite: Álvarez-Gandía, Y. D., Lewis, C., Barker, B. M., Catalán-Dibene, J., Kaufeld, K. A.  ., Kollath, D., Lauer, A., Mead, H., Oltean, H., Ramsey, M., Romero-Olivares, A., Bartlow, A. W., and Gorris, M. E.: Understanding soil properties conducive for Coccidioides ssp. presence in the United States , EGU General Assembly 2025, Vienna, Austria, 27 Apr–2 May 2025, EGU25-7658, https://doi.org/10.5194/egusphere-egu25-7658, 2025.

EGU25-8846 | ECS | Orals | ITS1.7/BG0.3

Balancing Act: Groundwater microbiomes' resilience and vulnerability to hydroclimatic extremes 

He Wang, Martina Herrmann, Simon A. Schroeter, Christian Zerfaß, Robert Lehmann, Katharina Lehmann, Arina Ivanova, Georg Pohnert, Gerd Gleixner, Susan E. Trumbore, Kai Uwe Totsche, and Kirsten Küsel

Groundwater health is increasingly threatened by climate change, which alters precipitation patterns, leading to groundwater recharge shifts. These shifts impact subsurface microbial communities, crucial for maintaining ecosystem functions. In this decade-long study of carbonate aquifers, we analyzed 815 bacterial 16S rRNA gene datasets, 226 dissolved organic matter (DOM) profiles, 387 metabolomic datasets, and 174 seepage microbiome sequences. Our findings reveal distinct short- and long-term temporal patterns of groundwater microbiomes driven by environmental fluctuations. Microbiomes of hydrologically connected aquifers exhibit lower temporal stability due to stochastic processes and greater susceptibility to surface disturbances, yet they demonstrate remarkable resilience. Conversely, isolated aquifer microbiomes show resistance to short-term changes, governed by deterministic processes, but exhibit reduced stability under prolonged stress. Variability in seepage-associated microorganisms, DOM, and metabolic diversity further drive microbiome dynamics. While shifts in DOM influence the potential functions of the microbiome, its overall functional potential demonstrates high temporal stability and resilience over time, largely due to functional redundancy. These findings highlight the dual vulnerability of groundwater systems to acute and chronic pressures, emphasizing the critical need for sustainable management strategies to mitigate the impacts of hydroclimatic extremes.

How to cite: Wang, H., Herrmann, M., Schroeter, S. A., Zerfaß, C., Lehmann, R., Lehmann, K., Ivanova, A., Pohnert, G., Gleixner, G., Trumbore, S. E., Totsche, K. U., and Küsel, K.: Balancing Act: Groundwater microbiomes' resilience and vulnerability to hydroclimatic extremes, EGU General Assembly 2025, Vienna, Austria, 27 Apr–2 May 2025, EGU25-8846, https://doi.org/10.5194/egusphere-egu25-8846, 2025.

EGU25-12311 | ECS | Posters on site | ITS1.7/BG0.3

Metabolic profiles of glacial ice algal-dominated habitats across the western Greenland ice sheet. 

Anirban Majumder, Carsten Jaeger, Jan Lisec, Pamela E Rossel, Martyn Tranter, Alexandre M Anesio, and Liane G Benning

The microbiologically-driven darkening of bare ice surfaces on the western Greenland Ice Sheet is significantly enhancing melting, contributing to sea level rise. Among microorganisms, purple-brown pigmented glacial ice algae (mainly members of Ancylonema alaskanum and Ancylonema nordenskiöldi) are key contributors to the ice surface darkening and the associated surface albedo reduction. It is known that the glacial ice algae actively replicate and spread across vast ice surface areas during the summer melt season. However, the metabolic pathways driving the glacial ice algal bloom development are still poorly understood. To address this knowledge gap, we used an untargeted endometabolomics approach to explore the dynamics and metabolic potential of glacier ice algal blooms and the role of the environment on their metabolic responses. We analyzed glacial ice algae-dominated surface ice samples from various locations across the western Greenland Ice Sheet using high-resolution mass spectrometry to annotate the metabolome of the algae-dominated samples. Combined with physical and chemical environmental data describing their constantly changing habitat (e.g., temperature, light response, cell numbers) we derived novel insights into the metabolic activity of the glacial ice algae and their biochemical adaptations to glacier conditions. Our data contribute to improving our understanding of the link between ice darkening and microbial activity.

How to cite: Majumder, A., Jaeger, C., Lisec, J., E Rossel, P., Tranter, M., M Anesio, A., and G Benning, L.: Metabolic profiles of glacial ice algal-dominated habitats across the western Greenland ice sheet., EGU General Assembly 2025, Vienna, Austria, 27 Apr–2 May 2025, EGU25-12311, https://doi.org/10.5194/egusphere-egu25-12311, 2025.

Wastewater-based epidemiology (WBE) is increasingly recognized as a pivotal tool for tracking community health trends, including viral pathogens and antimicrobial resistance (AMR). This study integrates the surveillance of SARS-CoV-2 genes and AMR in wastewater samples collected from wastewater treatment plants (WWTPs) in Dehradun, India, during the COVID-19 pandemic. By combining genomic and molecular analyses, this research offers a dual perspective on two significant public health threats: the emergence of SARS-CoV-2 variants and the escalating burden of AMR. Weekly wastewater samples were collected from eight WWTPs between June 2022 and July 2023. SARS-CoV-2 RNA was quantified using real-time PCR assays targeting N, S, and ORF-1ab genes. At the same time, AMR was assessed through 16S rRNA gene sequencing and qPCR to detect resistance genes across multiple antibiotic classes, including aminoglycosides, β-lactams, macrolides, and tetracyclines. Seasonal variations, gene abundance, and correlations between SARS-CoV-2 and AMR markers were analyzed to understand the dynamics of these health risks in the urban environment. In this respect, SARS-CoV-2 analysis revealed 68 distinct lineages, dominated by Omicron recombinant variants XAP, XBB.1.16.1, and XBB.1.22 in March and April 2023, making up more than 50% of the total abundance. Such variants carried mutations that could increase transmissibility, underlying the importance of wastewater monitoring in tracking viral evolution. Meanwhile, AMR surveillance highlighted significant seasonal trends in the abundance of antibiotic-resistance genes (ARGs). Tetracycline resistance surged to 34.35% during the monsoon season at the Kargi WWTP, compared to 12.98% in winter. In contrast, macrolide resistance peaked at 35.87% in winter and decreased to 15.35% during the monsoon season. Resistant genes, such as tetXermFblaOXA-50, and aadA1, were frequently detected, with aminoglycosides and tetracyclines consistently showing high resistance levels across sites and seasons. The simultaneous presence of SARS-CoV-2 RNA and ARGs in wastewater underscores the role of WWTPs as reservoirs and conduits for emerging public health threats. Climatic factors, anthropogenic activities, and proximity to healthcare facilities impact the distribution of resistant genes and viral variants.  Notably, the effective removal of SARS-CoV-2 genes in municipal WWTPs (~50% gene reduction) highlights the possibility of targeted interventions to mitigate pathogen spread. However, the continued presence of resistant genes despite treatment raises concerns about environmental and public health risks. This study illustrated the potential for integrated viral and AMR wastewater surveillance to deliver community health intelligence in real-time. Thus, by monitoring SARS-CoV-2 variants alongside AMR trends, WBE can be an early warning system for emerging health threats, informing public health policy and environmental management strategies.

Keywords: antimicrobial-resistance; Covid-19; resistant genes; wastewater-based epidemiology

How to cite: Dogra, S. and Kumar, M.: The co-occurrence of Viral Pathogens and Antimicrobial-Resistance (AMR) markers from urban wastewater treatment plants in India, EGU General Assembly 2025, Vienna, Austria, 27 Apr–2 May 2025, EGU25-13669, https://doi.org/10.5194/egusphere-egu25-13669, 2025.

Learning about the metabolic activities and adaptations of deep-sea microbes is a challenging task, because the collection and retrieval of samples from the deep ocean induce RNA degradation and alteration of microbial communities. Here, we employed a in situ DNA/RNA co-extraction device to collect 18 time-course nucleotide acid samples for winter and summer seasons in the South China Sea to generate metatranscriptomes and metagenomes with the minimal possible sampling perturbation. Between the two seasons, the most active eukaryotic microbes were Ciliophora, whereas the most abundant but inactive eukaryotic microbes were Retaria. In the winter, autotrophic microorganisms contributed to organic matter production by CO2 fixation associated with nitrification. In the summer, the primary source of energy originated from heterotrophic microorganisms that can utilize alkanes, aromatic compounds and carbohydrates, partially relying on anaerobic respiration in the particles. This may relate with nutrient source variations as reflected by the different levels of microbial network complexity between two seasons. Altogether, we uncovered the metabolic activities and adaptations of active microbial groups in two seasons with in situ metatranscriptomes, paving the way to identification of the real microbial contributors to element cycles in the deep ocean.

How to cite: He, Y., Baltar, F., and Wang, Y.: In situ sampling uncovers seasonal variability in community structure and metabolism of active deep-sea microbes, EGU General Assembly 2025, Vienna, Austria, 27 Apr–2 May 2025, EGU25-14323, https://doi.org/10.5194/egusphere-egu25-14323, 2025.

EGU25-14807 | Orals | ITS1.7/BG0.3

Decoding Soil Microbiomes: Metagenomic Insights into Pesticide-Contaminated Agro-Ecosystems 

Durga Madhab Mahapatra, Shristi Sinha Roy, and Nishu Goyal

Abstract: Soil contamination from excessive pesticide use is a global issue, threatening human health and environmental sustainability. Pesticides disrupt soil microbiomes, leading to a decline in beneficial microorganisms, impaired nutrient cycling, and long-term ecosystem disturbances. Microorganisms play a crucial role in environmental preservation by breaking down xenobiotics, including pesticides. However, the pathways of pesticide degradation by microorganisms are not well understood due to limitations in current culturing techniques. To address this knowledge gap, we utilized 16S rRNA V3-V4 metagenomic sequencing to analyze farming soils in Dehradun with a history of pesticide application. Our results revealed a relative abundance of the phyla Proteobacteria, Acidobacteria, Firmicutes, and Actinobacteria in contaminated zones. Bacillus, Solibacter, and Nitrospira were the most prevalent taxa, indicating nitrogen and carbon fixation and regulation of biogeochemical cycles in extreme environments. Predictive metagenome analysis showed that core-degrading orthologs involved in membrane transport, the TCA cycle, carbohydrate metabolism, and xenobiotic degradation (such as atrazine and chlorocyclohexane degradation) were prevalent in contaminated soils. Our findings highlight the implications of abundant microbes in contaminated soils through comprehensive metagenomic approaches, paving the way for further research on gene expression frequencies and major enzyme assays for pesticide degradation.

Keywords: Metagenomics, Microbial diversity, Pesticide degradation, Taxonomy

How to cite: Mahapatra, D. M., Sinha Roy, S., and Goyal, N.: Decoding Soil Microbiomes: Metagenomic Insights into Pesticide-Contaminated Agro-Ecosystems, EGU General Assembly 2025, Vienna, Austria, 27 Apr–2 May 2025, EGU25-14807, https://doi.org/10.5194/egusphere-egu25-14807, 2025.

EGU25-16283 | ECS | Posters on site | ITS1.7/BG0.3

Survival strategies of supraglacial algae-dominated communities in the transition from high light to continual darkness on the Greenland Ice Sheet 

Helen K. Feord, Christoph Keuschnig, Christopher B. Trivedi, Rey Mourot, Athanasios Zervas, Thomas Turpin-Jelfs, Martyn Tranter, Alexandre M. Anesio, Lorenz Adrian, and Liane G. Benning

Glacier ice algae of the streptophyte genus Ancylonema live on glaciers globally, including the Greenland Ice Sheet, and bloom despite low temperatures, low nutrient availability, and very high light intensities. In polar regions, the long polar night also imposes additional abiotic stressors. However, the cellular mechanisms responsible for Ancylonema’s resistance and adaptation to high light stress or to prolonged darkness during the polar winter are not known. We addressed this knowledge gap by evaluating the functional responses of a Greenland Ice Sheet Ancylonema-dominated microbiome to in-situ light conditions and continual darkness during a 12-day period using amplicon sequencing, metatranscriptomics, and metaproteomics. The microbial community did not substantially change during the 12 days of dark incubation; however, heterotrophs became more transcriptionally active in the dark. Metatranscriptomic and metaproteomic analyses showed that Ancylonema cells underwent high oxidative stress in the light. However, after 12 days in darkness, the algal cells retained functional photosynthetic machinery but downregulated their expression of early shikimate pathway enzyme transcripts. Transcriptional reprogramming linked to sugar uptake and phytohormone signalling was also identified in the dark, providing an insight into the first steps towards algal cell survival through the polar night. These results give us a novel understanding of the gene expression dynamics of glacier ice algae under changing light conditions, providing important clues regarding their adaptation to a harsh and extremely variable environment.

How to cite: Feord, H. K., Keuschnig, C., Trivedi, C. B., Mourot, R., Zervas, A., Turpin-Jelfs, T., Tranter, M., Anesio, A. M., Adrian, L., and Benning, L. G.: Survival strategies of supraglacial algae-dominated communities in the transition from high light to continual darkness on the Greenland Ice Sheet, EGU General Assembly 2025, Vienna, Austria, 27 Apr–2 May 2025, EGU25-16283, https://doi.org/10.5194/egusphere-egu25-16283, 2025.

EGU25-18428 | Posters on site | ITS1.7/BG0.3

Deep Underground Long Term Evolution Experiments, a key to understand the impact of low doses on living organisms 

Vincent Breton, Giovanna Fois, Christophe Insa, Lydia Maigne, and David Biron

Deep Underground laboratories are unique environments for exploring the impact of ultralow radioactivity on living organisms. They also provide unique features for running long term controlled low-dose experiments.

Evolution is an on-going process, and it can be studied experimentally in organisms with rapid generations. The E. coli Long-Term Evolution Experiment (LTEE) is an ongoing study in experimental evolution begun by Richard Lenski at the University of California, which has been tracking genetic changes in 12 initially identical populations of asexual Escherichia coli bacteria since 24 February 1988 on more than 60.000 generations.

A first evolution experiment conducted at Modane Underground Laboratory with the same E. Coli strain and the same growth medium used by Richard Lensky and collaborators has shown no change in the fitness trajectory over 500 generations when radiative background was reduced by a factor 6 from 150 to 26 nGy/hr. Monte-Carlo simulation of the experimental set-up showed that 40K in the E. Coli culture medium (Davis Medium) was the almost exclusive source of radioactivity to the bacterial strains, representing 99% of the dose received.

Potassium has three naturally occurring isotopes: 39K (93.258%) and 41K (6.730%) are stable, while 40K (0.012%) is radioactive, with a half-life of 1.25 billion years. As 40K in the nutritive medium was the main obstacle to the reduction of the dose received by the bacterial strains during this experiment, depleting 40K in the potassium used to feed the bacteria would reduce significantly the dose received and allow exploring further the ultralow radioactivity frontier. Reciprocally, enriching the potassium in 40K would increase the dose absorbed by the bacteria without changing any other physico-chemical parameters.

We therefore propose to compare the fitness trajectories over 1000 generations of the same E. Coli strain using Davis Medium (DM) nutritive media either enriched or depleted in 40K. Although the isotopic composition of natural Potassium is very stable, potassium enriched in 39K and depleted 10 times in 40K can be purchased from commercial vendors for less than 10 € per milligram.  To enrich natural potassium in 40K, a promising approach is through neutron irradiation.

Repeating the same experiment using DM nutritive media that differ only by the isotopic composition of the potassium allows isolating the sole impact of radiation on the evolutionary path of the bacteria. Increasing 40K isotopic fraction increases proportionally the absorbed dose and radiation induced mutations are expected to modify the strain evolutionary paths when they exceed the spontaneous mutation rate.

These experiments could be performed in several Deep Underground Laboratories to compare the observed fitness trajectories and quantify the reproducibility of the observed evolutionary paths.  


How to cite: Breton, V., Fois, G., Insa, C., Maigne, L., and Biron, D.: Deep Underground Long Term Evolution Experiments, a key to understand the impact of low doses on living organisms, EGU General Assembly 2025, Vienna, Austria, 27 Apr–2 May 2025, EGU25-18428, https://doi.org/10.5194/egusphere-egu25-18428, 2025.

EGU25-18535 | ECS | Orals | ITS1.7/BG0.3

TotalRNA sequencing reveals active community and functional dynamics on the surface of the Greenland Ice Sheet 

Athanasios Zervas, Laura Perini, Helen Feord, Ate Jaarsma, Katie Sipes, Martyn Tranter, Liane G. Benning, and Alexandre M. Anesio

The ablation area of the Greenland Ice Sheet (GrIS) is a biome driven by microbial activity. During the summer melt season, the weathering crust of the ice becomes a wet living skin dominated by eukaryotic glacier ice algae, particularly Ancylonema spp., which accelerate ice melt through their dark pigmentation. Cryoconite holes, formed by sediment melting into the weathering crust, also dominate the landscape of the ice surface. They are primarily inhabited by cyanobacteria as the main primary producers and also host a diverse community of bacterial, fungal and other microeukaryotic heterotrophs. This study investigates the active microbial communities and functionality of the weathering crust and cryoconites using Total RNA metatranscriptomics. With this approach, we describe the full diversity of ice surface microbial communities; assembling, annotating and analyzing jointly full-length 16S rRNA and 18S rRNA genes in addition to transcriptomes. We conducted a seasonal study over a 21-day period during the ablation season, sampling ice and cryoconite habitats. Samples were collected from five cryoconite holes and five 2-meter patches of the weathering crust ca 25km inland on the GrIS, near Ilulissat. Biomass from cryoconite holes and ice surfaces was collected at solar noon on seven sampling days during the summer. The findings highlight the dynamics and spatial variability of very different microbial communities between the weathering crust and cryoconite holes. Notably, the weathering crust is dominated by eukaryotic biomass, and spatial variability is significant; cryoconites are far more diverse, dominated by prokaryotic interactions and relatively stable temporally.  A snowfall in late summer provided a window of opportunity to show that cryoconites communities are robust, while the functionality of the weathering crust, including genes associated to carbon, nitrogen and phosphorus cycling all responded to snowfall. The Total RNA approach in this study provides a powerful insight into the entire active microbial community and their functionality on glacial surfaces.

How to cite: Zervas, A., Perini, L., Feord, H., Jaarsma, A., Sipes, K., Tranter, M., Benning, L. G., and Anesio, A. M.: TotalRNA sequencing reveals active community and functional dynamics on the surface of the Greenland Ice Sheet, EGU General Assembly 2025, Vienna, Austria, 27 Apr–2 May 2025, EGU25-18535, https://doi.org/10.5194/egusphere-egu25-18535, 2025.

EGU25-20154 | ECS | Posters on site | ITS1.7/BG0.3

Exploring microbial activity and metabolic requirement during the polar winter of the Arctic 

Harpreet Singh, James A Bradley, Timothy M Vogel, and Catherine Larose

The cryosphere encompasses a wide range of perennial microbial habitats including glaciers, lakes, seas, rivers, and soils. These habitats pose intrinsic seasonally-variable challenges for microbial populations, whose activity may be temporarily constrained. Microbial dynamics in these environments during the summer and (to a lesser extent) spring have been extensively studied, however the winter season remains largely unexplored. During the winter period, microbial activity may be constrained by freezing temperatures, limited availability of liquid water, and the absence of light and thus photosynthetic carbon input. Critical aspects of microbial activity, including metabolic processes, winter-specific community profiles, and their unique functional roles in ecological processes, are still poorly understood. To address this knowledge gap, we examined microbial activity during the winter months in a range of aquatic and terrestrial Arctic habitats. Using metatranscriptomic techniques, we identified active microorganisms and uncovered their core metabolic requirements for sustaining activity. We also employed BONCAT (bioorthogonal noncanonical amino acid tagging) to assess the ratio of live to dead microbes across different habitats and utilized qPCR and RT-qPCR to quantify organism abundance. Our results revealed significant differences in community composition, abundance, and activity across environments. Notably, glacial snow and lake slush snow exhibited high RNA-to-DNA ratios, with distinct differences in microbial diversity. Lake slush snow, in particular, displayed a more uneven microbial community compared to its snow counterpart. In contrast, soil showed very low activity despite a high DNA content. Among the ice cores, glacial ice exhibited both high diversity and moderate microbial activity. Overall, our findings suggest that microbial communities in winter are active, with activity levels varying across different habitats. These variations may be driven by factors such as differences in microbial seeding sources and the availability of free water. Despite limited energy reserves, we suggest that winter microbial communities contribute to the mineralization and recycling of biomass and elements, playing a crucial role in sustaining ecological processes in the Arctic cryosphere.

How to cite: Singh, H., Bradley, J. A., Vogel, T. M., and Larose, C.: Exploring microbial activity and metabolic requirement during the polar winter of the Arctic, EGU General Assembly 2025, Vienna, Austria, 27 Apr–2 May 2025, EGU25-20154, https://doi.org/10.5194/egusphere-egu25-20154, 2025.

Forest ecosystems play a pivotal role in maintaining ecological balance, serving as carbon sinks, biodiversity reservoirs, and providers of critical ecosystem services such as climate regulation and water cycle maintenance. Despite their importance, forests are increasingly threatened by deforestation, degradation, and climate-induced disruptions, leading to significant ecological and socio-economic consequences. Timely and accurate detection of forest disturbances is essential for formulating effective conservation policies, mitigating biodiversity loss, and ensuring sustainable forest management. This study presents a novel backscatter modeling framework designed to enhance the detection of forest disturbances across diverse and heterogeneous landscapes of the Indian subcontinent. Implementing the unique capabilities of synthetic aperture radar (SAR) data, the framework integrates physical scattering mechanisms with vegetation structural variations, enabling precise monitoring of changes in forest cover. SAR's all-weather, day-and-night imaging capabilities make it particularly suitable for regions with frequent cloud cover and varied terrain, addressing key challenges faced by optical-only methods. The proposed methodology employs a hybrid approach that combines theoretical backscatter modeling with advanced machine learning algorithms for feature extraction and classification. This integration includes the strengths of both data-driven analytics and physics-based modeling, offering robust detection capabilities for both abrupt disturbances, such as clear-cutting and gradual changes like forest degradation. The framework's adaptability allows it to account for the complexities of diverse forest structures, dynamic seasonal variations, and landscape heterogeneity, making it a scalable solution for large-scale forest monitoring. Validation of the framework was conducted using multi-temporal SAR datasets and high-resolution optical imagery from key forested regions in the Indian subcontinent. The results highlight the framework’s superior sensitivity and accuracy compared to existing methods, demonstrating its ability to detect a wide range of disturbances with precision. This improved detection capability is critical for understanding the underlying drivers of forest changes and their ecological impacts. By addressing limitations in current forest monitoring techniques, this backscatter modeling framework provides a powerful tool for conservation and sustainable management. Its implementation has the potential to support policy-makers and environmental managers in formulating data-driven strategies for forest protection and restoration. Ultimately, the study underscores the framework’s transformative potential in enhancing forest resilience, promoting biodiversity conservation, and contributing to sustainable development in regions facing increasing environmental and anthropogenic pressures.

How to cite: Rai, K. and Singh, G.: Advanced Backscatter Modeling for Enhanced Detection of Forest Disturbances in the Indian Subcontinent, EGU General Assembly 2025, Vienna, Austria, 27 Apr–2 May 2025, EGU25-188, https://doi.org/10.5194/egusphere-egu25-188, 2025.

EGU25-2268 | Orals | ITS1.8/BG0.4

On the assessment and initialization of European forest state variables in Land Surface Models 

Marine Remaud, Jina Jeong, Guillaume Marie, Omar Flores, Kim Naudts, and Sebastiaan Luyssaert

Forest structure is shaped by forest management practices, land-use changes and forest disturbances including droughts, fires, storms and insect outbreak. It plays an important role in climate by modifying the carbon-water-energy exchanges with the atmosphere, and affects the capability of forests to undergo future disturbances in a changing climate. Given the importance of forest structure for the climate, land surface models are moving towards explicit representations of forest structure and management strategies. We present a new procedure to initialize forest diameters over Europe and document its implications for simulations of future forest carbon sinks. The simulated diameters for each grid cell covered by forests are initialized toward the diameter from a forest inventory. To this end, a 300-years semi-analytical spinup was carried out to bring the soil carbon and nitrogen pools into equilibrium until the European forests were clearcut. Then, a 150-years biosphere simulation over Europe was performed to build a look-up-table of simulated diameters. For each grid point, the year associated with the simulated diameter that is the closest to the observation is selected, enabling the production of new initial state files over Europe. The new initialization procedure makes the initial state of forest more realistic and therefore is expected to have significant influence on the evolution of the forest carbon sink. In this work, we will assess the effect of the initialization procedure on the simulated land carbon sink and we will evaluate the representation of the diameters in the ORCHDEE LSM. The method could be further extended to initialize other forest state variables such as height or aboveground biomass.

How to cite: Remaud, M., Jeong, J., Marie, G., Flores, O., Naudts, K., and Luyssaert, S.: On the assessment and initialization of European forest state variables in Land Surface Models, EGU General Assembly 2025, Vienna, Austria, 27 Apr–2 May 2025, EGU25-2268, https://doi.org/10.5194/egusphere-egu25-2268, 2025.

EGU25-6985 | ECS | Orals | ITS1.8/BG0.4

Forest digital twin: coupling field data, mathematical modelling and 3D representation of a Mediterranean forests   

Riccardo Fornaro, Francesco Giannino, Duncan Nathaniel Heatfield, Valerio Minopoli, Alessandro Aquino, Angelo Rita, Antonio Saracino, and Luigi Saulino

Knowledge of forest ecosystem pattern and process responses to climate change and anthropogenic pressure requires innovative tools that combine monitoring and modelling of tree growth dynamics to account for a more sustainable management of forest resources and ecosystem services. In this context, Digital Twins (DTs) emerge as powerful tool to allow a better interpretation of complex models, summarizing a large amount of data and knowledge into a comprehensive 3D visualization. A Digital Twin is an evolving and comprehensive representation of a physical object, in our case trees, which involves three key elements: a digital representation of the object, an evolving set of data and a dynamic adjustment of the object data. However, due to the structural complexity of the forest stand, and the lack of adequate growth historical data series useful to build and validate the simulations, the full potential of Digital Twin frameworks has yet to be realized in forest field. Our work aims to develop a system that simulate forest growth and spatial patterns through a process-based single tree model and represent the outputs into a 3D immersive and interactive environment, able to reproduce the stand structure of Mediterranean forests. An individual based spatially explicit model has been developed to simulate the biomass growth within a time step of one year and while an immersive 3D dynamic environment enables the user to interact with trees (e.g. tree marking, logging). Competition among trees has been modelled computing the tree influence on surroundings space using a distance-biomass dependent approach. We implemented a set of allometric equations to convert tree biomass into size attributes (e.g. stem diameter, total height) to appropriately represent the modelled forest stand in the 3D environment. The use of DTs can assist forest experts and policymakers in managing complex systems like Mediterranean forests, by simulating several management scenarios and analysing their long-term impacts on forest ecosystem dynamics. Furthermore, process-based models coupled with an immersive 3D representation could help to better understand the forest ecosystem functioning.

How to cite: Fornaro, R., Giannino, F., Heatfield, D. N., Minopoli, V., Aquino, A., Rita, A., Saracino, A., and Saulino, L.: Forest digital twin: coupling field data, mathematical modelling and 3D representation of a Mediterranean forests  , EGU General Assembly 2025, Vienna, Austria, 27 Apr–2 May 2025, EGU25-6985, https://doi.org/10.5194/egusphere-egu25-6985, 2025.

EGU25-7375 | Posters on site | ITS1.8/BG0.4

Outbreaks of invasive phloem feeding Toumeyella parvicornis modified fire behaviour and canopy surface reflectance in Mediterranean Pinus pinea forests 

Luigi Saulino, Antonio Pietro Garonna, Francisco Castro Rego, Angelo Rita, Alessandro Aquino, Greta Liuzzi, Riccardo Fornaro, Enrica Pinelli, Roberto Silvestro, Sergio Rossi, and Antonio Saracino

The continued introduction of non-native insect species, coupled with the rising threat of extreme wildfire events, poses significant risks to terrestrial ecosystems and the services they offer globally. However, the impact of invasive phloem-feeding insect species on fire severity is not well understood, particularly in terms of how they influence fire behaviour and the likelihood of crown fire ignition. Two experimental designs were set up to investigate how the alien tortoise scale (Toumeyella parvicornis) outbreaks have influenced fire behaviour dynamics and canopy surface reflectance in the Mediterranean P. pinea stands severely burnt in the summer of 2017. We combined Rothermel’s model for fire surface spread and Van Wagner’s crown ignition model to simulate fire behaviour and employed data from the Landsat 8 collection to detect canopy wilt symptoms related to T. parvicornis outbreaks. Simulating fire behaviour in single-storied P. pinea stands indicated that all predicted fires were surface fires. An uncertainty analysis concerning the inputs of the canopy fuel attributes model revealed that fires in thinned stands were entirely classified as surface fires. In contrast, in unthinned stands, only 62.7% were surface fires, with 37.3% categorised as conditional fire types. Among the Landsat 8 reflectance bands, only NIR, Green, and SWIR 2 were sensitive to the abundance of T. parvicornis. Based on these sensitive bands, two-band NIR-multiplied vegetation indexes were significantly associated with the abundance of T. parvicornis from the fall generation onward, when sooty mould consistently covered canopy needles. The divergence between observed and predicted fire behaviour underscores the need to investigate the processes and variables linked to T. parvicornis feeding activity on the trees to improve fire behaviour prediction. Understanding how insect outbreaks can modify fire behaviour in Mediterranean stands is crucial for effective management at stand and landscape levels. The satellite vegetation indexes based on sensitive reflectance bands represent an essential tool for an early recognition of insect outbreak distribution on large spatial scale.

How to cite: Saulino, L., Garonna, A. P., Rego, F. C., Rita, A., Aquino, A., Liuzzi, G., Fornaro, R., Pinelli, E., Silvestro, R., Rossi, S., and Saracino, A.: Outbreaks of invasive phloem feeding Toumeyella parvicornis modified fire behaviour and canopy surface reflectance in Mediterranean Pinus pinea forests, EGU General Assembly 2025, Vienna, Austria, 27 Apr–2 May 2025, EGU25-7375, https://doi.org/10.5194/egusphere-egu25-7375, 2025.

EGU25-12297 | ECS | Orals | ITS1.8/BG0.4

Incorporating Insect Disturbances into Terrestrial Biosphere Model: Impacts and Challenges 

Yimian Ma, Sönke Zaehle, Albert Jornet-Puig, and Ana Bastos

Insect disturbances significantly impact multiple functions of forest ecosystems, yet their representation in terrestrial biosphere models remains limited. To address this gap, we developed an insect impacts module in the terrestrial biosphere model QUINCY (QUantifying Interactions between terrestrial Nutrient CYcles and the climate system model). The new module represents bark-beetle and defoliator impacts by introducing standing dead biomass pools and insect-mediated nutrient cycling pathways, and effectively capturing key processes such as snag decay, larvae pool dynamics, compensatory leaf growth, and carbon starvation due to over-defoliation. Model validation against multiple forest sites registering insect disturbances demonstrated good agreement with observed trends in forest dynamics, carbon fluxes, water and energy exchanges, and nutrient transformations during insect disturbances. Long-term simulations revealed that severe insect outbreaks can reduce ecosystem carbon storage by up to 6% for a horizon of 50 years, primarily due to accelerated nutrient leaching through litter decomposition. These results emphasize the critical role of insect disturbances in shaping vegetation carbon dynamics and highlight the importance of integrating these processes into global vegetation models. Our results further underscore the need for observational datasets, including field and satellite-based measurements, to constrain and improve model representations of insect disturbances. By advancing understanding of insect impacts and their interactions with climate, our study contributes to reducing uncertainties in projections of vegetation dynamics and the terrestrial carbon sink under future climate change.

How to cite: Ma, Y., Zaehle, S., Jornet-Puig, A., and Bastos, A.: Incorporating Insect Disturbances into Terrestrial Biosphere Model: Impacts and Challenges, EGU General Assembly 2025, Vienna, Austria, 27 Apr–2 May 2025, EGU25-12297, https://doi.org/10.5194/egusphere-egu25-12297, 2025.

EGU25-13405 | ECS | Posters on site | ITS1.8/BG0.4

Effects of tree-tree competition on growth in post-disturbance, drought-prone montane forests  

Samira Garkisch, Clemens Geitner, and Alois Simon

The regeneration phase of forests is a crucial and vulnerable life stage in tree and forest development, which is likely to be intensified by climate change leading to increased drought events. In addition, the functioning of protective forests in mountain areas also needs to be continuously maintained or quickly restored after disturbances. It is widely thought that competition between trees negatively affects tree growth also in early live stages. Therefore, this study examines the effects of tree-tree competition on tree growth at a reforested post-disturbance site in the Northern Calcareous Alps. Despite high precipitation, the severe site conditions namely, shallow soils, steep slopes and southeastern aspect, result in drought-prone forests and site conditions likely to increase under climate change.

Following a windthrow, an experimental afforestation trail was established in 2010 with four coniferous and three broadleaved tree species. To calculate a distance-weighted competition index (CI), the tree height of the focal tree as well as the distances and heights of its three main competitors were measured in 2023. The CI was then calculated from the sum of distance-weighted ratios of the tree’s height to that of its competitors. Due to the high survival rate, this study focuses on results of the European larch (Larix decidua) and the Norway spruce (Picea abies).

Our results show that European larch has the highest growth rate, with mean tree height of 6.4 m after 12 growing seasons. Furthermore, a strong negative correlation (Pearson r = -0.789) is observed between its height and CI, suggesting that competition has a negative effect on growth. The Wilcoxon-Mann-Whitney test confirmed that tree height was significantly lower under high competition. The opposite was observed for Norway spruce, with a median tree height of 2.65 m with low CI and a tree height of 4.7 m at high CI values.

These results highlight the complex interactions in a mixed forest, where pioneer species such as European larch thrive under extreme site conditions and maintain their leading role in early succession stages. Norway spruce, however, appears to benefit from con- and interspecific clustering at this life stage, which we interpret as advantages of favourable microclimate under severe site conditions. These results highlight the dual role of competition: while it limits growth for some species, it can also create favourable microclimatic conditions for others. These different characteristics play a key role in restoration of forests and their ecosystem services after disturbance. Furthermore, the resilience of a mixed forest structure provides essential benefits during early succession and the crucial regeneration phase despite many challenges posed by climate change.

How to cite: Garkisch, S., Geitner, C., and Simon, A.: Effects of tree-tree competition on growth in post-disturbance, drought-prone montane forests , EGU General Assembly 2025, Vienna, Austria, 27 Apr–2 May 2025, EGU25-13405, https://doi.org/10.5194/egusphere-egu25-13405, 2025.

EGU25-13709 | ECS | Orals | ITS1.8/BG0.4

The impact of windthrow on carbon dynamics in temperate forests: a study case of Co. Laois in Ireland 

Bruna L. Longo, Brian Tobin, and Kenneth A. Byrne

Historic climatic data suggests that severe windstorms have been observed every 10-15 years in Ireland (Gallagher, 1974) and sometimes even more frequently, having a devastating impact on forests in the country. Such severe storms cause a significant number of trees to be uprooted or snapped (McInerney et al. 2016), a phenomenon commonly known as windthrow. Windthrow has extensive consequences for forest management, impacting the operations of forest for timber (wood volume shift to salvage wood, possible quality downgrade due to premature extraction, etc.), the dynamics of forests for nature (light availability, regeneration options, higher deadwood volume, etc.), the safety of forests for public use, the soil dynamics (especially for uprooted trees due to exposed soil), among others. In the context of climate change, natural disturbances such as windthrow might shift forests from carbon sinks to temporary carbon sources (Albrich et al. 2023). In order to understand the impact of windthrow on carbon dynamics in temperate forests, this work uses National Forest Inventory data from county Laois (Ireland) as a study case. Centrally located, county Laois has a forest cover (16.5%) higher than the national average (11.6%), and features diverse conditions, including varied soil types, forest types, as well as management purposes. This study models the impact of windthrow events on carbon pools in county Laois’ temperate forests using the CBM-CFS3 framework (Kurz et al. 2009). Varying disturbance intensities (25%, 50%, 70% and 100% of trees damaged by windthrow) are simulated, and their effects on carbon fluxes across biomass, soil organic carbon, and harvested wood products are analyzed. Management strategies, including salvage logging and natural regeneration, are evaluated to assess both immediate impacts and recovery potential, as well as their role in enhancing carbon resilience.

References

Albrich, K., Seidl, R., Rammer, W., & Thom, D. (2022). From sink to source: changing climate and disturbance regimes could tip the 21st century carbon balance of an unmanaged mountain forest landscape. Forestry: An International Journal of Forest Research, 96(3), 399-409.

Gallagher, G. (1974). Windthrown in state forests in the Republic of Ireland. Irish Forestry, 31(2), 14.

Kurz, W. A., Dymond, C. C., White, T. M., Stinson, G., Shaw, C. H., Rampley, G. J., Smyth, C., Simpson, B. N., Neilson, E. T., Trofymow, J. A., Metsaranta, J., & Apps, M. J. (2009). CBM-CFS3: A model of carbon-dynamics in forestry and land-use change implementing IPCC standards. Ecological Modelling, 220(4), 480-504. 

McInerney, D., Barrett, F., Landy, J., & McDonagh, M. (2016). A rapid assessment using remote sensing of windblow damage in Irish forests following Storm Darwin. Irish Forestry, 73, 19.

How to cite: Longo, B. L., Tobin, B., and Byrne, K. A.: The impact of windthrow on carbon dynamics in temperate forests: a study case of Co. Laois in Ireland, EGU General Assembly 2025, Vienna, Austria, 27 Apr–2 May 2025, EGU25-13709, https://doi.org/10.5194/egusphere-egu25-13709, 2025.

EGU25-14976 | Posters on site | ITS1.8/BG0.4

Short-Term Effects of Selective Cutting on Tree-Related Microhabitats in Cryptomeria japonica Plantations 

Xin Yue Li, Ching-Chu Tsai, Chuan Liu, and Su-Ting Cheng

Tree-related microhabitats (TreMs) are widely recognized in Europe as a strategy to enhance biodiversity in plantation forests. Selective cutting, a common forest management practice, helps maintain forest structure and ecological integrity while balancing economic and ecological needs. This study investigates the short-term effects of selective cutting on TreMs in Cryptomeria japonica plantations. We selected three 0.1 ha square plots within a C. japonica plantation in Xitou, managed by the Experimental Forest of National Taiwan University, and conducted surveys before and six months after selective logging to assess changes in microhabitat availability and heterogeneity. Key TreMs indicators, including cavities, growth deformation, micro-soils, dead branches, bark injuries, and epiphytes, were measured, and a terrestrial LiDAR with a 5-meter grid resolution was used to monitor detailed changes in canopy cover. Modified Hill numbers (q0, q1, q2) were applied to quantify changes in the total types, abundance, and evenness of TreMs. Wilcoxon signed-rank tests were used to compare pre- and post-cutting effects. Results indicated significant increases in Hill numbers (q0, q1, q2), reflecting short-term changes in TreMs. Geometric mean ratios between pre- and post-cutting data showed minimal changes in cavities (0.91, CI: 0.74-1), a moderate increase in growth deformation (1.20, CI: 1-1.41), and no change in micro-soils (1.00, CI: 1-1). In contrast, significant increases were observed in dead branches (1.28, CI: 1.12-1.48), bark injuries (1.11, CI: 1.01-1.22), and epiphytes (1.56, CI: 1.41-1.71), with epiphytes showing the most pronounced change. LiDAR analysis revealed a reduction in canopy cover following logging, which was closely associated with variations in epiphyte abundance, highlighting an interaction between canopy openness and epiphyte colonization. As the first application of the European TreM inventory in Taiwan, this study underscores the importance of further research on microhabitats as indicators of forest ecosystem function and biodiversity at local scales and calls for adaptation of this approach to Taiwan's unique environmental conditions.

Keywords: Cryptomeria japonica Plantation, Tree-related microhabitats (TreMs), Selective cutting, terrestrial LiDAR, Hill numbers, Wilcoxon signed-rank tests.

How to cite: Li, X. Y., Tsai, C.-C., Liu, C., and Cheng, S.-T.: Short-Term Effects of Selective Cutting on Tree-Related Microhabitats in Cryptomeria japonica Plantations, EGU General Assembly 2025, Vienna, Austria, 27 Apr–2 May 2025, EGU25-14976, https://doi.org/10.5194/egusphere-egu25-14976, 2025.

EGU25-15428 | ECS | Posters on site | ITS1.8/BG0.4

Omission of organic layers in soil organic carbon models results in overestimation of carbon turnover rates: a 14C study of temperate and alpine forest soils 

Alexander Brunmayr, Margaux Moreno Duborgel, Luisa Minich, Benedict Mittelbach, Timothy Eglinton, Frank Hagedorn, and Heather Graven

Soil organic carbon (SOC) is the largest terrestrial reservoir in the active carbon cycle, and it is predicted to be a crucial component of the terrestrial carbon sink in the present day and in future climate scenarios. However, commonly used SOC models have been shown to inadequately represent SOC turnover, as evidenced by their consistent overestimation of the radiocarbon (14C) content in forest soils. This implies that models have too fast turnover rates and do not accurately capture the persistence of carbon in the different soil pools. To reconcile observational data and modeling frameworks, we conduct a detailed 14C-based study of the SOC dynamics across climatic and environmental gradients in 54 forest sites in Switzerland. At each site, we gather 14C data for the organic layers and five chemical and density fractions in the mineral soil. Calibrating a novel SOC model with these layer- and fraction-specific 14C data reveals an improved representation of turnover times and environmental dependencies, contrasting with existing models. In particular, we find that, by ignoring organic carbon respiration in the organic layers, most existing soil models have to effectively increase the turnover rates of SOC to compensate for the strongly overestimated carbon inputs into the mineral soil. Our results have the potential to significantly improve the representation of SOC in models, particularly under climate and environmental change.

How to cite: Brunmayr, A., Moreno Duborgel, M., Minich, L., Mittelbach, B., Eglinton, T., Hagedorn, F., and Graven, H.: Omission of organic layers in soil organic carbon models results in overestimation of carbon turnover rates: a 14C study of temperate and alpine forest soils, EGU General Assembly 2025, Vienna, Austria, 27 Apr–2 May 2025, EGU25-15428, https://doi.org/10.5194/egusphere-egu25-15428, 2025.


Climate change poses a challenge for European forestry, requiring the selection of tree species adapted to future conditions. Analyzing this for a large country like Germany requires considering diverse regional environmental conditions in climate, soil, and management history. A promising approach is to utilize simulation models to derive potential natural vegetation (PNV) under climate change, which can help to identify robust candidate species for regions.


We employed the process-based forest landscape model iLand to investigate: (i) the impact of climate change on PNV species composition and carbon stocks  across regions in Germany, and (ii) regional adaptation deficits by comparing future PNV composition with current forest composition (derived from national inventory data). We defined 12 representative ecoregions via cluster analysis of climate, soil, and vegetation data. For each, we created generic landscapes (20-30k ha) reflecting regional environmental gradients. We used these landscapes to simulate PNV with iLand under historical and nine climate change scenarios. Changes in equilibrium species composition and attainable carbon stocks were calculated relative to historical climate simulations. Finally, we created high-resolution maps of future PNV in Germany by mapping the stands of our simulated landscapes to country scale. 


Our landscapes cover 95% of Germany’s forested climate and soil space (defined by the ratio of forest pixels, after removing outliers). Simulations identified regions particularly vulnerable to climate change, as well as those with the greatest mismatch between expected PNV and current forests. To account for regional differences in species suitability is crucial for developing climate change adaptation policies at the national level within Germany.


How to cite: Kerber, J., Seidl, R., and Rammer, W.: Mapping the Future of Germany’s Forests: Modelling Potential Natural Vegetation under Climate Change Scenarios, EGU General Assembly 2025, Vienna, Austria, 27 Apr–2 May 2025, EGU25-16504, https://doi.org/10.5194/egusphere-egu25-16504, 2025.

EGU25-16695 | ECS | Orals | ITS1.8/BG0.4

Mapping forest disturbances and their impacts on protection forests in South Tyrol (Italian Alps) 

Emilio Dorigatti, Marco Mina, and Ruth Sonnenschein

The intensity, frequency, and spatial distribution of forest disturbance regimes across Europe are shifting due to climate change. This raises concerns about the vulnerability of forest ecosystems and the impacts on the goods and services that they provide. Protection against natural hazards is a key service provided by forests in the Alps but current protective effects are threatened by the growing incidence of disturbance events such as windstorms, heavy snowfalls and drought. For planning effective management interventions, detailed information on the patterns of recent forest disturbances and quantifications of their impacts on protection forests are necessary. In our study we focused on a region in the Italian Alps (South Tyrol) with the aims of: i) providing a wall-to-wall disturbance map by agent type (wind, snow, beetles) and an analysis of the spatial patterns of disturbance agents and their interaction, and ii) quantifying the loss of protective effects in protection forests and areas with residual protection given by standing dead trees due to bark beetle.

We analyzed Sentinel-2 timeseries to map disturbances covering the period 2019-2023. We then applied a supervised machine learning classifier leveraging multisource predictors to attribute a disturbance agent to each disturbed patch. Afterwards, we explored the correlation between the areas disturbed by different agents and assessed the areas of protection forest which were affected by disturbances. For these areas, we performed a pixel-based classification to identify areas with residual protective effects given by standing dead trees (i.e., pixels with dead canopy but not downed or salvaged yet) due to recent bark beetle outbreaks.

Our results showed that, over a period of five years, disturbances affected 5.9% of the forests of the study area. Damages due to windthrow (1.6%) and snow (1.3%) had a comparable cumulated impact, while bark beetle caused much larger damages (3%). Snow-damaged areas correlated more strongly with bark beetle damage than wind disturbances. Notably, 5.6% of protection forests in the area were disturbed, with bark beetles causing disproportionately higher impacts compared to the other two agents. Overall, about 1.3% of protection forests still provide some level of protection because they are covered by standing dead trees. These are forests that will soon lose their protective function and should be given high priority in management planning. These findings provide the first detailed mapping of recent disturbances in the region and highlight critical areas where protection forests can no longer offer adequate hazard mitigation. By identifying forests most at risk of losing their protective function, we offer useful information for managers to plan near future interventions in these areas.

How to cite: Dorigatti, E., Mina, M., and Sonnenschein, R.: Mapping forest disturbances and their impacts on protection forests in South Tyrol (Italian Alps), EGU General Assembly 2025, Vienna, Austria, 27 Apr–2 May 2025, EGU25-16695, https://doi.org/10.5194/egusphere-egu25-16695, 2025.

EGU25-18432 | Orals | ITS1.8/BG0.4

The Impact of Forest Management Strategies on Ecosystem Services in China 

Luyao Liu, Konstantin Gregor, Qiao-Lin Gu, Yage Liu, Anzhi Wang, and Anja Rammig

Forest ecosystems are vital for a multitude of ecosystem services including timber provision, climate change mitigation, local climate regulation, and provision of habitat for biodiversity. However, previous studies have primarily focused on individual ecosystem service indicators, with limited attention to the underlying biophysical mechanisms. Investigating multiple services under diverse strategies is critical for assessing their impacts on forest ecosystems. Therefore, in this study, we used the global dynamic vegetation model LPJ-GUESS to simulate the temperate forests in China under scenarios of natural succession and forest management strategies. The natural succession refers to forest regeneration without any human intervention. We analyzed multiple ecosystem services, including carbon sequestration, timber provision, water retention, and biodiversity. We found that (1) under management, forests exhibited short-term higher timber yields and economic benefits, but natural succession maintained higher long-term carbon sequestration; (2) density-based management strategies increased timber production and accelerated the forest regeneration in the short term. However, these activities temporarily increased evapotranspiration and reduced biodiversity due to habitat disturbance, which then affected ecosystem services, especially at the initial stages of harvesting; (3) integrated optimization strategies, focusing on tree species, density, and age structure, can optimize forest structure and enhance the multifunctional ecosystem services in the long term. Our study provides valuable insights into the diverse impacts of the management strategies on ecosystem service provision, offering guidance to policymakers and local stakeholders in balancing ecological conservation and economic priorities through sustainable forestry practices.

How to cite: Liu, L., Gregor, K., Gu, Q.-L., Liu, Y., Wang, A., and Rammig, A.: The Impact of Forest Management Strategies on Ecosystem Services in China, EGU General Assembly 2025, Vienna, Austria, 27 Apr–2 May 2025, EGU25-18432, https://doi.org/10.5194/egusphere-egu25-18432, 2025.

EGU25-18906 | ECS | Posters on site | ITS1.8/BG0.4

Predicted Future Changes in the Mean Seasonal Carbon Cycle: Impacts of Climate Change 

elia vangi, Mauro Morichetti, Daniela Dalmonech, Elisa Grieco, and Alessio Collalti

Through photosynthesis, forests absorb significant amounts of CO₂ from the atmosphere while simultaneously releasing CO₂ back through respiration. The net carbon balance of a forest—whether it functions as a carbon sink (absorbing more CO₂ than it emits) or a carbon source (emitting more CO₂ than it absorbs)—depends on the relative magnitudes of these opposing carbon fluxes. The Mean Seasonal Cycle (MSC) provides a comprehensive view of the average carbon fluxes—Net Ecosystem Exchange (NEE), Gross Primary Production (GPP), and ecosystem respiration (Reco)—throughout the year.  

In this study, we assessed the ‘Three Dimensional–Coupled Model Carbon Cycle–Forest Ecosystem Module’ (3D—CMCC—FEM) ability to simulate key carbon fluxes. We validated the model against observed data and investigated whether the seasonal carbon sink/source dynamics patterns are affected under two climate change scenarios across five European forest sites. More specifically, daily observed meteorological (1997–2005) data for model validation come from the Fluxnet2015 Dataset, and future climate scenarios (2006–2099) are projected from three Earth System Models. These models are part of the Climate Model Intercomparison Project 5 (CMIP5) and are driven by two Representative Concentration Pathways (RCP), specifically RCP 2.6 and RCP 6.0. The five case studies selected to represent key European forest species are chosen for their presence in the Fluxnet network. These sites include: the temperate European beech (Fagus sylvatica L.) forests at Collelongo, Italy (IT—Col), and Sorø, Denmark (DK—Sor); the maritime pine (Pinus pinaster Ait.) forest at Le Bray, France (FR—Lbr); the boreal Scots pine (Pinus sylvestris L.) forest at Hyytiälä, Finland (FI—Hyy); and the temperate Norway spruce (Picea abies (L.) H. Karst) forest at Bílý Kříž, Czech Republic (CZ—Bk1). 

The model, validated under current climate conditions, confirmed the robust predictive ability in estimating NEE, GPP, and Reco across various forest species and climates. Under future climate scenarios, a consistent decline in forests Csink capabilities is observed, with a more pronounced reduction under RCP 6.0. This decline is particularly pronounced in evergreen forests, which showed a greater decrease in NEE than deciduous forests. Finally, it was found that the number of days when evergreen forests act as Csink increases over the years, with a forward shift of DoY to Csink and a backward shift of DoY to Csource. In contrast, deciduous forests maintain a relatively stable number of Csink (and Csource) days throughout the century (fixed DoY to Csink or Csource). The DoY for deciduous forests remains constant, as the earlier onset of the growing season, driven by warming temperatures, is offset by an earlier increase in respiration. This indicates that over the long haul, deciduous forests demonstrate greater efficiency in utilizing photosynthates than evergreen forests. 

How to cite: vangi, E., Morichetti, M., Dalmonech, D., Grieco, E., and Collalti, A.: Predicted Future Changes in the Mean Seasonal Carbon Cycle: Impacts of Climate Change, EGU General Assembly 2025, Vienna, Austria, 27 Apr–2 May 2025, EGU25-18906, https://doi.org/10.5194/egusphere-egu25-18906, 2025.

EGU25-18956 | ECS | Posters on site | ITS1.8/BG0.4

Advancing Tree Growth Prediction with Interactive and eXplainable AI for Tackling Climate Change 

Anahid Wachsenegger, Jasmin Lampert, and Refiz Duro

Understanding the intricacies of tree growth is crucial for understanding vegetation dynamics, optimizing carbon sequestration, preserving biodiversity, and enhancing climate adaptation within forest ecosystems. Leveraging primarily time-series data from dendrometers and weather stations provided by the International Cooperative Program for Forests (ICP-Forest), this study explores tree growth dynamics across diverse regions in Austria. Despite the value of this data, the nature of its collection introduces noise and errors, posing challenges for analysis. To address this, we employ advanced deep learning models within a machine and human interaction framework to predict tree growth, complemented by state-of-the-art explainability AI techniques (e.g., SHAP and LIME). By analyzing dendrometer and weather data, the study specifically investigates the impact of environmental components’ fluctuations over time on tree growth, offering valuable insights into forest ecosystem dynamics and their response to changing climatic conditions. We show that there is a strong correlation between soil moisture, temperature, and individual tree growth, emphasizing the importance of including these environmental factors in predictive models. Furthermore, we underscore the necessity of calculating tree competition parameters (estimated using terrestrial laser scanning data collected for the project), which play a vital role in accurately modelling tree dynamics and growth patterns.  Lastly, initial forecasting results demonstrated high accuracy, providing a robust foundation and serving as a baseline for developing more sophisticated machine learning models. These insights collectively can advance the understanding of forest dynamics and offer a pathway toward enhancing global vegetation models and more effective data-driven decision-making in forestry.

How to cite: Wachsenegger, A., Lampert, J., and Duro, R.: Advancing Tree Growth Prediction with Interactive and eXplainable AI for Tackling Climate Change, EGU General Assembly 2025, Vienna, Austria, 27 Apr–2 May 2025, EGU25-18956, https://doi.org/10.5194/egusphere-egu25-18956, 2025.

A reliable assessment of forest resource stocks, productivity, and harvesting is a central goal of environmental monitoring programs. More specifically, evaluating appropriate management tools has become increasingly critical for assessing forest sustainability. Understanding how forests respond to various management tools is essential for developing and implementing sustainable strategies that enhance the resilience of forest ecosystems. Chestnut forest management practices differ across regions, with coppicing being one of the most common techniques. However, evidence from coppiced chestnut forests has raised concerns, particularly related to soil erosion and land degradation.

This study explores the use of advanced remote sensing and spectroscopic techniques to address two key aspects of land and soil degradation in Italian forests. The first objective is to utilize multi-temporal hyperspectral and multispectral satellite imagery to develop and test methods for identifying clearcut areas in chestnut forests resulting from coppice treatments, as opposed to other causes of bare soil, such as wildfires. The second objective focuses on monitoring the erosion impacts on land and soil degradation using mid-infrared (MIR) spectroscopy.

To achieve these goals, the study employed large-scale, multi-temporal satellite imagery from PRISMA, Sentinel-2, and Landsat 8, with a focus on developing a robust methodology for accurately delineating clearcut zones in chestnut forests located in central Italy (Campania). A pixel-based approach was used to differentiate between clearcut areas and pixels affected by other disturbances, beginning with a bare soil masking technique to create an annual bare soil composite image, followed by the delineation of clearcut zones.

In addition to remote sensing analysis, a comprehensive soil sampling campaign was conducted at active clearcut sites to evaluate the impact of chestnut management on soil degradation, with a focus on soil organic carbon content. Samples were collected from multiple locations within the clearcut areas to account for spatial variability. This dataset was used to identify areas vulnerable to soil erosion through MIR spectroscopy, offering valuable insights into soil function and the long-term impacts of management techniques on soil health.

The results show that the annual chestnut coppice clearcut areas were mapped with overall accuracies of 80%, 87%, and 92% for Landsat 8, PRISMA, and Sentinel-2, respectively. This approach enabled a detailed, high-resolution assessment of land use changes over time and the identification of clearcut zones due to coppice treatments. The use of MIR spectroscopy also facilitated the assessment and monitoring of erosion-prone areas within chestnut clearcuts.

The findings of this research have significant implications for forest management strategies, particularly regarding sustainable forest management and conservation. This study contributes to enhancing land management strategies by providing a deeper understanding of the environmental consequences of forest systems management techniques and highlighting the potential of remote sensing and spectroscopy for monitoring soil degradation.

How to cite: Mzid, N. and Terribile, F.: Integrating Remote Sensing and Mid-Infrared Spectroscopy to Assess Land and Soil Degradation in Forest Ecosystems: Implications for Sustainable Management, EGU General Assembly 2025, Vienna, Austria, 27 Apr–2 May 2025, EGU25-19324, https://doi.org/10.5194/egusphere-egu25-19324, 2025.

EGU25-19761 | Orals | ITS1.8/BG0.4

Modeling Wildfire Risks and Forest Dynamics in Europe: Strategies for Climate-Resilient Management 

Colin Johnstone, Andrey Krasovskiy, Jo Hyun-Woo, Park Eunbeen, Dmitry Shchepashchenko, and Florian Kraxner

Wildfire risk is an escalating concern across EU territories, amplified by climate change and necessitating proactive management. Addressing this issue requires nature-based solutions, such as fuel management, forest conservation, and restoring fire-adapted ecosystems to their natural fire regimes. This study models forest growth across Europe under climate change and varying management strategies, presenting three scenarios aligned with potential policies. We focus on future wildfire dynamics and their impacts on forests, relying on high-resolution modeling of forest growth and burned areas.

We developed a new model for deadwood and litter dynamics and integrated it with models for forest growth and development and wildfire risks to simulate annual disturbances and post-disturbance management. The Wildfire Climate Impacts and Adaptation model (FLAM) identifies wildfire hotspots under historical, current, and future conditions and projects burned areas under various climate scenarios and management strategies. The Global Forest Model (G4M) simulates large-scale forest changes, accounting for growth, mortality, regeneration, and management activities like thinning, harvesting, and replanting.

Results from integrating and calibrating these models with observed fire events, harvest levels, biomass stocks, and other parameters will be presented. Three management scenarios reflecting key directions in forest management are proposed, linked to climate projections through 2070. This approach provides a robust framework for assessing the impacts of policies and legislation on wildfire dynamics across Europe, enhancing our ability to mitigate risks and adapt to changing conditions.
 

How to cite: Johnstone, C., Krasovskiy, A., Hyun-Woo, J., Eunbeen, P., Shchepashchenko, D., and Kraxner, F.: Modeling Wildfire Risks and Forest Dynamics in Europe: Strategies for Climate-Resilient Management, EGU General Assembly 2025, Vienna, Austria, 27 Apr–2 May 2025, EGU25-19761, https://doi.org/10.5194/egusphere-egu25-19761, 2025.

EGU25-19976 | ECS | Posters on site | ITS1.8/BG0.4

Volume growth responses of Scots pine and Norway spruce to nitrogen fertilization: quantitative synthesis of fertilization experiments in Finland 

Johanna Jetsonen, Annamari Laurén, Heli Peltola, Katariina Laurén, Samuli Launiainen, and Marjo Palviainen

Nitrogen (N) fertilization can enhance carbon (C) sequestration in biomass in boreal forests, which has potential to work as a tool addressing climate change and promoting sustainable forest management. The effects of N fertilization on tree growth have been studied widely in boreal forests in Finland, but a quantitative synthesis is still lacking. Therefore, we performed a quantitative synthesis of the effects of N fertilization on Scots pine (Pinus sylvestris L.) and Norway spruce (Picea abies (L.) Karst.) stands across Finland, utilizing data from 9 published studies encompassing 108 Scots pine and 57 Norway spruce observations. Our research involved building multivariate linear regression models that reflect the annual volume growth response induced by N fertilization, incorporating factors such as N dosage, site fertility, and climatic conditions. The models demonstrated that the N dose is the most significant predictor of volume growth response, which is positively correlated with average precipitation but negatively correlated with time since fertilization. Notably, site fertility had significant influence on growth increment for Scots pine. These findings underscore the importance of site-specific precision fertilization schemes to sustainably enhance growth and carbon sequestration, addressing key management implications for boreal forest resilience. Furthermore, this work contributes to the broader framework of forest system modeling by integrating multiple environmental variables and offers insights into adaptive management strategies.

How to cite: Jetsonen, J., Laurén, A., Peltola, H., Laurén, K., Launiainen, S., and Palviainen, M.: Volume growth responses of Scots pine and Norway spruce to nitrogen fertilization: quantitative synthesis of fertilization experiments in Finland, EGU General Assembly 2025, Vienna, Austria, 27 Apr–2 May 2025, EGU25-19976, https://doi.org/10.5194/egusphere-egu25-19976, 2025.

EGU25-20137 | Posters on site | ITS1.8/BG0.4

Advanced Monitoring Techniques and Modelling for Tree Growth under Influence of Climate Change 

Refiz Duro, Anahid Wachsenegger, Hanna Koloszyc, Anita Zolles, Carlos Landivar, Martin Gritsch, Günther Bronner, Larissa Posch, Albert Villalobos Gasca, Jasmin Lampert, Sean Cody, Franz Martin Rohrhofer, and David Conti

Changing climatic circumstances bring more frequent and intense extreme weather events that significantly impact forests in various ways. Since forests are the largest terrestrial sinks for carbon, and are among the richest biological environments on Earth, the goals of understanding the related challenges and improving the forest resilience is high on the agenda to mitigate climate change and save biodiversity. Achieving these goals requires access to data to derive vitality and health of trees, monitor and forecast tree growth, environmental conditions data, as well as suitable data modelling approaches.

Within our research, we exploited a wide set of data sources originating and ranging from remote sensing to in-situ measurement equipment allowing us to address the tree growth and health from different spatial and temporal points of view.

The data from dendrometers provided us with the high frequency (hourly), intraday variation of tree radial growth for assessing long-term growth and instantaneous changes in growth. These data are of extreme value, as no other means to monitor trees on such a high temporal resolution with a very high sensitivity exits. However, to understand the variations in these data, which directly show variation in the tree growth, especially in the context of extreme or sudden changes, they are evaluated within the environmental context. The environmental high-quality data were collected directly from forest sites selected from the Europe-wide Forest monitoring program (ICP-Forests), which has been providing high-quality data on the vitality and adaptability of trees, nutrient cycles, water balance, etc.  

Furthermore, satellite Earth Observation (EO) data for single-tree detection and monitoring forest disturbances like selective logging and drought impacts have been likewise exploited, to explore if they may have an impact on the individual tree growth. We show that a CNN-based U-Net model trained on Very High Resolution (VHR) imagery demonstrates strong potential for identifying tree crowns and validating changes in forest structure. However, challenges such as limited training data diversity and low resolution for small trees underscore the need for further refinements.

Finally, terrestrial laser scanning (TLS) technique delivers single tree point-clouds not only allowing extraction of traditional tree features like diameters at different heights, tree height and crown dimensions, but also providing the possibility of statistical approaches for calculation of various metrics, e.g., point-cloud percentiles along the tree height and tree competition.

We describe the approaches on leveraging these, the challenges we have encountered (e.g., data gaps, errors in data, co-location), how we approached them,  and all in the context of developing predictive AI-based, climate sensitive tree growth models, to support forest management on a local, regional and national level, and thus empowering response to minimize potentially harmful consequences for modern societies in line with the UN Sustainable Development Goals.

How to cite: Duro, R., Wachsenegger, A., Koloszyc, H., Zolles, A., Landivar, C., Gritsch, M., Bronner, G., Posch, L., Villalobos Gasca, A., Lampert, J., Cody, S., Rohrhofer, F. M., and Conti, D.: Advanced Monitoring Techniques and Modelling for Tree Growth under Influence of Climate Change, EGU General Assembly 2025, Vienna, Austria, 27 Apr–2 May 2025, EGU25-20137, https://doi.org/10.5194/egusphere-egu25-20137, 2025.

According the the IPCC's 2023 Synthesis Report on Climate Change, global temperatures have risen approximately 1C since the the pre-industrial period, and there is significant uncertainty around future climate projections. Additionally, IPCC and related scientific literature find that the forestry sector is both vulnerable to and already feeling the effects of climate change. This work sets out to accomplish two goals. The first is contribute a new modeling approach that accounts of intra-annual changes in the variability of weather patterns on tree growth using signal processing and statistical modeling techniques. The second uses these models, in conjunction with climate projections, to develop a portfolio view of the forest through the lens of a changing and uncertain climate future. We leverage publicly available data from the USFS's Forest Inventory and Analysis Database, ORNL's DAYMET, and NASA's NEX-GDDP-CMIP6 to train models based on past observation and then simulate future growth based on 88 projections of future climate. Our models consider species-level reactions to site characteristics and weather patterns across the southeastern United States. 

Finally, we compare the performance of roughly 4.6 million forest compositions, across four species and two management scenarios, to explore the trade-off between expected return and the variance of said return in a Markowitz Portfolio Selection framework when optimiizing financial returns to timber and carbon production, respectively. Special attention is paid to the performance of different species and their relative prevalence in portfolios along the efficient frontier. 

How to cite: Baker, J. and Manner, R.: A Portfolio of Trees in a Changing Climate: Using Signal Processing and Individual Tree Growth Simulations to Develop Mean-Variance Tradeoff Frontiers for Forest Establishment in the Southern United States, EGU General Assembly 2025, Vienna, Austria, 27 Apr–2 May 2025, EGU25-20362, https://doi.org/10.5194/egusphere-egu25-20362, 2025.

EGU25-21265 | Posters on site | ITS1.8/BG0.4

Analysis of Species Composition and Distribution Changes in South Korean Forests Using the Individual Tree Data 

Moonil Kim, Jisang Lee, Jiwon Son, Youngjin Ko, and Mina Hong

The distribution and composition of tree species in forests play a pivotal role in forest ecology, management, and carbon cycling. Consequently, their assessment and prediction are of paramount importance for effective forest management planning and the formulation of climate change adaptation strategies, both at local and national scales. The primary objective of this study was to interpret and forecast patterns of tree species distribution changes observed within Korean forests. To achieve this goal, we utilized data from the 5th to 7th National Forest Inventory to construct basal area data for all tree species within each permanent plot. Subsequently, we conducted a comprehensive analysis of the changing trends exhibited by each tree species. Additionally, we calculated climatic environmental indices highly relevant to tree species distribution using meteorological data provided by the Korea Meteorological Administration. Furthermore, a tree species distribution prediction model was developed by applying the Generalized Additive Model (GAM). Our analysis revealed that prominent tree species with a significant distribution presence in Korean forests included Pinus densiflora (36.2%), Quercus mongolica (14.6%), Quercus variabilis BL (11.0%), Quercus serrata Murray (4.3%), Pinus rigida (3.6%), Larix kaempferi (3.2%), Quercus acutissima (2.8%), and Pinus koraiensis (2.4%), based on basal area. Notably, Pinus densifloraQuercus mongolica, and Pinus rigida showed a consistent decline in forest area. Furthermore, the results from the GAM analysis highlighted a substantial correlation between changes in basal area among major tree species and climate indices, including the Warmth Index (WI), Precipitation Effectiveness Index (PEI), and Minimum Temperature of the Coldest Month Index (MTCI). Forest age also emerged as a closely associated factor. The findings of this study hold significant implications, as they enable us to anticipate future alterations in tree species distributions attributable to natural selection and climate change. In addition, this is the first research using the individual tree-level for develping the tree species distribution model in South Korea. 

∗This work was supported by Korea Environment Industry & Technology Institute through Climate Change R&D Project for New Climate Regime, funded by Korea Ministry of Environment (RS-2022-KE002294).

How to cite: Kim, M., Lee, J., Son, J., Ko, Y., and Hong, M.: Analysis of Species Composition and Distribution Changes in South Korean Forests Using the Individual Tree Data, EGU General Assembly 2025, Vienna, Austria, 27 Apr–2 May 2025, EGU25-21265, https://doi.org/10.5194/egusphere-egu25-21265, 2025.

EGU25-21432 | Posters on site | ITS1.8/BG0.4

Modelling Multiple Interconnected Hazards to Forests in a Changing Climate 

Barry Gardiner, Tam Do, Victor Jorquera Olave, Robin Bourke, and Marc Hanewinkel

Forests face increased threats from multiple hazards, with clear evidence of rising levels of disturbance across the world. In Europe part of this increased disturbance is from the increasing areas of forest across the continent, part is due to the management of the forests, and part is due to the changing climate. Recently the levels of damage have become alarming, with windstorms causing catastrophic damage, forest fires appearing in new and unexpected locations, and extended droughts followed by bark beetle infestations leading to very high mortality in Norway spruce across Central Europe.

The disturbance agents that affect forests are often linked together so that, for example, drought can lead to bark beetle outbreaks, windstorms will often lead to secondary damage from bark beetles, and dead wood from any disturbance can raise the fuel loading in the forest and increase the risk and intensity of any subsequent forest fires. Usually when forest risk has been studied or modelled each disturbance has been studied and modelled separately. In this paper we present a modelling effort to link together, in the R software environment, existing and new disturbance models for wind (fgr), bark beetles (IpsR), drought (SPEI) and forest fires (cffdrs). When coupled with climate sensitive growth models we are able to investigate predicted levels of damage until the end of the century for different climate scenarios. The disturbance models have been linked to the European Forest Dynamics Model (efdm) to assess levels of risk across Europe, and they have been linked to the 3-PG growth model (r3PG) to assess forest risk across Germany at a finer spatial scale. The results allow us to determine the effect of different forest management options and to search for optimal management approaches that can help in the development of more climate resilient forests.

How to cite: Gardiner, B., Do, T., Jorquera Olave, V., Bourke, R., and Hanewinkel, M.: Modelling Multiple Interconnected Hazards to Forests in a Changing Climate, EGU General Assembly 2025, Vienna, Austria, 27 Apr–2 May 2025, EGU25-21432, https://doi.org/10.5194/egusphere-egu25-21432, 2025.

EGU25-21546 | ECS | Posters on site | ITS1.8/BG0.4

Describing the current forest state in the complex mountainous forest landscape of Austria 

Christoph Pucher, Klemens Schadauer, Mathias Neumann, Christian Hochauer, and Manfred Josef Lexer

The lack of consistent and accessible forest data in Europe still provides a challenge for large-scale assessments and simulation studies. Here we compare two approaches for providing a detailed description of the current forest state in the complex mountainous forest landscape of Austria. Approach A integrates point-based National forest inventory with climate and remote sensing data to produce detailed gridded forest information (forest type and structural attributes) at 1 x 1 km resolution. In addition to these data sets, approach B integrates high resolution (10 m) remote sensing tree species data, which has recently become available for Austria. A special focus lies on how the detailed tree species maps can be used to improve the description of the current forest state.

How to cite: Pucher, C., Schadauer, K., Neumann, M., Hochauer, C., and Lexer, M. J.: Describing the current forest state in the complex mountainous forest landscape of Austria, EGU General Assembly 2025, Vienna, Austria, 27 Apr–2 May 2025, EGU25-21546, https://doi.org/10.5194/egusphere-egu25-21546, 2025.

EGU25-1994 | Orals | ITS2.7/BG0.5

Ecosystem heterogeneity is key to limiting the increasing climate-driven risks to European forests 

Giovanni Forzieri, Hervé Jactel, Alessandra Bianchi, Jonathan Spinoni, Deepakrishna Somasundaram, Luc Feyen, and Alessandro Cescatti

The rise in forest disturbances due to climate change poses a serious threat to key forest ecosystem services, yet impact and adaptation assessments are scarce at European scale. Here we estimate the forest biomass loss in Europe due to fires, windthrows and insect outbreaks over 1979-2018 and evaluate potential adaptation benefits by integrating machine learning with disturbance data and satellite products. Results show an average overall annual biomass loss of 41.6±5.3 Mt at European level subject to a significant rise of 2.3±0.3 Mt year-1, largely influenced by climate change (72-98%). The contribution of insect outbreaks appears prominent (79%) compared to windthrows (20%) and fires (1%) and linked to their upsurge after year 2000. However, impacts vary greatly across Europe depending on local environmental conditions. We estimate that enhancing ecosystem heterogeneity could reduce biomass loss by about 18% and such action should therefore be fostered in forest adaptation policies.

How to cite: Forzieri, G., Jactel, H., Bianchi, A., Spinoni, J., Somasundaram, D., Feyen, L., and Cescatti, A.: Ecosystem heterogeneity is key to limiting the increasing climate-driven risks to European forests, EGU General Assembly 2025, Vienna, Austria, 27 Apr–2 May 2025, EGU25-1994, https://doi.org/10.5194/egusphere-egu25-1994, 2025.

EGU25-3177 | ECS | Posters on site | ITS2.7/BG0.5

Vulnerability of the terrestrial ecosystem to climate change in China 

Wei Yuan, Shaojie Mu, and Shuang-Ye Wu

Climate change has significant impacts on the structure and stability of terrestrial ecosystems. China has implemented several restoration projects since the mid-20th century and has experienced a substantial greening trend under climate change. However, the assessment and evaluation of the ecosystem vulnerability in China remains limited. Here, we evaluated the characteristics of ecosystem vulnerability from 1982 to 2020 in China in terms of its exposure, sensitivity, and resilience based on a multiple auto-regression approach. We analyzed the drivers and mechanisms of ecosystem vulnerability from multiple perspectives in different land cover types and climate zones. The results show that ecosystem vulnerability follows a similar spatial pattern to the exposure risk, especially in the eastern plains where the flat topography leads to the relatively higher climate risk. The agro-pastoral ecotone shows relatively high vulnerability due to higher exposure and sensitivity to climate change. The terrestrial ecosystem becomes more vulnerable to climate change when warming rates exceeding 0.04 oC/a and precipitation decrease for more than -5 mm/a. For different land cover types, croplands and forests show relatively high vulnerability and are attributed mostly to exposure and sensitivity respectively. Although grasslands show medium vulnerability on average, their sensitivity to climate change shows greater spatial variation. The transition zone between semi-arid and sub-humid climates is more vulnerable to climate change, but the humid region displays lower exposure and sensitivity because of sufficient water supply hence low sensitivity to precipitation change. Higher variability in temperature and precipitation in high-exposure and high-sensitivity areas compared to low-exposure and low-sensitivity areas, but higher variability in NDVI is mainly found in low-resilience areas. This study contributes to the understanding of terrestrial ecosystem vulnerability in China and highlights the urgency of climate mitigation actions.

How to cite: Yuan, W., Mu, S., and Wu, S.-Y.: Vulnerability of the terrestrial ecosystem to climate change in China, EGU General Assembly 2025, Vienna, Austria, 27 Apr–2 May 2025, EGU25-3177, https://doi.org/10.5194/egusphere-egu25-3177, 2025.

EGU25-3495 | Posters on site | ITS2.7/BG0.5

Digital twin technology used for assessment of ecosystems state in a climate change conditions in Romania 

Florian Bodescu, Simona Marculescu, Iulia Radu, Florina Dediu, Ioan Theodor Bodescu, and Alina Radutu

Biodiversity and ecosystems monitoring and services evaluation are part of all major European and international policy making initiatives and actions, the GEO BON, UN SDGs and the EU green deal are probably the most important. Following the prepare-design-demonstrate approach of the EU climate change adaptation mission, after the mapping and assessment of ecosystems and their services process (MAES) implementation in Romania by our team through project Demonstrating and promoting natural values in support of decision-making processes in Romania - Nature4Decision-Making - N4D,   we have focused on  developing a set of remote sensing based indicators for assessing ecological conditions adapted to ecosystems, for five study cases one for each biogeographical region in Romania (alpine, continental, steppe, panonic, marine Black Sea). The analysis was performed in respect of the general objective of Exploitation of Satellite Earth Observation data for Natural Capital Accounting and Biodiversity Management - EO4NATURE project, to develop state-of-the-art concepts and standardized methods for addressing environmental challenges related to climate change. The specific objectives directly address the goals related to the Horizon EU mission like answering the ecosystem monitoring needs by integrating Copernicus Sentinel and other satellite data for deriving useful information for ecosystem assessment (ecosystem condition, ecosystem services). The developed framework can be used for a large amount of past, present and future EO data organized in data cubes to evaluate time series of indicators variability and to conclude for physical, chemical, composition, structural, functional and inter-ecosystemic states to express the vulnerability and resilience of ecosystems. The obtained results from EO4NATURE are part of main scientific and research initiative from Romania based on Competence Center for Climate Change Digital Twin Earth for forecasts and societal redressment: DTEClimate.

How to cite: Bodescu, F., Marculescu, S., Radu, I., Dediu, F., Bodescu, I. T., and Radutu, A.: Digital twin technology used for assessment of ecosystems state in a climate change conditions in Romania, EGU General Assembly 2025, Vienna, Austria, 27 Apr–2 May 2025, EGU25-3495, https://doi.org/10.5194/egusphere-egu25-3495, 2025.

EGU25-4388 | ECS | Orals | ITS2.7/BG0.5

Assessing the impact of lightning on regional disturbance regimes across a tropical forest gradient 

Ian McGregor, Jeffrey C. Burchfield, Cesar Gutierrez, Matthew W. Chmielewski, Helene C. Muller-Landau, Phillip M. Bitzer, Stephen P. Yanoviak, and Evan M. Gora

The first comprehensive investigation into the ecological effects of lightning revealed that it is a major driver of tropical plant mortality, gap formation, and biomass carbon turnover in a mature tropical forest. These findings demonstrated the capacity of lightning to influence forest dynamics, but those data are restricted to a single mature forest at a spatial scale (~15 km2) that is much smaller than the scale at which the atmospheric processes controlling lightning operate (10s to 100s of km). Given evidence that lightning and severe storm frequency is increasing with climate change, we need large-scale studies of lightning effects across multiple forest types to understand the future forest dynamics and carbon budgets. Here we present the results from the first regional study of lightning ecology, wherein we use an array of electric field change meters (FCMs) to track lightning strikes in real-time over 20,000 km2 in central Panama. This network provides direct measurements of each strike’s intensity with high detection efficiency and a precision accuracy of < 30 m. The ecological effects of these lightning strikes were quantified using subsequent field surveys, validated at medium-scales (15 km2) using drone imagery, and upscaled to quantify regional disturbance regimes by integrating the FCM, drone, and field data.


This is the first spatially-explicit record of a regional disturbance regime for any given driver of tree mortality in a tropical forest. We show that lightning exhibits strong patterns of spatiotemporal aggregation. Based on these patterns, we estimate the study area and duration needed to accurately capture the contributions of lightning to plant mortality and biomass carbon dynamics, which is much larger than a typical forest plot (1 ha) and longer than a typical study time-frame for this size plot (10 years). Using field data describing the ecological effects of lightning, we then estimate the absolute contributions of lightning to biomass carbon turnover across the study regions, including 8,000 km2 of tropical forest. We then test if regional patterns of lightning-caused disturbance predict regional variation in forest structure and carbon storage. We expect our findings will be key to more accurate carbon accounting and the development of mechanistic demographic vegetation models.

How to cite: McGregor, I., Burchfield, J. C., Gutierrez, C., Chmielewski, M. W., Muller-Landau, H. C., Bitzer, P. M., Yanoviak, S. P., and Gora, E. M.: Assessing the impact of lightning on regional disturbance regimes across a tropical forest gradient, EGU General Assembly 2025, Vienna, Austria, 27 Apr–2 May 2025, EGU25-4388, https://doi.org/10.5194/egusphere-egu25-4388, 2025.

EGU25-5124 | ECS | Orals | ITS2.7/BG0.5

Normalised representation of terrestrial vegetation response to extreme weather events 

Yana Savytska, Viktor Smolii, and Kira Rehfeld

Since the beginning of the industrial era, the climate of our planet and the human environment have been changing rapidly. Therefore, known and new types of extreme events have been and will continue to be a challenge. An example of a climate challenge is climatological extremes. In recent decades, extreme weather events such as wildfires, floods, droughts, and heat waves have increased across the globe. These extreme events can disturb and alter ecosystems over timescales ranging from minutes to months. However, the recovery and adaptation processes often take far longer than the extreme events. While the intensity of adaptation efforts may vary, they inevitably follow disturbances.

Here, we focus on the recovery dynamics of vegetation in different types of ecosystems after droughts and heat waves, which are the most damaging types of weather extremes. The study covers the last decades period and is based on satellite data.

Disturbance-induced changes in terrestrial ecosystems affect photosynthetic activity, reducing carbon dioxide (CO2) fixation. We hypothesise that, in return, the temporal dynamics of atmospheric CO2 fixation by vegetation may indicate different stages of ecosystem recovery - normal ecosystem state (before extreme), imbalance phase, post-extreme phase, recovery phase, or collapse. We find such an approach helpful for understanding the time frames of the phases and capturing phase transitions and general ecosystem states in near real-time.

The identification of vegetation recovery stages is influenced by several factors, including environmental conditions and seasonal cyclicity. To ensure the effectiveness of an automated approach, a unified phase-stage representation for comparability and analysis of CO2 uptake is required.

To achieve this, we divide daily CO2 uptake values by their maximum values observed during a year without significant droughts and heatwaves. We have chosen the observation period from 1993 to 2005, which includes a European drought in 2003 and the periods before and after it. As a result of normalisation, stronger ecosystem recovery will correspond to values around “1” and weaker recovery - to a range around “0”. Negative values could indicate the dominance of CO2 emissions or ecosystem degradation processes.

Vegetation indices, such as NDVI, can be employed as markers of transformation scope to identify the beginning and end of the vegetation growth period activity. This allows us to represent the time scale in a normalised relative interval – [0;1].

The results are a first step towards a normalised representation of the response of terrestrial vegetation to further study the dynamics of its recovery from extreme weather events.

How to cite: Savytska, Y., Smolii, V., and Rehfeld, K.: Normalised representation of terrestrial vegetation response to extreme weather events, EGU General Assembly 2025, Vienna, Austria, 27 Apr–2 May 2025, EGU25-5124, https://doi.org/10.5194/egusphere-egu25-5124, 2025.

Ecological restoration, as a component of sustainable development, can mitigate ecosystem degradation and improve ecological diversity. Accurate identification of ecological restoration priority areas (ERPAs) is essential for developing restoration practice. However, few studies have considered both ecosystem reference conditions and vulnerability during ecological restoration. In this study, a comprehensive framework of ERPA identification was developed by integrating ecosystem reference conditions and vulnerability. Using the Jialing River Basin (JRB), a representative basin of the Yangtze River, as a case study, our results revealed that under average climate conditions, the areas with high values of ecosystem reference conditions were mostly in the eastern and southeastern mountainous areas of the JRB, whereas the potential areas for ecological restoration were concentrated in the central northern and southern basin. Additionally, regions with high ecosystem vulnerability were found in the northern mountainous areas and southern urban areas and were scattered along major tributaries. Overall, the identified ERPAs were predominantly in the central northern and southern urban areas, with some scattered areas in the central basin, accounting for 9.61% of the JRB. Consequently, the JRB can be divided into four regions with targeted management strategies to address ecosystem degradation and implement restoration activities. Moreover, we suggest that the proposed framework for identifying ERPAs is used for clarifying restoration objectives, assessing the ecological baseline, and offering a scientific reference for large-scale ecological restoration efforts.

How to cite: Wang, H., Zhao, Z., and Wu, X.: Integrating ecosystem reference conditions and vulnerability to identify ecological restoration priority areas, EGU General Assembly 2025, Vienna, Austria, 27 Apr–2 May 2025, EGU25-5527, https://doi.org/10.5194/egusphere-egu25-5527, 2025.

EGU25-5664 | Orals | ITS2.7/BG0.5

The importance of non-climatic factors in climate risk assessments for ecosystems  

Ana Bastos, Eleanor Butler, Laura Eifler, Tiago Ermitão, Yimian Ma, Mirco Migliavacca, Franziska Müller, Sebastian Sippel, Myriam Terristi, Chenwei Xiao, and Xin Yu

High-impact events driven by weather extremes, such as large-scale drought-induced mortality, crop failure, mega-fires, and widespread tree mortality are expected to intensify under climate change in many regions. While the importance of climate change in increasing the frequency or intensity of many such events has been demonstrated by climate attribution studies, non-climatic factors such as landscape structure and composition, diversity, biotic agents, disturbance history, etc., shape ecosystem resistance and ability to recover from such events.

Quantifying the role of non-climatic factors on observed impacts is challenging, since they are often of second order importance, given the signal of weather extreme anomalies. Nevertheless, quantifying the importance of such non-climatic factors and how they are influenced by human activities is crucial to anticipate potential loss of resistance/resilience and to support effective adaptation strategies to ongoing climate change. Here, we discuss the importance of non-climatic factors for climate risks based on historical events and show how the ecoclimatic event framework can be adapted to support the attribution of climatic vs. non-climatic factors in climate risk assessments for ecosystems.

How to cite: Bastos, A., Butler, E., Eifler, L., Ermitão, T., Ma, Y., Migliavacca, M., Müller, F., Sippel, S., Terristi, M., Xiao, C., and Yu, X.: The importance of non-climatic factors in climate risk assessments for ecosystems , EGU General Assembly 2025, Vienna, Austria, 27 Apr–2 May 2025, EGU25-5664, https://doi.org/10.5194/egusphere-egu25-5664, 2025.

EGU25-5795 | ECS | Posters on site | ITS2.7/BG0.5

A novel Approach For Automatically Identifying and Evaluating Climate Stress Thresholds in Potato Yields 

Mojtaba Saboori, Mojtaba Naghdyzadegan, Ritesh Patro, and Ali Torabi Haghighi

The stability of agricultural production, critical for global food security, is increasingly threatened by climate variability and extreme weather events. This study focuses on identifying and evaluating climate-induced stress thresholds for potato yields in Finland and the Netherlands, two regions with contrasting climatic and agronomic conditions. A comprehensive dataset spanning multiple decades was analyzed using advanced machine learning techniques, including Random Forest modeling, SHAP (SHapley Additive exPlanations) values for feature importance, and Partial Dependence Plots (PDPs) to detect key climate indicators and their thresholds. By classifying yields into shocked, normal, and boosted categories based on detrended yield percentiles, the study pinpoints the specific climatic conditions that transition potato yields into stress states. District-level analyses highlight spatial variations, with northern Finland and southern Netherlands particularly sensitive to compound climatic extremes, emphasizing the need for localized adaptation strategies. Findings reveal distinct regional stressors: in Finland, excessive June precipitation (>69 mm) consistently emerged as a critical driver of yield reductions, while in the Netherlands, extreme July temperatures (>31.5°C) and deviations in warm-day counts were the dominant stressors. This research is the first to identify climate-induced stress thresholds by accounting for the nonlinear and interactive effects of multiple climate factors. The findings provide actionable thresholds for policymakers and farmers, enhancing climate resilience and ensuring sustainable agricultural practices under future climate scenarios.

How to cite: Saboori, M., Naghdyzadegan, M., Patro, R., and Torabi Haghighi, A.: A novel Approach For Automatically Identifying and Evaluating Climate Stress Thresholds in Potato Yields, EGU General Assembly 2025, Vienna, Austria, 27 Apr–2 May 2025, EGU25-5795, https://doi.org/10.5194/egusphere-egu25-5795, 2025.

EGU25-5866 | ECS | Orals | ITS2.7/BG0.5 | Highlight

Projected exposure of terrestrial vertebrates to different extreme climate events reveals high vulnerability to multiple hazards 

Stefanie Heinicke, Karim Zantout, Hjalmar S. Kühl, Christopher P.O. Reyer, Sandra Zimmermann, Maik Billing, Simon N. Gosling, Manolis Grillakis, Stijn Hantson, Akihiko Ito, Sian Kou-Giesbrecht, Aristeidis Koutroulis, Benedikt Mester, Hannes Müller Schmied, Sebastian Ostberg, Kedar Otta, Yadu Pokhrel, and Katja Frieler

Climate change is intensifying extreme climate events, fundamentally altering ecosystem disturbance regimes. Impacts on biodiversity are typically assessed using climate model outputs (i.e., temperature, precipitation) or by focusing on one type of extreme event. For this study, we used a new dataset covering four climate extremes (droughts, heatwaves, river floods, and wildfires) derived from the output of five climate models and six climate impact models for future projections under three climate scenarios (SSP1-2.6, SSP3-7.0 and SSP5-8.5) from the Inter-Sectoral Impact Model Intercomparison Project (ISIMIP Phase 3b). We assessed the exposure of 33,936 terrestrial vertebrate species (amphibians, birds, mammals, and reptiles). We also compiled published evidence on how species respond to extreme events. Heatwaves emerged as the most prevalent threat, with over 70% of species' geographic ranges projected to be exposed by 2050 (SSP3-7.0 scenario) - a 60% increase from 2000 levels. More than 21,000 species face heatwave exposure in 75% of their range. Wildfire exposure is projected to affect more than 20% of species ranges by 2050, increasing to 30% by 2085, with more than 5,000 species exposed in 50% of their range by mid-century. Notably, our findings indicate substantial multi-hazard exposure, with approximately 30% of species’ geographic ranges facing at least two types of extreme events by 2050. Hotspots are species-rich areas in the tropics. More than 70 species, mostly amphibians and reptiles, are projected to be exposed to a high frequency of three types of events over 75% of their range. Most of these species already have declining populations and are listed as threatened on the IUCN Red List of Threatened Species. Our study highlights the importance of studying the impacts of extreme events on biodiversity in a multi-hazard context. The combination of high exposure with documented negative impacts - such as heat stress mortality, reproductive failure, or wildfire injury – is of particular concern for already threatened species. This underscores the urgency of developing targeted interventions for vulnerable species.

How to cite: Heinicke, S., Zantout, K., Kühl, H. S., Reyer, C. P. O., Zimmermann, S., Billing, M., Gosling, S. N., Grillakis, M., Hantson, S., Ito, A., Kou-Giesbrecht, S., Koutroulis, A., Mester, B., Müller Schmied, H., Ostberg, S., Otta, K., Pokhrel, Y., and Frieler, K.: Projected exposure of terrestrial vertebrates to different extreme climate events reveals high vulnerability to multiple hazards, EGU General Assembly 2025, Vienna, Austria, 27 Apr–2 May 2025, EGU25-5866, https://doi.org/10.5194/egusphere-egu25-5866, 2025.

Over the last decade, several extreme weather events contributed to considerable loss and degradation of forest ecosystems throughout central Europe [1]. For future forest protection an in-depth understanding of these disturbances and their interactions is crucial to target the transformation and adaptation of forests [2]. The vulnerability of forest stands to disturbances is determined by the interaction of a large number of environmental influences and their characteristics. The influencing variables are interrelated at multiple dimensions and scales [3]. Due to the complexity of cause-effect relationships in forest ecosystems and the multitude of factors involved, stress response of forests and trees has not been fully decoded as yet and hence remains a research topic of growing importance for climate adaptation [4].

The recording of small-scale ecological phenomena and their dynamics requires spatially and temporally continuous high-resolution data to retrieve explicit information, which cannot fully be covered by current terrestrial monitoring networks e.g., the ICP Forests crown conditions survey or national forest inventories. The combination of satellite time series analysis and change detection algorithms can detect forest vitality changes across time and space at a high resolution in order to extract disturbance signatures with event-specific patterns from phenological time series [5].

In this study, we use forest disturbance recordings of forest fires, storm damage, and forest defoliation or dieback induced by insects, fungal pathogens, or drought from the European Forest Fire Information System (EFFIS), the Database of wind disturbances in European forest (FORWIND), the Database of European Forest Insect & Disease Disturbances (DEFIS2), and the Global Drought Observatory (GDO) as well as MODIS phenological time series ranging from 2001 to 2023 to gather disturbance sequences and compile a pan-European disturbance interaction chronology map in order to identify forest disturbance hotspots in Europe, extract disturbance interaction related signatures from phenological time series and quantify the interaction effects in terms of disturbance specific changes in forest vitality over space and time.


References:

[1] Patacca, M, Lindner, M, Lucas‐Borja, ME, Cordonnier, T, Fidej, G, Gardiner, B, ... & Schelhaas, MJ (2023). Significant increase in natural disturbance impacts on European forests since 1950. Global change biology, 29(5), 1359-1376. https://doi.org/10.1111/gcb.16531

[2] Bolte, A, Ammer, C, Löf, M, Madsen, P, Nabuurs, GJ, Schall, P, ... & Rock, J (2009). Adaptive forest management in central Europe: climate change impacts, strategies and integrative concept. Scandinavian Journal of Forest Research, 24(6), 473-482. https://doi.org/10.1080/02827580903418224

[3] Sanders, TGM, Spathelf, P, & Bolte, A (2019). The response of forest trees to abiotic stress. In Achieving sustainable management of boreal and temperate forests (pp. 99-128). Burleigh Dodds Science Publishing. DOI:10.19103/AS.2019.0057.05

[4] Ammer, C, Fichtner, A, Fischer, A, Gossner, MM, Meyer, P, Seidl, R, ... & Wagner, S (2018). Key ecological research questions for Central European forests. Basic and Applied Ecology, 32, 3-25. https://doi.org/10.1016/j.baae.2018.07.006

[5] Gnilke, A, & Sanders, TGM (2022). Distinguishing abrupt and gradual forest disturbances with MODIS-based phenological anomaly series. Frontiers in Plant Science, 13, 863116. https://doi.org/10.3389/fpls.2022.863116

How to cite: Gnilke, A., Stadelmann, C., and Sanders, T.: Disentangling multi-event forest disturbances and interaction effects using pan-European records and satellite-based phenological time series, EGU General Assembly 2025, Vienna, Austria, 27 Apr–2 May 2025, EGU25-6299, https://doi.org/10.5194/egusphere-egu25-6299, 2025.

Intensified water stress driven by greenhouse gas-induced warming plays a pivotal role in regulating terrestrial vegetation growth across arid-to-humid transition zones, with significant implications for the global carbon cycle. However, the shifting sensitivity of the vegetation productivity to a warming climate remain poorly understood. Since the early 2000s, Northern East Asia (NEA) has experienced pronounced reductions in gross primary production (GPP), primarily attributed to notable soil moisture (SM) decreases and water vapor deficit (VPD) increases. Our findings demonstrate distinct ecosystem responses along aridity gradients: vegetation growth in arid regions is predominantly influenced by SM, while VPD exerts a stronger influence in semi-arid to humid zones under warming and drying conditions. These results highlight the complex and regionally varied responses of vegetation dynamics across aridity gradients. As climate variability intensifies and drylands expand, understanding these sensitivities becomes essential for predicting ecosystem vulnerability and assessing vegetation responses to future climate scenarios.

How to cite: Wang, Z.: Aridification enhancing vegetation sensitivities to soil and atmospheric dryness in northern East Asia, EGU General Assembly 2025, Vienna, Austria, 27 Apr–2 May 2025, EGU25-7667, https://doi.org/10.5194/egusphere-egu25-7667, 2025.

Climate change is responsible for the increase in frequency and magnitude of extreme meteorological events, including windstorms, which are expected to cause greater damage to both natural and human resources. In European forests, wind damage is already the first cause of timber loss. Additionally, in the Alps context forests provide protection against gravitational hazards, a function that could be completely or partially compromised in case of wind damage. Thus, identifying the most wind-vulnerable forests is crucial to actively manage them and possibly increase their resistance to such events.

To address this challenge, various physically and statistically based models have been developed to estimate forest vulnerability to windstorms. Such models consider both stand and single tree parameters to derive the critical wind speed (CWS), defined as the wind speed threshold above which damage is likely to occur. While the CWS quantifies the forest wind vulnerability, assessing the probability of forest damages requires the probability of occurrence of a given windstorm event. Moreover, the latter could be influenced by climate change given that the regime of windstorm events is expected to change in the future.

In this study, we assess the forest wind vulnerability of the Rocca Pietore municipality area, using high-resolution LiDAR data to extract detailed stand and individual tree characteristics. These data are input into the semi-mechanistic ForestGALES model to calculate the CWS. The probability and the magnitude of wind damages are calculated using km-scale Convection Permitting Models (CPMs) from CORDEX-FPS on Convective Phenomena over Europe and the Mediterranean (FPS Convection). Specifically, we used wind data from the CPMs ensemble for both historical and future conditions. The study shows the critical maps of likelihood of forest wind damages under current conditions and the future scenario RCP8.5, highlighting changes across the study region and identifying the more exposed areas.

This study underscores the importance of integrating high-resolution forest and climate data to assess the vulnerability of natural resources against windstorms. By combining detailed forest characteristic data with advanced climate projections, the adopted approach provides valuable insights for forest management and climate adaptation planning.

How to cite: Baggio, T., Fosser, G., and Lingua, E.: Assessing future wind vulnerability of mountain forests using high-resolution remote sensed and climate data: a pilot study in the Italian Alps, EGU General Assembly 2025, Vienna, Austria, 27 Apr–2 May 2025, EGU25-8452, https://doi.org/10.5194/egusphere-egu25-8452, 2025.

The European “Floods” Directive requires river basin district authorities to identify flood prone areas and potential adverse consequences on built and natural environments. However, there are few examples of methods to assess flood impact to environment at the spatial scale of river basin districts. Moreover, the lack of data concerning the environmental impacts occurred during past floods constrains their identification as well as the definition of empirical vulnerability models.

This work examines the environmental impacts of the 2023 floods in Emilia-Romagna (Italy), through the collection, analysis and georeferencing of information available on newspaper and social media after the event. The analysis highlights that damage to natural ecosystems is often overlooked compared to direct economic losses. The floods caused significant harm, including the release of pollutants, destruction of natural habitats, and disruption of ecosystem services. The most affected areas were water resources, aquatic ecosystems, and terrestrial habitats, with primary effects such as pollution, submersion, and erosion. Specific damages included bathing bans due to water contamination, interruption of bird nesting, fish and bivalve deaths, and alterations in coastal ecosystems. The impacts were spatially concentrated in coastal areas and river deltas, with temporal variability. Some effects, like bathing bans, were resolved within 30-45 days, while others, such as nesting disruption and soil contamination, had longer-term consequences. Assessing these impacts remains challenging due to the lack of systematic monitoring and shared methodologies. Natural resilience dynamics and indirect effects, including health and economic consequences, are also poorly understood. We conclude that a greater interdisciplinary focus is needed to understand and integrate environmental impacts into flood risk management. Future research should address specific ecosystem vulnerabilities and develop metrics for assessing damage based on ecosystem services.

Reference: Arrighi, C. and Domeneghetti, A.: Brief communication: On the environmental impacts of the 2023 floods in Emilia-Romagna (Italy), Nat. Hazards Earth Syst. Sci., 24, 673–679, https://doi.org/10.5194/nhess-24-673-2024, 2024.

Acknowledgements: This study was carried out within the RETURN Extended Partnership and received funding from the European Union Next-GenerationEU (National Recovery and Resilience Plan – NRRP, Mission 4, Component 2, Investment 1.3 – D.D. 1243 2/8/2022, PE0000005)

How to cite: Domeneghetti, A. and Arrighi, C.: Environmental impacts of a flood: an overlooked problem - Evidences from the 2023 Italian floods, EGU General Assembly 2025, Vienna, Austria, 27 Apr–2 May 2025, EGU25-10528, https://doi.org/10.5194/egusphere-egu25-10528, 2025.

EGU25-10928 | ECS | Posters on site | ITS2.7/BG0.5

Modelling Biomass Projections in Grasslands of Central Spain Under Climate Change Scenarios 

Marcos Aragón Pizarro, Carlos G. H. Díaz-Ambrona, Ana M. Tarquis, Andrés F. Almeida-Ñauñay, and Ernesto Sanz

Grasslands are vital ice-free ecosystems that provide essential ecosystem services, including carbon sequestration, biodiversity preservation, and pollination. However, these systems face significant threats from rising temperatures and reduced precipitation, necessitating a deeper understanding of their dynamics to inform sustainable management. This study investigates the potential changes in grassland biomass under future climate scenarios, offering insights into long-term trends and adaptive strategies.

The study focuses on grasslands in the Community of Madrid, central Spain, covering approximately 41% of the territory. To analyze biomass variations, we established a 5x5 km grid across the region, selecting research areas based on proximity to soil pits and a minimum grassland coverage of 40% per grid cell. Observational climate data (1975–2021) and future projections (2022–2100) were used, derived from SSP-2.6, SSP-4.5, SSP-7.0 and SSP-8.5 scenarios based on Shared Socioeconomic Pathways.

Biomass calculations are estimated using the SIMPAST model. This model, designed to predict biomass under varying climatic conditions, required inputs such as hydrological balance, solar radiation, and an initial seed count. Vegetation species and biomass measurements are being conducted from September to May 2024–2025 to refine and evaluate model accuracy and assess water use efficiency across the three study areas.

Preliminary results reveal significant spatiotemporal variations in grassland biomass, linked to projected changes in temperature and precipitation patterns. The findings underscore the importance of adaptive management strategies tailored to specific climate scenarios to maintain grassland ecosystem services.

Acknowledgements: The authors acknowledge the support of Project “Garantía Juvenil” scholarship from Comunidad de Madrid, as well as Universidad Politécnica project Clasificación de Pastizales Mediante Métodos Supervisados - SANTO (project number: RP220220C024).

How to cite: Aragón Pizarro, M., Díaz-Ambrona, C. G. H., Tarquis, A. M., Almeida-Ñauñay, A. F., and Sanz, E.: Modelling Biomass Projections in Grasslands of Central Spain Under Climate Change Scenarios, EGU General Assembly 2025, Vienna, Austria, 27 Apr–2 May 2025, EGU25-10928, https://doi.org/10.5194/egusphere-egu25-10928, 2025.

EGU25-11659 | Posters on site | ITS2.7/BG0.5

Rising summer heatwave exposure of global peak vegetation productivity 

Zhiqin Tu, Jianyang Xia, Jiaye Ping, Cuihai You, and Xingli Xia

Projected increases in both frequency and intensity of heatwaves during the 21st century pose significant risks to terrestrial ecosystems. Yet, the extent to which these heatwaves threaten peak vegetation productivity, a fundamental driver of terrestrial carbon uptake, remains largely unknow. Here, we used sun-induced fluorescence, a proxy of vegetation productivity, to find all peaks in the vegetation growth during 2001 to 2018 and employed daily maximum temperature to detect spatiotemporal contiguous heatwaves. The study revealed vegetation growth peaked in summer across 86.06% of the Northern Hemisphere and 58.25% of the Southern Hemispheare, with 32.25% of global vegetated areas experiencing heatwaves every year. The temporal dynamics analysis showed that the global advance of vegetation growth peak (48.33%) and the increase of heatwave days (42.67%) both presented large spatial heterogeneity. We found that over half of the global vegetated areas (52.16%) experienced at least one peak of vegetation growth exposed to heatwaves, with the total affected area expanding by approximately 72,700 km² per year. The response of peak growth to heatwave depended on the background climate. These findings highlight the intensifying risk of heatwaves to global vegetation productivity, with potentially severe consequences for land carbon uptake and the resilience of ecosystems to climate change.

How to cite: Tu, Z., Xia, J., Ping, J., You, C., and Xia, X.: Rising summer heatwave exposure of global peak vegetation productivity, EGU General Assembly 2025, Vienna, Austria, 27 Apr–2 May 2025, EGU25-11659, https://doi.org/10.5194/egusphere-egu25-11659, 2025.

The effects of tropical cyclones on phytoplankton biomass and community structure in the coastal ocean vary with storm characteristics (i.e., wind v. runoff) and with prior conditions of the ecosystem (i.e., stratified v. well-mixed water column). A recent meta-analysis suggests that phytoplankton are sensitive to rainfall delivered to coastal ecosystems and show tradeoffs between resistance and resilience to these pulse disturbance events. Since 2019, monthly sampling data has been collected at 2 nearshore estuarine sites along the south-central Louisiana coast for water quality, phytoplankton biomass, and community composition. Since 2022, data has been collected from 5 estuarine sites via continuous sondes measuring abiotic variables (including nitrate at 1 site) and biomass of total phytoplankton (as chlorophyll-a) and freshwater cyanobacteria (as phycocyanin) every 15 minutes. Eleven named tropical cyclone systems have impacted the Louisiana coast since 2019, while additional flood (2019), unnamed storm (2024), and drought (2023) events also occurred. In 2024, Hurricane Francine made landfall in Terrebonne Parish. In the 1-2 days around landfall, a site 120 miles west showed a substantial, but temporary, increase in biomass. Conversely, a site 160 miles east showed little change during the storm, but biomass increased one week after landfall as falling salinity indicated runoff. Insights from individual pulse disturbances on phytoplankton dynamics, along with aggregated responses to disturbance characteristics, will be further discussed in this presentation.

How to cite: Stauffer, B., Piwowarski, E., Lombardi, M., and Perry, S.: Phytoplankton responses to tropical cyclone events: insights from discrete and continuous water quality monitoring in Louisiana estuaries, EGU General Assembly 2025, Vienna, Austria, 27 Apr–2 May 2025, EGU25-14460, https://doi.org/10.5194/egusphere-egu25-14460, 2025.

EGU25-16241 | ECS | Posters on site | ITS2.7/BG0.5

Quantifying ecosystem resilience to extreme events: a comparison of single and multiple cropping systems 

Miriam Rodriguez, Katharina Waha, and Wolfgang Buermann

The stability of managed land systems is increasingly threatened by the rising frequency and severity of extreme events caused by climate change. To maintain productivity and adapt to these changing conditions, these systems must build resilience to adverse impacts. Detecting and understanding the effects of such events is essential for assessing the effectiveness of different management strategies in promoting ecosystem resilience.

In this study, we identify extreme events using model- and observation-based Gross Primary Production (GPP) data. To identify these extremes, the GPP anomalies are calculated and then a statistical technique is used to identify extreme events. Using statistical methods including regression models, the most relevant events are then attributed to meteorological drivers, such as temperature and precipitation. Based on these results, we define a stability measure rooted in the recovery time after an extreme event. This approach is applied to three scenarios: (1) a control experiment considering only GPP influenced by climate, (2) GPP influenced by both climate and land use/land change in single cropping areas, and (3) GPP in multiple cropping areas.

These results will help us contrast whether management strategies can mitigate the impacts of extreme events, and identify which types of events and areas may benefit most from potential targeted interventions to increase ecosystem resilience.

How to cite: Rodriguez, M., Waha, K., and Buermann, W.: Quantifying ecosystem resilience to extreme events: a comparison of single and multiple cropping systems, EGU General Assembly 2025, Vienna, Austria, 27 Apr–2 May 2025, EGU25-16241, https://doi.org/10.5194/egusphere-egu25-16241, 2025.

EGU25-17497 | ECS | Orals | ITS2.7/BG0.5

Assessing carbon fluxes following non-invasive and clear-cut management responses to widespread drought mortality of a Scots Pine plantation 

Markus Sulzer, Simon Haberstroh, Thomas Plapp, Thomas Seifert, Dirk Schindler, Christiane Werner, and Andreas Christen

In recent years, frequent dry and hot summer periods in Central Europe have caused irreversible damages to many forest ecosystems. The consequences are widespread tree mortality, including forest ecosystems in the Upper Rhine Valley. We compare two management responses to a highly impacted, mature Scots Pine (Pinus sylvestris) plantation in the Upper Rhine Valley at the ICOS Site DE-Har by assessing annual and seasonal carbon fluxes in the first seven years following the management response.

At the non-invasively managed site, >60% of all former Pinus sylvestris trees died since 2018 and consequently the canopy opened up considerably. Dead and fallen trees were generally not removed. The site has undergone a significant regime change in which increased sunlight under the damaged/missing tree crowns has accelerated growth of a deciduous understory (mainly Tilia cordata, Carpinus betulus, and Fagus sylvatica among others). At the clear-cut site, all Pinus sylvestris trees were fully removed in autumn 2017, and new saplings consisting of various broad-leaf trees, more suited for hot and dry weather conditions (including Acer platanoids, Corlyus colurna, Carpinus betulus), were planted in spring 2018 and 2019. Due to extreme drought, almost all of the saplings died shortly after they were planted and the area now consists of grasses, shrubs and a few deciduous trees.

We use concurrent eddy covariance measurements at the non-invasively managed site since 2019 and at the clear-cut site since 2021 to quantify the effect of the two management responses on net CO2 fluxes and partitioned gross primary productivity (GPP) and ecosystem respiration (Reco). On average over the period from 2019 to 2024, the non-invasively managed site has been a small CO2 source (NEE = +75 g C m-2 year-1), compared to 20 years ago, when the mostly healthy forest was still a considerable CO2 sink.  Typically, the non-invasively managed site is a CO2 source during winter and autumn and a CO2 sink in spring and summer, except for the hot and dry summer of 2022. On average over the period from 2021 to 2024, the clear-cut site has been a substantial CO2 source (NEE = +460 g C m-2 year-1), mainly because of higher values of Reco. The NEE data of the clear-cut site also show a yearly cycle, with higher values in winter and autumn and lower values in spring and summer, nevertheless the clear-cut site was a CO2 source in all seasons during the last four years. The highest annual NEE values at both sites can be found in the hot and dry year 2022. Seven years after the clear-cut, both sites are still CO2 sources and it is uncertain whether and when either of these sites will become a CO2 sink.

How to cite: Sulzer, M., Haberstroh, S., Plapp, T., Seifert, T., Schindler, D., Werner, C., and Christen, A.: Assessing carbon fluxes following non-invasive and clear-cut management responses to widespread drought mortality of a Scots Pine plantation, EGU General Assembly 2025, Vienna, Austria, 27 Apr–2 May 2025, EGU25-17497, https://doi.org/10.5194/egusphere-egu25-17497, 2025.

EGU25-18303 | ECS | Posters on site | ITS2.7/BG0.5

Vegetation response components to drought regimes attributes in the Mediterranean Basin 

Matilde Torrassa, Mara Baudena, Edoardo Cremonese, and Maria J. Santos

Climate models project increasing frequency and intensity of droughts in the Mediterranean Basin, increasing the threat to Mediterranean ecosystems. The lack of water may result in plant wilting and cavitation, reduced resistance to disease and pests, stronger competition between species, and increased wildfire frequency, among many other ecological processes that might be affected. Water-limited ecosystems, like those in the Mediterranean Basin, although adapted to water scarcity, may be particularly vulnerable to extreme droughts. 

The objective of this research is to examine the impact of drought regimes on the response and resilience of Mediterranean ecosystems. We expect to detect a nonlinear relationship between drought regimes and vegetation response as successive drought events cumulate on stronger impacts on ecosystem resilience. To test this hypothesis, we employed an event-based approach to drought regime analysis, for which at each event we measured duration, intensity, severity, and time since the last event as drought attributes. Droughts are detected using the Standardized Evapotranspiration-Precipitation Index (SPEI) at different time scales (3, 6 and 12 months), with precipitation and potential evapotranspiration data retrieved from global downscaled re-analyses of the CHELSA database. We have analyzed the response of vegetation to drought events by extracting the temporal components of resistance, recovery, and resilience. The vegetation response is evaluated using the Normalized Difference Vegetation Index (NDVI), Enhanced Vegetation Index (EVI), Normalized Difference Water Index (NDWI) and Near-infrared Reflectance of Vegetation (NIRV) spectral indices from the MODIS multispectral sensor as proxies of vegetation functioning.  

We examined the 2001-2018 time series for several ecoregions in the Mediterranean Basin to detect the functional shape of the vegetation response curve for this region. Our preliminary results suggest that vegetation response components and drought regime attributes can characterize different aspects of the two variables. Furthermore, the distribution of the vegetation response over drought regimes exhibits multimodal patterns, thereby supporting the hypothesis of a nonlinear relationship. This suggests that the drought response modelling approach used is challenging but promising. 

How to cite: Torrassa, M., Baudena, M., Cremonese, E., and Santos, M. J.: Vegetation response components to drought regimes attributes in the Mediterranean Basin, EGU General Assembly 2025, Vienna, Austria, 27 Apr–2 May 2025, EGU25-18303, https://doi.org/10.5194/egusphere-egu25-18303, 2025.

Monsoon rains trigger pulsed flows from tributaries, which in turn impact the structure of riverine food webs. However, the mechanisms driving food web dynamics in tributaries in response to these pulsed flows are not yet fully understood. We employed carbon (δ13C) and nitrogen (δ15N) stable isotopes of macroinvertebrates and fish to quantify changes in the trophic base and diversity, food chain length, and food web trophic niches before and after the monsoon in two tributaries of the northeast Asian monsoon region. The δ13C and δ15N values of primary basal resources (leaf litter and biofilms) were consistent before and after the monsoon, with a notable increase in δ15N values from forest streams to agricultural channels. Consumer δ13C and δ15N values remained stable over time but exhibited a longitudinal increase due to greater nutritional contributions from local resources. Community isotopic niche metrics were consistent across locations and seasons, while trophic niches diverged between watersheds and closely overlapped seasonally in isotopic space. These results highlight the significant impact of agricultural inputs on downstream channel food webs and demonstrate the limited effect of monsoonal rains on altering the longitudinal trajectory of trophic niches across tributaries.

How to cite: Kang, H. Y. and Kang, C.-K.: Longitudinal trends in a community trophic niche in temperate tributaries across forested and agricultural watersheds pre- and post-monsoon, EGU General Assembly 2025, Vienna, Austria, 27 Apr–2 May 2025, EGU25-20177, https://doi.org/10.5194/egusphere-egu25-20177, 2025.

EGU25-20573 | ECS | Posters on site | ITS2.7/BG0.5

Vulnerability assessment of the Deepor Beel, a Ramsar wetland in Northeast India, to changing climate 

Bhaswatee Baishya and Arup Kumar Sarma

Wetlands are complex ecosystems that sustain livelihoods and provide diverse ecological services, making them exceptionally susceptible to climate change. This study evaluates the vulnerability of Deepor Beel, a Ramsar site in Northeast India, and identifies key assets for conservation. Five target assets were selected based on their representation of the wetland, significance for ecological processes, potential threat to Ramsar status, and sensitivity to change. These assets are the catchment and its hydrological regime, migratory birds, aquatic vegetation, fisheries, and tourism. The vulnerability assessment was based on climate data, obtained from CMIP6 GCMs. Twelve GCM models were downscaled and bias-corrected using the Inverse Distance Weighting method and linear scaling for Deepor Beel's most degraded watershed. A Multicriteria Decision-Making (MCDM) approach and rating metric determined the overall rank of each GCM. Multi-model ensembles, employing the random forest algorithm, were used for climate projections from the top five GCMs. The projections indicated a relative increase in rainfall during the monsoon (June-September) and a decrease during winter (October-January). Additionally, a decrease in temperature was observed during the monsoon and pre-monsoon (February-May) periods, while an increase was noted during winters. A comprehensive questionnaire survey was conducted to assess the sensitivity and exposure of assets to climate threats, allowing impact calculations using an impact scoring matrix. The adaptive capacity was similarly assessed to determine vulnerability using a vulnerability scoring matrix. Migratory birds were found highly vulnerable during future monsoon and winter periods. These findings will help decision-makers preserve assets critical to maintaining Deepor Beel's Ramsar status.

Keywords: Ramsar Wetland, vulnerability, Multicriteria Decision-Making, CMIP6 Global Circulation Model (GCM) 

How to cite: Baishya, B. and Sarma, A. K.: Vulnerability assessment of the Deepor Beel, a Ramsar wetland in Northeast India, to changing climate, EGU General Assembly 2025, Vienna, Austria, 27 Apr–2 May 2025, EGU25-20573, https://doi.org/10.5194/egusphere-egu25-20573, 2025.

EGU25-101 | ECS | Orals | ITS3.7/BG0.6

Modeling micronekton diel vertical migration contribution to carbon export in the mesopelagic zone 

Hélène Thibault, Frédéric Ménard, Jeanne Abitbol-Spangaro, Jean-Christophe Poggiale, and Séverine Martini

Micronekton is a diverse group assemblage of marine animals, described as active swimmers ranging from 2 to 20 cm. Micronekton organisms perform diel vertical migrations, feeding on nutrient-rich surface waters during the night and migrate several hundred meters at sunrise to deep waters, where they digest their food, generating an active transport of carbon. These organisms play a significant but often overlooked role in carbon sequestration within the ocean. Current models generally do not take into account the contribution of the entire community of micronekton to the carbon budget or include a large number of parameters that are difficult to test. Using a one-dimensional trait-based model with a limited number of parameters, we simulated the diel vertical migrations of micronekton and their carbon production through respiration, fecal pellets, excretion, and dead bodies. The model relies on three state variables which are the biomass of the preys, i.e. mesozooplankton, the biomass of the consumers and their gut content. During the night, micronekton reside near the surface to feed. At dawn and dusk, they swim to stay at depth during the day to escape predation from their visual predators. In the model, migrations are triggered by the gradient of light. Our model allowed us to explore the biotic and abiotic variables influencing the active transport of carbon in the mesopelagic zone, where organisms experience low light levels. The functional approach highlighted the importance of size and taxonomy, in particularly considering fish, crustacean, and cephalopod as key factors controlling the efficiency of carbon transport. Several metabolic parameters accounted for most of the variability in carbon production (organic and inorganic) and transport efficiency, mostly linked to respiration rates. Our results suggest that in temperate regions, migrant organisms are responsible for an important vertical transport of carbon. This active export showed strong seasonal variations with a maximum reached in summer. However, in the context of global warming, the evolution of the impact of micronekton on carbon sequestration remains uncertain. This underscores the imperative for future research to deepen our understanding of micronekton metabolism and vertical dynamics through a functional approach and in relation to their environment.

How to cite: Thibault, H., Ménard, F., Abitbol-Spangaro, J., Poggiale, J.-C., and Martini, S.: Modeling micronekton diel vertical migration contribution to carbon export in the mesopelagic zone, EGU General Assembly 2025, Vienna, Austria, 27 Apr–2 May 2025, EGU25-101, https://doi.org/10.5194/egusphere-egu25-101, 2025.

EGU25-2912 * | Orals | ITS3.7/BG0.6 | Highlight

Making Space for Water: Nature-based Solutions with Beavers 

Alan Puttock, Holly Barclay, Matt Holden, Peter Burgess, and Richard Brazier

Beavers are ecosystem engineers and were once widespread across Europe and North America. They are now being reintroduced to much of their native range. A growing body of evidence has shown the return of the beaver can provide multiple benefits, including for biodiversity, natural flood management and drought resilience (Brazier et al., 2021, Puttock et al., 2021). However, the return of beavers to intensely managed and highly populated anthropogenic landscapes can also bring management challenges. Pragmatic evidence based policies are required to maximise the benefits and minimise the conflicts associated with the return of the beaver.

Results will be presented from the Making Space for Water Programme which aims to support land managers to create a network of nature rich wetlands across South West England, increasing resilience to hydrological extremes. This project led by Devon Wildlife Trust, in partnership with the University of Exeter and local landowners works with wild beavers to deliver natural solutions to address societal challenges. Case studies will be presented discussing how we have combined geospatial analysis, on the ground expertise and stakeholder engagement to prioritise sites where the Nature-based Solution benefits of beavers may be greatest and direct opportunities exist for least risk.

References  

Brazier, R. E., Puttock, A., Graham, H. A., Auster, R. E., Davies, K. H., & Brown, C. M. L. (2021). Beaver: Nature’s ecosystem engineers. In Wiley Interdisciplinary Reviews: Water (Vol. 8, Issue 1, p. e1494). John Wiley and Sons Inc. https://doi.org/10.1002/wat2.1494

Puttock, A., Graham, H. A., Ashe, J., Luscombe, D. J., & Brazier, R. E. (2021). Beaver dams attenuate flow: A multi‐site study. Hydrological Processes, 35(2), e14017. https://doi.org/10.1002/hyp.14017


How to cite: Puttock, A., Barclay, H., Holden, M., Burgess, P., and Brazier, R.: Making Space for Water: Nature-based Solutions with Beavers, EGU General Assembly 2025, Vienna, Austria, 27 Apr–2 May 2025, EGU25-2912, https://doi.org/10.5194/egusphere-egu25-2912, 2025.

 Karst landscapes, characterized by their distinctive geomorphology and biodiversity, also host rich cultural heritage represented by traditional villages. These villages reflect the complex interplay between human activity and the environment, shaped over centuries by geological, ecological, and cultural factors. However, karst regions face critical challenges such as ecological degradation, rocky desertification, and cultural homogenization, which threaten both biological and cultural diversity.This study conducts a multidimensional analysis of traditional village distribution across China’s karst landscapes and selects the Miaoling mountainous region as a representative area to explore integrated conservation strategies. Adopting a bio-cultural diversity framework, the research emphasizes the dynamic interactions between biodiversity and cultural heritage.A comprehensive evaluation of bio-cultural diversity was performed using an indicator-based approach. Biodiversity was assessed through factors such as karst lithologic development, habitats of endangered species (Andrias davidianus, Rhinopithecus brelichi, Abies fanjingshanensis, and Taiwania flousiana), and ecosystem services, including carbon storage, soil conservation, and habitat quality. Cultural diversity was analyzed based on the distribution of traditional villages, agricultural and intangible cultural heritage, historical relics, and ethnic minority communities. Priority conservation zones were spatially identified using the Zonation model.Results highlight that the central and western Miaoling regions, especially the Beipan River basin, demonstrate high biodiversity due to well-preserved karst habitats and the presence of critical species. Culturally, traditional villages—predominantly inhabited by Miao, Dong, and Bouyei ethnic groups—are clustered in areas with elevations of 600–800 meters and slopes less than 5°, such as Moon Mountain, Leigong Mountain, and along the Beipan and Douliu Rivers, reflecting their close relationship with the karst environment.Despite these overlaps, nearly half of the region exhibits limited coordination between biological and cultural diversity, with an average coupling coordination degree of 0.611. Higher coordination zones are concentrated in central Miaoling, while the eastern and western regions remain fragmented. Priority conservation zones, covering 2,286.76 km², are primarily located in small watersheds and agroforestry systems, revealing a fragmented spatial distribution.To address these challenges, a “source-corridor-network” conservation strategy was proposed, consisting of 29 primary corridors, 76 secondary corridors, and 25 key nodes to enhance connectivity and resilience. Additionally, a multi-stakeholder adaptive management framework was introduced, emphasizing policy support, community participation, and the integration of conservation with sustainable development.This study underscores the critical value of integrating bio-cultural diversity in conservation planning for karst regions. By bridging geosciences, ecology, and cultural studies, it provides strategic insights for global biodiversity and restoration initiatives, contributing to holistic and sustainable conservation practices in the face of climate change and anthropogenic pressures.

How to cite: Li, X., Yang, Q., and Tarolli, P.: Integrating Bio-Cultural Diversity for Sustainable Conservation in Karst Landscapes: Insights from the Miaoling Mountainous Region, EGU General Assembly 2025, Vienna, Austria, 27 Apr–2 May 2025, EGU25-4862, https://doi.org/10.5194/egusphere-egu25-4862, 2025.

EGU25-7942 | ECS | Posters on site | ITS3.7/BG0.6

Enhanced detriment to ecosystem carbon pools by global change factors and herbivory 

Changlin Xu and Biao Zhu

Ecosystem carbon pools are being rapidly transformed by global change factors (GCFs) and trophic interactions within ecosystems. However, despite mounting evidence for the individual impacts of GCFs and herbivores on ecosystem carbon pools, the extent to which these factors interact to transform ecosystem carbon dynamics remains a major uncertainty, impeding efforts to guide ecosystem-based approaches by leveraging trophic managements to climate change adaption. By curating terrestrial and aquatic GCFs and trophic interactions full-factor paired experiments globally (544 paired observations from 121 studies), we revealed that the combined effects of GCFs and herbivores on ecosystem carbon pools were more detrimental than their individual effects, and these synergistic stressors of GCFs and herbivores posited slightly different impacts on vegetation and soil carbon pools, with a more detrimental effect on plant aboveground biomass and microbial biomass carbon. Furthermore, these negative combined effects were amplified in low-latitude regions, and aridity contributed the highest power for explaining the variability in these interactions, suggesting that these effects were more likely to harm ecosystem carbon stocks in regions with higher temperatures or stronger evapotranspiration. Overall, our findings underscore that the interplay between abiotic and biotic stressors can substantially undermine ecosystem carbon sequestration capacity, particularly in already vulnerable regions, calling for a reevaluation of current climate change mitigation strategies to explicitly account for and manage trophic interactions.

How to cite: Xu, C. and Zhu, B.: Enhanced detriment to ecosystem carbon pools by global change factors and herbivory, EGU General Assembly 2025, Vienna, Austria, 27 Apr–2 May 2025, EGU25-7942, https://doi.org/10.5194/egusphere-egu25-7942, 2025.

EGU25-8555 | Posters on site | ITS3.7/BG0.6

Coexistence Dynamics and Behavioral Analysis of Brown Bears (Ursus arctos) in Peri-Urban Forest Ecosystems 

Raul Gheorghe Radu, Mihai Fedorca, Ancuta Fedorca, and Stefan Petrea

Advancements in GPS radiotelemetry have facilitated the collection of extensive data on elusive wildlife species, including brown bears (Ursus arctos), for which direct observations are frequently impractical. Grounded in the premise that individual animals often exhibit temporally consistent behavioral traits, this study investigates habitat use, movement patterns, and resting behaviors of 50 brown bears inhabiting peri-urban forest ecosystems. In total, 61,562 GPS locations were recorded and linked to ecological covariates such as forest type, elevation, slope, land cover, forest biomass, deadwood availability, forest disturbance, and proximity to roads, water, impervious surfaces, and forest edges. The dataset underwent thorough cleaning to remove incomplete and erroneous points, followed by chronological ordering to capture diurnal and seasonal variability. Each location was classified into one of four seasons (winter, spring, summer, autumn) and further categorized into diel periods (dawn, day, dusk, night), adjusted according to season.

Movement analyses incorporated diel cycles, seasonal variation, sex, age, and the presence of cubs. Using clustering algorithms, we identified resting clusters and active movement segments at various spatial scales, subsequently quantifying home ranges across demographic groups and time frames. To ensure robust insights, large temporal and spatial gaps were omitted, and continuous trajectories were used to calculate key metrics, including travel time, distance, elevation change, and slope.

Mixed-effects models indicated significant seasonal and diel effects on bear velocity, with faster travel observed in summer and at dusk, and slower movement in winter and during daytime—particularly in higher-elevation and more rugged terrain. Although demographic factors (sex, age, presence of cubs) exerted limited influence on velocity itself, they were associated with variation in home range sizes and resting cluster distribution. By spatially linking GPS data and movement segments to ecological parameters, this investigation provides a comprehensive perspective on the interplay between landscape structure and bear behavior.

Through this integrative approach, our findings show both active and stationary bear behaviors in human-influenced habitats. By identifying critical periods and key habitats for resource acquisition and rest, these results may offer practical insights for conservation efforts and promote coexistence in peri-urban landscapes.

How to cite: Radu, R. G., Fedorca, M., Fedorca, A., and Petrea, S.: Coexistence Dynamics and Behavioral Analysis of Brown Bears (Ursus arctos) in Peri-Urban Forest Ecosystems, EGU General Assembly 2025, Vienna, Austria, 27 Apr–2 May 2025, EGU25-8555, https://doi.org/10.5194/egusphere-egu25-8555, 2025.

EGU25-9242 | ECS | Posters on site | ITS3.7/BG0.6

Closing Biodiversity Monitoring Gaps: A Workflow for Validation and Quality Assessment of Citizen Science Location Data for Amphibian and Reptile Monitoring in Private Gardens  

Anna Iglseder, Christoph Leeb, Florian Danzinger, Claudia Meixner, Dominik Linhard, Christian Lettner, and Markus Hollaus

Worldwide, amphibians and reptiles are among the most threatened animal classes. In Austria, more than half of the 21 amphibian and 15 reptile species are classified as endangered, critically endangered, or at risk of extinction, primarily due to habitat loss and destruction. Close to nature designed and managed gardens can serve as valuable refuges, yet they remain largely unexplored in systematic monitoring. 
The “BIOM-Garten” project leverages citizen science to collect monitoring data from private properties in Austria, which are otherwise inaccessible to conservation scientists, helping to close critical gaps in amphibian and reptile monitoring. Citizen scientists use a browser-based reporting platform to submit data on species occurrence, including location, address, photos, details of sightings, and detailed descriptions of their gardens. However, inaccuracies or ambiguities in user-reported locations can hinder the scientific usability of the data.
To address these issues, we developed a workflow that integrates reported data with OpenStreetMap as well as cadastral and municipal datasets to optimize geolocation and assess data quality. By combining address information, pinned map locations, and image  data of reported species recorded by cameras and mobile phones, we optimize the point location of each entry and assign uncertainty levels and a quality class to ensure scientific accuracy for subsequent environmental modeling.
In the first project year, following the platform's launch in June 2024, we received more than 700 reports. These submissions were successfully processed, geocoded, and classified, showcasing the platform's effectiveness in engaging citizen scientists and generating high-quality research data. Of the valid reported species sightings, 63% could be located at the parcel level, 29% at the municipality level, and 8% of the data had to be discarded due to insufficient localization.

How to cite: Iglseder, A., Leeb, C., Danzinger, F., Meixner, C., Linhard, D., Lettner, C., and Hollaus, M.: Closing Biodiversity Monitoring Gaps: A Workflow for Validation and Quality Assessment of Citizen Science Location Data for Amphibian and Reptile Monitoring in Private Gardens , EGU General Assembly 2025, Vienna, Austria, 27 Apr–2 May 2025, EGU25-9242, https://doi.org/10.5194/egusphere-egu25-9242, 2025.

EGU25-10337 | ECS | Orals | ITS3.7/BG0.6

Functional responses of oligochaetes and chironomids to restoration-induced changes in connectivity- A case study in the Donau-Auen National Park  

Sonia Steffany Recinos Brizuela, Andrea Funk, Wolfram Graf, Anthony Basooma, and Thomas Hein

Lateral connectivity, as a cornerstone of floodplain ecosystems, shapes hydrogeomorphological features, supports floodplain functions, and initiates new habitat formation processes such as fine sediment and deadwood dynamics. However, anthropogenic activities have increasingly disrupted connectivity in large-river floodplains, leading to terrestrialization processes and significant declines in freshwater biodiversity. Restoration efforts in the Upper Danube River aim to enhance hydrological connectivity within the river-floodplain system to mitigate habitat isolation and terrestrialization. Evaluating the outcomes of these efforts requires understanding the interplay between connectivity, environmental factors, and freshwater biodiversity responses.

Using the available information from a river-floodplain stretch in the Donau-Auen National Park, we compared the responses of oligochaetes and chironomids to side-channel reconnection measures across control and impacted sites before (reference period), in the short term and the long term after restoration. We applied a Before-After x Control-Impact (BACI) design to analyse the direct effect of restoration-induced habitat changes on the taxonomic and functional composition and diversity of these indicator groups. A graph theoretical approach followed by applying Partial Least Squares Regressions was used to determine the overall effect of connectivity change on the functional diversity of the indicator groups.

The BACI analysis revealed the positive effects of restoration on oligochaete taxonomic and functional diversity. However, we observed that terrestrialization processes dominate over the long term, outweighing the impacts of restoration. Variations in species traits such as longitudinal zonation, body size, dispersal strategy, drift propensity, and adult lifespan showed short-term restoration effects for both groups, returning to pre-restoration conditions in the long term. For oligochaete functional diversity, connectivity was influential shortly after restoration, while environmental factors became more significant over time.

Our findings underscore the importance of incorporating functional trait responses into restoration assessments to inform the management of protected areas. We highlight the need for restoration measures to refine strategies that enhance floodplain connectivity in the long term to ensure lasting effects on aquatic biota and recommend continuous monitoring to understand better the role of connectivity in influencing ecological processes and their cascading effects on freshwater communities.


This research acknowledged support from the EU Projects i-CONN’ H 2020 research and innovation programme under the Marie Skłodowska-Curie (grant agreement number 859937), DANSER (grant agreement No 101157942), H2020 MERLIN (grant agreement No 101036337), HEU DANUBE4ALL project (grant agreement no. 101093985), and AquaINFRA (grant No 101094434). Furthermore, the Austrian Federal Ministry for Digital and Economic Affairs and the Christian

How to cite: Recinos Brizuela, S. S., Funk, A., Graf, W., Basooma, A., and Hein, T.: Functional responses of oligochaetes and chironomids to restoration-induced changes in connectivity- A case study in the Donau-Auen National Park , EGU General Assembly 2025, Vienna, Austria, 27 Apr–2 May 2025, EGU25-10337, https://doi.org/10.5194/egusphere-egu25-10337, 2025.

EGU25-11704 | Posters on site | ITS3.7/BG0.6

Modeling the effects of rewilding on soil carbon dynamics and greenhouse gas mitigation in Europe 

Yue Cheng, Jeppe A. Kristensen, Liza Le Roux, Frederik N. Philipsen, Joanne O’ Keeffe, Klaus S. Larsen, Carsten W. Müller, Jesper R. Christiansen, and Lars Vesterdal

Rewilding has emerged as a transformative restoration approach, promoting ecosystem self-regulation by restoring key processes like trophic complexity and reducing human influence. As a nature-based solution, rewilding plays a vital role in both climate adaptation and mitigation, offering pathways to address challenges like biodiversity loss and carbon sequestration. Trophic rewilding, in particular, focuses on reintroducing keystone species such as large herbivores to restore ecosystem functionality. While rewilding's impacts on biodiversity and aboveground carbon dynamics are increasingly documented, its influence on soil carbon storage—particularly the underlying dynamics—remains poorly understood. Large herbivores can influence soil carbon both directly and indirectly through mechanisms such as trampling, defoliation, and defecation. Trampling alters soil bulk density and porosity, affecting soil aeration and microbial activity. Defoliation simulates biomass removal, redistributing aboveground carbon inputs to the soil. Defecation contributes to nutrient cycling and modifies the C/N ratio in soils. Despite observational studies, laboratory experiments, and meta-analyses pointing to these mechanisms, there is a lack of comprehensive modeling frameworks to capture their cumulative effects on soil carbon dynamics.

Here we used LPJ-GUESS, a dynamic vegetation model (DGVM), to simulate rewilding scenarios across Europe, from single points to regions. The point estimates are based on data from sites in Poland and Denmark; the Białowieża Forest (BIA) in Eastern Poland, one of Europe's last lowland primeval forests, where 23 years of herbivore exclusion has allowed undisturbed regeneration within fenced areas, and the Mols Laboratory (ML), a former agricultural landscape in Denmark rewilded since 2016. These sites represent two stages of a ‘Northern European rewilding trajectory’: BIA as a late-successional system, and ML as a system in a state of early secondary succession. Preliminary results indicate that the model performs well in simulating single-point scenarios of passive rewilding and realistic land-use and land-cover changes (LUCC). Comparisons with global MODIS and FLUXNET-derived daily GPP data yield R² values of 0.86 for Białowieża and 0.84 for Mols.

Building on this, we aim to enhance LPJ-GUESS by representing animal-driven processes such as trampling, defoliation, and defecation in the model, to compare the impact of trophic (animal introductions) and passive rewilding (land abandonment), continued agriculture, and traditional grassland nature management (mowing) on carbon dynamics. Future work will explore the regional impacts of large herbivores on soil carbon dynamics and greenhouse gas fluxes through advanced modeling and field data integration. This research will contribute to understanding the role of large herbivores in ecosystem restoration and carbon cycling, supporting the emerging discipline of zoogeoscience.

How to cite: Cheng, Y., Kristensen, J. A., Roux, L. L., Philipsen, F. N., Keeffe, J. O., Larsen, K. S., Müller, C. W., Christiansen, J. R., and Vesterdal, L.: Modeling the effects of rewilding on soil carbon dynamics and greenhouse gas mitigation in Europe, EGU General Assembly 2025, Vienna, Austria, 27 Apr–2 May 2025, EGU25-11704, https://doi.org/10.5194/egusphere-egu25-11704, 2025.

EGU25-11846 | ECS | Orals | ITS3.7/BG0.6

To graze or not to graze: comparing soil carbon and nitrogen storage and cycling under trophic rewilding, passive rewilding and conservation mowing  

Joanne O'Keeffe, Aidan Ovesen, Frederik N. Philipsen, Jesper R. Christiansen, Klaus S. Larsen, Sebastian K. Rojas, Yamina Micaela Rosas, Troels Munck, Jeppe A. Kristensen, Liza Le Roux, Yue Cheng, Carsten W. Mueller, and Lars Vesterdal

Rewilding has emerged as a prominent ecological restoration approach in recent decades. It is aimed at restoring natural processes, improving ecosystem functioning, and enhancing biodiversity with minimal human interference necessitated. Different approaches to rewilding exist, including trophic and passive rewilding. Trophic rewilding involves the active introduction of species, most often large herbivores. The latter approach involves passive management with minimal human interference. Being a nascent strategy available to ecosystem managers, comparative empirical research in the context of rewilding is lacking, especially relating to soil functions like carbon (C) and nitrogen (N) cycling and storage.

In this study, we investigated whether the choice of trophic versus passive rewilding had an impact on the quantity and cycling of C and N stored in soils. Additionally, we compared these two approaches to annual mowing and removal of biomass, a typical conservation management strategy for grasslands.

Permanently fenced passive rewilding and conservation mowing plots were established within a trophic rewilding project at Mols Bjerge, Denmark in spring 2017. Plots delineated adjacent to these represented trophic rewilding. Exmoor ponies and Galloway cattle were introduced the previous year and continue to freely roam the 120 ha site with minimal human intervention. The area has previously been used for sheep and cattle grazing research, primarily on aboveground biodiversity. In August 2024, we collected soil samples from three layers (0-5 cm, 5-10 cm, and 10-20 cm; n = 216) in each treatment replicated at 8 locations within the study site. Additional topsoil (0-5 cm; n=72) samples were retrieved from each plot for analyses of microbial activity.

Bulk density, organic carbon (OC), total nitrogen (TN), and pH were determined in samples from all depths. Microbial biomass C and N, respiration, microbial activity and diversity, and net N mineralization rates were analysed in the topsoil samples. Based on preliminary results, trophic rewilding was characterised by the largest stocks of C and N to 20 cm with mean values of 3.62 kg m-2 and 0.27 kg m-2, respectively. Passive rewilding and conservation mowing resulted in mean C stock values 11% and 19% lower compared to trophic rewilding, with similar results for N stocks. In contrast, soil C/N ratios were significantly higher under conservation mowing compared to the rewilding treatments. The lowest levels of microbial biomass C, specific (normalised for OC content) C mineralization, and net N mineralization were associated with trophic rewilding, suggesting that nutrient turnover rates are comparatively suppressed. EcoPlate™ results similarly showed reduced microbial activity, as well as diversity, under trophic rewilding with significantly higher results under mowing. These results demonstrate that the decision to include or exclude animals in land management strategies can have a consequential impact on C and N storage and the driving processes related to their cycling in soil. Therefore, this decision should be considered carefully in land management policy development.

How to cite: O'Keeffe, J., Ovesen, A., Philipsen, F. N., Christiansen, J. R., Larsen, K. S., Rojas, S. K., Rosas, Y. M., Munck, T., Kristensen, J. A., Le Roux, L., Cheng, Y., Mueller, C. W., and Vesterdal, L.: To graze or not to graze: comparing soil carbon and nitrogen storage and cycling under trophic rewilding, passive rewilding and conservation mowing , EGU General Assembly 2025, Vienna, Austria, 27 Apr–2 May 2025, EGU25-11846, https://doi.org/10.5194/egusphere-egu25-11846, 2025.

EGU25-12447 | ECS | Orals | ITS3.7/BG0.6

Herbivory-induced alteration of ecosystem biogeochemistry: the case of domestic sheep herbivory in the Norwegian mountains  

George Furey, Gunnar Austrheim, Line Tau Strand, Jan Mulder, James Speed, and Vegard Martinsen

Herbivory can have a major impact on the stocks and fluxes of elements in an ecosystem. As herbivores forage for limiting nutrients, the preferential consumption of certain plants over others shifts plant community composition. The well-defended plants that can resist herbivory have specialized traits often leading to lower quality litter that is slow to decompose. The dominance of well-defended species promotes a greater quantity of low-quality litter to enter the soil which then can slow the mineralization of limiting elements. When soil fertility is low, increased dominance of well-defended plant species can slow nutrient cycling leading to an herbivory-induced deceleration of ecosystem biogeochemistry. Here we present results from a 23-year fencing experiment in the south-western mountains of Norway that compares the effect of high density grazing with the effect of excluding domestic sheep. We complement the experiment with a series of natural and human-created islands in two hydroelectric reservoirs that have excluded sheep-grazing for at least sixty years and therefore can serve as a natural control. The low-alpine site (~850–1050 m) is characterized by a wet oceanic climate with a nutrient-poor granitic parent material creating a mixture of sandy soils of histosols, gleysols and podzols often with moist, deep, and acidic O-horizons.

We discovered that herbivory impacted both the plant community and ecosystem biogeochemistry in the stocks, concentrations, and ratios of silicon (Si) and phosphorus (P) in plants and soils. Our results demonstrate that sheep herbivory was associated with the dominance of herbivory-resistant grass Nardus stricta while the ungrazed islands harbored herbivory-susceptible grasses and forbs such as Deschampsia flexuosa and Solidago rigida. N. stricta was found to have low quality plant leaves with a high Si to P ratio (Si:P). Its dominance scales this high Si:P stoichiometry to the bulk aboveground plant biomass leading to a higher stock of Si under mainland herbivory compared to the island control. In comparison, the island vegetation was found to be relatively enriched in P. There were no treatment differences in the Si:P ratio between the mainland fencing treatment. N. stricta remained dominant inside many fences, suggestive of negative feedback towards the high-grazing state; however, one site transitioned to low Si:P ratio plant biomass with high D. flexuosa abundance and was classified with the islands. The present case suggests a mechanism of plant-soil-herbivory interactions where herbivory, through increasing dominance of a well-defended plant species, impacts ecosystem biogeochemistry via Si and P. Our empirical results inform theory on the role of herbivores in generating stabilizing negative feedback among ecosystem states that can aid to scale and implicate zoogeochemistry into Earth system models. We will discuss our results in the context of theory that describes herbivory-induced deceleration of ecosystem nutrient cycling. A deep understanding of herbivory-induced plant-soil feedbacks, expanded to include the stoichiometry of elements beyond carbon and nitrogen, is essential for efforts to model animals in the Earth system.   

How to cite: Furey, G., Austrheim, G., Tau Strand, L., Mulder, J., Speed, J., and Martinsen, V.: Herbivory-induced alteration of ecosystem biogeochemistry: the case of domestic sheep herbivory in the Norwegian mountains , EGU General Assembly 2025, Vienna, Austria, 27 Apr–2 May 2025, EGU25-12447, https://doi.org/10.5194/egusphere-egu25-12447, 2025.

Evaluating how land cover is being transformed is essential to identify patterns necessary to infer the change trajectories and the driving factors. This study considers the case of Nigeria, where various natural ecosystems are being converted and for which a current national scale assessment at high spatial resolution is lacking. Producing 30 m Landsat-based time-series data, we analyze change among land cover types (i.e. tree-covered area, grassland, wetland, waterbody, cropland, artificial surface, and otherland) across seven agroecological zones. The annual change intensity was assessed at multi-levels across three time-intervals (i.e. 1986-2000, 2000–2013, 2013–2022). Distinguishing between natural land cover and human activity-related land-use, we estimate the extent of change signifying how humans have appropriated natural land cover (HANLC) over almost four decades. Focusing on major processes of observed change patterns, transitions between categories were aggregated into three HANLC classes for each time point (i.e. 1986, 2000, 2013, 2022). The HANLC classes are: 1) Cropland expansion, 2) Settlement and infrastructure development (SID), and 3) Natural regeneration and afforestation (NRA) comprising areas of NLC recovery. The first and second classes are areas where HLU expanded into NLCs. We then estimated the extent and changes of HANLC during the three time-intervals. The latter formed the basis for identifying the drivers and processes underlying the observed HANLC changes across AEZ and at the national level.

Insights from analysis at the interval level reveal that land transformation accelerated from 2.7% yr−1 during 1986 – 2000 to 3.3% yr−1 during 2000 – 2013 and peaked at 4.5% yr−1 during 2013 – 2022 in all agroecological zones (e.g. rainforest, mangrove), except in Sudan savannah and Sahel savannah where speed was higher in 2000–2013 as grasslands were increasingly cultivated. Cropland expanded almost two-fold (22% to 37%), whereas tree-cover declined from 50% to 31% and wetland from 7% to 3.7% over the 23 years. Much loss of natural land cover (e.g. tree-cover, grassland, and wetland) to cropland occurred in 2000–2013 (22%) when most irrigation schemes in Nigeria were established. In contrast, the loss of mostly natural land cover to settlement (0.6%) during 1986 – 2000 increased to 0.9% in 2000–2013 and to 2.0% in 2013–2022. Of all agroecological zones, the mangrove zone was most disturbed as its persisting land cover areas reduced from about 80% during 1986 – 2000 to 69% in 2000–2013 and to 5% in 2013–2022. The amount of persisting land cover increased in the Sudan savannah at 16% in 1986 – 2000, 44% in 2000–2013 and 49% in 2013–2022. Processes of human-appropriated natural land cover in Nigeria are related to urbanization and cropland expansion into natural areas with some instances of natural regeneration, especially in croplands and abandoned settlement areas. Studies to identify measures to halt the high rate of conversion of natural land covers to croplands are thus needed.

Relevant links:

  • https://doi.org/10.1080/10095020.2024.2362759
  • https://zenodo.org/doi/10.5281/zenodo.8205098

How to cite: Akinyemi, F. O. and Ifejika Speranza, C.: Human-appropriated natural land cover in Nigeria are related to urbanization and cropland expansion from 1986 to 2022, EGU General Assembly 2025, Vienna, Austria, 27 Apr–2 May 2025, EGU25-13362, https://doi.org/10.5194/egusphere-egu25-13362, 2025.

Yak dung is an input to the carbon (C) and nutrient cycles that maintain ecosystem functions on the Tibetan Plateau. Yak dung is C and nutrient-rich excreta that is conducive to the growth and metabolic activities of bacterial communities, thus predicting that more bacterial than fungal processes are responsible for the degradation of yak dung. A three-year yak dung degradation experiment in a yak-grazing alpine rangeland was designed to investigate the changes in dung moisture content, chemical and enzymatic properties, and bacterial and fungal communities during degradation, as well as to explore how these parameters may regulate the degradation of yak dung. After three years of decomposition, yak dung had a 79 % reduction in mass, and most of the mass loss occurred within the first 2 years. Cellulosic polymers, especially cellulose and hemicellulose, determined the rate of yak dung degradation. The main changes in dung bacterial communities occurred during the first 2 years of degradation, largely related to changes in moisture and available substrates (e.g., dissolved organic C, dissolved organic nitrogen (N), ammonium, nitrate, and available phosphorus). In contrast, dung fungal communities did not change until 1.5–3 years of degradation, in response to the total substrates (e.g., total C and N). The relative abundances of ProteobacteriaBacteroidotaFirmicutesBasidiomycota, and Ascomycota, and the activities of endo-cellulases, exo-cellulases, β-1,4-glucosidase, and β-1,4-xylosidase, which were associated with cellulose and hemicellulose degradation, decreased during decomposition. The relative abundances of Actinobacteria, and activities of peroxidases and polyphenol oxidase were positively correlated with dung lignin content. Structural equation modeling suggested that degradation of lignocellulose in dung was mainly the consequence of bacterial community activities. Additionally, moisture was the most important abiotic factor influencing lignocellulose degradation, as it can directly affect dung substrate availability, and ultimately bacterial communities and associated enzyme activities. As the microbial degradation of lignocellulose in yak dung is strongly related to moisture, any change to the rainfall pattern in the future is expected to influence yak dung degradation in this alpine region.

How to cite: Jiao, Y. and Zhang, Z.: The Impact of Yak Dung Deposition on Litter Decomposition and Multi-Nutrient Cycling in Grassland Ecosystems, EGU General Assembly 2025, Vienna, Austria, 27 Apr–2 May 2025, EGU25-13489, https://doi.org/10.5194/egusphere-egu25-13489, 2025.

EGU25-14859 | Orals | ITS3.7/BG0.6

Macrofaunal diversity in high-bottom current environments at the Vesturdjúp Seamounts (Northern Irminger Sea, Iceland) 

Nico Augustin, Jan Oliver Eisermann, Linus Budke, David Thor Odinsson, Froukje M. van der Zwan, Evelyn R. Garcia Paredes, Viktoria Strizek, Mikołaj Prejc, Christian Hübscher, and Dominik Palgan

The Vesturdjúp Basin is located at the northeastern edge of the Irminger Sea, bordered by southern Greenland to the west, the Denmark Strait and Iceland to the north, and the Reykjanes Ridge to the east. To the south, it opens into the North Atlantic Ocean. The basin’s bathymetry is characterized by large sediment rafts shaped by intense bottom-water currents, a distinctive ocean floor fabric, and numerous cone-shaped volcanoes1. In the summer of 2024, Meteor Expedition M201 explored the seamounts of the Vesturdjúp Basin1. In addition to a comprehensive geological sampling and geophysical program, all studied volcanoes were surveyed using a towed camera system (OFOS – Ocean Floor Observation System). A total of 21 dives were conducted, covering 24.3 km of seafloor and resulting in over 65,000 still images and 38 hours of video footage. Observations revealed that lithified sediments and some manganese crusts extensively cover the seamounts of the Vesturdjúp Basin, with occasional rocky outcrops accompanied by abundant talus material and drop stones. No evidence of recent lava was detected. However, the seamounts host diverse and vibrant ecosystems that vary with depth and, more notably, with current exposure. While some seamounts show sparse macrofaunal presence, many are rich in species, such as sea pens, corals, diverse sponges, crinoids, crustaceans, octopods, and fish. This study presents the faunal diversity of the Vesturdjúp Basin seamounts, highlighting how species distribution and abundance appear to be more influenced by current dynamics and sedimentation patterns - particularly south of the Denmark Strait in the northern Irminger Sea - than by the geological features of the volcanoes.

1Augustin, N.,  Palgan, D., Hübscher, C.P., van der Zwan, F.M., et al., (2024) Volcanism in the Vesturdjúp Basin - Flank Igneous System or Intraplate Volcanism Off-Shore Western Iceland, Cruise No. M201, 09. June - 18. July 2024, Reykjavik (Iceland) - Praia da Vitoria (Azores, Portugal), METEOR-Berichte, M201, 1-91, https://doi.org/10.48433/cr_m201

How to cite: Augustin, N., Eisermann, J. O., Budke, L., Odinsson, D. T., van der Zwan, F. M., Garcia Paredes, E. R., Strizek, V., Prejc, M., Hübscher, C., and Palgan, D.: Macrofaunal diversity in high-bottom current environments at the Vesturdjúp Seamounts (Northern Irminger Sea, Iceland), EGU General Assembly 2025, Vienna, Austria, 27 Apr–2 May 2025, EGU25-14859, https://doi.org/10.5194/egusphere-egu25-14859, 2025.

EGU25-16310 | Posters on site | ITS3.7/BG0.6

Aboveground Vegetation and Soil Fauna Activity - Land Use effects on Soil Biodiversity 

Oren Shelef, Zenawi Tadesse, Jonathan Fireman, Roza Belayneh, and Moshe Coll

Soil fauna, particularly its microarthropod content, is key to soil functioning. However, the interactions of agricultural practices and the functioning of its soil biodiversity are not fully understood. We evaluated how vegetation cover affects microarthropod diversity in three Mediterranean agroecosystems - almond and olive orchards and a vineyard in Israel. Soil samples were collected from vegetated and non-vegetated areas and analyzed using the Soil Biological Quality method (QBS-ar). Higher QBS-ar, higher microarthropod richness, and distinct assemblage composition were measured in vegetated soils compared to soils without vegetation. Acari, Collembola, Diplura, Coleoptera, Chilopoda, and Symphyla were identified by indicator value analysis as biological indicators of vegetation cover. These findings highlight the positive impact of vegetation cover on soil biodiversity in agroecosystems, which is likely to support ecosystem services. Such research can aid Mediterranean farmers, land managers, and policymakers develop sustainable soil management practices that balance biodiversity conservation with agricultural productivity. Developing soil fauna bioindicators and indexes can be essential to monitoring soil status. Such monitoring tools can support establishing solid scientific knowledge to inform practitioners and policymakers on how to implement sustainable management solutions.

How to cite: Shelef, O., Tadesse, Z., Fireman, J., Belayneh, R., and Coll, M.: Aboveground Vegetation and Soil Fauna Activity - Land Use effects on Soil Biodiversity, EGU General Assembly 2025, Vienna, Austria, 27 Apr–2 May 2025, EGU25-16310, https://doi.org/10.5194/egusphere-egu25-16310, 2025.

EGU25-17028 | ECS | Orals | ITS3.7/BG0.6

Large herbivores as geomorphic agents: insights from a systematic review and meta-analysis  

Grace Moore, Gemma Harvey, Tim Newbold, and Alex Henshaw

Large herbivores acting as ‘ecosystem engineers’ (e.g. pigs, deer, cattle, bison, ponies) have diverse effects on geophysical and ecological systems and are increasingly being incorporated in landscape restoration and rewilding projects through species (re)introductions. Through their physical behaviours such as trampling, grazing, wallowing and rootling, large herbivores can alter soil properties, vegetation structure and hydrological processes, contributing to landscape-scale changes. Despite their growing inclusion in rewilding projects, particularly in temperate regions, the geomorphic impacts of large herbivores remain poorly understood.

This systematic review and meta-analysis aims to synthesise the evidence base on the geomorphic impacts of large herbivores in rewilding and other environmental settings and identify the nature and magnitude of their impacts. Using systematic searches of Scopus and Web of Knowledge, 13,733 studies were initially identified and screened down to 461 studies for full-text review. Studies meeting key inclusion criteria (terrestrial environments, temperate biomes, relevant to rewilding settings) were retained for synthesis and meta-analysis of effect sizes.  The presentation will explore the evidence base in terms of geographic distribution of studies across species, ecosystems and countries and identify key gaps.  Through meta-analysis of effect sizes, it will explore the directionality and magnitude of large herbivore effects on key geomorphic processes across a range of environments relevant to rewilding. These findings provide new insights into the role of animals in shaping ecosystems.

How to cite: Moore, G., Harvey, G., Newbold, T., and Henshaw, A.: Large herbivores as geomorphic agents: insights from a systematic review and meta-analysis , EGU General Assembly 2025, Vienna, Austria, 27 Apr–2 May 2025, EGU25-17028, https://doi.org/10.5194/egusphere-egu25-17028, 2025.

EGU25-17711 | ECS | Posters on site | ITS3.7/BG0.6

Effects of different nature management strategies on soil GHG fluxes: Trophic rewilding, passive rewilding and mowing 

Frederik N. Philipsen, Joanne O'Keeffe, Klaus S. Larsen, Jeppe A. Kristensen, Elizabeth Le Roux, Yue Cheng, Carsten W. Müller, Lars Vesterdal, and Jesper R. Christiansen

Nature-based solutions to climate change, e.g. restoring ecosystem processes that translocate GHG from the atmosphere to biomass, are recognized as cost-effective methods to simultaneously mitigate climate change and reverse ecosystem degradation. The importance of large ungulates as part of nature-based solutions has been emphasized due to their critical role in maintaining and improving diversity in ecosystems, while the extent of large ungulate-mediated effects on radiative forcing and greenhouse gas balance is unclear due to lack of observations and apparent context-dependencies across biomes. We particularly lack direct measurements of large ungulate-mediated feedbacks on soil GHG fluxes despite their substantial influence on atmospheric concentrations of GHG’s. Large ungulates shape their environments e.g. via biomass consumption, alteration and redistribution, seed dispersal and trampling, affecting plant diversity and productivity as well as soil physicochemical conditions. Together, these impacts may govern the direction and magnitude of soil GHG fluxes.

Here, we present a study conducted in a Danish rewilding area, where cattle and horses were released for year-round grazing in 2016. Within the 120 ha area, we studied eight fenced experimental blocks located in common broom (Cytisus scoparius) dominated shrublands on well-drained sandy soils. We aimed to detect effects of three treatments resembling possible nature management strategies: Trophic rewilding (large ungulate presence) passive rewilding (large ungulate absence) and annual mowing (traditional nature management) on soil GHG fluxes. We were particularly interested in identifying the ungulate-mediated effects on soil physicochemical parameters that drive soil GHG fluxes. Our experimental approach included both chamber measurements in the field and laboratory incubations of intact soil cores. During both types of campaigns, we measured fluxes of CO2, CH4 and N2O. To elucidate mechanistic relationships, we also measured soil parameters related to physical structure, soil C & N concentrations, and N mineralization rates.

Initial results from our incubation experiment suggest that trophic rewilding increased soil respiration, which is in contrast to field measurements that showed higher respiration rates from passive rewilding plots. The former result may be attributed to higher soil C concentrations under trophic rewilding, and the latter to greater autotrophic respiration under passive rewilding. Conversely, CH4 uptake rates and N2O emissions were reduced under trophic rewilding, which could partially be explained by changes soil structure and nitrification rates. Annual mowing management exhibited similar responses in CO2 and CH4 fluxes to trophic rewilding, while the production of N2O was substantially reduced compared to the other management types. Our study demonstrates that introducing large ungulates in nature management may influence soil GHG fluxes, highlighting their role in soil biogeochemical processes and nature-based climate solutions.

How to cite: Philipsen, F. N., O'Keeffe, J., Larsen, K. S., Kristensen, J. A., Le Roux, E., Cheng, Y., Müller, C. W., Vesterdal, L., and Christiansen, J. R.: Effects of different nature management strategies on soil GHG fluxes: Trophic rewilding, passive rewilding and mowing, EGU General Assembly 2025, Vienna, Austria, 27 Apr–2 May 2025, EGU25-17711, https://doi.org/10.5194/egusphere-egu25-17711, 2025.

EGU25-17877 | ECS | Posters on site | ITS3.7/BG0.6

From Fields to Flora: Decoding Historical Land-Use Intensification and Its Impact on Danish Plant Biodiversity 

Nele Lohrum, Anne-Cathrine Storgaard Danielsen, Morten Graversgaard, Signe Normand, and Tommy Dalgaard

Biodiversity degradation in intensive agricultural landscapes has been a pressing issue, as agricultural systems cover a significant portion of land and greatly influence habitats crucial for species diversity. Understanding the impact of historical agricultural land use on recent biodiversity is essential to uncovering legacy effects and developing strategies for ecological restoration and long-term sustainability. Plant diversity is critical for maintaining ecosystem functionality, enhancing resilience, and supporting sustainable agriculture. However, the extent to which agricultural intensification has impacted biodiversity remains poorly quantified. This study investigates how historical land-use changes have influenced biodiversity in Denmark by combining historical land-use data with records from Flora Danica, a comprehensive dataset documenting the occurrence and distribution of Danish plants. By analysing spatial and temporal patterns, we aim to address the effect of agricultural intensification and land-use changes on recent biodiversity patterns or biodiversity richness.
The research explores the legacy effects of historical agricultural land use at selected hotspots of change and how these insights can inform sustainable future management practices and biodiversity restoration. Our approach provides a unique opportunity to link historical developments with present-day biodiversity richness – or poorness offering valuable knowledge on the timeframes of degradation and potential restoration. These findings are crucial for addressing contemporary challenges in biodiversity conservation and sustainability. This study emphasises the importance of historical perspectives in ecological research and highlights the need for integrative approaches to safeguard biodiversity in agricultural landscapes.

How to cite: Lohrum, N., Storgaard Danielsen, A.-C., Graversgaard, M., Normand, S., and Dalgaard, T.: From Fields to Flora: Decoding Historical Land-Use Intensification and Its Impact on Danish Plant Biodiversity, EGU General Assembly 2025, Vienna, Austria, 27 Apr–2 May 2025, EGU25-17877, https://doi.org/10.5194/egusphere-egu25-17877, 2025.

EGU25-20230 | Posters on site | ITS3.7/BG0.6

Assessing the Impact of Anthropogenic Seismic Activity on Wildlife in Protected Areas 

Lara Boudinot, Thomas Lecocq, Feras Almasri, Paula Koelemeijer, Robert Montgomery, and Beth Mortimer

Globally, the encroachment of human activities on protected areas is accelerating, posing new challenges for biodiversity conservation. As the United Nations’ 2030 goal of protecting 30% of the planet's landmass for nature draws closer, understanding the lesser-known dimensions of human disturbances becomes critical. Anthropogenic seismic noise, such as that produced by mining, oil drilling, and heavy infrastructure development, represents a largely unexplored but potentially substantial threat to sensitive ecosystems. Recent studies have revealed that large mammals, including elephants, are sensitive to seismic waves, detecting seismic signals and potentially using them for long-distance communication.

This research explores the interplay between seismology and conservation biology by investigating the impact of seismic noise from extractive operations on wildlife spatial behavior and habitat use in Murchison Falls National Park, Uganda. Using seismometers, camera traps, and machine learning models, this study uncovers correlations between seismic activity patterns and shifts in large mammal movements. The findings highlight how seismic disturbances propagate into wildlife behavior, contributing to an emerging understanding of how human activities affect ecosystems beyond visible or audible dimensions. By bridging the fields of geophysics and biodiversity conservation, this research underscores the need for holistic environmental impact assessments in protected areas and provides a foundation for mitigating seismic noise effects on biodiversity.


How to cite: Boudinot, L., Lecocq, T., Almasri, F., Koelemeijer, P., Montgomery, R., and Mortimer, B.: Assessing the Impact of Anthropogenic Seismic Activity on Wildlife in Protected Areas, EGU General Assembly 2025, Vienna, Austria, 27 Apr–2 May 2025, EGU25-20230, https://doi.org/10.5194/egusphere-egu25-20230, 2025.

EGU25-20330 | ECS | Orals | ITS3.7/BG0.6

Post-gypsum mining landscapes in Germany - Unveiling Biodiversity  

Saskia Knispel de Acosta

In light of European and international mandates to protect natural areas for biodiversity conservation, unused or abandoned areas are increasingly recognized as valuable resources. This study investigates the botanical and structural diversity of mining areas and surrounding landscapes across four major gypsum mining regions in Germany. Over the course of a year, we analysed 66 study transects across 24 mining sites, categorizing them based on their structure and usage. Our results indicate that vascular plant diversity in restored post-mining landscapes is significantly higher than in the surrounding undisturbed areas. This research underscores the importance of these disturbed landscapes for Red List species and the potential of recovering gypsum-mining sites in Germany to protect biodiversity. Furthermore, our findings highlight the critical role of management strategies, with particular emphasis on renaturation and recultivation as effective techniques to enhance the nature conservation value of abandoned sites.

The study also reveals the significant influence of management interventions on the ecological development of these landscapes. Renaturation, involving the restoration of natural habitats, was found to be more beneficial for biodiversity than recultivation, which often involves returning areas to agricultural or forestry use. We advocate for long-term management plans in renaturation areas, as these are essential for sustaining species diversity, particularly for areas undergoing ecological succession. Regular mechanical disturbance, applied in a mosaic pattern every 3–5 years using methods such as grazing, brush cutting, or heavy tillage, can further improve biodiversity outcomes. Additionally, after mining activities cease, the creation of a diverse range of landscape structures—such as steep walls, shallow water areas, rubble piles, and stone slabs—can support a variety of species.

This study contributes to our understanding of the potential for post-mining landscapes to serve as important habitats for biodiversity conservation. It also provides practical recommendations for nature conservation organizations, municipalities, and the mining industry. By fostering partnerships and implementing long-term renaturation concepts, we can improve the ecological restoration of mining areas and ensure their role in biodiversity protection.

Keywords: gypsum mining, biodiversity, time-for-space concept, disturbance ecology, post-mining landscapes, nature conservation, Red List species, ecological restoration

Implications for Practice:
The trends observed in renatured and recultivated areas have significant implications for future management plans, particularly those aimed at preserving and promoting floristic and faunal biodiversity. We recommend:

  • Long-term management plans are crucial for renaturation areas but not strictly necessary for recultivated sites.
  • Regular mechanical disturbance should be applied in a mosaic pattern every 3–5 years.
  • A variety of landscape structures should be created after the dismantling of extraction sites.
  • Renaturation is preferable to recultivation for biodiversity development

How to cite: Knispel de Acosta, S.: Post-gypsum mining landscapes in Germany - Unveiling Biodiversity , EGU General Assembly 2025, Vienna, Austria, 27 Apr–2 May 2025, EGU25-20330, https://doi.org/10.5194/egusphere-egu25-20330, 2025.

EGU25-6 | Orals | ITS3.12/BG0.8 | Highlight

Mutualisms weaken the latitudinal diversity gradient among oceanic islands 

Camille Delavaux, Thomas Crowther, James Bever, Patrick Weigelt, and Evan Gora

The latitudinal diversity gradient (LDG) dominates global patterns of diversity, but the factors underlying the LDG remain elusive. Here, we use a unique global dataset to show that vascular plants on oceanic islands exhibit a weakened LDG and explore potential mechanisms to explain why. Our results show that traditional physical drivers of island biogeography – namely area and isolation – contribute to the difference between island and mainland diversity at a given latitude (i.e., the island species deficit), as smaller and more distant islands experience reduced colonization. However, plant species with mutualists are underrepresented on islands, and we find that this plant mutualism filter explains more variation in the island species deficit than abiotic factors. In particular, plant species that require animal pollinators or microbial mutualists like arbuscular mycorrhizal fungi contribute disproportionately to the island species deficit near the equator, with decreasing contributions with distance from the equator. As such, plant mutualist filters on species richness are particularly strong at low latitudes where mainland richness is highest, weakening the LDG of oceanic islands. These results provide empirical evidence that mutualisms, habitat heterogeneity, and dispersal are key to the maintenance of high tropical plant diversity and mediate the biogeographic patterns of plant diversity on Earth.

How to cite: Delavaux, C., Crowther, T., Bever, J., Weigelt, P., and Gora, E.: Mutualisms weaken the latitudinal diversity gradient among oceanic islands, EGU General Assembly 2025, Vienna, Austria, 27 Apr–2 May 2025, EGU25-6, https://doi.org/10.5194/egusphere-egu25-6, 2025.

Forests, which contain a large share of the world’s terrestrial biodiversity, have and are still being converted for various land-use. Assessment of human impact on forest biodiversity requires knowledge of the baseline state – the biodiversity found in natural ecosystems. Primary forests, which have had little to no direct human impacts, may represent this baseline state. In this systematic literature review we assess the effect of forest management on the species richness of multiple taxonomic groups (epiphytic lichen, understory vascular plant, saproxylic beetle) at the European scale, while using primary forests as references. By reviewing European studies comparing species richness in primary and managed forests, we quantified effect sizes and summarized the comprehensiveness, representativeness, and scale of existing research. Our review identified a shortage of large-scale studies and large variability in study designs, limiting our ability to confidently compare and generalize findings across Europe. Hence, using the current European literature, it is challenging to assess the effect of forest management on species richness. To enable more robust analyses at this spatial scale, increased efforts to map primary forests and adopt standardized biodiversity assessment guidelines across Europe may be helpful.

How to cite: Volle, C., Blennow, K., and Ahlström, A.: Using Primary Forests as Baselines to Assess the Effect of Forest Management on Biodiversity: A Multi-Taxonomic European Perspective, EGU General Assembly 2025, Vienna, Austria, 27 Apr–2 May 2025, EGU25-322, https://doi.org/10.5194/egusphere-egu25-322, 2025.

EGU25-419 | ECS | Orals | ITS3.12/BG0.8

Reindeer grazing counterbalances the treeline expansion in the Scandinavian subarctic 

Liyenne Hagenberg, Femke Pijcke, Tim Horstkotte, Johan Olofsson, and Matthias Siewert

Herbivory may offset climate change driven treeline expansion into the tundra. This study quantifies the effects of reindeer grazing on mountain birch recruitment and growth in the treeline ecotone in the Scandinavian sub-arctic in an area with contrasting grazing regimes for the past 20 years. We measured seedling density and the allometry of trees below, at, and above the treeline as well as vegetation composition along 20 transects crossing the treeline. Additionally, we investigated nutrient loading of soils and its effects on adult tree growth rate. Our results show that the treeline in the area grazed in winter may be responding to climate forcing by expanding diffusely into the tundra, while no treeline expansion was observed under the year-round grazing regime. High grazing pressure also reduced the numbers of tree basal shoots and the number of leaves below reindeer browsing height (<2 m). Additionally, we found a shift in ground layer vegetation composition in the area grazed year-round. Our results suggest that reindeer grazing at high density and when occurring during the growing season has the potential to stabilize the treeline locally, as well as significantly modify field layer vegetation composition in the treeline ecotone.

How to cite: Hagenberg, L., Pijcke, F., Horstkotte, T., Olofsson, J., and Siewert, M.: Reindeer grazing counterbalances the treeline expansion in the Scandinavian subarctic, EGU General Assembly 2025, Vienna, Austria, 27 Apr–2 May 2025, EGU25-419, https://doi.org/10.5194/egusphere-egu25-419, 2025.

EGU25-470 | ECS | Posters on site | ITS3.12/BG0.8 | Highlight

Climate change impacts on the Arctic tundra-forest ecotone – present and future 

Millicent Harding, Robert Baxter, and Daniel Donoghue

The forest-tundra ecotone (FTE) is the transition zone between the northern boreal forest and Arctic tundra. In response to climate warming, boreal forests may, as in the past, migrate northwards with potential consequent increases in tree growth, canopy density, and stand productivity. Or they may perhaps remain stationary or even retreat. Such outcomes may then influence energy balance as well as above and below ground carbon stocks and hence feedback to Earth’s climate system. 

The Fennoscandian Arctic climate spans from predominantly oceanic in the west to continental in the east. Forest advance may not be uniform across this east-west transition. How climate and microclimate interact leading to advance, stationarity, or retreat of the boreal forest is being investigated. Approaches include a novel combination of remote sensing, terrestrial laser scanning plus microclimate data in combination with machine learning and ecological models is utilised to predict future forest extent under climate warming. 

How to cite: Harding, M., Baxter, R., and Donoghue, D.: Climate change impacts on the Arctic tundra-forest ecotone – present and future, EGU General Assembly 2025, Vienna, Austria, 27 Apr–2 May 2025, EGU25-470, https://doi.org/10.5194/egusphere-egu25-470, 2025.

Modelling of the current and potential distribution of Reynoutria japonica Houtt. in the territories of 14 European countries, including Ukraine, has been conducted using the maximum entropy approach in the Maxent software package. The changes in the distribution area and ecological niche have been forecast based on two climate change scenarios up to 2100. Based on 19 170 records R. japonica of the database GBIF, it has been demonstrated that Europe is suitable for the establishment of this taxon, including mountainous areas. The distribution of species in Germany and Ukraine by biotopes depending on climate change has been studied. It has been found that the range will expand into northern zones by 13.6% or 17.0%, depending on the scenario. However, the contraction of the distribution area in the southern regions amounts to 26%, resulting in a slight contraction of the range (by 9-13%) by 2100 due to a reduction in the distribution areas in the southern regions of Europe, where maximum air temperatures will increase. The most important climatic variables affecting distribution are temperature variability throughout the year (seasonality) due to the significant difference in temperatures in summer and winter, the average temperature of the driest quarter, isothermality (the ratio of the mean annual temperature to the mean annual temperature range), the average temperature and precipitation of the warmest quarter, particularly the temperature variability throughout the year and precipitation in the warmest quarter, which are limiting factors for distribution. The minimum temperature of the growing season will affect the distribution in forecasts up to 2060, but this parameter does not have a limiting effect under current climate conditions. An assessment and forecast of the increasing harmful impact of Reynoutria taxa on ecosystems and biodiversity, considering climate changes and the impact of military actions in Ukraine, has been given. A general algorithm for controlling Reynoutria Houtt invasions have been developed, which can be used at the state and interstate levels. The risks of Reynoutria taxa invasions have been assessed, including specific threats to the territory of Ukraine, which will contribute to significant invasions of representatives of this genus in the future. The results are important for early detection, assessment and monitoring, management of the spread of the taxon in protected areas, and urban green infrastructure.

For the first time, a risk assessment and climate modelling of the distribution of R. japonica have been conducted in Europe and Ukraine and are important for threat assessment and effective ecosystem management and prevention of threats to the destruction or restructuring of biodiversity.

How to cite: Miroshnyk, N.: Climate modelling of the Reynoutria japonica Houtt. distribution for 14 European countries. Impact on biodiversity, the need for risk management, EGU General Assembly 2025, Vienna, Austria, 27 Apr–2 May 2025, EGU25-2751, https://doi.org/10.5194/egusphere-egu25-2751, 2025.

EGU25-2841 | Posters on site | ITS3.12/BG0.8

Comparing ecological relevance of climate velocity indices 

Stéphane Goyette, Laure Moinat, Jérôme Kasparian, and Iaroslav Gaponenko

Climate change has been shown to induce shifts in species distribution areas. These shifts are
driven not only by climate parameters, but also by short-term weather events, topography and other
non-climate factors. Furthermore, the estimation of magnitude of the climate change velocity requires
assumptions regarding its direction, since the two-dimensional velocity vector is not fully constrained
by temperature, which is a scalar. Furthermore, the definition of the magnitude and direction of the
climate velocity is not univocal; assumptions are needed, based on physical as well as mathematical
arguments. The well-known gradient-based definition of climate change [1] has limitations and in
particular local divergences [2]. This has recently prompted the introduction of an alternative method
that aims to maximise the regularity of the velocity field. This method is known as Monte-Carlo
iTerative Convergence Method (MATCH) [3].
The ecological relevance of these methods for specific purposes necessitates assessment. Here, we
asses them against observed shifts in species distribution ranges. The present study includes both ma-
rine and terrestrial species, including North American birds as determined by the Audubon Christmas
Bird Count and the NOAA fisheries survey along the North American coast. The centroid of each
species distribution range is determined at decade-long time ranges and over the entire survey period.
The shifting velocity of these centroids are computed with respect to the latitudinal, longitudinal
and vertical (respectively elevation and depth) directions. The isotherm shift is calculated using the
gradient-based and the MATCH methods for ground and sea-surface temperatures at each observation
location.
The results obtained demonstrate a significant positive correlation between latitudinal and ver-
tical (depth or height) shifts calculated with the MATCH approach, as evidenced by the analysis of
bird species in the western part of the North American continent and marine species. Conversely, no
correlation was found between longitudinal shifts and climate shifts calculated with either method.
These findings suggests that the MATCH approach generates velocity fields that are more relevant
ecologically. It may help to anticipate species range shifts and adapt conservation strategies accord-
ingly.

References
[1]. S. R. Loarie et al. Nature 462, 1052 (2009)
[2]. J. Rey, G. Rohat, M. Perroud, S. Goyette, J. Kasparian, Env. Res. Lett. 15, 034027 (2020)
[3]. I. Gaponenko, G. Rohat, S. Goyette, P. Paruch, J. Kasparian, Sci. Rep., 12, 2997, (2022)

How to cite: Goyette, S., Moinat, L., Kasparian, J., and Gaponenko, I.: Comparing ecological relevance of climate velocity indices, EGU General Assembly 2025, Vienna, Austria, 27 Apr–2 May 2025, EGU25-2841, https://doi.org/10.5194/egusphere-egu25-2841, 2025.

EGU25-2993 | ECS | Posters on site | ITS3.12/BG0.8

The Biodiversity Footprint of Taiwan's Semiconductor Industry 

Chen-Wei Hsu and Ching-Pin Tung

Biodiversity loss has emerged as one of the most pressing challenges of our time, threatening the stability of ecosystems and their capacity to sustain life on Earth. The World Economic Forum's Global Risks Report 2024 underscores biodiversity loss as a critical risk to global economic resilience. Taiwan, commanding 30% of global semiconductor manufacturing capacity in 2024 and ranking as the world's second-largest producer, plays a pivotal role in the global supply chain. However, current research lacks a comprehensive understanding of how the industry's operations impact Taiwan's biodiversity across terrestrial, freshwater, and marine ecosystems. This study analyzes the biodiversity footprint of Taiwan's semiconductor industry using corporate sustainability reports and governmental environmental statistics from 2020 to 2023. The research examines Taiwan's semiconductor supply chain, from IC design to wafer manufacturing and packaging services, through leading companies including TSMC (Taiwan Semiconductor Manufacturing Company), UMC (United Microelectronics Corporation), and ASE Group (Advanced Semiconductor Engineering). The study employs the ReCiPe methodology to quantify key biodiversity-related pressures such as habitat loss from land use transformation; freshwater ecosystem disruption from water consumption and wastewater discharge; and atmospheric deposition effects on sensitive ecosystems. The analysis provides a comprehensive view of how these pressures cumulatively affect Taiwan's terrestrial, freshwater, and marine biodiversity. As the first comprehensive biodiversity impact assessment of Taiwan's semiconductor industry, this research provides practical tools to evaluate and mitigate biodiversity risks, supports investor nature-related risk assessments, and establishes a scientific foundation for policy-driven biodiversity conservation. The assessment establishes quantitative linkages between industrial activities and biodiversity outcomes while providing strategic pathways toward nature-positive transformation in the semiconductor industry, advancing the critical balance between industrial development and ecosystem resilience.

How to cite: Hsu, C.-W. and Tung, C.-P.: The Biodiversity Footprint of Taiwan's Semiconductor Industry, EGU General Assembly 2025, Vienna, Austria, 27 Apr–2 May 2025, EGU25-2993, https://doi.org/10.5194/egusphere-egu25-2993, 2025.

EGU25-6250 | ECS | Orals | ITS3.12/BG0.8

Roadmap for identifying priority areas to monitor the effects of climate change on European rivers 

Julie Crabot, Jukka Aroviita, Helena Bayat, Angela Boggero, Núria Bonada, Thibault Datry, Sami Domisch, Maria Joao Feio, Mathieu Floury, Riccardo Fornaroli, Virgilio Hermoso, Jonathan Jupke, Alex Laini, Heikki Mykrä, Narcis Prat, Ralf Schaefer, Astrid Schmidt-Kloiber, and Miguel Cañedo-Argüelles

There is an urgent need for planning actions to mitigate biodiversity loss worldwide, which involves developing assessment methods to help decision-makers identifying areas most at risk and prioritizing action.  This requires robust data and analyses but it also implies thinking about realistic and cost-effective measures. Fresh waters host an important part of global biodiversity but freshwater organisms are expected to be profoundly impacted by the predicted increase in water temperatures and discharge alterations associated with climate change. However, available models focus mostly on changes in air temperature, potentially failing to incorporate these impacts. Given that freshwater biodiversity is declining at an alarming and exponentially increasing rate, there is an urgent need to monitor the potential effects of climate change. Here, we modeled the distribution of freshwater macroinvertebrates across Europe for present and future conditions including recently available data on water temperature and discharge. We also included other environmental variables that might be relevant in understanding the current spatial distribution of invertebrates (e.g. geology, adjacent land use). We used 40 datasets of standardized monitoring protocols of freshwater invertebrates spanning 23 years. Then a score of the vulnerability to climate change was attributed to each taxon based on the models. Finally, the average community indicator calculated for all European rivers allowed us to identify relevant regions for monitoring climate change using a planning conservation tool.

How to cite: Crabot, J., Aroviita, J., Bayat, H., Boggero, A., Bonada, N., Datry, T., Domisch, S., Feio, M. J., Floury, M., Fornaroli, R., Hermoso, V., Jupke, J., Laini, A., Mykrä, H., Prat, N., Schaefer, R., Schmidt-Kloiber, A., and Cañedo-Argüelles, M.: Roadmap for identifying priority areas to monitor the effects of climate change on European rivers, EGU General Assembly 2025, Vienna, Austria, 27 Apr–2 May 2025, EGU25-6250, https://doi.org/10.5194/egusphere-egu25-6250, 2025.

EGU25-7264 | ECS | Orals | ITS3.12/BG0.8

Improving high latitude vegetation representation in the ORCHIDEE land surface model by introducing shrub PFTs 

Anna Kirchner, Efrén López-Blanco, Vladislav Bastrikov, Sebastiaan Luyssaert, Philippe Peylin, and Anne Sofie Lansø

High-latitude terrestrial ecosystems are significantly affected by anthropogenic climate change. One of the most notable observed ecological responses is an expansion of shrubs across tundra ecosystems. These shifts in plant composition influence tundra carbon and energy balances, modify snow and soil dynamics, and have broader implications for regional and global climate systems. However, due to multiple interacting processes involving ecosystem CO2 and energy fluxes, permafrost, soil moisture, nutrient availability and interactions with snow cover, the net climate impact of shrubification, including its feedback potential and future trajectory, remain highly uncertain.

Land surface models can contribute to reducing those uncertainties and improving understanding of interactions, drivers and responses of tundra shrubification, but this requires an adequate representation of the involved ecosystems and processes in the models. However, the diversity of high-latitude ecosystems and processes is underrepresented in many global land surface models, including the ORCHIDEE land surface model. The current ORCHIDEE model version lacks key tundra plant types such as shrubs, limiting its ability to account for their role in high-latitude carbon and energy budgets, as well as to simulate tundra vegetation shifts and climate feedback processes, including shrubification. Instead, boreal trees are simulated in areas where shrubs dominate, resulting in a significant overestimation of aboveground biomass in high latitudes.

This work introduces two new plant functional types (PFTs) into the ORCHIDEE model—tall deciduous shrubs and evergreen dwarf shrubs - enhancing its representation of tundra vegetation. Their implementation is heavily based on observational data of shrub plant traits, growth form, biomass and CO2 fluxes across the tundra region, which are used for calibration of model parameters and validation. The successful introduction of two shrub plant functional types with realistic growth form, carbon allocation and carbon fluxes into the ORCHIDEE model considerably improves its representation of high latitude vegetation, including its estimate of carbon stored in tundra biomass. Furthermore, it lays the foundation to simulate observed and future shrubification processes, their interactions with snow and permafrost dynamics and their climate impacts and feedbacks, which will be an important contribution to improve understanding of drivers and impacts of tundra vegetation change.


How to cite: Kirchner, A., López-Blanco, E., Bastrikov, V., Luyssaert, S., Peylin, P., and Lansø, A. S.: Improving high latitude vegetation representation in the ORCHIDEE land surface model by introducing shrub PFTs, EGU General Assembly 2025, Vienna, Austria, 27 Apr–2 May 2025, EGU25-7264, https://doi.org/10.5194/egusphere-egu25-7264, 2025.

EGU25-10369 | ECS | Posters on site | ITS3.12/BG0.8

Phenological impacts on the dynamics of non-invasive and invasive species communities in mountainous ecosystems 

Ruiling Liu, Kun Guo, Franz Essl, and Wenyong Guo

Alien plants are increasingly expanding from low to high elevations, threatening native communities in mountainous ecosystems. Understanding the mechanisms driving these invasions and their ecological impacts is essential for effective management and biodiversity conservation. Plant phenology, a sensitive indicator of environmental change, plays a pivotal role in facilitating plant colonization along environmental gradients. Although phenological niche differentiation between non-invasive and invasive plants has been observed, its impacts on invasion success and native community diversity remain underexplored. In this study, we conducted nine surveys from March to September across 35 plots along an altitudinal gradient in the Tianmu Mountain National Nature Reserve, Zhejiang Province. We recorded species composition, cover, and 10 functional traits to investigate temporal dynamics in community dissimilarity, ecological strategies, diversity and stability. Temporal patterns of non-invasive and invasive groups were compared across high and low elevations to infer the underlying community assembly processes. Our results revealed significant temporal shifts in community components, with diversity following an inverted U-shaped trajectory: non-invasive groups peaked in September, while invasive groups peaked in May. Both non-invasive and invasive groups showed decreasing species turnover over time, with higher community-weighted ruderal scores compared to competitive and stress-tolerant scores at both high and low elevations. Environmental variation between high and low elevations mediated relationships among community components, particularly diversity and stability. Distinct differences in community structure between non-invasive and invasive groups suggest divergent assembly mechanisms. Notably, invasive groups exhibited increasingly clustered phylogenetic patterns over time, decoupled from more divergent functional trait patterns. By integrating multidimensional community variables, this study provides a comprehensive view of annual dynamics and structural differences between non-invasive and invasive groups. It highlights the critical role of environmental change and phenological niche differentiation in shaping community dynamics, offering valuable insights into predicting community reorganization under future scenarios of climate change and alien plant invasion.

How to cite: Liu, R., Guo, K., Essl, F., and Guo, W.: Phenological impacts on the dynamics of non-invasive and invasive species communities in mountainous ecosystems, EGU General Assembly 2025, Vienna, Austria, 27 Apr–2 May 2025, EGU25-10369, https://doi.org/10.5194/egusphere-egu25-10369, 2025.

EGU25-10691 | ECS | Posters on site | ITS3.12/BG0.8

Global impacts of agricultural production on terrestrial biodiversity: Quantifying biodiversity losses and transboundary effects 

Can T. Nguyen, Davina Vačkářová, and Jan Weinzettel

Agricultural production is a primary driver of degrading terrestrial biodiversity through crop cultivation and livestock grazing, which appropriates an extensive global land. These impacts may even go beyond the national territories and embody transboundary effects through international trade. This study utilizes the Biodiversity Intactness Index (BII) as a proxy to quantify terrestrial biodiversity loss associated with crop and livestock production. It allocates BII losses to individual crop and livestock commodities while assessing the spatial impacts of land conversion on biodiversity (measured in affected areas, km²), thereby enabling a more detailed biodiversity footprint analysis. The findings highlight that agricultural production induces approximately 2.6 million km2 of BII loss (1.9% global land), mostly from Asian and African continents, which are evenly dominated by crops and livestock. The crops and livestock vary by region, but cereal crops and meat cattle are the primary contributors to biodiversity loss worldwide. BII losses from crops have been steadily increasing, while those from livestock have been decreasing since the beginning of the last decade. The standardized BII loss allocated to total production reveals that the production in Central Asia, Eastern Europe, Africa, Western Asia, and Russia implies higher biodiversity loss in their productions than in other regions. The FAO international trade data between countries is incorporated to indicate that about 10.5% of the total BII losses are linked to international trade in 2020. Asia and Southern Africa are net importers of biodiversity losses, while North America, Australia and New Zealand, South America, and Eastern Europe are the net exporters of biodiversity losses through their crop and livestock commodities.

This study is the preliminary effort to analyze biodiversity loss embodied in international trade before it will be comprehensively tracked by multi-regional input-output analysis. The research findings highlight the significant global impact of agricultural production on terrestrial biodiversity, which emphasizes the need for targeted regional and international policies to mitigate biodiversity loss, particularly through sustainable agricultural practices and responsible trade frameworks.  


How to cite: T. Nguyen, C., Vačkářová, D., and Weinzettel, J.: Global impacts of agricultural production on terrestrial biodiversity: Quantifying biodiversity losses and transboundary effects, EGU General Assembly 2025, Vienna, Austria, 27 Apr–2 May 2025, EGU25-10691, https://doi.org/10.5194/egusphere-egu25-10691, 2025.

EGU25-12001 | ECS | Posters on site | ITS3.12/BG0.8

NordBorN: a research and educational platform to understand borealization in the Nordic region 

Mariana Verdonen and Isabel C. Barrio and the NordBorN team

Climate and land use changes are driving biome boundary shifts worldwide, with higher latitudes experiencing an expansion of boreal forest species into the tundra—a process known as borealization. This phenomenon includes treeline advancement, shrub expansion, changes in ecosystem structure and function, and the spread of non-native species. These shifts have significant implications for the functioning of Nordic terrestrial ecosystems and their capacity to deliver ecosystem services. The Nordic Borealization Network (NordBorN) is a five-year NordForsk-funded project that aims to address these challenges by fostering collaboration among six Nordic universities and three associated partners. NordBorN seeks to advance research excellence in terrestrial ecology by investigating the processes, drivers, and consequences of borealization, while also establishing a training hub for the next generation of Nordic researchers. By facilitating mobility, co-supervision of graduate students, and collaborative research initiatives, NordBorN will provide critical insights and capacity building to understand and manage the ecological and societal impacts of borealization in Nordic ecosystems.

How to cite: Verdonen, M. and Barrio, I. C. and the NordBorN team: NordBorN: a research and educational platform to understand borealization in the Nordic region, EGU General Assembly 2025, Vienna, Austria, 27 Apr–2 May 2025, EGU25-12001, https://doi.org/10.5194/egusphere-egu25-12001, 2025.

EGU25-12056 | Orals | ITS3.12/BG0.8

Borealization of terrestrial ecosystems: patterns, drivers and consequences  

Isabel C. Barrio and the NordBorN team

As the Northern latitudes of the planet warm, species are moving northward, a process that has been referred to as borealization. While this term has been mainly applied to the marine realm, similar patterns are described for terrestrial ecosystems but a common terminology is lacking. We define the term tundra borealization as shifts in species composition with climate change and land use change from the boreal forest into the tundra biome. Land use changes interact with climate change to lead to species and community reorganization in northern biomes, and borealization can have important consequences to food webs and ecosystem functions. There is growing evidence of borealization of plant and animal communities in tundra ecosystems and there are different methods that can be used to quantify borealization. Yet, metrics to assess borealization need to be standardized. Bringing together different definitions and lines of evidence for tundra borealization, we aim to emphasize this important ecological process and rapidly evolving area of research.

How to cite: Barrio, I. C. and the NordBorN team: Borealization of terrestrial ecosystems: patterns, drivers and consequences , EGU General Assembly 2025, Vienna, Austria, 27 Apr–2 May 2025, EGU25-12056, https://doi.org/10.5194/egusphere-egu25-12056, 2025.

EGU25-12514 | ECS | Posters on site | ITS3.12/BG0.8

Arctic biodiversity responses to climate change impacts in the Canadian Beaufort Sea  

Inda Brinkmann, Matt O'Regan, Bennet Juhls, Paul Overduin, Lisa Bröder, Negar Haghipour, Jorien Vonk, Julie Lattaud, Taylor Priest, Dustin Whalen, Atsushi Matsuoka, André Pellerin, Daniel Rudbäck, Maria-Emilia Rodriguez-Cuicas, Katharina Schwarzkopf, Blanda Matzenbacher, Thomas Bossé-Demers, Michael Fritz, and Peter D. Heintzman

The Arctic is experiencing unprecedented rates of warming. Arctic coastal environments are particularly vulnerable to the consequences: thawing of permafrost, decline of sea ice, and increased fluxes of sediment, organic carbon and nutrients across the land-ocean interface. These effects of global climate change drive significant transformations in coastal biogeochemistry and ecosystems, with severe implications for local communities. However, the responses of nearshore Arctic ecosystems to these changes, as well as involved mechanisms and driving forces, remain poorly constrained. The 'Fluxes from Land to Ocean: How Coastal Habitats in the Arctic Respond' (FLO CHAR) project focuses on the Mackenzie Delta region of the Beaufort Sea and asks the question: How does modern climate change alter land-ocean dynamics and the biodiversity of coastal ecosystems? A key objective is to explore biodiversity shifts and ecosystem functioning over the past millennium, to gain long-term perspectives of ecosystem dynamics in response to climate-driven changes. This is achieved through marine sedimentary ancient DNA (sedaDNA) analyses, utilizing state-of-the-art metabarcoding approaches and shotgun metagenomics. Establishing baseline data of coastal biodiversity in the Beaufort-Mackenzie region during the Late Holocene will allow to put modern biodiversity and ecosystem dynamics in a long-term context. Further, key diversity shifts will be assessed in the context of paleoenvironmental and -geochemical records to assess potential responses to climate change impacts, such as sea ice dynamics and land-ocean organic matter fluxes. The outcomes of the project will offer a critical framework for assessing future directions of Arctic coastal environments, and developing sustainable management and adaptation strategies.

How to cite: Brinkmann, I., O'Regan, M., Juhls, B., Overduin, P., Bröder, L., Haghipour, N., Vonk, J., Lattaud, J., Priest, T., Whalen, D., Matsuoka, A., Pellerin, A., Rudbäck, D., Rodriguez-Cuicas, M.-E., Schwarzkopf, K., Matzenbacher, B., Bossé-Demers, T., Fritz, M., and Heintzman, P. D.: Arctic biodiversity responses to climate change impacts in the Canadian Beaufort Sea , EGU General Assembly 2025, Vienna, Austria, 27 Apr–2 May 2025, EGU25-12514, https://doi.org/10.5194/egusphere-egu25-12514, 2025.

EGU25-12826 | ECS | Orals | ITS3.12/BG0.8

From benthic functional biodiversity to the mapping of ecosystem functions: a case study over the Black Sea northwestern shelf 

Séverine Chevalier, Olivier Beauchard, Adrian Teaca, Tatiana Begun, Luc Vandenbulcke, Karline Soetaert, and Marilaure Grégoire

Keywords: macrozoobenthos, functional biodiversity, ecosystem functioning, benthic-pelagic coupling, northwestern shelf of the Black Sea, modelling.

Benthic biodiversity is of global significance for the provision of ecosystem services and the mediation of global biogeochemical cycles. For instance, the macrozoobenthos plays a key role in marine carbon and nutrient cycling. Yet, current ocean biogeochemical models oversimplify or ignore life at the seafloor and its variability. The absence of detailed spatial distribution of the functions of the benthos, at large-scale (e.g., coastal and shelf scales), partly explains why benthic life characteristics are not taken into account in model formulation of benthic-pelagic exchanges. This lack of knowledge critically prevents our ability to predict the impact of climate change on the functioning of benthic life and its feedback on marine ecosystem and the biogeochemical budget of carbon, nitrogen, oxygen, phosphorus.

Here, we propose to scale up benthic biodiversity data from field sampling to the evaluation of ecosystem functions at large-scale (e.g., carbon sequestration, denitrification), relevant for ecosystem-based management. In our study, we include mechanistic and statistical models to map functional benthic biodiversity in relation to environmental drivers, and ultimately to incorporate its variability into current ocean model.

In more details, we compile macrozoobenthos occurrence from 210 sampling stations, covering constrained benthic habitats, over the northwestern shelf of the Black Sea. We use a functional approach of the biodiversity meaning that species are defined by their traits (e.g., dwelling depth and mobility) with an effect on ecosystem functioning. Then, species traits are upscaled at the community level by crossing species observations and their traits. From punctual values, we map continuous distribution of traits as a proxy of ecological processes (e.g., biomixing and biodeposition), precursors of ecosystem functions. We use a neural network to reconstruct maps of traits by linking them to environmental drivers, provided by a biogeochemical model, at high temporal and spatial resolution, run in an operational mode by Copernicus Marine Service (CMEMS). We use a combination of dozen biogeochemical (e.g., bottom oxygen and flux of organic carbon to the bottom) and physical drivers (e.g., bottom temperature and shear stress) as preliminary predictors of the distribution of traits. Then, we choose the best selection of predictors for our trait distribution models.

Our key findings show that bottom oxygen and stock of organic carbon are strong predictors for the distribution of traits at shelf-scale. Specifically, areas with high suspended materials and nutrients, such as near the Danube Delta, show deeper burrowing depths and greater mobility in benthic communities meaning potentially higher impact on sediment biomixing. In contrast, permanently hypoxic waters are characterized by very low sediment biomixing potential and very low benthic biodiversity.

Thanks to the maps of ecosystem functions, we adapt the parametrization of a current diagenetic model (e.g., depth of mixed layer, bioturbation coefficient) to incorporate the variability of the functional benthic biodiversity. A diagenetic model constrained by seafloor biodiversity, will constitute a significant step for the development of ocean models considering the impact of environmental changes on benthic life and its ability to deliver key marine ecosystem functions.

How to cite: Chevalier, S., Beauchard, O., Teaca, A., Begun, T., Vandenbulcke, L., Soetaert, K., and Grégoire, M.: From benthic functional biodiversity to the mapping of ecosystem functions: a case study over the Black Sea northwestern shelf, EGU General Assembly 2025, Vienna, Austria, 27 Apr–2 May 2025, EGU25-12826, https://doi.org/10.5194/egusphere-egu25-12826, 2025.

EGU25-14430 | ECS | Posters on site | ITS3.12/BG0.8

Forest expansion threatens Arctic tundra ecosystems: A process-based modeling perspective 

Rodrigo Souto-Veiga, Philipp Porada, Ramona Julia Heim, Norbert Hölzel, Simeon Lisovski, Ulrike Herzschuh, Stefan Kruse, Sarah Haupt, Antonia Ludwig, and Hannes Feilhauer

Arctic tundra ecosystems are changing fast due to warming and more intense land use. In the SQUEEZE project, which focuses on identifying key Arctic regions for nature conservation, we are using a process-based vegetation model called LiBry (currently configured for mosses and lichens) to see how forest expansion and climate change might affect tundra biodiversity and functions in the future. In our initial simulations, we compared treeline conditions in 2020 and 2300 under RCP8.5, keeping other climate variables the same so we could look at forest invasion specifically. We found a drop in non-vascular plant biomass (from 0.65 Gt to 0.51 Gt), net primary productivity (from 0.26 Gt yr1 to 0.19 Gt yr1), and functional diversity. This suggests that increased tree cover may reduce future diversity and productivity of tundra plant communities, which might impact crucial processes such as permafrost protection.

As a next step, we plan to include shrubs, grasses, and other vascular plants in LiBry, using trait data from sources including the TRY database. By considering different stressors — forest invasion, climate change, grazing, and fire management — our work will enable more informed decisions about conservation across the Arctic. These simulations will ultimately support TundraProtect, a conservation tool aimed at prioritizing key areas for protection while addressing increasing economic pressures in the Arctic.

How to cite: Souto-Veiga, R., Porada, P., Heim, R. J., Hölzel, N., Lisovski, S., Herzschuh, U., Kruse, S., Haupt, S., Ludwig, A., and Feilhauer, H.: Forest expansion threatens Arctic tundra ecosystems: A process-based modeling perspective, EGU General Assembly 2025, Vienna, Austria, 27 Apr–2 May 2025, EGU25-14430, https://doi.org/10.5194/egusphere-egu25-14430, 2025.

The growth of population and economic development led to the rapid development of corporation. However, being the benefactor of ecosystem service, directly or indirectly, if the corporations fail to acknowledge the inevitable impacts of business activities on the natural environment, it could lead to the ongoing degradation of natural ecosystems, which is detrimental to environmental sustainability. Therefore, it is essential for corporations to assess nature-related risks.

This study took Qisda Corporation as case, employed the framework of the Taskforce on Nature-related Financial Disclosures (TNFD) in tandem with the biodiversity questionnaire to locate, evaluate and assess risks in order to determine material risks faced by the corporation. These material risks were subsequently analyzed under different climate change scenarios introduced by the Intergovernmental Panel on Climate Change (IPCC). The variations of risk severity were examined under the scenarios of SSP1-2.6, SSP2-4.5, and SSP5-8.5.

The results indicated that Qisda would encounter the most severe climate adaptation challenges under the SSP5-8.5 scenario, while the SSP1-2.6 scenario represents the most optimistic outlook. In response, Qisda implemented biodiversity and no-deforestation policies as well as conducting biodiversity assessments. By examining corporate operational strategies, this study aims to inspire corporations to act proactively, integrate the industry value chain, and establish comprehensive measures and mechanisms to address climate change and preserve biodiversity. In addition, the results of this study can serve as an empirical foundation for corporate biodiversity risk management and provide reference material for sustainable development efforts.

Key Words: Sustainable development, Scenario analysis, Climate change, TNFD, Corporation risk management

How to cite: Liu, C.-L., Chan, H.-C., Liang, S.-H., and Liao, Y.-T.: Analyzing Operational Risks and Response Strategies of Qisda Corporation Using Nature-Related Financial Disclosures and Climate Change Scenarios, EGU General Assembly 2025, Vienna, Austria, 27 Apr–2 May 2025, EGU25-14881, https://doi.org/10.5194/egusphere-egu25-14881, 2025.

EGU25-18871 | ECS | Posters on site | ITS3.12/BG0.8

Changes of macroinvertebrate in the glacial-fed river system Vestari-Jökulsá (Iceland) between 1996 and 2022 

Alicia Madleen Knauft, Martin Reiss, Gísli Már Gíslason, Jón S. Ólafsson, Iris Hansen, Ragnhildur Þ. Magnúsdóttir, and Peter Chifflard

The ongoing retreat of glaciers driven by climate change is predicted to significantly alter the ecological dynamics of glacier-fed streams, including changes in macroinvertebrate community composition. Previous studies suggest that increased water temperatures and altered channel stability due to glacial retreat initially decrease α-diversity due to elevated runoff, followed by an eventual rise in diversity and upstream shifts of species. Additionally, β-diversity is expected to decrease along the stream as highly adapted species near the glacial snout face changing conditions. However, few studies have confirmed these predictions yet, and most focus on temperate mountainous regions rather than Arctic environments.

To improve our understanding of these processes, an ongoing long-term research project investigates macroinvertebrates along the Vestari-Jökulsá (Iceland), an Arctic glacier-fed river draining the Satújökull glacier (Hofsjökull). In 1996 and 1997, Gíslason et al. (2002) studied longitudinal changes in macroinvertebrate communities and hydro-physical and hydro-chemical parameters in this river network to detect glacial influence as a function of distance from the glacier terminus. This dataset offers a unique opportunity to detect and compare the impact of current glacier retreat on macroinvertebrate communities, as well as hydro-physical and hydro-chemical parameters in this pro-glacial ecosystem over a long time period.

Data sampling will be conducted at 12 identical or comparable sites along the Vestari-Jökulsá and reference rivers in the area. Measured parameters include conductivity, temperature, discharge, sediment load, pH, macroinvertebrate diversity and density, nutrients, dissolved ions, chlorophyll α, and dissolved organic carbon content and composition through absorbance and fluorescence analyses. Hydrometric and hydro-chemical approaches will identify water sources (e.g., glacier meltwater, snowmelt, groundwater, rainfall, and stream water) at various spatial and temporal scales.

Fauna sampling was conducted in accordance with established methods in the ongoing long-term project. Near the glacier terminus, no recent invertebrate fauna was found. Approximately 83 individuals were identified at different life stages of insects (larvae, pupae, and imago). Most individuals belonged to Chironomidae (non-biting midges), with Diamesa spp. typically present. Diamesa species are specifically adapted cold-stenothermal kryal inhabitants. We also identified individuals from Simuliidae (black flies), Phoridae (humpbacked flies), and Scathophagidae (dung flies).

In the ongoing project, investigations will continue until the end of 2025 to obtain robust data for assessing long-term changes. This research aims to explore relationships between macroinvertebrate community diversity and environmental variables, identifying key drivers of ecological change. By evaluating Arctic systems' responses to glacier retreat, the study will offer critical insights into the resilience and adaptability of macroinvertebrate communities under rapid climatic shifts.

How to cite: Knauft, A. M., Reiss, M., Gíslason, G. M., Ólafsson, J. S., Hansen, I., Magnúsdóttir, R. Þ., and Chifflard, P.: Changes of macroinvertebrate in the glacial-fed river system Vestari-Jökulsá (Iceland) between 1996 and 2022, EGU General Assembly 2025, Vienna, Austria, 27 Apr–2 May 2025, EGU25-18871, https://doi.org/10.5194/egusphere-egu25-18871, 2025.

EGU25-19674 * | Orals | ITS3.12/BG0.8 | Highlight

Exploring the role of agricultural trade in the future of nature and people 

David Leclere, Amanda Palazzo, Charlotte Janssens, Samantha Hill, Esther Boere, Bettina Meinhart, and Petr Havlik

Abstract

Agricultural trade was an important driver of habitat and biodiversity loss in the recent decades (Chaudhary & Kastner 2016). Yet, it might also have increased land use efficiency and the net biodiversity impacts are heterogeneous across regions, commodities and spatial scales (Kastner et al. 2021, Roux et al. 2021). Trade greening is identified as a key leverage point to reverse global biodiversity declines (Chan et al. 2020), and future trade could be deeply affected by the food system sustainability transition needed to reach ambitious goals for climate, biodiversity and people (Leclère et al. 2020). To explore uncertainties in the co-evolution of agricultural trade and biodiversity in the coming decades, we used the GLOBIOM partial equilibrium model of the agricultural, forestry, bioenergy and aquaculture sectors (Havlík et al. 2014) to quantify a set of scenarios.

A first scenario dimension contrasted a future baseline prolongating historical trends (Middle of the Road Shared Socioeconomic Pathway SSP2, Popp et al. 2016) with additional efforts towards bending the curve of global biodiversity loss (Leclère et al. 2020) including increased conservation and restoration alone, or cumulated with a faster convergence of agricultural yields, reduced waste and increased share of plant-based products in diets. These scenarios are first combined with the standard SSP2 trade setup, and then combined with three alternative future trade variants as a second scenario dimension (Enhanced trade liberalization, Frictions and reconfigurations, Trade greening).

Preliminary results showed positive future socio-economic impacts and negative future environmental impacts in a scenario prolongating historical trends. Assuming an exacerbated liberalization worsened environmental impacts for mixed effects on socio-economic indicators, while trade frictions & reconfiguration would have mild environmental gains and negative socio-economic impacts as compared to the baseline. Trade Greening could have moderate positive impacts on all metrics as compared to the baseline. Relatively high levels of future increases in trade flows were found despite lower environmental impacts when assuming additional conservation and supply-side efforts. However, assuming additional demand-side efforts was more disruptive, with much larger environmental gains and food security risk reduction as compared to the baseline, but also much smaller future increases in agricultural value added and trade flows.

References:

Chan, KMA et al. (2020) Levers and leverage points for pathways to sustainability. DOI: 10.1002/pan3.10124

Chaudhary, A, Kastner, T. (2016) Land use biodiversity impacts embodied in international food trade. DOI: 10.1016/j.gloenvcha.2016.03.013

Kastner, T et al. (2021) Global agricultural trade and land system sustainability: Implications for ecosystem carbon storage, biodiversity, and human nutrition. DOI: 10.1016/j.oneear.2021.09.006

Roux, N et al. (2021) Does agricultural trade reduce pressure on land ecosystems? Decomposing drivers of the embodied human appropriation of net primary production. DOI: 10.1016/j.ecolecon.2020.106915

Leclère, D et al. (2020) Bending the curve of terrestrial biodiversity needs an integrated strategy. DOI: 10.1038/s41586-020-2705-y

Havlík, P et al. (2014) Climate change mitigation through livestock system transitions. DOI: 10.1073/pnas.1308044111

Popp, A et al. (2016) Land-use futures in the shared socio-economic pathways. DOI: 10.1016/j.gloenvcha.2016.10.002

How to cite: Leclere, D., Palazzo, A., Janssens, C., Hill, S., Boere, E., Meinhart, B., and Havlik, P.: Exploring the role of agricultural trade in the future of nature and people, EGU General Assembly 2025, Vienna, Austria, 27 Apr–2 May 2025, EGU25-19674, https://doi.org/10.5194/egusphere-egu25-19674, 2025.

Heavy metal pollution poses significant threats to global ecosystems, impacting biodiversity, soil and water quality, and human health. Traditional remediation methods often fall short, especially in ecologically sensitive regions. In response, phytoremediation offers a sustainable solution, leveraging plant species that naturally absorb heavy metals. This study explores the effectiveness of phytoremediation in Pin Valley National Park, Himachal Pradesh, India, integrating advanced remote sensing techniques—proximal, airborne, and space-borne data collection—to assess contamination levels and monitor environmental changes from 2010 to 2023. Proximal sensing utilized a spectroradiometer for high-resolution spectral data collection, while drones facilitated vast coverage, and satellites (Landsat-8, Landsat-9, and Sentinel-2) provided extensive temporal and spatial data. Vegetation and environmental health were analyzed using various indices, including the Normalized Difference Vegetation Index (NDVI), Normalized Difference Red Edge (NDRE), and Soil-Adjusted Vegetation Index (SAVI). These indices indicated plant vigor and environmental degradation. The Heavy Metal Index, Iron-Oxide Index, and Hydrothermal Index measured contamination levels, revealing significant correlations between heavy metal concentrations and vegetation stress markers. Results indicated a notable relationship between high NDVI values and low heavy metal concentrations, underscoring the efficacy of phytoremediation. Species like Indian mustard (Brassica juncea) and hemp (Cannabis sativa) emerged as key players in metal uptake, with Brassica juncea showing biomass lead accumulation of up to 2,500 mg/kg and Cannabis sativa exhibiting cadmium uptake of 900 mg/kg. The study identified minimal levels of heavy metals, such as Yttrium (3-11 ppb), Strontium (20-32 ppb), and Cadmium (0.045-0.170 ppb), across site locations.The application of remote sensing technology enabled precise mapping of metal concentrations and plant health, optimizing phytoremediation efforts. Longitudinal data revealed increasing NDVI values in reclaimed areas, rising from 0.35 to 0.65, indicating improved vegetation health and cover. Corresponding reductions in Heavy Metal Index values confirmed a decrease in contamination levels. This underscores remote sensing's critical role in ongoing environmental monitoring—rapidly identifying contamination hotspots, optimizing plant selection, and efficient resource allocation while ensuring reliable results across various scales. In conclusion, this research validates the effectiveness of combining phytoremediation with remote sensing technologies to address heavy metal contamination. The study’s framework is adaptable to various ecological contexts and contaminant profiles, highlighting its potential as a practical tool for environmental restoration worldwide. The findings contribute significantly to academic knowledge while offering actionable insights for policymakers and environmental managers dedicated to preserving ecosystems and promoting ecological resilience and sustainability. Continued refinement of these technologies will enhance global efforts to combat heavy metal pollution and support sustainable land management practices.

Keywords: Environmental Monitoring, Metal contamination, Phytoremediation, Pin Valley NP, Hyperspectral, Normalized Difference Red Edge Index (NDRE), Normalized Difference Vegetation Index (NDVI), Soil-adjusted Vegetation Index (SAVI), Strontium, Rubidium, Yttrium

How to cite: Sharma, D. and Galodha, A.: Advanced ecosystem restoration: Blending phytoremediation with satellite-based and non-imaging based remote sensing in the Himalayas of PIN Valley National Park, India, EGU General Assembly 2025, Vienna, Austria, 27 Apr–2 May 2025, EGU25-20611, https://doi.org/10.5194/egusphere-egu25-20611, 2025.

BG2 – Methods in Biogeosciences

Steroidal compounds are crucial biomolecules in nature, governing diverse biological functions and serving as indicators of organic matter origin, depositional environmental history, and facilitating geological correlations in the petroleum geochemistry (Moldowan et al., 1985; Volkman, 2003). Nevertheless, different organisms can generate identical steroidal compounds, so confident identifications of sources can be enhanced by stable isotope analysis. Prior studies have demonstrated the utility of molecular-average d13C to improve interpretations of the phylogenetic and environmental origins of steroidal compounds (Freeman et al., 1990). However, there are challenges and limitations associated with interpretation of d13C values of steroids in geochemical contexts, including post-depositional alteration and the influence of different abiotic and biotic processes. In addition, d13C values of steroidal compounds from different sources might overlap (Piper and Thevis, 2022).

We will present results of a novel Orbitrap-based analytical method for measuring multiple stable-isotope properties of steroidal compounds, including the intramolecular distributions of single and multiple 13C and D substitutions, with the aim of providing more reliable constraints of sources, environments and alteration histories. Unlike traditional bulk carbon isotope analysis, site-specific and multiply substituted carbon isotope analysis focuses on specific carbon positions or groups of positions within organic molecules, enabling detection of variations in carbon cycling, metabolic pathways, and microbial processes that may not be evident from bulk measurements alone. A first proof of concept study focuses on forensic discrimination of isotopic structures of natural and synthetic steroids in human subjects for the purpose of sports doping applications. Preliminary results reveal differences in the measured site-specific 13C, D and clumped isotope of various isotopologues derived from natural and synthetic steroids despite the similarity in their molecular average isotope values.

References

Freeman, K.H., et al., 1990. Evidence from carbon isotope measurements for diverse origins of sedimentary hydrocarbons. Nature343, 254-256.

Moldowan, J.M., et al., 1985. Relationship Between Petroleum Composition and Depositional Environment of Petroleum Source Rocks. AAPG Bull.69, 1255-1268.

Piper, T., Thevis, M., 2022. Investigations in carbon isotope ratios of seized testosterone and boldenone preparations. Drug Test. Anal.14, 514-518.

Volkman, J., 2003. Sterols in microorganisms. Appl. Microbiol. Biotechnol.60, 495-506.

How to cite: Shawar, L., Piper, T., and Eiler, J.: Site-Specific δ13C, D and Clumped Isotope Analysis of Steroidal Compounds for Forensic and Geochemical Applications, EGU General Assembly 2025, Vienna, Austria, 27 Apr–2 May 2025, EGU25-1492, https://doi.org/10.5194/egusphere-egu25-1492, 2025.

EGU25-3148 | ECS | Orals | BG2.1

The isotopic timeline of an agricultural field 

Bettina loy

The so-called crucial field is an agricultural test project west of Copenhagen since 2001, where various fertilizers (such as cattle manure, mineral fertilizer and organic household waste) have been applied on different sub-plots to study their long-term effects. Moreover, some sub-plots have been 'retired' and received only minimal fertilization after 2012. To investigate the numerous effects on C and N isotopes, I am analyzing stored fertilizer, soil and grain samples. The main points of investigation are

1. how the isotopic composition of the soil and the grain changes depending on the fertilizer treatment over time (caused by the fertilizer delta values or alternated soil processes due to fertilization);

2. how the isotopic delta values of the fertilizers themselves have changed since the beginning of the experiment and

3. how long the soil isotopic delta values take to reach pre-experimental values after 'retirement'.

In addition, it is intended to do GHG-flux measurements to investigate emissions of the sub-plots and  examine whether high emissions can be linked to high delta values in the soil. 

How to cite: loy, B.: The isotopic timeline of an agricultural field, EGU General Assembly 2025, Vienna, Austria, 27 Apr–2 May 2025, EGU25-3148, https://doi.org/10.5194/egusphere-egu25-3148, 2025.

EGU25-3735 | Orals | BG2.1

Role of 15N methods for assessing the susceptibility of agricultural N management systems to environmental N losses 

Benjamin Wolf, Fawad Khan, Samuel Franco Luesma, Frederik Hartmann, Michael Dannenmann, Rainer Gasche, Clemens Scheer, Andreas Gattinger, Wiebke Niether, and Ralf Kiese

An evaluation of the susceptibility of different N management systems to nitrogen (N) losses into the environment requires either the in-situ determination of the individual components of the nitrogen balance or the determination of the recovery of fertilizer N in plants and soil. For both aspects, 15N methods are essential as the 15N gas flux method (15NGF) is the only widespread in-situ method for the determination of dinitrogen (N2) emissions, and 15N labelled fertilizers can be used to assess the allocation of fertilizer N to plants and soil.

To evaluate the influence of management history on N losses, we quantified N loss pathways (NH3, N2O, N2, NO3- leaching), total N balance and 15N recovery in soil and plants of two adjacent sites over a two-year cropping sequence. One site was under integrated farming (IF) and the other under organic farming (OF) with frequent legume cultivation and occasional fertilizer input.

Though integrated farming had resulted in significantly higher pH, soil organic C and N content, the emissions of ammonia, dinitrogen and nitrous oxide after cattle slurry application as well as nitrate leaching were low and not significantly different. High 15N recovery rates in plants and soil agreed well with the low directly measured N losses. Integrating the directly measured losses into the 15N balance resulted in high overall recoveries of 84 to 100%. Conversely, unrecovered 15N was on a low level, but higher for OF (12%) than for IF (6%).

Our results confirm that 15N labelled fertilizers and their recovery can be used as an indicator for N losses, but the spatial variability is high, complicating statistically significant findings. Consideration of N2 fluxes using the 15NGF method could not close the 15N balance, indicating that unaccounted N losses have occurred. Since the directly measured N losses were not significantly different, unaccounted losses could be due to N2 emissions as their quantification was limited to two weeks after fertilizer application.

Overall, integrated farming history reduced the vulnerability towards N loss, but continuous methods for determination of N2 emissions, such as isotopomer measurements, need to be tested concomitantly, and uncertainty of 15N recovery in plants and soil needs to be reduced by more sophisticated sample mixing approaches.

How to cite: Wolf, B., Khan, F., Franco Luesma, S., Hartmann, F., Dannenmann, M., Gasche, R., Scheer, C., Gattinger, A., Niether, W., and Kiese, R.: Role of 15N methods for assessing the susceptibility of agricultural N management systems to environmental N losses, EGU General Assembly 2025, Vienna, Austria, 27 Apr–2 May 2025, EGU25-3735, https://doi.org/10.5194/egusphere-egu25-3735, 2025.

EGU25-4195 | ECS | Posters on site | BG2.1

Belowground carbon allocation response to soil acidification stress in a meadow grassland 

Yu Shang, Ruzhen Wang, and Yong Jiang

Soil acidification caused by atmospheric sulfur (S) deposition may have a significant impact on plant carbon (C) assimilation and allocation, thereby altering soil organic C (SOC) dynamics. However, it remains largely unknown for how plants allocate photosynthetic C among belowground functional sinks and whether they can leverage these limited C resources to adapt abiotic stresses. We conducted a 13CO2 pulse-labelling experiment in a grassland field to investigate the effects of simulated soil acidification by S addition on photosynthetic C allocation and analyzed the trade-offs among plant belowground functional sinks. We also elucidated the contribution of belowground C allocation to SOC formation. We found that soil acidification decreased the absolute amount of excess 13C allocated to both shoots and soils, possibly due to less photosynthetic C assimilation and aboveground biomass production. In contrast, S addition partially increased the excess 13C allocated to roots, indicating that a greater proportion of C was allocated to root biomass construction to combat acidification stress. The excess 13C in roots related negatively to soil 13C but positively to both root biomass and non-structural carbohydrates (NSC), suggesting a possible trade-off relationship in belowground 13C allocation between rhizodeposition and root growth. Our research confirms that under soil acidification stress, less photosynthetic C in roots was converted into rhizodeposition C entering the soil, while more was invested in root growth, respiration, and storage to improve their survival and ability to resist environmental stress. Although with lower excess 13C allocated to both shoots and soils, soil acidification had no effect on SOC stocks, possibly due to less SOC decomposition accompanied with suppressed microbial activity. These results provide an invaluable insight into plant C allocation strategy and its impact on belowground C dynamics under soil acidification stress.

How to cite: Shang, Y., Wang, R., and Jiang, Y.: Belowground carbon allocation response to soil acidification stress in a meadow grassland, EGU General Assembly 2025, Vienna, Austria, 27 Apr–2 May 2025, EGU25-4195, https://doi.org/10.5194/egusphere-egu25-4195, 2025.

EGU25-5149 | ECS | Orals | BG2.1

The dual nature of the hydrogen stable isotopes in tree-rings of the Holocene 

Tito Arosio, Markus Leuenberger, Kurt Nicolussi, and Matthias Saurer

The dual nature of tree-ring cellulose hydrogen isotope composition (δ²H) as a hydroclimatic and physiological proxy offers unique opportunities for palaeoclimatic research (Vitali et al. 2022, 2023), yet its application in long-term studies remains limited. Building on recent advances in tree-ring stable isotope research, we analyse the Alpine Holocene Tree-Ring Triple Isotope Record (AHTTRIR, Arosio et al. 2022), a comprehensive dataset spanning 9,000 years of δ²H, δ¹⁸O and δ¹³C measurements from high-altitude Alpine conifer trees. This study focuses on developing novel methodological approaches for δ²H analysis, applying species-specific values to establish the first multi-millennial δ²H chronology, and comparing it with δ¹⁸O chronology from the same dataset, which is known to contain hydroclimatic signals (Arosio et al. 2025). Despite the inherent complexity of δ²H signals and associated methodological challenges, analysis of approximately 7790 δ²H measurements from the AHTTRIR dataset shows that δ²H contains valuable information on both hydroclimatic variability and tree physiological responses. Through comparison with δ¹⁸O data, we show that δ²H provides complementary insights into plant metabolic processes, including storage mobilisation and stress adaptation mechanisms that could occur due to biotic or abiotic events affecting tree vitality, like damage to needles after insect attacks or frost. This dual-isotope approach, incorporating corrections for species- and age-specific effects, allows the separation of climatic signals from physiological responses over millennial timescales. Comparison with independent Alpine paleoclimate proxies and regional records strengthens our understanding of long-term hydroclimatic dynamics and their impact on tree metabolism throughout the Holocene. These results emphasise the importance of preserving long-term trends in isotope data, while highlighting the need for expanded tree-ring isotope research across different species and geographical regions. The establishment of this pioneering δ²H chronology advances our ability to reconstruct past climate variability while providing crucial insights into ecosystem responses to long-term environmental change.


Arosio Tito, Malin Ziehmer, Kurt Nicolussi, Christian Schluechter, Andrea Thurner, Andreas Österreicher, Peter Nyfeler, and Markus Christian Leuenberger,. 2022. “Alpine Holocene Triple Tree Ring Isotope Record.” PANGAEA, 2022. https://doi.pangaea.de/10.1594/PANGAEA.941604.

Arosio T, Leuenberger M., Nicolussi K, Esper J, Krusic P, Bebchuk T, Tegel W, Hafner A, Kirdyanov A, Schlüchter C, Reinig F, Muschitiello F and Büntgen U. 2025. “Tree-ring stable isotopes reveal a Holocene-long drying trend for central Europe”. In Revision to Science Advances

Vitali, Valentina, Elisabet Martínez-Sancho, K. Treydte, Laia Andreu-Hayles, Isabel Dorado-Liñán, Emilia Gutierrez, Gerhard Helle, Markus Leuenberger, Neil J. Loader, and Katja T. Rinne-Garmston. 2022. “The Unknown Third–Hydrogen Isotopes in Tree-Ring Cellulose across Europe.” Science of the Total Environment 813:152281.

Vitali, Valentina, Richard L. Peters, Marco M. Lehmann, Markus Leuenberger, Kerstin Treydte, Ulf Büntgen, Philipp Schuler, and Matthias Saurer. 2023. “Tree-Ring Isotopes from the Swiss Alps Reveal Non-Climatic Fingerprints of Cyclic Insect Population Outbreaks over the Past 700 Years.” Tree Physiology 43 (5): 706–21.

How to cite: Arosio, T., Leuenberger, M., Nicolussi, K., and Saurer, M.: The dual nature of the hydrogen stable isotopes in tree-rings of the Holocene, EGU General Assembly 2025, Vienna, Austria, 27 Apr–2 May 2025, EGU25-5149, https://doi.org/10.5194/egusphere-egu25-5149, 2025.

Pollution of surface and shallow groundwater by nitrate (NO3-) is a global concern resulting in deterioration of drinking water quality. Stable isotopes of NO3- 15N and δ18O) can be used to trace its sources which have distinct N and O isotopic signatures. The isotopic values can also be used to identify areas of natural remediation through biogeochemical processes such as denitrification. Conversion of aqueous NO3- to N2O headspace gas by Ti(III) reduction is a new method for analysis of NO3- stable isotopes. Previous literature introduces the analytical procedure but provides limited guidelines for instrument set-up and operation. Here, we present an automated purge and trap isotope ratio mass spectrometer (P&T-IRMS) combined with the Ti(III) reduction method for analysis of δ15N and δ18O in NO3-. The P&T-IRMS base analytical precision was ±0.3‰ and ±0.2‰ for δ15N and δ18O, respectively. Isotopic values were quantified down to an N2O gas concentration of 1 µl L-1 for δ15N and 2 µl L-1 for δ18O. The target NO3--N concentration needed for accurate measurements was 0.2 mg L-1. Comparison of δ15N and δ18O measured using the P&T-IRMS by Ti(III) reduction with EA-IRMS values showed high accuracy. The measurement precision (SD) and uncertainties (u) for our KNO3- internal standard were ±0.2 (±0.6) and ±0.2 (±0.9) for δ15N and δ18O, respectively. The P&T-IRMS and Ti(III) reduction method set-up showed low quantification limits and acceptable accuracy and precision in line with other well-established methods for analysis of NO3- stable isotopes. The provided guidelines will assist laboratories which utilize IRMS headspace gas instrumentation with the process of IRMS set-up and operation and establishment of an independent analytical procedure for the Ti(III) reduction method. 

How to cite: Gcakasi, M. N., Stumpp, C., and Watzinger, A.: Establishment of a purge and trap continuous flow isotope ratio mass spectrometer system for analysis of stable nitrate isotopes (δ15N and δ18O) in water samples by Ti(III) reduction, EGU General Assembly 2025, Vienna, Austria, 27 Apr–2 May 2025, EGU25-5412, https://doi.org/10.5194/egusphere-egu25-5412, 2025.

EGU25-5413 | Orals | BG2.1

Photosynthetic C18OO fractionation is related to within- and between-species variations in photosynthetic traits 

Xiaoying Gong, Sui Min Huang, Yong Zhi Yu, and Hans Schnyder

The C18O16O/C16O16O fractionation during photosynthesis (Δ18OA) carries rich information about plant physiology and environmental conditions, which is crucial for plant physiological, ecological, and biogeochemical studies. Δ18OA is mainly determined by the isotopic fractionation during diffusion and the CO2-leaf water oxygen exchange reaction. Therefore, Δ18OA is believed to relate to leaf physiological parameters such as the evaporative 18O enrichment of leaf water (Δe), CO2 influx and efflux. Based on current mechanistic understanding of Δ18OA, oxygen isotope composition of atmospheric CO2a) can be used to estimate global gross primary productivity and to separate photosynthetic and respiratory CO2 fluxes at the ecosystem scale. However, there is uncertainty about the key physiological factors responsible for changes in Δ18OA and whether there is a difference in Δ18OA between C3 and C4 plants.

In this study, we investigated the response of Δ18OA to short-term changes in CO2 levels in three C3 species (Helianthus annuus, Vigna unguiculata and Triticum aestivum) and one C4 species (Cleistogenes squarrosa) grown under different levels of vapour pressure deficit (VPD) and nitrogen supply. Utilising a new mass-balance equation that distinguishes metabolic (mitochondrial and photo-respiratory CO2) and purely diffusive (retro-diffusive CO2) CO2 fluxes, we assessed the effect of the gross CO2 efflux from leaves.

We found a significant CO2 effect on Δ18OA for C. squarrosa, but not for the C3 species. Δ18OA was not significantly correlated with Δe of the C3 species, and Δ18OA of C4 species was not sensitive to changes in Δe driven by VPD. The gross CO2 efflux and Δ18OA were significantly correlated for both C3 and C4 species, demonstrating its role in regulating Δ18OA. We also found that the C3 species had significantly higher Δ18OA than the C4 species, due to the lower ratio of intercellular to atmospheric CO2 (Ci/Ca) in the latter. Our study reveals the distinct difference in Δ18OA between C3 and C4 species and the remarkable relationship between Δ18OA and physiological parameters, which provides new insights into how Δ18OA can be used to infer carbon cycle processes from leaf to ecosystem scales.

How to cite: Gong, X., Huang, S. M., Yu, Y. Z., and Schnyder, H.: Photosynthetic C18OO fractionation is related to within- and between-species variations in photosynthetic traits, EGU General Assembly 2025, Vienna, Austria, 27 Apr–2 May 2025, EGU25-5413, https://doi.org/10.5194/egusphere-egu25-5413, 2025.

EGU25-5914 | ECS | Orals | BG2.1

δ65Cu as biomarker for the photophysiological state of a symbiotic coral  

Frank Förster, Lucie Sauzéat, Christine Ferrier-Pagès, Stéphanie Reynaud, and Tom Sheldrake

Explosive volcanic eruptions are capable of producing large amounts of ash, that affect the surrounding ecosystems. Once the ash comes in contact with seawater, the metal salts coating the ash particles quickly dissolve, releasing essential trace metals into the environment. Moderate ash exposure increases the concentrations of several essential metals in the coral host tissue and their algal endosymbionts. As a result, the photosythetic activity of algal symbionts increases, leading to healthier corals and suggesting that ash has a fertilizing effect on symbiotic corals. This study aims to investigate how the duration of ash exposure and the ash concentration affect the photophysiological state of corals and whether metal concentrations and stable isotope ratios can provide insight into the underlying biological processes.


Microcolonies of the scleractinian coral Stylophora pistillata were grown under controlled laboratory conditions, including pH, temperature and irradiance. The corals were divided into various tanks under four different conditions: a control group without ash exposure and three ash-exposure treatments (3.75 g ash/week for three weeks, 7.5 g ash/week for three weeks and  7.5 g ash/week for six weeks). These conditions were chosen to evaluate the effects of different amounts of ash and exposure durations on coral responses. Throughout the experiment, various photophysiological parameters were monitored, including photosynthesis and respiration rates, as well as the photosynthetic efficiency (measured by e.g. relative electron transfer rate and Fv/Fm). At the end of the experiment, Cu, Fe, and Zn concentrations and isotopic compositions (δ56Fe, δ65Cu and δ66Zn) were measured on the symbionts and tissues of three nubbins per tank.


Volcanic ash exposure enhanced the coral photosynthetic activity, although trace metal concentrations and isotope ratios didn’t change between the exposure conditions. The effect was also independent of the intensity or duration of exposure. However, δ65Cu levels in the coral host correlated almost perfectly with the photosynthetic parameters; corals with lighter δ65Cu demonstrated better photosynthetic performance. We propose that the δ65Cu serves as an indicator of the photochemical efficiency and may be linked to the antioxidant capacity of the coral host to mitigate oxidative stress, with stress likely increasing with long-term exposure. Understanding physiologically-induced metallomic responses following ash exposure improves the understanding of ecosystem resilience and collapse.


How to cite: Förster, F., Sauzéat, L., Ferrier-Pagès, C., Reynaud, S., and Sheldrake, T.: δ65Cu as biomarker for the photophysiological state of a symbiotic coral , EGU General Assembly 2025, Vienna, Austria, 27 Apr–2 May 2025, EGU25-5914, https://doi.org/10.5194/egusphere-egu25-5914, 2025.

EGU25-6283 | Orals | BG2.1

Seasonal dynamics of modern ostracod stable isotope (δ18O, δ13C) compositions in a large tropical lake (Lago Enriquillo, Dominican Republic)  

Claudia Wrozyna, Christopher Berndt, Markus Reuter, Michael E. Böttcher, Birgit Schröder, Edwin Garcia Cocco, and Torsten Haberzettl

The stable oxygen (O) and carbon (C) isotope composition of bulk carbonate in sediments is widely used for paleoenvironmental reconstructions. This approach, however, does often not consider seasonal variability in environmental conditions. Although, this can be overcome by the consideration of the specific composition of ostracod shells which have a relatively short and variable life history, this approach has not been consequently applied in the past. Only few studies investigated the potential of ostracodes in high-resolution (e.g. seasonal) paleoenvironmental reconstructions, based on their stable isotope composition, so far.

Seasonal meteorological conditions in tropical areas such as the Caribbean region are broadly divided into dry and rainy seasons with often profound effects on hydrological and ecological conditions. How this hydrological seasonality is archived by ostracode stable isotopes (δ18O, δ13C) is largely still unclear. The present study uses variations in lake water isotopes (δ18O, δ2H) and δ13CDIC together with the hydrochemical composition (major and trace elements) of the hyperhaline Lago Enriquillo. Water samples and living ostracodes were taken during March and September (i.e. dry and rainy season) in 2022. The C and O isotopic composition of single ostracode valves of different ostracode species (Cyprideis similis, C. edentata, Perissocytheridea cribrosa, Thalassocypria cf. sarbui) were analysed. These species provide differences in their temporal-spatial distribution but are generally restricted to the upper 8 m water depth of the lake. Both types of life cycles (permanent and seasonally restricted) are shown by the ostracodes species.

Questions that are addressed in this study include: Does the water isotopic composition reflect significant differences between the dry and the rainy season? What are the sources and sinks of water for the lake? Do ostracode δ18O and δ13C values reflect the composition of water and dissolved DIC in the lake? How does ostracode ecology (i.e. habitat preferences, life cycle) affects their isotope signatures?

Our results show a low intra-annual variation in δ18O and pronounced local variability of δ13CDIC values of the lake water. Ostracode δ18O and δ13C signatures reflect the lake water composition. The individual species display differences in their isotopic composition and variation ranges. δ18O results agree with the low intra-annual variation of the lake water and display a pronounced gradient with increasing values towards areas with reduced influence of inflows. δ13C values of ostracodes, on the other hand, show strong local differences between and even heterogeneity within samples sites.

Results imply that the lake water was buffered against seasonal hydrological variations during the sampling period, but reveals large spatial variations associated with e.g. strong contrast between inflows and the lake reservoir. The deduction of paleoenvironmental conditions of Lago Enriquillo based on stable isotopes of fossil ostracodes requires therefore consideration of multiple species. The ostracode proxy information then may help to deduce past changes in the lake water cycle.

How to cite: Wrozyna, C., Berndt, C., Reuter, M., Böttcher, M. E., Schröder, B., Garcia Cocco, E., and Haberzettl, T.: Seasonal dynamics of modern ostracod stable isotope (δ18O, δ13C) compositions in a large tropical lake (Lago Enriquillo, Dominican Republic) , EGU General Assembly 2025, Vienna, Austria, 27 Apr–2 May 2025, EGU25-6283, https://doi.org/10.5194/egusphere-egu25-6283, 2025.

A quantitative understanding of 18O fractionation mechanisms in plants is highly desirable for effective utilization of the δ18O signatures of plant cellulose (δ18Ocel) in diverse climatic and ecological applications. According to the isotope theory, biochemical fractionation associated with oxygen isotopic exchange represents a critical control of δ18Ocel. Biochemical fractionation operates in both autotrophic (i.e., leaf) and heterotrophic (i.e., stem/trunk) organs, with the current δ18Ocel model assuming that its effect amounts to c. 27‰ in both types of organs. However, with respect to the autotrophic fractionation factor (εbio_A), calculations of the deviations of the δ18O enrichment of sucrose (Δ18Ols) from that of water (Δ18Olw) in a bulk leaf, -- as performed in many previous studies, -- have led to a wide range of εbio_A estimates (i.e., from 22.4 to 34‰) across different species. Such a bulk-leaf based estimation method, however, does not provide a precise quantification of εbio_A. This is because the oxygen exchange-determined intrinsic relationship between Δ18Ols and Δ18Olw, namely Δ18Ols = Δ18Olw + εbio_A, is not expected to hold at the bulk leaf level owing to complications arising from within-leaf heterogeneity that is commonly present in Δ18Olw and sucrose synthesis rate (rsuc).

Here, based on explicit consideration of potential within-leaf heterogeneity in rsuc, as well as of spatial variation characteristics of Δ18Olw as informed by the Farquhar-Gan model, we suggest that the isotopic relationship between bulk Δ18Ols and Δ18Olw should instead be expressed as the following: Δ18Ols = β*Δ18Olw + εbio_A, with β being a composite variable highly relevant to spatial variation of rsuc across the leaf. Further analysis demonstrates that β can be markedly larger or smaller than unity depending on whether rsuc progressively increases or decreases along the leaf length. With the derivation of this new equation delineating bulk leaf isotopic relationships, we propose a regression approach via which εbio_A can be robustly quantified as the intercept of a linear relationship between Δ18Ols and Δ18Olw. We subsequently applied such a regression method under highly controlled experimental settings to determine εbio_A in diverse plant species under different growth temperatures. The application of this new method allowed us to successfully constrain the estimate of εbio_A at 25°C to a narrow range of 26.4‰ ± 1.5 per mil across a range of plant species, closely aligning with the traditionally assumed value of 27‰. Additionally, a significantly inverse relationship of εbio_A with temperature was revealed from our experiment. Further comparisons will be made between our revealed temperature dependence of εbio_A with that of the heterotrophic factor εbio_H as reported in Sternberg and Ellsworth (2011). Our study represents a step forward in constraining isotope parameters in the δ18Ocel model, which has important implications for isotope-based paleoclimatic reconstruction and ecophysiological applications.

How to cite: Wen, W., Tang, X., and Song, X.: Towards a refined method for estimating 18O autotrophic fractionation during sucrose synthesis in a bulk leaf, EGU General Assembly 2025, Vienna, Austria, 27 Apr–2 May 2025, EGU25-7605, https://doi.org/10.5194/egusphere-egu25-7605, 2025.

EGU25-8622 | Orals | BG2.1

Carbon and Nitrogen stable isotopes comparison in urban ecosystems along a Mediterranean latitudinal transect 

Irene Tunno, Andrea Scartazza, Marco Micali, Carlo Calfapietra, Gabriele Guidolotti, and Dario Papale

In the last few decades, the Mediterranean area has been extensively impacted by prolonged and intense droughts and heat waves. These events, combined with heavily landscape management, ongoing for thousands of years in the region, have been affecting the ecosystems’ resources such as water availability and nutrient cycles. Mediterranean vegetation responds differently to natural and human-induced changes and within the same species, different compartments (e.g. leaves, branches and roots) may exhibit diverse responses to these stressors, providing valuable bioindicators. Stable isotopes, particularly carbon (C) and nitrogen (N), have become widely used as effective tools to study plant responses to environmental gradients such as plant water-use efficiency, nitrogen-use strategies and ecosystem functioning.

Within ITINERIS (Italian integrated environmental research infrastructures system) project, we present preliminary findings comparing d13C and d15N values in soil and vegetation samples from coastal urban and peri-urban parks along a latitudinal gradient in Italy. To evaluate the relationships between isotopic signatures and environmental changes, soil and vegetation samples were collected in three ICOS (Integrated Carbon Observation System) stations located along the coastal latitudinal transect (Pisa, Rome and Naples). Holm oak (Quercus ilex) was selected as a potential bioindicator of environmental changes and anthropogenic disturbances due to its abundant presence at all three sites. Soil and plant compartments (e.g., leaves of different ages, branches, pollen, fine roots) were collected and analysed at the start and end of the growing season to investigate the response of Mediterranean species down to organ level to a thermo-pluviometric gradient.

The main findings of this study have highlighted differences in C and N concentrations and isotope compositions across the latitudinal gradient and seasons. Capodimonte (Naples), the most southern site, reveals an enrichment in d13C and d15N in leaves compatible not only with a response to hot and dry climate, but also to a much higher degree of anthropization. Castel Porziano (Rome) exhibits a similar trend but lower d15N and N concentration. San Rossore (Pisa), the northernmost site is subject to less water stress during summer season, resulting in more diluted d13C and d15N values. The leaves in the fall showed higher d13C and N concentration compared to spring. Branches were about 1 ‰ enriched in 13C compared to leaves due to post-photosynthetic isotope fractionations. Further analyses are underway on other plant compounds, including pollen, to identify the most suitable bioindicators of Mediterranean species’ response to climate change and human impact, with potential applications in the region’s management and conservation strategies.

How to cite: Tunno, I., Scartazza, A., Micali, M., Calfapietra, C., Guidolotti, G., and Papale, D.: Carbon and Nitrogen stable isotopes comparison in urban ecosystems along a Mediterranean latitudinal transect, EGU General Assembly 2025, Vienna, Austria, 27 Apr–2 May 2025, EGU25-8622, https://doi.org/10.5194/egusphere-egu25-8622, 2025.

EGU25-9771 | Posters on site | BG2.1

Intra-annual tree-ring cellulose δ2H as an indicator of drought 

Charlotte Angove, Marco Lehmann, Matthias Saurer, Yu Tang, Elina Sahlstedt, Giles Young, Kerstin Treydte, Paul Szejner, Kersti Leppä, Pauliina Schiestl-Aalto, Guido Wiesenberg, and Katja Rinne-Garmston

Temporal variability of tree-ring cellulose δ2H (δ2Hring-cel) can be a unique tool for understanding tree physiology and climate. However, we do not fully understand the drivers of temporal variability in δ2Hring-cel. Investigating seasonal δ2Hring-cel in boreal forests is particularly challenging. Previous studies on intra-annual tree-ring δ18Ohave shown that tree-ring isotope variability can result from the combined but opposing effects of source water and leaf assimilates, a dynamic likely relevant for δ2Hring-cel as well. To be able to use δ2Hring-cel as a standalone and reliable bioindicator, it is important to understand the variable hydrogen isotope fractionation between source water and tree rings. Our study aimed to provide context to this variability in a natural forest by being the first study to trace intra-annual δ2Hring-cel to the δ2H of its sources and drought indices.

The δ2H of source water, leaf water and carbohydrate pools (i.e. water-soluble carbohydrates, starch) were analysed from five pine (Pinus sylvestris) trees during 2019 at Hyytiälä forest, Finland. Their δ2H were used to model continuous δ2H of source water (δ2Hsource) and leaf sugars (δ2Hleaf-sug). Modelled and measured δ2Hleaf-sug matched moderately for 2019, and the model was applied to predict δ2Hleaf-sug during 2018. Intra-annual δ2Hring-cel were analysed in these two years at a resolution of 5-10 timepoints per year, and they were allocated to xylogenetic timepoints. They were then compared to time-integrated δ2Hsource, δ2Hleaf-sug, net assimilation rate, evapotranspiration and drought indicators.

Carbohydrate δ2H was significantly different among leaves, branches and stems. δ2Hring-cel had strong time-integrated relationships to modelled δ2Hsource, net leaf assimilation rate and evapotranspiration, but the direction of their relationships was different between years. At monthly resolution, water-soluble carbohydrate δ2H measured from one year-old needles had a strong, positive relationship to δ2Hring-cel. Similarly, the modelled δ2Hleaf-sug, had strong positive relationships to δ2Hring-cel, which were robust between years. δ2Hring-cel also had strong relationships to Standardized Soil Moisture Index (SSMI). 

We show that the role of δ2Hleaf-sug superseded the role of δ2Hsource in intra-annual δ2Hring-cel, because δ2Hleaf-sug had a consistent relationship to intra-annual δ2Hring-cel in both years while δ2Hsource did not. This clearly supports the growing body of evidence that δ2Hring-cel is strongly mediated by physiological processes. Our results show promise for δ2Hring-cel functioning as a bioindicator of soil drought related physiological stress signals in long-term tree ring chronologies. 

How to cite: Angove, C., Lehmann, M., Saurer, M., Tang, Y., Sahlstedt, E., Young, G., Treydte, K., Szejner, P., Leppä, K., Schiestl-Aalto, P., Wiesenberg, G., and Rinne-Garmston, K.: Intra-annual tree-ring cellulose δ2H as an indicator of drought, EGU General Assembly 2025, Vienna, Austria, 27 Apr–2 May 2025, EGU25-9771, https://doi.org/10.5194/egusphere-egu25-9771, 2025.

EGU25-9857 | ECS | Orals | BG2.1

Seasonal Dynamics of Dissolved Oxygen in the Danube River: The Role of Primary Producers and Slope 

Jan Maier, Anna-Neva Visser, Christina M. Schubert, Simon T. Wander, and Johannes A. C. Barth

Dissolved oxygen (DO) is one of the most fundamental health indicators of aqueous ecosystems. Beyond climate change and habitat modifications, excessive nutrient and pollutant inputs can significantly degrade this critical water quality parameter. Eutrophication, for instance, can drive harmful algal blooms, oxygen depletion and biodiversity loss.

In our study, we present seasonal data on DO concentrations and its oxygen stable isotope ratios (δ¹⁸ODO*) from five campaigns along the Danube River in 2023 and 2024, complemented by particulate organic carbon (POC) data as a biomass indicator. Our results highlight dynamic seasonal patterns. Photosynthesis dominated in spring and summer, while respiration and atmospheric equilibration prevailed in fall and winter. Notable hotspots were identified in the middle and lower Danube, with DO peaks of 0.35 mmol/L and 0.40 mmol/L, accompanied by δ¹⁸ODO* enrichments of +9.8 ‰* and +12.5 ‰* and POC concentrations of 0.25 mmol/L and 0.24 mmol/L. These regions, characterized by reduced river gradient und resulting lower flow velocities and turbulence, suggest enhanced primary producer activity. Notably, nutrient levels remained low, with nitrate under 0.29 mmol/L and phosphate largely undetectable, indicating minimal anthropogenic influence—likely due to environmental improvements and reduced industrial impacts in the catchment. All DO levels were within safe ecological ranges (> 0.06 mmol/L), ruling out hypoxia or harmful algal blooms.

How to cite: Maier, J., Visser, A.-N., Schubert, C. M., Wander, S. T., and Barth, J. A. C.: Seasonal Dynamics of Dissolved Oxygen in the Danube River: The Role of Primary Producers and Slope, EGU General Assembly 2025, Vienna, Austria, 27 Apr–2 May 2025, EGU25-9857, https://doi.org/10.5194/egusphere-egu25-9857, 2025.

EGU25-10355 | ECS | Orals | BG2.1

Opposing seasonal trends in source water and sugar dampen intra-annual variability in tree rings oxygen isotopes 

Paul Szejner, Yu Tang, Charlotte Angove, Pauliina Schiestl-Aalto, Elina Sahlstedt, Giles Young, Nelson Daniel B, Kahmen Ansgar, Matthias Saurer, and Katja T. Rinne-Garmston

Intra-annual variations of oxygen isotope composition (δ18O) in tree rings offer insights into tree ecophysiology and how trees respond to climate. In this study, we focused on the interplay between the δ¹⁸O from source-water, leaf-water and photosynthates to understand how seasonal trends are integrated in tree rings. We conducted a seasonal analysis of Pinus sylvestris in Finland. Our findings reveal a significant reduction in the seasonal variability and trends of δ18O from needle-water to tree rings. This dampening effect on the seasonal trends is due to the opposing seasonal patterns: source-water δ¹⁸O increases from early spring to late summer, while the evaporative enrichment of ¹⁸O recorded in the δ¹⁸O of photosynthates at the leaf level decreases over the same period. Additionally, oxygen isotope exchange between source water and phloem sugars during wood formation  contributes to the dampening of the evaporative δ¹⁸O signals in tree rings. These findings enhance our understanding of how δ¹⁸O integrates into tree rings, particularly the seasonal signals preserved along the tree growing season. This study offers new perspectives on how intra-annual δ¹⁸O proxies capture seasonal environmental variations over time, which is crucial for refining climate reconstructions and improving our knowledge of tree physiological responses to climate.

How to cite: Szejner, P., Tang, Y., Angove, C., Schiestl-Aalto, P., Sahlstedt, E., Young, G., Daniel B, N., Ansgar, K., Saurer, M., and Rinne-Garmston, K. T.: Opposing seasonal trends in source water and sugar dampen intra-annual variability in tree rings oxygen isotopes, EGU General Assembly 2025, Vienna, Austria, 27 Apr–2 May 2025, EGU25-10355, https://doi.org/10.5194/egusphere-egu25-10355, 2025.

EGU25-10869 | Posters on site | BG2.1

Carbon stable isotope analysis in groundwater remediation – The role of microbial biofilm communities and biochar in PCE and NAP degradation 

Andrea Watzinger, Simon Leitner, Christine Stumpp, Gerhard Soja, and Katharina Keiblinger

Biochar as an alternative filter to activated charcoal was tested for the removal of tetrachloroethene (PCE) and Naphthalene (NAP) from contaminated groundwater by means of sorption and biodegradation in batch and column experiments. Microbial communities were extracted from the aqueous and solid phases and analysed using 16S rRNA gene amplicon sequencing. Microbial biomass and its carbon isotope composition were determined using microbial phospholipid fatty acids (13C-PLFA) analysis. This approach enabled a quantitative and functional observation of the microbial community besides identifying the relevant bacteria.

Molecular biological analyses of the PCE experiments confirmed that organo-halide respiration bacteria (OHRB) established after inoculation both in the batch and throughout the columns. PLFA analysis revealed that microorganisms and also those groups that can be assigned to the PCE-degrading organisms preferentially colonize biochar, while activated charcoal is avoided possibly due to the higher PCE sorption capacity of the activated charcoal and hence lower bioavailability of PCE. The carbon isotope value of the microorganisms (13C PLFA) indicates the use of biochar as a carbon source and/or the presence of strongly isotope-fractionating biochemical processes such as methanogenesis / methane oxidation. The microbial communities were influenced by the factor char and its physical/chemical properties. It is therefore advisable to choose the filter material not only on the basis of the sorption capacity, but above all on the synergy effects that leads to a permanently active microbial community and an extension of the filter life due to the continuous and complete degradation.

The living microbial biomass in the aerobic naphthalene columns was a factor of 4 higher than in the anaerobic PCE columns. The distribution of microorganisms was similar to that in the PCE degradation experiments; i.e. greater colonization of the biochar filters compared to the activated charcoal filters. Furthermore, the microorganisms responded to naphthalene supply with increased microbial biomass and naphthalene incorporation. Once the naphthalene addition was stopped, the microorganisms were able to convert sorbed naphthalene (in the presence of ethanol). This ability is a strong indicator of the sustainability and self-cleaning potential of the colonized biochars. However, high levels of colonization and biofilm development may increase the risk of clogging negatively impacting filter system sustainability. The insights gained from this study are crucial for advancing global efforts in groundwater remediation and sustainable environmental management.

How to cite: Watzinger, A., Leitner, S., Stumpp, C., Soja, G., and Keiblinger, K.: Carbon stable isotope analysis in groundwater remediation – The role of microbial biofilm communities and biochar in PCE and NAP degradation, EGU General Assembly 2025, Vienna, Austria, 27 Apr–2 May 2025, EGU25-10869, https://doi.org/10.5194/egusphere-egu25-10869, 2025.

EGU25-11009 | Posters on site | BG2.1

Analysis of dissolved nitrate stable isotopes using the one-step Ti (III) reduction method and Elementar EnvirovisION System  

Sam Barker, Calum Preece, Rob Berstan, and Mike Seed

Identifying and quantifying sources and cycling of nitrogen is important for understanding not only aquatic ecosystems but also planning water resource management, mitigating urban and agricultural pollution, and optimizing government policy. Stable isotopes of dissolved nitrate and nitrite (δ15N, δ18O and δ17O) have been useful in distinguishing between the diverse nitrogen sources and sinks and help understand large scale global ocean processes as well as revealing major changes in agricultural land use and urbanization. 

Despite the strength of dissolved nitrate and nitrite stable isotope analysis, the strong barrier for uptake using the favored contemporary methods (bacterial denitrifier and Cd-azide reaction) due to the laborious multi-step methods, maintenance of anerobic bacterial cultures and use of highly toxic chemicals has limited the analysis to highly specialized laboratories. We evaluate the performance of the Elementar EnvirovisION using the new Titanium (III) reduction method (Altabet et al., 2019) for one step conversion of nitrate into N2O for IRMS analysis.   

The EnvirovisION has been developed for high performance analysis of CO2, N2O and CH4 and dissolved nitrate. The system has the capacity to be rapidly customized for specific needs with options for dual GC columns supporting the Weigand ‘heart-cut’ N2O method (Weigand et al., 2016) and sequential N2 and N2O analysis from a single atmospheric sample. 

How to cite: Barker, S., Preece, C., Berstan, R., and Seed, M.: Analysis of dissolved nitrate stable isotopes using the one-step Ti (III) reduction method and Elementar EnvirovisION System , EGU General Assembly 2025, Vienna, Austria, 27 Apr–2 May 2025, EGU25-11009, https://doi.org/10.5194/egusphere-egu25-11009, 2025.

EGU25-12689 | Posters on site | BG2.1

Thermodynamic stability and reactivity of dolomite-analogues from the norsethite-family: Carbon isotope and metal release during experimental dissolution at 25°C and 1 atm total pressure 

Michael Ernst Böttcher, Anja S. Haršányi, Olaf Dellwig, Georg Grathoff, Iris Schmiedinger, and Wen Liang

Double carbonates of the norsethite-family (Ba(Mg,Mn,Fe)[CO3]2) are used as crystal chemical and geochemical analogues for the prominent rock-forming mineral dolomite (CaMg[CO3]2) and the less common kutnahorite (CaMn[CO3]2). Selected family members have been observed to occur in low- and high-temperature natural systems, like Baltic Sea sediments or different types of ore deposits. For most of the norsethite-members, neither the thermodynamic nor the reaction kinetic properties are well constrained or even known, so far.

In the present study, the dissolution behaviour of double and triple carbonate members of the norsethite family were dissolved in CO2-saturated solutions at 25°C and 1 atm total pressure. The carbonates were synthesized at high P and T and characterized as described by Liang et al. (2021, 2025) and Böttcher et al. (2022). Free-drift batch-type reactors were used. Both, the congruent and incongruent parts of the dissolution process were investigated and the partitioning of metals and stable carbon isotopes was followed. At the end of the experiment, carbonate solid-solutions were precipitated by letting CO2 to degas.

The dissolution in aqueous solutions was found to be initially congruent with respect to metal stoichiometry. The solution composition was interpreted using PHREEQC. Extrapolation of experimental congruent reaction parts give the solubility product and the free energy of formation of the respective carbonate and the time-dependent reaction path allows for the extraction of dissolution kinetic parameters. The development of 13C contents of dissolved inorganic carbon represent an experimental verification of carbonate dissolution in a system open with respect to a CO2 gas phase (sensu Garrels & Christ, 1965 and Deines et al., 1974).

These new experimental results form a base to include these phases into modelling codes for natural or underground CO2-storage systems.

How to cite: Böttcher, M. E., Haršányi, A. S., Dellwig, O., Grathoff, G., Schmiedinger, I., and Liang, W.: Thermodynamic stability and reactivity of dolomite-analogues from the norsethite-family: Carbon isotope and metal release during experimental dissolution at 25°C and 1 atm total pressure, EGU General Assembly 2025, Vienna, Austria, 27 Apr–2 May 2025, EGU25-12689, https://doi.org/10.5194/egusphere-egu25-12689, 2025.

EGU25-12734 | Posters on site | BG2.1

Tree-ring isotope-based 20th century reconstructions of the seasonal origin of water sourced by trees: Advances and limitations 

Meisha Holloway-Phillips, Haoyu Diao, Fabian Bernhard, Anna Wieland, Marius Floriancic, Peter Waldner, Kerstin Treydte, Matthias Saurer, Georg von Arx, Arthur Gessler, Katrin Meusburger, and Marco Lehmann

The hydrogen (δ²H) and oxygen (δ¹⁸O) isotopic signatures of tree rings depend on that of the environmental water sources, such as precipitation and soil water, taken up by trees (i.e., "source water"). Analyzing δ²H and δ¹⁸O of tree rings is thus a promising approach for reconstructing the spatio-temporal origins of tree water sources. However, such reconstructions remain rare, likely due to methodological challenges, including the analysis of hydrogen isotopes in tree rings and the availability of historical source water isotope data.

In this study, we present a first attempt to reconstruct the temporal origins of water used by trees during the 20th century (1901–1995) with annually resolved tree-ring δ¹⁸O time series. The reconstruction is based on a δ¹⁸O chronology of whole wood, sampled from the latewood of spruce (Picea abies) at Bettlachstock, Switzerland. Our choice of site and species reflects a conservative approach, as a transfer function linking δ¹⁸O of tree-ring cellulose to the δ¹⁸O of source waters (e.g., stem xylem water and soil solutions) was recently established over a 17-year period (20062022) at the same site. After accounting for the isotopic offset between whole wood and cellulose, we estimated δ¹⁸O values of soil solution (80 cm depth) and stem xylem water during the growing season (MaySeptember) using a linear transfer function. Further, using modeled precipitation δ¹⁸O data and the estimated δ¹⁸O of soil solution and xylem water, we deduced interannual variations in the seasonal origin index (SOI) of soil solution and xylem water during the 20th century.

Our results show that the reconstructed δ¹⁸O values and SOI of xylem water were higher than those of soil solutions, suggesting a greater contribution of summer water to xylem water than to soil solutions. Interestingly, while conditions from 1900 to 1970 remained relatively stable, we observed abrupt increases in SOI for both soil solutions and stem xylem water between 1970 and 1995. These recent changes were not due to an increase in summer precipitation amount but may be linked to shifts in seasonal precipitation patterns, causing a relative increase in the contribution of summer precipitation in tree water sources.

Despite these findings, uncertainties in precipitation isotope data and transfer functions need further investigation to draw more definitive conclusions. We hope this study will stimulate discussion on the advances and limitations of using tree-ring isotopes to reconstruct historical water sources.

How to cite: Holloway-Phillips, M., Diao, H., Bernhard, F., Wieland, A., Floriancic, M., Waldner, P., Treydte, K., Saurer, M., von Arx, G., Gessler, A., Meusburger, K., and Lehmann, M.: Tree-ring isotope-based 20th century reconstructions of the seasonal origin of water sourced by trees: Advances and limitations, EGU General Assembly 2025, Vienna, Austria, 27 Apr–2 May 2025, EGU25-12734, https://doi.org/10.5194/egusphere-egu25-12734, 2025.

EGU25-13667 | Posters on site | BG2.1

Methodological Recommendations for Water Isotope Measurements Using CRDS: Balancing Throughput and Precision 

Magdalena Hofmann, Jan Woźniak, and Keren Drori

Cavity Ring-Down Spectroscopy (CRDS) has emerged as a critical tool for measuring water isotopes in climate, environmental, and hydrological research. Key features of CRDS analyzers, such as the L2130-i and L2140-i, include high precision, minimal drift, and field deployability. However, the precision and accuracy requirements of water isotope measurements vary by application. For example, paleoclimate studies demand the highest precision (on par with IRMS), while other applications prioritize rapid analysis of large sample sets over precision.

In this study, we present updated methodological recommendations for water isotope analysis using CRDS, tailored to different precision, accuracy, and throughput requirements. We evaluated a range of analytical and data processing methods using the WICO 2024 sample set. This set, provided by the IAEA, includes six water samples with δ¹⁸O values ranging from -22‰ to +1‰ and δ²H values spanning from -163‰ to +17‰. The samples were analyzed on a Picarro L2130-i instrument in both Standard and Express mode [1]. Data were processed using the analyzer's built-in ChemCorrect software and the open-source FLIIMP software [2], which enables advanced data correction techniques such as drift and memory correction.

Our findings highlight the trade-offs between precision and throughput for different use cases and underscore the importance of selecting appropriate analysis and processing methods based on specific research needs.

References

[1] Galili, N. et al. (2025). Cavity Ring-Down Spectroscopy Performance and Procedures for High-Throughput δ¹⁸O and δ²H Measurement in Water Using “Express” Mode. Applied Spectroscopy.

[2] Sodemann, H. et al. (2023). FLIIMP - a community software for the processing, calibration, and reporting of liquid water isotope measurements on cavity ring-down spectrometers. MethodsX, 11, 102297.

How to cite: Hofmann, M., Woźniak, J., and Drori, K.: Methodological Recommendations for Water Isotope Measurements Using CRDS: Balancing Throughput and Precision, EGU General Assembly 2025, Vienna, Austria, 27 Apr–2 May 2025, EGU25-13667, https://doi.org/10.5194/egusphere-egu25-13667, 2025.

Previous nitrogen isotope studies of bulk proteins extracted from ancient Atlantic cod (Gadus morhua) tissues document a 1-2‰ decrease in δ15N values over the last couple of centuries (Harris, 2011; Lueders-Dumont et al., 2018). Due to the nature of the nitrogen isotope signal in bulk proteins, this isotopic shift may be attributed to a decrease in trophic level and/or a change in baseline nitrogen in the Gulf of Maine over this time period. Here, we analyze the  δ15N composition of individual amino acids from ancient cod bone collagen to tease out the relative importance of shifts in trophic level vs baseline nitrogen sources to cod diets through time. Preliminary data indicate that  δ15N values of phenylalanine (“source” amino acid) extracted from cod bone collagen became more depleted in δ15N over the last 500 years and into the modern record. These shifts in δ15NPhe are in agreement with those found in δ15NPhe of deep-sea corals (Sherwood et al., 2011) and bivalves (Whitney et al., 2019) from the Gulf of Maine over the last 100 years. The fact that similar trends are seen in three different species occupying different ecological niches suggests the shift in source nitrogen may reflect broad changes in hydrographic conditions in the Gulf of Maine. More work is needed to corroborate these preliminary findings and is currently underway. 


How to cite: Turtle, S., Johnson, B., and Dostie, P.: δ15N of Amino Acids in Ancient Cod Bone Collagen Track Shifts in Baseline Nitrogen & Cod Trophic Levels in the Gulf of Maine for the Past 4,400 years, EGU General Assembly 2025, Vienna, Austria, 27 Apr–2 May 2025, EGU25-14238, https://doi.org/10.5194/egusphere-egu25-14238, 2025.

EGU25-14870 | Posters on site | BG2.1

Spatially resolved δ13C measurements of solid samples via Laser Ablation Cavity Ringdown Spectroscopy (LA CRDS) – a new tool for environmental research 

Ciprian Stremtan, Jan Wožniak, Montana Pușcaș, and Magdalena Hofmann

Cavity ringdown spectroscopy (CRDS) is a well-established technique used for measuring a large variety of gaseous species which are known to absorb light radiation at specific wavelengths, e.g., CO2, CH2, C2H4, water vapors, etc. In the field of environmental and geochemical research, CRDS is commonly used to determine the isotopic ratios of light isotope families, like hydrogen, carbon, oxygen, etc. Similarly, laser ablation (LA) is a solid sample introduction method which is used in conjunction with a variery of spectrometric and spectroscopic techniques and works by focusing a laser beam (of various wavelengths, pulse width and energy) onto the sample surface to convert minute amounts of the solid into fine aerosol, or gaseous phase.

Hyphenating the two techniques is a recent addition to the earth sciences tool set [1,2]. While still in its infancy, LA CRDS is a promising technique for fast, highly accurate and spatially resolved stable isotope measurements. In this contribution we look at the figures of merit of the technique when measuring δ13C, comparing different types of lasers (pulsed nanosecond solid state 213 nm wavelength, and continuously emitting infrared CO2 laser) on both organic (wood, cellulose, plastics, and plant derived material) as well as inorganic matrices (soils, CaCO3) which are critical proxies for environmental and climatic studies. We also investigate the impact of increased spatial resolution (i.e., tens of micron spot sizes) on the accuracy and precision of the analysis.


[1] Stremtan, C., Wozniak, J., Puscas, C. M., and Tamas, T.: Laser Ablation – Cavity Ring Down Spectrometry, a new method for the in-situ analysis of δ13C of organic and inorganic carbonates, EGU General Assembly 2024, Vienna, Austria, 14–19 Apr 2024, EGU24-17192, https://doi.org/10.5194/egusphere-egu24-17192, 2024.

[2] E. Malegiannaki, P. Bohleber, D. Zannoni, C. Stremtan, A. Petteni, B. Stenni, C. Barbante, B.M. Vinther, V. Gkinis, Towards high-resolution water isotope analysis in ice cores using laser ablation - cavity ring-down spectroscopy, Anal. (2024) 5843–5855. https://doi.org/10.1039/d4an01054j.

How to cite: Stremtan, C., Wožniak, J., Pușcaș, M., and Hofmann, M.: Spatially resolved δ13C measurements of solid samples via Laser Ablation Cavity Ringdown Spectroscopy (LA CRDS) – a new tool for environmental research, EGU General Assembly 2025, Vienna, Austria, 27 Apr–2 May 2025, EGU25-14870, https://doi.org/10.5194/egusphere-egu25-14870, 2025.

EGU25-15848 | ECS | Posters on site | BG2.1

High-resolution insights into the seasonal physiological responses of Great Basin bristlecone pine (Pinus longaeva) through in-situ δ13C LA-IRMS 

Andrew Weitz, C. Montana Puscas, Ciprian C. Stremtan, Audrey Salerno, and Andy Bunn

Predicting the physiological responses of tree species under future hydroclimate scenarios is essential for understanding and mitigating the impacts of anthropogenic climate change. Here, we present our work on reconstructing the intraseasonal physiological responses of one of the longest living tree species on Earth – Great Basin bristlecone pine (Pinus longaeva, Pinaceae). This species is infamous for its tree ring chronologies that can extend beyond 5,000 years, yet the key physiological traits that will determine its ability to tolerate warmer, drier conditions in the future remain to be characterized. Moreover, the extent to which localized changes in topoclimate and seasonal water availability will impact overall growth performance and survival is also uncertain. To address this, we collected needle samples from trees along an elevation gradient near Great Basin National Park, NV, USA. Using the unique phyllotaxy of this species, we isolated annual needle samples corresponding to five distinct growth years (2018 – 2022). We then developed a novel method for quantifying intraseasonal variation in carbon isotope discrimination and intrinsic water use efficiency by using fine-scale, sequential measurements of needle δ13C in-situ via laser ablation isotope ratio mass spectrometry. We obtained an average of 25 individual δ13C measurements along the lengths of each needle sample, which were all consistent with whole-needle δ13C values measured via traditional elemental analyzer isotope ratio mass spectrometry. However, these sequential δ13C values varied in excess of 1 ‰ (VPDB) along the lengths of each needle sample, likely reflecting intraseasonal changes in water availability through the time in which individual needles were being constructed. Paired with our previous measurements of annual ring width, stomatal density, and needle length from trees at this site, we discuss how this new method provides a more comprehensive understanding of the role of intraseasonal variation in water availability on the overall physiological performance of this species in the past as well as under future hydroclimate scenarios.

How to cite: Weitz, A., Puscas, C. M., Stremtan, C. C., Salerno, A., and Bunn, A.: High-resolution insights into the seasonal physiological responses of Great Basin bristlecone pine (Pinus longaeva) through in-situ δ13C LA-IRMS, EGU General Assembly 2025, Vienna, Austria, 27 Apr–2 May 2025, EGU25-15848, https://doi.org/10.5194/egusphere-egu25-15848, 2025.

EGU25-18101 | Orals | BG2.1

A simple setup for online laser spectroscopy gas isotope analysers in online chamber systems 

Lukas Kohl, Markku Koskinen, Tatu Polvinen, Yann Salmon, Christina Biasi, Mari Pihlatie, Annamari Laurén, Xin Zhuang, Teemu Paljakka, and Matej Znamínko

Laser spectroscopy-based gas isotope analysers (LSIA) are cheaper in acquisition and maintenance but still lack the accuracy and precision available through isotope ratio mass spectrometry (IRMS). One of the applications where LSIA are particularly advantageous are online measurements that follow gas release over time. This is even more the case in labelling experiments, where requirements regarding isotope ratio precision are lower. Yet, experiments that implement such setups remain relatively rare.

Here, we present a simple, low-cost setup that conducts automated isotope ratio measurements in gases released from various materials. The setup consists of a LSIA instrument (Picarro G2201-i or G5131-i) which is connected to up to 16 measurement chambers using a VICI selector valve actuated by a Raspberry Pi which also records the measurement data and valve position. An auxiliary pump equipped with a needle valve is placed in parallel to the LSIA to regulate the total flow rate to 500 mL min-1. Each chamber is connected to the analyser for 10 minutes, before switching to the next chamber. We therefore allow the target gas (CO2, CH4, or N2O) to accumulate over 150 minutes between measurements in each chamber. During the measurement, chamber air is pulled to the analyser and replaced by ambient air. The analyte concentration therefore decreases during the measurement time, which allows us to calculate the source isotope value through the Keeling plot method. At the end of the measurement, the analyte concentration and isotope ratio is near ambient air, such that the chamber is reset for the next cycle.

We present and compare three different experiments that used this approach. First, we studied phloem transport rates in Beech trees. For this, we pulse-labelled branches with 13CO2 and followed the release of 13CO2 from stem respiration at different heights over time. Second, we studied the conversion of 13C-acetate label injected into intact peat cores into CO2 and CH4. We quantified the fractions of label recovered as CO2 and CH4 as well as the timing of label-derived gas emissions as a function of injection depths. Finally, we adjusted this setup for measurements of natural abundance isotope ratios in soil N2O emissions to study N2O source processes from permafrost soils. Our presentation will compare these implementations and report on the experience gained during their setup.


How to cite: Kohl, L., Koskinen, M., Polvinen, T., Salmon, Y., Biasi, C., Pihlatie, M., Laurén, A., Zhuang, X., Paljakka, T., and Znamínko, M.: A simple setup for online laser spectroscopy gas isotope analysers in online chamber systems, EGU General Assembly 2025, Vienna, Austria, 27 Apr–2 May 2025, EGU25-18101, https://doi.org/10.5194/egusphere-egu25-18101, 2025.

EGU25-18571 | ECS | Posters on site | BG2.1

Unravelling Hydrogen Isotope Fractionation in Marine Macroalgae: Insights from Macrocystis pyrifera 

Marc-Andre Cormier, Diana Steller, Mohammad Ali Salik, Marco Lehmann, Maya Al Sid Cheikh, and Patrick Gagnon

Marine ecosystems play a critical role in global photosynthetic carbon fixation, with approximately 5.36 Pg C exported annually via the biological pump. Macroalgae alone sequester around 200 million tons of CO₂ annually, though these estimations are largely based on indirect calculations. Hydrogen isotope (δ²H) analyses offer a promising avenue to refine such estimates while advancing our understanding of macroalgal carbon and energy metabolism.

Stable isotope studies have been instrumental in ecological and biogeochemical research, yet the application of δ²H analyses to marine algae remains limited. Most prior studies have focused on salinity-driven δ²H variations in algae, overlooking the potential of δ²H to reveal key biochemical processes. Recent findings suggest that δ²H values of organic molecules are significantly influenced by biosynthetic fractionation (²H-εbio), governed by the interplay between photosynthetic (²H-ελ) and post-photosynthetic (²H-εΗ) processes. This metabolic signal, previously observed in terrestrial plants, is strongly modulated by the photosynthetic carbohydrate supply rate, impacting δ²H variability in organic compounds.

The giant kelp Macrocystis pyrifera provides an ideal model system to investigate these processes in marine environments. Unlike terrestrial plants, M. pyrifera offers a simplified isotopic system due to: (i) access to water with stable δ²H values, (ii) exclusion of evaporative ²H-fractionation, and (iii) a primitive vascular system that minimizes isotopic exchange across its structure. These unique features allow us to isolate and examine the variability of ²H-ελ under different light conditions, shedding light on the metabolic processes underlying δ²H variability in marine photoautotrophs.

This study highlights the potential of δ²H analyses to bridge the gap between isotopic and biochemical research in marine systems. By focusing on M. pyrifera, we aim to provide critical insights into the drivers of δ²H variability and their broader implications for understanding marine carbon dynamics and the role of macroalgae in global biogeochemical cycles. This work lays the groundwork for advancing isotopic methodologies and applying them to ecological and palaeoenvironmental studies in marine ecosystems.

How to cite: Cormier, M.-A., Steller, D., Salik, M. A., Lehmann, M., Al Sid Cheikh, M., and Gagnon, P.: Unravelling Hydrogen Isotope Fractionation in Marine Macroalgae: Insights from Macrocystis pyrifera, EGU General Assembly 2025, Vienna, Austria, 27 Apr–2 May 2025, EGU25-18571, https://doi.org/10.5194/egusphere-egu25-18571, 2025.

EGU25-18733 | ECS | Posters on site | BG2.1

Combining carbon isotopes with tree ring analysis – insights into water use efficiency and drought stress  

Philipp Keutner, Mathias Neumann, and Eva-Verena Müller

The composition of heavy and light carbon isotopes in tree rings is influenced by the water supply during the time the tree ring was formed due to stomata opening and therefore the ability of the tree to favor lighter isotopes, since the absorbed carbon is used for tree ring formation. This allows calculating the Intrinsic Water Use Efficiency (iWUE) as an indicator for drought stress. With about 1400 samples (tree-rings) from 15 trees from Southwestern Germany, with three individual trees of European beech, Sessile oak, Norway spruce, Scots pine and Douglas Fir respectively, we created cross-dated time series Delta13C isotope ratio and annual growth (using ring width). Our sites included both good and bad site conditions. We linked our data with climate time series for the study area as independent variables. The variety of variables allowed us to determine, to what extent independent factors influence growth and iWUE as well as interactions between the individual factors and their cumulative effects. Statistical methods and time series analyses were used to quantify the complex relationships between water availability, competitive pressure, climatic conditions, and tree growth. This approach combines various fields of terrestrial ecosystem research on individual plant level.

First results show diverse reactions to drought depending on species and location. We found growth and iWUE to be highly dependent on the climate for all species, whereas correlations between these variables imply a tree´s strategy to cope with drought conditions. The correlations differ between individual trees of the same species meaning that location may play a greater role in its significance than previously assumed, conditional on the species. Further investigations could support hydrologically focused forest management with respect to understanding the impacts of climate change on forest ecosystems.

Therefore, an upscaling approach would allow for the depiction of iWUE on catchment level. By reconstructing past environmental conditions based on tree rings, valuable information can be obtained, contributing to the development of strategies for adapting forest stands to future climate conditions. For a deeper understanding and practical conclusions, the neighborhood relationships and competition should be quantified over the entire lifetime of an analyzed tree, since not all irregularities in isotope composition were captured.

How to cite: Keutner, P., Neumann, M., and Müller, E.-V.: Combining carbon isotopes with tree ring analysis – insights into water use efficiency and drought stress , EGU General Assembly 2025, Vienna, Austria, 27 Apr–2 May 2025, EGU25-18733, https://doi.org/10.5194/egusphere-egu25-18733, 2025.

EGU25-18841 | Orals | BG2.1 | Highlight

Sources and sinks of water and elements in the high-CO2 volcanic Laacher See, Germany 

Patricia Roeser, Anna Jentsch, Stijn Albers, Nils Knornschild, Georg Heumann, Marc de Batist, Maren Brehme, Christian März, and Michael Böttcher

The Laacher See (Lake Laach), the largest volcanic lake in Germany, resulted from a massive phreatomagmatic eruption in the Eifel Region ~13,000 years ago. The enclosed lake within a small catchment is still affected by the underlying volcanic activity, providing a unique natural laboratory for investigating the sources and sinks of high dissolved carbon concentrations and associated element cycles in natural chemical gradients. The lake is continuously affected by magmatic CO2 degassing. A large number of moffettes are distributed not only along the lake shore but also at different depths of the lake, whereby gas seeps can still be found at the deepest point of the lake at 51 m. Here, seasonal investigations of the water column and porewaters from several sediment short cores and a 6 m long core at a reference site show for the first time that the sediment package is an active and special biogeochemical reactor outlining a unique type of diagenesis under the boundary conditions of high dissolved inorganic carbon. With the help of an underwater drone equipped with a temperature & depth sensor, the water column was accurately sampled at regular depth intervals. Additionally, the fingerprinting of surrounding groundwaters as potential water and elemental sources, allows for a first assessment of the cycling of dissolved carbon, water, major and trace elements. Stable H and O isotope signatures provide insight into the water sources and the seasonal water balance of the lake. The C isotopic composition of dissolved inorganic carbon (DIC) indicates its sources and fate, and explains signatures reported for authigenic sedimentary carbonates, e.g. siderite. Sulfate is consumed by microbial sulfate reduction in the upper few centimeters of the sediments, and the SO4 isotopic signature from the lake water is close to that of the moffette solution indicating similar influence of these benthic processes. The examination of porewaters from a ca. 7-meter-wide pockmark provides evidence of enhanced diagenesis under high DIC fluxes potentially affecting metal accumulation and liberation from sediments.

How to cite: Roeser, P., Jentsch, A., Albers, S., Knornschild, N., Heumann, G., de Batist, M., Brehme, M., März, C., and Böttcher, M.: Sources and sinks of water and elements in the high-CO2 volcanic Laacher See, Germany, EGU General Assembly 2025, Vienna, Austria, 27 Apr–2 May 2025, EGU25-18841, https://doi.org/10.5194/egusphere-egu25-18841, 2025.

EGU25-19505 | Orals | BG2.1

Plants in changing climate: Linking isotope effects, manipulation experiments, plant archives and modelling to derive long-term ecophysiogical signals 

Jürgen Schleucher, Lenny Haddad, xiaohan Yin, Pieter Zuidema, Sophie Zwartsenberg, Mats Öquist, John Marshall, and Benjamin Smith

Conventional isotope applications in plant ecophysiology measure isotope ratios (e.g. δ2H, δ13C) of whole molecules. However, it is well established that isotope abundance varies AMONG the CH groups of metabolites (isotopomers), because they are biochemically distinct. This variation reflects enzyme isotope fractionations and encodes metabolic information, but it is unclear how these fractionations get transferred into signals that can be recovered from archives of plant material.

Here, we will describe physical and biochemical mechanisms of hydrogen isotope fractionation in plants and compare their magnitudes. Based on observations for hydrogen isotope transfer in plants, we present a model for the extraction of H isotope signals from plant archives.

Plant responses to increasing CO2 are critical for plant productivity and as climate feedbacks. As CO2 is the substrate for photosynthesis, plants should benefit from increasing CO2, but the magnitude of this “CO2 fertilization” disagrees with biomass estimates. Photorespiration is a side reaction of photosynthesis that reduces C assimilation in most vegetation, therefore its response under climate change is critical for the future C cycle. Photorespiration should be reduced by increasing CO2 yet exacerbated by rising T, but its response is not well captured in models, adding large uncertainty to C cycle predictions.

To retrieve ecophysiological signals from plant archives, we use manipulation experiments to develop proxies for plant C fluxes, based on intramolecular abundance variation of 2H and 13C, detected by NMR. We then retrieve these proxies from archives such as tree-ring series, to derive metabolic responses over long time scales, and to improve global vegetation models.

Here we will describe progress in tracking isotopomer signals from controlled experiments to plant archives, and results on long-term trends of photorespiration in response to increasing atmospheric CO2 for two globally important ecosystems. In Sphagnum species, we link trends in photorespiration to the C sink of boreal peatlands. In the tropical tree species Toona ciliata, we describe long-term trends in photosynthetic efficiency.

As intrinsic quantities, isotope data are well suited to report on metabolic shifts, but not about fluxes in absolute numbers. Therefore we use isotopomer data as input for the LPJ-GUESS Ecosystem Model, to translate isotopomer-derived changes in photorespiration into trends in ecosystem C fluxes.

References:

Augusti A. et al (2008) Chem. Geol. 252, 1-8, doi 10.1016/j.chemgeo.2008.01.011

Ehlers I. et al (2015) PNAS 112, 15585-15590 doi 10.1073/pnas.1504493112

Walker AP. et al (2021) New Phytol 229, 2413-2445 doi 10.1111/nph.16866

Serk H. et al (2021) Scientific Reports 11, 24517 doi 10.1038/s41598-021-02953-1

Zwartsenberg SA. et al (2025) New Phytol in press.

How to cite: Schleucher, J., Haddad, L., Yin, X., Zuidema, P., Zwartsenberg, S., Öquist, M., Marshall, J., and Smith, B.: Plants in changing climate: Linking isotope effects, manipulation experiments, plant archives and modelling to derive long-term ecophysiogical signals, EGU General Assembly 2025, Vienna, Austria, 27 Apr–2 May 2025, EGU25-19505, https://doi.org/10.5194/egusphere-egu25-19505, 2025.

EGU25-19649 | Posters on site | BG2.1

Reconstructing changes in nitrogen input to the Danube-influenced Black Sea Shelf during the Holocene 

Andreas Neumann, Kirstin Dähnke, and Tina Sanders

The western Black Sea Shelf where the Danube is discharging into the Black Sea is especially sensitive to river-induced eutrophication, which peaked in the 1980s and 1990s due to human-induced nutrient input and is decreasing since the mid-1990s due to ongoing mitigation measures. The scarcity of information on Danube nutrient loads prior to the 1960s complicates the assessment of earlier nutrient input and thus to define pristine conditions to provide a reference for nutrient reduction goals. In this study, we aimed to trace modern and historical nitrogen sources to the western Black Sea Shelf during the last ~5,000 years with special focus on the past 100 years, using sedimentary records of TOC, TIC, nitrogen, and δ15N.

Our results demonstrate that the balance of riverine nitrogen discharge into the Black Sea on the one hand, and nitrogen fixation in the pelagic on the other hand is generally determined by climate effects. Specifically, this balance of riverine N input and N fixation is not only controlled by the amount of nutrients discharged by rivers, but also by the freshwater itself, which controls the intensity of thermohaline stratification and thereby the intensity of nutrient recycling from the deep basin back into the euphotic epipelagic. Our results show a gradient from the nearshore sediment directly at the Danube Delta, where riverine N is dominant to offshore sediment in 80 m water depth, where pelagic N fixation was dominant in the past. Our results based on stable isotopes also demonstrate the increased deposition of nitrogen from human activities in all stations across the shelf and the concomitant changes in deposition rates of organic matter as indication for perturbations in the epipelagic community due to the human-induced eutrophication. Finally, our stable isotope data indicate that human-induced eutrophication can be traced back to the 12th century AD, which raises the question which point in time is a feasible reference for nutrient reduction goals as the Danube was not pristine since at least 800 years.

How to cite: Neumann, A., Dähnke, K., and Sanders, T.: Reconstructing changes in nitrogen input to the Danube-influenced Black Sea Shelf during the Holocene, EGU General Assembly 2025, Vienna, Austria, 27 Apr–2 May 2025, EGU25-19649, https://doi.org/10.5194/egusphere-egu25-19649, 2025.

EGU25-19711 | ECS | Orals | BG2.1

Insights into the genesis and geological significance of iron-manganese precipitates in the Baltic Sea, Gulf of Finland seafloor 

Johanna Maria Ojap, Martin Liira, Aivo Lepland, Michael E. Böttcher, Sten Suuroja, Peeter Somelar, and Kalle Kirsimäe

Iron-manganese (oxy)hydroxide precipitates (Fe-Mn concretions) occur at the ocean and sea floors all over the world, typically in regions with low sedimentation rates. In shallow water environments like the Baltic Sea, Fe-Mn concretions form in areas where bottom currents prevent active sediment accumulation. The shallow brackish conditions and periodical saltwater inflows from the North Sea make the Baltic Sea a unique environment for concretion formation. Fe-Mn concretions in the Baltic Sea also grow much faster than oceanic concretions, resulting in different mineralogical, chemical, and isotopic compositions compared to deep-sea nodules. One of the areas in the Baltic Sea where Fe-Mn concretions are widespread is the Gulf of Finland, where the concretions form where Late Pleistocene glaciolacustrine varved clays, glacial till, or crystalline bedrock is exposed on the seafloor. 

Due to redox-driven precipitation processes, the spherical or disc-like Fe-Mn concretions forming symmetrically around a nucleus are composed of alternating Fe- and Mn-rich layers. In addition, crust-like concretions can grow in areas with higher background sedimentation rates. During their formation, Fe-Mn concretions record the geochemical status of the sedimentary environment, making them potential archives of the geological history of sedimentary basins. Following the Last Glacial Maximum, the Baltic Sea basin has been through multiple phases of fresh and saltwater conditions before the establishment of the modern brackish Baltic Sea. The Fe-Mn concretions in the Baltic Sea have potentially recorded those changes in their chemical and stable isotopic composition, helping us to understand their formation mechanisms and growth phases through layer-by-layer sampling of the concretions from the centre outwards. 

This study examines the morphological, chemical, stable isotopic and mineralogical properties of the Fe-Mn concretions in the Baltic Sea, Gulf of Finland seafloor and has an overarching aim to assess the complex geological processes controlling the formation of concretions, as well as get a closer look at the growing phases through the finer sampling of their layered structure, which could offer a new perspective on the timing of formation of these concretions relative to the development of the Baltic sea and the Gulf of Finland.

How to cite: Ojap, J. M., Liira, M., Lepland, A., Böttcher, M. E., Suuroja, S., Somelar, P., and Kirsimäe, K.: Insights into the genesis and geological significance of iron-manganese precipitates in the Baltic Sea, Gulf of Finland seafloor, EGU General Assembly 2025, Vienna, Austria, 27 Apr–2 May 2025, EGU25-19711, https://doi.org/10.5194/egusphere-egu25-19711, 2025.

EGU25-19720 | Orals | BG2.1

Revealing past climate variability using tree rings and stable isotopes from tropical and boreal regions in the Americas 

Laia Andreu-Hayles, Clara Rodríguez-Morata, Milagros Rodriguez-Caton, Etienne Boucher, Duncan A. Christie, Doris B. Crispín-DelaCruz, Rosanne D'Arrigo, Valérie Daux, Eugenia Ferrero, Robert D. Field, Fabio Gennaretti, Ignacio Hermoso, Alienor Lavergne, Mariano Morales, Rose Oelker, Edilson J. Requena, Ginette Ticse-Otarola, Arianna M. Varuolo-Clarke, Ricardo Villalba, and Mathias Vuille

High-resolution records of centennial climate variability are crucial considering the scarcity and overall short length of instrumental meteorological data in many regions of the world. The application of stable isotopic analysis in tree rings has emerged as a robust methodological tool for elucidating the intricate complexities of environmental history. This presentation will travel from high latitudes in North America to the Tropical Andes in South America to show how tree-ring stable isotopes can be used to reconstruct climate variability and atmospheric patterns across the Americas, as well as changes in Sea Surface Temperatures (SST). Stable oxygen isotopes (δ18O) measured in tree rings from white spruce trees from the Northwest Territories of Canada record similar large-scale climate patterns as modelled precipitation δ18O from a general circulation model (NASA GISS ModelE2 isotopically-equipped). Trees from the species Polylepis tarapacana growing at high elevation (~5,000 m a.s.l) at the South American Altiplano were used to reconstruct annual precipitation variability, which is driven by the South American Summer Monsoon, over the last 300 years. This newly developed tree-ring δ18O chronology revealed a robust hydroclimatic teleconnection showing interannual (2–5 years) and decadal (~11 years) periodicities consistent with records of Altiplano precipitation, central tropical Pacific SST, Andean ice core δ18O and tropical Pacific coral δ18O. Furthermore, new tree species of the genus Polyelpis growing in the inner tropics were discovered and found to have significant sensitivity to local and regional hydroclimate variability, showing a close link to tropical Pacific SST and El Niño–Southern Oscillation. Overall, our findings point out the importance of developing longer stable isotopes tree-ring records to overcome the inherent difficulties to reconstruct global hydroclimate variability.


How to cite: Andreu-Hayles, L., Rodríguez-Morata, C., Rodriguez-Caton, M., Boucher, E., Christie, D. A., Crispín-DelaCruz, D. B., D'Arrigo, R., Daux, V., Ferrero, E., Field, R. D., Gennaretti, F., Hermoso, I., Lavergne, A., Morales, M., Oelker, R., Requena, E. J., Ticse-Otarola, G., Varuolo-Clarke, A. M., Villalba, R., and Vuille, M.: Revealing past climate variability using tree rings and stable isotopes from tropical and boreal regions in the Americas, EGU General Assembly 2025, Vienna, Austria, 27 Apr–2 May 2025, EGU25-19720, https://doi.org/10.5194/egusphere-egu25-19720, 2025.

EGU25-19824 | ECS | Posters on site | BG2.1

 Isotopic composition of N2O emissions from a permafrost peatland: a laboratory study using three different analytical techniques   

Matěj Znamínko, Lukas Kohl, Tatiana Trubnikova, Michael Bahn, and Christina Biasi

Nitrous oxide (N2O) is a very potent greenhouse gas, and it is also involved in stratospheric ozone destruction. It is primarily produced by microbial processes such as nitrification and denitrification. Emissions of N2O from permafrost-affected soils have only recently been discovered but are of particular concern as climate change accelerates permafrost thaw and also N2O production. Nevertheless, mechanisms underlaying N2O emissions form permafrost-affected soils remain largely unresolved. Therefore, better understanding of N2O production and consumption processes is urgently needed, and isotope tools are critical for advancing this knowledge.   

Advances in isotopic laser spectroscopy, such as cavity ring-down spectroscopy (CRDS), have enabled real-time quantification of N2O isotopic ratios, offering a powerful tool to study isotope signals of N2O and microbial pathways. Here, an incubation experiment was conducted with soils collected from a permafrost peatland (bare and vegetated). Each of them was subjected to variable water holding capacities (WHC) ranging from 20% to 100%, since water availability is a primary controlling factor on N2O fluxes from soils. Incubations took place at the standard temperature of 15°C.  

Additionally, the study compared three methods for determining the isotopic signature of N2O sources. In the first method, discrete gas samples were collected into glass vials over the incubation period and later analyzed offline using the Keeling plot to derive the isotopic composition. For the second method, endpoint sampling, gas samples were collected at the end of the incubation into gas bags and analyzed to directly determine the isotopic signature of the accumulated N2O. The third method involved real-time isotopic measurements, connected directly to the incubation bottles via a multiplexer. The inverse Keeling plot was then used to derive the isotopic signature. All isotope analysis of N2O were done using the Picarro G5131-i isotopic N2O analyzer.  

Reliable isotopic data could only be obtained when the N2O flux flux exceeded the equivalent to 3 ppb per hour, which was rarely achieved. In the few cases, where fluxes were higher, the isotope signature of N2O indicated that denitrification was the main pathway at all moisture levels. The traditional Keeling plot approach was the most reliable method to determine the isotope source, but the inverse Keeling plot approach can be developed and offers, similar to the gas bag method, practical advantages. We discuss pros and cons of each method and ways to improve precision and reliability of the isotopic measurements in case of high and low fluxes. 


How to cite: Znamínko, M., Kohl, L., Trubnikova, T., Bahn, M., and Biasi, C.:  Isotopic composition of N2O emissions from a permafrost peatland: a laboratory study using three different analytical techniques  , EGU General Assembly 2025, Vienna, Austria, 27 Apr–2 May 2025, EGU25-19824, https://doi.org/10.5194/egusphere-egu25-19824, 2025.

EGU25-20120 | Orals | BG2.1

Biological nitrogen fixation at four Sphagnum-dominated peatlands in the Bohemian Massif: Spatial and temporal variability based on 15N2 moss incubation experiments and microbial community analysis 

Martin Novak, Bohuslava Cejkova, Jiri Barta, Hana Santruckova, Ivana Jackova, Marketa Stepanova, Frantisek Buzek, Jan Curik, and Frantisek Veselovsky

Accumulation of carbon and nitrogen in freshwater wetlands is affected by climatic change. Elevated temperatures and changes in precipitation patterns may lead to degradation and thinning of peat deposits resulting from higher rates of biogenic emissions of greenhouse gases. Higher atmospheric concentrations of greenhouse gases, mainly CO2, CH4, and N2O, may then accelerate global warming. A number of recent studies have addressed the relationship between increasing deposition of reactive nitrogen (Nr, predominantly ammonium and nitrate)and stability of the N stock in peat. Under high atmospheric Nr inputs, peatlands may become a net source of N, rather than a net sink. Nitrogen inventories in ombrotrophic bogs may be influenced by biological N2-fixation (BNF), the conversion of atmospheric molecular N2 by diazotrophic microorganisms to bioavailable NH4+. Because a high energy is required to break the triple bond in the N2 molecule, microbial N2-fixation may shut off when other Nr sources are available. To verify this assumption, we studied four Sphagnum-dominated peat bogs in the Czech Republic differing in Nr deposition by a factor of two. We hypothesized that the more Nr-polluted sites in the north, Velke jerabi jezero (VJ) and Cerny potok (CP), would exhibit lower BNF rates than the less polluted sites in the south, Cervene blato (CB) and Zdarecka slat (ZS). At the end of laboratory incubations of waterlogged peat in a 15N2 atmosphere (t = 2-7 days), samples of living Sphagnum exhibited an increase in d15N values from about -3 ‰ typical of all sites to 27, 259, and 266 ‰ at VJ, CP and ZS, respectively. No significant change in d15N values was recorded at CB. At VJ, the estimated BNF rates reached 840 ng N per gram Sphagnum per day. At CP and ZS these rates were about 10 times higher. Microbial analysis revealed higher activity of diazotrophs at VJ than at CB. At VJ, autotrophic cyanobacterial diazotrophs of the Nosctocaceae family comprised 4.2 %, while at CB they were below 0.1 %. Repeated sampling at CP and ZS in spring and summer showed complex temporal trends in d15N shifts during 15N2 moss incubations. At CP, the d15N shift and BNF rates were larger in summer, whereas at ZS, a larger d15N shift and higher BNF rates were observed in spring. Vertical trends in d15N values at the end of the 15N2 incubations were also complicated. Out of four peat sampling depths (0, 10, 20 and 30 cm), the highest positive d15N shifts during incubation experiments were found 20 cm below surface at CP (561 ‰; spring) and 10 cm below surface at ZS (805 ‰; summer). Collectively, our data indicate that atmospheric Nr inputs were not the main control of BNF in the studied Central European peat bogs. Also large within-site and seasonal variability in BNF was observed. Other site characteristics, such as phosphorus availability, NH4+/NO3- ratios, and moisture conditions served as important BNF drivers.

How to cite: Novak, M., Cejkova, B., Barta, J., Santruckova, H., Jackova, I., Stepanova, M., Buzek, F., Curik, J., and Veselovsky, F.: Biological nitrogen fixation at four Sphagnum-dominated peatlands in the Bohemian Massif: Spatial and temporal variability based on 15N2 moss incubation experiments and microbial community analysis, EGU General Assembly 2025, Vienna, Austria, 27 Apr–2 May 2025, EGU25-20120, https://doi.org/10.5194/egusphere-egu25-20120, 2025.

EGU25-20270 | ECS | Orals | BG2.1

Unraveling N2O production pathways in agricultural and forest soils using stable isotope analysis 

Rosanna Margalef-Marti, Stefania Mattana, Carme López-Sánchez, Raúl Carrey, Jordi Palau, Neus Otero, Tiphaine Tallec, Bernard Heinesch, Iris Feigenwinter, Fabio Turco, Helena Rautakoski, Annalea Lohila, Matthias Peichl, Rossella Guerreri, Ivan Jansens, Silvia Poblador, Enzo Magliulio, Luca Vitale, Dominika Lewicka-Szczebak, and Angela Ribas

Nitrous oxide (N2O) is a potent greenhouse gas and a significant contributor to global warming and ozone layer depletion. It is primarily emitted from soils through microbial processes such as nitrification and denitrification and shows spatial and temporal variations driven by environmental factors such as the availability of nitrogen (e.g., in the form of fertilizers), organic carbon, soil moisture, temperature and oxygen levels. However, estimates on the relative contribution of different N2O producing pathways are frequently uncertain and knowledge on how environmental factors influence N2O emissions dynamics is still limited. Therefore, closing these knowledge gaps is crucial for improving mitigation strategies.

This study aims to analyze the patterns of N₂O emissions across diverse forest and agricultural soils, taking geographic variations into account, and to determine the relative contributions of the primary N2O producing and consuming pathways specific to each soil type.

Batch experiments were conducted using four agricultural soils and four forest soils from sites of the ICOS (https://www.icos-cp.eu) and FLUXNET (https://fluxnet.org/about/) networks. Agricultural soils were obtained in France, Belgium, Italy and Switzerland, while forest soils were obtained in Finland, Sweden, Belgium and Italy. These soils exhibited a range of intrinsic characteristics, such as texture, organic matter content and type, and nitrogen sources. The incubations took place in complete darkness at a constant temperature of 22 ºC for approximately 30 hours after rewetting dry soil. Each soil type was tested with five replicates across five time points (i.e., 25 reactors for soil type). For each reactor we measured the production of N2O and its isotopic composition including the δ15N-N2Obulk, δ18O-N2Obulk, and site preference δ15N-N2OSP (i.e., the intramolecular distribution of N isotopes, since the N2O molecule has an asymmetric linear structure [N-N-O]). Additionally, the isotopic compositions of nitrate and ammonium from soil KCl extracts are being analyzed (δ15N-NO3-, δ18O-NO3-, δ15N-NH4+) and microbiological characterization is also being performed.

Preliminary results revealed significantly higher N2O production in agricultural soils compared to forest soils during the 30-hour incubation period, with rates reaching up to 130 μg N-N2O/kg/h in agricultural soils and only 0.3 μg N-N2O/kg/h in forest soils. Notable differences were also observed among the four tested soils within each category (agricultural or forest). These differences might be mainly attributed to differences in the nitrogen and organic carbon content as well as the texture. The isotopic analysis of N2O suggests that denitrification is the primary process driving N₂O emissions in the studied soils, with nitrification also contributing to varying extents depending on the soil type.

Ongoing isotopic analyses of nitrate and ammonium in soil KCl extracts alongside microbial characterization, will provide deeper insights into the dominant processes driving N2O emissions in each soil type and the key environmental factors influencing them.

How to cite: Margalef-Marti, R., Mattana, S., López-Sánchez, C., Carrey, R., Palau, J., Otero, N., Tallec, T., Heinesch, B., Feigenwinter, I., Turco, F., Rautakoski, H., Lohila, A., Peichl, M., Guerreri, R., Jansens, I., Poblador, S., Magliulio, E., Vitale, L., Lewicka-Szczebak, D., and Ribas, A.: Unraveling N2O production pathways in agricultural and forest soils using stable isotope analysis, EGU General Assembly 2025, Vienna, Austria, 27 Apr–2 May 2025, EGU25-20270, https://doi.org/10.5194/egusphere-egu25-20270, 2025.

Mountain grasslands are currently experiencing significant changes in land use and climate, with an increased frequency of extreme droughts anticipated in the near future. Understanding the drought responses of carbon (C) allocation—a critical process in the C cycle—remains limited. In this study, we conducted an experimental summer drought on traditionally managed hay meadows and traced the fate of recent assimilates into leaf and root sucrose. We applied 13CO2 pulses at peak drought and tracked the labeled carbon into individual positions of glucose using liquid chromatography coupled with ultrahigh-resolution mass spectrometry.

Our findings revealed that drought conditions decreased total C uptake and led to a reduction in above-ground carbohydrate storage pools. The turnover of the leaf sugar pool, determined through position-specific carbon enrichment, was significantly reduced compared to the control treatment. Interestingly, below-ground C allocation to root sucrose was enhanced by drought, but the position-specific carbon enrichment was less affected, suggesting the involvement of other carbon sources.

These results demonstrate that position-specific isotope distribution provides a novel understanding of plant carbon allocation, offering new insights into the resilience and adaptation of mountain grasslands to drought stress.

How to cite: Gleixner, G.: Unveiling Carbon Allocation Dynamics in Mountain Grasslands Under Drought Stress Using Position-Specific Isotope Analysis, EGU General Assembly 2025, Vienna, Austria, 27 Apr–2 May 2025, EGU25-20366, https://doi.org/10.5194/egusphere-egu25-20366, 2025.

EGU25-20485 | Orals | BG2.1

Environmental conditions for dolomite formation in the Late Miocene Lake Bira – Clues from Mg and Sr isotopes 

Boaz Lazar, Ludwik Halicz, Jakub Karasiński, Dotan Shaked Gelband, Abraham Starinsky, and Mordechai Stein

d26Mg values and 87Sr/86Sr ratios are used as tracers of calcite and dolomite formation in the late Miocene Lake Bira. Mg and Sr isotope ratios were analyzed in freshwaters and brines that currently feed the Sea of Galilee (the modern remnant of Lake Bira) and in limestones and dolostones comprising the Bira Formation. d26Mg and 87Sr/86Sr ratios of the Sea of Galilee waters (~0.89‰, ~0.7075) are consistent with the mixing of mainly carbonate and basaltic waters with subsurface Ca-chloride brines (e.g., Tiberias Spa). The d26Mg values in the limestones and dolostone of the Bira Formation range from ~ -1.0 to ~ -3.5‰. and -2.8 to -1.8 ‰, respectively. The d26Mg values in Lake Bira waters at that time were between ~-2 ‰ to ~1 ‰, as calculated from the fractionation factors between water and either calcite or dolomite (-2 ‰ and -0.75 ‰, respectively). Isotope mixing calculations suggest that waters with positive d26Mg values (estimated as ~1.2 ‰) were added to the lake. We suggest that these waters were Ca-chloride brines that were formed in the late Miocene Jordan Valley by interaction between evaporated seawater and the local limestones. These brines deposited the contemporaneous thick sequences of salt (halite) and gypsum in the Jordan Valley to the east of the lake. Dolomitization of the limestones increased the d26Mg of the brines during their re-circulation through the surrounding aquifers due to Rayleigh fractionation, The dolomitization process was accompanied by the production of a Ca-chloride solution.

Limestone formation required enhanced freshwater input; a process accompanied by increasing hydrological head that induced an enhanced inflow of the Ca-chloride brine with high d26Mg to the lake. Dolomite formation was associated with the weakening of the hydrological head, and diminishing flow of the brine to the lake.

The formation of dolomites in the lacustrine environment of Lake Bira and the contemporaneous deposition of gypsum in the nearby Jordan Valley provides a model for dolomitization in marginal environments (e.g., lagoons and subkhas), where the Mg is exchanging with Ca during the dolomitization process and the excess Ca taking the sulfate to form gypsum.

How to cite: Lazar, B., Halicz, L., Karasiński, J., Shaked Gelband, D., Starinsky, A., and Stein, M.: Environmental conditions for dolomite formation in the Late Miocene Lake Bira – Clues from Mg and Sr isotopes, EGU General Assembly 2025, Vienna, Austria, 27 Apr–2 May 2025, EGU25-20485, https://doi.org/10.5194/egusphere-egu25-20485, 2025.

EGU25-443 | Orals | BG2.2

New standards for isotope measurements of CO2 for atmospheric and biogeoscience applications 

Joële Viallon, Robert Wielgosz, Edgar Flores, Tiphaine Choteau, and Philippe Moussay

Progress in the development of pure CO2 gas standards for δ13C, δ18O and Δ47 measurements as well as CO2 in air gas standards (with mole fractions in the range 350 µmol/mol to 800 µmol/mol) for δ13C, δ18O measurements are described. Initial results indicate the potential to produce standards with internal consistencies at the 0.005 ‰ level for δ13C and standard uncertainties of 0.015 ‰ in relation to the VPDB scale, with the magnitude of the latter principally limited by the homogeneity of primary carbonate reference materials.
An initial driver for standards development was the requirement for appropriate calibration strategies and standards [1]  to support commercially developed laser-based instruments that have grown in number over the last decade. These analysers can measure real-time isotopic ratio variations of greenhouse gases, and notably CO2, allowing their application across a wide range of scientific and technical disciplines. The development of appropriate standards and calibration methods has required the links and traceability to primary carbonate materials via the IRMS dual inlet reference method to be re-examined.
Outputs of the project so far include:
Establishment of a facility to produce stable pure CO2 gas standards in 6L cylinders at 2 bar with δ13C values from -1 ‰ to +45 ‰ vs VPDB, with internal consistency approaching the 0.005 ‰ level, and an effective calibration option for dual inlet IRMS systems as demonstrated in the international comparison CCQM-P204 completed in 2021 [2];
Studies of Δ47 values of mixtures of different pure CO2 gas, and the reproducibility and stability of these and their potential to act as reference standards for clumped isotope ratio measurements with IRMS systems;
The development and validation of a cryogenic Air Trapping system to extract CO2 from air for determination of δ13C and δ18O-CO2 with IRMS, including a correction for the N2O present in samples. The facility is currently being used for another international comparison (CCQM-P239) of CO2 in in air standards from 15 institutes containing CO2 over the range of 380 μmol mol−1 to 800 μmol mol−1 and δ13C and δ18O-CO2 values from 1 ‰ to -43 ‰ and -7 ‰ to -35 ‰, respectively. The method demonstrates excellent reproducibility, with standard deviations of 0.005% and 0.05% for δ13C  and δ18O-CO2, respectively, and will demonstrate the level of equivalence of new CO2 in  air isotope  ratio standards currently being produced.
[1] Flores, E., Viallon, J., Moussay, P., Griffith, D. W. T. & Wielgosz, R. I. Calibration strategies for FT-IR and other isotope ratio infrared spectrometer instruments for accurate δ13C and δ18O measurements of CO2 in air. Anal. Chem. 89, 3648–3655 (2017).
[2]  J Viallon et a, Final report of CCQM-P204, comparison on CO2 isotope ratios in pure CO2,  2023 Metrologia 60 08026 DOI 10.1088/0026-1394/60/1A/08026

How to cite: Viallon, J., Wielgosz, R., Flores, E., Choteau, T., and Moussay, P.: New standards for isotope measurements of CO2 for atmospheric and biogeoscience applications, EGU General Assembly 2025, Vienna, Austria, 27 Apr–2 May 2025, EGU25-443, https://doi.org/10.5194/egusphere-egu25-443, 2025.

Mercury (Hg) stable isotopes have become a powerful tracer for understanding Hg sources and complex biogeochemical processes in the natural environment. Anomalies of even mass number mercury isotopes (even-MIF; Δ200Hg, Δ204Hg), in particular, have enabled the differentiation of Hg chemical forms (Hg0 vs. HgII) and their depositional pathways. This is because even-MIF occurs exclusively via upper atmospheric photo-oxidation, leaving HgII with a positive Δ200Hg value and Hg0 with a negative Δ200Hg value. Over the past several years, my research group has characterized even-MIF anomalies in atmospheric samples (gaseous Hg0, precipitation), seawater, zooplankton, and fish from high (Beaufort, Chukchi Sea) and mid-latitude oceans (West to Central Pacific Ocean). Our goal was to comprehensively trace sources, oxidation/removal pathways, and fate of Hg to open ocean food web. The results depict a clear Δ200Hg dichotomy, in which all samples from mid-latitude oceans have positive Δ200Hg (reflecting HgII) and the samples from high-latitude oceans have negative Δ200Hg (reflecting Hg0). The δ202Hg, which has been used to trace Hg sources (types of anthropogenic, natural sources) across a large spatial scale, show that, while high-latitude oceans exhibit values similar to that of background Hg, mid-latitude oceans have δ202Hg consistent with anthropogenic Hg. There is also a gradual dilution of zooplankton Hg concentration and anthropogenic δ202Hg signals from West to the Central Pacific Ocean. We summarize Hg sources and oxidation pathways as such, by using an isotope mixing model: In the West and Central Pacific, 52-60% of Hg0 emitted from anthropogenic sources is first circulated to the upper atmosphere for photo-oxidation prior to oxidation and removal to the open ocean. The remainder of Hg comes from riverine Hg export. In the Arctic, >70% of Hg is oxidized near the biosphere, not in the upper atmosphere, thereby conserving the even-MIF of Hg0 even upon oxidation. We speculate that the presence of abundant halogens and sea salt aerosols (SSA) is responsible for rapid Hg0 oxidation and removal to the open ocean. Our study showcases that Hg stable isotopes can be used to differentiate sources, pathways of removal, and fate of Hg across a large spatial scale. After compiling further dataset, we identify that near-surface Hg0 oxidation mediated by halogens and SSA in the Arctic explains elevated Hg levels reported in the Arctic fish, mammals, and polar bears. The pathway of anthropogenic Hg0 emission to bioaccumulation detected in the West and Central Pacific suggests that anthropogenic Hg0 abatement from continental Asia would lower Hg levels in the adjacent marine ecosystems.

How to cite: Kwon, S. Y., Motta, L., and Lim, S. H.: Mercury stable isotopes reveal atmospheric oxidation and removal processes to high and mid-latitude oceans , EGU General Assembly 2025, Vienna, Austria, 27 Apr–2 May 2025, EGU25-2293, https://doi.org/10.5194/egusphere-egu25-2293, 2025.

The presence of approximately 400,000 non-producing oil and gas wells (OGWs) in Canada and millions more globally poses significant environmental and safety issues. These wells leak methane (CH₄) and other pollutants, which exacerbate climate change, pose explosion hazards, contaminate drinking water, and damage plants and animals. Plugging all existing non-producing OGWs would cost several hundred billion dollars1, making this approach virtually impossible. However, since only 10% of these wells are responsible for >90% of the emissions2, a better strategy may be to identify and target high-emitting wells for more effective and economical mitigation efforts. It is therefore important to fully understand the processes governing methane leakage and their subsequent emissions through non-producing OGWs. Another important aspect of these efforts is the identification of well integrity failures, which may not necessarily cause high emissions to the atmosphere but can cause subsurface fluid migration, even for low-emitting wells. A modern OGW typically consists of a system of casings and cement, providing multiple barriers designed to prevent contamination. The surface casing vent (SCV), installed at the wellhead, is designed to vent gas from the annular space between the surface casing and the next casing string. Generally, methane emissions at the SCV are viewed as a sign of well integrity failure but could be unrelated if the casing intersects natural fluid migration pathways.

In this study, we compiled the geochemical data of 365 OGWs from Canada, with measurements made at the component level (wellhead, SCV and surrounding soil) wherever possible. By analyzing δ13C and δ2H isotopic signatures and gas compositions, we identified the origins of our samples as primary microbial, secondary microbial, thermogenic, or abiotic. These origins were only attributed to a third of the studied wells for at least one of the three components (wellhead, SCV and surrounding soil), due to the sensitivity of this approach. We found that the presence of thermogenic methane at the SCV is a good indicator of high-emitting wells, with magnitudes of emissions 100 times higher than microbial emissions. Furthermore, our analysis revealed that a considerable number of emitting wells (~23%) produce methane of microbial origin, which is higher than previously thought (8% in the only existing meta-analysis), and with emission magnitudes that exceed previous estimates by a factor of 1,000. These results suggest that non-producing OGWs could act as bridges facilitating the diffusion of subsurface microbial methane emissions into the atmosphere. Finally, we generally found similar geochemical signatures of methane in corresponding wellhead and SCVs, suggesting that the structural integrity of these wells has been compromised and they can act as one single entity.

  • 1. Raimi, D., Krupnick, A. J., Shah, J.-S. & Thompson, A. Decommissioning Orphaned and Abandoned Oil and Gas Wells: New Estimates and Cost Drivers. Environ. Sci. Technol. 55, 10224–10230 (2021).
  • 2. Williams, J. P., Regehr, A. & Kang, M. Methane Emissions from Abandoned Oil and Gas Wells in Canada and the United States. Environ. Sci. Technol. 55, 563–570 (2021).

How to cite: Micucci, G. and Kang, M.: Investigating the role of Canadian non-producing oil and gas wells in subsurface-atmosphere methane fluxes through geochemical signatures and methane origins, EGU General Assembly 2025, Vienna, Austria, 27 Apr–2 May 2025, EGU25-3259, https://doi.org/10.5194/egusphere-egu25-3259, 2025.

EGU25-3453 | ECS | Posters on site | BG2.2

Long-term high-frequency isotope-specific monitoring of H2O, CO2, CH4 and N2O exchange between atmosphere and ecosystems 

Matthias Claß, Youri Rothfuss, Daniel Schulz, and Nicolas Brüggemann

The central goal of this project is to establish long-term isotope-specific monitoring of H2O, CO2, CH4 and N2O exchange between terrestrial ecosystems and the atmosphere with high temporal resolution at grassland, arable land and forest sites. The exchange of H2O and CO2 between ecosystem and atmosphere will be determined online with rapid (10 Hz) isotope-specific laser analyzers using the eddy covariance (EC) method. The objective of this measurement is to determine the isotopologue fluxes of the respective gases and the source/sink partitioning, i.e., evaporation and transpiration in the case of water vapor or photosynthetic uptake and ecosystem respiration in the case of CO2. Measurements will be conducted using fully automated measurement systems for a minimum of two years. In addition, a mobile automated sampling system will be developed for isotope-specific recording of CH4 and N2O ecosystem exchange using the profile method with off-line isotope analysis by isotope ratio mass spectrometry to ensure the highest possible precision of isotope measurements. The aim of the isotope-specific flux measurements is to partition the CH4 flux into CH4 production (methanogenesis, if relevant) and CH4 uptake (methane oxidation), and the N2O flux into nitrification and denitrification as sources and N2O reduction as an N2O sink. Furthermore, the measurements will permit the determination of the isotopic composition across seasons and during peak emission periods, such as fertilization or freeze-thaw events. All approaches will be evaluated for their relevance in identifying greenhouse gas source/sink processes and their potential for long-term deployment. This presentation will introduce the measurement concepts and present first results.

How to cite: Claß, M., Rothfuss, Y., Schulz, D., and Brüggemann, N.: Long-term high-frequency isotope-specific monitoring of H2O, CO2, CH4 and N2O exchange between atmosphere and ecosystems, EGU General Assembly 2025, Vienna, Austria, 27 Apr–2 May 2025, EGU25-3453, https://doi.org/10.5194/egusphere-egu25-3453, 2025.

EGU25-3476 | Orals | BG2.2

Carbonyl sulfide sulfur isotopes fractionation and leaves' internal conductance 

Alon Angert, Felix M. Spielmann, Boris Bazanov, Georg Wohlfahrt, and Alon Amrani

Carbonyl sulfide (OCS) is the major long-lived sulfur-bearing gas in the atmosphere. The main sink for COS occurs when it diffuses through the plant leaves stomata and enters the mesophyll cell, where it reacts with the enzyme carbonic anhydrase. Since CO2 enters the leaves by a similar pathway, COS has been used to estimate the rates of regional and global photosynthesis. For example, recently 1, it was suggested that the global GPP is ~30% higher than estimated so far, based on COS observations and new modeling of COS internal conductance, which relates to the diffusion into the active site in the mesophyll. Sulfur isotope analysis (34S/32S ratio, δ34S) of COS was shown 2 to be useful for improving the determination of atmospheric COS sources and sinks. The sulfur isotopic fractionation during COS uptake in plants is needed for using this tool, but so far, has only been established in the lab. In that study, the fractionation was found to be −1.6 ± 0.1‰ for C3 plants,  −5.4 ± 0.5‰  for C4 plants, and the carbonic anhydrase fractionation was estimated indirectly as −15 ± 2‰. Field studies of leaves' COS uptake enable the study of the effects of varying light conditions in the tree canopy. Here, we measured the COS fractionation during uptake in an Austrian alpine forest, using branch chambers at three height levels in a Pinus sylvestris canopy. In addition, we directly measured the fractionation of carbonic anhydrase in vitro in the lab. The isotopic analysis was conducted by pre-concentrating the air samples and subsequent δ34S analysis by gas chromatography (GC) connected to a multi-collector inductively coupled plasma mass spectrometer (MC-ICPMS). The results of this research are important for improving both leaves scale COS transport models and global budgets of COS and CO2.


1. Lai, J., Kooijmans, L. M., Sun, W., Lombardozzi, D., Campbell, J. E., Gu, L., ... & Sun, Y. (2024). Terrestrial photosynthesis is inferred from plant carbonyl sulfide uptake. Nature, 634, 855-861.

2. Davidson, C., Amrani, A., & Angert, A. (2021). Tropospheric carbonyl sulfide mass balance based on direct measurements of sulfur isotopes. Proceedings of the National Academy of Sciences, 118(6), e2020060118.

3. Davidson, C., Amrani, A., & Angert, A. (2022). Carbonyl sulfide sulfur isotope fractionation during uptake by C3 and C4 plants. Journal of Geophysical Research: Biogeosciences, 127(10), e2022JG007035.

How to cite: Angert, A., Spielmann, F. M., Bazanov, B., Wohlfahrt, G., and Amrani, A.: Carbonyl sulfide sulfur isotopes fractionation and leaves' internal conductance, EGU General Assembly 2025, Vienna, Austria, 27 Apr–2 May 2025, EGU25-3476, https://doi.org/10.5194/egusphere-egu25-3476, 2025.

EGU25-3828 | Orals | BG2.2

Measurement and Full Model of Isotope Fractionation During Photodissociation and Applications in Cosmo and Geochemistry 

Mark Thiemens, Ksenia Komorova, Natalia Gelfand, Francoise Remacle, Raphy Levine, Subrata Chakraborty, Teresa Jackson, and Oleg Kostco

The application of isotope effects from photodissociation processes in nature date back to Viking and the observation of a massive 15N in the Martian atmosphere, derived from combined photolysis and gravitational escape. Large observed effects in meteorites, interstellar molecular clouds, and pre solar nebulae utilize photodissociation as a source of the wide range in isotopic composition. CO, which is isoelectronic with nitrogen, has also been widely used, but models do not agree with experiments suggesting models do not include all parameters.

We report precise novel measurements of the isotopic branching ratio in the photodissociation of N2 in the VUV at the advanced light source, Berkeley with quantitative scavenging of the nascent N atoms. We here report an integration of these measurements with state-of-the-art dynamics modeling and light shielding. The measured photodissociation enrichment in 15N with wavelength with a down trend above 90 nm is shown to arise from dynamical effects. There are two effects identified by the computations, the branching between exit channels and the more subtle role of the non-monotonic variation in the individual line widths that in the higher energies begin to significantly overlap. The widths have a significant effect on both the shielding computations at the higher energies and on the cross sections themselves. The modeling requires accurate quantum dynamical simulations using state of the art multireference potential energies and their state-dependent couplings. As the excitation energy increases, competition between different coupled exit channels, some leading to reactive N (2D) and some leading to significantly less reactive N (2P) in an isotope dependent way, modulates the selectivity for the 15N atoms. As a result, the dissociation lifetimes of initial states close in energy vary in a nonmonotonic isotopic dependent manner as a function of energy. Our work shows that modelling can interpret the novel experimental observations and account for the exceptionally high selectivity. Additional progress requires accurate high resolution UV spectra for entire UV bands, both measured and computed to complement fractionation measurements. The complexity of the non-statistical dynamics and the role of the light shielding make such high-resolution work necessary for the detailed understanding of isotope enrichment fractions in the higher energy regime for nitrogen and also for other molecules of interest in cosmochemistry such as CO. Given the massive range in isotopic composition, the interpretation of e.g the Mars atmosphere and photolysis intersection, meteoritic nitrogen may be modeled better. Samples from the earth’s interface with space where N2 photolysis occurs would be an interesting application and testing of the model.


How to cite: Thiemens, M., Komorova, K., Gelfand, N., Remacle, F., Levine, R., Chakraborty, S., Jackson, T., and Kostco, O.: Measurement and Full Model of Isotope Fractionation During Photodissociation and Applications in Cosmo and Geochemistry, EGU General Assembly 2025, Vienna, Austria, 27 Apr–2 May 2025, EGU25-3828, https://doi.org/10.5194/egusphere-egu25-3828, 2025.

EGU25-6805 | Orals | BG2.2

Isotopic fractionation of O2 during photochemical O2 consumption: A relevant process for estimating primary production in sunlit surface waters? 

Sarah G. Pati, Lara M. Brunner, Thomas B. Hofstetter, and Moritz F. Lehmann

Isotopic fractionation of O2 is an important tracer for estimating primary production in aquatic environments because it helps to disentangle the respective contributions from O2 production, consumption, and gas-exchange. Isotope-based methods for estimating primary productivity typically involve measurements of either only 18O/16O ratios or, in the case of triple oxygen isotope approaches, also 17O/16O ratios. Aerobic respiration is generally assumed to be the only process consuming O2, with a constant value for O-isotopic fractionation, expressed as ε or λ values, respectively. However, emerging evidence suggests that in the photic zone of lakes and oceans, photochemical O2 consumption can be of similar magnitude as microbial respiration and photosynthetic O2 production. To determine whether photochemical O2 consumption should be included in isotope-based assessments of primary productivity, we measured the O-isotopic fractionation (as 18O-ε and λ values) of two important photochemical O2 consumption reactions. First, we investigated the energy transfer from photochemically excited dissolved organic matter (DOM) to O2, leading to the reversible formation of singlet oxygen, which can irreversibly react with several functional groups within DOM. Under realistic conditions for sunlit surface waters, this photochemical O2 consumption reaction is associated with 18O-ε values of -25 ‰ to -30 ‰, which are larger than typical values for respiration (approx. -20 ‰). The second photochemical process investigated was the reaction between O2 and photochemically produced organic radicals, which yielded substantially smaller values for 18O-ε (0 ‰ to -15 ‰). 18O-ε values for photochemical O2 consumption may thus be distinguishable from those for respiration. Yet, the overall isotopic fractionation in sunlit surface water will depend on the relative contributions of the different photochemical O2 consumption reactions. Although some studies have measured the isotopic fractionation of photochemical O2 consumption in natural water samples, additional research is needed for properly implementing these processes into isotope-based estimations of primary production. Finally, results from triple oxygen isotopic fractionation measurements suggest an overlap of λ values in the range of 0.51-0.53 for photochemical O2 consumption (as determined in this study) and for respiration experiments from literature.

How to cite: Pati, S. G., Brunner, L. M., Hofstetter, T. B., and Lehmann, M. F.: Isotopic fractionation of O2 during photochemical O2 consumption: A relevant process for estimating primary production in sunlit surface waters?, EGU General Assembly 2025, Vienna, Austria, 27 Apr–2 May 2025, EGU25-6805, https://doi.org/10.5194/egusphere-egu25-6805, 2025.

EGU25-8718 | ECS | Posters on site | BG2.2

From Sunshine to Snowfall: Understanding concurrent CO2 and COS exchange in a Coniferous Forest 

Felix M. Spielmann, Albin Hammerle, Anna De-Vries, Alexander Platter, and Georg Wohlfahrt

The net ecosystem exchange (NEE) of CO2 can be measured using the eddy covariance (EC) technique, but separating NEE into ecosystem respiration and gross primary productivity (GPP) relies on models and tracers, making it a persistent challenge. Beyond the established nighttime and daytime flux partitioning algorithms, the trace gas carbonyl sulfide (COS) shows promise as a robust proxy for constraining GPP. Unlike CO2, which is exchanged bidirectionally by leaves and its ecosystem level exchange being influenced by soil respiration, COS generally enters leaves unidirectionally and is fully catalyzed by carbonic anhydrase. Other sources and sinks of COS within ecosystems are typically minor and negligible.

Initial laboratory studies have determined the leaf relative uptake rate (LRU) – the ratio of COS to CO2 deposition velocities (LRU = (FCOS/χCOS)/(GPP/χCO2)) – to be relatively stable around 1.7 under optimal conditions. By knowing the LRU and measuring COS fluxes alongside CO2 and COS ambient mixing ratios, GPP can be calculated. However, most laboratory measurements have been conducted under optimal conditions and further research revealed the influence of environmental factors such as drought, vapor pressure deficit (VPD) and photosynthetically active radiation (PAR) on the LRU.

Due to the high cost and sensitivity of required instruments, few studies have examined COS fluxes at the ecosystem scale, and even fewer have performed long-term monitoring. Seasonal dynamics, particularly during winter, remain largely unexplored.

To address this gap, we conducted EC measurements of COS and CO2 fluxes at a Pinus sylvestris-dominated coniferous forest in Austria to investigate environmental influences on COS fluxes and LRU dynamics. Sampling has been continuous since May 2021, except for a two-month gap during the winter of 2021/22. We present the influence of VPD, PAR, temperature and snowfall on COS fluxes and the LRU at the ecosystem level, based on 3.5 years of measurements.

How to cite: Spielmann, F. M., Hammerle, A., De-Vries, A., Platter, A., and Wohlfahrt, G.: From Sunshine to Snowfall: Understanding concurrent CO2 and COS exchange in a Coniferous Forest, EGU General Assembly 2025, Vienna, Austria, 27 Apr–2 May 2025, EGU25-8718, https://doi.org/10.5194/egusphere-egu25-8718, 2025.

EGU25-10604 | ECS | Orals | BG2.2

Large temperature dependencies for the D, 13C and clumped kinetic isotope effects in methane oxidation by OH and Cl predicted by quantum chemical and transition state theory. 

Marie Kathrine Mikkelsen, Jacob Lynge Elholm, Kurt V. Mikkelsen, and Matthew S. Johnson

Methane emission budgets based on isotopic analysis (e.g. 13C-CH4, D-CH4, 13CH3D CH2D2, CHD3, and/or CD4) correct composition for the isotopic fractionation of atmospheric oxidation reactions. They rely on a handful of laboratory measurements obtained at only a couple of temperatures. The goal of this study is to better characterize KIEs of the reactions and especially the temperature dependence of the KIEs.

As a first step we have calculated the temperature dependent reaction rates using tunneling corrected Transition State Theory. We examine the reaction of methane with Cl and OH including all possible transition states with the isotopologues: CH4,13CH4, 14CH4, 13CDH3, CDH3, CD2H2, CD3H, and CD4. Transition State Theory has been used with M06-2X, ωB97X-D, and CAM-B3LYP level of theory, with the two basis sets 6-31++G(d,p) and 6-311++G(d,p). The KIE is calculated for all reactions and compared with literature. Results for the 13CH4 + Cl reaction show that the KIE changes with -12.0 ‰ per 100 K. Whereas for 13CH4 + OH the KIE changes by -1.14 ‰ from 300 to 200 K. For all isotopologues we predict that the KIE’s change significantly with temperature. Including this correction in isotopic mass balance top down emissions estimates will significantly change the results.

In future work we will examine the reaction path and molecular dynamics in detail. To do these calculations, we will perform ab initio multiple spawning (AIMS) trajectories interfaced with the TeraChem electronic structure program. This study will increase our understanding of the oxidation of methane and compare the quantum chemical understanding of isotope budgeting to observations.

How to cite: Mikkelsen, M. K., Elholm, J. L., Mikkelsen, K. V., and Johnson, M. S.: Large temperature dependencies for the D, 13C and clumped kinetic isotope effects in methane oxidation by OH and Cl predicted by quantum chemical and transition state theory., EGU General Assembly 2025, Vienna, Austria, 27 Apr–2 May 2025, EGU25-10604, https://doi.org/10.5194/egusphere-egu25-10604, 2025.

EGU25-10857 | ECS | Orals | BG2.2

The role of sampling height in interpreting methane isotope ratios for source attribution and inversion modelling 

Emmal Safi, Dafina Kikaj, Thomas Röckmann, Edward Chung, Jacoline van Es, Chris Rennick, Carina van der Veen, Tim Arnold, and Bibhasvata Dasgupta

Methane (CH4) has a global warming potential 28-36 times that of carbon dioxide over a 100-year period [1]. Different sources of CH4 have distinct isotopic signatures, with CH4 from biological sources having a lighter signature than those from fossil sources [2]. Greenhouse gas (GHG) emissions are typically reported using bottom-up methods (based on data such as emission factors) that are verified using top-down methods (based on atmospheric transport models (ATMs) and observations) which infer fluxes, often through Bayesian methods [3]. Isotope ratio data are generally used in atmospheric models to understand individual contributions of various CH­4 sources, globally and regionally. However, there is uncertainty regarding isotopic signatures due to large temporal variabilities and regional specificities [4].

Methane isotope ratio source signature information is typically gained through discrete mobile measurement campaigns, with the aim of capturing the emissions directly from the sources, through downwind transection of plumes as closely as possible to the source [5]. These measurements fill databases that are used for atmospheric modelling [2,6,7].

Continuous measurements of CH4 isotope ratios are also carried out at from varying sampling heights [7,8,9] (ranging from tens to hundreds of meters) with the lower heights, closer to emissions sources, capturing more local influences and higher heights capturing more regional emissions. While they offer the advantage of being continuous, they are further away from the emission sources, therefore have larger uncertainties.

Understanding the information that can be gained from continuous CH4 isotope ratio measurements at different sampling heights and locations will be an important factor to consider when using observational data in inversion frameworks, in terms of accurately quantifying source signatures. We present results of mean isotopic signatures from continuous measurements, resolved using the Keeling approach and compare to modelled data to understand the inferred source contributions.

Continuous measurements of CH4 isotope ratios have been carried out at 10 European atmospheric GHG monitoring stations. This study focuses on two sites: Heathfield (an inland, 100 m a.g.l tall tower) and Krakow (an urban, 35 m a.g.l site). We present CH4 isotope ratio datasets from these sites and aim to use them to interpret isotopic signatures in the surrounding areas.

[1] IPCC 2021. Cambridge University Press.

[2] Sherwood et al. 2017. Earth Syst. Sci. Data. 9, 639-656.

[3] Manning et al. 2021. Atmos. Chem. Phys. 21, 12739-12755.

[4] Ramsden et al. 2022. Atmos. Chem. Phys. 22, 3911-3929.

[5] Bakkaloglu et al. 2022. Atmos. Environ. 276, 119021.

[6] Menoud et al. 2020. Tellus B. 72, 1823733.

[7] Menoud et al. 2022. Earth Syst. Sci. Data. 14, 4365-4386.

[8] Röckmann et al. 2016, Atmos. Chem. Phys. 16, 10469-10487.

[9] Rennick et al. 2021. Anal. Chem. 93, 10141-10141.

How to cite: Safi, E., Kikaj, D., Röckmann, T., Chung, E., van Es, J., Rennick, C., van der Veen, C., Arnold, T., and Dasgupta, B.: The role of sampling height in interpreting methane isotope ratios for source attribution and inversion modelling, EGU General Assembly 2025, Vienna, Austria, 27 Apr–2 May 2025, EGU25-10857, https://doi.org/10.5194/egusphere-egu25-10857, 2025.

EGU25-11143 | Orals | BG2.2

Towards a calibration-free analysis of 15N site preference in N2O reference materials using matrix-isolation infrared spectroscopy 

Jonas Schlagin, Dennis Dinu, Klaus R. Liedl, Dominik Stolzenburg, Hinrich Grothe, and Joachim Mohn

In the global nitrous oxide (N2O) budget, various processes can influence the natural isotope abundances, often enriched with 15N with a site-specific preference δ15NSP that serves as a unique natural isotope tracer. Unlike δ18O and δ15Nbulk, δ15NSP is independent of the substrate’s isotopic signature and remains unchanged during N2O diffusion. However, while δ 15NSP can reveal mechanisms of N2O formation and reduction [1], distinguishing between production and consumption processes remains challenging due to overlapping isotopic signatures and variable fractionation factors. Current approaches, such as dual isotope plots (e.g., δ15NSP15Nbulk), help constrain dominant pathways but rely on experimental fractionation data. Which can be difficult considering that for the determination of 15NSP values with isotope ratio mass spectrometry (IRMS) methods it was shown that they are highly reliant on the choice of calibration with differences of up to 30 ‰ [2]. At the same time, laser absorption spectroscopy (LAS) of rotational-vibrational transition is prone to interferences by other trace gases, requires rigorous calibration and needs preconcentration units [3-4]. We propose using matrix-isolation Fourier-transform infrared (MI-FTIR) spectroscopy, which provides a calibration-free measurement of site-specific N2O isotopic composition by determining the absorption cross-section of the pure vibrational features of the respective isotopocules


[1] Toyoda, S., Yoshida, N. and Koba, K. (2017), Isotopocule analysis of biologically produced nitrous oxide in various environments. Mass. Spec. Rev., 36: 135-160

[2] Westley, M.B., Popp, B.N. and Rust, T.M. (2007), The calibration of the intramolecular nitrogen isotope distribution in nitrous oxide measured by isotope ratio mass spectrometry†. Rapid Commun. Mass Spectrom., 21: 391-405.

[3] Harris, E., Zeyer K., Kegel R., et al. (2015), Nitrous oxide and methane emissions and nitrous oxide isotopic composition from waste incineration in Switzerland. Waste Management, 35: 135-140


[4] Ostrom, N.E., Ostrom, P.H. (2017), Mining the isotopic complexity of nitrous oxide: a review of challenges and opportunities. Biogeochemistry, 132: 359–372.

How to cite: Schlagin, J., Dinu, D., Liedl, K. R., Stolzenburg, D., Grothe, H., and Mohn, J.: Towards a calibration-free analysis of 15N site preference in N2O reference materials using matrix-isolation infrared spectroscopy, EGU General Assembly 2025, Vienna, Austria, 27 Apr–2 May 2025, EGU25-11143, https://doi.org/10.5194/egusphere-egu25-11143, 2025.

EGU25-11217 | ECS | Posters on site | BG2.2

Addressing discrepancies in 13CKIE and DKIE values for the CH₄-OH oxidation 

ChihChang Chen, Getachew Adnew, Carina van der Veen, and Thomas Röckmann

Methane (CH₄) plays a critical role in the global carbon cycle, with its mole fraction currently 2.5 times higher than preindustrial levels. The increasing growth rate observed globally highlights the importance of accurate partitioning the atmospheric CH4. Oxidation of CH₄ by hydroxyl radicals (OH) in the troposphere accounts for approximately 85% of the global CH₄ sink. The resulting isotopic fractionation of δ13C-CH₄ and δD-CH₄ provides a valuable tool for understanding the global CH₄ budget. However, discrepancies exist in the reported kinetic isotope effect (KIE) values for CH₄ destruction by OH with 13CKIE ranging from 1.0036 to 1.010 and DKIE ranging from 1.25 to 1.31. These uncertainties significantly limit the precision of global CH₄ budget estimation.


This study aims to address these discrepancies by accurately characterizing the KIE values under varying temperature and pressure conditions. During the laboratory experiments, CH₄ is subjected to chemical reactions with OH, which is generated through the photolysis of vapor-phase hydrogen peroxide using a deep-UV light source (200-380 nm). To minimize interference from O(1D) reactions, a coated glass filter is employed. The photochemical reactions take place in a 5-liter, triple-quartz-layered reactor, maintained at stable pressure and temperature, with by-products removed using a low-temperature trap. The reactor is coupled to two Isotope Ratio Mass Spectrometers (IRMS), enabling continuous measurements of δ13C, δD, and δ18O in remaining CH₄ and CO throughout the experiment. By enhancing our understanding of CH₄-OH reaction kinetics under controlled conditions, this study can improve the accuracy of global CH₄ budget assessments and refine the distribution between fossil and biogenic CH4 sources.

How to cite: Chen, C., Adnew, G., van der Veen, C., and Röckmann, T.: Addressing discrepancies in 13CKIE and DKIE values for the CH₄-OH oxidation, EGU General Assembly 2025, Vienna, Austria, 27 Apr–2 May 2025, EGU25-11217, https://doi.org/10.5194/egusphere-egu25-11217, 2025.

EGU25-11425 | Posters on site | BG2.2

Expanding Isotope Ratio Analysis of Intact Molecules to Gas Phase Using a MION-Orbitrap System 

Hans-Jürg Jost, Henning Finkenzeller, Aleksei Shcherbinin, Fariba Partovi, and Joona Mikkilä

Orbitrap mass spectrometers have proven highly effective for isotope ratio analysis in liquid chromatography (LC)-coupled workflows, offering high precision and resolution. We introduce an innovative expansion of this capability to gas-phase isotope ratio analysis of intact molecules, eliminating the need for complex sample preparation and molecular conversion required in traditional isotope ratio mass spectrometry (IRMS).

The MION-Orbitrap system is optimized for direct gas-phase sample introduction, enabling precise and accurate isotope ratio measurements for carbon (13C/12C), hydrogen (2H/1H), nitrogen (15N/14N), and sulfur (34S/32S) on intact molecular species. Its capability for online analysis of ambient air further enhances its applicability. By bypassing conventional combustion or molecular conversion steps, this approach simplifies workflows, reduces handling time, and minimizes potential isotopic fractionation.

Preliminary experiments demonstrate the feasibility of this method and first results will be presented. By preserving molecular integrity during analysis, the system opens new avenues for investigating complex organic compounds in environmental chemistry, atmospheric processes, biogeochemical cycles, and plant metabolism.

We also address some of the remaining challenges in advancing this methodology, including the need for standardized reference materials for intact molecular isotope ratio measurements and the mitigation of potential matrix effects. These efforts are critical for ensuring accuracy, reproducibility, and broader adoption of gas-phase isotope ratio analysis.

How to cite: Jost, H.-J., Finkenzeller, H., Shcherbinin, A., Partovi, F., and Mikkilä, J.: Expanding Isotope Ratio Analysis of Intact Molecules to Gas Phase Using a MION-Orbitrap System, EGU General Assembly 2025, Vienna, Austria, 27 Apr–2 May 2025, EGU25-11425, https://doi.org/10.5194/egusphere-egu25-11425, 2025.

EGU25-12043 | ECS | Orals | BG2.2

Assessing drivers of uncertainty in simulating δ¹³C-CH4 at global scale 

Emeline Tapin, Antoine Berchet, Adrien Martinez, Malika Menoud, Xin Lan, Sylvia Michel, and Marielle Saunois

Methane (CH4), the second-largest contributor to global warming, necessitates a detailed examination of its sources and sinks to understand the recent rise in atmospheric CH4 mole fractions. Atmospheric isotopic signals, especially δ¹³C-CH4, offer critical insights for disentangling sectoral contributions and addressing these uncertainties.

This study focuses on enhancing our understanding of CH4 sources and sinks by incorporating updated δ¹³C-CH4 source signature datasets into atmospheric modeling. First, we updated these datasets to reflect the latest knowledge of methane emission processes. Next, we assessed the sensitivity of key modeling parameters such as atmospheric chemistry, the aggregation of δ¹³C-CH4 source signatures, and prior flux estimates on simulated CH4 signals and mole fractions. This analysis aims to validate the updated datasets and identify primary drivers of uncertainty in the simulations. We conducted forward modeling using the Global Circulation Model LMDZ coupled with the Community Inversion Framework (CIF), based on surface observations of methane and its isotopic signal from 1998 to 2022. These efforts lay the groundwork for improving the robustness of future isotopic inversions.

Building on these findings, our future work will focus on transitioning from forward simulations to atmospheric inversions to analyze global methane concentration trends. Initially, we will perform inversions using in-situ data from 1998 to 2022, leveraging the updated δ¹³C-CH4 source signature datasets and setups. Subsequently, we will analyze trends from 2018 to 2022 by integrating satellite observations of total methane columns with surface isotopic measurements. This approach utilizes the high-resolution, global coverage of TROPOMI (TROPOspheric Monitoring Instrument) onboard the Sentinel-5P platform, which measures column-averaged methane dry-air mole fractions X(CH4). By combining satellite and surface observations, we aim to enhance our ability to monitor methane dynamics and deepen our understanding of CH4 source and sink interactions. These advancements will provide critical insights for designing more effective climate mitigation strategies.

How to cite: Tapin, E., Berchet, A., Martinez, A., Menoud, M., Lan, X., Michel, S., and Saunois, M.: Assessing drivers of uncertainty in simulating δ¹³C-CH4 at global scale, EGU General Assembly 2025, Vienna, Austria, 27 Apr–2 May 2025, EGU25-12043, https://doi.org/10.5194/egusphere-egu25-12043, 2025.

EGU25-12431 | ECS | Orals | BG2.2

A multiplexing set-up of aquatic biological chambers to study the isotopic fractionation of oxygen: application to the interpretation of the δ18O of O2 records found in deep ice cores. 

Nicolas Bienville, Amaelle Landais, Sarah Fiorini, Clément Piel, Joana Sauze, Frédéric Prie, Olivier Joussoud, Simon Chollet, and Samuel Abiven

Earth atmospheric dioxygen is mainly produced by biosphere photosynthesis, and biosphere respiration is also one of the main consumers of this gas. The evolution of atmospheric O2 is thus linked to global biosphere productivity.


In ice cores we extract air from bubbles to study the composition of the past atmosphere. However, as O2 concentration in air bubbles is affected by close off processes, it is difficult to reconstruct its variations in the past atmosphere from ice core analyses. In turn, the isotopic composition of O218O and δ 17O), is also influenced by biological processes and is less influenced by close-off processes so that this tracer should provide useful information on the past biosphere activity.


Quantitative interpretation of the isotopic composition of O2 in the past relies on robust estimate of oxygen fractionation coefficients associated with the relevant biological processes: photosynthesis and respiration. In the past decades, some determinations of these biological fractionation coefficients were performed in uncontrolled large-scale environments or at the scale of the micro-organisms in conditions very different from the natural environment. There are thus inconsistencies in previous determinations of the O2 fractionation coefficients limiting the interpretation of δ18O and δ 17O of O2.


In order to come up with coherent estimates of oxygen fractionation coefficients during biological processes, we developed closed biological chambers as a biosphere replica, with controlled environment parameters (light, temperature, CO2 concentration), which were used in combination with a newly designed optical spectrometer for continuous measurements of O2 concentration and of its isotopic composition.


In this presentation, we show the design and realisation of our aquatic biological chambers as well as the associated development of the multiplexing system to be able to run parallel experiments with the same environmental conditions. Then, we show the results obtained for light and dark periods, and the corresponding fractionation coefficients calculated for photosynthesis and respiration. Finally, we use the newly determined fractionation coefficients to improve interpretation of the δ18O of O2 record in air bubbles from ice cores.

How to cite: Bienville, N., Landais, A., Fiorini, S., Piel, C., Sauze, J., Prie, F., Joussoud, O., Chollet, S., and Abiven, S.: A multiplexing set-up of aquatic biological chambers to study the isotopic fractionation of oxygen: application to the interpretation of the δ18O of O2 records found in deep ice cores., EGU General Assembly 2025, Vienna, Austria, 27 Apr–2 May 2025, EGU25-12431, https://doi.org/10.5194/egusphere-egu25-12431, 2025.

EGU25-13223 | Orals | BG2.2

Modeling the sulfur isotopic signature of marine carbonyl sulfide emissions 

Sinikka Lennartz, Alon Amrani, Yasmin Avidani, Chen Davidson, Heike Simon, and Alon Angert

Carbonyl sulfide (OCS), the most abundant sulfur-containing trace gas in Earth's atmosphere, plays a central role in stratospheric aerosol formation and can serve as a proxy for terrestrial carbon dioxide uptake. In this context, quantifying its atmospheric sources and sinks is of great interest, but especially the role of marine emissions is poorly constrained. Analysis of sulfur isotopic ratios (34S/32S; d34S) is a valuable tool to quantify the relative contributions of different sources to the atmospheric budget of OCS. However, the d34S values for marine OCS emissions are based on a data set that has so far been limited to a few measurements in coastal and shelf areas. Here, we present a first global ocean mixed-layer model of OCS sulfur isotopes, building on experimentally derived fractionation factors for the most important biogeochemical processes of marine OCS cycling, i.e. photochemical production, dark production and degradation by hydrolysis. The model is tested against incubation experiments and novel measurements along an Atlantic transect. We calculate the d34S values of marine OCS emissions, with the ultimate aim to decipher their relative contributions to the atmospheric budget. Our simulations show regional and temporal variations in the d34S values of OCS, suggesting a distinct latitudinal gradient with lower d34S in the tropics and higher d34S in high latitudes. The spatially weighted average of d34S values of OCS is used to update a global mass balance approach to infer the role of direct marine emissions of OCS in the atmospheric budget.

How to cite: Lennartz, S., Amrani, A., Avidani, Y., Davidson, C., Simon, H., and Angert, A.: Modeling the sulfur isotopic signature of marine carbonyl sulfide emissions, EGU General Assembly 2025, Vienna, Austria, 27 Apr–2 May 2025, EGU25-13223, https://doi.org/10.5194/egusphere-egu25-13223, 2025.

EGU25-13314 | Orals | BG2.2

Atlantic Meridional Transect of polyisotopic carbon dioxide: Challenges of ship-based laser spectroscopy and implications for atmosphere-biosphere exchange 

Jan Kaiser, Penelope A. Pickers, Grant L. Forster, Alina Marca, Richmal B. Paxton, and Barry McManus

During the AMT31 research cruise (Southampton–Montevideo, December 2024), we measured CO2 polyisotopologues using a tuneable infrared laser direct absorption spectrometer (Aerodyne TILDAS-FD-L2). Dried marine air from an inlet at the bow of the ship was alternated with a working reference every 2 min to correct for instrument drift.

Compared with land-based measurements, ship motion (roll, pitch, heave) was found to deteriorate isotope ratio precision by a factor of 3 to 10 (depending on the sea state). However, after averaging over hourly intervals, precisions better than 0.05 µmol mol–1 for y(CO2) and better than 0.03 ‰ for δ(13C), δ(18O) and δ(17O) were achieved. For the 17O isotope excess, Δ(17O), hourly precision was often better than 10 ppm (0.01 ‰), but unfortunately, target tank results showed unexplained day-to-day variability of the order of ±35 ppm.

Preliminary corrections for this day-to-day variability indicate that southern hemisphere δ(18O) is 1.2–1.8 ‰ higher and Δ(17O) is about 60 ppm higher than northern hemisphere marine background air. This interhemispheric Δ(17O) gradient is twice as high as predicted by atmosphere-biosphere exchange models (Koren et al., 2019) and could indicate a stronger than expected influence of the 17O-enriched stratospheric return flux in austral spring or a stronger biospheric exchange signal in boreal autumn.

How to cite: Kaiser, J., Pickers, P. A., Forster, G. L., Marca, A., Paxton, R. B., and McManus, B.: Atlantic Meridional Transect of polyisotopic carbon dioxide: Challenges of ship-based laser spectroscopy and implications for atmosphere-biosphere exchange, EGU General Assembly 2025, Vienna, Austria, 27 Apr–2 May 2025, EGU25-13314, https://doi.org/10.5194/egusphere-egu25-13314, 2025.

EGU25-13624 | Posters on site | BG2.2

Advancing Greenhouse Gas Isotopic Measurements: Evaluating the Compatibility and Efficiency of Picarro Gas Autosampler with Picarro Isotopic Analyzers 

Keren Drori, Joyeeta Bhattacharya, Magdalena Hofmann, Jan Woźniak, and Tina Hemenway

The greenhouse gas research community faces a growing demand for automated solutions tailored to isotopic measurements of greenhouse gases (e.g., isotopic CO2/CH4). Traditional solutions often entail significant initial and maintenance costs, intricate deployment and maintenance processes, and limited fieldwork adaptability. Anticipating this challenge, the Picarro Gas Autosampler is poised to attract growing interest for its anticipated compatibility with Picarro isotopic Carbon analyzers featuring low flow rates (<50 scc/m), promising efficient isotopic measurements. This report delves into the compatibility, efficiency, and advantages of the Picarro Gas Autosampler when paired with the Picarro G2201-i analyzer. Our experiments showcase remarkable precision and accuracy in isotopic measurements of greenhouse gases. Additionally, we explore factors such as linearity in dilution factors and characterize memory effects and variability across different gas species (e.g., comparing CO2 vs CH4). Moreover, the report offers practical recommendations on methods and best practices for conducting isotopic measurements of greenhouse gases. In summary, the Picarro Gas Autosampler, when combined with the Picarro G2201-i analyzer, emerges as a compelling, cost-effective, and user-friendly solution for isotopic measurements of greenhouse gases, offering a distinct advantage over traditional alternatives.

How to cite: Drori, K., Bhattacharya, J., Hofmann, M., Woźniak, J., and Hemenway, T.: Advancing Greenhouse Gas Isotopic Measurements: Evaluating the Compatibility and Efficiency of Picarro Gas Autosampler with Picarro Isotopic Analyzers, EGU General Assembly 2025, Vienna, Austria, 27 Apr–2 May 2025, EGU25-13624, https://doi.org/10.5194/egusphere-egu25-13624, 2025.

EGU25-13790 | ECS | Orals | BG2.2

Compositional analysis and isotope sourcing of gases generated from self-heating coal waste dump: the case study from France 

Yaroslav Bezyk, Dariusz Strąpoć, Maciej Górka, Łukasz Kruszewski, Jarosław Nęcki, Dariusz Więcław, Carina van der Veen, and Thomas Röckmann

The accumulation of organic matter in coal waste dumps can result in self-heating or spontaneous ignition, which lead to the release of various gaseous products into the atmosphere. GHGs and trace compounds emitted from self-heating coal waste dump located in the Nord-Pas-de-Calais region of Northern France were investigated under this study in September 2024. Tracking hotspot locations across coal waste dump confirmed various patterns of temperature and gaseous emissions from the investigated area. The temperature measured in boreholes drilled to the depth up to 0.6 meters on the top and slopes of the dump ranged between +51.0 and +83.1 °C. The non-uniform subsurface temperatures can be explained by the varied content of coal and carbon-containing rocks deposited at the dump, along with the diverse air inflow to the thermally active sites. The composition and source of the gaseous compounds emitted during self-heating were directly influenced by the various thermal activity stages and properties of the organic matter present in the dump.

Different generation patterns of released gases are related to the self-heating stage, including exothermic oxidation and pyrolysis. At thermally active sites (but below +68 °C) on the top of the dump (well-ventilated with free access of oxygen) the emission included CO2 12.8 vol%. Otherwise, at the sites on the wet dump slope (preventing oxygen entering), where prominent thermal activity was noted (temperature rise of about 80 ºC), the switch to pyrolysis was confirmed by showing a peak of CO2 (18.3 vol%), with a significant drop in O2 content (1.48 vol%). Apart from CO2, much higher was the concentration of CH4 reaching 4260 ppmv, and CO averaging 54 ppmv, above background H2, high levels of pyrolytic ethane 327 ppmv and propane 69 ppmv as well as C4 – C6 hydrocarbons.

The generation processes of the gases on both types of sites were confirmed by C and H isotopic analyses (CO2, CH4, C2H6, H2) and will be discussed in detail during the presentation of the paper. Recapitulating, the stable isotope tracing of the emitted gases was useful and can also be indicative for future monitoring of the thermal stage of self-heating coal waste dumps. Additionally, sulfur and nitrogen heterocyclic compounds such as furane, thiophene, and pyridine were detected in trace quantities. Although substantial amounts of gasses (mainly CO2 and CH4) escaped from the emission hotspot on the dump, their concentrations measured above the surface at sites without thermal activity were not significantly higher than local background levels. The surface flux mapping of entire dump, depth profiling of temperature and gas concentrations, their generative and degradation processes will be the main areas of future investigations.


This work was funded by the Polish Ministry of Science and Higher Education under Grant No. 2022/44/C/ST10/00112. The isotopic analysis has been supported by the ATMO-ACCESS (grant agreement No. ATMO-TNA-4—0000000041 and No. C1-ISOLAB/CESAR-9).

Acknowledgment for organization of and assistance during the onsite measurements and samples acquisition on the dump to Fabrice Quirin, Vincent Adam, Gaetan Bentivegna from Bureau de Recherches Géologiques et Minières, Unité Territoriale Après-Mine Nord, Billy-Montigny, France.

How to cite: Bezyk, Y., Strąpoć, D., Górka, M., Kruszewski, Ł., Nęcki, J., Więcław, D., van der Veen, C., and Röckmann, T.: Compositional analysis and isotope sourcing of gases generated from self-heating coal waste dump: the case study from France, EGU General Assembly 2025, Vienna, Austria, 27 Apr–2 May 2025, EGU25-13790, https://doi.org/10.5194/egusphere-egu25-13790, 2025.

EGU25-14132 | ECS | Posters on site | BG2.2

Simulating Long-Term Trends and Seasonal Dynamics of Carbon Isotopes in Atmospheric CO2 Using a 3D Transport Model 

Uddalak Chakraborty, Naoko Saitoh, Prabir Patra, Naveen Chandra, Dmitry Belikov, and Marko Scholze

Carbon Dioxide (CO2), the primary anthropogenic greenhouse gas (GHG), plays a significant role in global warming. Earth’s global surface air temperate was higher by 1.09 °C in 2011–2020 than in 1850–1900. This rise is overwhelmed by 47% in atmospheric CO2 during the period (IPCC AR6, 2021). Analysis of carbon isotopes (13C and 14C) of CO2 plays a pivotal role in separating the anthropogenic and natural carbon release and uptake across land, ocean and atmosphere carbon pools. Despite their utility to understand carbon cycle dynamics, simulating the seasonal variations and long-term trends of 13C and 14C remains challenging. Bridging of the budget gaps requires robust modeling approaches to simulate the isotopic exchange fluxes since the rapid increase in fossil fuel emissions began in the 1950s.

This study has quantified the monthly exchange fluxes of 13C and 14C between the atmosphere and terrestrial biosphere, and between the atmosphere and ocean, as well as 13C and 14C emissions from fossil fuel, nuclear bomb tests, and nuclear power plants, for the period from 1940 to 2020. We have used fossil fuel emissions from GridFED (Jones et al., 2023), land biosphere fluxes are taken from LENS, LPJ and VISIT (NCAR ref., Scholze et al., 2008, Ito et al., 2007), and ocean exchange fluxes are taken from CESM2, LENS (NCAR ref., Danabasoglu et al., 2020). The Model for Interdisciplinary Research on Climate version 4 (MIROC4) atmospheric general circulation model (AGCM)-based chemistry-transport model (referred to as MIROC4-ACTM) has been used for the simulation of the prepared fluxes of 13C and 14C.

Our model simulated the observed concentrations of Δ14C at Jungfraujoch (JFJ; ICOS ref., Levin et al., 2021) and Baring Head (BHD; NIWA ref., Turnbull et al., 2007); e.g., the rise from -24.3 ‰ to 272.4 ‰ during 1950−1960, followed by a slow (near exponential) decay during 1965 to 2020. The two model cases using LENS and LPJ land model fluxes showed noticeable differences during 1970s. The model simulations of δ13C were compared with nine sites of SIO (Keeling et al., 2001); they successfully reproduced the long-term declining trend driven by the Suess Effect, which is the isotopic depletion of atmospheric CO2 caused by the combustion of δ¹³C-depleted fossil fuels. Seasonal variations were well captured, with enriched δ¹³C during photosynthetic periods (summer) and depleted δ¹³C during respiration periods (winter). In our simulations, the interhemispheric gradient in δ¹³C was evident, with stronger seasonal cycles and steeper declines in the Northern Hemisphere (e.g., Barrow, Mauna Loa) due to proximity to major anthropogenic CO2 sources, while Southern Hemisphere sites (e.g., Baring Head, South Pole) showed weaker seasonal variations, reflecting the dominance of ocean uptake and isotopic mixing. Discrepancies in Δ¹⁴C during 1955–1965 and 1980–2000 due to uncertainties in bomb-test emissions and biospheric uptake fluxes remain a challenge in accurately reproducing the observations.

How to cite: Chakraborty, U., Saitoh, N., Patra, P., Chandra, N., Belikov, D., and Scholze, M.: Simulating Long-Term Trends and Seasonal Dynamics of Carbon Isotopes in Atmospheric CO2 Using a 3D Transport Model, EGU General Assembly 2025, Vienna, Austria, 27 Apr–2 May 2025, EGU25-14132, https://doi.org/10.5194/egusphere-egu25-14132, 2025.

EGU25-14144 | ECS | Orals | BG2.2

Source apportionment and evolution of reactive nitrogen in an East Asian mountain forest: A dual-isotope and modeling approach 

Wen-Chien Lee, Ming-Hao Huang, Wei-Chieh Huang, Jen-Ping Chen, Haojia Ren, and Hui-Ming Hung

Anthropogenic activities have led to a rapid increase of reactive nitrogen (Nr) in the Earth system, contributing to climate change, biodiversity loss, acid deposition, and air pollution. Among Nr species, particulate ammonium (pNH4+) and nitrate (pNO3) derived from ammonia (NH3) and nitrogen oxides (NOx) are key pollutants affecting air quality. However, their sources and formation pathways vary by location and remain poorly understood. This study investigates the sources and atmospheric processing of Nr in an East Asian mountain forest, using nitrogen (δ15N) and oxygen (δ18O) isotope compositions of pNH4+ and pNO3. A field campaign was conducted in Xitou, Taiwan (23.40°N, 120.47°E, 1179 m above sea level) from April 17 to 24, 2021. Size-segregated aerosol particles ranging from 0.056 to 18 µm were collected using a micro-orifice uniform deposit impactor (MOUDI) and analyzed for mass concentrations and isotopic compositions using Fourier-transform infrared spectroscopy with attenuated total reflection (FTIR-ATR) and gas chromatography-isotope ratio mass spectrometer (GC-IRMS), respectively. Additionally, a stable isotope mixing model (MixSIAR) was applied to quantify source contributions of Nr based on δ15N signatures. Xitou, located downstream of metropolitan coastal areas during the daytime, receives air pollutants transported inland by sea breezes and valley winds, combined with local emissions. During the campaign, the average mass concentrations of pNH4+ and pNO3 were 3.7 and 2.4 µg m−3, respectively. The mean δ15N values of pNH4+ (10.8 ± 2.7‰) and pNO3 (−3.0 ± 2.0‰) reflect their emission sources and isotopic fractionation during gas-particle partitioning. δ18O values of pNO3 ranged from 32.0‰ to 73.3‰, indicating distinct chemical formation pathways: pNO3 formed via O3 reactions exhibited higher δ18O values, while those formed via peroxy radicals (RO2) had lower values. Two distinct groups of pNO3 were identified based on δ15N-pNO3and δ18O-pNO3 signatures. The first group, characterized by higher δ15N (−5.6 to 0.8‰) and δ18O (55 to 83‰), likely formed in metropolitan areas via O3 oxidation before being transported to the mountain observation site. The second group, consisting of smaller particles with lower δ15N (−10.1 to −2.1‰) and δ18O (8.6 to 38‰), was likely produced locally with RO2 as the dominant oxidant. Source apportionment analysis of δ15N revealed that combustion-related sources, including fossil fuel combustion and NH3 slip, accounted for 63% of NH3 emissions, while anthropogenic NOx sources such as biomass burning, coal combustion, and mobile sources contributed approximately 68% of total NOx emissions. These findings highlight the importance of targeted emission control policies to reduce Nr pollution and mitigate its adverse environmental impacts, including air quality degradation and ecosystem harm.

How to cite: Lee, W.-C., Huang, M.-H., Huang, W.-C., Chen, J.-P., Ren, H., and Hung, H.-M.: Source apportionment and evolution of reactive nitrogen in an East Asian mountain forest: A dual-isotope and modeling approach, EGU General Assembly 2025, Vienna, Austria, 27 Apr–2 May 2025, EGU25-14144, https://doi.org/10.5194/egusphere-egu25-14144, 2025.

EGU25-14260 | ECS | Posters on site | BG2.2

Multi-model Insights into δ13C-CH4 from Arctic Permafrost Thermokarsts 

Kevin Rozmiarek, Youmi Oh, Xiangyu Liu, Irina Overeem, Elijah Miller, Valerie Morris, Bruce Vaughn, Nicholas Hasson, Brooke Chase, Katey Walter Anthony, Qianlai Zhuang, Gregory Rieker, and Tyler Jones

Methane is experiencing an accelerating increase in the atmosphere globally. Of the tools researchers have to diagnosis and determine the cause of rapidly changing sources and sinks of methane, its carbon isotope composition, δ13C-CH4, is a promising option to reduce uncertainty and provide constraints on methane atmospheric inversions. A building consensus in literature points towards wetland emissions as the driving force behind increase emissions, yet our ability to be prescriptive of the wetland δ13C-CH4 flux remains uncertain. Of wetlands, northern permafrost and its thaw features add additional complexities just as they add a large potential carbon stock for future methane release. Early models attempting to determine the δ13C-CH4 of permafrost thaw predict that these landscapes will be isotopic endmembers, more depleted than any source on the planet. How does this prediction hold up against observations when downscaled to the site level?

We present an intercomparison between observations and two isotope-enabled methane production models targeting the thaw feature Big Trail Lake outside Fairbanks, Alaska. We compare the isotope-enabled version of the terrestrial ecosystem model–methane dynamics module (isoTEM) to the Arctic Lake Biogeochemistry Model (ALBM) with an added isotope mass balance. We benchmark both model runs against methane eddy-flux data and flask-collected methane isotope measurements onsite. Through this multi-model-observation intercomparison, we evaluate model mismatch of δ13C-CH4 flux at Big Trail Lake and evaluate how model physics can be improved to better capture permafrost thaw δ13C-CH4 flux for use in constraining atmospheric inversions.

How to cite: Rozmiarek, K., Oh, Y., Liu, X., Overeem, I., Miller, E., Morris, V., Vaughn, B., Hasson, N., Chase, B., Walter Anthony, K., Zhuang, Q., Rieker, G., and Jones, T.: Multi-model Insights into δ13C-CH4 from Arctic Permafrost Thermokarsts, EGU General Assembly 2025, Vienna, Austria, 27 Apr–2 May 2025, EGU25-14260, https://doi.org/10.5194/egusphere-egu25-14260, 2025.

EGU25-15335 | Orals | BG2.2

New experiments and quantum-molecular mechanics model of isotopic fractionation in formaldehyde photolysis explains atmospheric dD-H2 anomaly  and shows extreme isotopic fractionation in CO 

Matthew Johnson, Luisa Pennacchio, Zacharias Liasi, Andreas Erbs Hillers-Bendtsen, Thomas Röckmann, and Kurt Valentin Mikkelsen

Formaldehyde is a short-lived intermediate formed by the oxidation of virtually every VOC in the atmosphere. It is the source of half of atmospheric hydrogen, and a large source of CO and CO2, and plays a role in particle growth. Efforts to better understand the remarkable transformations of formaldehyde are hindered due to lack of knowledge of some of the basic processes in formaldehyde photolysis. Here, we present a combined quantum and molecular mechanics, Rice–Ramsperger–Kassel–Marcus (RRKM) and experiment-based model that significantly advances our ability to describe photolytic kinetic isotope effects and their pressure dependencies. RRKM theory was used to calculate the decomposition rates of the S0, S1 and T1 states using CCSD(T)/aug-cc-pVTZ, ωB97X-D/aug-cc-pVTZ and CASPT2/aug-cc-pVTZ levels of theory. Experimental internal conversion and intersystem crossing rates were used and modified with the density of states of the isotopologues based on Fermi’s ‘Golden Rule’. The following isotopologues of formaldehyde were investigated: HCHO, DCHO, DCDO, D13CHO, H13CHO, HCH17O, HCH18O, HC13H17O and HC13H18O. The method and mechanism were validated by comparison to all existing and newly obtained experimental data. The model was able to accurately replicate the experimental pressure trends of the kinetic isotope effects (KIEs) and was in excellent agreement. The model was used to predict the KIEs and the molecular hydrogen yields of the deuterated species at varying altitudes.

How to cite: Johnson, M., Pennacchio, L., Liasi, Z., Erbs Hillers-Bendtsen, A., Röckmann, T., and Mikkelsen, K. V.: New experiments and quantum-molecular mechanics model of isotopic fractionation in formaldehyde photolysis explains atmospheric dD-H2 anomaly  and shows extreme isotopic fractionation in CO, EGU General Assembly 2025, Vienna, Austria, 27 Apr–2 May 2025, EGU25-15335, https://doi.org/10.5194/egusphere-egu25-15335, 2025.

EGU25-15597 | Posters on site | BG2.2

Temporal Variations and Influencing Factors on Atmospheric CO2 in Urban Environments: A Stable Isotope Perspective 

Sergio Gurrieri and Roberto M.R. Di Martino

Volcanoes are primary geological sources of carbon dioxide (CO2), while the combustion of fossil fuels significantly contributes to raise the CO2 concentration in the atmosphere, particularly within densely populated urban areas. Previous investigations have identified distinct sources of CO2 at the district scale in urban environments and that the short term evolutions in atmospheric CO2 concentration are influenced by meteorological parameters.

This study presents continuous monitoring of stable isotope compositions and CO2 concentrations in the urban environment of Palermo over a yearly period from 2023 to 2024. A laser-based isotope mass spectrophotometer was employed for measurements, detecting various isotopologues of CO2 (e.g., COO, 13COO, and C18OO isotopologues) through mid-infrared range laser absorption. The instrument calculated the 13C/12C ratio, 18O/16O ratio, and overall CO2 concentration. Measurements were conducted outside the Istituto Nazionale di Geofisica e Vulcanologia (INGV) laboratory at an elevation of 16.30 meters above the ground floor, referenced hourly, and calibrated daily using a known stable isotope composition standard of pure CO2.

Environmental parameters, including air temperature, atmospheric pressure, relative humidity, solar radiation and wind speed and direction, were recorded at a 5-minute sampling frequency. These data were utilized for processing the atmospheric CO2 dataset. The correlation between stable isotopic ratios and CO2 concentration, analyzed through the "Keeling plot" approach, enabled the determination of the isotopic signature of the predominant source of atmospheric CO2 in the Palermo urban zone.

The results indicated that wind speed and atmospheric pressure exerted opposing effects on atmospheric CO2 concentration. Elevated CO2 levels coincided with periods of high atmospheric pressure and low wind speed, while reduced CO2 concentrations were associated with increased air turbulence during windy periods. However, meteorological variables partly explain the variability in atmospheric CO2, considering contributions from various CO2 sources. The δ13C-CO2 measurements aligned with CO2 derived from fossil fuel combustion, attributed to urban vehicular mobility and residential heating, particularly during winter periods.

Analysis indicates that CO₂ levels in medium-sized urban areas like Palermo exhibit distinct seasonal and daily variations. Seasonal shifts primarily reflects CO2 emissions from hydrocarbon combustion during winter which was unbalanced by CO₂ uptake during productivity season (spring and summer). On the weekly timescale, CO₂ variations reflect population behaviors. CO2 concentrations are lowest during weekends and holiday periods contrasting raises of CO2 concentration on weekdays and in periods of atmospheric stability, especially in winter. Urban-scale observations, where the majority of greenhouse gases are emitted, allow for tracking high-frequency variations driven by environmental conditions and changes in human activities. Monitoring CO₂ in urban areas offers crucial insights for assessing the effectiveness of climate change mitigation measures.

How to cite: Gurrieri, S. and Di Martino, R. M. R.: Temporal Variations and Influencing Factors on Atmospheric CO2 in Urban Environments: A Stable Isotope Perspective, EGU General Assembly 2025, Vienna, Austria, 27 Apr–2 May 2025, EGU25-15597, https://doi.org/10.5194/egusphere-egu25-15597, 2025.

EGU25-16221 | Posters on site | BG2.2

An absolute reference frame for nitrous oxide position-specific and clumped isotopic measurements 

Paul Magyar, Nico Kueter, Naizhong Zhang, Noémy Chénier, Lukas Emmenegger, Béla Tuzson, and Joachim Mohn

Stable isotopes are a powerful tool for constraining the sources and sinks of nitrous oxide (N2O), essential for identifying and mitigating the climate and air quality impacts of N2O emissions. Site preference (SP), the position-specific N stable isotope incorporation in N2O (14N15N16O vs 15N14N16O), has proven especially useful. Measurements of the clumped isotopologues 14N15N18O, 15N14N18O, and 15N15N16O are emerging as new constraints on the processes of N2O formation and destruction. An advantage of clumped and position-specific isotopic systems over conventional stable isotopes is the existence of an absolute reference frame: under equilibrium conditions, isotopes are randomly distributed among molecules at high temperatures, and deviations from this random distribution at lower temperatures can be both predicted by thermodynamic modelling and measured.

We use quantum cascade laser adsorption spectroscopy to measure the seven-dimensional stable isotopic composition of N2O (δ15N, δ18O, ∆17O, SP, ∆14N15N18O, ∆15N14N18O, and ∆15N15N16O). This spectroscopic approach provides key benefits for standardization studies, including the ability to measure each isotopologue directly without the need for the fragmentation and rearrangement corrections required by mass spectrometric methods. In addition, the ability to measure a sample in replicate (n = 3) in <30 min with precision better than ±0.3‰ for all isotopologues increases the throughput of N2O clumped isotope measurements and improves greatly on previous analytical approaches.

We present results for N2O equilibrated over g-alumina, which has been identified as a catalyst for the N-O isotope exchange equilibria, at temperatures between 170 °C and 230 °C. This range of temperatures represents an optimum where the kinetics of isotope exchange reactions outpace N2O thermal decomposition but proceed fast enough for readily repeatable experiments. Additionally, this range of temperatures is associated with a predicted variation in SP of 4.6‰, suitable for evaluating the temperature dependency of reactions among N2O isotopologues. We find the catalytic activity of g-alumina to be sensitive to its conditions of activation and to the N2O/catalyst ratio. We report equilibration and analyses of gases of a wide variety of starting isotopic compositions to demonstrate the equilibrium nature of these reactions by the principle of bracketing, to document the kinetics of isotope exchange for each isotopologue, and to establish a set of reference gases suitable for robust two-point calibration in all isotopic dimensions.

How to cite: Magyar, P., Kueter, N., Zhang, N., Chénier, N., Emmenegger, L., Tuzson, B., and Mohn, J.: An absolute reference frame for nitrous oxide position-specific and clumped isotopic measurements, EGU General Assembly 2025, Vienna, Austria, 27 Apr–2 May 2025, EGU25-16221, https://doi.org/10.5194/egusphere-egu25-16221, 2025.

EGU25-16416 | ECS | Posters on site | BG2.2

A comprehensive carbon isotopic analysis of seasonal carbon dioxide variability from an urban environment in Hungary 

Balázs Áron Baráth, Tamás Varga, István Major, Sándor Bán, Zoltán Barcza, László Haszpra, Thomas Röckmann, Jacoline van Es, Carina van der Veen, and Mihály Molnár

Urban areas as important sources of industrial and transport emissions, have a key impact on the atmospheric greenhouse gas trends. In order to study these emissions we collected atmospheric air samples at the HUN-REN Institute for Nuclear Research (ATOMKI) of Debrecen, Hungary, in three different seasons (winter, spring and summer). Sampling was done to reflect differences between weekdays and weekends and between morning and afternoons. For this study we collected at least 23 samples each season. We compared carbon dioxide (CO2) concentration and radiocarbon (14C) results with observations from the Hungarian ICOS (Integrated Carbon Observation System) regional background station. Within the project, stable isotope analysis was performed at Utrecht University while CO2 mole fraction and 14C were measured at ATOMKI.

The results show that depleted δ13C and Δ14C values observed during morning hours -especially winter- may indicate fossil fuel emission sources.  On the other hand, summer shows enriched isotopic values because of the stronger biogenic uptake. We analyzed strong correlations between δ¹³C and Δ¹⁴C values in winter, compared to weaker correlations in spring, suggesting that isotopic signals may be influenced by different processes depending on the season. The findings provide important information in the field of carbon isotopic measurements that could simplify distinguishing between CO2 sources or understanding seasonal shifts between biogenic and anthropogenic sources.

Project number C2295145 has been implemented with the support provided by the Ministry of Culture and Innovation of Hungary from the National Research, Development and Innovation Fund, financed under the KDP-2023 finding scheme.

How to cite: Baráth, B. Á., Varga, T., Major, I., Bán, S., Barcza, Z., Haszpra, L., Röckmann, T., van Es, J., van der Veen, C., and Molnár, M.: A comprehensive carbon isotopic analysis of seasonal carbon dioxide variability from an urban environment in Hungary, EGU General Assembly 2025, Vienna, Austria, 27 Apr–2 May 2025, EGU25-16416, https://doi.org/10.5194/egusphere-egu25-16416, 2025.

EGU25-16768 | ECS | Posters on site | BG2.2

Numerical simulation of the impact of atmospheric OH variability on the global mean δ13C(CH4) trend. 

Anna-Leah Nickl, Patrick Jöckel, Franziska Winterstein, and Anja Schmidt

The hydroxyl radical (OH) serves as a primary sink for CH4 in the atmosphere and plays an important role in interpreting the global CH4 budget. Changes in the OH trend have recently been proposed as a potential explanation for the renewed increase of CH4 and the simultaneous decrease in δ13C(CH4) since 2007. In this work, we introduce comprehensive numerical sensitivity simulations to explore the impact of temporal OH variations on the globally averaged CH4 mixing ratio and δ13C(CH4) signature. We apply the state-of-the-art global chemistry-climate model EMAC and use a simplified approach to simulate methane loss. Our simulations apply different OH fields, including climatologically described and transient OH fields, and assume moderate changes in the CH4 tropospheric lifetime. We also consider methane isotopologues and the kinetic isotope effects in physical and chemical processes. The setup uses recent CH4 emission inventories and accounts for regional differences in the isotopic signatures of individual emission source categories. Our results suggest that the influence of an OH reduction on the global δ13C(CH4) is rather small and does not explain the observed trend in CH4. Additionally, we examine the impact of the latitudinal OH distribution on the relative contribution of different emission source categories to the global CH4 rise and the global mean surface δ13C(CH4).

How to cite: Nickl, A.-L., Jöckel, P., Winterstein, F., and Schmidt, A.: Numerical simulation of the impact of atmospheric OH variability on the global mean δ13C(CH4) trend., EGU General Assembly 2025, Vienna, Austria, 27 Apr–2 May 2025, EGU25-16768, https://doi.org/10.5194/egusphere-egu25-16768, 2025.

EGU25-17262 | ECS | Orals | BG2.2

Modelling the triple-isotopic composition of dissolved oxygen using a 3D Earth System Model of intermediate complexity 

Emeline Clermont, Ji-Woong Yang, and Didier M. Roche

Marine photosynthesis (or gross primary productivity, GPP) is one of the main mechanisms for carbon fixation and global oxygen formation, contributing around half of the oxygen produced on Earth and sustaining aquatic ecosystem. Understanding the mechanisms that regulate GPP is essential for gaining insights into biological oxygen and carbon cycles. The combined study of GPP with net primary productivity (NPP) and net community productivity (NCP) will greatly improve our understanding of the interactions between biological processes, linking photosynthesis, respiration and the carbon cycle.

The triple isotopic composition of dissolved oxygen has been proposed as a tracer of gross oxygen productivity in aquatic ecosystem (Luz & Barkan, 2000).  The reasoning behind this is that the ∆17O of dissolved O2 is determined by two main end-members: the marine photosynthesis (∆17O ~ 249 ppm) and the atmospheric O2 (∆17O ~ 8 ppm), as ∆17O is not much affected by other processes that fractionate oxygen in a mass-dependent manner. However, subsequent studies have highlighted potential sources of uncertainty or bias in this proxy. Uncertainties about fractionation factors and transport parameters call the tracer into question (Levine et al., 2009; Nicholson et al., 2014; Li et al., 2022).

To address this issue, we have recently implemented the triple isotopic composition (δ17O and δ18O) of dissolved O2 into the 3D Earth System Model of intermediate complexity, iLOVECLIM. We will present our preliminary results of model comparing them with observation and discussing sensitivity experiments; we further compare our results to previous findings that used 1D or 2D modeling approaches.

How to cite: Clermont, E., Yang, J.-W., and Roche, D. M.: Modelling the triple-isotopic composition of dissolved oxygen using a 3D Earth System Model of intermediate complexity, EGU General Assembly 2025, Vienna, Austria, 27 Apr–2 May 2025, EGU25-17262, https://doi.org/10.5194/egusphere-egu25-17262, 2025.

EGU25-17599 | Posters on site | BG2.2

In-situ atmospheric measurements of CO2 polyisotopologues at Weybourne Atmospheric Observatory in the United Kingdom 

Penelope Pickers, Grant Forster, Jan Kaiser, Alina Marca, Andrew Manning, Richmal Paxton, and Tim Arnold

The δ18O signature of atmospheric CO2 can be used as a tracer for estimating gross primary production (GPP), however, this method requires having detailed knowledge of δ18O signatures of numerous water reservoirs and isotopic fractionation associated with transfer processes, which are highly variable due to the complexity of the hydrological cycle. Simultaneous measurements of δ18O-CO2 and δ17O-CO2 can simplify this requirement, since variations in δ17O are, for most processes, strongly correlated with variations in δ18O. Thus, it is possible to combine measurements of δ18O-CO2 and δ17O-CO2 into a tracer that removes the mass-dependent fractionations related to the hydrological cycle, known as the ‘triple oxygen isotope excess’ (Δ17O). Variability in Δ17O only depends weakly on the oxygen isotope signatures of soil and leaf water and should therefore in principle be a more direct tracer for GPP than variations in δ18O alone.

We present a 2.5-year record (2021-2024) of atmospheric δ13C-CO2, δ18O-CO2, δ17O-CO2, Δ17O, and CO2 mole fraction measurements at Weybourne Atmospheric Observatory on the north Norfolk coast in the UK (52º 57’ N, 1º 07’ E). Measurements are made in-situ every 4 minutes using a tuneable infrared laser direct adsorption spectroscopy (TILDAS) dual-laser analyser from Aerodyne Research Inc. We present observed atmospheric variability in Δ17O on seasonal, diurnal, and synoptic timescales, and report the measurement system short-term repeatability and reproducibility.

How to cite: Pickers, P., Forster, G., Kaiser, J., Marca, A., Manning, A., Paxton, R., and Arnold, T.: In-situ atmospheric measurements of CO2 polyisotopologues at Weybourne Atmospheric Observatory in the United Kingdom, EGU General Assembly 2025, Vienna, Austria, 27 Apr–2 May 2025, EGU25-17599, https://doi.org/10.5194/egusphere-egu25-17599, 2025.

EGU25-17839 | Orals | BG2.2

High precision QCL based direct detection of stable isotopes and tracers in bio-geoscience 

Jonas Bruckhuisen, Morten Hundt, Jiri Hlubucek, Etienne Smith, and Oleg Aseev

To study the geochemical cycles of important greenhouse gases, it is helpful to go beyond measuring their concentrations. Measurements of isotopic ratios can help identify emission sources and study biological and chemical processes. This can include laboratory incubation experiments in soil, agricultural and grass lands, wastewater, and other microbial active aqueous solutions.

The abundances of the 15N and 18O isotopes can be compared to the main isotope 14N14N16O, revealing the distinct isotopic signatures. As a linear molecule with two nitrogen atoms, N2O has two structural isomers of identical mass, which cannot be distinguished by mass spectroscopy. Therefore, a geometry sensitive laser spectroscopy-based approach is required.

The new MGAi-N2O from MIRO Analytical simplifies the monitoring of N2O isotopic composition by enabling simultaneous online measurements of up to 5 major isotopologues of N2O at high measurement rates, while providing excellent stability and precision at a fraction of the cost of isotope mass spectrometers. 

In our presentation we will demonstrate the simultaneous measurement of 5 isotopologues of N2O including 17O using our recently launched MGAi-N2O analyzer. Measurements of different samples, showing high stability and precision, illustrate the potential but also the limitations of this novel analyzer. In addition to continuous flow, a batch sampling mode option will be introduced and characterized.  Recent improvements in the measurement of novel tracers such as OCS and HONO, combined with up to 9 other gases in a single instrument, will also be presented.

How to cite: Bruckhuisen, J., Hundt, M., Hlubucek, J., Smith, E., and Aseev, O.: High precision QCL based direct detection of stable isotopes and tracers in bio-geoscience, EGU General Assembly 2025, Vienna, Austria, 27 Apr–2 May 2025, EGU25-17839, https://doi.org/10.5194/egusphere-egu25-17839, 2025.

EGU25-18216 | Posters on site | BG2.2

Semi-automated separation of methane from ambient air for analysis of Δ13CH3D and Δ12CH2D2 

Tim Arnold, Sara Defratyka, Andrew Gartside, Freya Wilson, Chris Rennick, Matthieu Clog, and Ed Chung

Bulk isotope ratios (δ13C-CH4 and δD-CH4) are used as tracers to help determine the contribution of methane (CH4) sources and sinks to the atmospheric burden. The multiply substituted (clumped) isotopologues are now potentially available as additional tracers to improve these distinctions in the global understanding of the CH4 budget. Measurement of Δ13CH3D and Δ12CH2D2, however, is more challenging than measurements of bulk isotopes and requires more advanced instrumentation. Our ongoing project, POLYGRAM (www.polygram.ac.uk), is developing the sampling strategy, sample preparation, mass spectrometry, and modelling work to begin monitoring these new isotopologue ratios.

Use of a custom-built automated preconcentrator is a key step in our approach during sample preparation, as HR-IRMS requires ultra-pure CH4 samples to measure the multiply substituted isotopologues. For ambient air studies we obtain 150 ml samples (1 bar) containing around 1% amount fraction of CH4, which can then be easily transported and further purified for final analysis. Importantly this separation technique is automated, free of liquid cryogen, and requires minimal manual intervention. We have also developed the system to be flexible and allow for preparation from any natural sources containing less than 1% CH4. We will present the validation of the method as well as a discussion to support the motivation for future development of monitoring Δ13CH3D and Δ12CH2D2 in the global atmosphere.

How to cite: Arnold, T., Defratyka, S., Gartside, A., Wilson, F., Rennick, C., Clog, M., and Chung, E.: Semi-automated separation of methane from ambient air for analysis of Δ13CH3D and Δ12CH2D2, EGU General Assembly 2025, Vienna, Austria, 27 Apr–2 May 2025, EGU25-18216, https://doi.org/10.5194/egusphere-egu25-18216, 2025.

EGU25-18701 | Posters on site | BG2.2

Facilitating the development of a global measurement infrastructure for the measurement of stable isotope ratios for greenhouse gases source apportionment 

Christoph Nehrbass-Ahles and Abneesh Srivastava and the CCQM GAWG/IRWG Joint Task Group on Stable Isotope Ratio Metrology for Atmospheric Source Apportionment (CCQM-GAWG-IRWG-TG-ISOTOP)

Recent progress in the field of laser spectroscopy has transformed the measurement of major greenhouse gases in the atmosphere, enabling real-time, in-situ field measurements of carbon dioxide (CO2) and methane (CH4) stable isotope ratios. These advancements provide critical insights into sources and sinks at local, regional, and global scales. These new measurement capabilities have generated an urgent demand for commutable isotopic gas reference materials for CO2 and CH4 at ambient amount fractions in air. Achieving the level of uncertainty required for such reference materials to effectively support climate mitigation efforts remains challenging. Furthermore, the reliance on individual calibration procedures by end-users has resulted in inconsistent data and hindered comparability across datasets. Addressing these challenges requires the development of new reference materials, improved validation protocols, and standardised calibration guidelines. This effort is essential to ensure traceability for field-deployable spectroscopic methods and traditional offline flask sampling techniques using mass spectrometry. The Metrology for Climate Action workshop, co-hosted by BIPM and WMO in 2022, underscored the critical need for an improved metrological support infrastructure to advance global comparability of greenhouse gas stable isotope ratio measurements. National Metrology Institutes (NMIs), Designated Institutes (DIs), and the WMO's Central Calibration Laboratory (CCL) were identified as key contributors in expanding the global network of certified reference material suppliers. This collaboration is crucial for providing the atmospheric measurement community with access to traceable isotopic greenhouse gas reference materials, thereby supporting the verification of emissions measurements. To address these demands, a new CCQM GAWG/IRWG joint Isotope Ratio Task Group was established in April 2023. This task group coordinates efforts among NMIs, DIs, and intergovernmental organisations to facilitate the development of a robust metrological support infrastructure for the accurate measurement of stable isotope ratios for atmospheric greenhouse gases and related applications. As part of its foundational activities, the task group recently submitted a comprehensive paper entitled “Developing Calibration and Measurement Capabilities for Atmospheric Methane Stable Isotope Ratios at NMIs/DIs: Metrology for Global Comparability.” This collaborative effort brought together experts from NMIs, DIs, academia, and intergovernmental organizations to provide key recommendations for advancing the measurement of CH4 stable isotope ratios. The paper also reviews the various elements that make up Calibration and Measurement Capabilities (CMC) to aid NMIs and DIs in developing their capabilities to support the atmospheric community's need for reliable stable isotope ratio measurements of CH4. This presentation will summarise the task group’s objectives, progress, and key recommendations. Additionally, it will provide a preliminary result from a global survey that is conducted in the first quarter of 2025, mapping the global capabilities for the measurement stable isotope ratio of CH4. Through fostering collaboration among diverse stakeholders, the task group aims to enhance global greenhouse gas data comparability and support effective climate action. We invite experts and organisations with a shared interest in this field to join us in this critical endeavour.

How to cite: Nehrbass-Ahles, C. and Srivastava, A. and the CCQM GAWG/IRWG Joint Task Group on Stable Isotope Ratio Metrology for Atmospheric Source Apportionment (CCQM-GAWG-IRWG-TG-ISOTOP): Facilitating the development of a global measurement infrastructure for the measurement of stable isotope ratios for greenhouse gases source apportionment, EGU General Assembly 2025, Vienna, Austria, 27 Apr–2 May 2025, EGU25-18701, https://doi.org/10.5194/egusphere-egu25-18701, 2025.

EGU25-19640 | ECS | Posters on site | BG2.2

Ship-borne atmospheric measurements during MOSAiC contribute to detect CH4 sources and transport pathways in the Arctic  

Sam Sellmaier, Ellen Damm, Torsten Sachs, Benjamin Kirbus, Inge Wiekenkamp, Annette Rinke, Falk Pätzold, Daiki Nomura, Astrid Lampert, and Markus Rex

The Arctic region plays a crucial role in the global methane (CH4) budget, as it is anticipated to contain substantial CH4 sources, such as (subsea) permafrost. The sparse network of land-based meteorological observation stations in the Arctic results in significant data gaps, particularly for marine sea-ice covered regions. Ship-based measurements can complement the land-based data enhancing our process understanding of the CH4 cycling in the Arctic including source-sink dynamics.

This study presents ship-borne observations of CH4 concentration and 𝜹13C-CH4 values continuously recorded in air near the ocean/ sea-ice surface with a Picarro G2132-i Isotope Analyzer during Leg 4 (June/July 2020) and Leg 5 (August/September 2020) of the Multidisciplinary drifting Observatory for the Study of Arctic Climate (MOSAiC) expedition in the Central Arctic. Three approaches to filter contamination by local pollution sources on both time series were compared. Finally, the Pollution Detection Algorithm was applied to the raw data. A comparison with recordings from the closest land stations and their seasonal patterns suggests that the ship-borne data is more closely linked to dynamic changes in methane sources, sinks, and transport processes, rather than being solely driven by seasonality. To unravel underlying processes, which may contribute to variations in the ship-borne data, we employed a two-step approach. First, we defined air mass source areas and transport pathways within the Arctic Ocean boundary layer using five-day backward trajectories modelled with the LAGRANTO analysis tool and ERA5 wind field data. Second, we linked the observed variations to the air mass source regions by utilizing Keeling plot analysis and 𝜹13C-CH4 fingerprints.

Our analysis reveals that variations in the time series are related both to specific geographical source areas and to seasonally different distinct CH4 source strengths within certain source areas. The findings highlight the importance of considering air mass source areas and seasons to understand variations in CH4 concentration and 𝜹13C-CH4 values in the Arctic. The study highlights the need for further collection of ship-borne measurements of CH4 concentration and 𝜹13C-CH4 data to enhance process understanding and modelling approaches.

How to cite: Sellmaier, S., Damm, E., Sachs, T., Kirbus, B., Wiekenkamp, I., Rinke, A., Pätzold, F., Nomura, D., Lampert, A., and Rex, M.: Ship-borne atmospheric measurements during MOSAiC contribute to detect CH4 sources and transport pathways in the Arctic , EGU General Assembly 2025, Vienna, Austria, 27 Apr–2 May 2025, EGU25-19640, https://doi.org/10.5194/egusphere-egu25-19640, 2025.

EGU25-19970 | ECS | Orals | BG2.2

Continuous methane (CH4) isotope measurements in Lindenberg, Germany 

Jacoline van Es, Carina van der Veen, Stephan Henne, and Thomas Rockmann

Methane (CH4) plays a crucial role in the Earth’s radiative balance because it is a potent greenhouse gas with a shorter lifetime compared to CO2. Mitigating CH4 emissions can potentially mitigate climate change over a short period [1]. Mitigating CH4 requires a solid understanding of the emissions, in particular, which source emits the CH4. Isotopic analysis can aid in source partitioning, as different production processes produce CH4 with subtle but significant differences in isotopic composition [3], enabling the differentiation of multiple sources.
CH4 isotopic source signatures are typically obtained through mobile where sources are sampled as close to the emission point as possible [2]. While these  campaigns are valuable, they only capture for a short duration and miss many smaller and unknown emissions. In contrast, continuous CH4 measurements cover longer periods and can detect inaccessible or unknown sources. However, the downside is that identifying the exact source can be more challenging as the source origin is not always known.
Researchers at Utrecht University developed an isotope ratio mass spectrometer (IRMS) system that measures CH4 mole fraction, δD and δ13C at high
precision with a 40-minute resolution. This system was deployed from 15 April 2022 till 8 January 2023 at a tall tower in Lindenberg, Germany. Measurements were initialised at 40 m.a.g.l and later continued 98 m.a.g.l. The station is part of the Integrated Carbon Observation System (ICOS), providing mole fraction measurements of CO, CO2, and CH4. CH4 isotopic data were also compared with simulations from EMPA. These simulations include the CH4 emissions for each category, allowing us to assign an isotopic source signature to each emissions category, and thereby simulating a CH4 isotopic source signature. For the isotopic measurements, we observed 169 peaks shorter than 24 hours.
This corresponds to 67% of the deployment days. Most source signatures indicate a microbial fermentation source (δ13C : [-55‰, -62‰], δD : [-260 ‰, -360 ‰]). Additionally, we identified 19 multi-day elevations, lasting up to 20 days. Eight of these multi-day elevations displayed isotopic signatures similar to those of the diurnal peaks, while the remaining multi-day peaks showed distinctly different source signatures from one another and the diurnal elevations.

How to cite: van Es, J., van der Veen, C., Henne, S., and Rockmann, T.: Continuous methane (CH4) isotope measurements in Lindenberg, Germany, EGU General Assembly 2025, Vienna, Austria, 27 Apr–2 May 2025, EGU25-19970, https://doi.org/10.5194/egusphere-egu25-19970, 2025.

EGU25-20440 | ECS | Orals | BG2.2

In-situ stable carbon isotope measurements with laser ablation and on-chip laser absorption spectroscopy  

Ragnar Seton, Jana Jágerská, and Jan Viljanen

Measuring stable carbon isotope ratios is a powerful method to study both the environment and ecosystems. The isotope ratios can be used as evidence of geological development or in climate sciences to study system interactions where it provides crucial insights about the ecosystem gas exchange. Mass spectrometry has remained the golden standard for stable carbon isotope analysis in solids and Isotope Ratio Mass Spectrometry (IRMS) has been applied in numerous use cases due to its precision and selectivity. However, the demand for on-site and in-situ capable carbon isotope monitoring methods is increasing. 

In this work, we present an in-situ-capable, all-optical method for stable carbon isotope ratio measurements in solid samples that combines laser ablation and on-chip tunable diode laser absorption spectroscopy (TDLAS). Laser ablation is used to transform the samples from solid to gas phase. The gas is then transported with a carrier flow through a microfluidic system, passing a particle filter and into the µl detector volume. The small sample volume is enabled by a suspended nanophotonic waveguide-based TLDAS sensor which was recently demonstrated for isotope-specific CO2 detection with a 20 ppb detection limit and isotope ratio accuracy of 0.2 ‰. Thus, the combination of an on-chip CO2 detector and laser ablation enables the construction of a compact and portable, all-optical sensor for stable carbon isotope ratio measurements. 

The presented measurement technology generates a paradigm shift in studies integrating the ecological, biological, and geochemical processes. This approach has high sample throughput with ~1 min measurement time due to the minimal requirement of sample treatment, enabling measurement of large sample sets. In addition, the measurement system can be applied to both solid and liquid samples enabling rapid, on-site screening of ecosystem carbon cycle. 

How to cite: Seton, R., Jágerská, J., and Viljanen, J.: In-situ stable carbon isotope measurements with laser ablation and on-chip laser absorption spectroscopy , EGU General Assembly 2025, Vienna, Austria, 27 Apr–2 May 2025, EGU25-20440, https://doi.org/10.5194/egusphere-egu25-20440, 2025.

EGU25-20522 | Posters on site | BG2.2

Improvements in ambient CH4 isotope ratio measurements – the isoMET project 

Javis Nwaboh, Joachim Mohn, Mehr Fatima, Dafina Kikaj, and Volker Ebert

Atmospheric observations provide a reality check on the true efficacy of climate change mitigation policy. Methane (CH4) is a potent greenhouse gas (GHG) with multiple complex sources. Stable isotope ratio measurements for CH4 provide the fingerprints necessary to verify emissions by source type. The isoMET project focuses on improving ambient air CH4 isotope ratio monitoring capabilities both in the laboratory and field. This project also targets improvements in the quality of CH4 isotopic source signature information as well as modelling necessary to make top-down emissions estimates with sectorial attribution.

Here, we present a new metrological infrastructure, developed within the isoMET project, for a dataset for CH4 isotope source signature measurements. In addition, information on new state-of-the-art CH4 calibration reference materials, developed in the project, will be provided. Latest results from the project on analytical advances in high-resolution mass spectrometry and laser spectroscopy for doubly substituted isotopic species of CH4 (13CH3D, 12CH2D2) will be shown. In addition, we present results on laboratory and field intercomparison, demonstrating the capability of e.g. optical isotope ratio measurements (OIRS) for δ13C, δ2H, Δ13CH3D and Δ12CH2D2 measurements in CH4. Finally, the use of atmospheric chemistry transport modelling to direct the measurement strategy for optimal emissions estimation will be demonstrated.

References

[1] isoMET project available at: https://www.npl.co.uk/21grd04-isomet

[2] J. A. Nwaboh, J. Mohn, F. Mehr, T. Arnold, V. Ebert, CCQM GAWG-IRWG Workshop on Carbon Dioxide and Methane Stable Isotope Ratio Measurements, LATU (Uruguay), 2023

[3] Mehr Fatima, Javis Nwaboh, Joachim Mohn, Tim Arnold, and Volker Ebert, EGU 2024, EGU24-20560, https://doi.org/10.5194/egusphere-egu24-20560

Acknowledgements: The project 21GRD04 isoMET project has received funding from the European Partnership on Metrology, co-financed from the European Union’s Horizon Europe Research and Innovation Programme and by the Participating States.  Empa has received funding from the Swiss State Secretaritat for Education, Research and Innovation (SERI).


How to cite: Nwaboh, J., Mohn, J., Fatima, M., Kikaj, D., and Ebert, V.: Improvements in ambient CH4 isotope ratio measurements – the isoMET project, EGU General Assembly 2025, Vienna, Austria, 27 Apr–2 May 2025, EGU25-20522, https://doi.org/10.5194/egusphere-egu25-20522, 2025.

EGU25-785 | ECS | Orals | BG2.4

Uncovering a potential bias in the RI-OH paleothermometer in methane seepage environments 

Pierrick Fenies, Sze Ling Ho, and Hefter Jens

Hydroxylated isoprenoid glycerol dialkyl glycerol tetraethers (OH-GDGTs) are ubiquitous, degradation-resistant archaeal membrane lipids. In marine environments, they are primarily thought to be produced by ammonia-oxidizing archaea Nitrososphaeria, and previous studies have shown that the number of cyclopentane moieties is positively correlated with upper ocean temperatures. This relationship has led to the development of the RI-OH and RI-OH’ paleothermometers. However, the low abundance of OH-GDGTs in marine settings, particularly in low-latitude regions, makes OH-GDGT-based paleothermometers relatively susceptible to the contribution of other archaea groups, such as methane-cycling benthic archaea, to the sedimentary OH-GDGT pool. This can potentially bias the relationship between the number of cyclopentane moieties and upper ocean temperatures.

Until now, the potential influence of OH-GDGT production by anaerobic methanotrophic archaea has remained unexplored.  To address this gap, we studied four sediment cores collected using a remotely operated vehicle within a ~200 m radius at three sites in the Four Way Closure Ridge cold seep system, offshore southwestern Taiwan. Three cores were collected from black patches associated with active seepage, while one control core represented a "normal" marine setting unaffected by seepage. A suite of data, including gas, porewater, bulk sediment geochemistry, archaeal genomics, and GDGT distributions, was generated.

We tested various calibrations using the control core, and found that the latest global RI-OH calibration yields temperatures that agree with the annual mean sea surface temperatures (SST). In contrast, other RI-OH and RI-OH’ calibrations produce temperatures that skew toward the summer and winter months, respectively. In three other sediment cores affected by anaerobic methanotrophic archaea, we observed that the Methane Index, which estimates the contribution of anaerobic methanotrophic archaea to the isoprenoid GDGT pool, reached as high as 0.7. Furthermore, we observed that when Methane Index values increase, the relative abundance of OH-GDGT-1 tends to increase as well, while that of OH-GDGT-2 tends to decrease. These changes corresponds to a temperature decrease of up to ~4°C as reconstructed using the RI-OH paleothermometer, while only marginally impacting the RI-OH' paleothermometer and the isoprenoid GDGT-based TEX86 (< 1°C). These findings suggest that anaerobic methanotrophic archaea may contribute to the sedimentary OH-GDGT pool in addition to the isoGDGT pool, potentially introducing a previously unidentified cold bias in the RI-OH paleothermometer. This underscores the need for further investigations into the role of anaerobic methanotrophic archaea in OH-GDGT production to improve the accuracy of RI-OH-based temperature reconstructions.

How to cite: Fenies, P., Ho, S. L., and Jens, H.: Uncovering a potential bias in the RI-OH paleothermometer in methane seepage environments, EGU General Assembly 2025, Vienna, Austria, 27 Apr–2 May 2025, EGU25-785, https://doi.org/10.5194/egusphere-egu25-785, 2025.

EGU25-2788 | Orals | BG2.4

Towards quantitative reconstruction of past East Asian monsoon precipitation based on lipid biomarkers in Chinese loess 

Francien Peterse, Louise Fuchs, Hao Lu, Martin Ziegler, and Youbin Sun

Changes in past East Asian monsoon (EAM) climate have been inferred from records of speleothem δ18O and the magnetic susceptibility (MagSus) of loess sequences on the Chinese Loess Plateau (CLP). However, where the speleothem record is dominated by a 23-kyr cycle, loess MagSus primarily shows a 100-kyr cycle. Generating a long-term high-resolution record of plant wax hydrogen isotopes (δ2Hwax) from the Yuanbao section on the western CLP reveals that variations in δ2Hwax follow the precessional pattern of the speleothem record, as opposed to the glacial-interglacial changes in MagSus from the same loess section. We, therefore, propose that plant waxes mainly record the δ2H of precipitation during the growing season, whereas MagSus represents an annual climate signal, including precipitation and temperature. This implies that summer vs annual climate variability is driven by distinct orbital forcings.

Regardless, these proxies only allow for qualitative reconstructions of past EAM climate; a method to generate records of absolute monsoon precipitation changes and also leads to consistent results across the CLP is still lacking. We find that in the Yuanbao section, the degree of cyclisation (DC) of branched tetraether membrane lipids, so-called brGDGTs, which are membrane lipids of soil bacteria that are mostly known for their temperature-sensitivity, closely tracks the changes in δ2Hwax. The positive relationship of the DC with mean annual precipitation (MAP) in surface soils from the CLP enables us to quantify past MAP at Yuanbao, but also at other sites on the CLP with existing brGDGT datasets. This reveals a spatial gradient in MAP that is most pronounced during glacials, when the western CLP experiences relatively more arid conditions. Furthermore, the DC records provide independent support for precession as main forcing of precipitation on the CLP, as opposed to the 100-kyr cycle recorded by MagSus, which rather reflects the relative intensity of the EAM.

How to cite: Peterse, F., Fuchs, L., Lu, H., Ziegler, M., and Sun, Y.: Towards quantitative reconstruction of past East Asian monsoon precipitation based on lipid biomarkers in Chinese loess, EGU General Assembly 2025, Vienna, Austria, 27 Apr–2 May 2025, EGU25-2788, https://doi.org/10.5194/egusphere-egu25-2788, 2025.

EGU25-3554 | ECS | Posters on site | BG2.4

Direct Evidence of 6-methyl Branched Tetraether Production in Freshwater 

Jingjing Guo, Desmond Eefting, Klaas Nierop, Jack Middelburg, and Francien Peterse

Branched glycerol dialkyl glycerol tetraethers (brGDGTs) are membrane lipids produced by bacteria in soils and peats worldwide. The distribution of brGDGTs relates to ambient environmental conditions, and the changes in their downcore distributions preserved in coastal marine sediments are used to reconstruct past temperatures of adjacent river catchments. However, brGDGT signatures in lakes and rivers deviating from those in soils suggest in situ production of brGDGTs, which can alter the original soil signal. In this study, we incubated river water with and without soils with 13C-labeled glucose addition to identify characteristics of brGDGTs produced in situ. We observe that the brGDGT signature shifts from more 5-methyl to more 6-methyl brGDGTs in river water, while the river water with soil remains dominated by 5-methyl brGDGTs during the incubation. Furthermore, the 6-methyl brGDGTs in river water show an uptake of 13C-labeled glucose added to the experiment, providing direct evidence of their production in an aquatic environment. However, label uptake by brGDGTs in experiments with soil addition was minimal, suggesting that brGDGTs produced in aquatic environments only alter the initial soil-derived brGDGT signal at times when soil input is relatively low.

How to cite: Guo, J., Eefting, D., Nierop, K., Middelburg, J., and Peterse, F.: Direct Evidence of 6-methyl Branched Tetraether Production in Freshwater, EGU General Assembly 2025, Vienna, Austria, 27 Apr–2 May 2025, EGU25-3554, https://doi.org/10.5194/egusphere-egu25-3554, 2025.

EGU25-4978 | ECS | Posters on site | BG2.4

Biomarkers and Stable Isotopes in Loess Deposits Reveal Early Human-Environment Interactions in Central Asia 

Aljasil Chirakkal, David K Wright, Ekaterina Kulakova, Calin Constantin Stiendal, Jago Jonathan Birk, Redzhep Kurbanov, and Jan-Pieter Buylaert

The loess-paleosol sequences of the Khovaling Loess Plateau in southern Tajikistan preserve a unique record of early hominin occupation and environmental changes during the Early Pleistocene (Marine Isotope Stages 11–15). Using a combination of biomarkers, stable isotopes, and magnetic susceptibility analyses, our research reconstructs paleoenvironmental and fire histories while investigating the impact of early humans on the landscape. Biomarker proxies, including straight-chain alkanes (n-alkanes) and polycyclic aromatic hydrocarbons (PAHs), reveal shifts between grass-dominated and forested ecosystems corresponding to glacial and interglacial cycles respectively. The enrichment of high molecular weight PAHs in stratigraphic layers with lithic artifacts suggests anthropogenic fire use during periods of wetter climates. The complementary stable carbon (δ¹³C) and nitrogen (δ¹⁵N) isotopes together with soil organic matter contents indicate intensive human activity in on-site contexts, with a reliance on C3 vegetation under cooler, wetter conditions. Off-site and near-site locales exhibit isotopic signatures reflecting less intensive human use and more open landscapes dominated by grassier vegetation.

The integration of these geochemical and isotopic proxies highlights the potential of soils and sediments to offer insights into the interplay between environmental changes and human activity. By linking these molecular findings with lithic artifact distributions and magnetic susceptibility records, our study demonstrates how loess soils preserve evidence of early human adaptation, resource use, and ecological impacts, contributing to our understanding of co-evolutionary relationships between hominins and landscapes in Central Asia.

How to cite: Chirakkal, A., K Wright, D., Kulakova, E., Constantin Stiendal, C., Jonathan Birk, J., Kurbanov, R., and Buylaert, J.-P.: Biomarkers and Stable Isotopes in Loess Deposits Reveal Early Human-Environment Interactions in Central Asia, EGU General Assembly 2025, Vienna, Austria, 27 Apr–2 May 2025, EGU25-4978, https://doi.org/10.5194/egusphere-egu25-4978, 2025.

EGU25-7916 | ECS | Posters on site | BG2.4

Environmental and Botanical Insights from Biomarker Variability in Xihu Depression Light Crude Oils 

Yuhan Jiang and Xiong Cheng

Comprehensive organic geochemical analyses were conducted on 41 light crude oil samples obtained from diverse structural zones within the Xihu Depression. These analyses revealed a pronounced enrichment of biomarkers, highlighting substantial contributions from terrestrial higher plants. Notably, tricyclic diterpanes and their aromatized derivatives were identified as key molecular markers, primarily derived from angiosperms, gymnosperms, and ferns. In contrast, biomarkers indicative of inputs from aquatic lower plants were significantly less abundant.

Detailed geochemical profiling uncovered distinct spatial variations in biomarker composition across the structural zones, as evidenced by diagnostic ratios such as isopimarane/nC20, isopimarane/(isopimarane + 16β(H) phyllocladane), 1,2,5-trimethylnaphthalene/1,3,6-trimethylnaphthalene, and 1,7-dimethylphenanthrene/(retene + 1,7-dimethylphenanthrene). These compositional variations, analyzed through multivariate statistical techniques, facilitated the classification of the crude oils into four distinct groups, reflecting variable contributions from angiosperms, gymnosperms, and ferns.

Furthermore, the study established a robust linkage between the saturated and aromatic hydrocarbon fractions of the crude oils, using high-resolution gas chromatography-mass spectrometry (GC-MS) to investigate their molecular signatures. A novel biomarker-based index, defined as (isopimarane + 1,7-dimethylphenanthrene)/(retene + 16β(H) phyllocladane), was developed to infer the source input of the light crude oils. Elevated values of this index were interpreted as indicative of a dominant gymnosperm-derived input. Notably, a positive correlation was observed between this index and the bulk δ13C values of the crude oils, further corroborating the critical role of gymnosperm resins in the hydrocarbon generation processes within the Xihu Depression. This integrated geochemical framework provides valuable insights into the source contributions and depositional settings of the region's petroleum systems.

How to cite: Jiang, Y. and Cheng, X.: Environmental and Botanical Insights from Biomarker Variability in Xihu Depression Light Crude Oils, EGU General Assembly 2025, Vienna, Austria, 27 Apr–2 May 2025, EGU25-7916, https://doi.org/10.5194/egusphere-egu25-7916, 2025.

EGU25-8285 | Posters on site | BG2.4

Persistent effect of ancient Romans on algal community in Murtensee (Switzerland) 

Theresa Wietelmann, Laura Epp, Nathalie Dubois, Ricardo N. Santos, Daniel B. Nelson, and S. Nemiah Ladd

Throughout recent decades, cultural eutrophication has threatened freshwater ecosystem functioning. However, anthropogenic activity has also heavily impacted aquatic environments earlier in human history. During the 2nd century BCE Aventicum (capital of the Roman province Helvetica), located at the southern border of Murtensee, was inhabited by ~20,000 people. This led to significant disturbances of the lake and its environment, which persisted for centuries, including increased soil erosion, cultural eutrophication, and major changes of the local vegetation. Here, we aim to investigate algal population dynamics in Murtensee in response to this known anthropogenic forcing during the Roman Period, by combining organic geochemical proxies with sedimentary ancient DNA (sedaDNA) analyses.

To analyse the effects on the algal community, a 15-meter-long sediment core, spanning > 8 kyr, was collected in April 2023. We present a record of the relative abundance of lipid biomarkers, which we used to reconstruct the ratio between eukaryotic algae and cyanobacteria and to provide insights about the diversity among eukaryotes. Our results reveal a prominent shift towards cyanobacteria during the Roman period, and a substantial decrease of specific phytosterols indicative of dinoflagellates and diatoms. We complement our analyses of biomarker distributions with compound-specific hydrogen isotope measurements of fatty acids, n-alkanols, and phytol, and use the offsets among these to further distinguish ecological changes in the lake. In addition to our organic geochemical data, we analysed sedaDNA using a metabarcoding approach targeting cyanobacteria. The results of these analyses indicate an increase in cyanobacterial diversity associated with the Roman eutrophication.

We analysed not only the immediate effects of Roman activities on the algal community but also investigated the long-term consequences of this disturbance over the following centuries. Although human pressure was reduced following the Roman period, the effect on the algal community composition was long-lasting, with persistent reduced diatom abundance for at least three centuries, and reduced dinoflagellate presence for over 1.5 kyr.

Our research emphasizes that even while ancient human activity was less pronounced compared to modern perturbations, it had a significant and persistent effect on the algal community. This suggests that centuries to millennia may be required for ecological recovery in the aftermath of a eutrophication disturbance.

How to cite: Wietelmann, T., Epp, L., Dubois, N., N. Santos, R., Nelson, D. B., and Ladd, S. N.: Persistent effect of ancient Romans on algal community in Murtensee (Switzerland), EGU General Assembly 2025, Vienna, Austria, 27 Apr–2 May 2025, EGU25-8285, https://doi.org/10.5194/egusphere-egu25-8285, 2025.

EGU25-8560 | ECS | Orals | BG2.4

Disentangling the impact of vegetation and hydroclimate dynamics on plant wax stable isotopes since the Younger Dryas in Central Switzerland 

Ricardo N. Santos, Antonia Klatt, Daniel B. Nelson, Fatemeh Ajallooeian, Carsten Schubert, Nathalie Dubois, Cindy De Jonge, and S. Nemiah Ladd

The stable isotopic composition of plant waxes (δ13C and δ2H values) in lake sediments is a powerful tool for reconstructing past climates and environments, offering critical insights into hydroclimate variability and vegetation dynamics. Different plant types, such as grasses and woody vegetation, can exhibit distinct water sources and isotopic fractionations, directly influencing plant-wax isotopic signatures in sedimentary records. This influence is particularly pronounced in small basins, where local vegetation sources can dominate over regional signals, complicating the interpretation of δ2H records. Disentangling the effects of vegetation changes from hydroclimate variations in lipid biomarkers is paramount for robust interpretations yet remains quite challenging. 

Here, we aim to quantify the effects of climate, vegetation, and human activities on sedimentary records, improving our understanding of environmental changes in central Switzerland. We utilized δ13C and δ2H records of plant waxes (n-alkanes and fatty acids) from Rotsee, a small lake near Luzern. Our Bayesian-based 14C age model establishes a temporal framework for interpreting changes in vegetation and hydroclimate at Rotsee since the Younger Dryas period (12.9–11.7 ka). The extensive paleoclimate and archaeological research in the region offers a complementary and broader context for our findings. 

During the Younger Dryas, leaf wax δ13C and δ2H values were very low — consistent with cold and dry conditions. δ2H values of long-chain fatty acids increase rapidly during the transition to the Early Holocene, in what appears to be a double-step change: an initial ~20 ‰ increase driven by hydroclimate changes (δ13C remained stable) followed by ~30 ‰ driven by changes in regional vegetation (accompanied by a ~10‰ δ13C increase). This overall ~50 ‰ increase in δ2H aligns with a major and well-known regional warming trend.

During the Holocene Thermal Maximum, around 9.5 to 6 ka, δ13C values peaked, likely reflecting the dominance of woody plants and increased input of aquatic plants, while δ²H values remained stable. However, after 6 ka, there were significant shifts in δ¹³C values, possibly reflecting local vegetation source changes at Rotsee such as a decrease in aquatic plants. 

Around 2 ka, during the Roman Period, the plant wax isotopic records at Rotsee show a major shift, with δ2H values declining by ~40‰ and δ13C by ~5‰ in long-chain fatty acids. This substantial change in δ2H values exceeds what would be expected based on plausible hydroclimate variations during this period, suggesting a vegetation source-driven change. The intensification of forest clearance and cereal cultivation, as indicated by pollen records, suggests that human-driven land use changes likely strongly influenced the δ2H signal. After medieval times (ca. 0.5 ka), plant wax δ13C and δ2H values increased significantly, likely due to forest regrowth and Rotsee’s eutrophication.

Overall, this study highlights the potential of plant-wax isotopes to reveal complex interactions among climate, vegetation, and human activity. Our findings demonstrate how sedimentary records from small basins similar to Rotsee can provide valuable insights into local and regional environmental dynamics.

How to cite: N. Santos, R., Klatt, A., B. Nelson, D., Ajallooeian, F., Schubert, C., Dubois, N., De Jonge, C., and Ladd, S. N.: Disentangling the impact of vegetation and hydroclimate dynamics on plant wax stable isotopes since the Younger Dryas in Central Switzerland, EGU General Assembly 2025, Vienna, Austria, 27 Apr–2 May 2025, EGU25-8560, https://doi.org/10.5194/egusphere-egu25-8560, 2025.

EGU25-9764 | ECS | Posters on site | BG2.4

Application of a Supercritical Fluid Chromatography quadrupole Time of Flight system to the detection of Glycerol Dialkyl Glycerol Tetraethers  

Pablo Martínez-Sosa, David Touboul, Sophie Bourcier, and Arnaud Huguet

Due to their response to environmental parameters and global distribution, the bacterial and archaeal lipids Glycerol Dialkyl Glycerol Tetraethers (GDGTs) have been used as proxies for environmental studies in marine and terrestrial settings for the past decades. Since these molecules were first discovered, improvements in the analytical method have been made, from the initial method that allowed for the identification of these compounds using cyanocolumns run in an HPLC-MS system, to the separation of their different isomers using two silica columns in series. While currently the most widely used method, using the silica columns, has been shown to produce very reproducible results across different laboratories, the runtime of the program of approximately 90 minutes makes it burdensome to analyze large arrays of samples, and the long runtime also requires large volumes of solvent. These are significant limitations for the application of this analysis in paleoclimate studies where large numbers of samples are required. Furthermore, since this method is run in Single Ion Monitoring mode, other related compounds are not currently being analyzed along the GDGTs.

Here we present the initial results of implementing a Supercritical Fluid Chromatography coupled to quadrupole Time of Flight mass spectrometry (SFC-qTOF) system to measure GDGTs. We report that this method produces results with comparable distribution of the GDGTs to the classical HPLC-MS method, where the GDGTs are correctly detected although no isomer separation is observed. Nevertheless, our total runtime is 25 minutes and also uses less than a third of the solvent from the standard method, as it primarily uses supercritical CO2 as mobile phase, supplemented with no more than 40% of methanol:ethanol (1:1). Furthermore, while other alternative techniques, such as reverse phase chromatography have also reduced the runtime of the GDGT analysis, since our system is running in normal phase, our results are easily comparable with those of the commonly made analyses. The implementation of a faster analysis would allow for an easier application of GDGT analyses to high resolution paleoreconstruction analyses.

While improvements in this method are still required, the versatility of the SFC-qTOF system, as demonstrated in its use for lipidomic studies, could provide a useful tool to not only measure the commonly studied GDGTs, but also by expanding the analysis to less studied structures such as intact polar lipids and unidentified GDGTs. Previous work has shown that the measurement of additional non-traditional GDGTs can provide extra paleoecological information, thus allowing for more robust and reliable paleoreconstructions.

How to cite: Martínez-Sosa, P., Touboul, D., Bourcier, S., and Huguet, A.: Application of a Supercritical Fluid Chromatography quadrupole Time of Flight system to the detection of Glycerol Dialkyl Glycerol Tetraethers , EGU General Assembly 2025, Vienna, Austria, 27 Apr–2 May 2025, EGU25-9764, https://doi.org/10.5194/egusphere-egu25-9764, 2025.

EGU25-9876 | ECS | Posters on site | BG2.4

Organic, inorganic, and isotopic proxy temperature estimates from a ten-year sediment trap record in the eastern Mediterranean Sea 

Addison Rice, Anouk van Boxtel, Gert J. de Lange, Jan-Berend Stuut, Gert-Jan Reichart, Lennart de Nooijer, Stefano Bernasconi, Heather Stoll, Appy Sluijs, Martin Ziegler, and Francien Peterse

Estimates of sea surface temperature (SST) in the geologic past often rely on geochemical proxies, including alkenone unsaturation ratios (UK’37), the proportion of cyclopentane rings in glycerol dibiphytanyl glycerol tetraethers (GDGTs; TEX86), δ18O and Mg/Ca in planktonic foraminifera, and clumped isotopes in biogenic carbonates (Δ47). Global calibrations show robust agreements between proxies and the temperature of the environment. However, proxy values in the eastern Mediterranean Sea are often offset from expected values based on these global relationships.

Here we aim to explain the Meditrerranean Sea proxy bias using sediment traps moored in the water column at 500, 1500, and 2500 m depth in the Ionian Sea between 1999 and 2018. We compare proxy values in trap material to those in surface sediment from the same site. UK’37-based SSTs (~12-22 °C) and TEX86-based SSTs (~28-30 °C) vary seasonally, although they differ from satellite-based SSTs (~16-27 °C). No significant variations in mean Mg/Ca or δ18O values in G. ruber or in coccolith Δ47 values were observed, indicating that these proxies do not vary on seasonal timescales in sinking particles at this site. Ultimately, however, sediments should record a flux-averaged proxy value. To this end, we explore export patterns of biomarkers and foraminifera.

We find that export of alkenones, GDGTs, and foraminifera exhibit different seasonality. Specifically, alkenone export typically peaks twice per year in late winter and late summer, maximum GDGT export often occurs in late winter, and export of planktonic foraminifera generally peaks in summer. Furthermore, alkenone export exhibits very little inter-annual variability, whereas the timing of GDGT export is more variable, and the peak flux of foraminifera is highly variable between years.

Flux-weighted UK’37- and TEX86-, and mean coccolith Δ47-based SSTs of 15, 29, and 15 ± 2 °C, respectively are offset from mean annual average satellite-based SSTs of 21 °C, whereas Mg/Ca and δ18O of G. ruber both yield average temperatures that are similar to the satellite-derived SSTs. Notably, whereas most proxy values measured in the surface sediment closely reflect those in the sediment trap material, the UK’37-based SST (13 °C) differs from the flux-weighted average in the sediment trap.

These results will be discussed in the context of seasonality, nutrient availability, dwelling depth, ecology, and physiological processes which may influence proxy values measured in the sediment trap and in underlying sediments.

How to cite: Rice, A., van Boxtel, A., de Lange, G. J., Stuut, J.-B., Reichart, G.-J., de Nooijer, L., Bernasconi, S., Stoll, H., Sluijs, A., Ziegler, M., and Peterse, F.: Organic, inorganic, and isotopic proxy temperature estimates from a ten-year sediment trap record in the eastern Mediterranean Sea, EGU General Assembly 2025, Vienna, Austria, 27 Apr–2 May 2025, EGU25-9876, https://doi.org/10.5194/egusphere-egu25-9876, 2025.

EGU25-10135 | ECS | Posters on site | BG2.4

Plant Biomarkers in Arid Ecosystems: Molecular and Isotopic Insights from the Thar Desert 

Deepak Kumar Jha, Namitha Miyash, Purushottam Gupta, Rachel Rudd, Satinder Pal Singh, and Patrick Roberts

The molecular and isotopic analysis of leaf wax biomarkers in sedimentary records is a widely used tool in palaeoclimate and palaeoenvironmental research. These biomarkers, particularly n-alkanes, are valued for their molecular stability, water insolubility, and resistance to microbial degradation, making them key indicators for reconstructing ancient environmental conditions. Despite extensive research on leaf wax n-alkanes in lacustrine, fluvial, and marine environments, their application in desert ecosystems remains limited [1]. This study analyses n-alkane distributions and their compound-specific isotopic signatures (CSIA; δ¹³C and δ²H values) in modern plants and sediments across an east-west aridity gradient of the Thar Desert.

Distinct patterns in n-alkane concentrations (∑Alk; C25-C33), Carbon Preference Index (CPI), and Average Chain Length (ACL) were observed across plants and sediments, revealing their relationship with climatic parameters. Inter-species variability in the abundance of C29 and C31 is observed, but when averaged to C3 and C4 photosynthetic groups we see a C31 chain dominance in both plants. Meanwhile, average ∑Alk of sediments indicated C29 dominance. C3 plants had the highest ∑Alk and TOC (%), followed by C4 plants, with sediments showing significantly lower ∑Alk due to microbial degradation. CPI and ACL values distinguished these groups, with C4 plants showing the highest values, reflecting their physiological adaptations to arid environments through increased odd-chain alkane production to minimise water loss.

Pearson correlation analyses revealed strong relationships between ∑Alk in C4 plants and climatic parameters, with positive correlations with Mean Annual Temperature (MAT) and negative correlations with Mean Annual Precipitation (MAP) and Aridity Index (AI). These relationships highlight the superior water-use efficiency of C4 plants compared to C3 plants, enabling their dominance in semi-arid and arid regions. However, the ACL and CPI values of both plant types and sediments showed limited correlation with environmental variables, except for a strong correlation between the ACL of C4 plants and AI.

Our preliminary statistical analysis using ANOVA and Tukey's HSD test suggests a significant difference in the δ¹³C values of n-alkanes (C29 and C31) between C4 plants and sediments, while the bulk δ¹³C values are similar for both. This similarity indicates a bias of bulk δ¹³C values toward the C4 signature in sediments of the Thar Desert, highlighting the need for caution when reconstructing historical climate and vegetation changes. This finding aligns with other research that has documented similar biases in bulk δ¹³C values during palaeoenvironmental reconstructions. Furthermore, the bulk δ¹³C values of plants and sediments are more sensitive to MAT, MAP, and AI compared to the δ¹³C values of n-alkanes (C29 and C31) in this region. These findings also provide valuable insights into plant responses and their organic matter preservation potential in arid ecosystems.

Referenc:

[1]  Jha, D.K., Patalano, R., Ilgner, J., Achyuthan, H., Alsharekh, A.M., Armitage, S., Blinkhorn, J., Boivin, N., Breeze, P.S., Devra, R., Drake, N., Groucutt, H.S., Guagnin, M., Roberts, P., Petraglia, M.D.  2024. Preservation of plant‐wax biomarkers in deserts: implications for Quaternary environment and human evolutionary studies. Journal of Quaternary Science, 39 (3), pp.349-358.

How to cite: Jha, D. K., Miyash, N., Gupta, P., Rudd, R., Singh, S. P., and Roberts, P.: Plant Biomarkers in Arid Ecosystems: Molecular and Isotopic Insights from the Thar Desert, EGU General Assembly 2025, Vienna, Austria, 27 Apr–2 May 2025, EGU25-10135, https://doi.org/10.5194/egusphere-egu25-10135, 2025.

EGU25-11308 | ECS | Posters on site | BG2.4

Distribution patterns of GDGTs and n-alkanes in the central Arctic Ocean during Marine Isotope Stages 1, 2, and 3 

Akanksha Singh, Ludvig Löwemark, Sze Ling Ho, Min-Te Chen, Pei-Ling Wang, Martin Jakobsson, and Richard Gyllencreutz

Arctic sea ice plays a crucial role in regulating the Earth’s energy budget, influencing Arctic marine productivity, and the global thermohaline circulation. Its distribution also affects the transport of sediment and organic matter (OM) across the Arctic Ocean. Lipid biomarkers are essential proxies for tracing OM transport in the central Arctic. However, their sources and patterns of spatial and temporal variability during the last glacial cycle remain poorly understood. To address these knowledge gaps, our study conducted a multiproxy analysis—including total organic carbon (TOC), n-alkanes, and glycerol dialkyl glycerol tetraethers (GDGTs) on nine sediment cores from the central Arctic. The GDGT record suggests that branched GDGTs (brGDGTs) in the central Arctic are predominantly of marine origin, challenging the previously held assumption of a terrigenous source. To determine the origin of brGDGTs in this region, two indices were applied, yielding contrasting results. Elevated IIIa/IIa values during MIS 3–1 indicate a marine source, whereas #ringstetra ratios point to a terrestrial origin. However, the reliability of #ringstetra ratios in the central Arctic is likely compromised due to their sensitivity to pH variations, making the IIIa/IIa ratio a more reliable indicator of in situ brGDGT production in the region. TOC, along with terrestrial biomarkers (long-chain n-alkanes) and marine biomarkers (isoprenoid and branched GDGTs), showed the highest concentrations in the Central Lomonosov Ridge (CLR) cores, located closer to the Siberian shelves. These concentrations decreased in Lomonosov Ridge Offshore (LRG) and Morris Jesup Rise (MJR) cores, further from the shelves. This spatial pattern, combined with evidence of low productivity in the central Arctic, suggests that both marine- and terrestrial-derived biomarkers were primarily transported via sea ice drift from the Siberian shelves. This transport process persisted through MIS 3–1, albeit with reduced intensity during glacial periods. Moreover, elevated Branched Isoprenoid Tetraether (BIT) index values in the central Arctic during glacial periods likely reflect changes in crenarchaeol and brGDGT production on the shelves and/or the selective degradation of crenarchaeol during transport.

How to cite: Singh, A., Löwemark, L., Ho, S. L., Chen, M.-T., Wang, P.-L., Jakobsson, M., and Gyllencreutz, R.: Distribution patterns of GDGTs and n-alkanes in the central Arctic Ocean during Marine Isotope Stages 1, 2, and 3, EGU General Assembly 2025, Vienna, Austria, 27 Apr–2 May 2025, EGU25-11308, https://doi.org/10.5194/egusphere-egu25-11308, 2025.

EGU25-11517 | ECS | Posters on site | BG2.4

Bacteriohopanepolyols track environmental transitions in the Black Sea 

Nora Richter, Anna Cutmore, Nicole Bale, Stefan Schouten, and Darci Rush

Bacteriohopanepolyols (BHPs) are structurally diverse compounds produced by a wide range of bacteria making them ideal candidates as chemotaxonomic biomarkers and indicators of bacterially driven biogeochemical processes in the geological record. In this study, we characterize changes in the BHP distribution in the Black Sea over the past 20 ka as the basin underwent three distinct environmental phases: (i) an oxic lacustrine phase where the Black Sea was disconnected from the global ocean; (ii) a transition period marked by the initial influx of marine water into the basin; and (iii) a marine phase where the basin was permanently euxinic, i.e. the bottom water is characterized by sulfidic conditions and a lack of oxygen. During the lacustrine phase we observe a high abundance and diversity of nucleoside BHPs (Nu-BHPs) that are likely associated with high terrigenous inputs. We also find evidence of BHPs likely associated with the nitrogen-cycle. For instance, an increase in oxazinone-aminobacteriohopanetriol could indicate that there was enhanced nitrite-oxidation during the lacustrine phase. The transition phase is generally characterized by an increase in the abundance of methoxylated-BHPs and various BHPs that are generally associated with aquatic environments (e.g., aminobacteriohopanetriol). Methoxylated-BHPs also persist into the marine phase, indicating that these BHPs may be specific to saline environments. The euxinic marine phase (7.2 ka-present) is composed of two stages. The early stage is characterized by a high abundance of aminobacteriohopanetetrol and aminobacteriohopanepentol, as well as ethenolamine-bacteriohopanepentol and -bacteriohopanehexol, that are likely transported to the sediments from the shallow oxycline niche of their methanotrophic sources. The later marine phase is characterized by a decline in these BHPs, likely due to a deepening of the oxycline. The change in distribution of many BHPs throughout the record may either be attributed to microbial adaptations to significant shifts in the oxygenation and/or hydrology of the basin or are associated with specific groups of bacteria that are suited to these environmental conditions. Throughout the record, diagenetic products of BHPs (e.g., anhydrous-bacteriohopanetetrol) were detected. These BHPs, however, remain a small proportion of the overall BHP composition, indicating high preservation conditions throughout the record. This study offers new insights into changes in microbial communities and biogeochemical processes that occurred in the Black Sea during the Last Deglaciation and Holocene in response to significant shifts in the hydrology and oxygenation of the basin.

How to cite: Richter, N., Cutmore, A., Bale, N., Schouten, S., and Rush, D.: Bacteriohopanepolyols track environmental transitions in the Black Sea, EGU General Assembly 2025, Vienna, Austria, 27 Apr–2 May 2025, EGU25-11517, https://doi.org/10.5194/egusphere-egu25-11517, 2025.

EGU25-14005 | ECS | Orals | BG2.4

Climate driven Holocene variations in lipid biomarkers from Shenmihu Lake, Northeastern Taiwan 

Romy Ari Setiaji, Ludvig Löwemark, Sze Ling Ho, and Kuo Fang Huang

Lake sediment provides information on hydrogeological and environmental conditions. It contains a wide range of physical, chemical, and biological archives that could be used to reconstruct paleoclimatic trends and shifts. Applying lipid biomarker proxies to lake sediment is widely used to reconstruct past conditions. However, it is also essential to consider the stages of lake evolution. In particular, a lake that is surrounded by steep slope topography potentially has a mix of watershed and water body organic material sources. In this study, we aim to disentangle terrestrial and aquatic organic matter sources using a range of lipid biomarker proxies.

Shenmihu Lake is located in the mountains near Yilan, northeastern Taiwan, about 1000 meters above sea level, and surrounded by steep slopes and ephemeral creeks containing loose gravel that may be transported to the lake by rain or extreme weather (torrential rain, typhoon, etc.). A 9,78m long composite core was retrieved from the lake using a Russian corer, and sub-samples were taken every 20 cm from the core. The bottom part of the core was radiocarbon dated to about 10700 BP, and the age model suggests continuous sedimentation spanning the entire Holocene. The Carbon Preference Index (CPI) and Paq ratio can be used to distinguish organic material sources from terrestrial, emergent, or submerged macrophytes. The preliminary result showed that organic materials of around 8000 and 6700 BP were dominated by floating macrophytes, indicating that water fully covered the lake. A better understanding of lake succession and lake internal processes is necessary to allow extracted paleoenvironmental archives to be compared to regional and global climate records.

Keywords: Lipid biomarker, lake sediment, Russian core, Asian monsoon

How to cite: Setiaji, R. A., Löwemark, L., Ho, S. L., and Huang, K. F.: Climate driven Holocene variations in lipid biomarkers from Shenmihu Lake, Northeastern Taiwan, EGU General Assembly 2025, Vienna, Austria, 27 Apr–2 May 2025, EGU25-14005, https://doi.org/10.5194/egusphere-egu25-14005, 2025.

EGU25-17244 | ECS | Orals | BG2.4

Plant wax n-alkanes track C3-C4 vegetation transitions and hydrological responses along elevation gradients in Lesotho, southern Africa  

Rachel Rudd, Robert Patalano, Deepak Kumar Jha, Josh van Schalkwyk, Len van Schalkwyk, Rethabile Mokhachane, Brian A. Stewart, and Patrick Roberts

Understanding human adaptations to high altitude contexts, and the impact of climatic change and associated vegetation change on human societies is a key research theme in archaeological, palaeoecological, and palaeoanthropological research. In many highland regions, variations in temperature related to elevation and aspect are associated with the distribution of plants following the C3 and C4 photosynthetic pathways. In Lesotho, δ13C of soil organic matter and faunal material is commonly used in archaeological research to infer palaeoenvironmental change and its connection to changes in human behavioural and settlement patterns. However, there is limited modern reference information for δ13C in the region with which to interpret past dynamics.

We present the results of bulk δ13C and compound-specific isotope analysis (CSIA; δ13C and δ2H) of long-chain n-alkanes from modern soil samples collected from four elevation transects covering 1,800 to 3,300 m a.s.l. in eastern Lesotho, from both north- and south-facing slopes. Consistent with modern ecological observations, elevation, and, in turn, temperature, are major controls on the distribution of C3 and C4 vegetation along the transects. Bulk sediment and n-alkane (C29, C31 and C33) δ13C results from north-facing slopes track the transition from C4 dominated to C3 dominated vegetation with increasing elevation, although this transition point varies by n-alkane chain-length. On south-facing slopes, which receive less solar radiation, CSIA δ13C values largely reflect C3 dominated vegetation, including at lower elevations than on the north-facing slopes. Differences observed between the bulk sediment and CSIA δ13C results are likely related to the impact of microbial activity in the bulk sediment samples, and highlight the advantages of compound specific analysis in identifying and exploring these discrepancies.

Variability in δ2H along the transects is less distinct, but also observed, particularly between north- and south-facing slopes. Mean δ2H values between north- and south-facing slopes are offset by up to 30 ‰. The results of this study provide a reference baseline for studying past ecological change in this region, where the application of compound specific isotope analysis of sediments from archaeological sites is increasingly used to improve our understanding of past human-environment interactions in highland areas.

How to cite: Rudd, R., Patalano, R., Jha, D. K., van Schalkwyk, J., van Schalkwyk, L., Mokhachane, R., Stewart, B. A., and Roberts, P.: Plant wax n-alkanes track C3-C4 vegetation transitions and hydrological responses along elevation gradients in Lesotho, southern Africa , EGU General Assembly 2025, Vienna, Austria, 27 Apr–2 May 2025, EGU25-17244, https://doi.org/10.5194/egusphere-egu25-17244, 2025.

EGU25-18656 | ECS | Posters on site | BG2.4

Seasonal and Hydroclimatic Dynamics Revealed by δDwax and δ13Cwax in a Tropical Lake Core for the past 18 000 years 

Petter Hällberg, Rienk Smittenberg, Kweku Yamoah, Frederik Schenk, Akkaneewut Chabangborn, Sakonvan Chawchai, Minna Väliranta, and Barbara Wohlfarth

Leaf wax hydrogen isotopic composition (δDwax) is increasingly used to reconstruct precipitation variability over geological time scales. A significant advantage of δDwax analysis compared to isotopic proxies from speleothems or ice cores is that the isotopic composition of a range of n-alkanes sourced from algae, aquatic plants and terrestrial plants is measured simultaneously. This additional data allows for investigations of multiple aspects of the hydrological cycle such as dry season evapotranspiration and seasonal distribution of rainfall. However, uncertainties persist in interpreting the δD of different n-alkanes, and as a result, δDwax studies often focus on a single terrestrial n-alkane (C27, C29, or C31). The choice of n-alkane can significantly influence the reconstructed precipitation record, potentially leading to divergent interpretations. Moreover, only a subset of the available data is typically utilized, suggesting that leaf wax analyses may hold untapped potential for deeper insights. 

In this ongoing study, we explore the n-alkane distribution and hydrogen and carbon (δ13Cwax) isotopic composition from an 18 000-year-long lake core in Thailand. High-resolution radiocarbon dating (n=65) was used to construct a well-constrained age model for the deglaciation. Our results indicate that δDwax records intense wetting during the Bølling and Older Dryas periods (~14.7-13.9 ka BP). Interestingly, δ13Cwax reveals a simultaneous shift toward dry-adapted C4 plants, suggesting seasonally dry conditions that impact vegetation, while δDwax likely reflects a wet-season signal. Allerød (13.9-12.8 ka BP) is marked by drying coinciding with a shift back to wet-adapted C3 vegetation. δDwax thereby appears to be seasonally biased in this tropical lake, at least for the deglacial period. The hydroclimate response during the Younger Dryas cold period (12.8-11.7 ka BP) is ambiguous based on different n-alkanes in our δDwax record – and even sign of change varies for the C25 to C31n-alkanes. Our results thereby highlight the need to carefully consider which n-alkane to use in hydroclimate δDwax reconstructions, and we discuss what information these differences may provide. Specifically, the divergence between aquatic and terrestrial δDwax may serve as a useful indicator of drought-induced evapotranspiration in this lacustrine setting.

How to cite: Hällberg, P., Smittenberg, R., Yamoah, K., Schenk, F., Chabangborn, A., Chawchai, S., Väliranta, M., and Wohlfarth, B.: Seasonal and Hydroclimatic Dynamics Revealed by δDwax and δ13Cwax in a Tropical Lake Core for the past 18 000 years, EGU General Assembly 2025, Vienna, Austria, 27 Apr–2 May 2025, EGU25-18656, https://doi.org/10.5194/egusphere-egu25-18656, 2025.

EGU25-19275 | ECS | Orals | BG2.4

Assessing Water Depth Effects on Archaeal Lipids and Refining the TEX86 Proxy: Insights from Hadal Trenches to a Global Scale 

Wenjie Xiao, Chuanlun Zhang, Yunping Xu, Fengfeng Zheng, Wenzhöfer Frank, and Ronnie Glud

The TEX86 proxy, based on archaeal isoprenoid glycerol dialkyl glycerol tetraethers (isoGDGTs), is among the most widely used tools for reconstructing past sea surface temperatures (SST). However, the impact of water depth on isoGDGT distributions and the reliability of TEX86 remains unclear. To address this, sediments from five hadal trench regions and a comprehensive global dataset were analyzed. The findings reveal that as water depth increases, the fractional abundance of low-ring-number isoGDGTs (e.g., GDGT-1 and GDGT-2) increases, while that of high-ring-number isoGDGTs (e.g., GDGT-3 and crenarchaeol) decreases. Notably, the crenarchaeol regio-isomer, despite its high-ring structure, display an unusually higher fractional abundance in deep-sea sediments, suggesting a distinct source or history compared to other isoGDGTs. Despite the influence of water depth, isoGDGT compositions and TEX86 maintain strong correlations with SSTs across varying depths, including the deepest oceanic regions, indicating the dominance of shallow-water-derived signals in sedimentary isoGDGT pools. The influence of water depth on TEX86 is even more minimal, likely due to compensatory changes in GDGT-2 and GDGT-3 and the proxy’s inherent ratio structure. Remarkably, TEX86 provides more reliable SST estimations in deep-sea sediments compared to coastal sediments. By excluding the crenarchaeol regio-isomer from TEX86, the resulting proxy demonstrates a stronger correlation with SSTs, reduced sensitivity to water depth, and improved performance in polar regions. Consequently, newly TEX86-SST calibration models were established to enhance SST estimations globally and across regions with varying water depths.

How to cite: Xiao, W., Zhang, C., Xu, Y., Zheng, F., Frank, W., and Glud, R.: Assessing Water Depth Effects on Archaeal Lipids and Refining the TEX86 Proxy: Insights from Hadal Trenches to a Global Scale, EGU General Assembly 2025, Vienna, Austria, 27 Apr–2 May 2025, EGU25-19275, https://doi.org/10.5194/egusphere-egu25-19275, 2025.

EGU25-20766 | ECS | Orals | BG2.4

Molecular geochemistry study of carbonaceous shale from Pranhita-Godavari valley, India: Implication for source rock properties, depositional environment and thermal maturity 

Debasis Prusty, Devleena Mani, Sudip Bhattacharyya, Ritam Konar, Krittibas Das, Sesha Srinivas J, Raju Kaduru, and Ahmed Nadeem

Biomarkers are biological remnants of extinct species which are generally found in sediments. The preserved molecular structures provide crucial insights into the organic matter's origin and precursor materials and serve as valuable proxies for reconstructing the ancient sedimentary environment. These biomarker serve as "molecular fossils" that offer important clues about past environments and life. This paper presents a detailed biomarker study of the organic-rich shales from open cast coal mines of Pranhita-Godavari (P-G) valley in South Central India. The Gondwana Basins of India, including the PG, are the primary coal producing regions, contributing approximately 98-99% of the nation's total coal reserves. The Barakar and Lower Kamthi Formations of the PG basin host significant reserves of power-grade coal. The shales collected from three sub-basins, namely Godavari in northern, Kothagudem and Chintalpudi sub-basin in southern part of PG.  The presence of n-alkanes in the range of n-C12 to n-C35, along with acyclic isoprenoids i.e. pristane and phytane in majority of samples indicates that the organic matter was derived from terrestrial higher plant sources deposited in a reducing environment, except for a few. The Pr/n-C17 versus Ph/n-C18 ratios indicate that the P-G samples predominantly contain terrigenous type III kerogen with a minor contribution from mixed type II & III kerogen. Important polycyclic aromatic hydrocarbons (PAH) such as naphthalene, phenanthrene, and their alkylated derivatives, dibenzothiophene were also observed in the samples of   P-G Valley. The DBT/P ratio from several shales is high to very high (>2), indicating the marine contribution during the sediment deposition. The other important PAH identified are the pyrene, benzo[a] anthracene, fluoranthene, and benzo[a] pyrene are found in the aromatic fraction of PG shale. These aromatic biomarkers have the potential to provide better understand the origin, depositional environment, thermal maturity, and potential for hydrocarbon generation of coal deposits. The P-G Basin shalse, characterized by excellent organic richness and thermal maturity, exhibits a complex origin, reflecting contributions from both terrestrial and aquatic organic matter sources. Furthermore, the depositional environment in this basin witnessed a significant transition, shifting from marine/aquatic to terrestrial conditions during the Permian period.

How to cite: Prusty, D., Mani, D., Bhattacharyya, S., Konar, R., Das, K., Srinivas J, S., Kaduru, R., and Nadeem, A.: Molecular geochemistry study of carbonaceous shale from Pranhita-Godavari valley, India: Implication for source rock properties, depositional environment and thermal maturity, EGU General Assembly 2025, Vienna, Austria, 27 Apr–2 May 2025, EGU25-20766, https://doi.org/10.5194/egusphere-egu25-20766, 2025.

EGU25-170 | ECS | Orals | BG2.6

Evaluating the potential of Dissolved Organic Matter (DOM) analysis and characterization for the investigation of clandestine graves 

Giulia Tagliabue, Anna Masseroli, Alex Golinelli, Fulvia Tambone, Cristina Cattaneo, and Luca Trombino

The presence of a decomposing body being victim of concealment by clandestine burial represents a localized disturbance in the complex equilibrium that characterizes the turnover of organic matter in the soil. However, although intuitively a biogeochemical analysis of the soil matrix affected by the concealment should provide clear evidence of the presence of a decomposing body, the relevant literature has shown that this is not the case, particularly with regard to the observation of TOC (Total Organic Carbon). In fact, its ubiquitous nature by definition makes the abnormal concentration of organic matter a difficult proxy to identify, but one that is urgently needed for complete crime scene profiling: the ability to distinguish the natural organic matter present in a soil from that derived from the nutrient input caused by the cadaver decomposition processes would represent the operational key to guide investigators towards a more complete and informative analysis of the case. In particular, an anomaly in the concentration and distribution of organic matter within the soil may provide information regarding the Post Burial Interval (PBI) of a concealment victim, as well as be suggestive of a possible previous burial site. For this reason, at the Forensic Taphonomy Facility of the University of Milan (Ticino-LEAFs), a simulation of clandestine burials in a natural environment was carried out using cadavers of piglets that had died of natural causes as a model for human decomposition research. At pre-determined intervals, the piglets, which had undergone various treatments prior to burial (namely being covered in quicklime, wrapped in cotton clothes, and harmed post-mortem), were exhumed and soil samples were taken at different depths to monitor changes in the concentration of the organic matter with increasing exposure of the body to the environment. For this purpose, an analysis of dissolved organic matter (DOM), both natural and affected by the presence of the body, was carried out, combined with complementary spectroscopic techniques (FT-IR). This analysis revealed anomalies in the concentration of dissolved organic matter in the soil horizons containing and immediately underlying the body, also showing the presence of organic compounds otherwise absent in the undisturbed soil. However, some variability attributable to the treatments the bodies underwent prior to burial was also observed, namely the presence of quicklime, which seems to be able to further disrupt the hypogeal environment. The rapidity of the analysis, its relative inexpensiveness, and the small amount of soil sample required could make this technique an innovative tool to be incorporated into forensic casework to help estimate the post-burial interval in the investigation of clandestine burials.

How to cite: Tagliabue, G., Masseroli, A., Golinelli, A., Tambone, F., Cattaneo, C., and Trombino, L.: Evaluating the potential of Dissolved Organic Matter (DOM) analysis and characterization for the investigation of clandestine graves, EGU General Assembly 2025, Vienna, Austria, 27 Apr–2 May 2025, EGU25-170, https://doi.org/10.5194/egusphere-egu25-170, 2025.

EGU25-2312 | Orals | BG2.6

Molecular dynamics simulations of dissolved humic substances: can small molecules maintain stable large associates?  

Mikhail Borisover, Drazen Petrov, Chris Oostenbrink, and Edgar Galicia-Andrés

Molecular modeling and molecular dynamics (MD) simulations are capable of improving our molecular-level understanding of natural organic matter (NOM) by providing new alternatives such as virtual experiments that may be difficult (or even impossible) to perform in real tests. The fine control of molecular structure required in molecular simulations is highly valuable and significant due to the fact that neither the structure nor (often) detailed composition of real NOM is known. The control of molecular structure and its educated variation guided by experimental data on 13C NMR-derived composition may be performed using Vienna Soil Organic Matter Modeller (VSOMM) [1], which allows accounting for the simultaneous presence of multiple NOM molecules of different structures. This work exploring the VSOMM is focused on examining how and whether the humic substances (HS) models representing Leonardite humic acid (LHA) can maintain stable associates in water. In this approach, the stability of HS aggregates was elucidated in the 100 ns MD simulations by varying amounts of water in a broad range, from representing "water solution in NOM" to aqueous dissolved NOM, and modifying molecular size and extent of ionization of HS models, and the type of counter-ions (Na+ vs Ca2+). Multiple properties characterizing HS-water systems have been calculated, e.g., cumulative coordination numbers, numbers of HS-HS and HS-water contacts and H-bonds at short-range distances, number and size of formed clusters as well as energies of Coulomb and Lennard-Jones interactions of HS with ions (Na+ or Ca2+), HS and water. One outcome of this modeling work is that it shows how HS dilution leads to the decomposition of HS aggregates which occurs, in particular in the presence of the Na+ counter ion, gradually. The results of this work are placed into the context of experimental data and discussion on whether the detected large HS sizes can be assigned to the presence of large aggregates and the formation of supramolecular structures [2]. Although strong interactions between HS molecules may lead to small stable aggregates (e.g., dimers) persisting during dilution, the modeling suggests that the formation and decomposition of HS associates is "a step-wise" process, and, together with experimental data on LHA dialysis proposes that large-size HS molecules (aggregated or not) may need to be taken into account while examining HS properties in aqueous solutions.

[1] Escalona, Y., Petrov, D., & Oostenbrink, C. (2021). Vienna soil organic matter modeler 2 (VSOMM2). Journal of Molecular Graphics and Modelling103, 107817.

[2] Borisover, M., Petrov, D., Oostenbrink, C., & Galicia-Andrés, E. (2025). Diluting humic substances in water in molecular dynamics simulations: Are aggregates stable? Colloids and Surfaces A: Physicochemical and Engineering Aspects704, 135507.

How to cite: Borisover, M., Petrov, D., Oostenbrink, C., and Galicia-Andrés, E.: Molecular dynamics simulations of dissolved humic substances: can small molecules maintain stable large associates? , EGU General Assembly 2025, Vienna, Austria, 27 Apr–2 May 2025, EGU25-2312, https://doi.org/10.5194/egusphere-egu25-2312, 2025.

The No. 2 structural belt in the Nanpu sag of the Bohai Bay Basin, China, is characterized by multiple sub-sags and a multi-layered hydrocarbon supply. To investigate its complex oil and gas sources, geochemical tests, including chromatography-mass spectrometry, were conducted to analyze the crude oil's geochemical characteristics. This technique, known for its precision in identifying and quantifying complex molecular structures, is particularly effective for source identification, maturity assessment, and understanding the transformation processes of organic matter during hydrocarbon formation. The crude oil is categorized into three types, with specific sources identified for each. The results show the following: (1) Type I crude oil, predominantly found in the third member of the Eocene Shahejie Formation (Es3) reservoir in the western structural belt, exhibits a similar relative content of C27 and C29 regular steranes. Its pregnane parameters ((pregnane + homopregnane)/regular sterane) and sterane isomerization parameters (C29 sterane 20S/(20R+20S), C29 sterane ββ/(αα+ββ)) are relatively high, suggesting a combined input from aquatic organisms and higher plants. This crude oil displays high maturity and is sourced from the Es3 source rock. (2) Type II crude oil is mainly distributed in the second member of the Eocene Dongying Formation (Ed3) reservoir in the western structural belt. It is characterized by a predominance of C29 regular steranes, with lower pregnane and sterane isomerization parameters, indicating a significant contribution from higher plants. This crude oil is less mature and originates from the Es1-Ed3 source rocks. (3) Type III crude oil, primarily found in the Ed3 reservoirs of the eastern structural belt and in the Ed1 and Minghuazhen Formation of the western structural belt, shows a higher C29 regular sterane content, lower pregnane parameters, and higher sterane isomerization parameters. This crude oil is largely derived from higher plants, with higher maturity and a composite source from three hydrocarbon source rocks. The 4-/1-MDBT and Ts/Tm indices of the crude oil show a decreasing trend towards the shallow strata along the fault. Notably, the vitrinite reflectance values derived from the methylphenanthrene in the crude oil align with the vitrinite reflectance of the underlying source rock, indicating that the crude oil originates from these underlying source rocks rather than the hydrocarbon generation center's source rock. The study's findings provide valuable theoretical guidance for optimizing hydrocarbon exploration strategies, such as identifying shallow reservoirs with higher economic potential, improving understanding of oil-source rock correlations, and targeting deeper strata with significant resource potential. These insights contribute to advancing knowledge of the biogeochemical processes of organic matter transformation during hydrocarbon formation and offer practical implications for both shallow and deep exploration strategies.

How to cite: Ouyang, G.: Application of Geochemical and Mass Spectrometric Data in Oil-Source Rock Correlation: A Case Study from the No.2 Structural Belt in Nanpu Sag, Bohai Bay Basin, China, EGU General Assembly 2025, Vienna, Austria, 27 Apr–2 May 2025, EGU25-2514, https://doi.org/10.5194/egusphere-egu25-2514, 2025.

Cold seeps are critical hotspots in marine ecosystems, where the biogeochemical processes of dissolved organic matter (DOM) significantly impact regional carbon reservoirs and the global ocean carbon cycle. To clarify the impact of cold seep activity on the production, transportation and transformation of DOM, we employed Fourier transform ion cyclotron resonance mass spectrometry (FT-ICR MS) to analyze DOM from the water column and sediment overlying water collected from cold seep and non-cold seep regions in the northern South China Sea. Our results showed that the overlying water in cold seeps contained a greater diversity of unique molecules, with a larger proportion of sulfur-containing compounds compared to the non-cold seep area. Approximately half of these unique molecules, characterized by lower H/C ratios, higher molecular weights, and a predominance of highly unsaturated compounds (82.3%), were transferred to the corresponding bottom water during the bubbling process. In contrast, molecules with higher H/C ratios, lower molecular weights, and a larger proportion of aliphatics compounds (40.8%) were lost. Additionally, the bottom water of the active cold seep exhibited the formation of some labile molecules (H/C > 1.5) with lower aromaticity (AImod < 0.25) and the decomposition of nitrogen-containing carboxyl-rich alicyclic molecules (CRAMs) with higher aromaticity, driven by the positive priming effect. These findings highlight the profound influence of cold seep activity on DOM properties and dynamics, providing deeper insights into the complex biogeochemical processes in cold seep ecosystems and their critical implications for marine carbon cycling.

How to cite: Tang, S., Yan, Z., Yi, Y., Shen, Y., Xie, W., He, D., and Li, P.: Transportation and Transformation of Dissolved Organic Matter from Overlying to Bottom Waters of Cold Seeps in the South China Sea: Insights at the Molecular Level , EGU General Assembly 2025, Vienna, Austria, 27 Apr–2 May 2025, EGU25-2677, https://doi.org/10.5194/egusphere-egu25-2677, 2025.

EGU25-3231 | Posters on site | BG2.6

Intermediate products during natural organic matter biogeochemical processing, a case study inducing photo transformations followed by liquid chromatography-ultrahigh resolution mass spectrometry 

Peter Herzsprung, Wolf von Tümpling, Aleksandr Sobolev, Norbert Kamjunke, Michael Schwidder, and Oliver J. Lechtenfeld

Not only the quality but also the fate of natural organic matter (NOM) is of broad environmental interest. NOM reactivity is insufficiently understood due to a lack of experiments with high temporal resolution, particularly with respect to polarity of NOM molecules. By coupling ultrahigh performance liquid chromatography (UHPLC) with ultrahigh resolution Fourier transform ion cyclotron resonance mass spectrometry (FT-ICR-MS), insights into the polarity (hydrophilic versus hydrophobic) of NOM compounds can be obtained.

Previous studies addressing NOM reactivity often focused on the fate of molecules – suggesting whether a molecule was degraded, a new molecule was produced, or if the molecule remain unchanged i.e., was resistant to the process of interest. By high time resolution, the reaction time course of molecules can be tracked. Of particular interest is, whether intermediate products can be observed, meaning their abundance initially increases and then decreases during an experiment. In this study, we irradiated a sample from a wastewater treatment plant with light, capturing data with a temporal resolution of 8 time points.

Full profile UHPLC-FT-ICR-MS chromatograms were segmented into 13 one-minute wide segments. Molecular formulas were assigned up to masses of 1000 Da by allowing at most two nitrogen atoms and one sulfur as non-oxygen hetero atoms.

The main findings indicate that the average (from 13 segments) number of intermediate products (800) was in the same order of magnitude as degraded components (1000). The average number of resistant molecules was lower (250), while the number of products was one order of magnitude smaller (65) compared to the intermediate products. More polar CHNO products and intermediate products were detected compared to CHO, which exhibited a higher number of products, degraded MFs and intermediate products with decreasing polarity. The polarity resolution, as evidenced by chromatographic retention, revealed that the same MF can have different reactivity.

From approximately 10,000 assigned MFs more than 2,000 were identified both as degraded and intermediate product, depending on their polarity. About 100 MFs were classified as both products and intermediate products. Notably, at least three reactivity types – product, intermediate product and degraded – could be assigned to about 90 MFs.

In conclusion, the investigation of DOM reactivity requires a combination of high mass resolution (FT-ICR-MS), chromatographic / polarity resolution and high temporal or spatial resolution within the experiment time setup.

How to cite: Herzsprung, P., von Tümpling, W., Sobolev, A., Kamjunke, N., Schwidder, M., and Lechtenfeld, O. J.: Intermediate products during natural organic matter biogeochemical processing, a case study inducing photo transformations followed by liquid chromatography-ultrahigh resolution mass spectrometry, EGU General Assembly 2025, Vienna, Austria, 27 Apr–2 May 2025, EGU25-3231, https://doi.org/10.5194/egusphere-egu25-3231, 2025.

Obtaining real-time estimations of DOC concentration, reactivity and fate requires the ability to detect changes in the chemical composition of DOM. Optical sensors are increasingly used for this purpose but are typically incapable of distinguishing between variability caused by changes in the quantity versus quality of DOM.

This study developed a new fluorescence index for detecting changes in the composition of DOM. The aromaticity index (ARIX) links the fluorescence composition of aquatic dissolved organic matter to its SUVA aromaticity and predicts ratios between FT-ICR MS molecular formulae and between LC-OCD fractions. In datasets showing decoupling between DOC and absorbance due to biogeochemical processing, the correlation between DOC and absorbance measurements was significantly improved by accounting for interactions between absorbance and ARIX.

A meta-analysis spanning seven continents indicated a linear relationship tying SUVA to ARIX in bulk and extracted freshwater DOM. For DOM isolates, linearity extended into the oceans. These results provide new insights into the relationships between measurements obtained using different techniques for evaluating dissolved organic matter composition. They further have exciting implications for field studies involving water quality monitoring using optical sensors.

How to cite: Murphy, K.: Improving the estimation of DOC concentrations and aromaticity from optical measurements, EGU General Assembly 2025, Vienna, Austria, 27 Apr–2 May 2025, EGU25-4423, https://doi.org/10.5194/egusphere-egu25-4423, 2025.

EGU25-4657 | ECS | Orals | BG2.6

Thermodynamic property and equilibrium state drive the spatial pattern of dissolved organic matter refractory in global ocean 

Zhenwei Yan, Yu Xin, Ruanhong Cai, Yuanbi Yi, Penghui Li, and Ding He

Marine dissolved organic matter (DOM) has been studied for decades in understanding of its compositions and cycling. Advances in analytical techniques have revealed that marine DOM is a complex mixture of thousands of molecules. Two theories, concentration threshold and molecular composition, provide insights into DOM cycling in the global ocean, either separately or in conjunction. This study integrates four groups of incubation experiments with 1,104 DOM samples collected from across the global ocean to calculate the thermodynamics and chemical equilibrium state of each individual DOM formula, utilizing molecular composition data obtained from Fourier transform ion cyclotron resonance mass spectrometry. Our findings indicate that marine DOM transitions from a thermodynamic nonequilibrium state to an equilibrium state during the degradation process. In addition, refractory DOM was found to be a group of molecules that have approached a relative equilibrium state, leading to its bulk stability. In-house incubation experiments, observations from the open ocean water column and the global conveyor belt further consolidate this finding. We conclude that the transformation of marine DOM is influenced by both concentration and composition, which together determine its thermodynamic properties, reactivity, and refractory characteristics in the global ocean.

How to cite: Yan, Z., Xin, Y., Cai, R., Yi, Y., Li, P., and He, D.: Thermodynamic property and equilibrium state drive the spatial pattern of dissolved organic matter refractory in global ocean, EGU General Assembly 2025, Vienna, Austria, 27 Apr–2 May 2025, EGU25-4657, https://doi.org/10.5194/egusphere-egu25-4657, 2025.

EGU25-5872 | Posters on site | BG2.6

Soil Washing with Humic Acid: A toxicity constraintment technique for a successful soil remediation 

Marios Drosos, Maria Antonopoulou, Ioanna Efthimiou, Li Xiong, Meng Li, Evangelos Giannakopoulos, Georgios Salahas, Vlastos Dimitris, Antonio Scopa, and Alessandro Piccolo

Natural organic matter (NOM), can be multifunctional, since besides its application in agriculture to increase soil fertility, it can be also used in the soil remediation from either heavy metals, or from persistent organic contaminants. Polycyclic aromatic hydrocarbons (PAHs) and polychlorinated biphenyls (PCBs) are major organic contaminants of polluted soils and represent a considerable health and environmental hazard due not only to their carcinogenic, mutagenic, and teratogenic properties, but also to their great persistence in soils conferred by a high hydrophobicity. The use of synthetic surfactants to remediate contaminated sites is limited by their intrinsic toxicity towards soil microorganisms that hinders further biodegradation of pollutants and a balanced biological activity in the washed soils. Alternatively, the use of biosurfactants in washings of polluted soils have been increasingly proposed in recent years. Among biosurfactants, NOM fractions have been recognized to be capable of incorporating PAHs and PCBs, increasing aerobic degradation of recalcitrant soil contaminants and effectively washing away pollutants from soils. Herein a soil sample collected in 1999 from a highly contaminated site around the former chemical plant of ACNA (near Savona) in Northern Italy was used. Humic acid (HA) was isolated from a North Dakota Leonardite (Mammoth, Chem. Co., Houston, Texas), and purified. 50g of soil were suspended with 500ml of HA (10g L-1) at pH7 for 24h. The suspension was then centrifuged at 3000rpm and the HA solution was filtered and collected. 200ml of milli-Q water were added to the residual soil and after suspension, centrifugation and filtration were added to the HA collected before, and freeze-dried. Off-line pyrolysis of 1g of soil and of 50mg of HA before and after the soil washing was conducted and the materials extracted were subjected to GC-MS analysis. Aliivibrio fischeri Bioluminescence Inhibition Test was used to assess the ecotoxicity of the HA before and after the treatment, using Microtox Model 500 Toxicity Analyzer (Azur Environmental) following the 81.9% basic test protocol. Bioluminescence was recorded after 15 min of exposure. GC-MS results of ACNA soil resulted in 1464±206mg kg-1 PAHs before soil washing (BSW) and 2.95±0.4mg kg-1 after soil washing (ASW), and in 151±14mg kg-1 PCBs BSW and 0.18±0.02mg kg-1 ASW. At the same time no PAHs or PCBs were identified at the HA BSW, but in HA ASW (100mg) 1656±175mg PAHs and 163±17mg PCBs were spotted. Atomic Adsorption Analysis (AAS) on HA and soil BSW and ASW, showed no heavy metal toxicity. The ecotoxicological results of the HA BSW shown a 0.89±0.01% inhibition, which was slightly increased ASW (1.85±0.11%). In both cases the HA was found to not cause ecotoxicity effects. This stunning result, indicates that when the aromatic pollutants come in contact with the humic supramolecular matrix, they are incorporated in the humic hydrophobic domains by forming stable π-π bonds with the humic aromatic constituents and, thus, are no-longer bioactive. This finding can be a milestone on the use of humics as materials for environmental remediation.

How to cite: Drosos, M., Antonopoulou, M., Efthimiou, I., Xiong, L., Li, M., Giannakopoulos, E., Salahas, G., Dimitris, V., Scopa, A., and Piccolo, A.: Soil Washing with Humic Acid: A toxicity constraintment technique for a successful soil remediation, EGU General Assembly 2025, Vienna, Austria, 27 Apr–2 May 2025, EGU25-5872, https://doi.org/10.5194/egusphere-egu25-5872, 2025.

EGU25-6737 | ECS | Orals | BG2.6

Development of a High-Sensitivity LC-MS Orbitrap Eclipse Methodology for the Detection of PAH Derivatives 

Maria Bou Saad, Henri Wortham, Pierre Doumenq, Brice Temime-roussel, Sylvain Ravier, Amandine Durand, Vincent Gaudefroy, Jean-Philippe Terrier, Olivier Burban, and Audrey Pevere

Polycyclic aromatic hydrocarbons (PAHs) and their derivatives, such as nitro-PAHs and oxygenated PAHs (oxy-PAHs), are persistent organic pollutants with significant environmental and health impacts. PAHs are primarily emitted through incomplete combustion processes and are well-recognized for their carcinogenic and mutagenic potential. While most studies have focused solely on the 16 parent PAHs classified by the US-EPA (US Environmental Protection Agency), PAH derivatives remain underexplored due to analytical difficulties, including low environmental concentrations and complex sampling matrices.

For these reasons, a methodology for analyzing nitro and oxy-PAHs in atmospheric matrices was developed on an HR-MS (LC-MS Orbitrap Eclipse) using an Atmospheric Pressure Chemical Ionization (APCI) in both positive and negative modes with a resolution of 60 000. This method demonstrated excellent sensitivity, achieving a detection limit of 0,03 ng m-³ for targeted PAH derivatives with a calibration range extended from 0.3 µg L-1 to 15 µg L-1 equivalent to 0.03 ng m-3 to 1.5 ng m-3 (considering an air sample volume of 10 m³ and a sample volume of 1 mL after extraction and concentration) with excellent linearity (correlation coefficient >0.99), ensuring the accuracy and reliability of quantification across a wide concentration spectrum. The technique also incorporated rigorous validation steps, including precision, robustness, and accuracy to confirm its reliability for trace-level measurements.

Finally, the methodology was applied to emissions from different asphalt formulations using a laboratory prototype that simulates road asphalt production conditions. Filters were collected, extracted, and analyzed using LC-MS Orbitrap. This enabled the detection and analysis of specific (PAHs) and their derivatives, demonstrating its capability to simultaneously identify and quantify a wide range of these compounds.

How to cite: Bou Saad, M., Wortham, H., Doumenq, P., Temime-roussel, B., Ravier, S., Durand, A., Gaudefroy, V., Terrier, J.-P., Burban, O., and Pevere, A.: Development of a High-Sensitivity LC-MS Orbitrap Eclipse Methodology for the Detection of PAH Derivatives, EGU General Assembly 2025, Vienna, Austria, 27 Apr–2 May 2025, EGU25-6737, https://doi.org/10.5194/egusphere-egu25-6737, 2025.

EGU25-7651 | ECS | Orals | BG2.6 | Highlight

Underestimated input of terrestrial dissolved organic carbon to the ocean 

Yuanbi Yi, Andrew Tanentzap, Chen He, Julian Merder, Helena Osterholz, Hongyan Bao, Jeffrey Hawkes, Ruanhong Cai, Siliang Li, Quan Shi, Sheng Xu, Chuanlun Zhang, Meixun Zhao, and Ding He

The contribution of terrestrial dissolved organic matter (DOM) to the ocean has been an enigma for decades. Tracking terrestrial DOM in the ocean has proven challenging due to factors such as the instability of terrestrial biomarkers, indistinguishable carbon isotopes from biogeochemical fractionation, and similar chemical composition between terrestrial and oceanic DOM. Here we show that the terrestrial contribution to oceanic organic carbon pools is 2 to 3 times higher than previously assumed, highlighting the need to adjust global carbon cycle models. We derive these estimates by bridging high-performance liquid chromatography with ultra-high resolution mass spectrometry to investigate the presence of terrestrial molecules that are transported from rivers to the ocean and estimate their contribution to oceanic DOM. We identified 269 molecular formulae that are likely transported from land to the ocean. These formulae exhibited resistance to biological and photochemical degradation in incubation experiments, and were widely distributed in global rivers, marginal seas and open oceans, suggesting that they are ubiquitous in inland and ocean waters and have a similar source. By relating the abundances of terrestrially derived molecular formulae to dissolved organic carbon concentrations, we estimated that a mean of 21.7 (16.7-25.0)% of oceanic DOM is likely derived from rivers.

How to cite: Yi, Y., Tanentzap, A., He, C., Merder, J., Osterholz, H., Bao, H., Hawkes, J., Cai, R., Li, S., Shi, Q., Xu, S., Zhang, C., Zhao, M., and He, D.: Underestimated input of terrestrial dissolved organic carbon to the ocean, EGU General Assembly 2025, Vienna, Austria, 27 Apr–2 May 2025, EGU25-7651, https://doi.org/10.5194/egusphere-egu25-7651, 2025.

EGU25-9137 | ECS | Orals | BG2.6

Efficient microbial sequestration of organic nitrogen in the eastern Indian Ocean 

Yixue Zhang, Shuchai Gan, Ying Wu, Jing Zhang, and Qi Ye

The formation of recalcitrant Dissolved Organic Matter (DOM) pools in the ocean has been a longstanding challenge due to the chemical complexity of DOM. Linking nitrogen sequestration and microbial reworking via the production of recalcitrant Dissolved Organic Nitrogen (DON) molecules remains elusive. Here, we characterized intricate molecular composition of DOM using FT-ICR-MS, with a particular emphasis on DON, across  three representative regions in the tropical eastern Indian Ocean. Our findings demonstrated the microbial origin of DON in epipelagic waters, with ammonia-oxidizing archaea exerting important control on the enrichment of peptide-like compounds. Microbial respiration was identified as a key driver of DOM transformation throughout the water column. This process enhanced the recalcitrance of DOM and DON by generating molecules with high levels of unsaturation and oxidation, characterized by low bioavailability. These effects were most pronounced in the equatorial region, which demonstrated an exceptional capacity to accumulate nitrogen-rich compounds through microbial processing, thereby facilitating to long-term nitrogen sequestration. Furthermore, we provided a valuable dataset representing microbially derived recalcitrant DON. Our study highlights that a small fraction of DOM with comparatively higher bioavailability is selectively preserved, though the majority of DON persists in the deep ocean due to its recalcitrant nature. This work provides novel molecular-level insights into microbially derived recalcitrant DON molecules, and holds significant implications for the detailed interpretation of global nitrogen sequestration.

How to cite: Zhang, Y., Gan, S., Wu, Y., Zhang, J., and Ye, Q.: Efficient microbial sequestration of organic nitrogen in the eastern Indian Ocean, EGU General Assembly 2025, Vienna, Austria, 27 Apr–2 May 2025, EGU25-9137, https://doi.org/10.5194/egusphere-egu25-9137, 2025.

EGU25-9191 | ECS | Posters on site | BG2.6

Bulk characteristics and dynamics of atmospheric PM from urban and rural coastal sites in the Northwestern Mediterranean area 

Mingchen Wei, Kalliopi Violaki, Laure Papillon, Edouard Bard, Philippe Kerhervé, Athanasios Nenes, and Christos Panagiotopoulos

Atmospheric particulate matter (PM) significantly impacts Earth's climate, air quality, visibility, and public health. PM influences the carbon cycle, ocean-atmosphere interactions, and global dynamics. The Mediterranean Sea, a highly climate-sensitive ecosystem, faces growing vulnerability from rising demographic and economic pressures. As part of the FIRETRAC project, we monitored total suspended particles (TSP) for two years at two Northwestern Mediterranean sites: urban Marseille and rural Banyuls-sur-Mer, both in the Gulf of Lions. Chemical analyses (metals, ions, organic carbon (OC), elemental carbon (EC), water-soluble organic carbon (WSOC), and water-soluble total nitrogen (WSTN)), and isotopic techniques (δ¹³C and Δ¹⁴C) along with statistical methods were used to detect TSP composition, sources, and dynamics.

TSP particles from Banyuls (-26.31 ± 0.52 ‰) and Marseille (-26.23 ± 0.51 ‰) showed comparable δ¹³C values, indicating a predominantly terrestrial origin. Apparent radiocarbon ages (Δ¹⁴C) ranged from 940 to 5000 years, pointing to a complex mixture of sources with varying reactivities. Additionally, HYSPLIT modeling revealed long-range transport from diverse regions, including the Sahara Desert, Eastern European industrial zones, and Northern Europe, contributing to the particulate matter in the Northwestern Mediterranean Sea. 

These findings suggest that TSP at both sites likely represent a mixture comprising both anthropogenic and natural sources which is further supported by the analysis of other chemical constituents.

Thus at the Marseille site, the Fe-Al correlation reached 0.94 (p < 0.0001, n=59), and during periods of higher concentrations, the HYSPLIT back-trajectory model confirmed its origin from natural source: Saharan dust. Conversely, at both sites, the strong correlation of Mn-Pb (r = 0.88 in Banyuls, 0.97 in Marseille, p < 0.0001, n=60), along with evidence from the HYSPLIT and PCA analysis, indicates shared sources, including industrial emissions and long-range pollution (via routes crossing the Atlantic Ocean, the industrial regions of southern Spain, and southern France). The OC and EC concentrations were relatively similar between the two sites (12.34 ± 5.56 µg·m-³ in Banyuls versus 9.59 ± 4.91 µg·m-³ in Marseille). Banyuls exhibited higher OC/EC ratios, indicating more secondary organic carbon, while Marseille showed stronger primary emissions. Seasonal variations in WSOC and WSTN concentrations suggest their dependence on local emissions and atmospheric seasonal processes. The higher WSTN/WSOC ratio observed in Marseille (0.51 ± 0.34 µg·m-³ compared to 0.36 ± 0.18 µg·m-³ in Banyuls) highlights greater nitrogen contributions, likely attributed to urban pollution.

Prncipal component analysis (PCA) showed that PC1 (41.9% variance) is dominated by OC, EC, WSOC, WSTN, and heavy metals (e.g., Pb, Zn, Cu), indicating anthropogenic influences like combustion and industrial emissions. In contrast, PC2 (15.4% variance) was driven by Na, Mg, Sr, and K, representing natural sources such as marine aerosols and soil dust. These findings suggest that regional pollution is largely driven by human activities but moderated by natural background sources, offering key insights for pollution source analysis.

Overall, this study reveals that TSP in the Northwestern Mediterranean Sea originates from a complex interplay of anthropogenic and natural sources, influenced by both local emissions and long-range transport and ongoing research in our lab focuses on specific BB tracers of TSP including anhydrosugars and PAHs.

How to cite: Wei, M., Violaki, K., Papillon, L., Bard, E., Kerhervé, P., Nenes, A., and Panagiotopoulos, C.: Bulk characteristics and dynamics of atmospheric PM from urban and rural coastal sites in the Northwestern Mediterranean area, EGU General Assembly 2025, Vienna, Austria, 27 Apr–2 May 2025, EGU25-9191, https://doi.org/10.5194/egusphere-egu25-9191, 2025.

EGU25-9688 | Posters on site | BG2.6

Reactive oxygen species produce and diversify low-molecular weight dissolved organic matter from laminarin and chitin 

Hannelore Waska, Sahithya Phani Babu Vemulapalli, Vitor Piotto de Oliveira, and Thorsten Dittmar

Reactive oxygen species (ROS) are continuously produced by abiotic and biotic processes in the worlds’ oceans. Their contribution to shaping the marine dissolved organic matter (DOM) composition is not well known, because ROS-DOM interactions likely occur stochastically and on short timescales. Long-standing research from medical and environmental engineering fields has shown that hydroxyl radicals (OH*) produced from UV/H2O2 treatments can depolymerize large biomolecules and partially decompose them to CO2. We therefore investigated whether laminarin and chitin, two abundant polysaccharides in the surface ocean, can be transformed in combined UVA/H2O2 experiments. Overall, we found little indication of laminarin and chitin net mineralization. Instead, chitin in suspension was partially solubilized to DOM, and both substrates were depolymerized and molecularly diversified, evidenced by a net increase of sugar oligo- and monomeric molecular formulae and new, unknown compounds detectable with ultra-high resolution mass spectrometry and high-field two-dimensional nuclear magnetic resonance spectroscopy. If such depolymerization occurs in the surface ocean, it would render large biopolymers ready for immediate microbial uptake without the aid of costly enzymes, while also contributing to the structural complexity of the DOM geometabolome. Based on our study we suggest that radical reactions continuously re-work marine organic matter in the background, exerting a so-far neglected influence on its availability as a substrate for heterotrophic consumers from both an intrinsic and emergent stability perspective.

How to cite: Waska, H., Vemulapalli, S. P. B., de Oliveira, V. P., and Dittmar, T.: Reactive oxygen species produce and diversify low-molecular weight dissolved organic matter from laminarin and chitin, EGU General Assembly 2025, Vienna, Austria, 27 Apr–2 May 2025, EGU25-9688, https://doi.org/10.5194/egusphere-egu25-9688, 2025.

EGU25-10016 | ECS | Orals | BG2.6

Influence of oxygen concentration on the elemental and molecular composition of marine dissolved organic matter in anoxic basins 

Marit Renken, Thorsten Dittmar, Lennart Stock, Felix J. Elling, Ian P. G. Marshall, and Gonzalo V. Gomez-Saez

Over the last 50 years, the permanently anoxic regions in the ocean have quadrupled in size due to deoxygenation derived from global warming and climate change. Marine anoxic basins are characterized by strong vertical redox variability. In the deep, anoxic waters of these basins, bulk measurements showed an increase in concentration of some dissolved organic matter (DOM) components such as dissolved organic carbon (DOC) and dissolved organic sulfur (DOS). However, the direct abiotic effect of deoxygenation and oxygen variability into the DOM composition remains unclear. In this study, we combined state-of-art techniques in analytical chemistry, including Fourier-transform ion-cyclotron-resonance mass-spectrometry (FT-ICR-MS), inductively coupled plasma optical emission spectroscopy (ICP-OES) and high temperature catalytic oxidation (HTCO), to quantitatively and qualitatively characterize the elemental (dissolved organic C, N, S and P) and molecular composition of DOM in three anoxic basins: the Mariager Fjord (Denmark, North Sea), the Gotland Basin (Baltic Sea), and the Black Sea. Samples were grouped in function of in situ oxygen concentration into three categories: oxic (>20 µM O2), hypoxic (1 - 20 µM O2) and anoxic (<1 µM O2). In addition, we abiotically incubated samples from oxic-to-anoxic transition zone of the Gotland Basin (2.5, 55, 66, and 240 m depths) for 17 and 45 days at >200 µM and <1 µM O2 concentration in the dark, continuously monitoring oxygen concentration by optical sensors inside a closed system previously flushed with N2 air. Our results show that elemental composition of DOM follows similar vertical patterns in all three anoxic basins as a function of the different oxygen zonation. The highest concentration of DOS and dissolved organic nitrogen (DON) was detected in deep anoxic waters. In contrast, DOC and dissolved organic phosphorus (DOP) concentration was highest in oxic waters. At a molecular level, we identified a total of 8600 molecular formulas, mostly including CHO, CHON, and CHOS compounds. Largest dissimilarities (<53% Bray Curtis) were found in the DOM signature when comparing the three sites, particularly linked to aromatic and highly unsaturated compounds, suggesting specific autochthonous processes having a key role in shaping the DOM composition in each anoxic basin. However, the proportion of DOS-related molecular formulas increased under anoxic conditions at the three sites, especially in the deep, sulfidic waters of the Black Sea, pointing towards common abiotic processes playing a key role (e.g. DOM sulfurization). Furthermore, preliminary results of the abiotic incubation experiment revealed some degree of selectivity in the molecular formulas affected by abiotic exposure to oxygen. Namely, after 45 days being exposed to oxygen, a 5 – 16% of the total DOM showed differences in their intensities, being half of them DON, DOS and DOP molecular formulas. Our study reveals novel insights into DOM composition in anoxic basins and provides a conceptual framework for future studies investigating the impact of deoxygenation in the ocean.

How to cite: Renken, M., Dittmar, T., Stock, L., Elling, F. J., Marshall, I. P. G., and Gomez-Saez, G. V.: Influence of oxygen concentration on the elemental and molecular composition of marine dissolved organic matter in anoxic basins, EGU General Assembly 2025, Vienna, Austria, 27 Apr–2 May 2025, EGU25-10016, https://doi.org/10.5194/egusphere-egu25-10016, 2025.

EGU25-10494 | ECS | Posters on site | BG2.6

The impact of the western boundary Kuroshio current on dissolved organic nitrogen cycling in the South China Sea 

Lin Wen, Sijing Kang, and Xiaolin Li

The dissolved organic nitrogen (DON) supplied horizontally from open ocean to marginal seas through western boundary current can influence upper regional nitrogen cycling. However, the observation on DON and its biogeochemical impacts on marginal seas are scarce. In this study, we investigated the distribution and degradation of DON transported by Kuroshio intrusion and its role in nitrogen cycling in the northern South China Sea (nSCS). The concentration and δ15N of DON fall in a relatively narrow range in the upper 100 m water column (4.3 ± 0.6 μM and 3.5 ± 1.6‰ vs. air, respectively; ± SD). The mean DON δ15N above 100 m is lower than the nitrate δ15N of in the “shallow subsurface” (below 100 m; 4.8 ± 1.2‰) but is higher than the δ15N of suspended particles in the surface ocean (~1.9 ± 0.5‰). This isotopic relationship between DON and suspended particles can be explained by the cycling of N between particulate organic nitrogen (PON), and DON, in which an isotope effect associated with DON degradation preferentially concentrates 15N in DON. Accordingly, a negative correlation (r = 0.72) between the concentration and the δ15N of DON is observed in the upper 100 m, suggesting an isotope effect of ~7.2 ± 1.0‰ for DON degradation. Furthermore, using an isopycnal mixing model, the exchange and biodegradation processes of Kuroshio-intruded DON were also quantified. We estimated the amount of DON carried by the Kuroshio intrusion was approximately 0.93 mmol m-2 d-1 in the upper 100 m. Concomitantly, the amount of nitrogen released from the enhanced DON degradation by Kuroshio intrusion is comparable to the supply deeper water and nitrogen fixation in surface waters. This study suggests that the enhanced biodegradation of DON during the western boundary currents intrusion could serve as an important nutrient source to marginal seas.

How to cite: Wen, L., Kang, S., and Li, X.: The impact of the western boundary Kuroshio current on dissolved organic nitrogen cycling in the South China Sea, EGU General Assembly 2025, Vienna, Austria, 27 Apr–2 May 2025, EGU25-10494, https://doi.org/10.5194/egusphere-egu25-10494, 2025.

EGU25-10553 | ECS | Orals | BG2.6

Multi-Pressure Chemical Ionization Mass Spectrometry: Comprehensive Analysis of Complex Gas Mixtures 

Aleksei Shcherbinin, Henning Finkenzeller, Hans-Jurg Jost, Fariba Partovi, Netta Vinkvist, Jyri Mikkila, Jussi Kontra, Juha Kangasluoma, and Matti Rissanen

Chemical Ionization Mass Spectrometry (CIMS) is a well-established analytical method in atmospheric research, process monitoring, forensics, breathomics and food science. Despite significant advancements in procedural techniques, several instrument configurations, especially operating at different ionization pressures, are typically needed to analyze the full range of compounds from non-functionalized parent compounds to their functionalized reaction products. For polar, functionalized compounds, very sensitive detection schemes are provided by high-pressure adduct-forming chemical ionization techniques, whereas for non-functionalized, non-polar compounds, low-pressure chemical ionization techniques have consistently demonstrated superior performance. Here, using a MION2 chemical ionization inlet and an Orbitrap ExplorisTM 120 mass spectrometer, we present multi-pressure chemical ionization mass spectrometry (MPCIMS), the combination of high- and low-pressure ionization schemes in a single instrument enabling quantification of the full distribution of precursor molecules and their oxidation reaction products from the same stream of gas without alterations. We demonstrate the performance of the new methodology in a laboratory experiment employing a-pinene, a monoterpene relevant to atmospheric particle formation, where MPCIMS allows to measure the spectrum of compounds ranging from the volatile precursor hydrocarbon to highly functionalized condensable reaction products. Furthermore, we demonstrate field applicability of the technique by measuring ambient air in automated switching sequence. MPCIMS carries the potential as an all-in-one method for the analysis of complex gas mixtures, reducing technical complexities and the need for multiple instruments without compromise of sensitivity.

How to cite: Shcherbinin, A., Finkenzeller, H., Jost, H.-J., Partovi, F., Vinkvist, N., Mikkila, J., Kontra, J., Kangasluoma, J., and Rissanen, M.: Multi-Pressure Chemical Ionization Mass Spectrometry: Comprehensive Analysis of Complex Gas Mixtures, EGU General Assembly 2025, Vienna, Austria, 27 Apr–2 May 2025, EGU25-10553, https://doi.org/10.5194/egusphere-egu25-10553, 2025.

EGU25-11282 | Orals | BG2.6

Global patterns of organic matter chemistry and biogeochemical cycling in wetland soils  

Kien Yung Teo, Carsten Simon, Jaan Pärn, Mikk Espenberg, Simon A. Schroeter, Gerd Gleixner, and Ülo Mander

Soil organic matter (SOM) in wetland soils, including peatlands, is crucial for maintaining ecosystem functions such as water quality, biogeochemical cycles, and regulating greenhouse gas emissions. Water-extractable organic matter (WEOM) comprises molecular compounds that dissolve in water under natural conditions. However, molecular-level studies of WEOM across wetlands in different climates and under various agricultural use intensities remain limited. We employed ultrahigh-resolution Orbitrap mass spectrometry to analyse WEOM and integrated it with data on climate types, agricultural intensities, environmental characteristics, molecular groups, microbial functional genes, and field-measured ecosystem respiration, methane and nitrous oxide fluxes. Wetland soil samples were collected from 25 regions representing four agricultural intensities: (1) no agriculture, (2) non-intensive grassland, (3) intensive grassland, and (4) arable land. Orbitrap identified 14,890 molecular formulas with masses ranging from 100 to 950 Daltons. Correlations between agricultural intensities and formula classes containing N, S, or P was visualised using Van Krevelen diagrams. We further examined the influence of climate types (tropical, temperate, continental) and agricultural intensity on WEOM molecular composition by Principal Coordinates Analysis, and linked WEOM quality changes with gas fluxes and other available environmental and microbiome characteristics. Ecosystem respiration, nitrous oxide emission, and agricultural intensity were positively correlated with the persistence of WEOM (i.e., aromaticity vs. aliphaticity) and negatively correlated with soil water content. Diversity of bacteria and archaea, as well as methane emission, were positively correlated with soil pH, but unrelated to WEOM quality. Our findings provide new insights into how WEOM chemistry changes under varying environmental and management conditions and advance our understanding of its role in global carbon and nutrient cycling.

Keywords: Wetland, WEOM, GHG emissions, Orbitrap, climate, agricultural intensity

How to cite: Teo, K. Y., Simon, C., Pärn, J., Espenberg, M., Schroeter, S. A., Gleixner, G., and Mander, Ü.: Global patterns of organic matter chemistry and biogeochemical cycling in wetland soils , EGU General Assembly 2025, Vienna, Austria, 27 Apr–2 May 2025, EGU25-11282, https://doi.org/10.5194/egusphere-egu25-11282, 2025.

EGU25-11326 | ECS | Orals | BG2.6

Allochthonous or Autochthonous? Origins of Berlin’s Groundwater DOM 

Laura E. Coulson, Angela Cukusic, Hannes Hemmerle, Marielle Geppert, Clemens Karwautz, He Wang, Alice Retter, Gabriele Schwammel, Jens Bölscher, and Christian Griebler

Dissolved organic matter (DOM) plays a pivotal role in aquatic ecosystems, influencing water quality, microbial activity, and carbon cycling. This study investigates the composition, sources, and dynamics of DOM in Berlin’s urban groundwater, focusing on its variability across aquifer layers and the implications for water quality and ecosystem health. Groundwater samples collected over three years (2021–2023) were analyzed using fluorescence spectroscopy and excitation-emission matrices (EEMs). The primary objectives were to identify DOM sources, assess surface water infiltration risks, and explore dynamic changes in DOM composition. PARAFAC analysis, performed on fluorescence EEMs, revealed eight components (UC1–UC8). Four components were characterized as terrestrial humic (UC1, UC3, UC7, UC8), two were microbial humic (UC2, UC6), one was anthropogenic humic (UC4), and one was a protein-like component (UC5). Component distribution varied across aquifers, reflecting differences in DOM sources and transformations. Shallow aquifers contained higher dissolved organic carbon (DOC) concentrations and microbial humic components (e.g., UC2), while deeper aquifers exhibited recalcitrant terrestrial humic components (e.g., UC7, UC8), potentially stored over long time scales due to anoxic conditions and slow degradation. Protein-like DOM (UC5) was restricted to shallow aquifers, indicating recent surface water inputs.

Overall, these findings underscore the heterogeneity of DOM sources and transformations within Berlin’s groundwater system. The dominance of recalcitrant humic components in deeper aquifers suggests long-term DOM storage, whereas shallow aquifers reflect active surface-water interactions. Anthropogenic influences were most pronounced in shallow and unconfined aquifers, emphasizing the importance of protecting groundwater from urban pollution. Our findings provide valuable insights into the ecological and biogeochemical roles of groundwater DOM and its implications for water management in urban systems.

How to cite: Coulson, L. E., Cukusic, A., Hemmerle, H., Geppert, M., Karwautz, C., Wang, H., Retter, A., Schwammel, G., Bölscher, J., and Griebler, C.: Allochthonous or Autochthonous? Origins of Berlin’s Groundwater DOM, EGU General Assembly 2025, Vienna, Austria, 27 Apr–2 May 2025, EGU25-11326, https://doi.org/10.5194/egusphere-egu25-11326, 2025.

EGU25-13342 | ECS | Orals | BG2.6

Dissolved organic matter composition and temperature determine organic carbon utilization in the deep ocean 

Benjamin Pontiller, Kevin W. Becker, Mara Rosmann, Antoine Barbot, Chie Amano, Gerhard J. Herndl, and Anja Engel

Dissolved organic matter (DOM) represents the largest and chemically diverse reservoir of reduced carbon (~630 Gt C) in the ocean. However, the overwhelming majority is considered biologically recalcitrant (RDOC), resisting rapid biological degradation. To date, the “recalcitrance” of organic compounds in the deep sea is attributed to three main limitations: (I) Deep-sea organic matter may be inaccessible to microorganisms due to its extremely low concentrations of individual components (limitation hypothesis). (II) The molecular structure of deep-sea DOM could be inherently resistant to microbial utilization (recalcitrance hypothesis). (III) The metabolic capabilities of deep-sea microbes might be constrained, e.g., by low temperature and high hydrostatic pressure, limiting their ability to process available organic matter. In addition, the impact of global warming-induced temperature increases in the bathypelagic zone and their consequent effects on deep-sea DOM dynamics remain poorly understood. Here, we show results from a long-term incubation experiment (222 days) with Pacific deep water bacterioplankton, from the Humboldt Current System, exposed to two sources of high molecular weight dissolved organic matter (HMW-DOM, 1-30 kDa), obtained from a) the surface and b) the deep sea (1500 m), along with a detailed characterization of micro(biological) and chemical parameters, at in situ (+2.5°C) and elevated temperature (+6.5°C). The addition of the two DOM sources to deep sea bacterioplankton stimulated bacterial activity (cell abundance, biomass production, and extracellular enzyme activity). However, amendments with deep sea DOM - characterized by more similar carbohydrate and amino acid composition than the surface (Euclidean distance) - resulted in higher bacterial biomass production. This effect increased up to 4-fold under elevated temperature (+6.5°C), while DOC and TOC decreased by ~10 µM C by the end of the experiment. Biochemical characterization of DOM components (i.e., dissolved hydrolyzable carbohydrates and amino acids), collectively accounting for ~6% of DOC, showed a selective consumption of galacturonic acid and glucuronic acid, contributing ~2% of total sugars, and alanine and serine at the end of the experiment (decrease in mol% and nM). These findings suggest that i) increasing the concentration of HMW-DOM components stimulates bacterioplankton activity, ii) these organic components are generally accessible to deep-sea microbes, and iii) the bathypelagic microbiome is capable of metabolizing HMW-DOM. Furthermore, the several-fold increase in bacterial activity observed under a simulated warming scenario (+4.0°C) indicates that climate change-induced warming of the bathypelagic zone could enhance deep-sea DOM utilization. This, in turn, has the potential to alter marine biogeochemical cycles, introducing feedback loops that remain poorly understood.

How to cite: Pontiller, B., Becker, K. W., Rosmann, M., Barbot, A., Amano, C., Herndl, G. J., and Engel, A.: Dissolved organic matter composition and temperature determine organic carbon utilization in the deep ocean, EGU General Assembly 2025, Vienna, Austria, 27 Apr–2 May 2025, EGU25-13342, https://doi.org/10.5194/egusphere-egu25-13342, 2025.

EGU25-14943 | ECS | Orals | BG2.6

The metabolic mechanisms underlying zooplankton-derived dissolved organic matter’s chemical properties 

Muhammad Firman Nuruddin, Ding He, and Longjun Wu

Dissolved organic matter (DOM), the largest reservoir of organic material in the ocean, plays a crucial role in the global carbon cycle and the microbial loop. While existing studies have documented significant DOM release by zooplankton, the chemodiversity and bioavailability of this DOM, along with the physiological mechanisms influencing these characteristics in heterogeneous coastal water environments, remain inadequately explored. We conducted onboard zooplankton DOM release experiments in heterogeneous estuarine-coastal water systems, followed by molecular characterization of the DOM using Fourier-transform ion cyclotron resonance mass spectrometry. Additionally, we analysed zooplankton metabolic activities through meta-transcriptomics to elucidate the relationship between the chemical properties of the released DOM and the underlying physiological processes of zooplankton. Our findings reveal substantial variations in the molecular diversity of DOM released by zooplankton across heterogeneous environment, notably between estuarine and coastal communities. We found strong correlations between the chemical reactivity of the DOM and clusters of orthologous groups (COGs) genes associated with functions such as carbohydrate metabolism, nucleotide processing, energy production, and coenzyme metabolism. Importantly, the aromaticity index (AI) of the released DOM was closely linked to metabolism-related gene functions, indicating that zooplankton metabolic processes significantly influence DOM bioavailability. This study enhances our understanding of how the organism’s metabolic processes shape the molecular characteristics of DOM they release, highlighting its implications for carbon cycling in the environment.


How to cite: Nuruddin, M. F., He, D., and Wu, L.: The metabolic mechanisms underlying zooplankton-derived dissolved organic matter’s chemical properties, EGU General Assembly 2025, Vienna, Austria, 27 Apr–2 May 2025, EGU25-14943, https://doi.org/10.5194/egusphere-egu25-14943, 2025.

EGU25-15501 | Orals | BG2.6

Assessing compositional variability of dissolved organic matter across different soil types and depths 

Livia Vieira Carlini Charamba, Tobias Houska, Klaus Kaiser, Klaus-Holger Knorr, Stephan Krüger, Tobias Krause, Huan Chen, Pavel Krám, Jakub Hruška, and Karsten Kalbitz

Dissolved organic matter (DOM) plays a crucial role in terrestrial and aquatic ecosystems through its carbon, nutrient, and contaminant transport involvement. Its transfer from soil to surface waters is influenced by soil interactions, which alter both its quantity and composition through various physical, biological, and biochemical processes before reaching surface waters.  This study aims to characterize the DOM composition across different sites and soil depths and assess how organic surface layers (peats and forest floor) affect the DOM composition in deeper mineral horizons, representing the major source of DOM in streams of mountainous catchments. We hypothesize that while organic surface layers show greater DOM compositional variability due to different primary plant sources (e.g., leaves, roots) and different stages of microbial processing, deeper mineral subsoils will contain a more uniform set of non-sorptive and persistent compounds. Despite becoming more uniform in deeper mineral horizons, we expect DOM to maintain some characteristics from the overlying organic layers.

Soil water samples were collected from four sites representing potential terrestrial sources of stream DOM within the catchment area of the Sosa drinking water reservoir located in the Ore Mountains (Germany). Each site was characterized by a different type of soil: Peat, peaty Gleysol, Cambisol, and Podzol. Soil water was sampled from three depths (D1, underneath the organic surface layer; D2, uppermost mineral horizon; and D3, deeper mineral horizon). DOM was characterized using fluorescence spectroscopy and pyrolysis gas chromatography/mass spectrometry (Py-GC-MS), with subsequent Bray-Curtis dissimilarity analysis.

The DOM characterization revealed that across sites with mineral subsoils, the number of identified compounds (i.e., variability) decreased from the organic surface layers to the deeper mineral subsoils, while for the Peat soil, the variability slightly increased. The number of common compounds and the dissimilarity analysis indicated that the organic surface layer of the peaty Gleysol influenced the DOM composition of the underlying mineral horizons more strongly than the organic surface layers of the Cambisol and the Podzol. This stronger influence likely results from the higher water content and reduced mineral interaction in the peaty Gleysol, allowing for greater vertical transport of organic compounds. Pairwise comparisons of the number of shared compounds revealed that the DOM of the Podzol was more similar to the DOM of the peaty Gleysol than to that of the Cambisol at D1, which may be explained by comparable pH conditions and comparable microbial communities adapted to acidic, organic-rich environments. The similarity of DOM composition along the depth of the sites mostly decreased, except at the Peat, where the similarity slightly increased. In contrast to our hypothesis, we found no indications of DOM becoming increasingly uniform during the passage through the mineral subsoil. In the soil with the strongest DOM adsorption in the mineral soil (i.e. the Cambisol), DOM composition showed the largest changes with increasing depth, likely because of transformative processes adding to the changes due to sorptive fractionation.

How to cite: Vieira Carlini Charamba, L., Houska, T., Kaiser, K., Knorr, K.-H., Krüger, S., Krause, T., Chen, H., Krám, P., Hruška, J., and Kalbitz, K.: Assessing compositional variability of dissolved organic matter across different soil types and depths, EGU General Assembly 2025, Vienna, Austria, 27 Apr–2 May 2025, EGU25-15501, https://doi.org/10.5194/egusphere-egu25-15501, 2025.

Lake sediments harbor substantial organic carbon (OC) reserves and exhibit remarkably high carbon fluxes, exerting a disproportionately large influence on the carbon cycle relative to their surface area. Now, the stability of lake sedimentary OC pools is increasingly threatened by ecosystem warming. Key questions remain unresolved: How does temperature influence the mineralization and turnover of OC? What mechanisms primarily drive the temperature response patterns of lake sediment OC pools? To address these gaps, we selected 13 lakes from the rapidly warming Qinghai-Tibetan Plateau (QTP) as study sites, and investigated the temperature response patterns of sedimentary OC mineralization processes by using microcosmic incubation, absorption spectroscopy, MALDI-TOF-MS, high-throughput sequencing and OC fractionation, etc. Our results reveal that in the QTP saline lake sediment environments, the stability and temperature response of OC pools are governed primarily by the chemical composition (e.g., chemical recalcitrance, molecular weight distribution) and substrate bioavailability (e.g., concentrations of dissolved and insoluble OC) rather than by mineral protection. Labile, carbon-rich organic compounds exhibit higher reactivity and temperature sensitivity during mineralization, challenging the predictions of the Carbon Quality-Temperature (CQT) hypothesis. This study discusses for the first time in lake sediments the relative importance of substrate bioavailability, OC chemical composition, and mineral protection on the temperature response patterns of mineralization processes, and provides multidimensional evidence through spectroscopic, mass spectrometric and other analytical techniques. In the context of climate warming, these findings can help us to predict more accurately the evolutionary trends of lake OC pools.


Key words: Lake sediments, organic carbon mineralization, temperature, chemical composition, substrate bioavailability, climate warming.

How to cite: Wang, B. and Sun, X.: Temperature response of organic carbon mineralization in lake sediments of the Qinghai-Tibetan Plateau is dominated by substrate chemical composition and bioavailability, EGU General Assembly 2025, Vienna, Austria, 27 Apr–2 May 2025, EGU25-15718, https://doi.org/10.5194/egusphere-egu25-15718, 2025.

EGU25-16047 | Orals | BG2.6

Enhanced molecular characterization of atmospheric organic aerosols in the Western Mediterranean basin by Fourier transform mass spectrometry  

Maxime C. Bridoux, Martha Chacón-Patiño, Christos Panagiotopoulous, Kalliopi Violaki, Ilwan Meignant, and Athanasios Nenes

Atmospheric aerosols (AAs) significantly influence the global radiative balance, air quality, biogeochemical cycles, and human health. While their climate and health impacts are well-studied, their biogeochemical role, including contributions of phosphorus (P), nitrogen (N), and organic matter (OM) to oligotrophic regions like the Mediterranean basin, is less explored. Recent studies suggest variable atmospheric deposition of trace metals and nutrients associated with both natural (i.e. recurring Saharan dust storms, biomass burning episodes) and anthropogenic origin (i.e. polluted air masses from northern and central Europe) with atmospheric OM inputs comparable to rivers. However, the detailed composition of atmospheric organic aerosols in the region remains poorly understood.

Ultrahigh-resolution mass spectrometry (UHRMS) offers unparalleled resolving power and enables detailed characterization of complex natural and anthropogenic organic matter (OM) mixtures. It also provides stoichiometric insights into organic nitrogen (N) or phosphorus (P) molecules that are often undetectable by methods like NMR spectroscopy or lower-resolution mass spectrometers. Here, we present advanced analysis of the chemical composition of aerosol particles collected in the Western Mediterranean basin. We combined atmospheric pressure photoionization (APPI) and electrospray ionization (ESI), two complementary techniques, to achieve comprehensive coverage of both polar and nonpolar molecular components through  UHRMS. Electrospray ionization (+ESI) was paired with a 21-Tesla (T) Fourier-transform ion cyclotron resonance mass spectrometer (FT-ICR MS), delivering exceptional resolving power, sensitivity, acquisition speed, mass accuracy, and dynamic range. Meanwhile, APPI (+ /-) was coupled to an Orbitrap Fusion Lumos 1M to target condensed, polyaromatic, nonpolar compounds that are challenging or impossible to detect by ESI alone.

Approximately 28,000 distinct CcHhNnOoPpSs molecular formulas were assigned across all 30 samples collected in the Western Mediterranean basin to ESI(+) 21-T FT-ICR MS spectra after a solid phase extraction to isolate and desalt the samples, revealing an astonishing molecular chemodiversity mainly driven by nitrogen-containing compounds (CHNO) and oxygenated compound (CHO) with minor contribution of sulphur-containing (CHOS) and phosphorus-containing (CHOP) compounds, despite their inherent poor ionisation efficiency in complex mixture. APPI(+/-) / Orbitrap Lumos 1M proved to be a powerful approach for characterizing the molecular composition of highly condensed hydrocarbons, especially the large molecular species that cannot be eluted from gas chromatography columns.

We will explore the key factors driving the molecular composition of atmospheric aerosols (AAs) and their influence on variations and potential formation pathways. Our findings aim to improve understanding of their composition and sources with a focus on biogeochemical processes in the nutrient-limited, stratified open waters of the Mediterranean Sea.

How to cite: Bridoux, M. C., Chacón-Patiño, M., Panagiotopoulous, C., Violaki, K., Meignant, I., and Nenes, A.: Enhanced molecular characterization of atmospheric organic aerosols in the Western Mediterranean basin by Fourier transform mass spectrometry , EGU General Assembly 2025, Vienna, Austria, 27 Apr–2 May 2025, EGU25-16047, https://doi.org/10.5194/egusphere-egu25-16047, 2025.

EGU25-16056 | Posters on site | BG2.6

Impact of Air Quality on the Composition and Degradability of Atmospheric Organic Matter in Coastal Regions 

Hongyan Bao, Ruoyang Zhang, Jutta Niggemann, and Thorsten Dittmar

Atmospheric deposition contributes approximately 90 million tons of dissolved organic carbon (DOC) to the oceans and 400 million tons to the land surface each year. Natural organic matter (OM) is composed of tens of thousands of distinct molecules, making its characterization a significant challenge. This complexity is particularly evident in atmospheric OM, which is more dynamic than its aquatic counterpart. Due to analytical difficulties, the cycling of atmospheric OM in receiving waters is not well understood and is not currently represented in global carbon cycling models. To address these knowledge gaps, we conducted seasonal aerosol sampling in two major coastal cities in China—Xiamen and Qingdao—each representing different air quality levels. Using ultra-high resolution mass spectrometry, we characterized the OM composition and conducted laboratory experiments to assess its potential degradability. We also investigated the relationship between molecular composition and air quality parameters. Preliminary results indicate that as air quality worsens (as reflected by an increasing Air Quality Index, or AQI), atmospheric OM becomes more aromatic, and the fraction of DOC that can be utilized by microbes decreases. These findings suggest that during periods of higher AQI, atmospheric OM is primarily derived from fossil fuel combustion, potentially persisting in the ocean for extended periods. Future research will focus on the biogeochemical impacts of these changes

How to cite: Bao, H., Zhang, R., Niggemann, J., and Dittmar, T.: Impact of Air Quality on the Composition and Degradability of Atmospheric Organic Matter in Coastal Regions, EGU General Assembly 2025, Vienna, Austria, 27 Apr–2 May 2025, EGU25-16056, https://doi.org/10.5194/egusphere-egu25-16056, 2025.

EGU25-16552 | Posters on site | BG2.6

Phosphorus speciation in environmental organic matter using 31P-NMR. Recent advances in the characterization of atmospheric organic matter 

Christos Panagiotopoulos, Kalliopi Violaki, and Athanasios Nenes

Phosphorus (P) is a vital element for all living organisms and is one of the most essential nutrients in both aquatic and terrestrial ecosystems. As a fundamental component of DNA and RNA, it plays a structural role in cell membranes (e.g., as part of phospholipids) and is crucial for various biological processes, such as energy transfer through ATP. In the environment, phosphorus exists in both inorganic forms (e.g., orthophosphate or PO43−) and organic forms. In environmental studies, organic phosphorus (P) is not measured directly but is estimated by subtracting the concentration of inorganic phosphorus species from total phosphorus. This process involves converting all forms of phosphorus into orthophosphate, typically through UV or persulfate oxidation, followed by colorimetric analysis. However, inefficiencies in this transformation can introduce errors and biases, leading to underestimation or overestimation of the organic phosphorus content.

Solid-state 31P NMR is a powerful technique that identifies phosphorus chemical species, organic or inorganic, without any previous sample treatment. This technique was widely used in the 2000s in marine chemistry in samples comprised of concentrated dissolved organic matter, fast-sinking particles, marine planktons, and sediments, revealing important features of organic P compounds such as phosphonates. A notable characteristic of P in concentrated dissolved organic matter is that P-esters and phosphonates consistently exhibit a nearly constant ratio of 75:25, regardless of the depth or location where the sample was collected. 31P-NMR, however, has not yet been used for atmospheric samples, and is the primary focus of this study. Here, we analyzed total suspended atmospheric particles collected during dust events, as well as ash produced from the biomass burning of olive trees. We find that the functional groups associated with phosphorus included orthophosphate and monophosphate esters, which shared the same chemical shift (H₃PO₄ and RH₂-PO₄), phosphate diesters (R₁R₂HPO₄), and pyrophosphate (H₄P₂O₇). P in our samples consisted of phosphate diesters (72–88%), followed by orthophosphate (10–19%) and pyrophosphate (1–8%). Unlike marine samples, phosphonates were absent, suggesting the absence of compounds containing carbon-phosphorus (C–P) bonds. Phosphate diesters are primarily found in naturally occurring organic compounds, such as nucleotides and their derivatives (e.g., DNA, RNA, AMP, ADP, ATP), including phospholipids, and thus constitute the majority of atmospheric organic phosphorus. As these compounds have C-O-P bonds they are readily hydrolyzed in the marine environment by the alkaline phosphatase enzyme, providing an important source of P in aquatic/marine ecosystems. Overall, our results suggest that organic-P, as estimated by 31P NMR, can account for up to 80% of total P in dust and burning biomass samples. Thus, the organic-P fraction of external inputs is likely as significant for marine primary productivity as inorganic inorganic-P.  

How to cite: Panagiotopoulos, C., Violaki, K., and Nenes, A.: Phosphorus speciation in environmental organic matter using 31P-NMR. Recent advances in the characterization of atmospheric organic matter, EGU General Assembly 2025, Vienna, Austria, 27 Apr–2 May 2025, EGU25-16552, https://doi.org/10.5194/egusphere-egu25-16552, 2025.

EGU25-17670 | Posters on site | BG2.6

Deoxygenation effects on the interaction between microbial metabolisms and dissolved organic matter cycling in the seasonally anoxic Mariager Fjord (Denmark, North Sea) 

Gonzalo V. Gomez Saez, Katharina Muschler, Ömer K. Coskun, Marit Renken, Marina Garcia-Llorca, Louison Nicolas-Asselineau, Linus M. Zeller, Jana Milucka, Thorsten Dittmar, William D. Orsi, and Ian P. G. Marshall

Seawater stores as much carbon in the form of dissolved organic matter (DOM) as there is CO2 in the atmosphere. Over a period of just 50 years (from 1960 to 2010) global oceanic oxygen reserves have been reduced by 2% and the anoxic waters have quadrupled, mainly due to anthropogenic global warming and eutrophication. Ocean deoxygenation leads to an expansion of oxygen minimum zones (OMZs), which contain higher concentrations of DOM (carbon and sulfur (DOS)) than the oxygenated ocean. Microbial metabolisms are directly responsible for the production, degradation and recycling of marine DOM but there is no consensus about their role in DOM accumulation in OMZs. Recent advances in analytical chemistry characterize the DOM at the molecular level in unprecedented detail, revealing new insights into its source and history by Fourier transform ion-cyclotron resonance mass spectrometry (FT-ICR-MS). Current progress in sequencing technology can predict specific functions contributing to the molecular activity of microbial communities in environmental samples by metatranscriptomics, or to specific substrate assimilation by quantitative DNA stable isotope probing (qSIP). In this study, we investigated the interaction between microbes and DOM in the water column of the Mariager Fjord (Denmark, North Sea). Due to nutrient loading from land combined with its topography, Mariager Fjord has anoxic bottom waters between spring and late fall, but it is typically flushed with oxygen-rich seawater from the Kattegat during winter. In spring 2023, we sampled waters at three depths (5, 15, 25 m) with an O2 range from oxic-to-hypoxic conditions (99, 65 and 4 % O2, respectively). Natural environmental samples were combined with incubations targeting (a) abiotic and biotic interactions in the presence or absence of oxygen; and (b) organosulfur cycling by active uncultivated microbes assimilating the 13C-DOS substrates methionine and taurine. Samples were analyzed for elemental organic and inorganic geochemistry, microbial diversity (16S rRNA sequencing), FT-ICR-MS, qSIP and metatranscriptomics. Our results showed clear changes on the microbial community composition and gene expression depending on the oxygen concentration. The surface oxic waters were dominated by Planctomycetes and Actinobacteria, while the hypoxic nitrite-enriched waters were dominated by Gammaproteobacteria and Bacteroidota. Expressed genes diversity was highest in the hypoxic waters, with reverse dissimilatory sulfate reduction and sulfur oxidation genes present in the metatranscriptomes, even though the waters were not sulfidic. Regarding organosulfur cycling, only bacteria assimilated 13C-DOS in the water column. Methionine was mainly utilized in oxic layers by Gammaproteobacteria, Alphaproteobacteria and Actinobacteria, while taurine was only assimilated in hypoxic waters mostly by Bacteroidota. Largest differences in DOM molecular composition between oxic-to-hypoxic samples were related to N- and S-containing compounds, although autochthonous terrigenous DOM input in the fjord dominated the DOM signature more drastically than oxygen variations. Overall, our study includes novel implementation of state-of-art methods to elucidate new links between the microbial biosphere with the chemical diversity of DOM in the context of a changing, deoxygenated ocean.

How to cite: Gomez Saez, G. V., Muschler, K., Coskun, Ö. K., Renken, M., Garcia-Llorca, M., Nicolas-Asselineau, L., Zeller, L. M., Milucka, J., Dittmar, T., Orsi, W. D., and Marshall, I. P. G.: Deoxygenation effects on the interaction between microbial metabolisms and dissolved organic matter cycling in the seasonally anoxic Mariager Fjord (Denmark, North Sea), EGU General Assembly 2025, Vienna, Austria, 27 Apr–2 May 2025, EGU25-17670, https://doi.org/10.5194/egusphere-egu25-17670, 2025.

EGU25-18845 | Posters on site | BG2.6

Annual dynamics of DOM and microbial community interactions in a Mediterranean coastal area: mutual influence and environmental drivers 

Simona Retelletti Brogi, Vincenzo Manna, Giancarlo Bachi, Cecilia Balestra, Mauro Celussi, Cinzia De Vittor, Mirco Guerrazzi, Federica Relitti, and Chiara Santinelli

Marine dissolved organic matter (DOM) and microbes are strictly linked by complex and dynamic processes. DOM represents the main source of energy for microbial communities and its concentration and chemical properties influence the microbe’s structure and activity. Microbes on the other hand can affect the DOM pool by changing its concentration and quality. Composition and properties of the DOM and the microbial community are therefore interdependent. On top of this, the variability of the environment drives changes on both, affecting each one’s properties and dynamics, and consequently their interaction.

The main goal of this study is to investigate the microbes-DOM interplay in a coastal area of the Mediterranean Sea and to assess its variability in relation to environmental conditions. Our hypothesis is that the environmental variability (i.e. seasonal changes in salinity, temperature, biological activity…) affects the concentration and properties of potentially bioavailable DOM and its interaction with the microbial community.

To achieve this goal, incubation experiments were carried out monthly for 1 year. Surface water was filtered through 1.2 µm filters to remove potential microbes’ grazers and most of phototrophic organisms and incubated in the dark at the in-situ temperature. DOC concentration, DOM optical properties (absorption and fluorescence), microbial prokaryotic abundance, secondary heterotrophic C production, and enzyme activity were followed for 30 days. Samples for the same parameters were collected from the surface water at the same time as the experimental sampling to gain information on the annual dynamics of both the DOM and the microbial community.

The study was carried out in the framework of the National Biodiversity Future Center (NBFC), at the Long-Term Ecological Research (LTER) “C1” coastal station, located in the Gulf of Trieste (northern Adriatic Sea). This station has been studied since 1986 and provides a solid background to contextualize seasonal environmental changes.

To the best of our knowledge, this is the first study investigating the DOM-microbial community relationship with such resolution over an entire year and allowing to estimate the potentially bioavailable DOM and its variability with changing environmental conditions. The North Adriatic Sea, as well as all the Mediterranean Sea is already experiencing the effects of climate change, such as increase in salinity and surface water temperature. Investigating how these variables affect the DOM-microbes interaction may give some clues to understand potential future changes in DOM-microbes relationship and therefore in the marine C cycle.

How to cite: Retelletti Brogi, S., Manna, V., Bachi, G., Balestra, C., Celussi, M., De Vittor, C., Guerrazzi, M., Relitti, F., and Santinelli, C.: Annual dynamics of DOM and microbial community interactions in a Mediterranean coastal area: mutual influence and environmental drivers, EGU General Assembly 2025, Vienna, Austria, 27 Apr–2 May 2025, EGU25-18845, https://doi.org/10.5194/egusphere-egu25-18845, 2025.

EGU25-19511 | ECS | Posters on site | BG2.6

Physicochemical Characterization of Dissolved Organic Matter in Soil Solution from Lysimetric Sampling 

Kristýna Müllerová, Vojtěch Enev, and Roman Glončák

Dissolved organic matter (DOM) in soil plays a crucial role in biogeochemical cycles, nutrient transport, and soil solution chemistry. This study focuses on the physicochemical characterisation of DOM extracted from soil solution samples collected using lysimeters at different depths (20 cm, 40 cm, and 60 cm). The primary analyses included pH and electrical conductivity measurements, dynamic light scattering (DLS) for particle size, ζ-potential measurements, Fourier-transform infrared spectroscopy (FTIR) for functional group identification, and three-dimensional excitation-emission matrix fluorescence spectroscopy (3D EEMs) for further characterisation of organic matter fractions. The concentration of humic substances in the soil solution was also determined according to the ČSN 75 7536 standard. The results indicate slightly alkaline soil conditions (pH 7.5-8.0) and increasing conductivity with depths, suggesting nutrient and organic matter accumulation at 60 cm. DLS and ζ-potential measurements provided insights into colloidal stability, while FTIR confirmed the presence of key functional groups such as O–H, C=O, and C–N, indicating polysaccharides, carboxylates, and others in the structure of DOM. These findings enhance understanding of DOM composition and mobility in soil, emphasising the significance of lysimetric sampling in studying DOM under natural conditions.

How to cite: Müllerová, K., Enev, V., and Glončák, R.: Physicochemical Characterization of Dissolved Organic Matter in Soil Solution from Lysimetric Sampling, EGU General Assembly 2025, Vienna, Austria, 27 Apr–2 May 2025, EGU25-19511, https://doi.org/10.5194/egusphere-egu25-19511, 2025.

EGU25-19831 | ECS | Posters on site | BG2.6

First measurements with a novel aerosol filter analysis workflow 

Sebastian Holm, Jussi Kontro, Moe Lwin, Joona Mikkilä, Matti Rissanen, and Juha Kangasluoma

Offline filter sampling of aerosols is a cost-effective and easily deployable method for long-term measurements. However, the subsequent analysis can be cumbersome and time-consuming. Measuring fine particulate matter with an aerodynamic diameter of up to 2.5μm (PM2.5) is essential in air pollution studies. To understand the role of organic aerosols (OA) in the atmosphere, particularly regarding climate and health effects, it is crucial to know their molecular composition. Typically, such data is gathered through offline filter sampling and laboratory analysis (Daellenbach et al., 2020; Cai et al., 2023).

Currently, there are many extraction methods for collected PM2.5 filters (see e.g., Roper et al. (2019)). Most of these methods require several stages of preparation before analysis can begin. This often involves cutting smaller pieces from the used filters and then performing steps such as sonication, rinsing, drying, dissolving, and nebulizing before the sample is finally analyzed.

We propose a more streamlined workflow. The entire collected filter is placed in a thermal desorption multi-scheme chemical ionization inlet coupled to an Orbitrap mass spectrometer (TD-MION-Orbitrap, see e.g., Partovi et al. (2023)). The MION allows for fast switching between multiple reagents, and the Orbitrap provides high mass resolution. While previous studies have successfully used TD-CIMS for offline analysis of PM (e.g., Cai et al., 2023), our method offers a user-friendly, preparation-free analysis process.

We hope to get the opportunity to present data from ambient filters collected in Helsinki – in a comparison to existing analysis methods – along with initial results from these early stages of the project.


References

Cai, J. et al. (2023). Characterization of offline analysis of particulate matter with FIGAERO-CIMS. Atmospheric Measurement Techniques, 16(5), 1147-1165.

Daellenbach, K. R. et al. (2020). Sources of particulate-matter air pollution and its oxidative potential in Europe. Nature, 587(7834), 414-419. https://doi.org/10.1038/s41586-020-2902-8

Partovi, F. et al. (2023). Pesticide Residue Fast Screening Using Thermal Desorption Multi-Scheme Chemical Ionization Mass Spectrometry (TD-MION MS) with Selective Chemical Ionization. ACS Omega, 8(29), 25749-25757.

Roper, C. et al. (2019). PM(2.5) Filter Extraction Methods: Implications for Chemical and Toxicological Analyses. Environ Sci Technol, 53(1),434-442.

How to cite: Holm, S., Kontro, J., Lwin, M., Mikkilä, J., Rissanen, M., and Kangasluoma, J.: First measurements with a novel aerosol filter analysis workflow, EGU General Assembly 2025, Vienna, Austria, 27 Apr–2 May 2025, EGU25-19831, https://doi.org/10.5194/egusphere-egu25-19831, 2025.

EGU25-21540 | Orals | BG2.6

Strategies to deal with batch effects with high resolution Orbitrap mass spectrometry for NOM characterisation 

Helen Rutlidge, Russell Pickford, Tina Ventura, and Rita Kay Henderson

There is growing evidence that changes in the molecular composition of natural organic matter (NOM) in water drives changes in the effectiveness of water treatment processes. Hence, there is a growing interest in obtaining more detailed characterisation of natural organic matter, than traditional methods can provide. High resolution mass spectrometry is one such technique that is increasingly being used for NOM analysis. Predominately, Fourier transform ion cyclotron resonance mass spectrometry (FT-ICR MS), has been used but Orbitrap MS is emerging as a more available, smaller, and cheaper alternative.  

Due to the high sensitivity of high-resolution mass spectrometry instrumental performance variation from day to day is a recognised problem. This means that samples measured on different days may not be directly comparable, likely due to slight variations in equipment operating conditions, laboratory ambient conditions and minor contamination left from other analysis. The aim of this study was to investigate the impact of this instrumental variation using a NOM standard mixture and ways to overcome it.

To understand the Orbitrap MS instrumental variation from day to day, a freshly prepared NOM standard mixture was analysed on several days. The data files were compiled and analysed using Compound Discoverer software. The molecular weights observed were assigned to molecular formula using the software. As part of the data processing various strategies were explored to deal with batch effects, including data-driven normalisation, removal of data with lower relative abundance and Systematic Error Removal Using Random Forest (SERRF).

For the NOM standard mixture, there were differences in the assigned molecular formulas as well as the relevant abundances. A total of 940 molecular formula were found for all the NOM mixture standard runs, with 357 found in more than one sample run. However, the compounds that were present in only one or two sample runs tended to have lower relative abundance, and hence removing compounds with lower relative abundance may reduce the influence of instrumental variation. In general, the greatest commonality across the sample runs was seen in the region where the H/C ratio was between 0.5-1.5 and the O/C ratio was <0.5, which corresponds to the condensed hydrocarbons and lignin-like compounds. The various correction strategies showed various levels of effectiveness.

How to cite: Rutlidge, H., Pickford, R., Ventura, T., and Henderson, R. K.: Strategies to deal with batch effects with high resolution Orbitrap mass spectrometry for NOM characterisation, EGU General Assembly 2025, Vienna, Austria, 27 Apr–2 May 2025, EGU25-21540, https://doi.org/10.5194/egusphere-egu25-21540, 2025.

EGU25-1043 | ECS | Posters on site | HS10.11

Multi-site investigation of the determinants of evapotranspiration partitioning with a mobile water isotope laboratory 

Daniel Schulz, Gilles Boulet, Nicolas Brüggemann, Aurore Brut, Valerie Le Dantec, Tiphaine Tallec, and Youri Rothfuss

Quantifying and partitioning evapotranspiration (ET) of agricultural ecosystems in various environmental settings enable studying the site-specific determinants of plant water use. The aim of the study was to conduct reliable and reproducible field-scale partitioning of ET into its component fluxes soil evaporation (E) and plant transpiration (T) from water stable isotope analysis (δ2H and δ18O). Isotope-based partitioning methods, because of their methodological independence to other, traditional, experimental or data-driven approaches, are useful for intercomparison. Campaigns were carried out at two agricultural field sites of the ICOS ecosystem thematic network, differing in their hydroclimate and crop settings. Isotopic partitioning was achieved by simulating (i) the isotopic composition of ET (δET) from atmospheric water vapor measurements and (ii) δE and δT from simultaneous destructive sampling of soil water and plant xylem water. Campaigns were carried out from June 22 to July 19, 2022 (sunflower crop, mean air temperature and relative humidity: 24 °C and 65 %) and from March 27 to April 18, 2023 (winter wheat, 12 °C and 75 %) in the Mediterranean site FR-Aur (Auradé, France), and from June 5 to August 26, 2024 (winter wheat, 19 °C and 73 %) in the temperate site DE-RuS (Selhausen, Germany). Up to three measurements per day of isotope-based partitioning results were confronted against estimates of ET obtained from on half-hourly eddy-covariance data. Non-isotopic ET partitioning was calculated based on simulations using half-hourly sap flow- (T) and daily microlysimeter measurements (E) during the 2022 campaign in Auradé. Both the non-isotopic and isotopic data showed an increase in daily T/ET ratios during the 2022 campaign. Daily mean T/ET ratios were 0.79 from sap flow/EC data, 0.75 from sap flow/microlysimeter data, and mean sub-daily isotopic T/ET ratios of 0.66 for sunflowers in 2022. T/ET ratios of winter wheat in Auradé 2023 showed a mean value of 0.92. The differences between the isotopic and non-isotopic T/ET ratios in 2022 might be a result of differences in measurement footprint, as field-scale EC-based partitioning was compared to sub-field scale isotopic partitioning. Estimation of T/ET uncertainty, calculated as from propagation of errors of the individually conducted measurements, was provided. While errors of daily sap flow/EC partitioning were lower compared to microlysimeter/EC and isotopic partitioning, errors of sub-daily EC/sap-flow T/ET exceeded the errors of the other two approaches. In addition, values of sap flow/EC T/ET increased over 100% from the late afternoon, showing a limitation of the sap flow/EC-based partitioning method on the sub-daily timescale. During the 2024 campaign, isotopic measurements were performed at an hourly resolution, and analysis of isotopic and non-isotopic T/ET ratios for the 2024 campaign is pending. The aim of future campaigns is the continuation of intercomparison between partitioning methods and the identification of differences and fit among T/ET partitioning approaches specifically to the considered temporal and spatial scales.

How to cite: Schulz, D., Boulet, G., Brüggemann, N., Brut, A., Le Dantec, V., Tallec, T., and Rothfuss, Y.: Multi-site investigation of the determinants of evapotranspiration partitioning with a mobile water isotope laboratory, EGU General Assembly 2025, Vienna, Austria, 27 Apr–2 May 2025, EGU25-1043, https://doi.org/10.5194/egusphere-egu25-1043, 2025.

EGU25-1261 | ECS | Posters on site | HS10.11

Quantification of actual evaporation through different in-situ techniques for Dutch water management practices 

Liduin Bos-Burgering, Miriam Coenders-Gerrits, and Remko Uijlenhoet

Historically, the Netherlands has predominantly managed water surpluses, consequently numerical hydrological models are calibrated and validated under conditions ranging from average to wet. However, as prolonged drought periods become more frequent, there is a growing need for models to simulate dry conditions. One of the key processes in drought simulation is evaporation (E). This study seeks to provide a deeper understanding of the quantification of actual evaporation (Eact) under dry circumstances in the Dutch agricultural sector and for water management practices. For this purpose, an extensive monitoring plan was implemented to estimate actual and potential evaporation (Epot) as well as soil moisture content, on an agricultural site in the Netherlands. A comparison between Epot and Eact during the drying and wetting phase is proposed to conduct an uncertainty analysis on various calculation and measurement methods. Furthermore, we will study the land- atmosphere interactions that influence Eact, and the effect of irrigation.

How to cite: Bos-Burgering, L., Coenders-Gerrits, M., and Uijlenhoet, R.: Quantification of actual evaporation through different in-situ techniques for Dutch water management practices, EGU General Assembly 2025, Vienna, Austria, 27 Apr–2 May 2025, EGU25-1261, https://doi.org/10.5194/egusphere-egu25-1261, 2025.

EGU25-1731 | Posters on site | HS10.11

Restoration Efforts in Riparian Ecosystems in the Colorado River Delta as Measured by Greenness Indices and Evapotranspiration (ET) and using Hydrology, Avian Studies and ET Change Maps  

Pamela Nagler, Libby Wildermuth, Patrick Shafroth, Eduardo Gonzalez-Sargas, Martha Gomez-Sapiens, Eduardo Jimenez-Hernandez, Armando Barreto-Muñoz, and Kamel Didan

Colorado River water has been allocated through recent Minutes (319 from 2014-2017; 323 from 2018-2026) to the 1944 Water Treaty between the United States and Mexico to support efforts to restore native riparian forests, which provide essential habitat for migratory birds, in the Colorado River delta. Our study was largely conducted in the context of assessing the effects of restoration efforts on riparian corridor health. We processed and analyzed remotely sensed data from 2000 to 2023 to assess large-scale dynamics of vegetation health by measuring satellite vegetation index (VI, a proxy for canopy greenness) and plant water use (actual evapotranspiration, ETa) in the riparian corridor.

Under Minute 323, water deliveries are used primarily to irrigate managed restoration areas. Our study reports the outcomes of restoration actions on variables such as vegetation extent and density through two-band Enhanced Vegetation Index (EVI2) measurements and hydrological processes including ETa. We integrated EVI2 with potential ET from two sources, the Yuma Valley Arizona Meteorological Station “AZMET” ground station and gridded Daymet, to calculate ETa. We quantify ETa in restoration sites compared to the unrestored reaches from 2000-2023. Our findings showed an average increase of 42% in EVI2, an indication of land cover greenness, within the restoration sites in the decade since 2014, when efforts by many non-government organizations collaborated to improve the riparian corridors, with one large effort in Reach 2 and a dozen smaller sites in Reach 4. Conversely, greenness in adjacent, unrestored areas in these reaches declined by 27%. The study also indicates a 22% increase in ETa in the restored areas, compared to a 31% reduction in the unrestored regions. Restored sites in Reach 4, which contains a dozen restoration areas, experienced ETa increases ranging from 9-12%, whereas their unrestored counterparts show a decline of 21%. Restoration efforts focusing on small plots have successfully revitalized habitat, the motivation for this research.

Measurements of VIs and ETa several years after the Minute 323 federal flows were delivered in 2020 and 2021 to the riparian corridor, including to restoration sites in Reaches 2 and 4, do not show any boost to the greenness and ETa in the unrestored riparian reaches in the delta after these federal flows were delivered. However, further downstream, in Reaches 5 and 7, the non-native shrub saltcedar (Tamarisk spp.) has been repeatedly defoliated by saltcedar beetles (Diorhabda spp.). Select regions of these defoliated shrubs in Reaches 5 and 7 were measured using Landsat time series data from 2000-2023 using peak growing season dates of May 1 through October 30. The measured change between the ETa in the first five years (2000-2004), with a mean of 737 mm/year, and latter five years (2019-2023), with a mean of 599 mm/year, showed a decrease of 138 mm/year in ETa, which is a decrease in ETa of 18.7%. Despite the challenges posed by small water deliveries and beetle defoliation for non-native saltcedar shrubs, restoration efforts focusing on small plots have successfully revitalized habitat, the motivation for this research.

How to cite: Nagler, P., Wildermuth, L., Shafroth, P., Gonzalez-Sargas, E., Gomez-Sapiens, M., Jimenez-Hernandez, E., Barreto-Muñoz, A., and Didan, K.: Restoration Efforts in Riparian Ecosystems in the Colorado River Delta as Measured by Greenness Indices and Evapotranspiration (ET) and using Hydrology, Avian Studies and ET Change Maps , EGU General Assembly 2025, Vienna, Austria, 27 Apr–2 May 2025, EGU25-1731, https://doi.org/10.5194/egusphere-egu25-1731, 2025.

Evapotranspiration (ET) is the primary pathway for dissipating terrestrial water resources, and a key process in regulating surface temperature. The Ts-VI feature space method is an important evapotranspiration simulation approach, reflecting the relationship between vegetation cover and the temperature-evapotranspiration response, while effectively balancing model complexity and efficiency. The key issue for Ts-VI feature space methods lies in the accurate identification of the four extreme endmember temperatures. However, the differences in feature points caused by applying the theoretical trapezoid framework at the pixel or areal scale have received little attention. The discrepancies and uncertainties between these two approaches, along with the resulting contradictions in trapezoid framework and differences in evapotranspiration simulation, are often neglected. This study firstly develops a fully explicit theoretical method for determining extreme endmember temperatures, simplifying the process and improving computational efficiency. Secondly, using the above explicit equation, a systematic comparison is conducted across four single-source Priestley-Taylor-based evapotranspiration models using four methods for determining extreme endmember temperatures: the empirical fitting method (EFM) as a reference, envelope theoretical method (ETM) and pixel theoretical method (PTM) at the areal scale, and the same pixel theoretical method with flux site observational meteorological data (PTMs). Thirdly, we analyzed the spatiotemporal variations of extreme endmember temperatures and their positional relationships within the trapezoidal framework across these different methods, and discussed their uncertainties through envelope analysis and sensitivity analysis. Using all site-year data from 9 AmeriFlux sites in the Southern Great Plains, along with MODIS and NCEP products from 2017. The results show that the proposed explicit theoretical calculation method is effective, with the four methods demonstrating the best validation results when compared to observed flux data, closed using the residual method, yielding RMSE values of 1.70 mm/d, 1.55 mm/d, 1.53 mm/d, and 1.51 mm/d, respectively. During the growing season of 2017, ETM exhibited an exceptionally high peak at the dry edge, while PTM and PTMs displayed frequent and dense high-value spikes, with particularly pronounced intensity. The positional discrepancies among the different trapezoidal frameworks were primarily observed at the dry edge, with PTM and PTMs showing a higher probability of the highest dry edge. Envelope analysis revealed that ETM, PTM, and PTMs occasionally failed to envelope all Fc-LST scatter points, leading to overestimations of evapotranspiration, particularly at the wet edge. In summary, this study provides a comprehensive understanding of the theoretical trapezoidal framework, highlighting the discrepancies and uncertainties across different scales, and offers valuable insights for model implementation and improvement.

How to cite: Yang, L., Guan, H., and Shang, S.: Discrepancies and Uncertainties in the Application of the Fc-LST Theoretical Trapezoid Framework at Pixel and Areal Scales Using a Priestley-Taylor based Evapotranspiration Model, EGU General Assembly 2025, Vienna, Austria, 27 Apr–2 May 2025, EGU25-2073, https://doi.org/10.5194/egusphere-egu25-2073, 2025.

EGU25-2096 | ECS | Orals | HS10.11

Enhancing Spatial Resolution and Accuracy of Land Surface Temperature: Integration of Regression-based and Surface Energy Balance Models 

Mohammad Karimi Firozjaei, Mehdi Rahimi, Majid Kiavarz, Leila Rahimi, Amir AghaKouchak, Carlo De Michele, and Salvatore Manfreda

Land surface temperature (LST) derived from satellite thermal sensors is a crucial dataset for environmental and urban studies. However, the limited spatial resolution and accuracy of these datasets may present significant challenges for various applications. This study introduces two innovative approaches to improve the spatial resolution and accuracy of LST: (1) a regression-based model integrating multiple sources of information and (2) a physically-based model of the Surface Energy Balance (SEB). The regression-based model employs, a decision-level fusion approach to minimize the impact of various error sources. Regression approaches include various combinations of regression models and different training and implementation strategies. In this study, four models were employed to develop an appropriate relationship between LST and environmental parameters: (1) Partial Least Squares Regression (PLSR), (2) Support Vector Regression (SVR), (3) Artificial Neural Networks (ANN), and (4) Random Forest Regression (RFR). For different model training and implementation approaches, the following strategies were considered: (1) Global Window Strategy (GWS), (2) Conceptual Window Strategy (CWS), (3) Regular Moving Window Strategy (RLWS), (4) Object-Based Window Strategy, and (5) Decision-Level Integration Window Strategy (DIWS). The second approach presents a novel physical model for enhancing the spatial resolution of LST using energy balance equations across different land cover types. For the first time, this model combines the Temperature Separation Principle (TSP) and Thermal Unmixing Model (TUM) frameworks to improve accuracy. This integration ensures that the physical nature of the spatial resolution enhancement process significantly mitigates scaling effects on LST accuracy, maintaining or improving the absolute accuracy of LST. The study uses diverse datasets, including imagery from Landsat 8 and MODIS Terra satellites, land cover maps, impervious surface percentages, digital elevation models, building heights, population density, and ground-based measurements. The study area included six cities in the United States (Chicago, Dallas, Minneapolis, Phoenix, Seattle, and Kansas), 13 cities in Europe (Lisbon, Madrid, Zamora, Bucharest, Vienna, Prague, Paris, London, Warsaw, Copenhagen, Herning, Stockholm, and Helsinki), and one city in Iran (Tehran). The findings reveal that in urban and agricultural areas, biophysical characteristics predominantly influence LST distribution, whereas topographical features have a greater impact in mountainous regions. Urban areas exhibit stronger effects of surface texture and neighborhood characteristics on LST distribution compared to other regions. Incorporating neighborhood effects and landscape parameters in the spatial resolution enhancement process reduced the LST error by 0.8 K in warm seasons and 0.4 K in cold seasons. Furthermore, improving the spatial resolution of LST from 1000 m to 30 m using the regression-based model at the decision-making level and the SEB model reduced the LST error by an average of 2.5 K (3.4 K) in warm seasons and 1.2 K (1.8 K) in cold seasons. The SEB model also provided additional insights into temperature distribution by accounting for evapotranspiration and energy fluxes. These findings underscore the high potential of the proposed approaches in simultaneously improving the spatial resolution and accuracy of LST, making them highly applicable for environmental and urban studies. 

Keywords: LST, Spatial Resolution Enhancement, Surface Energy Balance, Regression Models, Decision-Level Integration

How to cite: Karimi Firozjaei, M., Rahimi, M., Kiavarz, M., Rahimi, L., AghaKouchak, A., De Michele, C., and Manfreda, S.: Enhancing Spatial Resolution and Accuracy of Land Surface Temperature: Integration of Regression-based and Surface Energy Balance Models, EGU General Assembly 2025, Vienna, Austria, 27 Apr–2 May 2025, EGU25-2096, https://doi.org/10.5194/egusphere-egu25-2096, 2025.

EGU25-2848 | ECS | Posters on site | HS10.11

Long-term gridded land evapotranspiration reconstruction using Deep Forest with high generalizability 

Qiaomei Feng, Dashan Wang, and Zhenzhong Zeng

Previous datasets have limitations in generalizing evapotranspiration (ET) across various land cover types due to the scarcity and spatial heterogeneity of observations, along with the incomplete understanding of underlying physical mechanisms as a deeper contributing factor. To fill in these gaps, here we developed a global Highly Generalized Land (HG-Land) ET dataset at 0.5° spatial resolution with monthly values covering the satellite era (1982–2018). Our approach leverages the power of a Deep Forest machine-learning algorithm, which ensures good generalizability and mitigates overfitting by minimizing hyper-parameterization. Model explanations are further provided to enhance model transparency and gain new insights into the ET process. Validation conducted at both the site and basin scales attests to the dataset’s satisfactory accuracy, with a pronounced emphasis on the Northern Hemisphere. Furthermore, we find that the primary driver of ET predictions varies across different climatic regions. Overall, the HG-Land ET, underpinned by the interpretability of the machine-learning model, emerges as a validated and generalized resource catering to scientific research and various applications.

How to cite: Feng, Q., Wang, D., and Zeng, Z.: Long-term gridded land evapotranspiration reconstruction using Deep Forest with high generalizability, EGU General Assembly 2025, Vienna, Austria, 27 Apr–2 May 2025, EGU25-2848, https://doi.org/10.5194/egusphere-egu25-2848, 2025.

EGU25-4159 | ECS | Orals | HS10.11

Can we estimate evaporation using commercial microwave links? 

Luuk van der Valk, Oscar Hartogensis, Miriam Coenders-Gerrits, Rolf Hut, Bas Walraven, and Remko Uijlenhoet

Spatial evaporation estimates are essential information for studying the water cycle, yet the amount of direct observations, such as Eddy-Covariance (EC) networks, are limited. Satellites can also provide spatial evaporation estimates, but these are based on indirect measurements of surface conditions and contain many assumptions. As a new method, we explore the potential of commercial microwave links (CMLs), such as used in cellular telecommunication networks, to be used as scintillometers. Scintillometers are dedicated instruments to measure path-integrated latent and sensible heat fluxes, which transmit electromagnetic radiation that is diffracted by turbulent eddies between transmitter and receiver, the so-called scintillation effect. CMLs are also line-of-sight devices that transmit electromagnetic radiation at similar frequencies as microwave scintillometers. Here, we estimate 30-min latent heat fluxes and daily evaporation estimates using the received signal level from a CML sampled at 20 Hz. To do so, we use data of a 38 GHz Nokia Flexihopper CML (formerly part of a telecom network) installed over an 856 m path at the Ruisdael Observatory near Cabauw, the Netherlands. We compare our results with estimates of a combined optical and microwave scintillometer setup, as well as an EC system.

Before obtaining flux estimates, we correct for the white noise present in the signal of the CML, based on power spectra of the CML and the microwave scintillometer, and obtain 30-min estimates of the structure parameter of the refractive index Cnn. Subsequently, to obtain the flux estimates from these Cnn estimates, we apply the two-wavelength method, in combination with the optical scintillometer, as well as a standalone energy-balance method (EBM), requiring net radiation estimates. Also, we consider the free-convection scaling of Monin-Obukhov similarity theory (MOST), instead of the complete scaling. An advantage of this scaling is that it removes the need for horizontal wind speed measurements, which are more difficult to obtain in complex environments. For the net radiation estimates, we use in-situ measured radiation and data products provided by the Satellite Application Facility on Land Surface Analysis (LSA SAF) of EUMETSAT.

Considering both turbulent heat fluxes, the two-wavelength method outperforms the EBM. The standalone EBM shows a reasonable performance, but depends heavily on the quality of the net radiation estimates. When aggregating our 30-min latent heat fluxes to daily evaporation estimates, the overall performance for both methods remains comparable. These daily evaporation estimates could also be useful for hydrological applications, e.g., for catchment-scale water budget studies. Moreover, application of the free-convection scaling instead of the complete MOST scaling results in a comparable performance for all methods. Before adoption of our methods to obtain evaporation estimates using CML networks, the influence of different CML design types and their sampling strategies in operational networks on the obtained flux estimates needs to be studied. If these are successfully addressed, CMLs could show a large potential to estimate evaporation, especially considering that existing CML networks are present at locations where evaporation observations are lacking.

How to cite: van der Valk, L., Hartogensis, O., Coenders-Gerrits, M., Hut, R., Walraven, B., and Uijlenhoet, R.: Can we estimate evaporation using commercial microwave links?, EGU General Assembly 2025, Vienna, Austria, 27 Apr–2 May 2025, EGU25-4159, https://doi.org/10.5194/egusphere-egu25-4159, 2025.

EGU25-5188 | ECS | Posters on site | HS10.11

Improving groundwater evapotranspiration modeling in saline areas by integrating remote sensing data 

Liya Zhao, Jingwei Wu, Qi Yang, and Anne Gobin

Groundwater evapotranspiration (ETg) is a crucial upward water flux in the water budget, especially in arid and semi-arid saline areas. Modeling ETg is challenging as it involves complex biogeophysical processes in both soil and vegetation dynamics. However, these processes are vastly oversimplified in commonly used process-based models like MODFLOW, where the ETg modeling relies solely on groundwater table depth. To disentangle this issue, this study presents the Evapotranspiration Package with Multi-factor (ETM), an enhancement to MODFLOW which additionally incorporates soil properties, vegetation information, and salinity levels to simulate spatiotemporal ETg. Compared to the original MODFLOW-EVT package, the proposed ETM package mitigates structural uncertainty by involving external soil and vegetation information based on optical remote sensing data. We conducted intensive experiments in Hetao, a one-thousand-year irrigation district in China. Daily groundwater table depth time-series for 108 observation wells were collected and used for calculating ground truth ETg based on the groundwater level fluctuation method. We evaluate the proposed ETM package in both well-level and regional-level experiments. In the well-level experiments, the ETM outperformed the EVT package with the coefficient of determination increasing from -1.698 to 0.449 and the RMSE reducing from 1.906 mm to 0.861 mm. Additionally, we employed the ETM package to model regional ETg for a 3,000-ha experimental area. Compared to the original EVT package which primarily considers groundwater level and results in more homogeneous outputs, the proposed ETM package demonstrated diverse ETg estimates in which the spatial pattern aligns with the prior knowledge. This improved approach addresses the shortcomings of previous models and contributes to more informed agricultural water resource management and planning through a deeper understanding of groundwater dynamics.

How to cite: Zhao, L., Wu, J., Yang, Q., and Gobin, A.: Improving groundwater evapotranspiration modeling in saline areas by integrating remote sensing data, EGU General Assembly 2025, Vienna, Austria, 27 Apr–2 May 2025, EGU25-5188, https://doi.org/10.5194/egusphere-egu25-5188, 2025.

Transpiration flux estimations for individual trees usually rely on point-information obtained from a limited number of sap flow sensors and wood core samples. The underlying assumption is that sap flux densities and wood properties are sufficiently homogeneous within one tree and well represented by a few sensor measurements and wood samples. If this assumption is justified or not, however, has rarely been experimentally tested and quantitatively evaluated. Our objective was to quantify the variability of individual sap flux measurements within one tree and to answer the question how the observed uncertainty could most effectively be reduced.

We installed 23 sap flow sensors into, and took 30 wood core samples from one specimen of Pinus sylvestris. Eventually, we obtained six stem cross sections from the same tree. This extensive sampling allowed us to asses the within-tree variability of sap flow velocities, wood densities and sapwood depths. Based on our various measurements, we applied a boot-strapping scheme to quantify the uncertainty of tree level transpiration flux estimates that would result from different numbers of installed sap flow sensors and extracted wood cores.

Our results indicate that the temporal courses of sap flux densities within our studied tree were highly correlated to each other (R² >= 0.98), but their absolute values varied considerably (coefficient of variation (CV) of 11.3% and 26.6% for outer and inner measurement depths, respectively) without showing a remarkable spatial pattern. Wood densities were the least variable parameter (CV of 2.5%), while the uncertainty of the conducting sapwood area varied across six stem cross sections (CVs between 8% and 14%).

We conclude, that the within-tree variability of sap flux densities and sapwood areas – even for a tree stem without any remarkable anomalies – can quickly lead to considerable errors of sap flux estimates. In our case, the heterogeneity of sap flux densities (especially within the inner sapwood) was so high, that it dominated the overall uncertainty. Consequently, the most effective way to reduce the uncertainty of our sap flux estimates was to increase the number of installed sap flow sensors, while additional wood core information only started to pay off in conjunction with higher numbers (≥4) of installed sap flow sensors. A reduction of the overall sap flux uncertainty (CV of 16 % for one sap flow sensor and one wood core) to a CV around 5% would have required at least seven sap flow sensors combined with information of eight wood cores, but could as well have been achieved with ten sap flow sensors combined with the information of two wood cores.

How to cite: Seeger, S. and Maier, M.: How many sap flow sensors and wood cores are required to accurately measure the sap flux of one tree?, EGU General Assembly 2025, Vienna, Austria, 27 Apr–2 May 2025, EGU25-6242, https://doi.org/10.5194/egusphere-egu25-6242, 2025.

EGU25-7715 | Posters on site | HS10.11

Progress in implementing diverse strategies to enhance the understanding of water vapor and greenhouse gas fluxes across varied land covers in tropical regions 

Jamil Alexandre Ayach Anache, Edson Wendland, Luiza Jardim Machado, Heitor de Sousa Pantarotto, and Samuel Almeida Dutra Júnior

The tropics play a pivotal role in the terrestrial energy and water cycles, as well as regulating the carbon cycle. The increasing pressures over the remaining natural vegetation areas in Brazilian tropical forests, allied to climate change, are likely expected to alter these cycles. Despite the existence of studies that have already observed changes on water and energy fluxes, questions regarding heat and mass exchange mechanisms and the biophysical processes in tropical ecosystems and crops for food and energy production remain. In order to enhance the knowledge towards these research questions, in-situ monitoring with high spatial and temporal resolutions are needed. This project aims to use and validate advanced approaches used to monitor and model water vapor, energy, and greenhouse gases (GHG) fluxes through in situ monitoring (sampling) in strategic land covers and forest ecosystems. With this purpose, besides a fixed-continuous monitoring in a wooded Cerrado (a tropical woodland) equipped with an Eddy Covariance system, a mobile set up monitoring system to water and energy fluxes, and GHG concentrations measurements will be used in different areas. This system will be a non-steady-state flux chamber connected to a closed-path gas analyzer. The target monitoring areas include different land covers (soybean, pasture, sugar cane, and other agricultural areas) and undisturbed areas (wooded Cerrado and riparian vegetation). The expected outcomes will contribute to improve methodologies and models through the better comprehension of the dynamics and the shifts of the water, energy and GHG fluxes. After the in-situ monitoring following a representative sampling criteria to catch both seasonal and spatial variabilities to measure the selected fluxes, mathematical models will be calibrated to allow the expansion of the timeseries and simulations including possible variations in the input variables. Afterwards, the observations, parameters, and simulations will serve as input for hydrological repositories, carbon inventories, and new contributions about water, energy, and carbon fluxes in a tropical region. Disclaimer: This abstract describes an ongoing project. Please note that it does not contain any results or conclusions, as the work is still in progress.

How to cite: Ayach Anache, J. A., Wendland, E., Jardim Machado, L., de Sousa Pantarotto, H., and Almeida Dutra Júnior, S.: Progress in implementing diverse strategies to enhance the understanding of water vapor and greenhouse gas fluxes across varied land covers in tropical regions, EGU General Assembly 2025, Vienna, Austria, 27 Apr–2 May 2025, EGU25-7715, https://doi.org/10.5194/egusphere-egu25-7715, 2025.

EGU25-8862 | Orals | HS10.11

Point dendrometers are simple and reliable tools for improving forest transpiration estimation accuracy at stand scales   

Ryan Bright, Danielle Creek, Holger Lange, Helge Meissner, Morgane Merlin, and Junbin Zhao

In terrestrial ecosystems, forest stands are the primary drivers of atmospheric moisture and local climate regulation, making the quantification of transpiration (T) at the stand level both highly relevant and scientifically important.  Stand-level T quantification complements evapotranspiration monitoring by eddy-covariance systems, providing valuable insight into the water use efficiency of forested ecosystems in addition to serving as important inputs for the calibration and validation of global transpiration monitoring products based on satellite observations.

Stand level T estimates are typically obtained by scaling up individual tree estimates of water movement within the xylem – or sap flow.  This movement affects the radius of a tree stem, whose fluctuations over the diel cycle provide pertinent information about tree water relations which can be readily detected by point (or precision) dendrometers.  While sap flow measurements have greatly advanced our understanding of water consumption (T) at the level of individual trees, deploying conventional sap flow monitoring equipment to quantify T at the level of entire forested stands (or ecosystems) can quickly become costly since sap flow measurements from many trees are required to reduce the uncertainty of the upscaling.

Using a boreal old-growth Norway spruce stand at an ICOS site in Southern Norway as a case study, we assess the potential of augmenting conventional sap flow monitoring systems with sap flow modeling informed by point dendrometer measurements to reduce the uncertainty of stand level T estimation at the daily resolution.  We test the hypothesis that the uncertainty reduction afforded by a boosted tree sample size more than offsets the propagation of uncertainty originating from the point dendrometer-based sap flow estimates.

How to cite: Bright, R., Creek, D., Lange, H., Meissner, H., Merlin, M., and Zhao, J.: Point dendrometers are simple and reliable tools for improving forest transpiration estimation accuracy at stand scales  , EGU General Assembly 2025, Vienna, Austria, 27 Apr–2 May 2025, EGU25-8862, https://doi.org/10.5194/egusphere-egu25-8862, 2025.

EGU25-8943 | Orals | HS10.11

An overview of satellite-based evapotranspiration products in the framework of the CEOS Land Product Validation Subgroup 

Carmelo Cammalleri and the CEOS Land Product Validation Subgroup - Evapotranspiration

Actual evapotranspiration (ET) is commonly the largest extractive term in the land surface water balance, thus representing a key component of any water management activity and water resource quantification. Unfortunately, in-situ ET observations are often expensive, sporadically collected, and representative only of local conditions. In this context, modelling approaches represent a widespread alternative for the characterization of ET over large areas and for log time periods. While most of the spatially-distribute ET estimation approaches relies on satellite data to some extent, not all these estimates can be considered as satellite ET products. Like other satellite-based datasets, ET estimates are indirect in nature, and often depend on modelling approaches characterized by a variety of approaches and input requirements integrating a mixture of satellite and non-satellite datasets. With continuous advancements and developments in satellite data, the number of continental to global satellite ET products are increasing and they are characterized by a vast variety of sensors and modelling methods. This increasing number of available ET products underscores the need for a concerted effort in defining the standards and protocols for validation and evaluation exercises, which is the main goal of the Committee on Earth Observation Satellite (CEOS) Land Product Validation (LPV) subgroup. In this research, an overview of the methodologies adopted for the assessment of satellite-based ET will be provided, with a focus on the key hypotheses and forcings representing the “satellite” component of the approaches. This overview will provide a common reference of what constitute a satellite-based ET product, to be investigated by the CEOS LPV subgroup in the definition of recommended protocols to assess the accuracy and reliability of current and future continental to global satellite ET datasets.

How to cite: Cammalleri, C. and the CEOS Land Product Validation Subgroup - Evapotranspiration: An overview of satellite-based evapotranspiration products in the framework of the CEOS Land Product Validation Subgroup, EGU General Assembly 2025, Vienna, Austria, 27 Apr–2 May 2025, EGU25-8943, https://doi.org/10.5194/egusphere-egu25-8943, 2025.

The resilience of regional hydrology in human-influenced landscapes is a key challenge in the context of climate change. Lusatia in East Germany is an example of a region facing complex challenges in water management due to massive open pit mining activities as well as being subject to increasing water climate-induced scarcity. This study presents a comprehensive validation and comparative analysis of multi-temporal satellite-based evapotranspiration evapotranspiration (ET) data at multiple spatial resolutions including the 2000m Central Europe Refined Analysis (CERv2) – a product derived from the Weather Research and Forecasting (WRF) model forced by ERA5 reanalysis – alongside the 500m Moderate Resolution Imaging Spectroradiometer (MODIS) global product and 30m Landsat based ET, using lysimeter and eddy covariance measurements as ground-based references. This approach aims to assess the accuracy and practical utility of these data products for informing regional water management strategies. For the first time, a long-term analysis of landscape water balance changes and resilience is conducted, focusing on evapotranspiration as a central parameter for assessing the spatial and temporal variability of water dynamics. To compare the time series data, metrics such as Mean Absolute Error (MAE) were used to evaluate the agreement between satellite-based datasets and reference measurements. Our results reveal differences in the absolute values of evapotranspiration across the datasets. MODIS data, for instance, tend to underestimate evapotranspiration in water-saturated areas, while Landsat data appear to overestimate evapotranspiration in forested areas. These findings suggest the presence of systematic deviations influenced by specific hydrological conditions and land use types. Despite these differences, the datasets exhibit strong consistency in terms of spatial patterns as well as of generic temporal dynamics, suggesting that the key processes driving evapotranspiration are reliably represented. Analysis of long-term ET trends highlights the sensitivity of different land use types to climatic changes. Notably, all datasets indicate an increasingly earlier seasonal decline in ET on agricultural land over the past 20 to 30 years, reflecting shifts in water availability patterns. These findings provide a foundation for advancing water management models and developing sustainable management concepts. The insights not only support local management strategies but can also offer transferable frameworks for addressing similar challenges in comparable landscapes in Central Europe.

How to cite: Kröcher, J., Ghazaryan, G., and Lischeid, G.: Monitoring Changes in the Landscape Water Balance: A Comparative Analysis of Satellite-Based Evapotranspiration Data in the Northern German Lowlands, EGU General Assembly 2025, Vienna, Austria, 27 Apr–2 May 2025, EGU25-11213, https://doi.org/10.5194/egusphere-egu25-11213, 2025.

Although Evapotranspiration (ET) has long been recognised as a key process for the redistribution of water and energy at a global scale, there remains uncertainty in the actual ET rates at a local scale from vegetated Sustainable Drainage Systems (SuDS). ET has been seen to account for between 61 % and 21 % of the water balance in these systems, demonstrating its significance in the overall system performance. There is a requirement to improve our understanding of the variance of ET rates from SuDS and similar systems. By extension, there is a need for robust ET estimation methods which can be readily applied to a variety of SuDS at different spatial and temporal scales.

The Three-Temperatures (3-T) method is one such approach, which only requires net radiation and surface temperatures from the vegetated surface and a corresponding imitation surface, alongside the overlying air temperature. This method has been previously applied to a variety of different surface types, spatial scales and environments. However, it has been met with a varying degree of success and often only produced spot ET estimates. Furthermore, its limitations are not fully understood and producing a continuous record of ET estimates allows us to see when and under what conditions spot estimates of 3-T ET may be considered credible.

This preliminary study aimed to determine if reasonable continuous ET estimates could be achieved from the 3-T method for a small vegetated surface analogous to SuDS and or green infrastructure (GI). This included the establishment of an experimental setup, which captured the relevant 3-T parameters and those required to calculate hourly reference ET rates as determined by the FAO 56 Penman–Monteith (P-M) method, to use for comparison purposes. Practical considerations (e.g. building shadowing) and sensitivity analysis of 3-T ET estimates to changes in the 3-T parameters were also explored, to provide a deeper understanding of the method’s robustness.

Initial results indicated that the 3-T method can produce periods of ‘reasonable’ continuous hourly ET values, between 0.0 mm.hr-1 to 0.5 mm.hr-1 under preferred conditions. Following a period (up to 3 days) of dry weather conditions, the cumulative reference ET was 2.3 mm and the corresponding 3-T ET was 2.9 mm, showing a total difference of 26% at the end of 3 days. The tendency of the 3-T method to produce higher ET estimates during the day compared to the reference ET values, was attributed to instances where the surface temperatures approach that of the air temperature. The preliminary findings show promise for the 3-T method to produce continuous records of ET, but have also highlighted the need for further research on the method’s application to vegetated SuDS and or GI.

How to cite: Wickham, B., Stovin, V., and De-Ville, S.: A preliminary study on the feasibility of continuously estimating evapotranspiration from vegetated surfaces using the three-temperatures method., EGU General Assembly 2025, Vienna, Austria, 27 Apr–2 May 2025, EGU25-13187, https://doi.org/10.5194/egusphere-egu25-13187, 2025.

In recent years, the Alpine region has experienced an increasing frequency of drought events, leading to periods of reduced water availability and consequent impacts on both agricultural and hydropower production. Evapotranspiration (ET) is a key variable for detecting drought conditions and optimizing water resource management, yet accurate estimates of ET at high spatial resolution remain scarce in mountainous regions. Remote sensing has become a valuable tool for generating spatially distributed ET maps using thermal infrared data. Among the existing methods, the Two-Source Energy Balance (TSEB) model has demonstrated robust performance across diverse land types and climates. In this work, we run TSEB simulations forced by input data optimized for complex terrain to assess the model's behavior in the Alpine region. Key datasets include topographically corrected high-resolution solar irradiance derived from a radiation product based on Meteosat Second Generation data (0.05° spatial resolution) and a high-resolution (5-m) land-cover map specific to the Alpine region. Vegetation height was obtained from a 30-m canopy height map derived from the Global Ecosystem Dynamics Investigation (GEDI) dataset, while biophysical parameters were estimated using distinct algorithms for forested and non-forested areas. We present a validation of the TSEB model at eddy covariance (EC) sites distributed across the Alpine region, representing a wide range of elevations and diverse land cover types. The model's performance was assessed using four configurations: (1) observed input variables from EC sites, (2) the standard Sen-ET implementation of TSEB using coarse resolution data, (3) high-resolution inputs as described above, and (4) a configuration incorporating meteorological data from a high-resolution analysis dataset. This work contributes to the PNRR project RETURN (Multi-risk science for resilient communities under a changing climate) and to the Italian National Drought Hydrological Monitoring System (NatDHMS).

How to cite: Deidda, P., Bartkowiak, P., and Castelli, M.: Improving Two-Source Energy Balance Modeling of Evapotranspiration in Complex Terrain: Validation at Alpine Eddy Covariance Sites, EGU General Assembly 2025, Vienna, Austria, 27 Apr–2 May 2025, EGU25-13491, https://doi.org/10.5194/egusphere-egu25-13491, 2025.

Over a century of study of ecosystem water fluxes has resulted an abundance of in-situ measurement techniques causing the availability of robust and continuous measurements to quietly grown by orders of magnitude in the last few years. For example, the ten years since the release of the FLUXNET 2015 synthesis dataset (which contained records dating back 25 years) has more than doubled the amount of eddy covariance measurements publicly released, with now over a million total days of measurements taken from over 450 sites globally. Furthermore, other dataset synthesis efforts for sap flux, soil moisture, stream flow, etc., as well as combinations with proximal and remote sensing, quickly result in datasets much larger than can be tackled by an individual. The advancement of machine learning and computational power to digest and utilize this deluge of environmental data hold promise to be able to understanding global water cycles in an unprecedented detail. However, limitations to applying machine learning methods often comes not from computational power, but rather in understanding the particular uncertainties and nuances, as well as unique information on ecosystem functioning, that each dataset brings.

Here, I briefly outline the current state of the art of scaling ecosystem water fluxes from in-situ to regional and global scales through the example of eddy covariance and the FLUXCOM-X framework [1]. Particularly, I highlight the current sources of uncertainties, such as measurement corrections and spatial extrapolation, as well as the potential limitations of machine learning and artificial intelligence in tackling these issues. Furthermore, comparing up-scaled eddy covariance evapotranspiration and transpiration products to terrestrial land surface models demonstrates the discrepancy in the global ratio of transpiration to ET between process based and data driven methods, demonstrating how machine learning from in-situ scales can inform our understanding of global cycle. Finally, I explore how integration of multiple data sources holds promise in isolating individual ecosystem water fluxes and to link the local measurements of individual plants and ecosystems to the regional and global scales.

1 - Nelson and Walther et al., 2024. X-BASE: the first terrestrial carbon and water flux products from an extended data-driven scaling framework, FLUXCOM-X. Biogeosciences 21, 5079–5115. https://doi.org/10.5194/bg-21-5079-2024

How to cite: Nelson, J. A.: Scaling terrestrial ecosystem water fluxes at the interface of in-situ measurements and machine learning, EGU General Assembly 2025, Vienna, Austria, 27 Apr–2 May 2025, EGU25-15919, https://doi.org/10.5194/egusphere-egu25-15919, 2025.

EGU25-16088 | Orals | HS10.11

Capturing Fine-Scale Variability in Dryland Evapotranspiration Through Multi-Scale Thermal Image Analysis 

Kelly Caylor, Shadman Amin, Bryn Morgan, and Anna Trugman

Accurate estimation of evapotranspiration (ET) in drylands is critically dependent on capturing fine-scale spatial variability, yet current thermal remote sensing approaches face significant scaling limitations. While satellite-based thermal imagery provides broad coverage for ET estimation, its coarse resolution fails to capture the heterogeneous vegetation patterns characteristic of dryland ecosystems, leading to systematic biases in ET estimates. The non-linear relationship between land surface temperature (LST) and ET means that coarse-resolution LST measurements cannot simply be averaged to estimate ecosystem-scale ET. Instead, the underlying spatial variance in LST must be properly accounted for when scaling between observations at different resolutions. Here, we demonstrate an approach using very high resolution (VHR) UAV-derived thermal imagery (0.3-m resolution) combined with multi-scale satellite observations (up to 90-m resolution) to develop scaling relationships between LST variance and spatial resolution. We show how these relationships vary with vegetation composition and seasonal dynamics in a dryland ecosystem over one year. By modeling how LST variance changes across scales, we can better estimate ET from coarser thermal imagery while preserving the influence of fine-scale heterogeneity. Our results indicate that vegetation pattern and phenological stage significantly influence scaling behavior, allowing us to identify optimal measurement resolutions for different ecosystem conditions. This approach reduces uncertainty in ET estimates from satellite thermal imagery by incorporating the effects of sub-pixel spatial variability revealed by VHR observations. The scaling relationships we develop provide a framework for improving regional ET estimates in drylands while accounting for their characteristic fine-scale vegetation patterns.

How to cite: Caylor, K., Amin, S., Morgan, B., and Trugman, A.: Capturing Fine-Scale Variability in Dryland Evapotranspiration Through Multi-Scale Thermal Image Analysis, EGU General Assembly 2025, Vienna, Austria, 27 Apr–2 May 2025, EGU25-16088, https://doi.org/10.5194/egusphere-egu25-16088, 2025.

EGU25-16431 | Orals | HS10.11

Towards high resolution evaporation data integrating satellite observations and hybrid modelling over Europe and Africa 

Oscar M. Baez-Villanueva, Diego G. Miralles, Olivier Bonte, Akash Koppa, Joppe Massant, Fangzheng Ruan, Maximilian Söchting, and Miguel Mahecha

Terrestrial evaporation (E) is a critical climate variable that links the water, carbon, and energy cycles. It plays a vital role in regulating precipitation, temperature, and extreme events such as droughts, floods, and heatwaves. In hydrology, E represents a net loss of water resources, while in agriculture, it determines irrigation demands. Despite its significance, global E estimates remain uncertain due to the scarcity of ground-based measurements, the complexity of physiological and atmospheric interactions, and challenges in capturing E through satellite observations. Addressing these limitations, the fourth generation of the Global Land Evaporation Amsterdam Model (GLEAM4¹) enhances the representation of E and its components by improving the representation of key processes such as interception loss, atmospheric water demand, soil moisture dynamics, and plant groundwater access. Using a hybrid framework that combines machine learning for evaporative stress estimation with physical principles, GLEAM4 balances interpretability with adaptability and validation against hundreds of eddy-covariance sites demonstrates its robustness and improved performance.

Building on GLEAM4, efforts are underway to develop a high-resolution (1 km) E dataset tailored to the needs of agriculture, water management, and climate adaptation. GLEAM-HR downscales precipitation from MSWEPv2.8 and radiative forcing data by optimally merging LSA SAF and MODIS. The innovations introduced in GLEAM-HR address fine-scale E dynamics, particularly in agricultural regions, while enabling the characterization of droughts, heatwaves, and water resource distribution in vulnerable areas. Preliminary results from GLEAM-HR over the Meteosat disk (covering Europe and Africa) highlight its potential to tackle water-related challenges, support sustainable water management practices, and contribute to evidence-based decision-making. In the future, the data products will be available publicly through an interactive 3D data cube application.


¹Miralles, D.G., Bonte, O., Koppa, A., Baez-Villanueva, O.M., Tronquo, E., Zhong, F., Beck, H., Hulsman, P., Dorigo, W., Verhoest, N.E. and Haghdoost, S. GLEAM4: global land evaporation dataset at 0.1° resolution from 1980 to near present, 20 November 2024, PREPRINT (Version 1) available at Research Square (https://doi.org/10.21203/rs.3.rs-5488631/v1)

How to cite: Baez-Villanueva, O. M., G. Miralles, D., Bonte, O., Koppa, A., Massant, J., Ruan, F., Söchting, M., and Mahecha, M.: Towards high resolution evaporation data integrating satellite observations and hybrid modelling over Europe and Africa, EGU General Assembly 2025, Vienna, Austria, 27 Apr–2 May 2025, EGU25-16431, https://doi.org/10.5194/egusphere-egu25-16431, 2025.

EGU25-16717 | Orals | HS10.11

Ensemble evapotranspiration estimates and uncertainties: EVASPA 

Samuel Mwangi, Albert Olioso, Gilles Boulet, Jordi Etchanchu, Vincent Rivalland, Nesrine Farhani, Jérôme Demarty, Chloé Ollivier, Kanishka Mallick, Tian Hu, Aolin Jia, Emmanuelle Sarrazin, Philippe Gamet, and Jean-Louis Roujean

Quantifying evapotranspiration (ET) beyond the local scale is essential for many water-related studies. Compared to in-situ instruments, Remote sensing (RS) has allowed the continuous monitoring of ET at larger spatial scales. By exploiting the physical relationship between remotely sensed surface biophysical parameters and the Earth’s thermal emission, continuous ET at such spatial scales can be obtained. In this study, we applied EVASPA, a tool that provides an ensemble of ET estimates, among other surface energy balance (SEB) variables, from various sources of data and several algorithms. Here, we applied MODIS data, which included: Land Surface Temperature/Emissivity (LST/E), NDVI, albedo, among others. Landsat data was separately applied for estimates at relatively high spatial resolution. Our multi-data multi-method approach resulted in 1215 ET estimates for the MODIS-based ETs (i.e., 5 LST/E (MYD/MOD 11/21 and VIIRS 21); 3 radiation sources (ERA5Land, MSG, MERRA); 9 Evaporative Fraction methods (5 S-SEBI based, 4 T-VI based), and 9 Ground heat flux methods (based on NDVI and LAI)). Evaluations using in-situ flux data yielded reasonable results even when a simple average was used (for example, RMSE of ~0.9 mm/d over the forested Puechabon site), with a broad absolute and performance range between the member estimates being observed (for instance, an ensemble RMSE range of ~0.6 to ~1.2 mm/d for the best-to-worst performing EVASPA members over the Puechabon site). Uncertainty analyses were also performed where we analysed how each of the distinct variables (i.e. radiation, LST, EF and G methods) influenced the modelled ET. Irrespective of the combination criteria selected, LST and EF were observed to be the main uncertainty drivers; this was despite instances where radiation resulted in higher uncertainties that were dependent on the combination selected and/or the period of simulation. G flux methods exhibited the least influence on the ensemble simulations. Overall, we showed that ensemble-based contextual modelling can provide enough spread for better flux simulations. This work aims to guide the establishment of an optimal weighting criteria of the members for improved ET estimates. The EVASPA algorithms will be used for providing ET estimates in the frame of the Indo/French future mission TRISHNA to be launched by the end of 2026.

Keywords: ET, SEB, contextual ET, multi-method multi-data, ensemble modeling.

How to cite: Mwangi, S., Olioso, A., Boulet, G., Etchanchu, J., Rivalland, V., Farhani, N., Demarty, J., Ollivier, C., Mallick, K., Hu, T., Jia, A., Sarrazin, E., Gamet, P., and Roujean, J.-L.: Ensemble evapotranspiration estimates and uncertainties: EVASPA, EGU General Assembly 2025, Vienna, Austria, 27 Apr–2 May 2025, EGU25-16717, https://doi.org/10.5194/egusphere-egu25-16717, 2025.

Global evapotranspiration (ET) products are critical for modeling climate, hydrology, land surface processes, and managing water resources. These products are derived using diverse methodologies, including machine learning, energy balance, and process-based models. While many studies have assessed ET products, they typically focus on specific regions or basins. Moreover, no intercomparison has specifically addressed irrigated areas, despite their significant role in regional climate and hydrology. To fill this gap, this study evaluates eight global ET products (FLUXCOM, MOD16A2, ERA5-Land, GLDAS-Noah, GLEAMv4, MERRA2, SSEBOP, PML v2) across 12 irrigated regions in the contiguous United States, Spain, Italy, Australia, China and India, characterized by diverse irrigation practices, climates, and crop types. The analysis examines ET dynamics and magnitudes in relation to auxiliary irrigation data (timing, equipment rates, and climate), includes a spatial evaluation of ET against the Global Map of Irrigated Areas (GMIA), and analyzes the spatial patterns of the ET/ETP ratio. The products are also locally validated using in situ ET measurements from five Eddy Covariance towers located in irrigated fields in California and Italy. Our results reveal substantial discrepancies among ET products in their ability to: i) detect irrigation signals, ii) capture seasonal irrigation patterns, and iii) estimate ET volumes consistent with crop water needs and local climatic conditions. Furthermore, the relationship between ET dynamics and irrigation information differs significantly between regions, sometimes even for the same product. These findings highlight the need to enhance global ET products to better incorporate irrigation dynamics, improving their utility for water management, climate modeling, and assessments of anthropogenic impacts on the Earth system.

How to cite: Laluet, P., Corbari, C., and Dorigo, W.: Intercomparison of global evapotranspiration products over irrigated areas using irrigation auxiliary information and in situ Eddy Covariance tower measurements, EGU General Assembly 2025, Vienna, Austria, 27 Apr–2 May 2025, EGU25-17630, https://doi.org/10.5194/egusphere-egu25-17630, 2025.

EGU25-18042 | ECS | Orals | HS10.11

Disentangling water flux dynamics on an eroded cropland using an automated chamber system, water stable isotopes, and novel data-driven machine learning approaches 

Adrian Dahlmann, David Dubbert, Marten Schmidt, Gernot Verch, John D. Marshall, Jürgen Augustin, Mathias Hoffmann, and Maren Dubbert

Understanding the water cycle is increasingly crucial to assess ecosystem resilience and ensure sustainable management and food security. Within the terrestrial water cycle, Evapotranspiration (ET) plays a pivotal role returning 60% of terrestrial precipitation back to the atmosphere. In agricultural systems, especially in water-scarce regions, understanding the water use of crops relative to their productivity (water use efficiency, WUE) is of paramount importance.

The AgroFlux sensor platform, including an automatic, robotic FluxCrane, is part of a long-term experiment in an agricultural system. We combine three years of ET measurements and two years of fully automated water stable isotope measurements coupled with campaign-based soil and plant measurements. The system is measuring along an erosion gradient with three different soil types to examine small scale heterogeneity of soils and their effect during various environmental conditions on different crops. The automated system generates data with high temporal and spatial resolution resulting in a new class of data that both enables and demands modern, efficient data analysis approaches. We use data-driven machine learning modeling approaches as an interface between the high-resolution monitoring networks and campaign-based measurements to provide better predictive results.

With our research we try to improve the knowledge of evapotranspiration by using novel modeling approaches coupled with measurements of common environmental parameters, plant specific parameters and water stable isotopes. We are investigating the potential of evapotranspiration estimation and modeling, and the possibility of automatically measuring and modeling the isotopic signature of evapotranspiration to decompose the water cycle into its components.

How to cite: Dahlmann, A., Dubbert, D., Schmidt, M., Verch, G., Marshall, J. D., Augustin, J., Hoffmann, M., and Dubbert, M.: Disentangling water flux dynamics on an eroded cropland using an automated chamber system, water stable isotopes, and novel data-driven machine learning approaches, EGU General Assembly 2025, Vienna, Austria, 27 Apr–2 May 2025, EGU25-18042, https://doi.org/10.5194/egusphere-egu25-18042, 2025.

EGU25-18779 | Orals | HS10.11

Towards an ensemble of RS-based SEB models to constrain the uncertainty in daily ETc monitoring in nut orchards 

Juan Manuel Sánchez, Alejandro Moya, Héctor Nieto, Álvaro Sánchez-Virosta, Joan Miquel Galve, and José González-Piqueras

Woody crops such as almond and pistachio orchards are proliferating very fast in arid and semi-arid agricultural regions. This is the case of the southeastern Spanish region of Castilla-La Mancha, where the shortage of water resources and the low rainfall during the crop growing season under these conditions, makes it necessary to conduct efficient use of irrigation water in order to improve the sustainability of these crops.

A variety of Remote Sensing based (RS-based) surface energy balance (SEB) models have been shown effective to estimate crop evapotranspiration (ETc), and capture water stress conditions, using satellite imagery. Although their performance sometimes depends on the crop type or the environmental conditions. In addition, some limitations remain for an operational and continuous monitoring of daily ETc at a fine spatial and temporal resolution for water management or irrigation scheduling purposes, particularly on nut orchards. A model ensemble might help in overtaking these shortcomings. 

Recent efforts in the framework of the WATERSNUTS project (“remote sensing and digital farming for sustainable water use in almond and pistachio orchards”) have combined computational design with well-stablished SEB approaches into a Python environment to generate daily maps of distributed ETc covering Castilla-La Mancha region, for a selected time period and a predefined spatial resolution, starting with 20 m x 20 m. Up to now, two models, the Mapping Evapotranspiration with Internalized Calibration (METRIC) and Two-Source Energy Balance (TSEB), were implemented for testing, and a time series of Landsat 8-9, and Sentinel 2-3 were used as inputs. Whereas METRIC stands on VNIR and TIR data from Landsat series at 30-m pixel size, the implemented version of TSEB adopts a disaggregated Land Surface Temperature (LST) at 20-m spatial resolution, that has already shown good results in previous research applied to the tandem Sentinel-2 (S2)/Sentinel-3 (S3).

The reference evapotranspiration, ETo, plays a key role in this computational framework to fill the daily gaps with no available satellite images. A layer of 5-km gridded observational daily ETo values was provided by the Spanish State Meteorological Agency (AEMET). A self-derived crop classification map was used to focus the analysis on the nut orchards and discern between irrigated and rainfed plots, and look into the differences between water regimens.

Before upscaling, a local assessment was conducted in an agricultural area located in Tarazona de La Mancha, Spain (39º 15’ 58’’ N, 1º 56’ 23” W), for the period 2021-2024, using data from two full-equipped eddy-covariance towers installed at the center of an almond and a close by pistachio orchards.

The ensemble results are promising for nut orchards such as almonds or pistachio plantations, since S3-S2 disaggregated LST can help in increasing the frequency of daily ETc estimates through TSEB modeling in reduced size plots, while METRIC can outperform for those days with Landsat overpass. Further integration of additional SEB approaches, or RS-based water balance estimates, would enrich the ensemble, and foster the constrain of the uncertainty in evapotranspiration monitoring in nut orchards.

How to cite: Sánchez, J. M., Moya, A., Nieto, H., Sánchez-Virosta, Á., Galve, J. M., and González-Piqueras, J.: Towards an ensemble of RS-based SEB models to constrain the uncertainty in daily ETc monitoring in nut orchards, EGU General Assembly 2025, Vienna, Austria, 27 Apr–2 May 2025, EGU25-18779, https://doi.org/10.5194/egusphere-egu25-18779, 2025.

EGU25-18865 | Orals | HS10.11

Estimating forest-floor litter evaporation from above- and below-canopy flux tower data 

Marius G. Floriancic, Lukas Hörtnagl, Luana Krebs, Liliana Scapucci, Iris Feigenwinter, Ankit Shekhar, and Nina Buchmann

Forests modulate precipitation and evapotranspiration fluxes. One important – yet often overlooked – component in the forest water cycle is the forest-floor litter layer. Organic matter on the forest floor retains significant amounts of annual precipitation (i.e., throughfall), subsequent evaporation from these forest-floor litter layers enhances below-canopy humidity, thereby potentially reducing atmospheric water demand in closed canopy stands. Evaporation fluxes from the forest floor are often attributed to transpiration, because partitioning of evaporation and transpiration is difficult and thus typically has large uncertainties. Here, we hypothesize that current partitioning estimates that do not account for forest-floor evaporation overestimate forest transpiration rates.

Previous measurements at our “WaldLab Forest experimental site” in Zurich and additional litter sampling in ~400 plots across the European Alps showed that needle and broadleaf litter retained up to 18% of annual precipitation or on third of annual evapotranspiration (ET), leading to substantial overestimates of recharge and transpiration in Alpine forest ecosystems. Here, we compare these results with temporally high-resolved water vapor flux data measured above- and below-canopy at the Swiss FluxNet sites Lägeren (CH-Lae; mixed deciduous forest) and Davos (CH-Dav; evergreen coniferous forest). We estimated the potential contribution of litter-layer evaporation to total below-canopy ET, by calculating half-life storage decay in the litter layer. The maximum water retention capacity of the forest-floor litter layer was estimated from soil moisture measurements at 5 cm depth, and the litter-layer retention timescales were estimated from changes in below-canopy ET after precipitation events. Overall, we found that roughly 60% of below-canopy ET at the Lägeren and Davos sites can be attributed to litter-layer evaporation, thereby suggesting overestimation of transpiration in water balance estimates and potential underestimation of tree water use efficiency.

How to cite: Floriancic, M. G., Hörtnagl, L., Krebs, L., Scapucci, L., Feigenwinter, I., Shekhar, A., and Buchmann, N.: Estimating forest-floor litter evaporation from above- and below-canopy flux tower data, EGU General Assembly 2025, Vienna, Austria, 27 Apr–2 May 2025, EGU25-18865, https://doi.org/10.5194/egusphere-egu25-18865, 2025.

EGU25-18907 | Posters on site | HS10.11

Uncertainties of drone-based cropland evapotranspiration estimation 

Krisztina Pintér and Zoltán Nagy

Drone surveys were conducted at a cropland at Kartal, Hungary in 2024 to estimate the evapotranspiration (ET) of the area. There is an eddy covariance tower in the cropland since 2017. Between 27 May and 8 August 9 campaigns were carried out with a DJI M300 drone equipped by a Micasense Altum (MA) multispectral and thermal camera. The leaf area index (LAI) was also measured at 7 points in the sunflower canopy supplemented light interception measurements to estimate the leaf angle distribution of the canopy. Canopy cover, surface temperature, and LAI maps were produced from the MA’s reflectance values and the LAI samples in the 7 points using partial least squares (PLSR) regression to serve as inputs of the pyTSEB model. The spatial average of the ET pixels from the footprint area of the corresponding eddy covariance flux were validated against the eddy covariance ET.

The first results of validation showed very weak relation between the measured and modelled data. The relationship improved considerably when the surface temperature maps taken by the MA were corrected according to the surface temperature measured from the eddy tower by an Apogee infrared radiometer.

Further improvement was reached when the LAI maps were modified based on the leaf angle distribution estimated from the light interception measurements.

While the correlation between the measured and modelled ET is statistically significant, the intercept of the regression is a considerable (~100 W m-2). 

How to cite: Pintér, K. and Nagy, Z.: Uncertainties of drone-based cropland evapotranspiration estimation, EGU General Assembly 2025, Vienna, Austria, 27 Apr–2 May 2025, EGU25-18907, https://doi.org/10.5194/egusphere-egu25-18907, 2025.

EGU25-19251 | ECS | Posters on site | HS10.11

METRIC-2S: A Two-Source Model for Enhanced Partitioning of Evapotranspiration in Agricultural Landscapes  

Jamal ElFarkh, Bouchra Ait Hssaine, and Abdelghani Chehbouni

Partitioning evapotranspiration (ET) into soil evaporation (E) and plant transpiration (T) is crucial for accurate water resource management. Traditionally, this has been challenging due to the complexity of the underlying processes. In this study, we develop an approach to enhance the Mapping EvapoTranspiration at high Resolution with Internalized Calibration (METRIC) model, enabling better partitioning of landscape-scale flux components. Named METRIC-2S, this approach introduces a two-source scheme into the original single-source model, using soil and vegetation temperatures for partitioning. These temperatures are used by METRIC to calculate two ET components, one for soil and another for vegetation, subsequently weighted by fractional vegetation cover (fc) to compute E and T. Soil and vegetation temperatures are estimated using the hourglass method, driven by surface temperature and fc. ET estimates from both the original METRIC and the revised METRIC-2S models are compared and validated against eddy covariance measurements over three agricultural sites: an olive orchard, a wheat field, and a mixed wheat/olive plantation. METRIC-2S demonstrates significant improvements in accuracy relative to the original METRIC model across all three sites, with reductions in RMSE from 141 to 63 W/m2 at the olive site, 102 to 83 W/m2 at the wheat field, and 180 to 78 W/m2 at the mixed site. To evaluate the performance of the partitioning scheme, transpiration estimates were compared with available sap flow measurements at the olive orchard site on selected dates coinciding with a Landsat overpass, yielding an RMSE of approximately 22.3 W/m2. While further verification and assessment of component values are necessary, the results suggest that the METRIC-2S approach strikes a good balance between simplicity and improved accuracy. 

How to cite: ElFarkh, J., Ait Hssaine, B., and Chehbouni, A.: METRIC-2S: A Two-Source Model for Enhanced Partitioning of Evapotranspiration in Agricultural Landscapes , EGU General Assembly 2025, Vienna, Austria, 27 Apr–2 May 2025, EGU25-19251, https://doi.org/10.5194/egusphere-egu25-19251, 2025.

EGU25-764 | ECS | Orals | CL4.3

Radiogenic Pb and Nd isotopic variability of fine lithic materials in weathering profiles of Deccan Trap, India 

Shivam Sahu, Satinder Pal Singh, and Kumar Batuk Joshi

Radiogenic isotopes are widely used for sediment provenance. Sedimentary processes are often neglected but may influence the radiogenic Sr isotope-based provenance [1]. This study explores the radiogenic Pb-Nd isotopic systematics in fine lithic materials from the critical zone of Deccan Basalt (Raigad, Maharashtra). An insignificant Pb and Nd isotope variability of fine lithic materials (<20 mm, <5 mm, and <2 mm) is highlighted in the soil (n=5) and saprolite (n=10) samples. The fine soil and saprolite materials also show statistically insignificant differences in CIA (Chemical Index of Alteration) irrespective of the grain size. However, the soil materials (206Pb/204Pb 17.422±0.513, 207Pb/204Pb 15.354±0.104, 208Pb/204Pb 37.843±0.409, and eNd –14.4±2.4) are isotopically different as compared to the saprolite materials (206Pb/204Pb 16.823±0.063, 207Pb/204Pb 15.219±0.013, 208Pb/204Pb 37.374±0.056, and eNd –15.7±1.0). The less radiogenic Nd isotopes suggest altered basalt as the source rock composition. Further, the mass balance suggests that one topsoil sample has a significant contribution of ~75–80 % dyke materials exposed nearby. Whereas the other soil samples show <10 % and <6 % contributions from the dyke and UCC-type materials, respectively. These data reaffirms the robust use of Pb and Nd isotopes in sediment provenance. 

Reference:

[1] Dasch, E.J., 1969. Strontium isotopes in weathering profiles, deep-sea sediments, and sedimentary rocks. Geochimica et Cosmochimica Acta, 33(12): 1521-1552.

How to cite: Sahu, S., Singh, S. P., and Joshi, K. B.: Radiogenic Pb and Nd isotopic variability of fine lithic materials in weathering profiles of Deccan Trap, India, EGU General Assembly 2025, Vienna, Austria, 27 Apr–2 May 2025, EGU25-764, https://doi.org/10.5194/egusphere-egu25-764, 2025.

EGU25-1813 | Orals | CL4.3 | Milutin Milanković Medal Lecture

Understanding Paleoclimatic Inference of Stable Water Isotopes using iTRACE Simulation 

Zhengyu Liu

Stable water isotopes (δ18O) in precipitation are one of the most abundant paleoclimate proxies and have been used to infer temperature changes at high latitude and hydrological changes in the tropics. In spite of much progress, however, fundamental questions on the paleoclimate interpretation of stable water isotopes still remain open. Combing water isotope observations and an isotope-enabled TRAnsient ClimatE simulation of the last 21,000 years (iTREACE-21), I will discuss some recent progresses towards the understanding of paleoclimatic inferences of  δ18O.

I will first discuss the δ18O for the pan-Asian monsoon region. We show that the widespread δ18O variability that is coherent over the Asian monsoon continental region is accompanied by a coherent hydroclimate footprint, with spatially opposite signs in rainfall. This footprint is generated as a dynamically coherent response of the Asian monsoon system to meltwater forcing and insolation forcing, reinforced by atmospheric teleconnections. As such, a widespread δ18O depletion in the Asian monsoon region is accompanied by a northward migration of the westerly jet and enhanced southwesterly monsoon wind, as well as increased rainfall from South Asia to northern China, but decreased rainfall in southern China. 

I will then discuss the temperature effect of polar ice core δ18O, quantitatively, in a new framework called the Unified Slope Equations (USE) that illustrates the general relationship between spatial and temporal δ18O-temperature slopes. The application of USE to the Antarctica in model simulations and observations shows that the comparable Antarctica-mean spatial slope with deglacial temporal slope in δ18O-surface temperature is caused accidentally by the compensation responses between the δ18O-inversion layer temperature relation and the inversion layer temperature itself.  This finding further leads us to propose a paleothermometer that is more accurate and robust than the spatial slope as the present day seasonal slope of -inversion layer temperature, suggesting the possibility of reconstructing past polar temperature changes using present observations.

I will finally discuss the climate interpretation of tropical alpine ice core δ18O by combining proxy records with climate models, modern satellite measurements and radiative-convective equilibrium theory. I show that the tropical ice core δ18O is an indicator of the temperature of the middle and upper troposphere, with a glacial cooling of ~7oC . Furthermore, it severs as a Goldilocks indicator of global mean surface temperature change, providing the first estimate of glacial stage cooling that is independent of marine proxies as ~6oC .


How to cite: Liu, Z.: Understanding Paleoclimatic Inference of Stable Water Isotopes using iTRACE Simulation, EGU General Assembly 2025, Vienna, Austria, 27 Apr–2 May 2025, EGU25-1813, https://doi.org/10.5194/egusphere-egu25-1813, 2025.

EGU25-1984 | Posters on site | CL4.3

Factors controlling Mg isotopes in meltwater and suspended sediments of Arctic rivers 

Jong-Sik Ryu, Hyoun Soo Lim, Hyeongseok Song, Ok-Sun Kim, Minjune Yang, and Nathalie Vigier

Enhanced chemical weathering in glacial regions, driven by climate change, is projected to increase the delivery of dissolved and particulate matter to the ocean, significantly disrupting biogeochemical cycles of critical elements which exert a strong influence on the global carbon cycle. This study investigates the elemental and Mg isotope geochemistry of meltwater, suspended particulate matter (SPM), and bedrock samples from Ny-Âlesund, Svalbard, in order to elucidate the link between glacial weathering processes and Mg isotope variations within this glacial environment. Magnesium isotopic compositions (δ26Mg) in meltwaters and SPMs exhibit significant variability, in which meltwater δ26Mg values are in isotopic equilibrium with corresponding SPM values, yielding two distinct isotope fractionation factors depending on the drainage lithology.

A global comparison of water δ26Mg values in Arctic rivers reveals that variability in waterδ26Mg can be attributed to two primary factors, which are a global isotopic equilibrium state that is consistent with what is observed in Svalbard, and an influence of drainage lithology (silicates versus dolomite). Globally, riverine Mg, on average, exhibits a consistent Mg isotopic signature that closely resembles that of the upper continental crust, regardless of the diverse environmental conditions encountered by these river systems. This observation strongly suggests that dynamic interactions between erosion and weathering processes rapidly drive the system towards isotopic equilibrium, which is well supported by this study. 

Overall, this study highlights that the difference in δ26Mg between waters and SPMs can be used as a novel indicator for predicting weathering disequilibrium induced by global warming and other factors influencing the Earth's surface evolution.

How to cite: Ryu, J.-S., Lim, H. S., Song, H., Kim, O.-S., Yang, M., and Vigier, N.: Factors controlling Mg isotopes in meltwater and suspended sediments of Arctic rivers, EGU General Assembly 2025, Vienna, Austria, 27 Apr–2 May 2025, EGU25-1984, https://doi.org/10.5194/egusphere-egu25-1984, 2025.

EGU25-3043 | ECS | Posters on site | CL4.3

Tracing sediment sources in the western Philippine Sea since 143 ka with Sr and Nd isotopes 

Wei-Chieh Wang and Yi-Wei Liu

Tracing the sources and transport pathways of marine sediments provides criticle insights into regional atmospheric and oceanic circulation patterns. Strontium (Sr) and neodymium (Nd) isotopes proxies, when applied to thick and well-dated marine sediment cores, offer a powerful tool for evaluating regional climate dynamics over glacial-interglacial cycles. In this study, we present 13 paired Sr and Nd isotope records for each of two size fractions of lithogenic sediments spanning the past 143 ka, collected from the Benham Rise in the western Philippine Sea. Our goal is to assess the contributions of Asian dust and Southeast Asian volcanogenic sediments under varying global climate conditions. Preliminary results indicate distinct isotopic signatures between size fractions. Volcanogenic Sr isotopic ratios (⁸⁷Sr/⁸⁶Sr = 0.705 to 0.707) were found in sediment grain size >20 μm, while more radiogenic strontium isotope signatures (⁸⁷Sr/⁸⁶Sr = 0.709 to 0.711) were found in sediments in the 2–20 μm fraction. The differences in Sr isotopic signatures between size fractions may partly result from the size effect. Coupled with εNd values, although with some fluctuations, we found shifts in sediment sources over the past 134 ka, indicating decreased contributions of Asian dust source towards the Las Interglacial Highstand. These findings contribute to a deeper understanding of sedimentary processes and environmental shifts in the western Pacific region, offering new perspectives on regional climate.


Keywords: Strontium and neodymium isotopes; Marine sediments; source and transport pathways, Last glacial-interglacial cycle

How to cite: Wang, W.-C. and Liu, Y.-W.: Tracing sediment sources in the western Philippine Sea since 143 ka with Sr and Nd isotopes, EGU General Assembly 2025, Vienna, Austria, 27 Apr–2 May 2025, EGU25-3043, https://doi.org/10.5194/egusphere-egu25-3043, 2025.

EGU25-3149 | Posters on site | CL4.3

Dynamics change in carbon cycle in contemporary environment in urban area in Gliwice, Poland 

Barbara Sensuła, Alicja Ustrzycka, and Adam Michczyński

The primary aim of our study is to monitor carbon dioxide concentrations and carry out advanced analyses of the carbon cycle through mass spectrometry-based research in the biosphere within an urban environment in the southern region of Poland. Sampling sites within urban agglomerations are crucial for examining both the similarities and differences between urban areas, including the levels of CO2 and their sources. Preliminary findings (Sensuła et al., 2023) suggest that continuous monitoring is essential, and incorporating additional research on carbon isotopes in the air may significantly contribute to understanding the carbon cycle in the studied areas.

In 2022, a new laboratory setup was established in Gliwice (Silesia, Poland) to monitor CO2 levels, enabling precise measurement of CO2 concentrations in the atmosphere. This system allows for high-time-resolution measurements of the CO2 molar fraction, as well as the collection and analysis of air samples. Furthermore, the extraction of CO2 from these samples, followed by 14C analysis via the MICADAS system, provides valuable data on the isotopic composition of both atmospheric and biospheric samples.

This study presents initial results in the form of a database documenting the molar fraction of CO2 and 14CO2 in atmospheric air samples from the urban area of Gliwice, Poland, covering the period from August 2023 to April 2025. CO2 concentrations have been measured using a low-cost system (CARBOCAP GMP-343), while 14C concentrations were determined through the MICADAS technique. Our observations in 2024 indicate that the 14C values in the air samples ranged from -55‰ to -24‰, while the monthly CO2 molar fraction varied between 428 and 469 ppm, depending on seasonal changes.

Additionally, since 2019 till 2024 we have investigated pine needles as potential archives of radiocarbon in contemporary environments. This examination focused on the radiocarbon concentration variations in pine needles of different ages, with thirty needle samples collected seasonally in Gliwice. The 14C concentrations in these samples were determined using a liquid scintillation counter, revealing a mean 14C fraction of 99.83 (69) pMC.

In January 2025, we began calibrating a new system based on the CRDS (cavity ring-down spectrometer) technique to analyze the stable isotopic composition of atmospheric gases (CO2 and CH4).

This work was supported by the following contracts and grants: the Initiative of Excellence – Research University programme implemented at the Silesian University of Technology, in the years 2022-2024 as part of a grant for cutting-edge research grant no.: 14/020 / SDU / 10-21- 03; project title: Analysis of CO2 changes in the atmospheric air: construction of a new module to monitor CO2 concentration in the air; EU funds FSD - 10.25 Development of higher education focused on the needs of the green economy European Funds for Silesia 2021-2027 : The modern methods of
the monitoring of the level and isotopic composition of atmospheric CO2 (project no.FESL.10.25-IZ.01-06C9/23-00) implemented at the Silesian University of Technology (2024-2026).

How to cite: Sensuła, B., Ustrzycka, A., and Michczyński, A.: Dynamics change in carbon cycle in contemporary environment in urban area in Gliwice, Poland, EGU General Assembly 2025, Vienna, Austria, 27 Apr–2 May 2025, EGU25-3149, https://doi.org/10.5194/egusphere-egu25-3149, 2025.

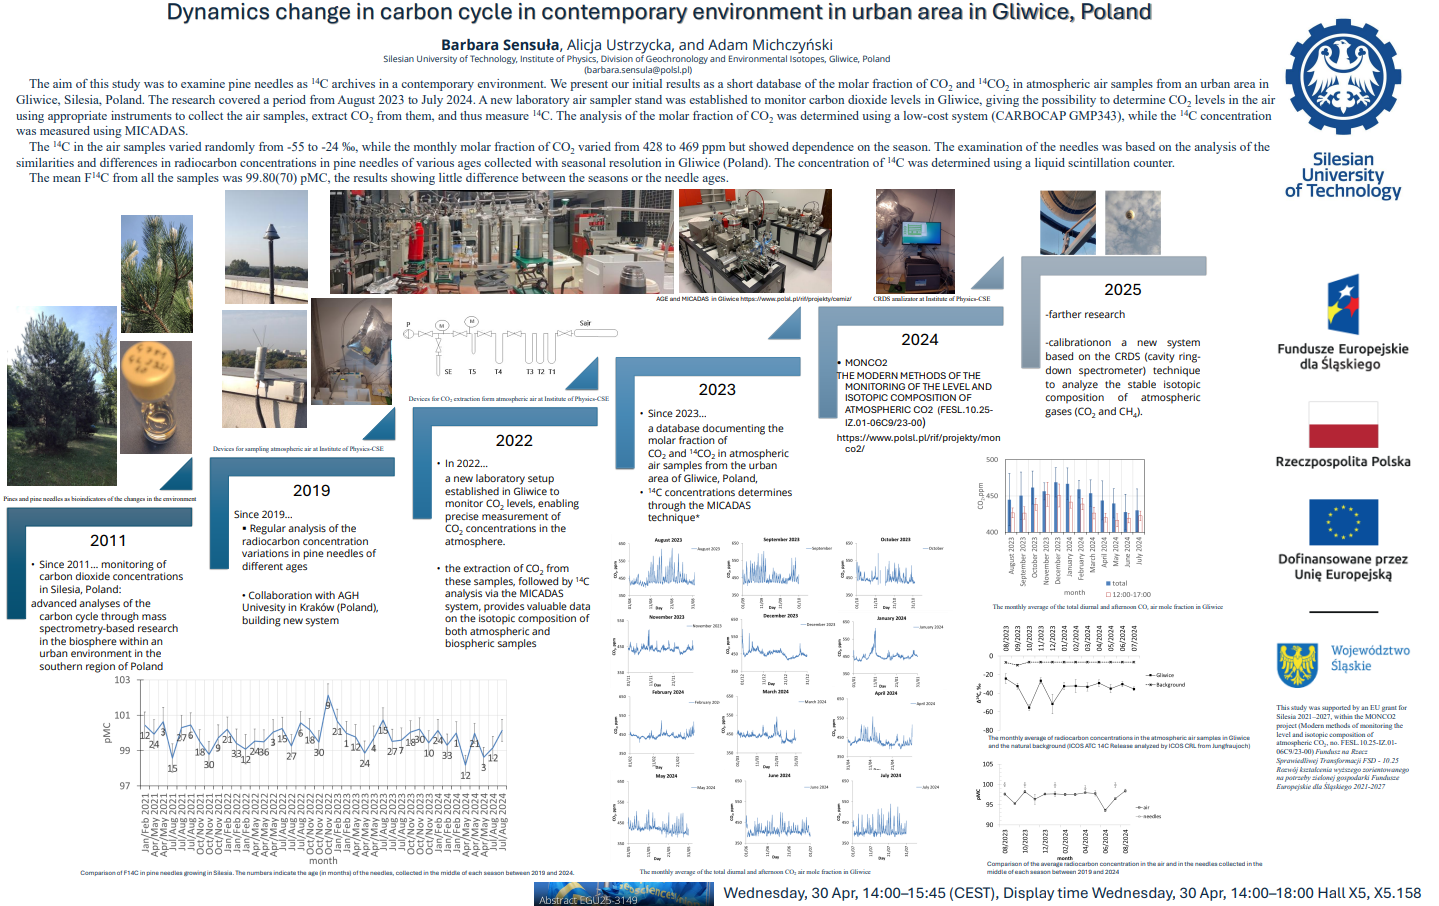
EGU25-3260 | Posters on site | CL4.3

Chironomid-based Holocene summer temperature dynamics from southern Spain  

Gonzalo Jiménez-Moreno, Narcís Prats, Oliver Heiri, Antonio García-Alix, R. Scott Anderson, Francisco J. Jiménez-Espejo, and Carmen Pérez-Martínez

This study presents a reconstruction of Holocene mean July air temperatures based on chironomid assemblages preserved in the sedimentary record of Laguna de la Mosca (LdlMo), an alpine lake in the Sierra Nevada of southern Spain. The LdlMo record reveals that the highest temperatures occurred during the Early and early-Middle Holocene, between 8500 and 7000 cal yr BP, followed by a significant cooling event. During the Middle Holocene, temperatures stabilized, but a second major cooling event occurred at approximately 4200 cal yr BP, possibly associated with the 4.2 kyr event. Throughout the Late Holocene, temperatures generally remained low, punctuated by warming episodes between 2300–1600 cal yr BP during the Iberian Roman Humid Period (IRHP) and around 1000 cal yr BP during the Medieval Climate Anomaly (MCA). The lowest temperatures were recorded at the end of the Little Ice Age (LIA), circa 1800 CE. Since ~1955 CE, a rapid and pronounced warming trend of 2.5°C has been observed, driven by anthropogenic climate change. This study shows the amplification of recent warming at high elevations, highlighting the vulnerability of these fragile and unique alpine environments to the impact of climate change.

This work was funded by grants BIOD22_001 and BIOD22_002, funded by Consejería de Universidad, Investigación e Innovación and Gobierno de España and Unión Europea – NextGenerationEU and PID2021-125619OB-C21 funded by the Ministerio de Ciencia e Innovacion of Spain, the Agencia Estatal de Investigacion and the Fondo Europeo de Desarrollo Regional FEDER MCIN/AEI/10.13039/501100011033/FEDER, UE

How to cite: Jiménez-Moreno, G., Prats, N., Heiri, O., García-Alix, A., Anderson, R. S., Jiménez-Espejo, F. J., and Pérez-Martínez, C.: Chironomid-based Holocene summer temperature dynamics from southern Spain , EGU General Assembly 2025, Vienna, Austria, 27 Apr–2 May 2025, EGU25-3260, https://doi.org/10.5194/egusphere-egu25-3260, 2025.

EGU25-4264 | ECS | Posters on site | CL4.3

Does the Largest Recorded Negative Carbon Isotope Excursion from the Neoproterozoic Krol Formation (India) Represent a Globally Synchronous Diagenetic Event? 

Debashish Pradhan, Melinda Kumar Bera, Ankita Nandi, and Ravikant Vadlamani

The "Shuram Excursion (SE)" stands as the largest known negative carbon isotope excursion (CIE) in geological history and is thought to represent the largest carbon cycle perturbation, possibly pivotal in the evolution of complex life forms and, thereafter, the Cambrian biotic explosion. Apart from the Shuram Formation at its type locality in Oman (the maximum depleted stable carbon isotopic ratio [δ13C value] in carbonate [peak δ13CCarbonate] of ~ –12 ‰), comparable negative CIE of similar ages has also been documented from different parts of the globe, among which the well constrained globally recognized SE sections are the Wonoka Formation of Australia (peak δ13CCarbonate of ~ −10 ‰), the Doushantuo Formation of South China (peak δ13CCarbonate of ~ −14 ‰), and the Rainstorm Member in the Johnnie Formation of Death Valley, California (peak δ13CCarbonate of ~ −11‰). Considering the inherent problem with the exact depositional age estimation for sedimentary rocks, although all the global locations show similar CIE patterns, the peak δ13CCarbonate values, and stratigraphic thicknesses vary from section to section. Because of these disparities, two distinct perspectives exist regarding the origin of the SE. While one group argues that a globally synchronous diagenetic event is responsible for the SE CIE, the other suggests it is a record of the temporal variation in the primary δ13C composition of the seawater dissolved inorganic carbon (DIC) and, hence, represents the actual carbon cycle perturbation. Based on the preliminary data obtained by other studies from the late Neoproterozoic Lesser Himalayan Krol Formation, previous workers tentatively suggested that the succession may contain the SE. However, because of the composite nature of the studied sections and the large spread in carbonate δ13C values in lithologically correlative stratigraphic (temporal) intervals, the proposition was not confirmed. So, the current study tries to recognize the possible SE CIE in the Lesser Himalayan Krol Formation, India, by studying continuously measured structurally undisturbed sections by employing vigorous fieldwork, detailed high-resolution carbonate δ13C data, and Pb-Pb dating of the carbonates after careful thin section and cathodoluminescence (CL) based screening for any possible diagenetic alterations. The transmitted light and CL-based petrographic observation, along with bulk and fabric-specific (micro-sampling) carbonate δ13C data, suggests the presence of distinct negative CIE with a peak δ13CCarbonate value of ~ –10.7 ‰ (CIE magnitude of ~10.7 ‰) in the Lesser Himalayan Krol Formation. The depositional age of ~560 ± 12 Ma, estimated by Pb-Pb dating of the carbonate across this CIE, further suggests the possible presence of SE CIE in the investigated section.

How to cite: Pradhan, D., Bera, M. K., Nandi, A., and Vadlamani, R.: Does the Largest Recorded Negative Carbon Isotope Excursion from the Neoproterozoic Krol Formation (India) Represent a Globally Synchronous Diagenetic Event?, EGU General Assembly 2025, Vienna, Austria, 27 Apr–2 May 2025, EGU25-4264, https://doi.org/10.5194/egusphere-egu25-4264, 2025.

EGU25-4937 | ECS | Orals | CL4.3

41Ca dating of marine deposits from Middle and Late Pleistocene 

Wei-Wei Sun, Michael Bender, En-Qing Huang, Huang Huang, Wei Jiang, Zheng-Tian Lu, Jun Tian, Tian Xia, Yu-Zhen Yan, Gun-Min Yang, and Hui-Min Zhu

41Ca (half-life = 99 ka) is a cosmogenic radionuclide that has long been proposed as a promising dating tracer for geological and archaeological samples from Middle and Late Pleistocene [1]. Calcium is abundant and has a residence time of 800 ka in the oceans, much longer than the half-life of 41Ca. This has led to the expectation of a uniform distribution of 41Ca/Ca ratios in oceans around the globe. Ocean deposits acquire the global seawater value of 41Ca/Ca upon the initial formation. Since ocean deposits are shielded from cosmic rays by overlying seawater, no cosmogenic 41Ca is produced as deposits grow older. These conditions are ideal for 41Ca dating of marine deposits.

However, the 41Ca/Ca ratio is typically less than 1015 in the environment, posing significant challenges for their measurements. Recent advances in Atom Trap Trace Analysis (ATTA) [2] have enabled the detection of 41Ca in geological samples [3]. The lowest 41Ca/Ca ratio measured so far is 3 × 10⁻¹⁸, found in a foraminifer sample from the Pacific Ocean.

We measured the 41Ca/Ca ratios in seawater samples from various depths in oceans around the world and mapped the spatial distribution of 41Ca. This work identifies the critical initial 41Ca/Ca value for 41Ca dating of marine deposits. Building on these findings, we performed 41Ca dating on foraminifera and coral samples from the Pacific, South China Sea, and Southern Ocean, and compared the results with those obtained from other dating methods. Meanwhile, we are exploring the feasibility of applying 41Ca dating to other geological and archaeological samples.


References:

[1] Raisbeck, G., Yiou, F. Possible use of 41Ca for radioactive dating. Nature 277, 42–44 (1979).

[2] A Primer on Atom Trap Trace Analysis (ATTA). http://atta.ustc.edu.cn/en-us/events/attaprimer.html

[3] Xia, TY., Sun, WW., Ebser, S. et al. Atom-trap trace analysis of 41Ca/Ca down to the 10–17 level. Nat. Phys. 19, 904–908 (2023)

How to cite: Sun, W.-W., Bender, M., Huang, E.-Q., Huang, H., Jiang, W., Lu, Z.-T., Tian, J., Xia, T., Yan, Y.-Z., Yang, G.-M., and Zhu, H.-M.: 41Ca dating of marine deposits from Middle and Late Pleistocene, EGU General Assembly 2025, Vienna, Austria, 27 Apr–2 May 2025, EGU25-4937, https://doi.org/10.5194/egusphere-egu25-4937, 2025.

EGU25-5402 | Orals | CL4.3

Basin-scale environmental changes in the Okhotsk Sea over the last 30,000 years 

Jianjun Zou, Qingchao Wang, and Xuefa Shi

The Sea of Okhotsk, situated at the northern boundary of the East Asian summer monsoon's domain, represents the southernmost region in the Northern Hemisphere where perennial sea ice develops year-round. It serves as a critical source of ventilation for modern North Pacific Intermediate Water and is highly sensitive to global climate change, making it an ideal natural laboratory for studying environmental changes. Despite its importance, our understanding of the basin-scale environmental evolution of the Sea of Okhotsk remains limited. This study addresses these gaps by compiling paleoenvironmental records from several sediment cores in the Sea of Okhotsk. We recalibrated the age models of these cores to reconstruct the histories of sea surface temperature (SST), sea ice activity, surface productivity, and intermediate water ventilation since 30 ka. Based on the reconstruction, we propose the conceptual modes of environmental evolution: the "glacial type," dominated by sea ice, and the "interglacial type," controlled by both sea ice and ocean currents. During the Last Glacial period (30 - 18 ka), the Sea of Okhotsk experienced low SSTs, extensive sea ice coverage, weak intermediate water ventilation, and reduced surface productivity. In contrast, the Late Holocene (< 6 ka) was characterized by higher SSTs, diminished sea ice, robust intermediate water ventilation, and increased surface productivity, with siliceous ooze being the dominant sediment component. Notably, during the Bølling-Allerød (14.7 - 13 ka) and Preboreal (11 - 9.7 ka) warm periods, the marine environment resembled the "interglacial type" but featured anoxic intermediate waters. During Heinrich Stadial 1 (18 - 14.7 ka) and the Younger Dryas (13 - 11.7 ka), environmental regimes were generally similar to the "glacial type" but with enhanced intermediate water ventilation. Since 30 ka, the evolution of environmental factors in the Sea of Okhotsk has been shaped by external forcings, internal feedbacks, and climate processes at both high and low latitudes, underscoring the complex interplay of factors influencing this dynamic region.

How to cite: Zou, J., Wang, Q., and Shi, X.: Basin-scale environmental changes in the Okhotsk Sea over the last 30,000 years, EGU General Assembly 2025, Vienna, Austria, 27 Apr–2 May 2025, EGU25-5402, https://doi.org/10.5194/egusphere-egu25-5402, 2025.

EGU25-5723 | Orals | CL4.3

Visualizing and quantifying biomineral preservation in fossils 

Živilė Žigaitė-Moro, Matthew Cowen, Marc de Rafélis, Loïc Ségalen, Benjamin Kear, and Maïtena Dumont

Palaeoclimatic reconstructions rely heavily on accurate interpretation of isotopic signal, retrieved primarily from fossil biominerals. Evaluating whether these geochemical proxies reflect original environment is often a challenge. In our recent study we have attempted to illustrate fossil vertebrate dental tissue geochemistry and, by inference, its extent of diagenetic alteration, using quantitative, semi-quantitative and optical tools to evaluate bioapatite preservation. Here we present visual comparisons of elemental compositions in fish and plesiosaur dental remains ranging in age from Silurian to Cretaceous, based on a combination of micro-scale optical cathodoluminescence (CL) observations (optical images and scanning electron microscope) with in-situ minor, trace and rare earth element (REE) compositions (EDS, maps and REE profiles), as a tool for assessing diagenetic processes and biomineral preservation during fossilization of vertebrate dental apatite. Tissue-selective REE values have been obtained using laser ablation-inductively coupled plasma-mass spectrometry (LA-ICP-MS), indicating areas of potential REE enrichment, combined with cathodoluminescence (CL) analysis. Energy dispersive X-ray spectroscopy (EDS) mapping was also used to identify major elemental components and identify areas of contamination or diagenetic replacement. We conclude that the relative abilities of different dental tissues to resist alteration and proximity to the exposure surface largely determine the REE composition and, accordingly, the inferred quality of preserved bioapatite.

How to cite: Žigaitė-Moro, Ž., Cowen, M., de Rafélis, M., Ségalen, L., Kear, B., and Dumont, M.: Visualizing and quantifying biomineral preservation in fossils, EGU General Assembly 2025, Vienna, Austria, 27 Apr–2 May 2025, EGU25-5723, https://doi.org/10.5194/egusphere-egu25-5723, 2025.

EGU25-6511 | Posters on site | CL4.3

Can shallow marine carbonate faithfully preserve the true signal of carbon cycle perturbation? 

Trupti Dadabhau Raskar, Arpita Samanta, and Melinda Kumar Bera

The carbon cycle perturbations in geological history are preserved in the form of changes in stable carbon isotope ratios (δ13C values) in different carbon-bearing sedimentary archives. The carbon cycle perturbation that occurred across the Paleocene-Eocene boundary (~56 Ma) is known as the Paleocene Eocene thermal Maximum (PETM). After more than three decades of research, the exact magnitude of the negative carbon isotope excursion (CIE) is still fuzzy. The shallow marine sedimentary archive, deposited far above the lysocline, is considered to be the best archive to quantify the carbon cycle perturbation because the deep marine (carbonate) was likely to be affected by carbonate dissolution and terrestrial sedimentary records influenced by different climatic parameters. However, different biotic and abiotic processes could influence the magnitude of the CIE during the perturbed carbon cycle-climate state in a shallow marine environment. For this reason, the present study investigated the early Paleogene marine carbonate rocks deposited in the eastern Tethyan Sea (Ladakh, NW India) to check the possible presence of the PETM CIE and test whether shallow marine carbonate is a good archive for measuring the CIE magnitude. The presence of age-diagnostic larger benthic foraminifera and detailed micro-facies analysis indicates the investigated shallow marine carbonate rocks were deposited during the ~56 to 54 Ma (Shallow Benthic Zone - 4 to 7) and are likely to hold the PETM CIE. The secular variation in the δ13C values of unaltered bulk carbonate, screened through the cathodoluminescence microscopic study, reveals a PETM CIE magnitude of -3.6 ‰.  The observed CIE magnitude is similar to the globally accepted CIE magnitude (-4 ± 0.4 ‰) for PETM and suggests that shallow marine carbonate can be used to assess the magnitude of PETM and other carbon cycle perturbations.

How to cite: Dadabhau Raskar, T., Samanta, A., and Kumar Bera, M.: Can shallow marine carbonate faithfully preserve the true signal of carbon cycle perturbation?, EGU General Assembly 2025, Vienna, Austria, 27 Apr–2 May 2025, EGU25-6511, https://doi.org/10.5194/egusphere-egu25-6511, 2025.

EGU25-8827 | Posters on site | CL4.3

Ursus spelaeus (Rosenmüller, 1794) during the MIS 3: temporal population distributions and relationship with climatic fluctuations 

Ana-Voica Bojar, Victor Barbu, Natalia Piotrowska, Hans-Peter Bojar, Andrei Smeu, Fatima Pawełczyk, and Ovidiu Guja

Ursus spelaeus, the Late Pleistocene a cave bear is known from numerous accumulations found in the fossil sector of caves situated in the Carpathian and Apuseni Mountains. In this study, we present approximate population variation in time using the temporal distribution and interval frequencies of radiocarbon ages from literature. Most of the dated skeletons were preserved in caves. The data suggest that, during the entire Marine Isotope Stage 3 (MIS 3) interval,  caves were serving as a shelter for U. spelaeus, with the oldest dated bone indicating ages over 60,000 and the youngest ones less than 30.000 years cal BP. Histogram plots of over 110 radiocarbon data from different caves of the Carpathian and Apuseni Mountains as Cioclovina Uscată, Peștera (Cave) cu Oase, Peștera Muierii, or Peștera Urșilor, respectively, show a maximum expansion of the cave bear population between 50,000 and 40,000, a decline between 40,000 and 35,000 and a partial recovery from 35,000–30,000 years cal BP. Radiocarbon data of Homo sapiens remains, younger than 35,000 years cal BP, support the fact that H. sapiens accessed the same caves where the cave bear persisted to hibernate. Besides general cool conditions and restricted food sources, the presence of H. sapiens constituted an additional stress factor driving the cave bear to extinction (Bojar et al., 2024).

References

Ana-Voica Bojar, Natalia Piotrowska, Victor Barbu, Hans-Peter Bojar, Fatima Pawełczyk, Andrei Smeu & Ovidiu Guja: Ursus spelaeus (Rosenmüller, 1794) during the MIS 3: new evidence from the Cioclovina Uscată Cave and radiocarbon age overview for the Carpathians, Isotopes in Environmental and Health Studies, DOI: 10.1080/10256016.2024.2376730

How to cite: Bojar, A.-V., Barbu, V., Piotrowska, N., Bojar, H.-P., Smeu, A., Pawełczyk, F., and Guja, O.: Ursus spelaeus (Rosenmüller, 1794) during the MIS 3: temporal population distributions and relationship with climatic fluctuations, EGU General Assembly 2025, Vienna, Austria, 27 Apr–2 May 2025, EGU25-8827, https://doi.org/10.5194/egusphere-egu25-8827, 2025.

EGU25-9061 | Orals | CL4.3

Ancient speleothem giant preserved in a high-Alpine cave (Dolomites, N Italy): rare insights into the Neogene 

Christoph Spötl, Gabriella Koltai, Robert Scholger, Jian Wang, Maria Knipping, and Hai Cheng

Conturines cave opens at 2775 m a.s.l. in the Dolomites (Northern Italy), hundreds of meters above the modern tree line. The cave is about 200 m long and comprises a single ascending paleophreatic conduit. The entrance of the cave is located at the base of the headwall of a former glacial cirque, testifying its pre-Pleistocene origin. Large parts of the cave floor are covered by an extensive (up to 3.5 m thick) flowstone and large stalagmite formations are present in the inner part of the passage, where the flowstone starts. All these large formations are inactive, partly corroded and dissected by fractures. The catchment area is a sharp ridge devoid of vegetation and soil, and the dripping water in the cave is undersaturated with respect to calcite, leading to the slow demise of these large speleothems.


Several drill cores covering the entire stratigraphy of the flowstone were obtained along the course of the gallery, the longest reaching bedrock at 3.5 m depth. Multi-proxy analyses of the two longest cores drilled approximately 5 m apart in the proximal part of the flowstone replicate well. Multiple magnetic reversals are preserved in the flowstone stratigraphy. According to preliminary U-Pb dating, speleothem deposition began ca. 5.5 - 5.0 Ma ago, likely coincident with the end of the Messinian Salinity Crisis in the Mediterranean, and continued intermittently until around 3 Ma. This uplifted ancient speleothem record provides a rare window into the Neogene at high resolution.

How to cite: Spötl, C., Koltai, G., Scholger, R., Wang, J., Knipping, M., and Cheng, H.: Ancient speleothem giant preserved in a high-Alpine cave (Dolomites, N Italy): rare insights into the Neogene, EGU General Assembly 2025, Vienna, Austria, 27 Apr–2 May 2025, EGU25-9061, https://doi.org/10.5194/egusphere-egu25-9061, 2025.

EGU25-10131 | Orals | CL4.3

Comparative analysis of gypsum from four different deposits of Badenian age in Romania 

Delia-Georgeta Dumitras, Octavian G. Duliu, Peter Istvan Luffi, Stefan Marincea, Doina Smaranda Sirbu Radasanu, Aurora Maruta Iancu, and Diana Persa

LA-ICP-MS, and XRD were used to investigate representative samples of gypsum collected from four deposits, all of them of Badenian age: Cheia (Transilvanian Basin, Cluj county), Ivancauti (Moldavian Platform, Botosani county), Negresti (Moldavide, Neamt county) and Moinesti (Moldavide, Bacau county) deposits were selected. The main objective of this study consisted of a geochemical, crystallo-chemical and economical potential detailed characterization of these deposits.

Accordingly, the LA-ICP-MS permitted determining the mass fractions of 21 elements including 10 REE (La, Ce, Nd, Sm, Eu, Gd, Er, Yb and Lu), as well as of Mg, P, Ti, Fe, Ni, Sr, Y, Ba, Pb, Th and U. Their content was interpreted considering their presence in the upper continental crust (UCC), sea water and chondrites.

Concerning the investigated elements, excepting for the REE ones, the LA-ICP-MS determinations evidenced in the case of Sr and U contents comparable with the UCC ones. It worth mentioning the presence of Sr of which mass fractions of 930 ± 47 and 545 ± 100 mg/kg in the Ivancauti and Cheia samples exceeded the UCC one of 330 mg/kg by a factor up to three, in good agreement with reported data concerning the lagunar Mediterranean gypsum.

At its turn, the U showed mass fractions varying between 1.76 ± 0.94 mg/kg in the case of Moinesti deposit and 2.93 ± 0.8 mg/kg for the Cheia samples, having the same order of magnitude as the UCC one of 2.7 mg/kg. On contrary, the maximum value of Th mass fraction of 68 ± 31 mg/kg was 155 times smaller than the value reported for UCC one. By comparing the ratio of the mass fractions of Th and U in investigated samples with the same ration of the sea water, the gypsum samples ratio of 0.02 significantly overpasses the sea water ratio of 0.0015, suggesting rather a terrigenous origin.

The great variability of the mass fractions of the investigated 11 elements makes possible the discriminant analysis of their distribution by considered elements as variable and deposits as cases. Indeed, a Root 2 vs. Root 2 bi-plot evidenced the presence of four clusters, the Negresti and Moinesti ones relatively closer and differing by the Ivancauti and Cheia ones with respect of Root 1, while Root 2 discriminates only the Cheia one with respect with the other three, i.e. Ivancauti, Negresti and Moinesti.

Likely, the investigated REE distribution showed for all of them mass fractions lower with one order of magnitude and more than the corresponding UCC values, e.g., varying from 5.59 ± 2.82 mg/kg for Yb in Ivancauti samples to 0.21 ± 0.04 mg/kg in the case of Lu in Moinesti gypsum. A peculiarity which we observed for all samples consisted of positive Ce and Eu anomalies. If the Ce anomaly could be associated to an oxidative depositional medium, the positive Eu anomaly could be associated to an increased content of Sr, but these facts need more investigations to be elucidated, especially as this anomaly was evidenced for all investigated samples, regardless the deposit.

How to cite: Dumitras, D.-G., Duliu, O. G., Luffi, P. I., Marincea, S., Sirbu Radasanu, D. S., Iancu, A. M., and Persa, D.: Comparative analysis of gypsum from four different deposits of Badenian age in Romania, EGU General Assembly 2025, Vienna, Austria, 27 Apr–2 May 2025, EGU25-10131, https://doi.org/10.5194/egusphere-egu25-10131, 2025.

EGU25-11318 | ECS | Orals | CL4.3

Late Holocene Climate Contrasts in NW Iberian Lakes 

Uxía Fernández-Pérez, Roberto Bao, Enno Schefuß, Teresa Rodrigues, Alberto Sáez, Pedro Raposeiro, Ricardo Prego, Rafael Carballeira, and Armand Hernández

This study explores Late Holocene climate variability and environmental transitions in the NW Iberian Peninsula by analyzing organic biomarkers (n-alkanes) and their isotopic signatures (δ¹³C and δD) from two contrasting lake systems: Lake Ocelo, a mountain lake (1517 m a.s.l.) located at a crucial point between the Atlantic and Mediterranean bioclimatic regions, and Lake Doniños, a coastal back-barrier perched lake (2.5 m a.s.l.) within the sub-Atlantic climatic domain. Lakes at varying altitudes provide complementary paleoenvironmental records that capture diverse ecosystem responses to past climate changes across vertical gradients.

In both Lake Ocelo and Lake Doniños, δD values reflect hydrological variability. In Ocelo, long-chain n-alkanes indicate terrestrial vegetation as the main source of organic matter. δD values (~-190‰ to ~-160‰) reflect wetter and cooler conditions during the Older Subatlantic (OSA; ca. 800-200 BCE), the Dark Ages (DA; ca. 300-750 CE) and Little Ice Age (LIA; ca. 1300-1900 CE), contrasted with warmer and drier conditions during the Roman Warm Period (RWP; ca. 200 BCE-300 CE), Medieval Climate Anomaly (MCA; ca. 750-1100 CE) and the Industrial Era (IE; ca. 1850 CE-present). Similary, in Doniños, δD values during the MCA became more positive, suggesting drier conditions. The MCA-LIA transition (ca. 1100–1300 CE) in Ocelo shows a shifts to wetter and cooler conditions, with δD and δ¹³C values declining. In Doniños, between 1200 CE and 1585 CE, δD became more positive, suggesting episodic drying and marine influence, likely linked to increased storminess. Also, δ¹³C rose sharply between 1400 CE and 1550 CE, during the LIA, possibly indicating increased nutrient input associated with climatic fluctuations or marine incursions. After a hiatus spanning 1585-1700 CE, δD stabilized at its most positive levels, marking reduced hydrological variability and arid conditions. Post-1850 CE, δD and δ¹³C trended toward more negative levels, reflecting increased meteoric water input due to wetter climate conditions or anthropogenic watershed. Additionally, the lowering of δ¹³C values during the IE may also reflect the Suess effect from fossil fuel combustion.

In Ocelo, δ¹³C data align with δD trends, reflecting shifts in vegetation composition and water stress, with relative enrichment in δ¹³C during the RWP and MCA suggesting warmer and drier conditions, while more negative δ¹³C during the LIA and DA reflects cooler and wetter conditions.

These findings emphasize the utility of biomarkers in reconstructing regional climate variability and the contrasting responses of mountain and coastal lakes to Late Holocene transitions. Despite their geographical proximity (185 km), both lakes reflect different climatic influences: Lake Ocelo records broader fluctuations linked to its bioclimatic position, while Lake Doniños is influenced by local processes, including marine intrusions and anthropogenic impacts. Similarities include drier conditions during the RWP and MCA in both lakes, while differences emerge during the LIA, where marine influence and storminess played a larger role in Lake Doniños. 

This work is supported by Grants PID2019-107424RB-I00 and PID2022-139775OB funded by MCIN/AEI/10.13039/501100011033, with the latter also co-funded by “ERDF A way of making Europe”. Xunta de Galicia also supports this work through projects ED431F 2022/18 and ED431B 2024/03.

How to cite: Fernández-Pérez, U., Bao, R., Schefuß, E., Rodrigues, T., Sáez, A., Raposeiro, P., Prego, R., Carballeira, R., and Hernández, A.: Late Holocene Climate Contrasts in NW Iberian Lakes, EGU General Assembly 2025, Vienna, Austria, 27 Apr–2 May 2025, EGU25-11318, https://doi.org/10.5194/egusphere-egu25-11318, 2025.

EGU25-11350 | Posters on site | CL4.3

High precision stable isotope analysis of carbonate and water samples for paleoclimate applications using the Elementar iso DUAL INLET 

Mike Seed, Calum Preece, Kathrin Rosenthal, and Sam Barker

Paleoclimate research is important for understanding past, current and future climate, providing the data needed to model and predict current and future climate change scenarios. Stable isotope analysis provides an essential tool for gathering past climate information from natural archives such as waters including ice-cores, ground waters, and biological waters; and carbonate materials such as foraminifera and other fossilized carbonates. Due to the often limited and small sample sizes available for stable isotope analysis it is vital that highly precise and accurate analysis can be carried out on the smallest of sample sizes.

Dual inlet technology remains the most precise, accurate and sensitive technique for pure gas, carbonate and water analysis. The Elementar iso DUAL INLET is a valuable tool for paleoclimate applications, enabling the analysis of pure gas samples within an incredibly compact footprint via our powerful lyticOS software suite. The 14-ultra low dead volume valves with bodies machined from a single block of high purity stainless steel and dedicated turbomolecular pump for the changeover valve guarantees zero residual memory effects between reference and sample gas.

The iso DUAL INLET can be optionally enhanced for the automated analysis of carbonate and water samples. With the iso AQUA PREP enhancement, up to 180 water samples can be analysed achieving δ18O precision better than 0.05‰ (1σ, n=10) and δD precision better than 1‰ (1σ, n=10), for any environmental water sample. The iso CARB PREP enhancement enables automated analysis of up to 180 micro-fossil samples for 13C and 18O down to 20μg sample size. For the highest productivity, both carbonate and water analysis can be performed with the iso MULTI PREP enhancement with switching between modes needing simply a change of needle. The IRMS collector configuration can also be upgraded for “clumped isotope analysis” of carbonate materials.

We will highlight the performance of the iso DUAL INLET with carbonate and water functionality across a range of sample types for paleoclimate applications, supporting researchers building a detailed understanding of the past to better inform policy makers for the future.

How to cite: Seed, M., Preece, C., Rosenthal, K., and Barker, S.: High precision stable isotope analysis of carbonate and water samples for paleoclimate applications using the Elementar iso DUAL INLET, EGU General Assembly 2025, Vienna, Austria, 27 Apr–2 May 2025, EGU25-11350, https://doi.org/10.5194/egusphere-egu25-11350, 2025.

EGU25-11461 | Orals | CL4.3

Heightened instability in lake circulation triggered by mid-Holocene warmth; insights from the varved sediments of Lake Nautajärvi, southern Finland  

Paul Lincoln, Rik Tjallingii, Emilia Kosonen, Antti Ojala, Ashley Abrook, and Celia Martin-Puertas

Future climate projections are expected to have a substantial impact on boreal lake circulation regimes, with warmer climates and higher organic loads leading to intensified thermo-stratification and brownification. Understanding lake sensitivity to warmer climates is therefore critical for mitigating potential ecological and societal impacts. The Holocene Thermal Maximum (HTM; ca 7-5 ka BP) provides a valuable analogue to investigate lake responses to warmer climates devoid of major anthropogenic influences.

In this presentation we present high-resolution micro-X-ray core scanning profiles (μ-XRF) of the annually laminated (varved) sediments from Lake Nautajärvi (NAU-23) in southern Finland to elucidate changes in lake circulation and sedimentation patterns. Principal component analysis (PCA) identifies two key components in the μ-XRF data associated with the nature of the sediments, i.e. detrital vs organic sedimentation (PC1), and hypolimnetic oxidation (PC2). Using these results, we will show that during the HTM, the lake became more sensitive to changes in oxygenation and mixing intensity. These changes were triggered by a warmer climate, which increased organic matter and redox sensitive metal solute concentrations in the water column, strengthening lake stratification and weakening dimictic circulation patterns. Superimposed on HTM weakened circulation are distinct phases of increased oxidation and iron-rich varve formation that do not happen when the background conditions are cooler (i.e. the early and late Holocene). This is driven by temporary strengthening of the mixing regime in response to climatic variability and storminess cycles across southern Scandinavia. These findings demonstrate that whilst warmer conditions weaken boreal lake circulation regimes, they can also make them increasingly vulnerable to short term oscillations in prevalent climatic conditions and weather patterns, which could have significant impacts on lake water quality and aquatic ecosystems. These findings underscore the non-stationary nature of lake sensitivity to short-term climatic variability and emphasize the potential for similar shifts to occur under future warming scenarios.

How to cite: Lincoln, P., Tjallingii, R., Kosonen, E., Ojala, A., Abrook, A., and Martin-Puertas, C.: Heightened instability in lake circulation triggered by mid-Holocene warmth; insights from the varved sediments of Lake Nautajärvi, southern Finland , EGU General Assembly 2025, Vienna, Austria, 27 Apr–2 May 2025, EGU25-11461, https://doi.org/10.5194/egusphere-egu25-11461, 2025.

EGU25-11502 | ECS | Orals | CL4.3

Seasonal bias in temperature-sensitive biomarkers: a multi-proxy assessment of branched GDGT suitability for Holocene climate reconstruction 

Ashley Abrook, Peter Langdon, Gordon Inglis, Achim Brauer, Paul Lincoln, Antti Ojala, and Celia Martin-Puertas

Understanding the evolution of Holocene climate is key for predicting what different futures may look like. However, global proxy and model-based climate reconstructions disagree on the general evolution of climate over the past 11.7 thousand years. Proxy-based reconstructions demonstrate a Holocene Climatic Optimum in the mid-Holocene, whilst model-based approaches show a trend of increasing temperatures throughout. This disagreement is largely believed to relate to seasonal biases within the proxy-based reconstructions, although model based-reconstructions are not without their flaws. Here we use a series of annually laminated (varved) lake sediment records from Europe (Diss Mere, United Kingdom; Meerfelder Maar, Germany; Lake Nautajärvi, Finland) to explore whether organic proxies are seasonally biased. To achieve this, we generate high-resolution (multi-decadal) branched glycerol dialkyl glycerol tetraether (brGDGT) lipid reconstructions of mean temperature of months above freezing (MAF; approximating MAAT in temperate locations) across the Holocene including the last 200-years and the mid-Holocene. We contrast our biomarker data with chironomid-inferred July summer temperature estimates from the same sample horizons within each lake to ascertain whether summer signals have an important imprint on the GDGT data. We show that brGDGTs are likely produced in situ within lake waters and that the varved nature of each lake does not impede brGDGT based climate reconstruction. We show that 1) GDGT-based temperatures record dominant climate variability at each site; 2) the mid-Holocene is warmer than present and pre-industrial mean annual temperatures; 3) biomarker and chironomid reconstructions from Diss Mere and Meerfelder Maar are more closely aligned than Nautajärvi suggesting location specific complexities; and 4) that biomarker and chironomid temperatures converge and diverge at various points in each record. Each of these results suggest seasonal biases exist within the GDGT-based climate reconstructions which may be non-stationary. Our data therefore reveals the need to generate multiple proxy-proxy assessments of climate from different archives to ascertain the influence of mean annual versus summer climate parameters. 

How to cite: Abrook, A., Langdon, P., Inglis, G., Brauer, A., Lincoln, P., Ojala, A., and Martin-Puertas, C.: Seasonal bias in temperature-sensitive biomarkers: a multi-proxy assessment of branched GDGT suitability for Holocene climate reconstruction, EGU General Assembly 2025, Vienna, Austria, 27 Apr–2 May 2025, EGU25-11502, https://doi.org/10.5194/egusphere-egu25-11502, 2025.

EGU25-11588 | ECS | Orals | CL4.3

Potentials and limitations of using cosmogenic Beryllium isotopes for the synchronization of marine sediment and ice cores 

Julia Loftfield, Norbert Nowaczyk, Lester Lembke-Jene, Thomas Frederichs, Johannes Lachner, Frank Lamy, Georg Rugel, Konstanze Stübner, and Florian Adolphi

Variations in the atmospheric production rate of cosmogenic 10Be lead to global changes in 10Be depositional fluxes. This may serve as a powerful tool for synchronizing various paleoclimate archives. For a robust synchronization, however, it is essential to understand the pathways of 10Be from its production in the upper atmosphere to its deposition in sediments and ice. While 10Be is deposited in ice within one to two years after production, its deposition in marine sediments is less direct, complicating its use for synchronization. To address this issue, we investigate the response of the authigenic 10Be/9Be ratio in marine sediments to a rapid increase in atmospheric 10Be production. We analyzed the 10Be/9Be ratios of three sediment cores from the Southern Ocean, all under the depositional regime of the Antarctic Circumpolar Current (ACC). We compared these records that encompass the period of the geomagnetic field minimum around the Laschamps excursion (~41 ka BP) to 10Be records from ice cores. All cores show an increase in the 10Be/9Be ratio during the Laschamps excursion. However, the marine records exhibit site-specific differences in amplitude and response time. We discuss the causes of these discrepancies and the roles of local residence time of Be in the water column, bioturbation of sediments, diagenetic Be fluxes, re-mobilization of sediments, and varying terrestrial Be sources. We argue that the attainable precision of a 10Be-based synchronization depends on the prior knowledge of these factors. Especially, the marine residence time of 10Be sets an upper limit on the achievable resolution from marine sediment 10Be/9Be records and leads to a temporal shift of the recorded 10Be/9Be changes relative to the increase in atmospheric 10Be-production. Additionally, terrestrial input of 10Be can lead to non-production influences on the 10Be/9Be ratio in sediments, even in pelagic settings. Nevertheless, under ideal conditions, marine sediments can capture 10Be/9Be signals that closely align with those in ice cores, highlighting the potential of 10Be/9Be ratios as a future chronostratigraphic tool for the synchronization of marine sediment records with other paleoclimate archives, e.g. ice cores.

How to cite: Loftfield, J., Nowaczyk, N., Lembke-Jene, L., Frederichs, T., Lachner, J., Lamy, F., Rugel, G., Stübner, K., and Adolphi, F.: Potentials and limitations of using cosmogenic Beryllium isotopes for the synchronization of marine sediment and ice cores, EGU General Assembly 2025, Vienna, Austria, 27 Apr–2 May 2025, EGU25-11588, https://doi.org/10.5194/egusphere-egu25-11588, 2025.

Recent retrogressive thaw slump activity in the Richardson Mountains (northwestern Canada), induced by climate warming, has exposed a stratigraphic record of landscape evolution and permafrost development since the last glaciation. Horizontal profiles of five relict ice wedges and one rejuvenation-stage (ca. modern) ice wedge were collected from the headwalls of four thaw slumps in the Willow Creek area of the Richardson Mountains to study post-glacial changes in winter climate. The ice wedges contain vertically elongated bubbles, indicating a likely snowmelt origin. δ2H and δ18O measurements, sampled every ~1.5 cm across the profiles (n = 325), fall well within the range of local winter precipitation values, thereby confirming winter precipitation as the probable source water. Detrital plant macrofossils from several pristine ice samples were AMS 14C dated (n = 16) and confirm at least 2 generations of relict wedge ice dating to the Younger Dryas (YD) and Late Holocene; this is only the second study from the Western Arctic to document YD wedge ice. YD wedge ice is ~2.2‰ more negative in δ18O compared to Late Holocene wedge ice, which could be explained by one or a combination of plausible factors: (i) winter temperatures were up to ~5°C colder on average (e.g., assuming a δ18Oprecip-T sensitivity of 0.41‰·°C-1); (ii) a greater proportion of snow fell during the coldest winter months; or (iii) the moisture source region varied in response to changing atmospheric circulation, moderated by the collapse of the last ice sheet. However, no significant difference is observed in dexcess between YD and Late Holocene wedge ice, which may suggest the precipitation seasonality and moisture source region were comparable. Conversely, the rejuvenation-stage wedge ice, which likely formed in the last few decades, is 1.7‰ more positive in δ18O than Late Holocene wedge ice, while dexcess is statistically indifferent. The strong increase in δ18O in modern wedge ice relative to Late Holocene wedge ice reflects the impact of recent Arctic warming, especially in winter, a pattern that has been previously observed in other ice wedge records from the Canadian and Siberian Arctic. In summary, this study provided insights on winter climate variability in the northwestern Canadian Arctic, with a focus on the YD, Late Holocene and recent times, and demonstrates the potential to use ice wedges to further our knowledge of cold-season climate dynamics in the circum-Arctic more broadly.

How to cite: Porter, T., Changulani, A., Opel, T., and Meyer, H.: Younger Dryas and Holocene winter conditions in the Richardson Mountains, Canadian Arctic, reconstructed from precipitation isotopes in relict ice wedges, EGU General Assembly 2025, Vienna, Austria, 27 Apr–2 May 2025, EGU25-13380, https://doi.org/10.5194/egusphere-egu25-13380, 2025.

EGU25-13426 | ECS | Orals | CL4.3

Clumped isotope constraints on formation environment of Triassic carbonates in Makhtesh Ramon 

Shlomit Cooper-Frumkin, Hagit Affek, Yael Ebert, and Uri Ryb

Despite prolonged research, the formation environments of dolomite remain debated. Previous studies have associated the apparent decrease in dolomite abundance during the Cenozoic with a global transition in marine carbonate depositional environments leading from warm, saline, shallow platforms in which dolomite formation was possibly mediated by microbial activity, to deeper and cooler environments in which dolomite formation was largely inhibited. Others suggested that large volumes of pre-Cenozoic dolomites reflect dolomitization at elevated burial temperatures of these rocks, whereas most Cenozoic carbonate platforms did not reach sufficient thermal maturity. A third, hybrid model suggests that Mg-rich dolomite precursor minerals precipitated in shallow environments and later underwent deep diagenesis to a more ordered and stoichiometric dolomite. The combination of carbonate oxygen (δ18O) and clumped (TΔ47) isotope analysis can be used to constrain and distinguish among these formation environments.

Here, we combine δ18O and TΔ47 measurements in marine carbonate rocks from the Triassic Ramon Gr. in Makhtesh Ramon, southern Israel, to constrain their formation environments. The studied section records a transition from a carbonate platform, dominated by fossil-rich limestone (top Gvanim and Saharonim Fm.), to a shallow saline evaporitic lagoon (Mohila Fm.) dominated by alterations of laminar dolomite and evaporitic gypsum, with much sparser fossils relative to top Gvanim and Saharonim Fm. Calcite samples in the Gvanim and Saharonim Fm. recorded δ18O and TΔ47 values from -8.41 to -2.17 ‰ VPDB, and from 29 to 98 °C, respectively. Two calcite samples recorded TΔ47 values of 152-231 °C, associated with isotopic solid-state reordering in response to local heating near igneous intrusions. Dolomite samples at the top Saharonim and Mohila Fms. recorded δ18O and TΔ47 values from -4.77 to -1.59 ‰ VPDB and from 36 to 74 °C, respectively. These results indicate that carbonate minerals recrystallized in burial-diagenetic environments in an open system with respect to δ18O. The observation that dolomite, associated by stratigraphic context and texture with deposition at (or near) the surface, has been recrystallized at depth, supports a multi-step dolomite formation process, in which carbonates were first enriched in Mg2+ in the lagoon and later recrystallized in high-temperature, deep-diagenetic environment. 

How to cite: Cooper-Frumkin, S., Affek, H., Ebert, Y., and Ryb, U.: Clumped isotope constraints on formation environment of Triassic carbonates in Makhtesh Ramon, EGU General Assembly 2025, Vienna, Austria, 27 Apr–2 May 2025, EGU25-13426, https://doi.org/10.5194/egusphere-egu25-13426, 2025.

Marine ferromanganese polymetallic crusts and nodules are an important mineral resource widely distributed on the seafloor. They are regarded as strategic reserve resources and have attracted much attention. During the mineralization process, the iron-manganese oxide/hydroxide colloids generated by the oxidation of Fe2+ and Mn2+ in the ambient seawater adsorb metal ions and oxidize the metal ions to a high valence state or form metal complexes to be enriched in iron-manganese minerals. They grow slowly at a rate of several mm/Myr, recording and preserving important information on paleo-ocean and paleoclimate changes. They are ideal objects and response media for studying global ocean evolution and environmental changes and are also helpful in exploring the source-sink process of marine substances. Therefore, based on the precise chronology of polymetallic crusts and nodules from the South China Sea (SCS), this study used in-situ Pb isotope analysis technology to analyze the variation characteristics of Pb isotope composition of polymetallic crusts and nodules, to reveal the growth and mineralization history and environmental evolution of crusts and nodules in the study area. 

The results show that: (1) The growth ages of SCS polymetallic crusts and nodules are about 1.16-3.46 Ma and an average growth rate of 3.19-6.07 mm/Myr using the 10Be/9Be isotope method. (2) The Pb isotope characteristics of SCS polymetallic crusts and nodules are related to their growth area: the Pb source of crusts and nodules growing in the northern SCS is mainly affected by the input of terrigenous materials; the crusts and nodules growing in the central SCS are less affected by terrigenous materials and are gradually affected by the weathering/alteration of seamount substrates and the input of volcanic activities. (3) Through the coupling of the mineralization chronology framework of SCS polymetallic crusts and nodules with the Pb isotope compositions of their profiles, it is found that the rapid formation and large-scale expansion of the northern hemisphere ice sheet around 3.5 Ma caused the deep water of the SCS to become extremely oxidized, thus promoting the mineralization of SCS crusts and nodules. The tectonic activities in the SCS since 2.8 Ma have had a greater impact on the SCS polymetallic crusts and nodules. Events such as the closure of the Lehe Waterway and the successive closure of the Taitung Waterway have led to the strengthening of the closure of the SCS, the lack of ventilation, and the reduction of oxidation of the seawater, which has slowed the growth rate of polymetallic crusts and nodules. In addition, the uplift of Taiwan and the subsidence of the northern SCS have led to an increase in the input of terrigenous materials, which has led to a decrease in the content of metal elements in the mineralization of polymetallic crusts and nodules. Therefore, the mineralization of SCS polymetallic crusts and nodules is subject to joint control of the tectonic evolution of the SCS and changes in the marine environment such as global climate change.

How to cite: Guan, Y., Ren, Y., Feng, A., and Zhou, X.: Metallogenic environment evolution of the polymetallic crusts and nodules from the South China Sea: Insights from in-situ Pb isotopes and elemental geochemistry, EGU General Assembly 2025, Vienna, Austria, 27 Apr–2 May 2025, EGU25-14366, https://doi.org/10.5194/egusphere-egu25-14366, 2025.

EGU25-15151 | ECS | Posters on site | CL4.3

Modern isotope dynamics in lakes of semiarid regions: A framework for interpreting lacustrine paleoclimate archives  

Claudia Voigt, Fernando Gázquez, Miguel Rodríguez-Rodríguez, Hana Jurikova, Lucía Martegani, Jorge Cañada-Pasadas, and Elvira Ruíz-Caballero

The isotope composition of lake sediments, including gypsum, carbonate, and biogenic silicate, provides a powerful means to reconstruct past hydrological and climatic changes. Triple oxygen isotope measurements in such minerals are an emerging tool for quantitative paleoclimate reconstructions in lacustrine environments. However, robust interpretations of these archives require a detailed understanding of the processes driving lake water isotope variability and mineral formation. Long-term changes in climate and hydrological conditions, especially in semiarid and arid regions, often challenge the interpretation of lacustrine records. Here, we synthesize key findings from multiple studies on the processes controlling triple oxygen and hydrogen isotope variability in semiarid lakes. The presented data include results from several Andalusian wetlands and artificial salt pans in Spain. We explore how factors such as groundwater connectivity, transitions between permanent and ephemeral stages, lake water salinity, climate seasonality, and seasonal and interannual variations in mineral formation influence the isotope composition of lake water and discuss their implications for paleoclimate reconstructions. Our findings provide a framework for interpreting lacustrine archives in complex hydrological settings.


Acknowledgements:

This research was supported by the European Commission (Marie Curie postdoctoral fellowship, grant no. 101063961) and the project PID2021-123980OA-I00 (GYPCLIMATE), funded by the Ministerio de Ciencia e Innovación of Spain, the Agencia Estatal de Investigación and the Fondo Europeo de Desarrollo Regional FEDER.

How to cite: Voigt, C., Gázquez, F., Rodríguez-Rodríguez, M., Jurikova, H., Martegani, L., Cañada-Pasadas, J., and Ruíz-Caballero, E.: Modern isotope dynamics in lakes of semiarid regions: A framework for interpreting lacustrine paleoclimate archives , EGU General Assembly 2025, Vienna, Austria, 27 Apr–2 May 2025, EGU25-15151, https://doi.org/10.5194/egusphere-egu25-15151, 2025.

EGU25-15935 | ECS | Posters on site | CL4.3

Exploring Fossil-Bound Nitrogen Isotopes in Modern and Paleozoic Sea Urchins: A New Window into Benthic Ecosystems 

Alexandra Auderset, Aaron L. Bieler, Alfredo Martínez-García, and Jeffrey R. Thompson

Nitrogen isotopic composition (δ¹⁵N) measured on organic matter within biominerals (fossil-bound) is an emerging proxy for reconstructing marine trophic conditions in deep time. While previously applied to foraminifera, diatoms, corals, shark teeth, and fish otoliths, the application of δ¹⁵N to other shallow-water marine taxa has been relatively limited. To evaluate the potential of sea urchins as a new model for paleoenvironmental and paleoecological reconstructions, we herein investigate fossil-bound δ¹⁵N in modern and fossil sea urchin biominerals and, for extant samples, its relationship to tissue δ¹⁵N.

Our findings indicate a δ¹⁵N difference of up to 3 ‰ between plates and spines within an individual sea urchin, with an observed nitrogen isotope gradient from the aboral surface to oral surface in both test plates and spines. In addition, we directly compare the δ¹⁵N signature of the gonads, gut content and body wall tissue with the biomineral-bound δ¹⁵N of the teeth, hemipyramids, rotulae, compasses, perignathic girdle, plates and spines. We suggest that biomineral-bound δ¹⁵N preserves trophic signals while also capturing internal isotopic gradients.

Extending this method, we analysed δ¹⁵N in various echinoid genera from the Carboniferous (Mississippian and Pennsylvanian) across multiple localities spanning the globe as a means of understanding their, previously poorly-defined, role in Paleozoic ecosystems. This study is a first step towards the application of fossil-bound nitrogen isotopes to this diverse group, providing new insights into trophic conditions and ecological structures in Paleozoic marine benthic ecosystems.

How to cite: Auderset, A., Bieler, A. L., Martínez-García, A., and Thompson, J. R.: Exploring Fossil-Bound Nitrogen Isotopes in Modern and Paleozoic Sea Urchins: A New Window into Benthic Ecosystems, EGU General Assembly 2025, Vienna, Austria, 27 Apr–2 May 2025, EGU25-15935, https://doi.org/10.5194/egusphere-egu25-15935, 2025.

EGU25-16107 | ECS | Orals | CL4.3

North Atlantic Freshening and Abrupt Cooling During the Last Glacial Maximum and Deglaciation recorded by Iberian Speleothem 

Laura Endres, Carlos Pérez-Mejias, Ruza Ivanovic, Lauren Gregoire, Anna Hughes, Hai Cheng, and Heather Stoll

The last deglaciation represents a valuable test case for understanding abrupt climate events as it triggers cascading feedback among Earth system components, particularly involving the ice sheets. Constraining the timing, magnitude, and order of these events within the critical North Atlantic realm remains challenging.

Here, we present a new U-Th-dated stalagmite from northwestern Iberia spanning the Last Glacial Maximum (LGM) and the entire last deglaciation (24-12 ka BP). Given its coastal and moisture-replete cave location, stable isotopes (δ18O, δ13C) capture both the influence of the Northern Hemisphere ice sheet’s meltwater inflow on surface ocean chemistry, and regional surface air temperature changes via their effects on local vegetation.  Since both stable isotopes are measured on the exact same samples, this allows a direct and high-resolution study of the temporal relationship between Northern Hemisphere meltwater ocean in-flux and temperature change in the North Atlantic realm, advancing speleothem applications in ocean and cryosphere studies.

We have compared our results to meltwater histories derived from the ice sheet model GLAC-1D, and our findings confirm/reveal gradual meltwater inflow during the LGM and early deglaciation (~20.8-18.2 ka BP), followed by a set of abrupt increases in meltwater starting at 18.04±0.16, 16.22±0.24 and 15.44±0.19 ka BP. In our record, abrupt cooling begins at 17.18±0.16 ka BP, indicating that the peak weakening of deep Atlantic convection lagged the first abrupt meltwater pulse by ~850 years. This suggests a non-linear connection between surface ocean freshening and the consequential disruption to the early deglacial Atlantic meridional overturning circulation. In contrast, a brief cooling phase, synchronous with a response in global archives, aligns with the meltwater pulse at 16.22 ka BP, whereas no cooling is associated with the 15.44 ka BP pulse. The transition into the Bølling-Allerød period, featuring two warm phases, is marked by rapid warming starting at 14.78±0.12 ka BP concurrent with a decline in meltwater anomalies, likely related to the re-strengthening of deep Atlantic convection. Remarkably, our record does not show a freshwater signal coincident with the classically cited onset of MWP 1a (~14.6 ka BP), suggesting that this event happened earlier or that the freshwater anomaly was rapidly advected out of the surface North Atlantic by a strong AMOC.

How to cite: Endres, L., Pérez-Mejias, C., Ivanovic, R., Gregoire, L., Hughes, A., Cheng, H., and Stoll, H.: North Atlantic Freshening and Abrupt Cooling During the Last Glacial Maximum and Deglaciation recorded by Iberian Speleothem, EGU General Assembly 2025, Vienna, Austria, 27 Apr–2 May 2025, EGU25-16107, https://doi.org/10.5194/egusphere-egu25-16107, 2025.

EGU25-16395 | Orals | CL4.3

South Asian summer and winter monsoon evolution during the last deglaciation 

Igor Obreht, Andreas Lückge, Mahyar Mohtadi, Petra Zahajská, Enno Schefuß, Denis Scholz, Lars Wörmer, Florian Adolphi, Martin Grosjean, and Kai-Uwe Hinrichs

The South Asian monsoon (SAM) system significantly influences the hydroclimate of the Indian subcontinent, affecting nearly two billion people. However, much of our paleoclimate knowledge is centered on the summer monsoon (SASM), while the winter monsoon (SAWM) remains poorly understood. This study investigates seasonal monsoon variability during the last deglaciation, focusing on abrupt climate transitions that provide natural experiments for understanding past monsoon dynamics. We analyzed sediment core SO130-289KL from the Northeastern Arabian Sea, a region sensitive to both the SASM and the SAWM. Laminated sediments deposited during the Bølling–Allerød Interstadial (~14,690–12,890 years BP) offer a rare high-resolution archive for reconstructing past climate variability at ~decadal timescales.

To overcome the limitations of traditional analytical techniques, we employed mass spectrometry imaging and hyperspectral imaging, achieving micrometer-scale spatial resolution. SST reconstructions rely on two independent biomarkers: the alkenone-based UK’37 index and the GDGT-based Crenarchaeol-Caldarchaeol Tetraether (CCaT) index. Hyperspectral imaging quantified chloropigments-a as a proxy for primary production, while leaf wax hydrogen (δD C31) and carbon (δ¹³C31) isotopes provide insights into atmospheric moisture and terrestrial vegetation dynamics in lower resolution.

Our results reveal distinct seasonal responses of the SAM system to deglacial climate changes. Alkenone-based SSTs, which are more sensitive to change in SAWM winds, show a progressive weakening of the northeastern boreal winter winds during the Allerød, aligning with a progressive cooling trend in the Southern Hemisphere. This weakening likely reflects a boreal winter (austral summer) northward shift of the Intertropical Convergence Zone (ITCZ) towards the equator driven by decreasing Southern Hemisphere austral summer temperatures. In contrast, CCaT-derived SSTs, linked to SASM wind strength, closely correlate with Northern Hemisphere temperature proxies, demonstrating that SASM variability was primarily controlled by boreal summer conditions.

Seasonal precipitation patterns reconstructed from leaf wax isotopes highlight hydroclimatic changes during the Bølling-Allerød. Lower δD C31 values during the Bølling indicate increased summer precipitation, while the early Allerød more positive δD C31 suggest decrease in precipitation. Following concurrent decreases in δ¹³C31 and δD C31 values during the mid to late Allerød suggest reduced seasonality with enhanced precipitation in both summer and winter.

The reconstructed seasonal evolution of SASM and SAWM has significant implications for other paleoclimate archives, such as speleothem δ¹⁸O values, traditionally interpreted as summer monsoon proxies. Our findings suggest that speleothem δ¹⁸O values reflect a combined signal of summer and winter precipitation. During the Bølling-Allerød, depleted δ¹⁸O values may indicate an increased contribution from isotopically lighter winter precipitation associated with subtropical westerly jets, rather than solely stronger summer monsoon rainfall. The observed decrease in δ¹⁸O values during the late Allerød likely reflects enhanced winter precipitation from isotopically depleted far-distance moisture sources.

Our findings underscore the dual hemispheric influence on the SAM. SASM strength was directly linked to Northern Hemisphere forcing, particularly shifts in Atlantic Meridional Overturning Circulation and associated ITCZ migrations, while SAWM variability was modulated by both Northern and Southern Hemisphere climate changes.

How to cite: Obreht, I., Lückge, A., Mohtadi, M., Zahajská, P., Schefuß, E., Scholz, D., Wörmer, L., Adolphi, F., Grosjean, M., and Hinrichs, K.-U.: South Asian summer and winter monsoon evolution during the last deglaciation, EGU General Assembly 2025, Vienna, Austria, 27 Apr–2 May 2025, EGU25-16395, https://doi.org/10.5194/egusphere-egu25-16395, 2025.

EGU25-18756 | ECS | Orals | CL4.3

Hydroclimatic variability during the onset of the Last Interglacial in Lake Van and Iimplications for the Eastern Mediterranean  

Anaïs Urban, Cecile Blanchet, Dirk Sachse, Birgit Schröder, Sylvia Pinkerneil, Markus Schwab, Rebecca Kearney, Ola Kwiecien, Achim Brauer, and Rik Tjallingii

The Mediterranean region is highly sensitive to climate change and warms faster than the global average. Models forecast a pronounced drying trend, coupled with an increase in the frequency and intensity of extreme rainfall events. Past Interglacials can be used as analogues to better understand and estimate regional hydroclimatic responses to global warming.

The Lake Van (Eastern Anatolia, Turkey) sediment record, ICDP site 5034, serves as a key archive to reconstruct hydrological changes in the Eastern Mediterranean. This terminal lake is the largest soda lake in the world and has experienced significant lake-level changes over Glacial-Interglacial transitions (~105 m above modern lake levels during MIS5e). Sediments covering the transition from MIS6 to MIS5e are finely laminated and, in parts, even annually laminated or varved. Therefore, these sediments enable detailed analyses of hydroclimatic variability during Termination II through XRF, microfacies analysis, stable isotope analysis, and δD on leaf wax biomarkers.

Within MIS5e, first results show a significant increase in the bulk organic δ13C signal over a period of several hundred years during a stage associated with higher lake levels. This shift aligns with a change in alkenone composition and precedes a change in stratification, as suggested by a transition from varved to non-varved lithology. The external and internal drivers of these changes are further investigated by XRF core scanning, element mapping, and comprehensive biomarker analyses to explore this proxy behavior.

Ultimately, the data obtained will be compared to other lacustrine records, such as the ICDP Core 5017 from the Dead Sea, to contribute to a more comprehensive understanding of regional variations in the hydroclimatic response during this warming phase in the Eastern Mediterranean.

How to cite: Urban, A., Blanchet, C., Sachse, D., Schröder, B., Pinkerneil, S., Schwab, M., Kearney, R., Kwiecien, O., Brauer, A., and Tjallingii, R.: Hydroclimatic variability during the onset of the Last Interglacial in Lake Van and Iimplications for the Eastern Mediterranean , EGU General Assembly 2025, Vienna, Austria, 27 Apr–2 May 2025, EGU25-18756, https://doi.org/10.5194/egusphere-egu25-18756, 2025.

EGU25-19988 | Posters on site | CL4.3

Chronological and seasonal constraints for the Holocene S1 tephra in the Eastern Mediterranean 

Markus J. Schwab, Rebecca J. Kearney, Katharina Pflug, Cecile Blanchet, Ina Neugebauer, Valby van Schijndel, Oona Appelt, Rik Tjallingii, and Achim Brauer

The eastern Mediterranean region experienced large hydroclimatic shifts throughout the Holocene (11.6 ka to present). The region is located between the contrasting humid Mediterranean climate and the Saharo-Arabian desert belt. The important palaeoclimatic record of the Dead Sea (Levant) ICDP Dead Sea Deep Drilling Project (DSDDP) core provides detailed reconstructions into the hydroclimatic variability during this time. However, chronological uncertainties have prevented detailed insight into the regional climatic (a)synchronies with other palaeoclimatic records in the region. The use of tephra horizons as time-synchronous markers can provide insight into the spatial and temporal environmental response of this region to past abrupt climatic change. The identification of a widely dispersed volcanic ash from a volcanic eruption is a particularly powerful chronological tool to be used, as seen with the S1 tephra from Mt. Erciyes (Turkey). 

            Here, we present the identification of a microtephra layer, visible only in thin section analysis, within varved sediments of the Dead Sea DSDDP record. Using major, minor and trace element analysis, this tephra has been identified as the S1 tephra. Though the S1 tephra has been found in the Dead Sea Ein Gedi shallow water core before (Neugebauer et al., 2017), this is the first time a ‘visible’ tephra layer has been found in the deep ICDP sediment lake record. Through thin section micro facies and XRF analysis, we can now confirm the season of the S1 eruption from Mt. Erciyes happened during the winter. The discovery of the S1 tephra in the well-dated part of the DSDDP record and at other sites across the Mediterranean, we have used Bayesian age-modelling to refine the age for this key tephrostratigraphic marker. As a result, this will enable further detailed insights into the timing of the African Humid period across the eastern Mediterranean region during the early Holocene.

How to cite: Schwab, M. J., Kearney, R. J., Pflug, K., Blanchet, C., Neugebauer, I., van Schijndel, V., Appelt, O., Tjallingii, R., and Brauer, A.: Chronological and seasonal constraints for the Holocene S1 tephra in the Eastern Mediterranean, EGU General Assembly 2025, Vienna, Austria, 27 Apr–2 May 2025, EGU25-19988, https://doi.org/10.5194/egusphere-egu25-19988, 2025.

Hydroclimatic variations on the Tibetan Plateau since the Last Glacial Maximum (LGM) are still debated. Here, we reconstruct climatic and hydrological variability in the southwestern Tibetan  Plateau since the late LGM using climate proxies based on molecular distributions of n-alkanes, hydrogen and carbon isotopic composition of terrestrial n-alkanes and δ18Ocarbonate at Lake Zabuye. Our findings indicate that the δD-nC31 signal in this lake was primarily influenced by temperature from late the LGM to early deglaciation period, shifting to a predominance of precipitation influence from the Heinrich event 1 (H1) to the Holocene period. In contrast, the carbonate δ18O was found to be primarily governed by evaporative processes. Through comprehensive analysis of all proxies, we suggest that Lake Zabuye was dominated by the mid-latitude Westerlies with cold and moist conditions from late LGM to early deglaciation. The H1 and Younger Dryas (YD) periods were characterized by low temperature and reduced precipitation due to the influence of the moderately intensified Westerlies. The Indian Ocean Summer Monsoon (IOSM) intensified during the Bølling/Allerød (B/A) period, and its strength was comparable to that of the Westerlies, resulting in plentiful rainfall and high evaporation. The IOSM was dominant during the Holocene, characterized by abundant rainfall and high evaporation.     

How to cite: Ling, Y., Tian, L., and Bendle, J.:  Hydroclimatic Evolution of the Southwestern Tibetan Plateau Since the Last Glacial Maximum Inferred from Multi-Proxy Data in Lake Zabuye, EGU General Assembly 2025, Vienna, Austria, 27 Apr–2 May 2025, EGU25-21525, https://doi.org/10.5194/egusphere-egu25-21525, 2025.

EGU25-2356 | ECS | Posters on site | ERE6.2

Maximising Benefits of Sustainable Development Target Interactions: An Integrated Priority Analytical Model Applied to China 

Yuanhui Wang, Rotem Zelingher, Nikita Strelkovskii, Changqing Song, and Peichao Gao

National governance plays a pivotal role in achieving the 2030 Sustainable Development Goals (SDGs) under limited resources. Therefore, it is necessary to prioritize SDGs and their underlying targets to support informed decision-making. Among the scientific approaches, integrated priority analytical models have led to the consideration of interwoven interactions among targets and the involvement of both traditional analytical and interaction-related criteria. However, existing models have limitations in maximizing the benefits of interactions, as they tend to overlook negative and high-order interactions. To address this issue, this study proposes a new model that integrates impacts of direction-specific high-order interactions and temporal trends in a tri-dimensional framework to assign target-specific “temporal priorities” and “resource priorities” at the national scale. We applied this model to the priority analysis of SDG targets in China to demonstrate its usefulness in leveraging the benefits of interactions within a complex sustainability framework. Our analysis shows that, for temporal priorities, 10.7% of targets require urgent action to promote progress or address trade-offs, and 23.8% demand low levels of urgency. The urgent targets focus on energy efficiency, augmented funding for forest management, and biodiversity preservation. Concerning resource priorities, 27.4% of targets necessitate elevated resource allocation, clustering primarily within Goals 12, 15, and 16. Accordingly, we recommend policy actions to enhance funding for biodiversity preservation and forest management and to foster energy efficiency measures. Additionally, allocating extra resources to the responsible consumption goal is imperative due to pronounced trade-off effects.

How to cite: Wang, Y., Zelingher, R., Strelkovskii, N., Song, C., and Gao, P.: Maximising Benefits of Sustainable Development Target Interactions: An Integrated Priority Analytical Model Applied to China, EGU General Assembly 2025, Vienna, Austria, 27 Apr–2 May 2025, EGU25-2356, https://doi.org/10.5194/egusphere-egu25-2356, 2025.

EGU25-2451 | ECS | Posters on site | ERE6.2

Developing a Life Cycle Assessment Framework with Nature-based Solutions for Carbon Footprint Management in Irrigation Infrastructure 

Chung Yu Yang Hung, Yi Ju Chen, Wei Chun Chuang, and Ching Pin Tung

Irrigation infrastructure, critical for agricultural water management, contributes significantly to greenhouse gas (GHG) emissions during its operational phase due to energy and resource consumption for gate operations, water pumping, and maintenance activities. In Taiwan, the construction of new irrigation canals has largely plateaued, with current projects predominantly focusing on repair, replacement, and upgrades. This study seeks to address the carbon footprint of these engineering activities by developing a tailored Life Cycle Assessment (LCA) framework that evaluates emissions hotspots specific to irrigation infrastructure and explores Nature-based Solutions (NbS) as mitigation strategies.

The LCA framework focuses on the maintenance and operational stages (B1-B5) of irrigation systems while incorporating end-of-life considerations (C1-C4) where necessary. For instance, it assesses energy consumption during post-repair operations and simulates scenarios involving energy savings or material reuse. NbS interventions, such as vegetative soil stabilization, eco-friendly repair techniques, and energy-efficient water management systems, are analyzed for their feasibility and alignment with the eight NbS criteria and twenty-eight associated indicators. The framework is designed to quantify the potential of these interventions to reduce lifecycle emissions and enhance ecosystem resilience.

Aligned with the Global Ecosystem Research Infrastructures Initiative, this study incorporates harmonized methodologies and collaborative practices to evaluate carbon emissions and explore effective mitigation strategies. By addressing key environmental challenges through structured frameworks, the research highlights the potential for interoperability and scalability, offering insights into how localized practices can inform global efforts in sustainable water resource management and climate resilience.

Preliminary findings highlight the potential of NbS to address key emission sources. For example, vegetative solutions applied to embankments reduce soil erosion while simultaneously sequestering carbon, and energy-efficient upgrades to water pumping systems significantly lower operational emissions. These results underscore the value of integrating LCA with NbS to provide actionable pathways for mitigating environmental impacts while ensuring infrastructure functionality.

By focusing on a localized case study of Taiwan’s irrigation infrastructure, this research demonstrates how regional practices can contribute to global environmental research infrastructures, fostering collaboration and advancing efforts to address shared environmental challenges under the context of climate resilience.

How to cite: Yang Hung, C. Y., Chen, Y. J., Chuang, W. C., and Tung, C. P.: Developing a Life Cycle Assessment Framework with Nature-based Solutions for Carbon Footprint Management in Irrigation Infrastructure, EGU General Assembly 2025, Vienna, Austria, 27 Apr–2 May 2025, EGU25-2451, https://doi.org/10.5194/egusphere-egu25-2451, 2025.

ATMO-ACCESS is a pilot project funded under the Horizon 2020 program (April 2021–October 2025) that addresses the needs of distributed atmospheric research infrastructures (RIs), including ICOS (Integrated Carbon Observing System), ACTRIS (Aerosol, Clouds, and Trace Gases Research Infrastructure), and IAGOS (In-flight Global Observing System). The project provides effective and convenient access to leading European atmospheric research facilities, including fixed monitoring stations, mobile observation platforms, simulation chambers, and central laboratories. It also offers virtual access to innovative cross-RI digital and training services.

These access opportunities are utilized by research communities worldwide to conduct experiments, evaluate instruments, and analyze data, ultimately advancing scientific knowledge and technological development.

Now in its final stage, ATMO-ACCESS is reviewing its main outcomes. The presentation will highlight how demand for access to atmospheric research facilities is shifting—from physical access to more hybrid and virtual modes,  It will also discuss how transnational access projects can support both research and innovation and illustrate how access programs are used by the private sector or by international organization outside the academics.  

Historically, access projects have been funded through short-term EU initiatives. However, findings from ATMO-ACCESS underscore the need for greater collaboration among funding agencies across Europe and beyond. Such cooperation within Europe and extended at international level is essential to establish more sustainable access programs that benefit the broader research community.

How to cite: Laj, P. and Philippin, S.: ATMO-ACCESS: Why Do We Need a Sustainable Access Program for Atmospheric Research?, EGU General Assembly 2025, Vienna, Austria, 27 Apr–2 May 2025, EGU25-3748, https://doi.org/10.5194/egusphere-egu25-3748, 2025.

EGU25-4820 | Posters on site | ERE6.2

Building the Future of Biodiversity: Italy's National Biodiversity Future Center (NBFC) Initiative 

Donatella Spano, Carlo Calfapietra, Massimo Labra, Alberto Di Minin, Simonetta Frachetti, Gianluca Sarà, Maria Chiara Chiantore, Gian Marco Luna, Lorena Rebecchi, Francesco Frati, Maria Chiara Pastore, Andrea Galimberti, Hellas Cena, Gloria Bertoli, Isabella Saggio, Luigi Bubacco, Riccardo Coratella, Simone Mereu, and Giuseppe Brundu

This presentation provides an overview of a recent initiative and large investment in biodiversity undertaken in Italy. It focuses on establishing the Italian National Biodiversity Future Center (NBFC), the first National Research and Innovation Center dedicated to biodiversity, funded through European Union funds—NextGenerationEU. The NBFC includes key actions to monitor biodiversity, enhance conservation efforts, restore ecosystems, and value terrestrial, marine, and urban biodiversity. To deal with such a complex roadmap, the NBFC is designed following the Hub&Spoke model. It comprises 6 thematic Spokes dedicated to the sea, land and wetlands, and cities, with two crosscutting spokes dedicated respectively to training, communication, knowledge sharing, innovation, and policies through international connections. A primary objective is to encourage data sharing among various institutions, organizations, and countries to foster international collaboration in biodiversity protection. The NBFC is working to create a national digital platform for data analysis and biodiversity informatics, as well as collecting biodiversity data and acting as a digital twin for monitoring and conservation. This digital platform will connect biodiversity to ecosystem functions and services. This multilevel digital platform is a vital resource for the national and international scientific community, policymakers, and organizations responsible for protecting biological diversity in various environmental contexts. All actions undertaken by the NBFC are based on the Nature-based Solutions approach, providing a wide range of options for biodiversity restoration and management. Additionally, Citizen Science initiatives contribute to the NBFC's objectives by raising public awareness about the need to understand, monitor, conserve, and restore biodiversity. The NBFC's activities also aim to promote human health and well-being. In line with the One Health approach, healthy ecosystems are essential for resilience to diseases, food security, and improved quality of life. Through this initiative, Italy aims to strengthen its commitment to safeguarding biodiversity while promoting sustainable development and ecological resilience.

How to cite: Spano, D., Calfapietra, C., Labra, M., Di Minin, A., Frachetti, S., Sarà, G., Chiantore, M. C., Luna, G. M., Rebecchi, L., Frati, F., Pastore, M. C., Galimberti, A., Cena, H., Bertoli, G., Saggio, I., Bubacco, L., Coratella, R., Mereu, S., and Brundu, G.: Building the Future of Biodiversity: Italy's National Biodiversity Future Center (NBFC) Initiative, EGU General Assembly 2025, Vienna, Austria, 27 Apr–2 May 2025, EGU25-4820, https://doi.org/10.5194/egusphere-egu25-4820, 2025.

EGU25-7674 | Orals | ERE6.2

The Ecological Monitoring System of Australia – standardised methods to track environmental change 

Sally O'Neill, Katie Irvine, Andrew Tokmakoff, Ashley Leedman, Jacqui DeChazal, Amelia Cook, and Ben Sparrow

The Australian Government makes significant investments to improve the stewardship of Australia's environment and the sustainable management of natural resources. On-ground actions by natural resource management (NRM) practitioners aim to improve or restore natural ecosystems and the diverse species they support, including threatened and unique taxa. Ideally, government investments are directed towards highly effective activities that result in positive conservation outcomes. Quality scientific data is critical not only to improve our understanding of the effectiveness of funded actions and their impact on species and ecosystems, but also to track climate-driven change, and enable policy-makers to make informed decisions. 

The Ecological Monitoring System of Australia (EMSA) is a collaboration between the Terrestrial Ecosystem Research Network (TERN) and the Australian Government Department of Climate Change, Energy, the Environment and Water (DCCEEW). EMSA provides the infrastructure, tools and resources to support NRM data collection, analysis, and evaluation, meeting the national requirement for a streamlined, consistent, automated, and robust ecological monitoring system.

EMSA builds on TERN's history as Australia’s terrestrial ecosystem observatory. EMSA’s consistent standardised observation methods provide on-ground practitioners with a modular suite of standardised survey protocols, comprehensive instructions manuals, a field data collection app, and centralised data management and storage system for the Australian Government's Biodiversity Data Repository. Ongoing support is provided via a help desk, community of practice, training and outreach activities.

The 24 EMSA modules include standardised methods for establishing plots, collecting landscape, soil, disturbance, vegetation community and floristic information, field vouchers, leaf tissue samples, and photopoints. Additional modules can be incorporated to target terrestrial fauna, pest fauna, and invertebrates through direct and indirect observation, camera trapping and acoustic monitoring. Modules are available to capture management activities, the severity of fire, and changes to tree condition and recruitment. Most modules offer multiple standardised options, depending on the detail required for the project. The field collection app is paired with an instruction manual and is written for entry to mid-level field ecologists and field practitioners.

EMSA is being delivered across Australia by partners funded under the Natural Heritage Trust. It is also encouraged for other NRM investment programs and is being considered for other future Australian Government programs. As a result, an Australian-wide network is being created, generating invaluable, science-rich data and improving our understanding of ecosystem restoration, biodiversity conservation, and climate change impacts, and supporting our planning, decision-making and reporting of investment programs Whilst developed for the Australian landscape, the EMSA model is adaptable globally.

How to cite: O'Neill, S., Irvine, K., Tokmakoff, A., Leedman, A., DeChazal, J., Cook, A., and Sparrow, B.: The Ecological Monitoring System of Australia – standardised methods to track environmental change, EGU General Assembly 2025, Vienna, Austria, 27 Apr–2 May 2025, EGU25-7674, https://doi.org/10.5194/egusphere-egu25-7674, 2025.

EGU25-12915 | Orals | ERE6.2

eLTER Standard Observations: A holistic framework for integrated long-term environmental monitoring 

Steffen Zacharias, Jaana Bäck, and Michael Mirtl

The European Long-Term, critical zone and socio-ecologicalEcosystem Research Infrastructure (eLTER RI) has been developed to provide a continental-scale site-based network for the observation, understanding, and addressing of critical ecological, geochemical, and socio-ecological challenges. A cornerstone of this initiative is the implementation of the eLTER Standard Observations, which constitutes a harmonised framework for the collection and analysis of long-term environmental data across diverse ecosystems.

These observations are characterised by a multidisciplinary approach, integrating biological, hydrological, geochemical, climatic, soil-related, and socio-economic variables and parameters. Key areas of focus include biodiversity, primary production, water quality, nutrient cycling, carbon storage, and climate dynamics. The standardisation of the methodology ensures the comparability of data across sites, regions, and timescales, thereby enabling robust analyses of ecosystem dynamics and human impacts.

The eLTER Standard Observations (SOs) are closely aligned with the concepts of Essential Variables (EVs), encompassing a wide range of critical environmental parameters necessary for understanding ecosystem dynamics. SOs are designed to integrate elements of e.g. Essential Climate Variables (ECVs), Essential Biodiversity Variables (EBVs), and Essential Socio-Economic Variables (ESVs), ensuring a comprehensive approach to environmental monitoring. The SOs provide the fundamental data necessary to track key processes, assess ecosystem health, and understand human-nature interactions across various scales. By harmonising data collection and focusing on long-term monitoring, the SOs contribute to the global framework of Essential Variables, fostering comparability and supporting evidence-based decision-making.

The presentation will outline the scope, methodology, and significance of the eLTER Standard Observations with respect to simultaneously covering existing EV concepts. It will highlight their role in addressing global challenges such as climate change, biodiversity loss, and sustainable resource management, emphasizing their contribution to integrative ecosystem research.

How to cite: Zacharias, S., Bäck, J., and Mirtl, M.: eLTER Standard Observations: A holistic framework for integrated long-term environmental monitoring, EGU General Assembly 2025, Vienna, Austria, 27 Apr–2 May 2025, EGU25-12915, https://doi.org/10.5194/egusphere-egu25-12915, 2025.

EGU25-12990 | Posters on site | ERE6.2

Biodiversity Knowledge Hub: Addressing the impacts of environmental change by linking Research Infrastructures, Global Aggregators and community Networks 

Christos Arvanatidis, Lyubomir Penev, Joaquin López Lérida, Cristina Huertas Olivares, Antonio José Sáenz Albanés, Alberto Basset, Sara Montinaro, Lucia Vaira, Nikos Minadakis, Michalis Griniezakis, and Julio López Paneque

Access to reliable information and FAIR compliant data is essential in understanding and addressing the impacts of environmental change on biodiversity and ecosystems. However, these resources are often fragmented and their combined use for delivering integrative knowledge to meet the above research challenge is difficult. The BiCIKL project (Biodiversity Community Integrated Knowledge Library) showcases the transformative potential of interdisciplinary collaboration in addressing biodiversity and climate research challenges. By integrating biodiversity data from research infrastructures, scientific repositories, and expert communities, BiCIKL has bridged the gap between fragmented knowledge systems and actionable insights for conservation and resilience.

A key achievement of BiCIKL is the Biodiversity Knowledge Hub (BKH), an innovative platform enabling seamless access to biodiversity data, tools, and workflows. The BKH fosters interoperability between diverse resources, empowering researchers, policymakers, and practitioners to make data-driven decisions that support biodiversity preservation and climate adaptation. This platform exemplifies open science principles and facilitates long-term, scalable solutions that support ongoing collaboration, innovation and resilience in biodiversity research and management.

Through its collaborative approach, BiCIKL has advanced biodiversity informatics by demonstrating best practices in data integration, capacity building, and stakeholder engagement. This positions BiCIKL as a benchmark for future efforts to harmonize biodiversity and climate resilience initiatives globally, exemplifying how interoperability and harmonized standards can transform the accessibility and utility of biodiversity data. The hub offers tailored tools that cater to a wide spectrum of users, from academic researchers conducting advanced analytics to policymakers seeking actionable insights for sustainable development.

BKH’s modular design allows for continuous expansion and adaptation, ensuring its relevance in addressing emerging challenges in biodiversity and climate resilience. By fostering active stakeholder engagement, BiCIKL has cultivated a thriving community of practice, ensuring the long-term sustainability and growth of its initiatives

This presentation will outline the methodologies and technologies contributing to BKH, emphasizing its role as a pioneering model for integrated biodiversity knowledge and action.

How to cite: Arvanatidis, C., Penev, L., López Lérida, J., Huertas Olivares, C., Sáenz Albanés, A. J., Basset, A., Montinaro, S., Vaira, L., Minadakis, N., Griniezakis, M., and López Paneque, J.: Biodiversity Knowledge Hub: Addressing the impacts of environmental change by linking Research Infrastructures, Global Aggregators and community Networks, EGU General Assembly 2025, Vienna, Austria, 27 Apr–2 May 2025, EGU25-12990, https://doi.org/10.5194/egusphere-egu25-12990, 2025.

EGU25-13041 | ECS | Orals | ERE6.2

Learning from the European Experiences: Representativity on a Global Level 

Thomas Ohnemus and Michael Mirtl

The distributed Integrated European Long-Term Ecosystem, critical zone and socio-ecological Research Infrastructure (eLTER RI) is one of six partners of the Global Ecosystem Research Infrastructure (GERI). eLTER RI comprises ecosystem research sites and socio-ecological research platforms for exemplary research covering major European environmental, social and economic gradients. In a holistic approach, the in-situ facilities are designed for standardized observation of the five ecosystem spheres – socio-econosphere, atmosphere, hydrosphere, geosphere and biosphere. To identify gaps and to optimize the spatial distribution of in-situ facilities within eLTER RI we conducted analyses of representativity. These analyses reveal under-, well or overrepresented conditions and locations. However, these current conditions shift dramatically due to Global Change. Therefore, we additionally investigated the suitability of eLTER RI to address land use change and climate change features, i.e. the fitness for future.

We identified three distinct geospatial gaps: the Iberian Gap, the Eastern Gap, and the Nordic Gap. These gaps resulted mainly from the underrepresentation of agricultural lands, regions with low economic density, mesic and dry regions as well as the Mediterranean, Continental and Boreal biogeoregions. The patterns of underrepresentation appeared to be driven by access to funding resources and the regional research history. Several sites that responded to the survey but do currently not fulfil the infrastructural requirements of the eLTER RI bear potential to contribute to gap closure. Additionally, incorporating research facilities from other research infrastructures or monitoring networks into the eLTER RI could cost-efficiently counteract gaps. Regarding the fitness for future, eLTER RI covers all facets of emerging research challenges, but is spatially biased. Gaps that were assumed to be consistent for a variety of potential futures manifested in the Southern Iberian Peninsula, Poland, Finland, Sweden and Norway.

This work demonstrated the power of geospatial representativity analyses to investigate spatial biases and to inform strategic network development on the European continental scale. Consequently, we additionally harness this power to investigate the spatial distribution of the GERI initiative, which strives to better understand the function and change of indicator ecosystems across global biomes. To that end, GERI aims to support excellent science that can also inform political and managerial decision-making regarding grand societal challenges. A fully functioning GERI shall deliver harmonized data, foster international partnerships and enable new understandings of global ecological processes—stretching across continents, decades, and ecological disciplines. Therefore, the collective coverage of global ecosystems through the physical networks of SAEON (Z.A.), TERN (AUS), NEON (USA), CERN (China), as well as ICOS and eLTER RI in Europe is of high interest. As first analysis we present a global scale coverage of GERI-associated in-situ facilities regarding climatic zones.

How to cite: Ohnemus, T. and Mirtl, M.: Learning from the European Experiences: Representativity on a Global Level, EGU General Assembly 2025, Vienna, Austria, 27 Apr–2 May 2025, EGU25-13041, https://doi.org/10.5194/egusphere-egu25-13041, 2025.

The forest landscape is of global importance for net radiative forcing. As the world warms, feedbacks within the ecosystems alter greenhouse gas (GHG) balances. Coordinated observations of GHG fluxes and concentrations, and of more chemically active species, as well as variables describing the ecosystem, are essential for understanding and prediction of feedbacks. ICOS (Integrated Carbon Observation System), ACTRIS (Aerosol, Clouds and Trace Gas Research Infrastructure) and SITES (Swedish Infrastructure for Ecosystem Science) have already provided >10 years of data for open science. These measurements on the carbon cycle, air quality, and ecosystem behavior already provide key information for quantifying GHG emissions and sinks, and investigating feedbacks under a changing climate. ACTRIS Sweden, ICOS Sweden and SITES have developed a strategic plan for enhanced cooperation. This will better address the global challenge of understanding ecosystem influences on GHG fluxes as the climate warms, as well as the interplay of physical and chemical properties of the atmosphere on ecosystems.


Before summarizing that plan for deeper cooperation, it is worth noting some more about these three national networks. ICOS and ACTRIS are already ERIC RIs and SITES is involved in efforts to establish eLTER (Integrated European Long-Term Ecosystem, Critical Zone and Socio-Ecological Research Infrastructure) as an ERIC RI as well. The three national RIs are active partners within their respective ERIC consortia and collaborate with other RIs in the ESFRI environment and climate domain. All stations and the FAIR data they provide are widely used within research, earth system observation, education (students, PhD, post docs), and as test sites for new instruments and methods within academia and private-sector companies. The stations of the three RIs are also incorporated into the Copernicus services. The management structure of the RIs are closely related to developments in earth observation at European and international levels.


The strategic plan for enhanced cooperation between the three national RIs has a set of eight short term goals that should be achieved in the next 2-3 years. These include further enhancing co-location of measurements, integration of scientific leadership, as well as coordination of tools for accessing both the field sites and available data. This enhanced cooperation between the national networks of ACTRIS, ICOS and SITES also aims at five long terms goals.


  • continuity of high-quality services
  • strategic collaboration
  • organizational optimization
  • increased usage across our RIs
  • fostering innovation


As a result of the enhanced cooperation, the RIs will achieve a new level of collaboration in observation systems for atmospheric pollution, including the effects of this pollution and climate change on ecosystems. Joint approaches to strategic development and outreach will further maximize synergies between these complementary infrastructures, giving ACTRIS, ICOS and SITES a more central, coordinated role in supporting Earth system science, and societal decision-making in the context of the UN Sustainable Development Goals.

How to cite: Krejci, R., Arnold, T., Holst, J., and Swietlicki, E.: Addressing research challenges of environmental change at the global scale via Research Infrastructures collaboration and alignment, EGU General Assembly 2025, Vienna, Austria, 27 Apr–2 May 2025, EGU25-13250, https://doi.org/10.5194/egusphere-egu25-13250, 2025.

EGU25-13612 | ECS | Orals | ERE6.2

Towards Globally Harmonized Environmental Datasets: a Proof of Concept Using Ecological Drought Data and the Global Ecosystem Research Infrastructure (GERI) Framework 

Krutika Deshpande, Cedric Hagen, Tommy Bornman, Leo Chiloane, Gregor Feig, Elisa Girola, Siddeswara Guru, Christine Laney, Henry Loescher, Michael Mirtl, Beryl Morris, Paula Mabee, Emmanuel Salmon, Michael SanClements, Benjamin Ruddell, Pamela Sullivan, Melinda Smith, Werner Kutsch, Xiubo Yu, and Steffen Zacharias

Global environmental challenges, such as climate change, transcend international borders, requiring a unified approach to data management and analysis. The Global Ecosystem Research Infrastructure (GERI) was founded to address this need, building relationships and establishing data sharing practices among six of the largest ecosystem research infrastructures in the world. Data harmonization is required to standardize and ingest data products from these infrastructures into a findable, accessible, interoperable, reusable (FAIR) global dataset. Harmonized global data can improve existing global climate models and inform environmental research studies. Here, we present challenges involved in data harmonization and progress to date resulting from a U.S. National Science Foundation AccelNet award. This GERI-affiliated AccelNet project focuses on harmonizing ecological drought data collected by different countries and establishing a broader network-of-networks for pursuing ambitious global-scale environmental science research. We describe the analytical pipelines and the philosophical decisions made in designing the GERI framework, as well as some of the challenges and lessons learned along the way. We also present the initial harmonized drought data products, exploring how environmental variables like soil moisture and temperature vary across the world. Future work will be focused in two areas. First, working with our colleagues at DroughtNet and the International Drought Experiment, we will further explore the implications of these global harmonized drought data. Second, we will begin global data harmonization efforts for new data products related to other research areas, primarily led by the GERI early career researcher working group.

How to cite: Deshpande, K., Hagen, C., Bornman, T., Chiloane, L., Feig, G., Girola, E., Guru, S., Laney, C., Loescher, H., Mirtl, M., Morris, B., Mabee, P., Salmon, E., SanClements, M., Ruddell, B., Sullivan, P., Smith, M., Kutsch, W., Yu, X., and Zacharias, S.: Towards Globally Harmonized Environmental Datasets: a Proof of Concept Using Ecological Drought Data and the Global Ecosystem Research Infrastructure (GERI) Framework, EGU General Assembly 2025, Vienna, Austria, 27 Apr–2 May 2025, EGU25-13612, https://doi.org/10.5194/egusphere-egu25-13612, 2025.

EGU25-14518 | ECS | Orals | ERE6.2

Assessing coastal ecosystem impacts of sea-level rise at the global scale via research infrastructure alignment 

Madeline Goddard, Vicki Bennion, Catherine Lovelock, and Neil Saintilan

TERN Australia, a GERI member in the southern hemisphere, produces systematically collected continental-scale time-series ecosystem data. These data are invaluable to a myriad of global models and sustainability reporting and help enable broader cross-continental ecological research. This presentation focuses on the challenges of federating recently introduced sea-level coastal ecosystem research infrastructure for future global impact. Understanding the vulnerability of vegetated coastal habitats is essential - they support biodiversity, filter pollutants, capture sediments and reduce coastal erosion and storm damage. They also on average sequester more carbon per unit area than terrestrial forest and maintain significant sedimentary carbon stocks. Australia has one of the longest coastlines in the world and to date, has over 300 surface elevation table (SET) instruments monitoring sea level rise impacts on coastal wetlands. SETs present a cost-effective methodology, collecting long term empirical datasets that may be integrated into remote sensed data. TERN aims ensuring all Australian SET operators adhere to ‘global standard’ for monitoring and data curation protocols so that the data can be harmonised with that of the 20-30 other countries, including other GERI members, to form the global SET network, systematically assessing and predicting coastal wetland responses to accelerating sea-level rise in the decades ahead.

How to cite: Goddard, M., Bennion, V., Lovelock, C., and Saintilan, N.: Assessing coastal ecosystem impacts of sea-level rise at the global scale via research infrastructure alignment, EGU General Assembly 2025, Vienna, Austria, 27 Apr–2 May 2025, EGU25-14518, https://doi.org/10.5194/egusphere-egu25-14518, 2025.

EGU25-14534 | Posters on site | ERE6.2

Harmonizing Stable Isotope Data in Australia: The isotopes.au Platform for Enhanced Data Sharing and Collaboration 

Nina Welti, Wayne Noble, Geoff Fraser, Lian Flick, Christoph Gerber, Steph Hawkins, Cath Hughes, Fabian Kohlmann, Tim Stobaus, Axel Suckow, Moritz Theile, Kathryn Waltenberg, and Xinyan Zhang

Large volumes of isotope data have been collected across many scales and for a diverse range of purposes. From international and national scale monitoring and measurement efforts to short term assessments such as academic projects and citizen science efforts.  These all continue to contribute to creating significant data assets. Yet, the difficulty extracting and integrating these data resources into workflows limits the potential value.  Data collection, management and analysis efforts are siloed by funding models and contractual agreements, resulting in a fragmented data landscape.

In Australia, environmental isotope data in environmental media, such as water, soil, rocks, plants and animals, have been accumulated over many decades in public organisations including federal and state government agencies and universities. Federal science agencies are key custodians of such data and already disseminates data through established organizational channels, such as the CSIRO Data Access Portal (DAP) and Geoscience Australia's Portal Core. However there remains an ambiguity about an institutional mandate for collecting and disseminating data, leading to a lack of coordination and sharing.

We present the process of harmonizing publicly held stable isotope data from Australian public organisations into a coherent user experience. Data across multiple Australian organisations has been harmonised through an interoperable architecture and common ontology, co-developed with wide consultation across the stable isotope community in Australia. This includes implementing robust data collection strategies, ensuring data quality control, and transparent data stewardship governance.

Existing data silos of big data repositories were translated in an aligned manner through a flat ontology, so data can be gathered and reused across different isotopic data sources. This was done while maintaining FAIR standards and preserving the autonomy of source institutions' internal data structures and governance systems. The isotopes.au platform and ontology are presented as a bottom-up solution with an additive architecture to be flexible across multiple future applications.

The goals of this multi-institutional effort are to create greater usability and availability of publicly-held data, increase collaboration of research infrastructure, and realise greater value from public data.  This supports good outcomes for both private and public usage. The next step is to expand the network of connected data sources and facilitate development of modelling applications supported by isotopes.au.

By leveraging big data through platforms like isotopes.au and fostering international collaboration, Australia and Europe can work together to establish robust and efficient data sharing mechanisms

How to cite: Welti, N., Noble, W., Fraser, G., Flick, L., Gerber, C., Hawkins, S., Hughes, C., Kohlmann, F., Stobaus, T., Suckow, A., Theile, M., Waltenberg, K., and Zhang, X.: Harmonizing Stable Isotope Data in Australia: The isotopes.au Platform for Enhanced Data Sharing and Collaboration, EGU General Assembly 2025, Vienna, Austria, 27 Apr–2 May 2025, EGU25-14534, https://doi.org/10.5194/egusphere-egu25-14534, 2025.

EGU25-14907 | Orals | ERE6.2

EcoPlots - The data Integration platform for systematic site-based surveys 

Siddeswara Guru, Javier Sanchez Gonzalez, Avinash Chandra, Arun Singh Ramesh, Junrong Yu, and Gerhard Weis

Harmonised ecology systematic survey site-based data is critical for trans-geography and trans-disciplinary research. However, integrating site-based survey data from multiple sources remains challenging due to the lack of data representation and exchange standards. 

TERN, Australia’s trusted name in research infrastructure development, has developed EcoPlots to integrate site-based survey data from multiple sources and provide integrated search and access capabilities. EcoPlots map source data to a standard information model and allow users to search based on multiple regions, data sources, methods used in the data collection, feature types, parameters, and observation date ranges. 

Users can also search for species, filter parameters and attributes with exact values and ranges. They can download data in multiple formats, including a comprehensive ontology-based CSV file format, simple CSV, and GeoJSON, which contains all observations related to a site. In addition, users can mint DOIs for their search outputs to improve the reusability of data. In Australia, EcoPlots has enabled the integration of site-based survey data across research infrastructure projects, academia, and government agencies.

How to cite: Guru, S., Sanchez Gonzalez, J., Chandra, A., Ramesh, A. S., Yu, J., and Weis, G.: EcoPlots - The data Integration platform for systematic site-based surveys, EGU General Assembly 2025, Vienna, Austria, 27 Apr–2 May 2025, EGU25-14907, https://doi.org/10.5194/egusphere-egu25-14907, 2025.

EGU25-16083 | Posters on site | ERE6.2

Simplifying cost calculations for eLTER sites and platforms: A flexible web application for site managers  

Allan Souza, Syed Ashraful Alam, Terhi Rasilo, Steffen Zacharias, and Jaana Bäck

The eLTER-SO-Costs web application is a specialized tool designed to assist the eLTER (integrated European Long-Term Ecosystem, critical zone and socio-ecological Research) community in estimating the costs associated with upgrading and operating standard observations (SOs) across various eLTER sites. It provides a flexible and efficient approach to cost estimation by tailoring calculations to specific site characteristics, ensuring that cost assessments are relevant and accurate. The tool considers key factors such as the site category, habitat types, focus spheres, and the potential for co-location with other research infrastructures, all of which influence the costs. The application is designed to be highly adaptable, allowing users to customize the output according to specific needs and exclude or adjust certain predefined cost elements based on the unique conditions of their sites or platforms. The core functionality of the application allows users to input unique site-specific data and receive an automated, detailed annual cost breakdown for SOs. The eLTER-SO-Costs facilitates financial planning, enabling eLTER site managers to optimize their eLTER site management, reducing the time and effort traditionally spent on manual cost calculations, democratizing access to essential financial data for the broader eLTER community. The tool's user-friendly interface ensures that site managers and researchers, even those without expertise in cost analysis, can efficiently plan for the long-term sustainability of their sites while meeting the scientific and operational demands of ecological monitoring.  

How to cite: Souza, A., Alam, S. A., Rasilo, T., Zacharias, S., and Bäck, J.: Simplifying cost calculations for eLTER sites and platforms: A flexible web application for site managers , EGU General Assembly 2025, Vienna, Austria, 27 Apr–2 May 2025, EGU25-16083, https://doi.org/10.5194/egusphere-egu25-16083, 2025.

EGU25-20665 * | Orals | ERE6.2 | Highlight

Investigating sustainability across scales through social-ecological land-use studies in LTSER platforms 

Veronika Gaube, Claudine Egger, Bastian Bertsch-Hörmann, and Benedikt Grammer

Sustainability challenges are related to socio-ecological interactions that take place at different spatial and temporal scales. Processes at different scales are interlinked, so that place-based research - like the LT(S)ER approach in eLTER - needs to be embedded in larger, often global, contexts. This is all the more important today, as increasing geopolitical tensions, international conflicts and the increasingly frequent and severe effects of global warming are pushing the world towards a "divided world" scenario. For example, changing environmental conditions due to climate heating but also land-use change, pose major threats to biodiversity and ecosystems. Changes in their biophysical and socio-economic framework will force land users to rethink and adapt their land management strategies in terms of land cover and land-use intensity. To link societal and environmental drivers of land use change, we developed the land-use agent-based model (ABM) SECLAND. The model’s farm agents represent real-world actors who make decisions in pursuit of well-being, intrinsic motivation and global socioeconomic and political drivers for decision-making influencing their preferences for certain land-use strategies. We will present new simulations for the LTSER (Long-term socio-ecological research) region Eisenwurzen in Austria, for which we calibrated the model with quantitative census data, supplemented by qualitative data from interviews and workshops with stakeholders to represent the specific conditions of the study region. Model simulations produce spatially explicit parcel-level land use maps. Previous land-use trajectories proposed strong shifts toward organic and extensive agriculture as well as forest transition as result of (grass-) land abandonment. We refine these forecasts by focusing on farmers’ perception of extreme events as climate change threats and evaluate the effects of early climate change adaptation measures on future land management. Based on this research example we will discuss the power of such models for transformative research, linking the biophysical processes of land use change to actors, institutions and power relations. Such social ecology methods and tools are important for exploring the integration of social and natural sciences in studying the sustainability of globally embedded socio-ecological systems. The investigation of social-ecological research in an RI such as eLTER can thus make a crucial contribution to the integration of local, actor-centred and participatory research carried out in LTSER regions into larger-scale models and assessments.

How to cite: Gaube, V., Egger, C., Bertsch-Hörmann, B., and Grammer, B.: Investigating sustainability across scales through social-ecological land-use studies in LTSER platforms, EGU General Assembly 2025, Vienna, Austria, 27 Apr–2 May 2025, EGU25-20665, https://doi.org/10.5194/egusphere-egu25-20665, 2025.

EGU25-21300 | Orals | ERE6.2

The Global Ecosystem Research Infrastructure (GERI): How we got here?, Where are we going? 

Henry W. Loescher, Michael SanClements, Steffen Zacharias, Tommy Bornman, Gregor Feig, and Paula Mabee

Recognizing that contemporary environmental challenges transcend geopolitical boundaries, the Global Ecosystem Research Infrastructure (GERI) was formed to address the nature and magnitude of these challenges through cross-border global perspectives and collaborations.  GERI brings together six major ecosystem research infrastructures (RIs) (i.e., SAEON in South Africa, TERN in Australia, CERN in China, NEON in the USA, and ICOS and eLTER in Europe) to federate the programmatic work needed for concerted operation, collaborations, and the provisioning of interoperable data and services.  Here, we present the historical activities that brought these RIs together, establishing a structured governance, and current overview of GERIs data harmonization and common services.  We will also present current programmatic challenges as GERI continues to develop internationally and seek community input and involvement.

How to cite: Loescher, H. W., SanClements, M., Zacharias, S., Bornman, T., Feig, G., and Mabee, P.: The Global Ecosystem Research Infrastructure (GERI): How we got here?, Where are we going?, EGU General Assembly 2025, Vienna, Austria, 27 Apr–2 May 2025, EGU25-21300, https://doi.org/10.5194/egusphere-egu25-21300, 2025.

EGU25-2335 | Posters on site | SSS9.5

Towards Green Initiatives: Advancing Root Zone Monitoring Using Non-Invasive Geophysical Techniques 

Panagiotis Kirmizakis, Arya Pradipta, Nektarios Kourgialas, Nikos Papadopoulos, and Pantelis Soupios

Aligned with Saudi Arabia’s Vision 2030 Green Initiative, this study presents an innovative approach to sustainable agriculture in hyper-arid regions by integrating advanced geophysical methods to monitor tree root water uptake (RWU). The research highlights the combined use of modeling through HYDRUS-1D and Electrical Resistivity Imaging (ERI) for non-invasive root zone monitoring under controlled experimental conditions. The findings address critical challenges in agricultural water management in arid environments, where extreme temperatures and sandy soils significantly impact water dynamics and crop sustainability. RWU patterns of a citrus tree were simulated using HYDRUS-1D under varying soil and climatic conditions. The results revealed that the highest RWU rates occurred in the upper 30 cm of soil, predominantly during the morning. As temperatures increased, RWU activity shifted more profoundly into the soil profile. These insights are crucial for optimizing precision irrigation strategies in water-scarce regions. The model calibration utilized real-time soil moisture data collected through innovative 3D and 4D ERI methods—a seven-month experiment conducted in a controlled outdoor environment in Dhahran, Saudi Arabia. The experimental setup included a 2m x 2m x 2m wooden tank filled with sandy soil, in which a lemon tree was planted and monitored using ERI techniques. The 3D and 4D geoelectrical models captured temporal and spatial variations in root zone moisture content during irrigation events, providing unprecedented insights into subsurface water distribution and root activity dynamics.

A key outcome of the research was the successful detection of root activity through resistivity anomalies, confirming the potential of ERI as a non-invasive tool for root zone monitoring. This novel approach to root zone monitoring offers significant advantages over traditional methods. Unlike invasive techniques, such as soil coring, ERI provides high-resolution data without disrupting the natural state of the root system. Additionally, the continuous monitoring capability of ERI enables dynamic observation of root water uptake patterns over time, supporting the development of more efficient irrigation and water management practices. Integrating geophysical methods with numerical modeling presents a scalable and sustainable solution for addressing water management challenges in agriculture. This research improves water use efficiency, reduces environmental impact, and enhances crop productivity in hyper-arid regions by providing actionable insights into root zone moisture dynamics. The findings have broad applications in precision agriculture and environmental management. They underscore the importance of adopting innovative, non-invasive technologies to optimize resource utilization and achieve sustainable development goals in water-scarce regions.

How to cite: Kirmizakis, P., Pradipta, A., Kourgialas, N., Papadopoulos, N., and Soupios, P.: Towards Green Initiatives: Advancing Root Zone Monitoring Using Non-Invasive Geophysical Techniques, EGU General Assembly 2025, Vienna, Austria, 27 Apr–2 May 2025, EGU25-2335, https://doi.org/10.5194/egusphere-egu25-2335, 2025.

EGU25-2603 | ECS | Posters on site | SSS9.5

Continuous Spatiotemporal Sensing of N2O through an Optical Web 

Vladislav Sevostianov, Paul Guiguizian, Josh Collins, and Mark Zondlo

Emissions of greenhouse gases from the agricultural sector vary in space and time, leading to hot spots and hot moments with large variability between farms. Large hot spots can exhibit enhancements of only a few ppbv above background and last on time scales of hours to days. For constraining N2O emissions and developing reduction strategies, detailed source characterization on emissions (impacts of fertilization type and timing, agricultural practices, soil conditions, etc.) is required. To this end, we developed and deployed in a soybean field a laser tomographic imaging system for N2O mapping and associated emissions quantification. A pair of continuous wave quantum cascade lasers scan across a field to an array of inexpensive mid-IR reflectors lining its perimeter, casting an optical web over an agricultural field. Each laser is tower mounted with a gimbal to aim the beams at various retroreflectors spread around the perimeter of the agricultural field. Each scan takes ~37 minutes and operates autonomously. Multiple retroreflectors are needed to create the high-resolution optical web, but traditional retroreflector cubic prisms are too bulky, expensive, and delicate for such field use. Consequently, we developed custom, thin (4 mm thick) plastic retroreflectors for the mid-IR with reflectivities reaching ~86% which are broadband across the entire infrared and perform better than traditional corner cubes. FPGA electronics ensure a low power (25 W/tower) system for remote field use. In the deployed configuration, 32 path-integrated overlapping measurements from two separate laser towers are combined for full mapping of N2O over the field through a computed tomographic reconstruction. A Monte Carlo approach is used for inversion modeling to locate the plume location to within two meters and estimate the emission rate to within 10% on acre sized fields. The same techniques and tools developed can readily be adapted to other gases like methane and ammonia for other applications in agricultural and industrial settings.

How to cite: Sevostianov, V., Guiguizian, P., Collins, J., and Zondlo, M.: Continuous Spatiotemporal Sensing of N2O through an Optical Web, EGU General Assembly 2025, Vienna, Austria, 27 Apr–2 May 2025, EGU25-2603, https://doi.org/10.5194/egusphere-egu25-2603, 2025.

EGU25-5339 | ECS | Posters on site | SSS9.5

Mapping 3D Root Zone Soil Moisture of GPR Data Based on Deep Learning 

Kexin Liu and Yonghui Zhao

Traditional methods for soil moisture prediction often face challenges in providing comprehensive spatial and temporal assessments of root zone soil moisture (RZSM) in complex soil environments. This study proposes a novel approach based on the convolutional neural network (CNN) for predicting average soil moisture based on images obtained from ground penetrating radar (GPR) data. The CNN is structured in two main stages: classification and regression. First, the CNN classifies GPR images of tree roots into distinct moisture content categories. Then, the pre-trained classification network is adapted using transfer learning to perform regression tasks, predicting continuous soil moisture values. To enable 3D non-invasive mapping of RZSM, we apply adaptive inverse distance weighted interpolation to reconstruct the distribution of soil water storage at various depths, ultimately generating a 3D visualization of RZSM. Finally, we validate the proposed approach using both synthetic and field data of GPR. The root mean square error between the soil moisture content predicted by this approach and the actual moisture content of the synthetic model, as well as the moisture content obtained in a field experiment, is less than 0.02 m3·m−3. This new approach for mapping RZSM holds great potential for enhancing root zone water management and promoting sustainability.

How to cite: Liu, K. and Zhao, Y.: Mapping 3D Root Zone Soil Moisture of GPR Data Based on Deep Learning, EGU General Assembly 2025, Vienna, Austria, 27 Apr–2 May 2025, EGU25-5339, https://doi.org/10.5194/egusphere-egu25-5339, 2025.

EGU25-6817 | Posters on site | SSS9.5

Calibration and Field Measurements of a Scalable Electromagnetic Induction System (SELMA-RB) for Agricultural Applications 

Markus Dick, Zimmermann Egon, Huisman Johan Alexander, Mester Achim, Wüstner Peter, Ramm Michael, Scherer Benedikt, Bernard Julie, Dogar Salar Saeed, Brogi Cosimo, and Natour Ghaleb

In precision farming, more and more methods are being developed and used for efficient and environmentally friendly farming of agricultural land. Technical solutions for rapid mapping of soil parameters help to enable more efficient field cultivation. Non-invasive methods, such as electromagnetic induction (EMI), are advantageous for fast mapping. These systems measure the electrical conductivity of the soil and enable the determination of various soil parameters (e.g. soil stratification, water content, fertilizer concentration). 
For a depth-resolving measurement, which requires a large number of different coil separations and orientations, multiple surveys with different commercial EMI devices are usually necessary. To simplify the application in the field, a modular EMI system was developed that enables simultaneous measurements with flexible coil spacing.
A temperature drift correction and a model-based offset calibration were carried out as part of the measurement data pre-processing. Two approaches for calibrating the offset were tested.
In the first approach, the EMI device was positioned over a pool of water at different heights, with the water modeled as a homogeneous layer to calculate the offset. In the second approach, the system was calibrated by placing it at different heights above a natural soil of an agricultural area.
To evaluate the quality of the EMI measurements, the apparent soil conductivity was mapped with the SELMA-RB system (twelve separations) and a commercial CMD measuring system (six separations, CMD Mini Explorer) on a test field (230 m x 160 m) near Jülich, Germany. The field was measured within approximately one hour by pulling the device with an ATV at 6-8 km/h with 4 m line spacing. A comparison of the conductivity maps and the calibration data are presented. 

How to cite: Dick, M., Egon, Z., Johan Alexander, H., Achim, M., Peter, W., Michael, R., Benedikt, S., Julie, B., Salar Saeed, D., Cosimo, B., and Ghaleb, N.: Calibration and Field Measurements of a Scalable Electromagnetic Induction System (SELMA-RB) for Agricultural Applications, EGU General Assembly 2025, Vienna, Austria, 27 Apr–2 May 2025, EGU25-6817, https://doi.org/10.5194/egusphere-egu25-6817, 2025.

EGU25-7257 | ECS | Posters on site | SSS9.5

A Bio-Physical Model for Estimating Leaf Area Index (LAI) UsingSoil Measurements. 

Kennedy Mugendi Muthamia, Pedro Berliner, Offer Rozenstein, Eran Tas, Iael Raij Hofman, and Naftali Lazarovitch

Leaf Area Index (LAI), the total one-sided area of leaves per unit ground area is an
important parameter in fields of science such as agriculture, ecology, forestry among
other fields of science as leaf surfaces are the main areas for energy and mass
exchange. Direct measurement of Leaf Area Index (LAI) can be destructive or time-
consuming, leading to the development of indirect methods. These approaches often
require field personnel or rely on satellites, which may have limited temporal resolution
for certain applications. Recognizing that more leaves on a plant can enhance energy
canopy interception and potentially lower soil surface energy, we aimed to explore the
relationship between Leaf Area Index (LAI) and soil temperature response. We grew
processing tomatoes (H4107) in southern Arava, Israel, and monitored Leaf Area Index
(LAI) using a Sentinel-2 based model, along with soil temperatures directly beneath the
plant at 15 cm and 30 cm depths throughout the season. In addition to a decrease in
calculated soil surface temperature amplitude with increase in LAI, the results showed a
strong linear relationship between the LAI and the minimum temperature difference
between the two depths (R 2  ~ 0.7). These findings indicate a potentially low-cost, high
temporal resolution approach to estimate LAI from soil data.

How to cite: Mugendi Muthamia, K., Berliner, P., Rozenstein, O., Tas, E., Raij Hofman, I., and Lazarovitch, N.: A Bio-Physical Model for Estimating Leaf Area Index (LAI) UsingSoil Measurements., EGU General Assembly 2025, Vienna, Austria, 27 Apr–2 May 2025, EGU25-7257, https://doi.org/10.5194/egusphere-egu25-7257, 2025.

Agricultural soil monitoring is essential for fostering sustainable farming practices and safeguarding environmental health, particularly in productive regions like the Ferrara alluvial plain in the Po Valley. This area, renowned for its rich agricultural heritage, faces increasing vulnerabilities due to climate change and human activities. Challenges include frequent droughts, overexploitation of soils, and unsustainable farming practices, which lead to soil degradation, reduced crop yields, and elevated greenhouse gas emissions. Traditional soil monitoring methods often lack the spatial and temporal insights needed to address these issues effectively, limiting farmers’ ability to implement conservation strategies.

To address these challenges, there is growing emphasis on integrating geophysical methods with geochemical analyses to enhance soil characterization and monitoring at the field scale. Geophysical techniques such as Electrical Resistivity Tomography (ERT), Electromagnetic Induction (EMI), and Ground-Penetrating Radar (GPR) provide non-invasive, in-situ assessments of soil properties, including moisture content, porosity, and soil structure. These methods efficiently characterize large agricultural areas, offering insights to depths of 150 cm at a relatively low cost.

Complementary geochemical analyses of soil samples from specific horizons (e.g., 0–50 cm, 50–100 cm) offer detailed data on soil salinity, organic matter content, and isotopic signatures. This information helps assess salinity impacts, trace organic matter depletion, and evaluate nutrient loss. However, geochemical sampling is limited by its localized scope and costs. In contrast, geophysical methods offer broader spatial coverage and high spatial resolution, enabling the creation of detailed 2D and 3D maps. Nonetheless, they are less precise in quantifying specific properties, highlighting the need for a combined approach that leverages both methodologies.

This integrated approach was applied to agricultural lands in Ferrara province, focusing on reclaimed lowlands near the Adriatic Sea with peaty soils particularly vulnerable to salinity. Geophysical analysis, conducted with an EM-400 Profiler, was paired with laboratory-based geochemical analyses (EA-IRMS and GroLine portable hydroponic probe) to gain a comprehensive understanding of soil conditions. The study correlated geophysical parameters, such as electrical conductivity, with geochemical results to depict spatial soil variations.

This methodology supports precision agriculture by optimizing irrigation schedules and fertilizer application based on spatially explicit electrical conductivity data. Such practices enhance resource use efficiency, reduce environmental degradation, and promote sustainable soil and water management. Moreover, the approach aids in designing remediation strategies for contaminated sites, improving soil quality and environmental health.

In the Ferrara plain and similar areas, this synergistic methodology equips stakeholders with tools to address interconnected challenges like climate change, salinization, organic matter degradation, and fertility decline. It provides essential insights for informed agricultural management, ensuring long-term sustainability in vulnerable landscapes.

This work is supported by the Emilia-Romagna Region fund “Territorio: transizione tecnologica, culturale, economica e sociale verso la sostenibilità pr fse+ 2021/2027 priorità 2.”

How to cite: Sobbe, A., Rizzo, E., and Bianchini, G.: Geophysical and geochemical data integration for agricultural soil monitoring andprevention of the effects of salinity and soil organic matter in the Province of Ferrara (Northern Italy), EGU General Assembly 2025, Vienna, Austria, 27 Apr–2 May 2025, EGU25-8196, https://doi.org/10.5194/egusphere-egu25-8196, 2025.

EGU25-8723 | ECS | Posters on site | SSS9.5 | Highlight

From root to leaf: Multi-sensor monitoring of the soil-plant-atmosphere continuum 

Valentin Michels, Simon De Cannière, Gina Lopez, Maximilian Weigand, Kevin Warstat, Bastian Siegmann, Sabine Seidel, Onno Muller, Uwe Rascher, Harry Vereecken, and Andreas Kemna

The soil-plant-atmosphere continuum (SPAC) is the interconnected water pathway between soil, plants, and atmosphere, and plays a pivotal role in distribution of water and nutrients in terrestrial ecosystems. In order to understand and predict the dynamics between its components, especially in the context of advancing climate change, it is essential to investigate both the above- and below-ground part of the SPAC with high temporal resolution. However, while methods to observe the above-ground part of the plant are frequently employed, due to its inaccessibility, in-situ measurements of root system activity are still scarce.

In this study, we employed a novel combination of sensors at the plot scale to obtain a more complete picture of the dynamics between root water uptake, plant photosynthesis and transpiration, and atmospheric conditions. During the growth season of 2023, we studied the rhizosphere beneath maize plots using spectral electrical impedance tomography, a method which has been shown to be sensitive to soil water content dynamics and root structure and activity. Water transport through the plant stem was monitored via sap flow sensors, while photosynthetic activity and atmospheric conditions were measured continuously using a sun-induced fluorescence sensor and a weather station, respectively. Time series data were analyzed across multiple time windows, focusing on environmental events such as precipitation, prolonged dry periods, and variations in cloud cover.

Our results demonstrate we achieved consistently high-quality electrical impedance data throughout the monitoring period. The electrical imaging results exhibit spatially and temporally well resolved diurnal variations in the subsurface polarization behaviour, suggesting a sensitivity to root ion uptake processes. In particular, variability in polarization signatures was more pronounced near the surface early in the season, and shifted to deeper layers later in the season. We attribute this behaviour to the seasonal shift in water availability towards deeper layers, causing a deeper active root water uptake zone. Additionally, rain events promote polarization variability in shallow soil layers. Above-ground data showed cyclical variations both for sap flow and fluorescence measurements and revealed a clear connection to meteorological conditions such as cloud cover or precipitation, confirming the coupling of above-ground plant activity to the atmosphere. Together, the below- and above-ground observations provide a holistic view of the processes within the SPAC, and allow analysis of the complex relations between transpiration, photosynthesis, and root water uptake. To conclude, this study contributes to a deeper understanding of water uptake and plant activity dynamics in crop systems and may inform the breeding of adapted plant varieties, the optimization of agricultural management practices, and the calibration of physiological models describing the SPAC.

How to cite: Michels, V., De Cannière, S., Lopez, G., Weigand, M., Warstat, K., Siegmann, B., Seidel, S., Muller, O., Rascher, U., Vereecken, H., and Kemna, A.: From root to leaf: Multi-sensor monitoring of the soil-plant-atmosphere continuum, EGU General Assembly 2025, Vienna, Austria, 27 Apr–2 May 2025, EGU25-8723, https://doi.org/10.5194/egusphere-egu25-8723, 2025.

EGU25-9440 | ECS | Posters on site | SSS9.5

Delineating Agricultural Management Zones using Unsupervised Classification of Electromagnetic Induction and Remote Sensing Data 

Salar Saeed Dogar, Cosimo Brogi, Dave O'Leary, Marco Donat, Harry Vereecken, and Johan Alexander Huisman

An accurate delineation of management zones that reliably characterizes within-field heterogeneity is essential to optimize resources and improve yields in precision agriculture. Non-invasive hydro-geophysical methods, such as electromagnetic induction (EMI), offer a rapid approach to delineating agricultural management zones that are based on subsurface soil characteristics that influence crop growth. Integrating additional data sources, such as remote sensing imagery and yield maps, can further enhance the quality and applicability of these management zones. However, integrating above-ground and subsurface information from multiple datasets for large agricultural fields poses challenges in data harmonization, analysis, and methodological consistency. Additionally, the impact of different dataset combinations on management zone delineation remains underexplored.

In this study, we propose a robust processing workflow that combines unsupervised classification and statistical validation to delineate management zones using proximal and remote sensing. This method was applied to a 70-ha field of the patchCROP experiment in Tempelberg (Germany). Part of this field consists of 30 small patches (0.5 ha each) that are managed separately since 2020. EMI data were collected in four campaigns between 2022 and 2024 by using a CMD Mini-Explorer and a CMD Mini-Explorer Special-Edition (featuring 3 and 6 coil separations, respectively). Maps of measured ECa were standardized using z-score normalization (ECaz) to reduce the effect of measuring in different environmental conditions. Additionally, seven satellite images of the 2019 growing season with 3 m resolution (PlanetScope) were used to obtain maps of NDVI development. Three dataset combinations were investigated: 1) ECaz maps, 2) NDVI maps, and 3) a combination of the EMI and NDVI maps. The Self-Organizing Maps (SOM) machine learning technique was used to cluster these three datasets. The optimal number of clusters was determined using the Multi-Cluster Average Standard Deviation (MCASD) method. Nine years (2011-2019) of yield data and detailed soil information up to 100 cm depth were used to refine the cluster numbers by using Tukey's post-hoc analysis and to assess the accuracy of the clustered maps with two-tailed t-tests in a subsequent step.

The EMI-based clustering resulted in 4 management zones. A comparison of adjacent zones showed that 15 out of 21 soil properties and 23 out of 27 yield combinations were statistically separated. The average p of all these combinations was 0.113 and 0.045, respectively. The NDVI-based clustering resulted in 3 zones with 10 out of 14 soil properties and 18 out of 18 yield combinations showing significant separation (average p of 0.166 and 0.001, respectively). Overall, the EMI-based zones better captured the patterns in soil heterogeneity, whereas the NDVI-based zones better matched yield maps. The combined EMI-NDVI clustering resulted in 3 zones, and all the combinations of soil properties and yield showed significant separation. This EMI-NDVI derived 3 m resolution map better represented soil properties and yield maps, highlighting the potential of integrating multi-source datasets for field management and, ultimately, agricultural productivity. It represents the base for actionable insights not only for precision agriculture applications such as fertilization and irrigation, but also for environmental modelling or to guide future sampling campaigns.

How to cite: Dogar, S. S., Brogi, C., O'Leary, D., Donat, M., Vereecken, H., and Huisman, J. A.: Delineating Agricultural Management Zones using Unsupervised Classification of Electromagnetic Induction and Remote Sensing Data, EGU General Assembly 2025, Vienna, Austria, 27 Apr–2 May 2025, EGU25-9440, https://doi.org/10.5194/egusphere-egu25-9440, 2025.

EGU25-11068 | ECS | Posters on site | SSS9.5

Time-lapse resistivity and seismic profiles (Vp, Vs) for Subsurface Characterization: A Case Study in a Well-Documented Agricultural Field 

Léna Pellorce, Rémi Valois, Claude Doussan, and Arnaud Mesgouez

Geophysical prospection offers non-invasive tools to investigate subsurface properties, that can be particularly useful in agricultural contexts. This study focuses on an agricultural field managed by INRAE (French National Research Institute for Agriculture, Food and Environment), under a Mediterranean climate (Avignon, FR). The site benefits from characterization of lithological profiles, soil physico-chemical analyses, and continuous monitoring of groundwater table depth as well as soil water content at a few depths.

We employed Electrical Resistivity Tomography (ERT) and seismic methods to develop 1D and 2D profiles of resistivity and seismic wave velocities (Vp and Vs, for the compressional and shear waves, respectively). Apparent resistivity data from ERT were inverted using pyGIMLi to generate 2D resistivity models, while first-arrival travel times from seismic data were similarly inverted with pyGIMLi to produce Vp profiles. Surface wave were analysed by Multichannel Analysis of Surface Waves (MASW) to derive Vs through dispersion curve inversion following the SWIP workflow developed by Pasquet and Bodet (2017). These profiles provide insights into subsurface structure and heterogeneity, reflecting variations in soil and lithological properties, as well as water content variation.

While this study focuses on presenting resistivity, Vp, and Vs profiles, the integration and joint inversion of these seimic and resistivity datasets for detailed hydrological and geomechanical characterization is planned as part of future work in this doctoral research. This approach aims to enhance our understanding of water distribution and soil mechanical properties in agricultural environments.

How to cite: Pellorce, L., Valois, R., Doussan, C., and Mesgouez, A.: Time-lapse resistivity and seismic profiles (Vp, Vs) for Subsurface Characterization: A Case Study in a Well-Documented Agricultural Field, EGU General Assembly 2025, Vienna, Austria, 27 Apr–2 May 2025, EGU25-11068, https://doi.org/10.5194/egusphere-egu25-11068, 2025.

EGU25-11369 | ECS | Posters on site | SSS9.5

Investigating the effect of maize roots under different nitrate applications using crosshole GPR 

Sophia Schiebel, Lena Lärm, Felix Maximilian Bauer, Andrea Schnepf, Harry Vereecken, and Anja Klotzsche

Non-invasive imaging of small-scale features within the soil–plant continuum can help to advance sustainable agriculture by optimizing agricultural treatments and protecting natural resources such as groundwater and soil. This study investigates the potential of different ground penetrating radar (GPR) frequencies with two primary objectives: monitoring soil water content (SWC) variations in maize root zones and detecting soil electrical conductivity variations caused by different nitrate concentrations. Therefore, weekly horizontal crosshole GPR measurements were conducted during a maize growing season using 200 MHz and 500 MHz GPR antennae at the upper field minirhizotron facility in Selhausen, Germany. Within the facility, horizontal rhizotubes are installed in three sets of three columns, with each column containing six rhizotubes at depths ranging from 0.1 m and 1.2 m and a horizontal rhizotube spacing of 0.75 m. These were used to acquire time-lapse measurements: horizontal zero-offset profiling (ZOP) collected between 0.2 m and 1.2 m and root images at all six depths. While variations in SWC and root presence are primarily linked to the permittivity, different nitrate concentrations are expected to cause variations in soil electrical conductivity, which affects the GPR signal attenuation resulting in a lower signal amplitude in areas of higher nitrate concentrations and vice versa. The permittivity of the soil is calculated for each position using the estimated travel time and the rhizotube spacing. Variations in GPR signal amplitudes are analyzed by calculating the envelopes and identifying their maximum at each position. For a time-lapse comparison, the static and dynamic influences are removed from the permittivity and maximum envelopes by using a statistical trend-correction approach. When both data are compared along the tube, the 500 MHz provides more details and structures than 200 MHz.  Pronounced root presence in the travel times are particularly evident at the 500 MHz frequency. Trend-corrected permittivity results show increased variability over time up to depths of 0.6 m and 0.8 m, correlating with greater root presence, while maximum envelopes shows greater variability only at 0.2 m. Preliminary results suggest that different nitrate concentrations affects the GPR data, with both frequencies indicating decreased maximum amplitudes in areas with higher nitrate concentration. At some locations in deeper layers, a decrease in maximum envelopes was observed while no increase in root presence was noticed, which could indicate zones of preferential flow of nitrate. The combined interpretation of permittivitiy and envelopes variations can help to disentangle the effect of SWC, roots and/or nitrate. These results highlight the potential of GPR as a non-invasive tool to accurately map root zones and to assess spatial variations in nitrate concentrations, thereby enhancing precision farming practices and promoting sustainable crop management.

How to cite: Schiebel, S., Lärm, L., Bauer, F. M., Schnepf, A., Vereecken, H., and Klotzsche, A.: Investigating the effect of maize roots under different nitrate applications using crosshole GPR, EGU General Assembly 2025, Vienna, Austria, 27 Apr–2 May 2025, EGU25-11369, https://doi.org/10.5194/egusphere-egu25-11369, 2025.

EGU25-12387 | ECS | Posters on site | SSS9.5

Soil-compaction imaging using geoelectrical methods in a grassland field of Buenos Aires, Argentina. 

Alejo Gabriel Gomez, Santiago Perdomo, Alejandro Romero Ruiz, Germán Rubino, and Simon Lissa

The soil is an essential natural resource that supports agriculture and forestry, and plays a crucial role in global hydrological processes. Traditional methods used to study soil properties are commonly based on laboratory measurements on core samples, sporadic field measurements on soil profiles or visual evaluation of soil traits. These methods provide detailed information of soil physical properties, yet they offer limited capabilities to quantify and monitor spatial and temporal variations about soil physical properties. Geoelectrical methods, due to their non-invasive nature, sensitivity to soil physical properties and robustness in their application, are increasingly used to complement traditional observations and fill spatial and temporal gaps of information on soil properties. 

In this work, we present a case study of using geoelectric methods to investigate soil compaction. We measured Electrical Resistivity Tomography (ERT) data before and after an experimental soil compaction event and for two different levels of compaction (ten passages of a five-ton tractor and 4 passages of a ten-ton vehicle) in an agricultural field. The field of study was a grassland, that had remain unmanaged for approximately four decades, located in the  Santa Escolástica agricultural site, in San Antonio de Areco, Buenos Aires, Argentina. We collected two (7.75m long and 0.25m electrode spacing) ERT transects (before and after the compaction event) along the wheel tracks, and a third similar transect perpendicular to the wheel tracks (only after compaction). In addition, a soil pit was dug to conduct a visual analysis of the soil layering.

The ERT transects were independently inverted using the res2dinv software to obtain an image of the electrical resistivity of the three soil profiles. Results indicate a reduction in soil electrical resistivity of up to 25% in the top soil after the 4 passages of the 10 ton vehicle and 20% for the 10 passages of the 5 ton tractor. Correspondingly, in the upper subsoil layer at a depth of 0.55 m, we estimated a reduction of up to 10% for the first compaction case and negligible reduction for the second compaction treatment. Ongoing and future work will focus on enhancing the inversion results by incorporating geometrical constrains and simultaneously collected ground penetrating radar data.

How to cite: Gomez, A. G., Perdomo, S., Romero Ruiz, A., Rubino, G., and Lissa, S.: Soil-compaction imaging using geoelectrical methods in a grassland field of Buenos Aires, Argentina., EGU General Assembly 2025, Vienna, Austria, 27 Apr–2 May 2025, EGU25-12387, https://doi.org/10.5194/egusphere-egu25-12387, 2025.

Even though availability of water and nutrients are the main limitations for grain production globally, little is known about the rooting system, the critical plant organ involved in accessing soil water and nutrients. We know that the crop’s genetic background (G), crop management (M), and the environment (E) interact to alter the architecture of the rooting system. However, root traits are hard to measure, and the lack of quick, cheap, accurate, and functional root phenotyping approaches in the field has limited the capacity of breeding, agronomy, and precision agriculture to develop traits and services for farmers. Recent advances in high-resolution root-zone soil moisture monitoring show potential to reveal genotypic and management differences in crop root systems across contrasting environments. This paper describes novel approaches for the high-throughput phenotyping of functional root traits of value for yield and yield stability. First, we introduce the phenotyping approach for in-situ 3D characterisation of sorghum water use and the root system in soil profiles. Second, we demonstrate its application to characterise two functional root traits, i.e., maximum rooting depth (MxRD), and an index of root activity (RAindex), and their phenotypic plasticities. The experiment results show that the proposed root phenotyping method could capture G´E´M effects at different crop growing stages. The plasticity of functional root traits was associated with the stability of grain yield traits. Hybrids with high root plasticity tend to have more stable grain numbers and grain weights. There is valuable genetic diversity in the mean value and plasticity of root traits that could be used to match root phenotypes to target production environments. The root phenotyping approach can be a valuable tool for understanding the dynamic interactions between root function, root architecture and yield traits in the field under variable environments.

How to cite: Zhao, D.: High-throughput root phenotyping in the field using electromagnetic induction sensors: Implications for breeding and agronomy, EGU General Assembly 2025, Vienna, Austria, 27 Apr–2 May 2025, EGU25-13598, https://doi.org/10.5194/egusphere-egu25-13598, 2025.

EGU25-15134 | ECS | Posters on site | SSS9.5

Investigating the soil-plant continuum of maize crops using ground penetrating radar 

Lena Lärm, Felix Bauer, Jan Rödder, Harry Vereecken, Jan Vanderborght, Jan van der Kruk, Andrea Schnepf, and Anja Klotzsche

The soil-plant continuum of agricultural crops is regulating key processes that affect plant performance and agricultural productivity. As climate change impacts agricultural systems, understanding these processes will become increasingly important, especially when increasing yield productivity, while minimizing the environmental footprint are key aspects. Quantifying the impact of climate change and management practices on crop growth requires understanding about the dynamics of the root systems of crops. Ground penetrating radar (GPR) combined with root imaging and modeling techniques offers a unique opportunity to study these dynamics in function of soil, climate and management. As a first step, this study examined the relationship between root development and soil dielectric permittivity variability using root images and 200 MHz time-lapse horizontal crosshole GPR at two field minirhizotron (MR) facilities in Selhausen, Germany. The data was acquired over three maize growing seasons, in 7-m long rhizotubes at six different depths, ranging between 0.1 m - 1.2 m and for three different plots with varying agricultural treatments. We calculated trend-corrected spatial permittivity deviations to isolate root-related effects by removing static and dynamic influences caused by soil heterogeneity and changing weather conditions. This permittivity deviation increased during the growing season, correlating with root presence. Cross-correlation analysis between permittivity variability and root volume fraction yielded in coefficients of determination above 0.5 for half of the data pairs. From this study some questions remained unanswered, such as identifying individual roots or quantifying the influence of roots and above-ground shoot on the GPR signal. Subsequently, synthetic forward modeling was conducted using the data acquisition of the previous study as a template and the open-source electromagnetic simulation software gprMax. GPR traces were modeled and analyzed for scenarios with varying soil-plant continuum compositions, including soil, roots, and above-ground shoots in two- or three dimensions. The models incorporated realistic root contributions based on trench wall counts. We found that the presence of roots, which resulted in a permittivity increase on one hand, had a higher influence on the GPR signal than the above-ground shoot and on the other hand the roots affected the first arrival time and amplitudes of the GPR signal. Hence more sophisticated analysis techniques such as full-waveform inversion are necessary. Furthermore, we introduced an approach to derive the soil water content within the soil-plant continuum, where the CRIM petrophysical model was extended with the root phase. This showed that neglecting the root phase leads to overestimation of soil water contents.

How to cite: Lärm, L., Bauer, F., Rödder, J., Vereecken, H., Vanderborght, J., van der Kruk, J., Schnepf, A., and Klotzsche, A.: Investigating the soil-plant continuum of maize crops using ground penetrating radar, EGU General Assembly 2025, Vienna, Austria, 27 Apr–2 May 2025, EGU25-15134, https://doi.org/10.5194/egusphere-egu25-15134, 2025.

EGU25-16636 | ECS | Posters on site | SSS9.5

Transforming electrical resistivity tomographies into volumetric water content ones: a strategy for optimizing irrigation in horticulture. 

Agnese Innocenti, Riccardo Fanti, and Veronica Pazzi

Agricultural water management is becoming an increasingly actual issue in a period of severe climate changings. Sustainable water management requires adequate knowledge of soil water availability and its storage capacity.

The correct management of irrigation water requires a good knowledge of the volumetric water content (VWC) in the soil. VWC is a parameter that can be measured using soil humidity sensors, and it can help understanding how the irrigation water distributes in the soil. However, these sensors are point humidity monitoring systems, that means they provide information limited to the vertical where they are installed and do not allow a 2D or 3D reconstruction of the water content in the subsoil. As well known, Electrical Resistivity Tomographies (ERT), a non-invasive geophysical method, estimates the spatial and temporal variations of soil resistivity (and thus of its inverse, i.e., conductivity), which is linked to parameters such as water content. Unlike point-based soil moisture sensors, ERT provides a broader view of water distribution in the soil. Thus, the goal of this study was to use electrical conductivity (EC) by full 3D-ERTs and moisture sensors to estimate the volumetric water content in the soil.

The study was conducted in a field dedicated to melon cultivation, where a detailed study of the irrigation system has been carried out over the years. It was determined that the three-drip-line system with a capacity of 4.1 lh/m² is the best irrigation system for this field located in Braccagni (GR, Italy). Therefore, one plot of the field was equipped with a three-drip-line irrigation system, and 72 electrodes were installed to perform full 3D-ERT measurements. Additionally, two PVC tubes, sealed at the base and with an opening at the surface, were installed to allow the insertion of the Diviner2000 probe and to measure soil moisture every 10 cm down to a maximum depth of 70 cm. Two ECH2O 10 HS sensors were also installed, connected to a data logger capable of recording temperature and moisture measurements every 30 min. The sensors, 15 cm in length, were installed vertically in the soil, allowing the measurement of VWC in a soil volume of 0.001 m³.

Between June and August 2023, six measurement campaigns of electrical conductivity were conducted. It is known that there is a direct relationship between EC and VWC. Therefore, the VWC data recorded by the Diviner2000 for all six acquisition times were correlated with the EC data acquired by ERTs. The two datasets (EC from ERT and VWC from Diviner2000) are in perfect agreement, showing a linear relationship with a R² of 0.96. Using the obtained regression law, it is possible to convert EC tomographies into VWC tomographies, thereby visualizing the variation of water content in the subsoil. This made it possible to understand the water distribution within the plot and to determine the percentage of water present throughout the entire root zone, not just at the points where the moisture sensors are installed.

How to cite: Innocenti, A., Fanti, R., and Pazzi, V.: Transforming electrical resistivity tomographies into volumetric water content ones: a strategy for optimizing irrigation in horticulture., EGU General Assembly 2025, Vienna, Austria, 27 Apr–2 May 2025, EGU25-16636, https://doi.org/10.5194/egusphere-egu25-16636, 2025.

EGU25-18694 | Posters on site | SSS9.5

A modelling framework for the preliminary assessment of tile drainage detection using ground-penetrating radar 

Ellen Van De Vijver, Seppe Vanrietvelde, Pablo De Weerdt, Wim Cornelis, and Philippe De Smedt

Geophysical surveys, particularly with ground-penetrating radar (GPR), have been proven useful tools for the detection and mapping of tile drainage in agricultural fields (Wienken & Grenzdorffer, 2024). However, the success of a GPR survey for this purpose depends on both the characteristics of the tile drain pipes, such as their material, diameter, and depth – which are often poorly documented – as well as environmental conditions, such as soil texture and moisture content. Furthermore, these environmental conditions can be highly variable in space and dynamic over time, adding to the challenge of assessing in advance whether a GPR survey will be worth the investment.

To assess the likelihood of successfully detecting tile drainage networks before planning a field survey, we developed a synthetic modelling framework using the open-source software gprMax (Warren et al., 2016). The framework evaluates how selected parameters influence the GPR signal, focusing on the reflection contrast expected when the electromagnetic wave interacts with a drainpipe in a simplified one-dimensional (1D) model. Whether detection is possible is determined by comparing the simulated reflection contrast with a general noise threshold typical for a time-domain GPR system with a specified centre frequency. In this study, all synthetic modelling tests were performed for a GPR system with a centre frequency of 300 MHz.

We explored the sensitivity of the GPR signal to soil texture, soil moisture content, as well as the radius, depth, and filling of the drainpipe, considering a laterally homogeneous soil profile composed of one or two layers. The validity of the modelling framework was assessed by comparing the predicted detectability with the detection success/failure in two real field cases with sandy and clayey soil types. While the synthetic model predicted feasible detection for the sandy field, no clear contrasts were visible in the radargrams after basic processing. This suggests the need for further refinement of the synthetic model, such as incorporating more complex soil variations and a more detailed representation of the drainpipe structure. Nevertheless, the modelling framework provides useful guidelines for planning and designing GPR field surveys, without requiring extensive prior information on site conditions.

Further research is recommended to explore additional centre frequencies, more complex soil structures, and the incorporation of higher-dimensional approaches (2D or even 3D) to extend the current modelling framework. However, it should balance complexity with practical applicability, as real field conditions are never entirely predictable and models must simplify certain aspects due to incomplete knowledge.

References

Warren, C., Giannopoulos, A., & Giannakis, I. (2016). gprMax: Open source software to simulate electromagnetic wave propagation for Ground Penetrating Radar. Computer Physics Communications, 209, 163–170. https://doi.org/10.1016/j.cpc.2016.08.020

Wienken, J. S., & Grenzdorffer, G. J. (2024). Non-invasive detection methods for subsurface drainage systems: A comparative review. Agricultural Water Management, 304, 109099. https://doi.org/10.1016/j.agwat.2024.109099

How to cite: Van De Vijver, E., Vanrietvelde, S., De Weerdt, P., Cornelis, W., and De Smedt, P.: A modelling framework for the preliminary assessment of tile drainage detection using ground-penetrating radar, EGU General Assembly 2025, Vienna, Austria, 27 Apr–2 May 2025, EGU25-18694, https://doi.org/10.5194/egusphere-egu25-18694, 2025.

EGU25-19478 | ECS | Posters on site | SSS9.5

Advancing Field-Scale Soil Mapping Using An Autonomous Rover With Multi-Layer Geophysical Sensors 

Davide Gabrieli, Ilaria Piccoli, Franco Gasparini, Luigi Sartori, and Francesco Morari

Geophysical methods are non-invasive techniques employed to measure the physical properties of the investigated media—primarily electrical and mechanical—while preserving the dynamics of soil structure without altering its state. These methods can be used qualitatively to detect soil anomalies and spatial heterogeneities, as well as quantitatively to correlate primary soil properties with physical measurements. Soil compaction resulting from traffic with modern agricultural machinery has significantly increased, leading to substantial impacts on soil ecosystem services and crop yields.
The quantification of soil structure and compaction has traditionally been performed through destructive soil sampling followed by, dry bulk density and porosity measurements, or through inferential methods (e.g., pedotransfer functions).
This study investigated the potential of an integrated geophysical approach using autonomous driving rover (Robotti 150D, Agrointelli-DK) for mapping soil variability and compaction status on arable land.
The experiment was conducted at the L. Toniolo experimental farm of the University of Padua on a 1-ha field comprising a complete randomize design testing two traffic treatments (conventional and controlled traffic with autonomous guidance vehicle) and four replicates covering 8 plots (130 m x 10 m). The geophysical instruments mounted on the rover included: a γ-ray detector (Agri Detector MS-2000, Medusa - NL) positioned at the front; a GPR (Stream DP, IDS - IT) and a cosmic ray neutron sensing probe (Finapp - IT) in the central section; and an electromagnetic conductivity meter (CMD-MiniExplorer, GF Instruments - CZ) mounted on a wooden sled at the rear. Measurements were conducted at a speed of 3.6 km h⁻¹, with swaths spaced every two meters. All instruments operated simultaneously and were connected to a GPS equipped with an RTK positioning system, ensuring a precision of 2 cm.
Moreover, eight (1 per plot) 3D electrical conductivity tomographies (ERTs) (Syscal Terra, IRIS - FR) were performed for each replicate on a ca. 3 m3 investigated volume (4.6 × 0.8 × 0.8 m) using a dipole-dipole array. Geophysical techniques were then complemented by traditional destructive measurements of bulk density (core method), soil penetration resistance (Eijkelkamp - NL) and soil texture on the top 1 m and by drone surveys to create a digital elevation model (DEM).
Preliminary results demonstrated that the combination of an autonomous robot with several multi-layer geophysical sensors can act as a proxy for expeditive digital soil mapping on large surfaces. Nevertheless, the ERT capability to capture the presence of resistivity anomalies and its combination with traditional method seemed fundamental to precisely adjust the multi-mapping survey.
In conclusion, the tested approach might provide a consistent set of real time data valuable also for training machine learning algorithms and give new insight to precision agriculture technique.

How to cite: Gabrieli, D., Piccoli, I., Gasparini, F., Sartori, L., and Morari, F.: Advancing Field-Scale Soil Mapping Using An Autonomous Rover With Multi-Layer Geophysical Sensors, EGU General Assembly 2025, Vienna, Austria, 27 Apr–2 May 2025, EGU25-19478, https://doi.org/10.5194/egusphere-egu25-19478, 2025.

BG3 – Terrestrial Biogeosciences

EGU25-1533 | ECS | Posters on site | BG3.1

Transition from positive to negative indirect CO2 effects on the vegetation carbon uptake 

Zefeng Chen, Giovanni Forzieri, and Alessandro Cescatti

The increase in the vegetation carbon uptake, stimulated in the last decades by the elevated CO2 concentration (eCO2), has substantially contributed to the enhancement of terrestrial carbon sink, thus playing a crucial role in mitigating climate change. Changes in the vegetation carbon uptake are affected by eCO2 through two distinct pathways. The first is the direct CO2 effect through the stimulation of the photosynthetic carbon fixation and the increase in water-use efficiency. The second is the indirect CO2 effect through the change in climate and related environmental conditions. Recent studies documented a declining trend in the direct physiological effect of eCO2 on the vegetation carbon sink because of the increasing role of other limiting factors (e.g., nutrients and water availability). Consequently, the indirect effects of eCO2 via associated climate change are expected to become increasingly important in controlling the terrestrial carbon budget. However, the current and future dynamics of such indirect CO2 effects and the underlying ecological mechanisms remain unclear. Here we investigate how the impacts of eCO2-driven climate change on growing-season gross primary production (GPP) have changed globally during the period 1982-2014, using both satellite observations and a suite of CMIP6 Earth system models, and evaluated their evolution until the year 2100 under the high emission scenario SSP5-8.5. We show that the initial positive effect of eCO2-induced climate change on global vegetation carbon uptake has declined significantly during recent decades. In this respect, this indirect effect has shifted to negative in the early 21st century, and is expected to turn firmly negative in the future. Such a decrease in the indirect effect of eCO2 appears more pronounced in northern high latitudes and occurs in combination with a concomitant decrease of the direct physiological effect of eCO2. Together, these changes will likely determine a sharp reduction of the current strong growth benefits induced by climate warming and CO2 fertilization in boreal ecosystems. The progressive weakening of the indirect CO2 effect on vegetation carbon uptake can be partially attributed to the widespread climate drying, except for some non-humid regions where the CO2 and drought-related increase in water-use efficiency potentially relaxes the water limitation to vegetation growth. These results imply that eCO2 may exert a less positive up to negative role on the terrestrial carbon uptake in the near future, ultimately reducing the ecosystems’ capacity to sequester atmospheric CO2. All together these findings contribute to a better understanding of the factors controlling the negative feedback between atmospheric CO2 concentration and the natural terrestrial sink and highlight a worrying decline in its strength that might ultimately lead to an acceleration of climate warming. Consequently, stronger reductions in anthropogenic emissions will be required to meet climate goals.

How to cite: Chen, Z., Forzieri, G., and Cescatti, A.: Transition from positive to negative indirect CO2 effects on the vegetation carbon uptake, EGU General Assembly 2025, Vienna, Austria, 27 Apr–2 May 2025, EGU25-1533, https://doi.org/10.5194/egusphere-egu25-1533, 2025.

EGU25-1590 | ECS | Orals | BG3.1

Spatial and temporal dynamics of a bark beetle-induced forest disturbance regime  

Anna Candotti, Nuno Carvalhais, Siyuan Wang, and Enrico Tomelleri

The European Alps are currently considered among the ecoregions with the highest magnitude of average bark beetle disturbance per year. We present a disturbance regime characterization based on a unique database including more than 50,000 records of ground-based bark beetle disturbance observations in the Eastern Alps for the years 2020 to 2023. The dataset was used to extract precise temporal and spatial information on disturbance events in terms of sizes, distances, intensity and frequency. Disturbance events were modeled as spatial point processes based on scale dependency (landscape-regional) and their deviation from random distributions was assessed. Parameters typically used in forest disturbance models such as clustering degree, intensity slope and probability scale were retrieved. Additionally, above-ground biomass loss was estimated. The disturbance metrics and parameters can help for the correct parameterization of forest disturbance models, and thus supporting our capability of predicting future patterns of beetle dispersal and effects on carbon stocks in the alpine region and beyond.

How to cite: Candotti, A., Carvalhais, N., Wang, S., and Tomelleri, E.: Spatial and temporal dynamics of a bark beetle-induced forest disturbance regime , EGU General Assembly 2025, Vienna, Austria, 27 Apr–2 May 2025, EGU25-1590, https://doi.org/10.5194/egusphere-egu25-1590, 2025.

Over the past few decades, China has implemented large-scale Forest Ecological Engineering Projects (FEEPs) aimed at restoring and enhancing ecosystem functions. However, global warming has exacerbated the frequency, intensity, and duration of droughts, which may undermine the positive effects of these ecological engineering programs on greening and carbon sequestration. This study utilizes remote sensing indices, namely the Normalized Difference Vegetation Index (NDVI) and Gross Primary Productivity (GPP), to represent vegetation greenness and productivity, respectively. To extract long-term vegetation change trends across eight FEEPs in China, we apply the Ensemble Empirical Mode Decomposition (EEMD) method. Additionally, a multi-scale Standardized Precipitation Evapotranspiration Index (SPEI) is used to assess the sensitivity and response of vegetation greenness and productivity to drought conditions. The results reveal a monotonic increasing trend in both NDVI and GPP across the eight FEEPs, but the rate of increase in GPP in regions such as the Shelterbelt Program for Liaohe River (SPLR), the Afforestation Program for Taihang Mountain (APTM), the Shelterbelt Program for Pearl River (SPPR), and the Coastal Shelterbelt Program (CSP) is significantly lower than that of NDVI. Before 2000, changes in NDVI and GPP followed relatively consistent trajectories. However, a divergence between these two indices became evident after 2000, particularly during the prolonged drought period from 2000 to 2009. The opposite trend between greenness and productivity in humid ecosystems during drought periods mainly caused this trend difference. In humid ecosystems, short-term drought promotes vegetation greening, while long-term drought has no significant impact on greenness. Our findings highlight the complex dynamics of vegetation growth in the context of climate change and underscore the challenges posed by drought in maintaining the effectiveness of afforestation and greening efforts.

How to cite: Zheng, L. and Wu, H.: Drought offsets gross primary productivity benefits from the afforestation initiatives-induced greening in China, EGU General Assembly 2025, Vienna, Austria, 27 Apr–2 May 2025, EGU25-2204, https://doi.org/10.5194/egusphere-egu25-2204, 2025.

EGU25-2299 | ECS | Orals | BG3.1

The present and future of US forest carbon allocation and turnover time 

Steven Kannenberg, William Anderegg, Avery Driscoll, Justin Mathias, and Chao Wu

The turnover time of forest biomass carbon is highly dynamic across space and time and is projected to decrease due to the acceleration of land use change and disturbance. However, turnover time may also shift due to changes in within-tree carbon allocation and species composition, processes that are highly unresolved. Using trait datasets and forest surveys, we developed US-wide maps of carbon contained in tree structural pools (leaves, stems, coarse roots, and fine roots), from which we derived forest biomass carbon turnover time. We found that hotter and wetter forests across the US experience lower carbon turnover time, primarily due to differences in tissue longevity and carbon allocation across species. We then tested the extent to which two mechanisms – shifts in carbon allocation and species composition – may affect carbon allocation and turnover time into the future using species distribution modeling and an individual-based tree model that can simulate changes in allocation. Turnover time generally decreased in the future across all methods, but the magnitude of this change, along with its underlying mechanisms, differed greatly depending on model type. This work underscores the need for expanded observations of carbon allocation in field settings on mature trees, and hints at the promise of optimality-based allocation models. Importantly, our results can be used to identify hotspots of carbon sequestration and constrain the sources of uncertainty in future forest carbon turnover time.

How to cite: Kannenberg, S., Anderegg, W., Driscoll, A., Mathias, J., and Wu, C.: The present and future of US forest carbon allocation and turnover time, EGU General Assembly 2025, Vienna, Austria, 27 Apr–2 May 2025, EGU25-2299, https://doi.org/10.5194/egusphere-egu25-2299, 2025.

EGU25-2437 | Posters on site | BG3.1

Variation and influencing factors of terrestrial ecosystem carbon fluxes in China 

Zhi Chen, Guirui Yu, and Weikang Zhang

Terrestrial ecosystem plays a significant role in global carbon budget. Understanding the variations and controlling mechanisms of ecosystem carbon fluxes is crucial for comprehending carbon cycles and assessing carbon budget. Using observed flux data, this study examined the spatial variation and influencing factors of carbon fluxes across China's terrestrial ecosystems. The results show that typical terrestrial ecosystems in China generally act as carbon sinks. There are clear geographical patterns in carbon fluxes, which tend to decrease linearly with increasing latitude and altitude, while increase linearly with increasing longitude. Carbon fluxes are positively correlated with mean annual temperature, mean annual precipitation, fractional vegetation cover, and leaf area index, while they show negative correlations with mean annual radiation. From 2002 to 2020, China’s terrestrial ecosystem productivity exhibited a slight increasing trend. The structural and functional properties contribute to this trend, with varying regional contributions. In the Northern regions of China, increasing structural properties, such as leaf area index, play a dominant role, while in the Southern and West regions, photosynthetic capacity is more significant. This study enhanced the understanding of the geographical patterns of carbon fluxes in China and provided a theoretical foundation for assessing the regional carbon budgets.

How to cite: Chen, Z., Yu, G., and Zhang, W.: Variation and influencing factors of terrestrial ecosystem carbon fluxes in China, EGU General Assembly 2025, Vienna, Austria, 27 Apr–2 May 2025, EGU25-2437, https://doi.org/10.5194/egusphere-egu25-2437, 2025.

EGU25-4062 | ECS | Posters on site | BG3.1

Photosynthesis sensitivity to cloud cover is shaped by aridity on a global scale 

Hao Luo and Johannes Quaas

Energy and water are two essential requirements for photosynthesis, and clouds influence both simultaneously by altering radiation and precipitation. Cloud-induced reductions in surface solar radiation and enhancements in precipitation have contrasting effects on photosynthesis. In our study, eddy covariance measurements, satellite observations and dynamic global vegetation models are used to examine the response of photosynthesis to cloud cover on a global scale. The results show that the photosynthesis sensitivity to cloud cover varies across ecosystems, and its global pattern is highly associated with aridity. Specifically, in water-limited dry regions, clouds promote photosynthesis by forming precipitation, while in energy-limited humid regions, clouds inhibit photosynthesis by blocking sunlight. The spatially dependent sensitivity of photosynthesis to cloud cover is further used to estimate projected changes in vegetation productivity driven by clouds.

How to cite: Luo, H. and Quaas, J.: Photosynthesis sensitivity to cloud cover is shaped by aridity on a global scale, EGU General Assembly 2025, Vienna, Austria, 27 Apr–2 May 2025, EGU25-4062, https://doi.org/10.5194/egusphere-egu25-4062, 2025.

EGU25-5508 | ECS | Orals | BG3.1

Traceability analysis of forest carbon dynamics with a matrix-represented vegetation demographic model 

Liuting Chen, Chenyu Bian, Ning Wei, Ruiling Lu, Fangxiu Wan, Xingli Xia, Erqian Cui, Ensheng Weng, Lifeng Jiang, Yiqi Luo, and Jianyang Xia

Understanding carbon cycle dynamics during forest succession is essential for predicting ecosystem responses to environmental change. Vegetation Demographic Models (VDMs), which include detailed demographic processes, offer valuable insights into forest successional dynamics. However, the high complexity of model structure can obscure our understanding of simulated ecosystem carbon dynamics. To address this, we developed a traceability framework to decompose VDM simulations of carbon storage into distinct, traceable components associated with different plant functional types (PFTs). Specifically, the transient carbon storage can be partitioned into three hierarchical layers: (i) carbon storage capacity (Xc) and potential (Xp); (ii) net primary production (NPP), carbon residence time (τN), net carbon pool change (X'), and carbon chasing time (τch); (iii) carbon allocation, transfer, and turnover rates. We applied this framework to a cohort-based VDM, Biome Ecological strategy simulator (BiomeE), and evaluated its utility using field observations of 72 species across three plots spanning 150 years of succession in a subtropical forest. The results showed that early succession exhibited high PFTs diversity, including evergreen broadleaf trees, evergreen broadleaf shrubs, evergreen needleleaf trees, deciduous broadleaf trees, and deciduous broadleaf shrubs, driving rapid increases in Xc and Xp. As succession progressed, deciduous PFTs declined, and evergreen broadleaf trees dominated carbon dynamics, with ecosystem carbon storage reaching approximately 40 kg C m-2 during the mid-succession stage. In the late successional stage, ecosystem carbon storage stabilized at 75 kg C m-2, closely approaching Xc, which is supported by high NPP (1.37 kg C m-2year-1) and long τN (70 years), while Xp and carbon sink strength declined. During succession, evergreen broadleaf trees contributed the most to carbon sequestration, with evergreen broadleaf trees (83.73%) > evergreen needleleaf trees (8.11%) > evergreen broadleaf shrubs (5.24%) > deciduous broadleaf trees (2.39%) > deciduous broadleaf shrubs (0.52%). These findings highlight the critical role of successional shifts in forest structure in shaping carbon dynamics in subtropical regions.

How to cite: Chen, L., Bian, C., Wei, N., Lu, R., Wan, F., Xia, X., Cui, E., Weng, E., Jiang, L., Luo, Y., and Xia, J.: Traceability analysis of forest carbon dynamics with a matrix-represented vegetation demographic model, EGU General Assembly 2025, Vienna, Austria, 27 Apr–2 May 2025, EGU25-5508, https://doi.org/10.5194/egusphere-egu25-5508, 2025.

Forestry protection constituted a fundamental element of China's forest management policy for the past four decades, which has played a critical role in increasing forest area and biomass stock. Nevertheless, an efficacious forest management policy should balance the dual roles of forests, serving as both carbon sinks and ecosystems, while also satisfying human demands for wood production. As one of the largest developing countries, China exhibited a significant increase in wood consumption from 49.42 million m3 in 1980 to 534.18 million m3 in 2020. However, the forest management policy in China tends to strictly limit domestic wood harvest for production. These forest management policies were formulated 40 years ago according to the situations at that time. Here, we evaluated the continued reliability of these protection-based forest management policies in the context of significant changes in forest structure. Additionally, we proposed a new wood harvest scheme that can satisfy all domestic wood requirements and has no negative impacts on forest carbon sink and soil erosion.

How to cite: li, X. and yuan, W.: It is time to optimize forest management policy for both carbon sinks and wood harvest in China, EGU General Assembly 2025, Vienna, Austria, 27 Apr–2 May 2025, EGU25-7621, https://doi.org/10.5194/egusphere-egu25-7621, 2025.

EGU25-8350 | ECS | Posters on site | BG3.1

Evaluating gross primary productivity, soil moisture and evapotranspiration derived from multiple Noah-MP dynamic vegetation schemes and satellite observations across land cover types in the Mediterranean region 

Martina Natali, Sara Modanesi, Gabrielle De Lannoy, Domenico De Santis, Daniela Dalmonech, Alessio Collalti, Susan Steele-Dunne, and Christian Massari

Land surface-atmosphere interactions are strongly influenced by vegetation, since the latter drives the exchange of energy, water and carbon at canopy level via transpiration and photosynthesis. These biochemical processes are related to both the stomatal response to meteorological variations (linking the canopy to the deepest soil layers), and the allocation of carbon in different parts of the plant such as roots and leaves. 

In recent years, the characterization of these processes has gained increasing attention in land surface models (LSMs), which are powerful tools that reproduce the soil-plant-atmosphere continuum and the mutual feedback of its components. Vegetation in LSMs is described either statically -- based on a prescribed vegetation climatology or cover -- or dynamically, that is, evolving in time its characteristics such as leaf area index and vegetation cover fraction, among the others. However, the dynamic simulation of vegetation is often simplified in LSMs with respect to state-of-the-art bio-geophysical and forest models. 

In the Noah Multi-Parametrization (Noah-MP, v. 4.0.1) LSM, multiple parametrizations are available for each individual sub-process scheme such as dynamic vegetation, runoff partitioning, groundwater recharge and radiative transfer through the canopy, among others. It is thus important to identify the land cover type, soil and climate characteristics of the specific study site and tailor the parametrization to find the “optimal” combination of sub-process schemes, i.e. the one which best reproduces in-situ observations. 

In this study, we evaluate point-scale simulations generated using different parametrizations of dynamic vegetation schemes within Noah-MP, run in offline mode within the NASA’s Land Information System (LIS). We compare the LSM results of gross primary productivity, soil moisture and evapotranspiration over several years between 2000 and 2023 to both ground-based estimates and remote sensing datasets derived from multiple observations and platforms such as MODIS, OCO-2, MSG and FLUXCOM. The study focuses on sites along the Italian peninsula, mostly forests, with croplands and grasslands as well, some of which are equipped with Eddy-covariance stations for carbon and water fluxes measurements and are included in the FLUXNET network. 

The sites are all natural, rain-fed ecosystems mostly located in drought-prone, Mediterranean regions. This study is meant to reveal previously neglected uncertainties in dynamic vegetation simulations, especially in dry regions, and to fine-tune the combination of sub-processes schemes in Noah-MP for future data assimilation experiments.

How to cite: Natali, M., Modanesi, S., De Lannoy, G., De Santis, D., Dalmonech, D., Collalti, A., Steele-Dunne, S., and Massari, C.: Evaluating gross primary productivity, soil moisture and evapotranspiration derived from multiple Noah-MP dynamic vegetation schemes and satellite observations across land cover types in the Mediterranean region, EGU General Assembly 2025, Vienna, Austria, 27 Apr–2 May 2025, EGU25-8350, https://doi.org/10.5194/egusphere-egu25-8350, 2025.

EGU25-8707 | ECS | Posters on site | BG3.1

Optimal Physiological Thresholds of Pan-Tropical Forests Using Surface Measurements and ECHAM/MESSy Atmospheric Chemistry Numerical Modeling 

Glauber Cirino, Anna Martin, Ryan Vella, Simone Rodrigues, Rafael Palacios, David Galbraith, and Andrea Pozzer

Aerosols and clouds are key external factors that significantly influence the light-use efficiency of plants and their primary productivity. Since photosynthesis and transpiration are tightly linked through leaf stomata, the diffuse fertilization effect (DFE) can also impact water-use efficiency (WUE). However, surface measurements have not yet been systematically employed to enhance the ability of global models to capture these effects, particularly across pan-tropical regions. Current global models remain uncalibrated, lacking validation datasets necessary to accurately represent the annual variations in gross primary productivity (GPP) and WUE driven by the DFE. In this study, we assessed the influence of DFE on annual carbon uptake and water dynamics using traditional methods widely applied across diverse forest ecosystems globally. Our analysis utilized long-term micrometeorological data from the FLUXNET dataset in six evergreen broadleaf forest (EBF) ecosystems, located in northern South America (SA), Central Africa (AF), South Asia (AS), and Oceania (OC). Preliminary comparisons were conducted with GPP and ET values simulated using the EMAC/JSBACH numerical systems. Here, we show the optimal physiological thresholds for GPP and WUE under overcast/smoky sky conditions and the typical tipping points linked to irradiance relative (f). Our preliminary results from the FLUXNET dataset indicated GPP and WUE rates as high as 0.4-0.6 g C m-2 h-1 and ET 0.3-0.5 mm h-1 for f between 1.1-0.7 (± 0.39) and solar zenith angles (SZA) ranging 0°–80°. For f ≤ 0.6, GPP and ET decreased rapidly in the studied areas, with a total breakdown of photosynthesis and evapotranspiration reaching around f 0.2 (± 0.36). The EMAC/JSBACH systems satisfactorily reproduced the behavior of the observed variables (aforementioned). However, we found systematic overestimations of temperature and solar radiation compared to FLUXNET measurements (~35%), which also can explain the GPP overestimations. Systematic calibrations in the EMAC/JSBACH are still necessary to achieve more accurate estimates of annual carbon and water losses due to DFE. Potential outcomes and benefits include: (i) improved physical representation and performance of Dynamic Global Vegetation Models (DGVMs) across different Plant Functional Types (PFTs) and landscapes; (ii) identification of the physiological optimum of forests under conditions affected by wildfires or extreme drought periods; and (iii) quantification of annual global water and carbon losses in tropical forests caused by wildfires; enhancements or photodamage caused by exposure to biomass-burning organic aerosol (BBOA), along with improved representation of global carbon cycling.

How to cite: Cirino, G., Martin, A., Vella, R., Rodrigues, S., Palacios, R., Galbraith, D., and Pozzer, A.: Optimal Physiological Thresholds of Pan-Tropical Forests Using Surface Measurements and ECHAM/MESSy Atmospheric Chemistry Numerical Modeling, EGU General Assembly 2025, Vienna, Austria, 27 Apr–2 May 2025, EGU25-8707, https://doi.org/10.5194/egusphere-egu25-8707, 2025.

Soil organic carbon (SOC) dynamics are driven by a complex matrix of factors, including local climate (e.g., temperature, precipitation), soil properties (e.g., mineralogy, clay content, cation-exchange capacity, pH), and land use (e.g., forests, grassland, arable agriculture) and its history. Each parcel of land carries a unique signature within this matrix, resulting in distinct SOC dynamics and varied responses to land-use changes and future climate scenarios.

European political and environmental strategies increasingly emphasize (re) afforestation as a key measure for climate change mitigation. This represents a full-circle transformation for European landscapes, many of which were historically deforested to accommodate grazing and agriculture. With rising reforestation rates, these landscapes are gradually returning to their forested states. However, with this, a critical ecological question arises: can SOC lost during initial forest-to-agriculture transitions be replenished within timeframes required for effective climate mitigation (typically decades)?

This study addresses this question by focusing on irrecoverable carbon stocks—SOC fractions lost during land-use transitions that cannot be restored quickly enough to meet climate targets. Using the terrestrial biosphere model T&C, which incorporates a microbially explicit soil biogeochemistry module to simulate carbon (C), nitrogen (N), and phosphorus (P) dynamics, we investigate SOC recovery potential and how this varies with land management.

Our proof-of-concept approach here presented involves a) validating the T&C model across multiple European sites undergoing forest-to-agriculture and agriculture-to-forest transitions and b) simulating SOC dynamics for a representative European grid cell experiencing these transitions under distinct Shared Socioeconomic Pathway (SSP) climate scenarios.

Such work is imperative to gain critical insights into the persistence of irrecoverable carbon stocks and the feasibility of SOC recovery through European (re)afforestation efforts.

How to cite: Buckley Paules, J., Paschalis, A., and Moustakis, Y.: Can SOC lost during initial forest-to-agriculture transitions be replenished within timeframes required for effective climate mitigation (typically decades)?, EGU General Assembly 2025, Vienna, Austria, 27 Apr–2 May 2025, EGU25-9050, https://doi.org/10.5194/egusphere-egu25-9050, 2025.

Eddy covariance measurements are increasingly utilized for assessing the exchange of matter and energy between ecosystems and the atmosphere across various time scales, ranging from hours to years. The flux footprint represents the area observable by flux tower sensors and illustrates how the surface influences the measured flux. Flux footprint models describe both the spatial extent and the specific location of the surface area contributing to the observed turbulent flux. In this study, we utilized a simple two-dimensional parameterization for flux footprint prediction (FFP) developed by Kljun et al. to identify the location of maximum footprint contribution every half hour over six years. These data were then subjected to monthly cluster analysis. Using QGIS, the resulting clusters were overlaid on a base map of the site obtained from the Estonian Land Board, where different compartments have varying growth stages and species composition. The main objective of this research was to integrate forest inventory data with ecosystem exchange and productivity data continuously recorded by the Eddy Covariance measurement tower at Järvselja, Estonia. The dataset obtained from the eddy covariance measurement technique was integrated with forestry inventory data, allowing half-hourly data to be selected and visualized using QGIS software.

How to cite: Thapa Magar, A., Padari, A., and Noe, S. M.: Modelling of forest ecosystem-atmosphere exchange and forest growth patterns with cluster analysis of Eddy covariance flux footprint data from SMEAR Estonia, EGU General Assembly 2025, Vienna, Austria, 27 Apr–2 May 2025, EGU25-9416, https://doi.org/10.5194/egusphere-egu25-9416, 2025.

EGU25-9705 | ECS | Posters on site | BG3.1

Dynamic of above ground biomass variation on a global scale over the last three decades. 

Samuel Favrichon, Maurizio Santoro, Oliver Cartus, Catherine Prigent, and Carlos Jimenez

Global vegetation plays a major role in the Earth carbon budget, storing the largest carbon stock on land. Both direct human activities and natural evolution under a changing climate impact the state of global forests, leading to regional decreases or vegetation growth. Monitoring these variations over long time periods can help better constrain estimates of the land carbon sink, and understand the driving forces of the cyclical and long term variations. This enables a refined understanding of climate effects and policies impact on current and future global vegetation carbon uptake.

Satellite records now span multiple decades, with microwave-based remote sensing providing complementary insights to optical observations. The lowest microwave frequencies are less affected by atmospheric perturbations and enable deeper penetration into the surface cover, with canopy penetration depth increasing with decreasing frequencies. However, achieving multi-decadal records requires the use of multiple instruments over time. These changes in instruments and observation types necessitate careful calibration and harmonization to produce consistent long-term time series of observations. The combination of different observation sources and different frequencies can be used as proxy to monitor geophysical variables variations such as the above ground biomass.

In this work we used a statistical model to combine observations of the Special Sensor Microwave - Imager, Special Sensor Microwave Imager Sounder and the C-band ERS/Advanced Scatterometer and Ku-band QSCAT to estimate above ground biomass on a global scale.  These models are applied to create a ~30 years time series of above ground biomass with R2>0.85 and RMSE<40 Mg/ha compared to the reference data from the CCI Biomass map. The retrievals are performed at different timescale highlighting the seasonality of vegetation cover and its impact on the microwave observations. The yearly estimates of AGB enable new insight into the dynamic of vegetation across different regions. The afforestation and deforestation effect can be evaluated across biomes, providing new estimates of the changes in carbon stocks at large scale.

How to cite: Favrichon, S., Santoro, M., Cartus, O., Prigent, C., and Jimenez, C.: Dynamic of above ground biomass variation on a global scale over the last three decades., EGU General Assembly 2025, Vienna, Austria, 27 Apr–2 May 2025, EGU25-9705, https://doi.org/10.5194/egusphere-egu25-9705, 2025.

EGU25-11268 | ECS | Posters on site | BG3.1

Soil carbon simulation, projections and feedbacks in CMIP6 Earth system models 

Rebecca Varney, Sarah Chadburn, Eleanor Burke, Pierre Friedlingstein, and Peter Cox

Understanding the sensitivity of soil carbon cycling to climate change is key to quantifying future carbon cycle feedbacks. Under increased atmospheric CO2, both carbon input to the soil from vegetation and carbon output from the soil due to heterotrophic respiration will increase, and the balance between these will determine the future ability of the land surface to be a sink or source of carbon. The ability of Earth system models (ESMs) to simulate soil carbon and related processes is therefore vital for reliably estimating global carbon budgets required for emission policies. Soil carbon simulation, projections and feedbacks are evaluated in the latest generation of CMIP6 ESMs. Global soil carbon is compared against observational datasets, future changes in global soil carbon stores and fluxes are investigated, and the carbon cycle feedbacks are quantified. The results suggest much of the uncertainty associated with modelled soil carbon stocks can be attributed to the simulation and representation of below ground soil processes in large scale models. These improvements would help reduce the uncertainty in projected carbon release from global soils under increasing levels of global warming.

How to cite: Varney, R., Chadburn, S., Burke, E., Friedlingstein, P., and Cox, P.: Soil carbon simulation, projections and feedbacks in CMIP6 Earth system models, EGU General Assembly 2025, Vienna, Austria, 27 Apr–2 May 2025, EGU25-11268, https://doi.org/10.5194/egusphere-egu25-11268, 2025.

EGU25-11778 | ECS | Orals | BG3.1 | Highlight

Too few, too many, or just the right number of estimates? Goldilock’s problem on post-disturbance carbon emissions and removal factors in tropical forests. 

Viola Heinrich, Amelia Holcomb, Simon Besnard, Daniela Requena Suarez, Charlotte Wheeler, Clement Bourgoin, Susan Cook-Patton, Nathaniel Robinson, David Gibbs, Yidi Xu, Na Chen, Celso Silva Junior, Luiz Aragão, and Martin Herold

Tropical forests are dynamic ecosystems shaped by deforestation, degradation, and recovery processes, with consequences for the carbon cycle. While emissions from deforestation have been well understood and quantified, information on emissions from degradation such as fire, logging, windrow and drought remain relatively poorly quantified, reflecting the complexity of these processes in space and time. Similarly, the carbon recovery potential of degraded forests is understudied compared to secondary forests regrowing after deforestation. Closing these knowledge gaps is crucial to reduce uncertainties in estimates of the tropical carbon budget and for addressing the priorities of international climate policies, which increasingly emphasize the value of protecting and restoring forests, without which we cannot constrain global warming to critical limits.

In recent years, research on carbon emissions and removals in tropical forests has surged, driven in part by advancements in Earth Observation. Here we synthesize these approaches with the aim to bring clarity and advance our understanding on aboveground carbon (AGC) emission and removal factors applicable for tropical moist forests. We contextualise the current studies, highlighting where there are sufficient data estimates to quantify emissions and removals post-disturbance, and where specific kinds of estimates are lacking.

Our synthesis of 66 studies of AGC loss due to disturbance shows emission estimates vary widely across disturbance types: average AGC losses are 3% (range 1–4%) for extreme drought, 27% (range 3–75%) for selective logging, and 52% (range 9–83%) for fire, relative to nearby und previously undisturbed forest. Our analysis underscores the need to account for disturbance severity, frequency and the cumulative effects of interacting disturbances to reduce variability between emissions estimates.

For AGC recovery, our synthesis of 68 studies indicates that degraded forests regained 41–117% of AGC within 20 years relative to undisturbed forests; significantly higher than forests regrowing from deforestation, which regained between 1% and 74% of undisturbed forest AGC. Younger recovering forests (<20 years) exhibit higher absolute regrowth rates, compared to older ones (> 20 years). In the Amazon region, where we have the greatest number of field site and region-specific remote sensing data, we see good agreement between field- and satellite- derived regrowth rate estimates. Remote sensing data therefore has the potential to fill the gaps in our spatial knowledge where field data is limited.

Our results also highlight some of the major gaps that still exist to provide long-lasting and relevant information into the policy and wider carbon budget science domain. Key research needs include: (i) reducing the variability of emission factors within disturbance types by further stratifying according to disturbance severity, frequency and co-occuring disturbances, (ii) addressing the research bias towards the Americas, particularly the Amazon, by expanding studies to areas where there are currently fewer estimates. Finally, we call for a more integrated approach between research focusing on deforestation, degradation and regrowth, recovery and consider these processes as interconnected, co-occurring and influencing each other in space and time.

How to cite: Heinrich, V., Holcomb, A., Besnard, S., Requena Suarez, D., Wheeler, C., Bourgoin, C., Cook-Patton, S., Robinson, N., Gibbs, D., Xu, Y., Chen, N., Silva Junior, C., Aragão, L., and Herold, M.: Too few, too many, or just the right number of estimates? Goldilock’s problem on post-disturbance carbon emissions and removal factors in tropical forests., EGU General Assembly 2025, Vienna, Austria, 27 Apr–2 May 2025, EGU25-11778, https://doi.org/10.5194/egusphere-egu25-11778, 2025.

EGU25-12652 | Posters on site | BG3.1

Variability and influences of carbon exchange processes in German Forests 

Hassane Moutahir, Pia Labenski, Hannes Imhoff, Edwin Haas, Ralf Kiese, and Rüdiger Grote

Tree growth and forest development depend to a large degree on climatic conditions. This is mostly because they are determining primary production, respiration losses, water demand and availability. The complex nature interacting climate components, however, represents a challenge if carbon sequestration and forest growth should be evaluated under changing conditions. Therefore, we apply a physiologically-based model (LandscapeDNDC) that has been evaluated on 15 ICOS flux tower sites, to all forested area in Germany in order to investigate the variability of carbon exchange processes in German Forests and their sensitivity to extreme events, specifically drought years. The results indicate that the net carbon sequestration is considerably reduced only in years and at sites with high water deficit (supply-demand) during extended periods of the growing period. The sensitivity to such stress, and thus also the variability between years, however, is different with species. Based on the simulations, we are also discussing the uncertainties related to model applications and the need to account for legacy effects.

How to cite: Moutahir, H., Labenski, P., Imhoff, H., Haas, E., Kiese, R., and Grote, R.: Variability and influences of carbon exchange processes in German Forests, EGU General Assembly 2025, Vienna, Austria, 27 Apr–2 May 2025, EGU25-12652, https://doi.org/10.5194/egusphere-egu25-12652, 2025.

EGU25-12712 | ECS | Posters on site | BG3.1

Monitoring climate and land-use change impacts on Alpine grassland vegetation dynamics and carbon sinks 

Daria Ferraris, Marta Galvagno, Ludovica Oddi, Gianluca Filippa, Edoardo Cremonese, Paolo Pogliotti, Federico Grosso, Umberto Morra di Cella, Sofia Koliopoulous, Chiara Guarnieri, Georg Wohlfahrt, Georg Leitinger, Mirco Migliavacca, Albin Hammerle, and Dario Papale

Terrestrial vegetation represents one of the planet’s primary carbon sinks, playing a pivotal role for climate change mitigation. Enhancing carbon storage in natural and managed ecosystems requires a deeper understanding of vegetation dynamics. In this context, Alpine Mountain ecosystems, are dealing with two significant challenges increasing the vulnerability of their carbon sinks: firstly, the atmosphere in the Alps is warming up twice as fast as in other areas of the planet and droughts and heat waves are becoming more frequent; secondly, socio-economic changes have led to partial land abandonment, affecting the composition and distribution of plant species. Specifically, in the Aosta Valley region (Northwest Italian Alps), land-cover and land-use changes (LCLU) are reshaping vegetation dynamics, particularly through the abandonment of mountain pastures below the forest line (~1500 meters asl).

The goal of our research is to investigate how climatic and socio-economic shifts drive woody species encroachment into mountain grasslands, altering carbon sequestration patterns and contributing to ecosystem changes. The activities were carried out at the ‘Integrated Carbon Observation System’ (ICOS) associated site Torgnon (IT-Tor), an abandoned subalpine pasture dominated by Nardus stricta, located in the Aosta Valley region at about 2100 m asl. An area of 15000 square meters was selected in the pasture, which is undergoing recolonization by larches (Larix decidua) and shrubs (specifically Calluna vulgaris, Juniperus communis, Vaccinium myrtillus, V. uliginosum, Rhododendron ferrugineum). Since 2015, periodic surveys (2015, 2018, 2021, and 2024) were conducted to monitor vegetation dynamics. The area was divided into line transects using ropes for sequential monitoring. Employing a GNSS system with 20 cm positional accuracy, we mapped larch tree locations, measured trunk diameters, heights, and crown dimensions, and documented associated shrub growth. Shrubs were independently counted to quantify their spread across the study area.

Continuous measurements of CO2, water fluxes, and meteorological variables are available at the site since 2008. To further evaluate ecosystem fluxes, an additional eddy covariance station was installed in October 2024 in the encroached area.

Results show an increase in the number of larches, most significant in the 2015-2018 period. During that period the number of larches almost doubled. After 2018 growth rates were lower but highlight an ongoing shift from grassland to woody vegetation, that affect carbon and water dynamics. Preliminary flux measurements will be presented, providing first insights into different carbon dynamics in the transition area.

This research underscores the critical role of LCLU changes in shaping present and future global vegetation dynamics and carbon sinks, that need to be considered to improve our understanding and modelling of ecosystem carbon cycle.

How to cite: Ferraris, D., Galvagno, M., Oddi, L., Filippa, G., Cremonese, E., Pogliotti, P., Grosso, F., Morra di Cella, U., Koliopoulous, S., Guarnieri, C., Wohlfahrt, G., Leitinger, G., Migliavacca, M., Hammerle, A., and Papale, D.: Monitoring climate and land-use change impacts on Alpine grassland vegetation dynamics and carbon sinks, EGU General Assembly 2025, Vienna, Austria, 27 Apr–2 May 2025, EGU25-12712, https://doi.org/10.5194/egusphere-egu25-12712, 2025.

EGU25-12778 | ECS | Posters on site | BG3.1

Exploring model uncertainty of the Congo basin rainforest carbon cycle 

Steven De Hertog, Félicien Meunier, Marcos Longo, and Hans Verbeeck

The Congo basin forest plays a crucial role in the global carbon cycle, contributing to more than 10% of the global terrestrial sink. This carbon potential appears more stable compared to other tropical forests. Historically, despite its importance for global climate, the Congo basin forest has received much less scientific attention than other tropical forests. Notwithstanding, in recent years the body of data and knowledge has reached a critical level that allows studying the carbon cycle of the Congo basin forest under the present climate.

The main objective of this ongoing research is to quantify the uncertainty related to the carbon cycle in process based models, and to decompose the different aspects contributing to this uncertainty, This will ultimately improve our understanding of the Congo basin carbon cycle within the present climate. We present results from two dynamic vegetation models (ED2 and FATES), which represent structural and functional heterogeneity of forests, over the Congo basin forest. We decompose the uncertainty related to model structure, climate drivers and model parameters. We focus on the data-rich site of Yangambi, located in the central Congo basin in the Democratic Republic of Congo. Both models are initialized with forest inventory plot data and driven with meteorological drivers from GSWP reanalysis. We evaluate the modelled carbon cycle on seasonal and diurnal time-scales against recent measurements from the Congoflux eddy-covariance tower (2020-2024). Preliminary results indicate that both models tend to underestimate observed net ecosystem carbon exchange, especially during the daytime. These results can provide new process-based insights as well as inform on the importance of model structure differences in modelling the carbon cycle over the Congo basin.

How to cite: De Hertog, S., Meunier, F., Longo, M., and Verbeeck, H.: Exploring model uncertainty of the Congo basin rainforest carbon cycle, EGU General Assembly 2025, Vienna, Austria, 27 Apr–2 May 2025, EGU25-12778, https://doi.org/10.5194/egusphere-egu25-12778, 2025.

EGU25-13253 | ECS | Orals | BG3.1

Can Tree Rings Help to Refine Vegetation Modelling?: Fused Empirical Data for Benchmarking Forest Biomass Estimates 

Evrim A. Şahan, Ana Aguirre Arnáiz, Kelly A. Heilman, Sonia Condés, Daniel Moreno Fernández, Iciar Alberdi Asensio, Isabel Cañellas, Jose Carlos Miranda, and Isabel Dorado-Liñán

Accurate estimations on forest above-ground biomass (AGB) are essential for improving our ability to simulate vegetation response to climate and assess the future role of forests as carbon sinks. In this context, Dynamic Global Vegetation Models (DGVMs) are the most important and rapidly evolving tool to estimate forest carbon dynamics and its potential trajectories in a warmer future at regional to global scales. However, DGVMs remain rather unprecise in their estimation of biomass components due to the lack of representation of growth processes within the model. Thus, enhancing our forest modelling skills at regional and global scales does not only depend on improving the photosynthetic or ecophysiological module (carbon uptake) but to correctly account for allocation into biomass (carbon storage). In this study, we aim to provide a refined, annually resolved empirical AGB estimates that serves as an accurate benchmark to assess the reliability of DGVMs biomass simulations.

To achieve this, we integrate a network of 230 National Forest Inventory (NFI) plots with tree-ring width data collected from the same locations at the Iberian Peninsula, using both frequentist and Bayesian approaches. The NFI data offer detailed forest structure information at the tree and stand levels, typically recorded at 10-year intervals, while tree-ring data provide a reliable measure of annual tree growth. We retrospectively interpolate annual estimates of diameter at breast height (DBH) in trees from NFI plots based on tree-ring width measurements, the climate drivers of tree growth and stand variables. These estimated DBH values are then used to calculate AGB.

Based on our estimated AGB, we assessed the annual net biomass change (NBC) for the last three decades, which allowed us to infer the impact of interannual climate variability and extreme climate events on forest biomass change.  We compared the estimated NBC with Net Primary Production (NPP) outputs from a selected set of DGVMs included in the TRENDY initiative. Our results revealed a general discrepancy between the simulated NPP and the NBC estimates, particularly evident when analyzing the biomass response to extreme climate events. During years marked by extreme summer droughts, such as 1994, 1995, 2003, and 2012, the spatial patterns of NPP anomalies were inconsistent with those observed in the NBC estimates. This discrepancy became even more pronounced during consecutive extreme climate events. During consecutive events, the simulated NPP showed a marked decline during the first year, whereas NBC estimates revealed that drought-induced biomass reduction became more pronounced in the following year due to the legacy effects. These results reflect the source-driven structural deficiency in DGVMs. Incorporating detailed growth dynamics and recovery trajectories into DGVMs is essential for improving their accuracy in a changing climate. In this context, the fusion of tree-ring and NFI data represents a significant advancement, not only for benchmarking DGVMs but also for improving data assimilation procedures.

How to cite: Şahan, E. A., Aguirre Arnáiz, A., Heilman, K. A., Condés, S., Moreno Fernández, D., Alberdi Asensio, I., Cañellas, I., Miranda, J. C., and Dorado-Liñán, I.: Can Tree Rings Help to Refine Vegetation Modelling?: Fused Empirical Data for Benchmarking Forest Biomass Estimates, EGU General Assembly 2025, Vienna, Austria, 27 Apr–2 May 2025, EGU25-13253, https://doi.org/10.5194/egusphere-egu25-13253, 2025.

EGU25-14267 | ECS | Posters on site | BG3.1

Widespread sink limitations on forest biomass growth in the Northern Hemisphere 

Yiting Luo, Hui Yang, Nuno Carvalhais, Siyuan Wang, and Philippe Ciais

Forests, which sequester atmospheric CO2 in the form of biomass within long-term reservoirs, are critical to the global land carbon sink. Current land surface models assume a strong coupling between photosynthesis and plant biomass changes, with carbon supply (i.e., carbon assimilation though photosynthesis) has been considered the main driver of plant biomass growth (‘source limitation’). However, the potential for sink limitations to constrain plant biomass growth, where plant biomass change become decoupled from photosynthesis, has been raised and supported by free air CO2 enrichment (FACE) experiment, inventory and tree ring evidence.

In this study, we relied on high spatial resolution satellite-based retrievals of above-ground biomass (AGB) and vegetation primary productivity (GPP), to quantify the extent of decoupling between plant photosynthesis and biomass growth at the ecosystem scales over the past decade in the Northern Hemisphere (from 35ºN to 90ºN). We found that the fraction of decoupled area in non-intact forest is 66 ± 9%, significantly higher than in the intact forest. Extensive decoupling was observed across Europe, Russia and Canada. This spatial pattern was verified using multiple satellite-derived and inventory-derived AGB, and GPP data from P model. To investigate the drivers of decoupling, we built a generalized additive model to predict spatial variations in decoupling fractions within non-intact forests. The model suggests that harvest and logging account for most of the decoupling in Europe, while wildfires in Siberia may promote a recovery of coupling due to rapid vegetation regrowth. More importantly, even in intact forests, 56 ± 13% still exhibited the decoupling signals. In western Russia, this decoupling appears to be driven by droughts, likely due to carbon allocation shifts to support metabolism and critical plant functions, thereby constraining biomass growth. In western Canada, decoupling was found in in old-growth, or dense intact forests, where high decomposition, competition, or mortality may result in stable or declining forest biomass over time. Our analysis provides a geographic overview of regions experienced sink limitations to forest biomass growth, as well as insights into the mechanisms regulating terrestrial carbon sequestration. These findings represent a critical step toward improving process-based models and enhancing predictions of terrestrial carbon dynamics under future climate change scenarios.

How to cite: Luo, Y., Yang, H., Carvalhais, N., Wang, S., and Ciais, P.: Widespread sink limitations on forest biomass growth in the Northern Hemisphere, EGU General Assembly 2025, Vienna, Austria, 27 Apr–2 May 2025, EGU25-14267, https://doi.org/10.5194/egusphere-egu25-14267, 2025.

EGU25-15528 | Posters on site | BG3.1

Dynamics of aboveground biomass over the past four decades in China’s forests 

Xuemei Zhang and Wei Li

As one of the most important carbon sinks and carbon pools globally, forest ecosystems play a critical role in absorbing and storing carbon dioxide from the atmosphere. The implementation of eco-engineering has transformed China into one of the hotspots in global greening. However, great differences in natural conditions between subregions, function transformation of forest ecosystem between carbon gain and carbon loss due to rapid land use changes, and uncertainties in the stability and sustainability of forest ecosystem functions resulting from climate change, lead to the large-scale forest carbon sink capacity and future carbon sink potential remaining largely unclear. This lack of clarity is not conducive to the formulation of climate change mitigation strategies in China. Therefore, it’s urgent to undertake the quantification and assessment of forest aboveground biomass carbon with high spatiotemporal resolution. Here, using a machine learning model, six bands of Landsat images, along with 3 indicators derived from the bands by raster calculators at a resolution of 30m × 30m, were used to train the estimate model of aboveground biomass carbon density in combination with the adjusted aboveground biomass / carbon products from 2019. Subsequently, the carbon density from 1985 to 2023 at a 30m × 30m resolution were predicted. The model’s RMSE was 9.03 MgC ha-1 and the R2 of test datasets stabilized around 0.77. We found that forest aboveground biomass carbon stock decreased first and then increased during the period. Despite a decreasing trend in the area of stable forests, the carbon stock increased from 7.50 PgC to 8.05 PgC, at a rate of 0.015 PgC yr-1. The area of secondary forests, however, showed the most rapid regrowth in carbon density during the period, with a rate of 0.46 MgC ha-1 yr-1. Over the past about four decades, carbon loss due to deforestation amounted to approximately 1.49 PgC, while carbon gain from plantation sumed to 4.55 PgC. Spatial and temporal high-resolution data of forest aboveground biomass carbon serve as an invaluable resource for identifying areas with significant carbon stocks and high carbon sink potential, and allows an in-depth understanding of the differences in dynamic patterns over time in China’s forest and provides a scientific reference for optimizing land management.

How to cite: Zhang, X. and Li, W.: Dynamics of aboveground biomass over the past four decades in China’s forests, EGU General Assembly 2025, Vienna, Austria, 27 Apr–2 May 2025, EGU25-15528, https://doi.org/10.5194/egusphere-egu25-15528, 2025.

EGU25-16393 | ECS | Posters on site | BG3.1

Modelling past and future impacts of droughts on tree mortality and carbon storage in Norway spruce stands in Germany 

Tim Anders, Jessica Hetzer, Nikolai Knapp, Matthew Forrest, Liam Langan, Merja Helena Tölle, Nicole Wellbrock, and Thomas Hickler

The consecutive drought events between 2018 and 2020 caused an unprecedented increase in Norway spruce (Picea abies) tree mortality across Germany. Despite the observable forest dieback, process-based vegetation models have difficulty reproducing it. This gap between observed and simulated forest dynamics underscores the pressing need for more advanced modeling approaches to accurately capture drought-induced tree mortality.

In our study, we adopted a data-driven statistical approach to enhance the representation of drought-induced Norway spruce tree mortality in the process-based vegetation model LPJ-GUESS. Using Norway spruce mortality data from the German Crown Condition Survey (Waldzustandserhebung, WZE), as well as climate and weather anomaly data, we developed logistic regression models to predict drought-induced tree mortality, which were then integrated into LPJ-GUESS.

This enhanced modeling framework successfully reproduced the general temporal and spatial patterns of historical Norway spruce mortality rates (1998–2020). Future simulations (2021–2070) under the RCP2.6 and RCP8.5 climate scenarios show periodic increases in Norway spruce mortality, comparable to or even exceeding the high rates observed in 2020. Although the drought-mortality models effectively replicate past dynamics, they diverge in predicting the timing and magnitude of future drought-induced mortality events.

The vegetation model also enabled us to quantify the impacts of mortality on forest productivity. Our projections indicate a drought-driven reduction in aboveground biomass of 18% under RCP2.6 and 36% under RCP8.5 (mean across all simulations). Moreover, we observed a significant decline in potential spruce timber harvests in Germany between 2021 and 2070, with cumulative losses amounting to 310 million Mg of C under RCP2.6 and 447 million Mg of C under RCP8.5. These impacts vary depending on the chosen climate scenario and the statistical mortality model applied.

Our study highlights the severe risk of large-scale future dieback in Norway spruce forests across Germany. However, the prediction of the timing and magnitude of such events remains highly uncertain. Nevertheless, the effects of droughts should be considered in predictive modeling studies, as they could have significant impacts on forest carbon cycling and timber harvests.


How to cite: Anders, T., Hetzer, J., Knapp, N., Forrest, M., Langan, L., Tölle, M. H., Wellbrock, N., and Hickler, T.: Modelling past and future impacts of droughts on tree mortality and carbon storage in Norway spruce stands in Germany, EGU General Assembly 2025, Vienna, Austria, 27 Apr–2 May 2025, EGU25-16393, https://doi.org/10.5194/egusphere-egu25-16393, 2025.

EGU25-16398 | Orals | BG3.1

Where in the world are we confident in terrestrial carbon balance? 

Thomas Smallman and Mathew Williams

Terrestrial ecosystems play a major role in the global carbon (C) cycle. However, our ability to quantify where in the world is a net C source or sink, and to what extent this is changing continues to be a critical challenge. Terrestrial ecosystems are responsible for the largest C fluxes in the world dwarfing anthropogenic emissions from fossil fuels. These processes are sensitive to climatic and anthropogenic disturbances on varied scales in time and space. This complex interconnection of internal ecosystem processes and external exchanges, mediated by ecosystem properties, challenges both observation and process-based modelling efforts to understand and quantify ecosystem C exchanges.

The expansion of satellite-based Earth Observation (EO) has provided unprecedented information at global scales on the state and evolution of terrestrial ecosystems. Increasingly, these data are provided with more robust estimates of their uncertainties and their variation in space and time. Process-models of terrestrial ecosystems have advanced with our growing ecological understanding derived from in-situ information. However, while there is great potential for EO to contribute to model calibration and validation, helping diagnose ecological function and improve model predictive skill, at present the connections between EO and process models are weakly developed.

Bayesian model-data fusion (data assimilation) approaches offer a powerful opportunity to integrate EO and process-models by informing the model parameter calibration with a diverse, location-specific array of complementary ecologically relevant observations, fully propagating their uncertainties. In this study, will use the state-of-the-art CARDAMOM Bayesian calibration framework to retrieve parameters for a process-based model of the terrestrial ecosystem (DALEC).

We will present a global (0.5 x 0.5 degree) analysis of the global carbon and water cycles for a 21-year period (2003-2023). CARDAMOM is applied uniquely at each 0.5 degree pixel, retrieving uncertainty bounded estimates of DALEC parameters as a function of information available for that location. From these ‘local’ parameters we estimate the state and dynamics of terrestrial ecosystems with fully realised uncertainties in space and time.

Our analysis will identify where in the world we have confidence in source / sink dynamics and diagnose environmental relationships driving current trajectories, including the large growth in atmospheric CO2 concentrations in 2023. Our preliminary analyses suggest this increase is driven by elevated fire activity, particularly in south west Amazon and Canadian boreal forests, and broad enhancement of heterotrophic respiration driven by warming.

How to cite: Smallman, T. and Williams, M.: Where in the world are we confident in terrestrial carbon balance?, EGU General Assembly 2025, Vienna, Austria, 27 Apr–2 May 2025, EGU25-16398, https://doi.org/10.5194/egusphere-egu25-16398, 2025.

Plants have a high capacity to both adapt to long term climate condition and to acclimate in response to short-term environmental changes. Superimposed on these individual plant responses, changes in environmental conditions and competition amongst individuals drive shifts in species composition and all these together drive changes in ecosystem function. Historically, vegetation models represented plants as rigid, with little or no capacity to react to change, with a basic representation of biome shift, leading to sometimes unexpected and unrealistic predictions of vegetation shifts under future conditions. Since, models have advanced both in terms of plasticity and vegetation dynamics representations although to some extent on parallel tracks, with little exploration of the interactions between the two. Using the QUINCY land surface model, we explore the implications of representing plant plasticity on both short and long timescales as well as the effect of competitive pressures. We use data from networks of manipulative experiments – DrougthNet and the Nutrient Network – to disentangle the extent to which plastic responses to stressors are general across the globe or adapted to specific conditions. The drought and nutrient manipulation also give us the opportunity to explore concepts around belowground competition for resources, which has been included in models to a far lesser extent than aboveground competition for light. While questions around the effect of increased model complexity remain, increased ecological realism and the inclusion of all relevant processes and their interaction improves our understanding and predictive capability of future vegetation dynamics.

How to cite: Caldararu, S.: From plant plasticity to demography: modelling plant responses to global change across timescales, EGU General Assembly 2025, Vienna, Austria, 27 Apr–2 May 2025, EGU25-16794, https://doi.org/10.5194/egusphere-egu25-16794, 2025.

EGU25-16869 | ECS | Posters on site | BG3.1

Analysis of the effects of soil parameterson radial stem growth for four sprucestands in Austria 

Anita Zolles, Sonja Vospernik, and Silvio Schüler

Understanding tree growth in relation to environmental conditions is essential, particularly in the context of climate change,
where rising temperatures, frequent droughts, and disturbances threaten forest health and productivity. This study uses
high-resolution data from four intensively monitored Picea abies stands in Austria (2010-2020), with dendrometers recording
hourly stem increments on 10 trees per site, allowing for detailed analysis of growth responses to environmental changes.For this
purpose we tested different generalized additive mixed models (GAMs) using environmental data collected on site. The best model
consisted of combinations of soil moisture (SM) and soil temperature (ST) data. Furthermore we analysed how the relationships
established differ for three different times during the growing season. We found that high SM consistently had a positive effect on
tree growth, wheras the effect of ST varied depending on the timing.Our findings underscore the importance of monitoring soil
conditions, particularly for species like Picea abies, which are known to react more sensitive to environmental changes due to
their shallow rooting systems and vulnerability to drought.

How to cite: Zolles, A., Vospernik, S., and Schüler, S.: Analysis of the effects of soil parameterson radial stem growth for four sprucestands in Austria, EGU General Assembly 2025, Vienna, Austria, 27 Apr–2 May 2025, EGU25-16869, https://doi.org/10.5194/egusphere-egu25-16869, 2025.

EGU25-17002 | ECS | Orals | BG3.1

Large-Scale Forest Regeneration Dynamics Over Two Decades in Central Europe: A Representative Analysis  

Ugo Molteni, Meinrad Abegg, Andrea D. Kupferschmid, Barbara Moser, Petia S. Nikolova, Daniel Scherrer, and Thomas Wohlgemuth

Forests provide essential ecosystem services, from carbon sequestration and biodiversity conservation to soil protection and socio-economic benefits. Understanding forest regeneration patterns is crucial for predicting future forest composition and ensuring the continued provision of these services. While long-term forest monitoring is well-established in Europe and in particular Switzerland through the National Forest Inventories (NFI) comprehensive analyses of regeneration trends across different forest communities remain limited. 

This study analyzes 20 years of regeneration data from the Swiss NFI's presence plots, spanning three inventory periods (NFI3: 2004-2006, NFI4: 2009-2017, NFI5: 2018-ongoing). We examine regeneration patterns across major forest communities, including beech, fir-beech, and fir-spruce forests, focusing on presence data for key tree species in two height categories: 40-130 cm and above 130 cm to 11.9 cm DBH. The presence plot methodology, implemented since NFI3, surveys 200 m² sampling areas, providing standardized data on species occurrence in the regeneration layer. 

Our analysis reveals significant temporal trends in species presence across different forest communities, identifying both increasing and decreasing patterns in regeneration success. Preliminary results for beech and fir-beech communities show distinct regeneration patterns: while most conifer species display stable or slightly increasing trends, we observe a notable expansion in deciduous tree presence, particularly beech and maple species. A concerning pattern emerges for European ash, showing a consistent decline across different forest communities. These findings provide crucial insights into the dynamics of Swiss forest regeneration and potential future forest composition. 

This comprehensive assessment of regeneration trends across Switzerland's diverse forest ecosystems offers valuable information for forest managers and policymakers, supporting evidence-based decisions in forest management and conservation strategies. The results contribute to our understanding of forest ecosystem resilience and adaptation potential in the face of environmental change. 

How to cite: Molteni, U., Abegg, M., Kupferschmid, A. D., Moser, B., Nikolova, P. S., Scherrer, D., and Wohlgemuth, T.: Large-Scale Forest Regeneration Dynamics Over Two Decades in Central Europe: A Representative Analysis , EGU General Assembly 2025, Vienna, Austria, 27 Apr–2 May 2025, EGU25-17002, https://doi.org/10.5194/egusphere-egu25-17002, 2025.

Terrestrial gross primary productivity (GPP) is a linchpin flux in the terrestrial carbon cycle and its simulation is a central component of dynamic global vegetation models (DGVMs). When calculating GPP, DGVMs typically rely on a light use efficiency (LUE) model which relates the amount of absorbed solar radiation to the amount of carbon fixed by photosynthesis. Recent theoretical advances utilising eco-evolutionary optimality (EEO) theory have led to the development of the P model, a parameter-sparse LUE model which has been well-validated at both local and global scales.

Here we implemented the P model into LPJ-GUESS, an established, community-developed DGVM. We compared LPJ-GUESS’s performance with and without the P model to remotely-sensed GPP estimates. The inclusion of the P model reduced the error in the simulated spatial pattern of annual GPP by 17% and markedly improved of the timing of the northern hemisphere spring green up. In order to disentangle the causes of data-model mismatch, we also investigated the GPP errors as a function of the environmental variables such as elevation, and in the case of elevation we found a strong model bias which was similar both with and without the P model.

In addition to the improved model skill, the P model version of LPJ-GUESS uses far fewer parameters (none of which are PFT specific), encapsulates a coherent body of theory reflecting more recent understanding of photosynthetic responses to changing environmental conditions, and has a reduced model run time. Based on this, we conclude that the P model has the potential to improve LPJ-GUESS and other DGVMs.

How to cite: Forrest, M. and Hickler, T.: Improving terrestrial carbon cycle simulations with eco-evolutionary optimality: Including the P model in LPJ-GUESS, EGU General Assembly 2025, Vienna, Austria, 27 Apr–2 May 2025, EGU25-17371, https://doi.org/10.5194/egusphere-egu25-17371, 2025.

Vegetation dynamics across the Tibetan Plateau (TP) are increasingly influenced by climate warming, warranting further investigation. This study integrates multiple data sources, focusing on Normalized Difference Vegetation Index (NDVI) and gross primary productivity (GPP), to analyze their long-term trends during TP’s growing season. We find a noteworthy shift from greening (increased NDVI) to pronounced browning (decreased NDVI) in the third generation NDVI dataset generated by the Global Inventory Modeling and Mapping Studies (GIMMS3g NDVI), evident from 1998 (1982–1998: 0.0006 yr-1, p < 0.1; 1998–2015: −0.0008 yr-1, p < 0.05). This browning trend is corroborated by Moderate-Resolution Imaging Spectroradiometer (MODIS) NDVI (−0.0005 yr-1, p < 0.05) during 2000–2015. In contrast, all GPP products consistently increase during 1982–2015. Browning and increasing GPP trends decouple in the eastern and southern TP, coinciding with terrestrial water storage (TWS) shifting from increasing to decreasing, and rising trends in solar radiation (SR), vapor pressure deficit (VPD), and temperature post-1998. Analysis highlights increasing SR (VPD) dominance and decreased TWS sub-dominance in GIMMS3g (MODIS) NDVI browning. TRENDYv6 multiple model experiments emphasize climate’s primary role, followed by CO2 fertilization, in increasing GPP trends. Furthermore, temperature exerts the most significant promoting effect on GPP enhancement, outweighing adverse effects of soil and atmospheric dryness. Additionally, we reconcile browning and increased GPP by attributing it to environment-induced increased light-use efficiency and highlight subtle plant carbon allocation strategies. This study provides valuable insights into the intricate relationship between changing climate and vegetation dynamics over the TP.

How to cite: Wang, J. and Wang, X.: Increasing gross primary productivity despite vegetation browning over the Tibetan Plateau during 1998−2015, EGU General Assembly 2025, Vienna, Austria, 27 Apr–2 May 2025, EGU25-20579, https://doi.org/10.5194/egusphere-egu25-20579, 2025.

EGU25-20625 | Orals | BG3.1

Quantifying the Global and Regional Contribution of Terrestrial Carbon Pools to the Land Sink 

Yinon Bar-On, Xiaojun Li, Michael O'Sullivan, Jean-Pierre Wigneron, Stephen Sitch, Philippe Ciais, Christian Frankenberg, and Woodward Fischer

Over the past several decades, terrestrial ecosystems have offset a ≈30% of anthropogenic CO2 emissions through increased CO2 uptake. While this carbon enters the biosphere through photosynthesis into biomass, its current distribution across different pools—such as live biomass, dead biomass, and soil and sedimentary organic carbon—remains uncertain. The partitioning of carbon into these pools impacts future terrestrial carbon storage because they have different turnover times and sensitivities to environmental change. By harmonizing a set of global estimates for changes in live woody biomass, we found that while ≈35±14 gigatons of carbon (GtC) have been sequestered on land between 1992-2019, live woody biomass changed by only ≈2±7 GtC. These findings contrasted with results from global vegetation models, which show sustained increases in live biomass. We highlight key processes that are not currently included in models and can account for a large fraction of this discrepancy such as forest degradation or fluxes related to inland waters. We infer that recent gains in terrestrial carbon stocks are sequestered as non-living organic matter in a combination of dead biomass, soils, and other sedimentary deposits. These results suggest that terrestrial carbon accumulated in recent decades might be more persistent than previously appreciated, and that a substantial fraction of it is intimately linked to human activities such as river damming, wood harvest, and waste treatment.

How to cite: Bar-On, Y., Li, X., O'Sullivan, M., Wigneron, J.-P., Sitch, S., Ciais, P., Frankenberg, C., and Fischer, W.: Quantifying the Global and Regional Contribution of Terrestrial Carbon Pools to the Land Sink, EGU General Assembly 2025, Vienna, Austria, 27 Apr–2 May 2025, EGU25-20625, https://doi.org/10.5194/egusphere-egu25-20625, 2025.

Land use and land cover change dynamics in the Niger Delta region from 1986 to 2024

Abstract

Understanding the effects of land use and land cover change (LULCC) is crucial for developing land management strategies that can reduce adverse effects on the hydrological cycle and the environment. This study examines the dynamics of LULCC in the Niger Delta of Nigeria, considering its implications for hydrological hazards. The study documents how the LULCC in the Niger Delta has changed from 1986 to 2024. A supervised maximum likelihood classification was applied to five land use classes (water bodies, rainforest, built-up, agriculture, and mangrove) derived from Landsat 5 TM and 8 OLI images from 1986, 2015, and 2024. The built-up and agriculture land classes record the greatest increase, about 8,229 and 6,727 sq. km (561.54% and 79.38%) respectively, while mangroves and rainforests showed the biggest decrease - 14,350 and 10,844 sq. km (-54.51 and -42.88%) respectively. Delta, Cross River, and Rivers States experienced the highest decrease in rainforest compared to other states, 64.0%, 49.49%, and 38.26% (5,711.0 sq km, 3,554.0 sq km and 1,297.0 sq km) respectively. The decreasing mangrove and rainforest cover impact on the hydrological functioning of the NDR resulting in flooding and increased risks and impacts associated with hydrological hazards. The study shows that multiple stakeholders, including the Nigerian government, need to manage LULCC and support forest and mangrove restoration and protection, particularly in Delta, Cross River, and Rivers States, to address rapid changes in the land use with impacts of hydrological functioning of the Niger Delta

 Obroma O Agumagu

 PhD
 Department of Environment and Geography
  University of York

 obroma4u@yahoo.com, oa824@york.ac.uk


How to cite: Agumagu, O.: Land use and land cover change dynamics in the Niger Delta region from 1986 to 2024 , EGU General Assembly 2025, Vienna, Austria, 27 Apr–2 May 2025, EGU25-84, https://doi.org/10.5194/egusphere-egu25-84, 2025.

EGU25-823 | ECS | Orals | BG3.2

Long-term Impacts of 1.5 °C Global Climate Pledges on China's Land Systems 

Peichao Gao, Changqing Song, Sijing Ye, Yifan Gao, Jiaying Lv, Yuanhui Wang, Haoyu Wang, and Fang Li

Global warming is a critical global challenge, and at the 26th Conference of the Parties to the UNFCCC in 2021, nations committed to limiting the global temperature rise to within 1.5°C by 2100. As a signatory, China has introduced ambitious climate targets, including carbon peaking and neutrality goals, which will significantly influence its land system changes. This study, focusing on China, integrates data from the Global Change Assessment Model (GCAM) with an enhanced CLUMondo model to simulate land system changes under two scenarios: a 1.5°C warming scenario and a reference scenario without updated emissions measures. The results show high simulation accuracy and highlight that, under the 1.5°C scenario, ecosystems improve, with shrubland, wetland, and forest areas projected to grow significantly, especially in southern and coastal regions. However, cropland is expected to decrease, with up to 35% converted to wetlands and forests by 2100, particularly in key grain-producing regions, raising food security concerns. These findings underscore the profound impacts of 1.5°C climate pledges on China’s land systems, offering crucial insights for climate risk mitigation and sustainable development.

How to cite: Gao, P., Song, C., Ye, S., Gao, Y., Lv, J., Wang, Y., Wang, H., and Li, F.: Long-term Impacts of 1.5 °C Global Climate Pledges on China's Land Systems, EGU General Assembly 2025, Vienna, Austria, 27 Apr–2 May 2025, EGU25-823, https://doi.org/10.5194/egusphere-egu25-823, 2025.

EGU25-1393 | ECS | Posters on site | BG3.2

Exploring the Climate Mitigation Potential of Afforestation in Europe using Species-Specific Modelling 

Tyler Houston and Marcus Breil

Afforestation in the mid-latitudes exhibits uncertain climate benefits due to dominating biogeophysical effects. While forestation is an important carbon sink, the balance of increased albedo and evapotranspiration remains the primary factor dictating the net climate benefit of afforestation in the region. We aim to formulate optimal strategies for afforestation in Europe and discover if a positive climate benefit can be achieved. We are performing idealised afforestation simulations with ICON-ESM while incorporating species-specific information into the included JSBACH land-surface model. This has been gathered through a tree species data inventory, resulting in the parameterisation of the following variables for eight European tree species: Vegetation Height, Maximum LAI, Maximum Surface Roughness, Maximum Woody Carbon, and Albedo (VIS/NIR). By incorporating this information into existing JSBACH PFTs, we create new species-specific PFTs with which to simulate the effects of monospecific afforestation. This idealised afforestation will be carried out for each species across Europe. The local climate effects will then be compared on a cell-by-cell basis to determine the most beneficial species for afforestation in each region. This focus on the comparison of inter-species differences will elicit the trees species locally best-suited for climate mitigation, allowing optimized afforestation strategies to be developed. Results from these experiments will be presented and initial conclusions drawn regarding such strategies.

How to cite: Houston, T. and Breil, M.: Exploring the Climate Mitigation Potential of Afforestation in Europe using Species-Specific Modelling, EGU General Assembly 2025, Vienna, Austria, 27 Apr–2 May 2025, EGU25-1393, https://doi.org/10.5194/egusphere-egu25-1393, 2025.

EGU25-1640 | ECS | Orals | BG3.2

Land Structure Change and Ecological Effects Under Future Development Scenarios in Tarim River Basin, Central Asia 

Yifeng Hou, Yaning Chen, Yupeng Li, Fan Sun, and Xueqi Zhang

Land is important in the productive life of human societies, as the ecological environment has been shown to be closely related to societal advancement. Currently, the dynamics of land use and cover change (LUCC) have emerged as a focal point in global change studies, playing a key role in urbanization development, regional climate, agricultural production, and ecological sustainability. Driven by the global context of increasing population, the human-land conflict is deepening issues around resource utilization and environmental problems. Soil and water matching in a land basin is important for securing land demand, alleviating human-land conflicts, and promoting sustainable development in the region. The Tarim River Basin (TRB) is the largest inland river basin in China and primarily sustains an agricultural economy centered around oases. 

Over the past half-century, global warming and carbon emissions have become a serious threat to the sustainable development of society. It is therefore critically important to find viable solutions to the structural layout of land use that will promote current and future ecological security in the southern Xinjiang region. The aim in conducting the present study is to explore options for safeguarding the demand for land in the TRB and to promote the synergistic development of regional socio-economic and ecological environments. Using remote sensing data, the study will employ the PLUS model to simulate the evolution of spatial and temporal land-use patterns in the basin under different future scenarios while also considering the ecological value of land-use types. The connection between land development and the ecological environment is examined through the lens of relative ecological value and ecological impact. This study provides a strong scientific foundation for future land management and ecological sustainable development in the TRB.

How to cite: Hou, Y., Chen, Y., Li, Y., Sun, F., and Zhang, X.: Land Structure Change and Ecological Effects Under Future Development Scenarios in Tarim River Basin, Central Asia, EGU General Assembly 2025, Vienna, Austria, 27 Apr–2 May 2025, EGU25-1640, https://doi.org/10.5194/egusphere-egu25-1640, 2025.

EGU25-1898 | Orals | BG3.2

Exploring land-based ecosystem carbon sources and sinks 

Zhangcai Qin, Josep Canadell, Philippe Ciais, Min Chen, Susan Cook-Patton, Tingting Li, Umakant Mishra, Shilong Piao, Pete Smith, Yijie Wang, Wenping Yuan, and Yakun Zhu

Our understanding of regional net carbon flux from land-based ecosystems and land-use changes has been evolving and improving as more data and advanced models become available. However, the size and attribution of carbon sources and sinks related to existing and potential land-use and land-use change (LUC) activities are still often debated, especially in the context of climate change mitigation and carbon neutrality. In this presentation, we aim to convey several key messages derived from our recent findings based on updated data and newly developed models (mechanistic and machine learning-based).   Using a new bookkeeping model (i.e., LUCE), we demonstrate that LUC has contributed to global net CO2 emissions, with forest-related activities (e.g., deforestation, reforestation) dominating changes in carbon fluxes. LUC could shift from a net carbon source to a net carbon sink in some regions with extensive gains in forest area particularly due to reforestation and afforestation. However, upon further examination of future land-use scenarios, we find that the large potential of carbon sequestration estimated from newly grown forests should be scrutinized from both ecological and socioeconomic perspectives. The role of the land sector in the global carbon budget could change over time and space, but an urgently needed positive change (from a carbon source to a sink) relies heavily on what we can and decide to do next.

How to cite: Qin, Z., Canadell, J., Ciais, P., Chen, M., Cook-Patton, S., Li, T., Mishra, U., Piao, S., Smith, P., Wang, Y., Yuan, W., and Zhu, Y.: Exploring land-based ecosystem carbon sources and sinks, EGU General Assembly 2025, Vienna, Austria, 27 Apr–2 May 2025, EGU25-1898, https://doi.org/10.5194/egusphere-egu25-1898, 2025.

EGU25-2235 | ECS | Orals | BG3.2

Mapping Land Use Transformations in the Eastern part of the EMMENA Region in the last two decades. Addressing Food Security from a Land Use Perspective. 

Dimitris Koumoulidis, Ioannis Varvaris, Christos Theocharidis, Diofantos Hadjimitsis, and Charalampos Kontoes

Arable land and its quality are the principal sources of food supplies and fundamental determinants of food security. They underpin essential ecosystem services and food provisioning. The Food and Agriculture Organization (FAO)[1] identifies four critical dimensions—availability, access, utilization, and stability—that support food security. Ensuring the integrity of these dimensions is of the utmost importance.

Preserving agricultural productivity is crucial; nonetheless, adverse policies and practices, such as repurposing fertile land for urban expansion, overgrazing, deforestation, and ineffective irrigation methods, play a significant role in land quality and productivity degradation. Furthermore, when these issues are coupled with environmental and climatic modifications, they can impact numerous domains, including water management, public health, transportation, ecosystems, biodiversity, and human-induced hazards such as forest fires.

The EMMENA (East Mediterranean, Middle East and North Africa) spans diverse countries from Morocco to Yemen and Saudi Arabia, varying politically, economically, culturally, and environmentally. The region includes twenty-two countries covering approximately 12 million Km2. Multiple criteria guided the choice of this study area, given that the EMMENA region is characterized by marked social disparities. The region’s populations are vulnerable to climate and suffer the most from climate change effects, particularly as far as extreme heat occurrences and water scarcity combined with agriculture and ecosystem losses are concerned. Additionally, projections indicate that the population of the region’s expansive eastern part will surpass 1 billion by 2100. This demographic surge in areas with restricted agricultural land and limited water resources creates substantial socio-economic challenges and environmental effects. In the eastern area of the EMMENA region, limited and unevenly distributed water resources often create a dissonance between the demands of human communities and the necessity for environmental sustainability. Ultimately, according to FAO[2], the eastern segment of the region (Middle East) is witnessing frequent violent incidents across several countries. Jordan and Lebanon, which accommodate most refugees in the area, as well as the current instability in Syria, are experiencing substantial challenges in the stewardship of their natural resources, particularly land and water.

This study uses satellite imagery from the Landsat Thematic Mapper to investigate land-use alterations from 2000 to 2020 in Jordan, Syria, Lebanon, and Cyprus. The analysis incorporates the GlobeLand30 dataset, developed and sourced from the Global Land Discovery & Analysis[3] website provides global land cover data at a resolution of 30m to accurately depict the area’s land cover characteristics. ArcGIS maps from 2000, 2005, 2010, 2015, and 2020 were scrutinized to evaluate net land-use changes across ten classes, including grasslands, cultivated areas, forests, water bodies, and artificial surfaces.

The findings indicate a notable agricultural land abandonment in Syria, with a lesser degree observed in Lebanon. Every country has a discernible increase in the proliferation of built-up environments, particularly close to substantial residential areas. In Cyprus and Lebanon, forested regions characterized by tall vegetation have been devastated by wildfires, while in Jordan, minor land-use modifications are evident due to the desert landscape, the country's flat topography, and the arid climatic conditions.


[1] The State of Food and Agriculture 2006

[2] https://openknowledge.fao.org/server/api/core/bitstreams/766356ba-d028-4f06-b9b8-04d65bd8149c/content

[3] GLAD Global Land Analysis & Discovery

How to cite: Koumoulidis, D., Varvaris, I., Theocharidis, C., Hadjimitsis, D., and Kontoes, C.: Mapping Land Use Transformations in the Eastern part of the EMMENA Region in the last two decades. Addressing Food Security from a Land Use Perspective., EGU General Assembly 2025, Vienna, Austria, 27 Apr–2 May 2025, EGU25-2235, https://doi.org/10.5194/egusphere-egu25-2235, 2025.

EGU25-2311 | ECS | Orals | BG3.2

Future land carbon removals in China consistent with national inventory 

Yue He, Shilong Piao, Philippe Ciais, Hao Xu, and Thomas Gasser

China’s commitment to carbon neutrality by 2060 relies on the Land Use, Land-Use Change, and Forestry (LULUCF) sector, with forestation targets designed to enhance carbon removal. However, the exact sequestration potential of these initiatives remains uncertain due to differing accounting conventions between national inventories and scientific assessments. Here, we reconcile both estimates and reassess LULUCF carbon fluxes up to 2100, using a spatially explicit bookkeeping model, state-of-the-art historical data, and national forestation targets. We simulate a carbon sink of −0.24 ± 0.03 Gt C yr−1 over 1994–2018 from past forestation efforts, aligned well with the national inventory. Should the official forestation targets be followed and extended, this could reach −0.35 ± 0.04 Gt C yr−1 in 2060, offsetting 43 ± 4% of anticipated residual fossil CO2 emissions. Our findings confirm the key role of LULUCF in carbon sequestration, but its potential will decline if forestation efforts cease, highlighting the necessity for emission reductions in other sectors to achieve carbon neutrality.

How to cite: He, Y., Piao, S., Ciais, P., Xu, H., and Gasser, T.: Future land carbon removals in China consistent with national inventory, EGU General Assembly 2025, Vienna, Austria, 27 Apr–2 May 2025, EGU25-2311, https://doi.org/10.5194/egusphere-egu25-2311, 2025.

EGU25-2580 | ECS | Posters on site | BG3.2

The rough reality: How forests reshape tropical circulation and hydroclimate 

Nora L. S. Fahrenbach, Steven J. De Hertog, and Robert C. Jnglin Wills

While afforestation and avoided deforestation are important strategies for climate change adaptation and mitigation, their effects on atmospheric circulation and hydroclimate remain underexplored. Here, we use future afforestation simulations in an SSP1-2.6 and SSP3-7.0 world from seven CMIP6 models from the Land Use Model Intercomparison Project (LUMIP). Our results reveal robust increases in precipitation and evapotranspiration, coupled with widespread decreases in net moisture flux (i.e., decreases in precipitation minus evaporation) in the tropics, particularly over Africa. The moisture flux changes are driven by opposing effects of afforestation on upper and lower-tropospheric circulation: The increase in surface roughness significantly slows down the moisture-laden surface winds from the ocean, reducing moisture transport and suppressing topographically-induced precipitation. However, the concurrent increase in near-surface moist static energy strengthens convection and thus the upper-tropospheric circulation. These findings underscore the significant role of surface roughness changes and land-atmosphere interactions in shaping tropical hydroclimate, and highlight the need for careful consideration of the hydroclimate impacts of land-based climate strategies.

How to cite: Fahrenbach, N. L. S., De Hertog, S. J., and Jnglin Wills, R. C.: The rough reality: How forests reshape tropical circulation and hydroclimate, EGU General Assembly 2025, Vienna, Austria, 27 Apr–2 May 2025, EGU25-2580, https://doi.org/10.5194/egusphere-egu25-2580, 2025.

EGU25-3441 | ECS | Posters on site | BG3.2

Overlooked deforestation from global mining activities in the 21st century 

Xiaoxin Zhang, Bin Chen, Jiafu An, and Chen Lin

Mining is a major driver of deforestation. However, quantitatively estimating its full impact on natural forests and the associated carbon emissions is challenging due to incomplete global data on mining activities. Here, we compiled a comprehensive inventory of global mining activities, including 236,028 mining areas with an overall accuracy of 87.37% to analyze deforestation within mining areas and the associated forest carbon emissions from 2001 to 2023. Our results reveal that deforestation directly caused by mining activities is two to three times higher than previously estimated from widely used mining datasets, accounting for 19,765 km2 of deforestation and 0.75 Pg CO2 of carbon emission in the 21st century. Notably, 50.29% of this deforestation is linked to undocumented mining activities. This study highlights the significant deforestation directly caused by mining activities on a global scale, and particularly underscoring the environmental impact of informal mining.

How to cite: Zhang, X., Chen, B., An, J., and Lin, C.: Overlooked deforestation from global mining activities in the 21st century, EGU General Assembly 2025, Vienna, Austria, 27 Apr–2 May 2025, EGU25-3441, https://doi.org/10.5194/egusphere-egu25-3441, 2025.

EGU25-3551 | ECS | Orals | BG3.2

A globally consistent negative effect of edge on aboveground forest biomass 

Gayoung Yang, Thomas W. Crowther, Thomas Lauber, Constantin M. Zohner, and Gabriel Reuben Smith

Because of widespread forest fragmentation, 70% of the world’s forest area lies within 1 km of an edge. Forest biomass density near edges often differs markedly from biomass density in the interior. In some biomes, these “edge effects” are responsible for significant reductions in forest carbon storage. However, there is little consensus on the sign and magnitude of edge effects on forest biomass across the globe, which hampers their consideration in forest carbon stock accounting. Here, we examined eight million forested locations to quantify variability in edge effects at a global scale. We found negative edge effects across 97% of examined areas, with aboveground biomass density lower near edges than in interior forests. Higher temperature, precipitation, and proportion of agricultural land are linked to more negative edge effects. Along with differences in the spatial scale of analysis, this variation can explain contrasting observations among previous studies. We estimate that edge effects have reduced the total aboveground biomass of forests by 9%, equivalent to a loss of 58 Pg. These findings underscore the substantial impact of forest fragmentation on global biomass stocks and highlight the critical need to account for edge effects in carbon stock assessments.

How to cite: Yang, G., Crowther, T. W., Lauber, T., Zohner, C. M., and Smith, G. R.: A globally consistent negative effect of edge on aboveground forest biomass, EGU General Assembly 2025, Vienna, Austria, 27 Apr–2 May 2025, EGU25-3551, https://doi.org/10.5194/egusphere-egu25-3551, 2025.

EGU25-4057 | ECS | Orals | BG3.2

SCISSOR: a Spectral ClImate Signal SeparatOR to assess complex climate responses to land cover changes 

Felix Jäger, Jonas Schwaab, Mona Bukenberger, Steven J. de Hertog, and Sonia I. Seneviratne

While large-scale afforestation and reforestation are heavily discussed as strategies for nature-based climate change mitigation and adaptation, massive deforestation is ongoing. Such widespread land use and land cover changes (LULCCs) not only alter the global climate through biomass carbon uptake or release but also through biogeophysical (BGP) processes related to changes in surface roughness, evaporation, transpiration, and albedo. These BGP effects act as local forcing to land-atmosphere interactions and lead to in situ climate responses. Caused by advection and spatio-temporal land-atmosphere-ocean interaction, they also generate nonlocal climate responses that occur remotely from the LULCC.

The non-local partition of climate response signals, and how it occurs at spatial scales different from the forcing, is still the subject of ongoing research. Here, we present a spectral perspective on climate responses to surface forcing from LULCC that aids in achieving a systematic and mechanistic understanding of the arousal and robustness of large-scale BGP effects.

We introduce spectral decomposition of forcing and response fields into a sum of signals with different wavelengths based on spherical harmonics to compare the two fields across spatial scales. Building on this approach, we define the ’cross-scale’ response signal based on the difference of response and forcing spectra. With our novel tool SCISSOR, a Spectral ClImate Signal SeparatOR, we determine the cross-scale signal of BGP-driven temperature response to deforestation, which strongly resembles the nonlocal signal as estimated by established methods such as moving window regression and checkerboard interpolation.

We further show that SCISSOR and other spectral tools can be used to analyze consistent and divergent characteristics of climate responses to LULCC between Earth System Models. We discuss the assumptions, advantages and limitations of both SCISSOR and the established signal separation methods and assess their potential use for future analysis of the complex interaction between climate and land surface changes.

How to cite: Jäger, F., Schwaab, J., Bukenberger, M., de Hertog, S. J., and Seneviratne, S. I.: SCISSOR: a Spectral ClImate Signal SeparatOR to assess complex climate responses to land cover changes, EGU General Assembly 2025, Vienna, Austria, 27 Apr–2 May 2025, EGU25-4057, https://doi.org/10.5194/egusphere-egu25-4057, 2025.

EGU25-4303 | ECS | Orals | BG3.2 | Highlight

Agent-based modelling of alternative futures in the German land system: What are the socioecological impacts of land-based Carbon Dioxide Removal? 

Karina Winkler, Mohamed Byari, Maximilan Witting, Felix Gulde, and Mark Rounsevell

To achieve net-zero greenhouse gas emissions in the future, carbon dioxide removal (CDR), also known as negative CO2 emissions, is likely to become an essential part of the climate mitigation portfolio. In Germany, land-based CDR options such as bioenergy with carbon capture and storage (BECCS), agroforestry, forest management, and afforestation/reforestation are increasingly being discussed and integrated into potential future scenarios. However, it remains unclear how these options will affect future land use in Germany and what impacts this will have on ecosystem service provision.

Depending on future socioeconomic development and the progression of climate change, Germany can follow different paths for implementing CDR in the land system. We use a set of stakeholder-developed qualitative and quantitative CDR visions and Shared Socioeconomic Pathways (SSPs) combined with climate change scenarios to simulate the future land use change in Germany concerning afforestation/reforestation, forest management, agroforestry, and BECCS. For this, we develop CRAFTY-DE, a new agent-based model of the German land system that integrates a wide range of available land use/cover data and operates at a 1 km² resolution. Here, the demand for ecosystem services drives a range of interrelated land use agents with different productivities and dependencies on changing socio-economic and environmental conditions.

With CRAFTY-DE, we simulate the conditions under which CDR targets can be achieved in the German land system. In particular, we investigate the role of selected policy measures. Our research addresses the following questions: Which scenarios offer favourable conditions for which CDR measures and thus synergies between ecosystem services? How can specific policy measures support this? What are the trade-offs and land use conflicts associated with CDR measures?

Identifying possible pathways of land use change and the resulting synergies and trade-offs associated with CDR will become an important knowledge base for policymakers, industry, and stakeholders regarding the scope for action in the development of land-based CDR in Germany.

How to cite: Winkler, K., Byari, M., Witting, M., Gulde, F., and Rounsevell, M.: Agent-based modelling of alternative futures in the German land system: What are the socioecological impacts of land-based Carbon Dioxide Removal?, EGU General Assembly 2025, Vienna, Austria, 27 Apr–2 May 2025, EGU25-4303, https://doi.org/10.5194/egusphere-egu25-4303, 2025.

EGU25-4384 | ECS | Orals | BG3.2 | Highlight

Developing land use strategies in Europe under climate change and legislative constraints 

Konstantin Gregor, Christopher P.O. Reyer, Thomas A. Nagel, Annikki Mäkelä, Andreas Krause, Thomas Knoke, and Anja Rammig

Land use, land management, and land cover change (LULCC) play a pivotal role in shaping ecosystems, influencing global and local climate, biodiversity, and the provision of resources.
Therefore, effective land use strategies need to consider the trade-offs between these often competing objectives. 

Legislative frameworks, including the EU Biodiversity Strategy, EU Forest Strategy, and national policies, aim to protect natural landscapes, enhance ecosystem services, and leverage resources for climate mitigation and the bioeconomy. However, reconciling these objectives poses a critical challenge for policymakers, land managers, and conservation stakeholders.

Using process-based ecosystem modeling and robust multi-criteria optimization, we analyzed how portfolios of forest management strategies could sustain multiple ecosystem services across diverse climate scenarios. The study incorporated strict constraints, such as protecting 10% of Europe’s land area and maintaining stable harvest levels under all climate scenarios. Results revealed significant trade-offs: limited flexibility due to the constraints led to low-diversity portfolios that compromised multi-functionality and increased regional risks. Moreover, productive northern regions would need to prioritize timber provision to compensate for declining harvests elsewhere, conflicting with targets for increasing forest carbon sinks in those regions. The uneven distribution of protected areas also introduced disparities in conservation efforts.

Our findings underscore the need for coordinated European land use strategies that address these conflicts. Complementary measures to the EU strategies are essential to achieve goals for carbon sequestration, resource availability, and ecosystem services under a changing climate. While the analysis focused on forests, the approach can be adapted to other land use types.

How to cite: Gregor, K., Reyer, C. P. O., Nagel, T. A., Mäkelä, A., Krause, A., Knoke, T., and Rammig, A.: Developing land use strategies in Europe under climate change and legislative constraints, EGU General Assembly 2025, Vienna, Austria, 27 Apr–2 May 2025, EGU25-4384, https://doi.org/10.5194/egusphere-egu25-4384, 2025.

In the future, agricultural land use is expected to continue expanding to meet the increasing food demand driven by population and economic growth. However, policy actions aimed at addressing climate change and biodiversity loss may impose constraints this expansion, leading to a triple land-use conflict. By linking land conservation priority data with the global economic land-use model (GLOBIOM), this study assesses the climate mitigation potential, biodiversity benefits, and food security risks under land-based climate mitigation and biodiversity conservation measures. The results indicate that dual measures could contribute to a cumulative carbon reduction of 242 Gt between 2020 and 2050, while maintaining global biodiversity integrity at 2020 levels by 2050. However, this would require a reduction in agricultural land use before mid-century, leading to a 57% increase in global food prices by 2050 compared to the baseline scenario and an additional 368 million people at risk of undernurishment, compared to 257 million under only climate mitigation measures. This is primarily due to the significant amplification effect of BECCS on food security under the land protection expansion scenario. Extensive scenario simulations based on Monte Carlo sampling reveal a nearly linear relationship between the carbon reduction potential of land-based measures and the resulting additional undernurishment risks, while the marginal biodiversity benefits decrease, further highlighting the "impossible trinity" of climate mitigation, biodiversity conservation, and food security arising from land-use conflicts. Although this study suggests that global food aids or agricultural subsidies could address the side effect at a cost of around 0.39% of GDP, the actual potential for food assistance remains limited.

How to cite: Ma, X. and Dai, H.: Joint action for climate mitigation and biodiversity conservation may undermine global food security, EGU General Assembly 2025, Vienna, Austria, 27 Apr–2 May 2025, EGU25-4654, https://doi.org/10.5194/egusphere-egu25-4654, 2025.

Forestation significantly affects local temperatures, yet its effects on land surface temperature (LST) are complex and context-dependent. While much research has focused on the cooling effects of forestation globally by latitudes, less attention has been given to regional, seasonal and class-specific variations in LST.

This study examines how forestation changes daytime LST using a percentile-based approach and identifies climatic drivers of forest greenness through random forest regression across India's diverse forest types, including tropical, temperate, montane, alpine, and sub-alpine, which are further divided into 14 classes. It finds that forestation has both cooling and warming effects depending on forest class and percentiles, with cooling observed in 9 out of 14 forest classes, ranging from -4.1°C in mangroves to warming by 4.8°C in montane dry temperate forests. Forestation cools areas between 12–25°N but warms regions outside this range. Monthly temperature variations are substantial, with Class 13 warming during JJAS and MAM season and Class 5 cooling year-round. Greening variation is primarily driven by latent heat, which explains over 70% of the variation in Classes 4, 5, and 6, and by net photosynthesis, which accounts for up to 69.4% in Class 14. Other factors, such as precipitation, PDSI, and soil moisture, influence forest-specific LAI regulation.The study highlights the importance of spatial and temporal heterogeneity in assessing forestation’s effects on LST, providing valuable insights for climate adaptation and forest management, while suggesting future research to explore microclimatic feedbacks and long-term ecosystem impacts.

Keywords: Forestation, Land Surface Temperature, Climatic Drivers, Greenness,  Seasonal Variation

How to cite: Sharma, J. and Kumar, P.: Quantification of Potential Forestation induced change in Daytime Land Surface Temperature in India, EGU General Assembly 2025, Vienna, Austria, 27 Apr–2 May 2025, EGU25-5008, https://doi.org/10.5194/egusphere-egu25-5008, 2025.

Dryland ecosystems provide a wide range of ecological services essential to human well-being, but the poor soils of drylands make them highly vulnerable to damage from human activities, with far-reaching economic and social consequences. Therefore, the study of human-nature interactions in drylands is important for sustainable development. However, the economic and social impacts of different forms of human-nature interactions vary widely. Traditional land cover-based studies of indicators of human-nature interactions in drylands have failed to adequately distinguish between these impacts. Therefore, based on the Google Earth Engine cloud platform, this study extracted and mapped the distribution of WUIs in China's drylands for the period 1990 to 2020 by combining a variety of data, including GHL-S building area and land cover data. In addition, the study quantitatively analyses the relationships between spatial and temporal changes, landscape-scale changes, and regional GDP and population changes in the WUIs of China's drylands.


The results show that the WUI area in China's drylands has increased by about 15.9% over the past 30 years, and this expansion trend is particularly concentrated near large urban agglomerations.The WUI areas in the landscape are characterised by diversity, fragmentation, homogeneity and edge simplicity, which indicate a complex spatial pattern. To further explore the relationship between WUI expansion and regional GDP and population changes, this study used the Pearson correlation coefficient at the scale of 486 dryland counties. The results show a strong relationship between WUI expansion and economic and population growth, suggesting that human-nature interactions in China's drylands have been increasing over the past three decades and that the associated risks are growing.


In particular, the expansion of the WUI has significantly changed the socio-economic structure of these areas, leading to more frequent natural disasters and public health events that seriously threaten the survival and development of human communities. The study highlights that increasing human activities in drylands can exacerbate problems such as ecological degradation, land desertification and water scarcity, making it particularly urgent to implement scientific landscape planning and sustainable development strategies in these regions. Such planning not only helps to mitigate the negative impacts of human activities on the environment, but also strikes a balance between economic development and ecological conservation, and promotes the harmonious coexistence of society and nature.


This study provides important quantitative data and insightful analytical perspectives for understanding WUI changes in China's drylands and their impacts on economic and social development. In the future, as data technology and analytical methods continue to advance, similar studies will play an increasingly important role in the sustainable development of the world's drylands. An in-depth study of the interactions between human activities and the natural environment can help policy-makers address the challenges facing drylands and ensure that the ecological, economic and social systems in these areas can achieve long-term sustainable development.

How to cite: Xu, S. and Liu, Y.: Intensifying Human-Nature Interaction on China’s Dryland Landscape: An Evidence from Wildland–urban Interface, EGU General Assembly 2025, Vienna, Austria, 27 Apr–2 May 2025, EGU25-5568, https://doi.org/10.5194/egusphere-egu25-5568, 2025.

EGU25-5786 | ECS | Orals | BG3.2

Regional climate modelling for a comprehensive understanding of forest management-induced biogeophysical climate impacts in Europe 

Yi Yao, Petra Sieber, Jonas Schwaab, Felix Jäger, and Sonia I. Seneviratne

Forests play a crucial role in European climate policy, owing to their potential for carbon sequestration, climate adaptation, biodiversity conservation, and other ecosystem services. Forest management directly changes land surface properties, e.g., albedo and roughness, and therefore has biogeophysical (BGP) impacts locally and potentially remotely due to advection and circulation. Previous studies investigating BGP climate impacts of forests focused on af/de-forestation, neglecting other types of forest management, like species change, tree health improvement, etc. To fill this gap, we employ the regional climate model COSMO-CLM, coupled with a land surface model with elaborate forest representation, CLM5, to perform simulations under multiple forest management scenarios. These scenarios vary in forest coverage, forest composition, and forest health (represented by leaf area index and canopy height), which allow us to detect the changes in climate induced by different forest management types and their combinations. The first results show that forest management-induced impacts have substantial spatial- and temporal- heterogeneity. Key findings include (i) both deforestation and broadleaf trees afforestation can decrease summer daily maximum temperature; (ii) broadleaf trees also increase winter daily minimum temperature in mid-latitude areas compared to needleleaf trees; (iii) afforestation increases precipitation in coastal regions of West Europe; and (iv) needleleaf trees afforestation decreases precipitation in the inland of Europe, but broadleaf trees afforestation increases it, etc. In our ongoing work, we will focus on understanding the mechanism behind these impacts by investigating changes in energy fluxes, water fluxes, wind speeds and other relevant variables.

How to cite: Yao, Y., Sieber, P., Schwaab, J., Jäger, F., and Seneviratne, S. I.: Regional climate modelling for a comprehensive understanding of forest management-induced biogeophysical climate impacts in Europe, EGU General Assembly 2025, Vienna, Austria, 27 Apr–2 May 2025, EGU25-5786, https://doi.org/10.5194/egusphere-egu25-5786, 2025.

Land consolidation (LC) is an important land use activity in China. Especially under the background of global climate change and national carbon neutrality strategy, it is particularly important to study the relationship between LC and carbon cycle. Existing studies lack the carbon effects analysis of the whole process and the exploration of low-carbon optimization strategies. Therefore, from the perspective of the whole life cycle, this study applied Life Cycle Assessment (LCA) method to construct a research framework and accounting system for carbon footprint assessment of LC, and then explored the decision-making optimization path of low-carbon LC construction based on the ISM model. Results showed that: (a) The carbon effect of the project area was characterized as carbon sink during the whole life cycle of LC, with the amount of 492tCE. (b) Carbon effect varied among different stages of LC. The Restoration Period (RP) and the Benefit Period (BP) were characterized as carbon sink, while all the other stages were manifested as carbon emission. Among them, as to the carbon emission, the Construction Period (CP) played a decisive role with the most proportion, followed by DP, and the carbon effect of PP was negligible. (c) Based on the calculation of ISM model, 17 low-carbon measures were divided into three levels. The analysis results show that measures such as improving the quality of cultivated land and protecting the Ecological Redline would play a decisive role in the low-carbon development of LC. This study contributes to providing certain theoretical guidance and method reference for the realization of Low-Carbon LC project planning.

How to cite: Shan, W.: Study on the carbon effects of land consolidation and optimization path of low-carbon decision-making from the perspective of life cycle, EGU General Assembly 2025, Vienna, Austria, 27 Apr–2 May 2025, EGU25-5812, https://doi.org/10.5194/egusphere-egu25-5812, 2025.

EGU25-6052 | ECS | Orals | BG3.2

Future Forests: estimating biogenic emissions from net-zero aligned afforestation pathways in the UK 

Hazel Mooney, Stephen Arnold, Ben Silver, Piers Forster, and Cat Scott

Woodlands sequester carbon dioxide from the atmosphere, which could help mitigate climate change. As part of an effort to reach net-zero greenhouse gas emissions by the year 2050, the UK’s Climate Change Committee (CCC) recommend increasing woodland cover from a UK average of 13% to 17-19%. Woodlands also have the potential to affect air quality, in part due to the emission of biogenic volatile organic compounds (BVOCs) which are precursors to major atmospheric pollutants, ozone (O3) and particulate matter (PM). This study presents for the first-time estimates of BVOC emissions that are consistent with net-zero aligned afforestation in the UK. The BVOC emission scenarios consider suitability of tree species for the UK coupled with regionally appropriate emissions potentials. We quantify the potential emission of BVOCs from five afforestation experiments using the Model of Emissions of Gases and Aerosols from Nature (MEGAN) (v2.1) in the Community Land Model (CLM) (v4.5) for the year 2050. Experiments were designed to explore the impact of the variation in BVOC emissions potentials between and within plant functional types (PFTs) on estimates of BVOC emissions from UK land cover, to understand the scale of change associated with afforestation to 19% woodland cover by the year 2050.  

Our estimate of current annual UK BVOC emissions is 40 kt yr-1 of isoprene and 46 kt yr-1 of total monoterpenes. Broadleaf afforestation results in a change in UK isoprene emission of between -4% and +131%, and a change in total monoterpene emission of between +6% and +52%. Needleleaf afforestation leads to a change in UK isoprene emission of between -3% and +20%, and a change in total monoterpene emission of between +66% and +95%.   

Our study highlights the potential for net-zero aligned afforestation to have substantial impacts on UK BVOC emissions, and therefore air quality, but also demonstrates routes to minimising these impacts through consideration of the emissions potentials of tree species planted. We show that incorporating regionally appropriate emissions factors, information about present day abundance of tree species, and the likely role of different species in the UK’s future forests, can substantially alter estimates of emissions. This study highlights an important interaction between the land and the atmosphere, for climate change mitigation options, specifically afforestation, to hold the potential to impact air quality. 

How to cite: Mooney, H., Arnold, S., Silver, B., Forster, P., and Scott, C.: Future Forests: estimating biogenic emissions from net-zero aligned afforestation pathways in the UK, EGU General Assembly 2025, Vienna, Austria, 27 Apr–2 May 2025, EGU25-6052, https://doi.org/10.5194/egusphere-egu25-6052, 2025.

EGU25-6225 | ECS | Posters on site | BG3.2

Attributing gridded land use change carbon emissions to crop and grass production from 2000 to 2020. 

Belen Benitez, Carole Dalin, and Bertrand Guenet

Food systems are responsible for one-third of global greenhouse gas (GHG) emissions, and these emissions are predominantly driven by land-based and land-use change (LUC) emissions linked to agricultural production (Crippa, M. et al., 2021). Incorporating all sources of GHG emissions, including those from land-use change, is essential for fully assessing the sustainability of agricultural production and enabling informed decision-making. However, many studies either overlook LUC-related emissions, do not account for diverse land-use change scenarios, neglect to accurately differentiate the agricultural commodities driving the change, or focus on aggregated subnational scales (Halpern, B.S. et al., 2024; Singh, C., & Persson, 2022; Lam, W. Y. et al., 2021). Our research addresses these gaps by providing high-resolution (5 arc-minute), global-scale estimates of LUC emissions attributed to crop and livestock production from 2000 to 2020. We quantify LUC emissions and attribute them to specific crops and pasture established on newly converted lands, providing crop- and grass-specific carbon emission intensities, which represent the carbon emissions generated per ton of production. Additionally, our study integrates emissions resulting from new pasture areas into livestock GHG emission intensity data from previous research, providing a more detailed livestock emission assessment. This approach offers a comprehensive evaluation of the carbon footprint of crop and livestock production and reveals the spatial and temporal dynamics of LUC-related emissions, thus providing valuable insights into the environmental impact of agricultural expansion.

How to cite: Benitez, B., Dalin, C., and Guenet, B.: Attributing gridded land use change carbon emissions to crop and grass production from 2000 to 2020., EGU General Assembly 2025, Vienna, Austria, 27 Apr–2 May 2025, EGU25-6225, https://doi.org/10.5194/egusphere-egu25-6225, 2025.

EGU25-6375 | ECS | Orals | BG3.2

Water and land management scenarios for addressing land subsidence in the Netherlands 

Muhannad Hammad, Kim Cohen, Gilles Erkens, and Esther Stouthamer

Land subsidence is a wicked problem that presents significant challenges to both urban and rural areas in the Netherlands. With annual subsidence rates reaching up to 10 mm in urban areas and over 30 mm in rural polder areas, the increasing damage caused by subsidence represents a long-term economic burden at both regional and national levels. Additionally, the land subsidence process contributes to greenhouse gas (GHG) emissions, further exacerbating environmental challenges. Addressing the persistent losses and emissions associated with land subsidence is a complex task that requires a holistic approach.

This study explores the role of integrated water and land management in mitigating land subsidence and the associated impacts on both society and the Earth system, using our backcasting approach developed within the Living on Soft Soils research programme [nwa-loss.nl]. This approach begins by formulating alternate long-term objectives for 2050, focusing on minimizing subsidence rates, reducing subsidence-related GHG emissions, and mitigating associated economic damage. These objectives were explicitly defined for both rural and urban contexts, with input from scientists and stakeholders. The three alternate objectives reflect varying levels of ambition and feasibility, with continued unaltered management practises, representing the business-as-usual scenario, serving as a baseline for comparison. Next, preparing the backcasting approach requires to define and select the water and land management measure sets that simulation modelling may select to alter land subsidence and the associated impacts from business as usual. Between rural and urban areas, the water management strategies of reducing the groundwater level lowering are fairly similar, but for the land management strategies there are strong context differences. In some rural areas, to reach the long-term objective one may opt for drastic land use changes, e.g. changing established agriculture into paludiculture, or reallocating land to forests or wetlands (in tandem with raising groundwater tables, serving GHG reduction and ecosystem restoration goals), while maintaining established agricultural use in other rural areas with higher groundwater levels and less drastic water management measures or less reducing the groundwater level lowering. In urban areas, land management strategies focus on soil stabilization, blue-green infrastructure, and district-level interventions to mitigate subsidence while enhancing urban resilience to climate change.

The modelling steps in this study explore the solution space and develops land subsidence management scenarios towards the three sustainable long-term objectives. Model runs using the water and land management strategies either individually or in different combinations. The performance of scenarios is evaluated based on their ability to reduce subsidence and the associated socioeconomic cost terms. With the performance analysed, the outcomes are lined up to introduce sustainable pathways for implementing measure sets, allowing stakeholders and decision-makers to make informed decisions and choose the most feasible and sustainable options, ensuring that these interventions are tailored to the local context and conditions, and also that these interventions contribute to broader Earth system sustainability.

In conclusion, this study highlights the role of integrating water and land management strategies in addressing land subsidence via a framework provides scenarios and pathways toward achieving sustainable land subsidence management in the Netherlands.

How to cite: Hammad, M., Cohen, K., Erkens, G., and Stouthamer, E.: Water and land management scenarios for addressing land subsidence in the Netherlands, EGU General Assembly 2025, Vienna, Austria, 27 Apr–2 May 2025, EGU25-6375, https://doi.org/10.5194/egusphere-egu25-6375, 2025.

EGU25-6588 | ECS | Orals | BG3.2

Blue in green: forestation turns blue water green, mitigating heat at the expense of water availability 

Olivier Asselin, Martin Leduc, Dominique Paquin, Nathalie de Noblet-Ducoudré, Diana Rechid, and Ralf Ludwig

In order to meet a stringent carbon budget, shared socioeconomic pathways (SSPs) aligned with the Paris Agreement typically require substantial land-use changes (LUC), such as large-scale forestation and bioenergy crop plantations. What if such a low-emission, intense-LUC scenario actually materialized? In this contribution, we quantify the biophysical effects of LUC under SSP1-2.6 using an ensemble of regional climate simulations over Europe. We find that LUC projected over the 21st century, primarily broadleaf-tree forestation at the expense of grasslands, reduce summertime heat extremes significantly over large swaths of continental Europe. In fact, cooling from LUC trumps warming by greenhouse gas (GHG) emissions, resulting in milder heat extremes by 2100 for about half of the European population. Forestation brings heat relief by shifting the partition of turbulent energy fluxes away from sensible and towards latent heat fluxes. Impacts on the water cycle are then assessed. Forestation enhances precipitation recycling over continental Europe, but not enough to match the boost of evapotranspiration (green water flux). Run-off (blue water flux) is reduced as a consequence. Some regions experience severe drying in response. In other words, forestation turns blue water green, bringing heat relief but compromising water availability in some already-dry regions.

How to cite: Asselin, O., Leduc, M., Paquin, D., de Noblet-Ducoudré, N., Rechid, D., and Ludwig, R.: Blue in green: forestation turns blue water green, mitigating heat at the expense of water availability, EGU General Assembly 2025, Vienna, Austria, 27 Apr–2 May 2025, EGU25-6588, https://doi.org/10.5194/egusphere-egu25-6588, 2025.

High-resolution land use and land cover change (LULCC) products have become increasingly important in climate impact modelling. Simulating LULCC patterns on a fine scale enables us to uncover the intricate interconnections and heterogeneous characteristics inherent to terrestrial carbon and water cycles, as well as broader climate dynamics in the Anthropocene. Here, we present our recent advances in developing high-resolution LULCC datasets across multiple scales and their applications in various domains of climate impact modelling. By capturing the spatial heterogeneity of global and regional LULCC patterns, we illustrate how their spatiotemporal dynamics may evolve under diverse warming scenarios and the impacts of land-use changes on carbon sequestration, soil conservation, and land-atmosphere interactions. The outcomes highlight the critical role of spatially explicit LULCC datasets for advancing climate impact research and informing land-based adaptation strategies.

How to cite: Wu, X. and Cheng, C.: Developing high-resolution land use and land cover datasets to support climate impact modelling in the Anthropocene, EGU General Assembly 2025, Vienna, Austria, 27 Apr–2 May 2025, EGU25-7040, https://doi.org/10.5194/egusphere-egu25-7040, 2025.

EGU25-7051 | Orals | BG3.2

Exploring Climate Implications of Land-Cover Change in Europe Through High-Resolution Climate Modeling   

Luca Caporaso, Matteo Piccardo, Georgios Blougouras, Gregory Duveiller, Caspar Roebroek, Mirco Migliavacca, and Alessandro Cescatti

Afforestation and deforestation have profound and diverse biophysical and biogeochemical impacts on the climate system, especially in Europe, a region characterized by different climatic and ecological zones. As tree planting is often considered a viable way to increase carbon removal from the atmosphere, understanding these impacts is crucial for achieving the goals of the European Green Deal. This study aims to quantify the climate consequences of forest cover changes, evaluating both local and broader non-local biophysical interactions.

We use advanced regional climate modeling with a 5 km spatial resolution, using the Regional Climate Model (RegCM5) coupled with the Community Land Model (CLM4.5). Simulations include a baseline scenario and two scenarios representing afforestation and deforestation, covering 2004–2014. 

Key variables such as surface energy fluxes, air temperature, and radiative balances are analyzed to reveal the local and spillover effects of land use change. The high-resolution modelling approach captures spatial heterogeneity and provides detailed insights into temperature dynamics and energy flux variations across European landscapes.

The results reveal a marked asymmetry in the biophysical effects of afforestation and deforestation, with deforestation exerting a stronger signal than afforestation. This asymmetry depends on the initial forest cover conditions, underscoring the need for fine-scale assessments. These results underline the importance of guiding land use planning and policy formulation to ensure the development of sustainable and effective climate change strategies. This work contributes to climate adaptation and mitigation efforts by providing actionable insights for integrating advanced modelling tools into land management practices.

How to cite: Caporaso, L., Piccardo, M., Blougouras, G., Duveiller, G., Roebroek, C., Migliavacca, M., and Cescatti, A.: Exploring Climate Implications of Land-Cover Change in Europe Through High-Resolution Climate Modeling  , EGU General Assembly 2025, Vienna, Austria, 27 Apr–2 May 2025, EGU25-7051, https://doi.org/10.5194/egusphere-egu25-7051, 2025.

Terrestrial ecosystem carbon dynamics play a critical role in regulating the Earth system's carbon cycle, strongly influenced by atmospheric processes and land management policies. Climate change is transforming carbon cycling within ecosystems and their exchange with the atmosphere, while forest management policies are increasingly recognized as essential nature-based climate solutions. However, the long-term impacts of climate processes and forest management on carbon cycling—spanning historical, present, and future periods—remain poorly understood due to limitations in current modeling frameworks. This uncertainty hinders efforts to optimize forest management strategies and implement effective climate change mitigation measures.

To address these challenges, we employ the state-of-the-art compact Earth system model OSCAR to integrate carbon dynamics predictions from Dynamic Global Vegetation Models (DGVMs) and bookkeeping models. Using the GCB2023 dataset as a historical baseline, we drive the OSCAR model under a range of climate scenarios (i.e., SSP126 and SSP370) and land-use and land-cover change (LULCC) trajectories. Our analysis provides multi-scenario projections of terrestrial carbon fluxes, including regional and biome-specific annual carbon flux estimates through 2100. Additionally, we quantify the inertia of LULCC impacts and evaluate emissions from land-use changes under diverse socio-economic and forest policy pathways, and disentangle the relative contributions of environmental conditions and land-use policies to future carbon dynamics.

Our projections indicate that CO₂ concentrations drive long-term carbon sink trends, while climate variability predominately influences interannual fluctuations. In mid- to high-latitude regions, LULCC carbon balance exhibits minimal sensitivity to forest policies, acting as a modest carbon source or sink. Conversely, in low-latitude regions, robust forest policies are crucial to reversing the carbon source status associated with LULCC. Cumulative emissions from land use can be offset by carbon sinks arising from ecosystem restoration. These findings offer critical insights into the future trajectories of terrestrial carbon cycles and provide a foundation for developing targeted climate change mitigation strategies. Our dataset, which will be updated annually with the latest GCB assessments, serves as a valuable resource for global monitoring, policy evaluation, and strategy optimization.

How to cite: Zhang, D., Gasser, T., and Zheng, B.: Terrestrial Carbon Dynamics through 2100: Projections with OSCAR Highlighting Climate and Land Management Impacts, EGU General Assembly 2025, Vienna, Austria, 27 Apr–2 May 2025, EGU25-7385, https://doi.org/10.5194/egusphere-egu25-7385, 2025.


Golf courses have increasingly contributed to the economic growth of Vietnamese cities like Hanoi. However, their environmental impacts, particularly regarding land use and resource management, remain a concern. This study utilizes Sentinel-2 and Landsat satellite imagery, combined with Geographic Information Systems (GIS), to monitor golf courses in Hanoi’s metropolitan area. By evaluating two detection methods—Normalized Difference Vegetation Index (NDVI) analysis and feature recognition—we identify the strengths and limitations of these approaches in urban settings. While NDVI is constrained by similar vegetation signatures in tropical climates, feature recognition captures distinct golf course characteristics. The findings contribute to sustainable urban land use planning and highlight the potential of advanced remote sensing technologies in environmental conservation.

How to cite: Nguyen, K.-A. and Liou, Y. A.: Monitoring Hanoi's Golf Courses Using Remote Sensing and Machine Learning for Sustainable Land Use Planning, EGU General Assembly 2025, Vienna, Austria, 27 Apr–2 May 2025, EGU25-7746, https://doi.org/10.5194/egusphere-egu25-7746, 2025.

EGU25-7768 | ECS | Posters on site | BG3.2

Modeling the effects of vegetation greening on frozen ground over the Qinghai-Tibet Plateau 

Yuxuan Wang and Siqiong Luo

Vegetation greening on the Qinghai-Tibet Plateau (QTP) plays a crucial role in altering the energy balance and frozen ground conditions. As vegetation cover increases, albedo decreases, leading to surface warming. This study used high-resolution land-use datasets from different time periods to parameterize plant functional types (PFTs) on the QTP and conducted sensitivity simulations with the RegCM5.0-CLM4.5 model. By comparing land cover changes (LCC) across different years, the study evaluated the effects of vegetation greening on energy balance and frozen ground dynamics. The results show that LCC caused significant warming, with land surface temperature (LST) increasing by 0.10°C in 2000 and 0.36°C in 2020.  Soil temperature (ST) changes were observed as deep as 280 cm, with the largest variations between 2 cm and 100 cm depths, leading to increases of 0.07°C (in 2000) and 0.31°C (in 2020).  This warming intensified frozen ground thawing, expanding thawing regions and shrinking freezing areas.  Variations in LST and energy flux components were regionally dependent, influenced by meteorological factors and circulation patterns.  The findings underscore that vegetation greening, by reducing albedo, reshapes energy fluxes, increasing air temperature, LST, and ST, while accelerating thawing and reducing freezing in frozen ground regions.

How to cite: Wang, Y. and Luo, S.: Modeling the effects of vegetation greening on frozen ground over the Qinghai-Tibet Plateau, EGU General Assembly 2025, Vienna, Austria, 27 Apr–2 May 2025, EGU25-7768, https://doi.org/10.5194/egusphere-egu25-7768, 2025.

A significant portion of terrestrial surface water is returned to the atmosphere through vegetation transpiration, making vegetation dynamics—such as deforestation, reforestation, and Earth’s greening—a critical driver of land evapotranspiration and vegetation-climate feedbacks. However, Earth system models (ESMs) exhibit substantial discrepancies in simulating the direction and magnitude of vegetation effects on evaporation. These inconsistencies stem from the heterogeneity of land-cover changes and limitations in ground-based observations, which complicate the quantification of these responses. In this study, we identify key disparities among ESMs in simulating evaporation and transpiration responses to vegetation changes, which lead to divergent predictions of climate feedbacks. A central issue is the persistent underestimation of the transpiration-to-evaporation ratio (Et/E), despite observational evidence indicating that transpiration dominates terrestrial evaporation fluxes. This underestimation is further compounded by inadequate representations of groundwater processes and limited soil depth in models, which restrict the availability of water for vegetation transpiration. To address these shortcomings, we propose the integration of enhanced observation-based constraints on model sensitivity, improved transpiration parameterizations, and the explicit inclusion of groundwater processes in ESMs. These advancements are essential for reducing uncertainties in vegetation-climate feedback projections and improving the accuracy of Earth system modeling.

How to cite: Zeng, Z. and Liu, X.: Modelled Sensitivity of Evapotranspiration to Vegetation Change: Reconciling Observations and Earth System Models, EGU General Assembly 2025, Vienna, Austria, 27 Apr–2 May 2025, EGU25-7853, https://doi.org/10.5194/egusphere-egu25-7853, 2025.

EGU25-9004 | ECS | Orals | BG3.2

Forest fragmentation increased in over half of global forests during years 2000-2020 

Yibiao Zou, Thomas Crowther, Gabriel Smith, Haozhi Ma, Lidong Mo, Lalasia Bialic-Murphy, Peter Potapov, Klementyna Gawecka, Chi Xu, Pablo Negret, Thomas Lauber, Zhaofei Wu, Dominic Rebindaine, and Constantin Zohner

Deforestation leads to habitat fragmentation, which adversely affects global biodiversity. Although some studies, using a separation-focused definition, have reported a decrease in fragmentation across 75% of the world's forests over recent decades, a comprehensive and ecologically relevant understanding of global fragmentation patterns remains lacking. In this study, we analyzed global fragmentation trends from 2000 to 2020, employing metrics that emphasize connectivity, aggregation, or separation. Connectivity-focused metrics reveal that 51% of global forests, particularly in tropical regions (58%), have undergone increased fragmentation—a rate nearly double that suggested by previous separation-focused metrics. This increase is corroborated by aggregation-focused metrics, which indicate heightened fragmentation in approximately 58% of forests worldwide and across all biomes. Further analysis attributes this escalation primarily to human activities, such as shifting agriculture and logging. Importantly, tropical protected areas have exhibited reductions in fragmentation by up to 82% compared to non-protected areas, underscoring the success of conservation efforts in these regions.

How to cite: Zou, Y., Crowther, T., Smith, G., Ma, H., Mo, L., Bialic-Murphy, L., Potapov, P., Gawecka, K., Xu, C., Negret, P., Lauber, T., Wu, Z., Rebindaine, D., and Zohner, C.: Forest fragmentation increased in over half of global forests during years 2000-2020, EGU General Assembly 2025, Vienna, Austria, 27 Apr–2 May 2025, EGU25-9004, https://doi.org/10.5194/egusphere-egu25-9004, 2025.

EGU25-9338 | ECS | Orals | BG3.2

Urbanization amplifies continental- to regional-scale warming 

Tirthankar (TC) Chakraborty and Yun Qian

Urbanization has traditionally been overlooked while estimating past changes in large-scale climate and is not resolved in future climate projections. This is due to the small fraction of Earth's surface historically covered by cities, the lack of representation of urban areas in most climate and Earth system models, and observational practices that try to minimize the influence of urban heat islands on the climate signal. In this study, we integrate global land surface temperature observations, which avoid many of the sampling pitfalls of ground-based weather station data, with historical urban area estimates to reveal that the urban contribution to continental- and regional-scale warming has become more significant over time, particularly in rapidly urbanizing regions and countries in Asia. Our findings suggest that anticipated urban expansion over the next century will further amplify the urban influence on large-scale surface climate, with projections indicating an approximate increase of 0.16 K for North America and Europe under a high-emission scenario by 2100. Consequently, we propose that urbanization, akin to other forms of land use/land cover change, must be explicitly included in climate change assessments. This inclusion necessitates the integration of dynamic urban extent and biophysical processes into current-generation Earth system models, enabling the quantification of potential urban feedback on the climate system across various scales.

How to cite: Chakraborty, T. (. and Qian, Y.: Urbanization amplifies continental- to regional-scale warming, EGU General Assembly 2025, Vienna, Austria, 27 Apr–2 May 2025, EGU25-9338, https://doi.org/10.5194/egusphere-egu25-9338, 2025.

EGU25-9521 | Orals | BG3.2

Modelling land-use dynamics in Western Sahel since 1960 

Anem Dupre, Isabelle Gounand, Paul-Alain Raynal, and Caroline Pierre

Climate change and demographic growth are particularly acute in the Sahel, jeopardizing the sustainability of human land-uses. This call for research to provide relevant outputs to support policy-making in this area, especially in terms of land management and land degradation. In the Sahel, detailed observations of land use dynamics and drivers are scarce and existing global land-use models have difficulty representing it. One regional model has been developed by Stephenne and Lambin (2001) to fit the regional characteristics of Sahelian land use (SALU).

This communication explains how we adapted this model to the current state of the art to reconstruct past land-use dynamics in Senegal from 1961 to 2020. For that purpose, we warried out an extensive bibliographic search to obtain the most updated ranges for parameter values. We performed an in-depth analysis of the model's sensitivity to parameter uncertainties through delta-indices calculation. When applying the new model at national scale to Senegal, the so-obtained trends were consistent with available literature, exhibiting first agricultural expansion leading to deforestation, and then a switch to intensification in the mid-1990s, which affected both livestock forage consumption and fallow duration.

Finally, we apply the new model to a sub-region of Senegal: the Groundnut basin, that concentrates a large proportion of the national land-demand. This case-study showed the limits of the model when downscaling, as these demands were too high to be satisfied by the local production. This study thus opens perspectives for the refinement of landuse modelling in the Sahel, including for prospective scenarios addressing the future decades.

How to cite: Dupre, A., Gounand, I., Raynal, P.-A., and Pierre, C.: Modelling land-use dynamics in Western Sahel since 1960, EGU General Assembly 2025, Vienna, Austria, 27 Apr–2 May 2025, EGU25-9521, https://doi.org/10.5194/egusphere-egu25-9521, 2025.

EGU25-9934 | ECS | Posters on site | BG3.2

 Impact of Liming on Soil CO2 Emissions and Oil Palm Physiology in Tropical Peatlands 

M. B. Nicodemus Ujih, Rosazlin Abdullah, Akira Watanabe, Faustina Sangok, Nur Azima Busman, and Lulie Melling

Southeast Asia hosts the largest areas of tropical peatland in the world, with Malaysia’s contribution being significant, covering approximately 2.7 million hectares. Many of these areas have been converted to oil palm plantations and face distinctive challenges due to the high acidity of peat soil, about pH 3.3 – 3.5. Liming is implemented to decrease soil acidity and enhance soil fertility. However, the impact of liming on soil CO2 emissions and oil palm physiology in tropical peatlands remains underexplored. This study investigates the effects of liming on soil CO2 emissions and oil palm physiological variables such as assimilation rate (A), stomatal conductance (Gsw), intercellular CO2 concentration (Ci), transpiration (E), and intrinsic water use efficiency (iWUE) on tropical peat soils. The experiment was arranged in a randomized complete block design with four liming treatments: 0 (T1), 2 (T2), 4 (T3), and 8 (T4) t ha⁻¹. Soil pH increased significantly with an increase in lime application. The soil CO2 emission was significantly higher in T4 (203 g C m-2 yr-1), followed by T3 (184 g C m-2 yr-1), T2 (140 g C m-2 yr-1) and T1 (111 g C m-2 yr-1). Similarly, assimilation rate (A)exhibited significant differences across treatments, with T4 recorded the highest rate (15.1 µmol m-² s-¹), and the lowest is T1 (10.8 µmol m-² s-¹). Conversely, Gsw was higher in the T1 (0.32 mol m-² s-¹) than T4 (0.24 mol m-² s-¹). Soil CO2emissions positively correlated (p < 0.01) with soil pH, A, Ci, and chlorophyll content. In contrast, a significant negative correlation (p < 0.01) was observed with Gsw, and E. These findings highlight that liming improves soil acidity, and oil palm physiological variables but also accelerates soil carbon loss as CO2 emissions.

How to cite: Ujih, M. B. N., Abdullah, R., Watanabe, A., Sangok, F., Busman, N. A., and Melling, L.:  Impact of Liming on Soil CO2 Emissions and Oil Palm Physiology in Tropical Peatlands, EGU General Assembly 2025, Vienna, Austria, 27 Apr–2 May 2025, EGU25-9934, https://doi.org/10.5194/egusphere-egu25-9934, 2025.

EGU25-10035 | ECS | Orals | BG3.2

Trade-Offs and Synergies between Climate Change, Biodiversity, and Agricultural Economy Across Various Future Land Use Scenarios in Brazil. 

Thomas Gérard, Sietze Norder, Judith Verstegen, Jonathan Doelman, Stefan Dekker, and Floor Van der Hilst

Land-use change is a major driver of biodiversity loss and a key contributor to greenhouse gas emissions, making it crucial to mitigate climate change and preserve biodiversity. This is especially relevant for Brazil, where agricultural expansion impacts biodiversity- and carbon-rich biomes. Achieving Brazil's commitments to the Paris Agreement and the Convention on Biological Diversity requires balancing agroeconomic development with biodiversity preservation and climate change mitigation. However, more comprehensive information is needed on land-use trade-offs and synergies across varying global change contexts. To address this gap, we quantified trade-offs and synergies among these objectives through 2050 under three land-use change scenarios in Brazil. We assessed the impact of each scenario by estimating spatial changes in carbon stock, mammal distributions, and agricultural revenue. Our results confirm that agricultural growth in Brazil occurs at the expense of biodiversity preservation and climate change mitigation, and vice versa. The primary drivers of these trade-offs and synergies are changes in natural vegetation cover and agricultural land, led by global demand for agricultural products. Under a SSP3-7.0 scenario, rising demand for agricultural products from 2015 to 2050 is projected to expand agriculture into natural areas. This pathway increases Brazil's agricultural revenue by $39.7 billion USD annually but reduces land carbon stock by 4.5 Gt and shrinks mammal distribution areas by 3.4%. Conversely, the SSP1-1.9 scenario projects declining agricultural demand over the same period, driving the reconversion of agricultural land to natural vegetation. This shift increases carbon stock by 5.6 Gt and expands mammal distribution areas by 6.8%, though it would lower agricultural revenue by $19.7 billion USD annually. Our findings further highlight that containing agriculture outside biodiversity- and carbon-rich areas, along with strategic ecosystem restoration, presents opportunities to harmonize agroeconomic development with biodiversity preservation and climate change mitigation.

How to cite: Gérard, T., Norder, S., Verstegen, J., Doelman, J., Dekker, S., and Van der Hilst, F.: Trade-Offs and Synergies between Climate Change, Biodiversity, and Agricultural Economy Across Various Future Land Use Scenarios in Brazil., EGU General Assembly 2025, Vienna, Austria, 27 Apr–2 May 2025, EGU25-10035, https://doi.org/10.5194/egusphere-egu25-10035, 2025.

Forest gain in the tropics is always assumed to cool land surface as much as the warming induced by forest loss. However, the observations from multiple satellites show that the impacts of forest gain on local land surface temperature are robustly weaker than forest loss. This asymmetry comes from the contrasting changes of vegetation properties, which are verified by vegetation indices. Forest loss which is primarily caused by intense disturbances such as fire and deforestation, could result in the rapid change of biophysical processes, while forest gain is mainly related to vegetation regrowth, whose changes are not often that rapid. These asymmetric effects of forest gain and loss are not well represented in current Earth system models because of the fixed biophysical parameters used, thus could lead to the overestimation of the climatic mitigation of forestation in the future, especially in a short period. This highlights the necessity to improve the representation of forest demographic on biophysical vegetation properties for better projecting the climate benefits of future forestation.

How to cite: Zhang, Y.: Asymmetric impacts of tropical forest gain and loss on temperature due to forest growth revealed by satellite observation, EGU General Assembly 2025, Vienna, Austria, 27 Apr–2 May 2025, EGU25-10306, https://doi.org/10.5194/egusphere-egu25-10306, 2025.

EGU25-10669 | ECS | Posters on site | BG3.2

Mapping the Spatial Distribution of Anthropogenic Forest Disturbances in China from 1986 to 2020 

Yanwen Zhang and Shuangcheng Li

Forests have substantial potential to mitigate climate change through carbon sequestration and to deliver important co-benefits to society. Long-term datasets on anthropogenic forest disturbances are vital for understanding their impacts on terrestrial carbon budgets, hydrothermal balance, and climate regulation. However, there is currently no quantitative information regarding the patterns and trends of anthropogenic forest disturbances in China.

In this study, we developed a comprehensive forest disturbance dataset for China by integrating Landsat imagery with the LandTrend algorithm, thus capturing spatiotemporal changes in forest disturbances from 1986 to 2020. We then used socioeconomic and environmental satellite data and direct sources such as statistical yearbooks to identify anthropogenic forest disturbance information, applied LightGBM model to reconstruct their spatial patterns and evaluate key driving factors. Our results indicate that approximately 37% of China’s forests experienced disturbances over the past three decades. Following the implementation of national forest protection measures, increased timber imports, and logging quota management after 1990, anthropogenic forest disturbances declined markedly. Between 1990 and 2000, anthropogenic activities led to a forest loss of 4.601 × 10⁴ km2, including a notable increase in forest loss in the Pearl River Delta region as a result of urbanization. In terms of the other drivers of forest loss, more than 80% of forest losses were linked to forestry-related activities, with additional contributions from commodity-driven deforestation and shifting agriculture.

The high-resolution, systematically developed anthropogenic forest disturbance dataset presented in this study offers critical baseline data for forest ecology research particularly in the context of China. It further supports national strategies aimed at addressing climate change, enhancing the monitoring of human-induced forest disturbances, and safeguarding forest carbon sinks.

How to cite: Zhang, Y. and Li, S.: Mapping the Spatial Distribution of Anthropogenic Forest Disturbances in China from 1986 to 2020, EGU General Assembly 2025, Vienna, Austria, 27 Apr–2 May 2025, EGU25-10669, https://doi.org/10.5194/egusphere-egu25-10669, 2025.

EGU25-11170 | ECS | Posters on site | BG3.2

Evaluating soil CO2 fluxes during the transition from peat swamp forest to an oil palm plantation 

Nur Azima Busman, Muhammad Zarul Shazreen, Faustina E. Sangok, Akira Watanabe, and Lulie Melling

The conversion of tropical peat swamp forests to oil palm plantations has significant implications for soil CO2 emissions. However, the extent of these changes remains highly uncertain, particularly across different stages of land-use conversion at a single site. Therefore, in this study, we present continuous measurements of soil CO2 flux, environmental conditions, and soil chemical properties from a peat swamp forest in Malaysia undergoing conversion to an oil palm plantation. The study, conducted from January 2011 to April 2022, encompasses three distinct phases: peat swamp forest (Jan 2011–Feb 2017), land preparation involving drainage, land clearing, and mechanical compaction (Mar 2017–Apr 2018), and oil palm plantation (May 2018–Apr 2022). Soil CO2 flux was measured on a monthly basis using the manual chamber method, and variations in environmental and soil chemical properties were also measured. Drainage during land preparation lowered the groundwater level (GWL) from −6.4 cm before conversion to −83.5 cm. The GWL further dropped to −112.8 cm in the first year of planting, then gradually increased from the second to the fourth year, reaching −65.7 cm. Air and soil temperatures also increased following conversion, peaking during the second year before starting to decrease in the third year of planting, possibly due to the growing of oil palm canopy. Soil total carbon and nitrogen contents remained unchanged throughout the study period, while the degree of humification and ash content increased after planting. Soil CO2 fluxes before conversion ranged from 30 to 403 mg C m−2 h−1, with no significant changes observed during land preparation (136–397 mg C m−2 h−1). However, soil CO2 fluxes increased during the first to the third year of oil palm planting (140–619 mg C m−2 h−1), followed by a decrease in the fourth year (140–368 mg C m−2 h−1). This decline may suggest that most of the labile carbon may have been lost during the first three years after planting. However, as this trend was observed only over one year, continued monitoring should be done. Soil CO2 flux showed a negative correlation with GWL before the conversion, but no such correlation was observed after conversion. This is likely due to the smaller variation in GWL following conversion, which is maintained by plantation management practices. Overall, our long-term measurements provide valuable insights into the temporal dynamics of soil CO2 flux during the conversion of tropical peat swamp forests to oil palm plantations, allowing for a more robust evaluation of the impacts of conversion.

How to cite: Busman, N. A., Shazreen, M. Z., Sangok, F. E., Watanabe, A., and Melling, L.: Evaluating soil CO2 fluxes during the transition from peat swamp forest to an oil palm plantation, EGU General Assembly 2025, Vienna, Austria, 27 Apr–2 May 2025, EGU25-11170, https://doi.org/10.5194/egusphere-egu25-11170, 2025.

EGU25-11262 | ECS | Orals | BG3.2

Impacts of land use and land cover change on blue and green water resources availability 

Simon P. Heselschwerdt and Peter Greve

Ongoing anthropogenic climate change and other human interventions increasingly interfere with freshwater availability and its distribution. Land use, land management, and land cover change (LULCC), in particular, shapes water resources by altering the partitioning of precipitation into green and blue water. Yet, a comprehensive understanding of how LULCC influences global precipitation partitioning is lacking. We address this gap by employing the Blue-Green Water Share (BGWS) metric, which quantifies water partitioning dynamics using monthly precipitation data, while monthly runoff and transpiration data serve as proxies for blue and green water flows. Using simulations from the Land Use Model Intercomparison Project (LUMIP), a component of the Coupled Model Intercomparison Project Phase 6 (CMIP6), we evaluate how LULCC impacts precipitation partitioning. Historical land use change impacts are isolated using simulations without land use change (hist-noLu). Additionally, we assess the effects of different land use scenarios on the BGWS under the Shared Socioeconomic Pathways (SSPs) 1-2.6 and 3-7.0 (ssp370ssp126Lu and ssp126ssp370Lu). Regression analysis and variable importance computations are performed to identify key drivers of BGWS trends, comparing the relative contributions of LULCC and climatic factors to shifts in green and blue water flows. Our results highlight the critical need to understand green and blue water dynamics for sustainable water resource management in the face of changing climatic and land use conditions. By advancing our knowledge of the hydrological consequences of LULCC, this research provides actionable insights to inform land-based climate mitigation and adaptation strategies.

How to cite: Heselschwerdt, S. P. and Greve, P.: Impacts of land use and land cover change on blue and green water resources availability, EGU General Assembly 2025, Vienna, Austria, 27 Apr–2 May 2025, EGU25-11262, https://doi.org/10.5194/egusphere-egu25-11262, 2025.

Land management is a critical component of human activities; however, due to the lack of data and methodological limitations, its influence on vegetation change has been challenging to identify and quantify. Existing models are insufficient in effectively describing these processes, while observation-based comparative analyses often rely on grid-walking methods, which fail to provide a clear depiction of land management processes at the regional scale. The Paired Land Use Experiment (PLUE) theory draws inspiration from the paired watershed approach by selecting regions with significant differences in land management but consistent climate change to create a land management control experiment. This theory has undergone validation in multiple regions. This report introduces the application of the PLUE method in various case studies, highlighting the significant impact of land management on vegetation change. Moving forward, these land management processes are suggested to be integrated as submodules within models to enable broader and more systematic research.

How to cite: Chen, T. and Chen, X.: Advancements in the Paired Land Use Experiment Method for Land Management Research, EGU General Assembly 2025, Vienna, Austria, 27 Apr–2 May 2025, EGU25-12325, https://doi.org/10.5194/egusphere-egu25-12325, 2025.

EGU25-12983 | ECS | Orals | BG3.2

Biophysical impacts of afforestation over Europe on atmospheric dryness – a simulation study 

Georgios Blougouras, Luca Caporaso, Shijie Jiang, Markus Reichstein, Alessandro Cescatti, Alexander Brenning, and Mirco Migliavacca

Afforestation is widely considered as a key nature-based strategy for mitigating climate change, due to the carbon sequestration potential of forests. While much focus has been on the benefits of carbon sinks, afforestation also induces biophysical changes that can influence the energy budget and the water cycle. A key atmospheric variable potentially affected by these biophysical changes is vapour pressure deficit (VPD), which has a critical role in terrestrial ecosystem functioning, by affecting plant dynamics, growth and health. Through its role in vegetation dynamics, VPD strongly affects land-atmosphere interactions, water and carbon fluxes, and is critical to understanding how ecosystems respond to environmental changes. However, the atmospheric response of VPD to afforestation remains insufficiently explored, and depends on both temperature and absolute humidity. To this end, we performed high-resolution (5km) convection-permitting simulations over a European domain, coupling a regional climate model (RegCM5) with a land surface model (CLM4.5). We focus on the biophysical impacts of changing vegetation cover to VPD, by keeping the CO2 mixing ratio constant. We analyse the resulting VPD changes and explore how temperature and absolute humidity respond to vegetation changes, both at a local and non-local level. Counterintuitively, despite increases in the forest cover over Europe, the VPD experiences small but consistent increases. This suggests that the evapotranspiration changes from the increased forest cover cannot compensate for the higher temperature-induced capacity of the atmosphere to retain moisture, which is driven by changes in the energy budget. To assess possible negative VPD-induced influences of afforestation, we investigate the implications of the new VPD regimes for different plant functional types (PFTs) across European climate types. Our findings contribute to a more nuanced understanding of the biophysical impacts of afforestation and offer actionable insights for climate change mitigation strategies.  

How to cite: Blougouras, G., Caporaso, L., Jiang, S., Reichstein, M., Cescatti, A., Brenning, A., and Migliavacca, M.: Biophysical impacts of afforestation over Europe on atmospheric dryness – a simulation study, EGU General Assembly 2025, Vienna, Austria, 27 Apr–2 May 2025, EGU25-12983, https://doi.org/10.5194/egusphere-egu25-12983, 2025.

EGU25-14059 | ECS | Posters on site | BG3.2

Scenario Dependence of Biogeochemical and Biogeophysical Effects of Reforestation  

Koramanghat Unnikrishnan Jayakrishnan, Alexander MacIsaac, and Kirsten Zickfeld

Reforestation is a widely considered nature-based method for climate mitigation. The net effect of reforestation on the climate system has two components: i) biogeochemical and ii) biogeophysical effects. The biogeochemical effect of reforestation involves the radiative cooling from the reduction in atmospheric CO2 concentration due to additional carbon storage on land. The biogeophysical effects are due to the changes in energy and moisture balances at the surface associated with reforestation. For example, the changes in land surface albedo due to reforestation modifies the surface energy balance, and consequently, affects the climate response. We hypothesize that both the biogeochemical and biogeophysical effects of reforestation are scenario dependent. The scenario dependence of biogeochemical effects could arise from different amount of additional carbon storage on land in different scenarios (larger CO2 fertilization in higher emission scenarios could lead to larger storage of carbon on land), while differences in the climate feedbacks such as the snow albedo feedback could result in scenario dependence of biogeophysical effects. In this study, we investigate the scenario dependence of biogeochemical and biogeophysical effects of reforestation by performing three sets of simulations with an Earth system model of intermediate complexity. The first set are baseline scenarios in which fossil fuel emissions, non-CO2 greenhouse gas forcing and aerosol forcing prescribed from different SSP scenarios with land use change fixed at 2020 values. The second and third sets involve emission and concentration driven reforestation experiments (each implemented with different SSP scenarios) designed for separating the biogeochemical and biogeophysical effects of reforestation.  

We find that biogeochemical effects show strong scenario dependence (Figure 1). Further, biogeochemical effects do not increase monotonically, despite the increase in additional carbon storage on land with the increase in background emissions. The non-monotonic behavior of the biogeochemical cooling effects is because of the logarithmic dependence of radiative forcing on atmospheric CO2 concentration and the saturation of the land carbon sink at higher emission levels. Biogeophysical effects are also non-monotonic in response to the increase in background emissions, however, they exhibit less scenario dependence than biogeochemical effects (Figure 1). Our results show that the effectiveness of reforestation for climate mitigation declines under high emission scenarios. Therefore, immediate cessation of fossil fuel emissions not only stabilizes the climate but also enhances the climate mitigation potential through reforestation.

Figure 1. The a) net, b) biogeochemical and c) biogeophysical effects of reforestation in five different SSP Scenarios.

How to cite: Jayakrishnan, K. U., MacIsaac, A., and Zickfeld, K.: Scenario Dependence of Biogeochemical and Biogeophysical Effects of Reforestation , EGU General Assembly 2025, Vienna, Austria, 27 Apr–2 May 2025, EGU25-14059, https://doi.org/10.5194/egusphere-egu25-14059, 2025.

EGU25-14168 | ECS | Orals | BG3.2

Ocean dynamics amplify non-local warming effects of forestation 

Pierre Etienne Banville, Alexander MacIsaac, and Kirsten Zickfeld

Large-scale forestation, including reforestation, afforestation, and forest restoration, is prevalent in net zero climate strategies due to the carbon sequestration potential of forests. In addition to capturing carbon, forestation has biogeophysical effects, such as changes in albedo, that can influence surface temperatures locally (local effects), and at distant locations (non-local effects). Biogeophysical effects may offset the cooling benefits of carbon sequestration, hence requiring a robust understanding of their mechanisms to adequately integrate forestation into climate mitigation strategies and carbon accounting frameworks. Yet, the role of ocean dynamics, such as ocean circulation, ocean-atmosphere interactions, and ocean-sea ice interactions in driving non-local effects remains underexplored. In this study, we investigate the impact of ocean dynamics on the magnitude and geographic patterns of the non-local biogeophysical effects of large-scale forestation over a multicentury timescale using the University of Victoria Earth System Climate Model (UVic ESCM), an Earth System Model of Intermediate Complexity (EMIC). We conduct multicentury paired global forestation simulations, with the first simulation using a dynamic ocean (Dynamic Ocean Simulation) and the second using prescribed sea surface temperatures (Prescribed SST Simulation). To be able to separate local from non-local effects, we use the checkerboard approach in both simulations, alternating grid cells undergoing forestation (subject to local and non-local effects) with grid cells remaining deforested (subject to non-local effects only), and compare land surface temperature to a control simulation where all grid cells remain deforested. Using the model simulation data, we perform a surface energy balance decomposition for each simulation at multiple points in time. After a 500-year period, we find a non-local warming effect on land surface temperature in both the Dynamic Ocean Simulation and the Prescribed SST Simulation. However, these non-local warming effects are of much greater magnitude and encompass a greater geographic area, particularly at high latitudes, in the Dynamic Ocean Simulation compared to the Prescribed SST Simulation. Moreover, in the Dynamic Ocean Simulation, non-local warming effects on land continue to strengthen for multiple centuries after most of the forest has regrown and local effects have stabilized. This prolonged land surface warming is the result of a gradual increase in sea surface temperature over multiple centuries caused by ocean-atmosphere interactions combined with the ocean’s thermal inertia. Furthermore, the ocean warming is amplified by climate feedback mechanisms, including the water vapor feedback, fueled by ocean evaporation, and the sea ice-albedo feedback. Consequently, forestation has non-local warming effects that develop gradually and intensify over multiple centuries due to interactions within the Earth system. Net zero policies and carbon accounting frameworks must therefore consider the complete Earth system response over a sufficiently long timeframe to include the slow ocean’s response. Without the consideration of the full Earth system response, net zero policies relying heavily on forestation may not deliver on their climate objectives.

How to cite: Banville, P. E., MacIsaac, A., and Zickfeld, K.: Ocean dynamics amplify non-local warming effects of forestation, EGU General Assembly 2025, Vienna, Austria, 27 Apr–2 May 2025, EGU25-14168, https://doi.org/10.5194/egusphere-egu25-14168, 2025.

EGU25-14933 | ECS | Orals | BG3.2

Hydrologic Cycle Impacts of Large-Scale Reforestation at Global and Regional Scales 

Marzieh Mortezapour, Kirsten Zickfeld, and Vivek Arora

Reforestation is a key nature-based solution for mitigating climate change. However, changes in land cover through reforestation can significantly influence the climate and hydrological cycle, affecting water availability and other critical components of the Earth system. Understanding these impacts is essential for developing effective climate adaptation strategies and ensuring sustainable land management in the coming decades.

This study leverages simulations with the Canadian Earth System Model (CanESM5.1), a state-of-the-art Earth system model, to quantify hydrological responses to two large-scale reforestation scenarios. The first scenario reverses historical deforestation, restoring tree cover to pre-industrial levels by the year 2070, while the second implements a sustainable reforestation strategy by the same year. To isolate the effects of reforestation, a reference simulation with land-cover fixed at the year 2015 configuration is also conducted. The study employs a two-stage simulation framework—historical (1850–2015) and future (2015–2200)—with multiple ensemble members, using SSP1-2.6 forcing to align with the Paris Agreement’s climate goals.

Preliminary results reveal that large-scale reforestation induces statistically significant climate and hydrological responses at both regional and global scales. These findings highlight the potential for unintended consequences of land-based climate mitigation strategies, emphasizing the need for holistic assessments to guide future land management and policy decisions.

How to cite: Mortezapour, M., Zickfeld, K., and Arora, V.: Hydrologic Cycle Impacts of Large-Scale Reforestation at Global and Regional Scales, EGU General Assembly 2025, Vienna, Austria, 27 Apr–2 May 2025, EGU25-14933, https://doi.org/10.5194/egusphere-egu25-14933, 2025.

Urbanization worldwide has resulted in a substantial increase in abandoned rural settlements, presenting a unique opportunity to enhance food security and mitigate climate change. Here we quantify the potential of these underutilized lands for optimized agricultural production and carbon sequestration, using China as a compelling case study. Leveraging high-resolution Night-Time Light (NTL) data from LuoJia1-01, we identify approximately 5.66 Mha of abandoned settlements across rural China, representing 38.05% of all rural settlements. We employ a probabilistic multi-objective spatial optimization of land use (pMOLU) model to strategically allocate these lands between reclamation for agriculture and afforestation, maximizing both food production and carbon sequestration under various scenarios. The results reveal that reclaiming abandoned settlements could yield an additional 9–21 Mt of food annually, while reforestation efforts could sequester 5–14 Mt of carbon per year. Furthermore, we propose a spatial prioritization strategy for the phased implementation of consolidation across the country and evaluate its beneficial impacts on food security and climate goals.The findings underscore the untapped potential of abandoned rural settlements for promoting sustainable development and offer a robust framework for optimizing land-use decisions in China and beyond.

How to cite: Wang, T.:  Unleashing the Potential of Abandoned Rural Settlements for Optimized Food and Climate Goals, EGU General Assembly 2025, Vienna, Austria, 27 Apr–2 May 2025, EGU25-16199, https://doi.org/10.5194/egusphere-egu25-16199, 2025.

EGU25-16459 | ECS | Posters on site | BG3.2

Evaluating physical and biogeochemical climate effects of boreal forests with EC-Earth 

Laura Thölix, Tommi Bergman, Risto Makkonen, Kalle Nordling, Antti-Ilari Partanen, and Joonas Merikanto

Boreal forests are particularly important for carbon storage. A warmer climate, combined with the expansion of these forests, is expected to enhance their role as carbon sinks in the future. Deforestation, where forests are replaced by crops and pastures, strongly affects land surface albedo and transpiration, leading to substantial carbon emissions into the atmosphere—a key driver of climate change.

In this study, we investigate the impacts of boreal forests on future climate using EC-Earth with full carbon cycle and prescribed CO2 concentration. EC-Earth-Veg captures the physical effect mechanisms, while EC-Earth-CC incorporates both physical and biogeochemical effect. The biogeochemical effect can be isolated and quantified from these results.

Globally, the temperature responses to deforestation due to physical and biogeochemical effects largely cancel each other, but locally, deforestation has a large (more than 1°C in annual mean) impact on annual temperatures over deforested regions, accompanied with a marked expansion of Arctic sea ice.

How to cite: Thölix, L., Bergman, T., Makkonen, R., Nordling, K., Partanen, A.-I., and Merikanto, J.: Evaluating physical and biogeochemical climate effects of boreal forests with EC-Earth, EGU General Assembly 2025, Vienna, Austria, 27 Apr–2 May 2025, EGU25-16459, https://doi.org/10.5194/egusphere-egu25-16459, 2025.

EGU25-16490 | ECS | Orals | BG3.2

Climate Mitigation Potential of Targeted Forestation Considering Climate Change, Fires, and Albedo Effects 

Dashan Wang, Shijing Liang, and Zhenzhong Zeng

Afforestation and reforestation are widely recognized as effective strategies for mitigating anthropogenic climate change. However, satellite-based assessments of their carbon sequestration potential remain uncertain, particularly when accounting for the dynamic nature of climate conditions, vegetation-climate feedbacks, fire-related disturbances, and the trade-offs posed by surface albedo changes. Using a coupled Earth system model, we estimate that optimal global forestation could sequester 31.3-69.2 Pg C between 2021 and 2100 under a sustainable shared socioeconomic pathway. Regionally, the greatest mitigation potential is found in tropical areas, while mid- to high-latitude regions exhibit higher heterogeneity, emphasizing the need for tailored strategies and further refinement of nature-based mitigation plans. Our findings highlight the critical role of considering disturbances, such as fires, and minimizing adverse albedo effects in the estimation of carbon mitigation potential from targeted forestation. We also advocate for the development of high-resolution, consistent maps identifying suitable forestation areas, with a focus on avoiding environmentally sensitive lands and minimizing conflicts with other human activities.

How to cite: Wang, D., Liang, S., and Zeng, Z.: Climate Mitigation Potential of Targeted Forestation Considering Climate Change, Fires, and Albedo Effects, EGU General Assembly 2025, Vienna, Austria, 27 Apr–2 May 2025, EGU25-16490, https://doi.org/10.5194/egusphere-egu25-16490, 2025.

EGU25-16539 | ECS | Orals | BG3.2

How do trees impact cloud formation across Africa: the role of their spatial distribution 

Di Xie, Luca Caporaso, Markus Reichstein, Deyu Zhong, and Gregory Duveiller

Vegetation plays a crucial role in regulating climate and sustaining the hydrological cycle. Preserving and expanding tree cover is potentially vital for mitigating climate change, as both the amount and spatial distribution of trees influence surface and atmospheric processes. While the direct effects of vegetation on surface properties are relatively well-studied, the indirect biophysical impacts of trees on cloud formation—particularly from trees outside forested areas—remain less explored, with the role of tree spatial patterns often overlooked. In this study, we used a space-for-time approach, high-resolution tree cover maps, and geostationary satellite data to investigate how tree cover, including its extent and spatial configuration, affects daytime and nighttime cloud formation across Africa. Our findings reveal distinct regional and temporal patterns: during the day, increased tree cover enhances cloud cover over tropical rainforests and arid steppes but reduces it over tropical savannahs. At night, a stronger negative relationship between tree cover and cloud formation emerges during the dry season, particularly in high-elevation areas of southern Africa. Mechanistically, these patterns are closely tied to sensible heat fluxes in water-abundant regions and to moisture availability in water-limited areas during the day, while nighttime cloud effects are linked to tree-induced variations in land surface temperature, likely through enhanced condensation on cooler surfaces. Incorporating tree cover heterogeneity alongside average tree cover offers further insights: in tropical savannahs, cloud formation is enhanced by 55.2% when heterogeneity is considered, compared to using tree cover alone, while in arid steppes, this increase is 12.4%. Conversely, in tropical rainforests, increased heterogeneity amplifies the negative impact of reduced tree cover on cloud formation. These findings underscore the importance of not only the extent but also the spatial arrangement of trees in afforestation and deforestation efforts. This data-driven analysis enhances the understanding of vegetation-cloud interactions, which remain uncertain and underrepresented in Earth system models, and provides valuable insights for planning and implementing future tree restoration projects in Africa.

How to cite: Xie, D., Caporaso, L., Reichstein, M., Zhong, D., and Duveiller, G.: How do trees impact cloud formation across Africa: the role of their spatial distribution, EGU General Assembly 2025, Vienna, Austria, 27 Apr–2 May 2025, EGU25-16539, https://doi.org/10.5194/egusphere-egu25-16539, 2025.

Changes in land use and land cover (LULC) are closely linked to global warming and localized climate alterations, as urbanization significantly modifies surface and atmospheric conditions, resulting in a phenomenon known as the Urban Heat Island (UHI) effect. This study evaluates the intensity of the daytime Surface Urban Heat Island (SUHI) effect at a local scale using the landscape index (LI) proposed by Xu, which examines source and sink landscapes and their roles in SUHI intensity. The study evaluates SUHI intensity across different LULC types in districts of Kerala, India, using Land Surface Temperature (LST) data derived from Landsat 8 by single Channel algorithm technique and LULC classifications acquired from Esri Sentinel-2 for the period 2017–2023. Results reveal significant LST variations in 2019 and 2023, The districts Alappuzha, Ernakulam, Thrissur, and Thiruvananthapuram districts were more prone to SUHI Intensity.

How to cite: pk, A. and sr, R.: Land Use Land Cover Change and Surface Urban Heat Island Intensity: A Source-Sink Landscape Based Study in Kerala, India, EGU General Assembly 2025, Vienna, Austria, 27 Apr–2 May 2025, EGU25-16629, https://doi.org/10.5194/egusphere-egu25-16629, 2025.

EGU25-16746 | ECS | Orals | BG3.2

Exploring Land Management Impacts on Extreme Weather Events: Cover Cropping in ICON-MPIM 

Leonore Jungandreas, Ana Bastos, Jian Peng, and Sönke Zaehle

Cover cropping is increasingly recognized as a sustainable land management strategy with potential biophysical and biogeochemical climate implications. Although managed lands cover up to  70% of the Earth's ice-free land surface, their representation in Earth system models (ESMs) remains limited. This study integrates cover cropping into the global climate model ICON-MPIM to investigate its impacts on extreme weather events through biophysical effects on the atmosphere.

We analyze how the integration of idealized cover cropping alters surface properties, water and energy fluxes, and atmospheric processes, with a focus on extreme events such as droughts and heat waves. Preliminary results over Europe reveal a decrease in annual mean 2m air temperatures over eastern Europe but an increase over western Europe, with strong seasonal variations. Conversely, the maximum daily air temperature pattern shows the opposite trend, with increases over eastern Europe and decreases over western Europe. Moreover, remote changes, for example in 2m air temperature or maximum daily air temperature, also occur in regions where no cover crops are grown, such as in the tropics and polar regions or the ocean. These findings suggest that the climate response to cover cropping is highly heterogeneous, emphasizing the importance of considering both spatial and temporal dynamics.

This approach represents a first step toward exploring the theoretical potential of cover cropping to influence climate dynamics and extreme events while recognizing the limitations of the model's representation of agricultural management practices. By addressing land management in a generalized yet systematic manner, this study contributes to an improved understanding of the influence of land management on land-atmosphere interactions and provides a basis for future research on the role of managed lands in climate systems.

How to cite: Jungandreas, L., Bastos, A., Peng, J., and Zaehle, S.: Exploring Land Management Impacts on Extreme Weather Events: Cover Cropping in ICON-MPIM, EGU General Assembly 2025, Vienna, Austria, 27 Apr–2 May 2025, EGU25-16746, https://doi.org/10.5194/egusphere-egu25-16746, 2025.

Suburban areas undergoing rapid urbanization face significant challenges in balancing ecological and socioeconomic sustainability. Land-use changes play a crucial role in shaping the dynamics of regional ecosystem service values. This study focuses on the Lanyang River Basin in Taiwan, adjacent to the Greater Taipei Metropolitan Area, to assess the impact of land-use changes on ecosystem service values and explore strategies for sustainable development. Using Nationwide Land Use Investigation Data from 1995, 2007, and 2020, we projected land-use dynamics for 2045 under a regular growth scenario and optimized land-use allocation through linear programming. The Integrated Valuation of Ecosystem Services and Tradeoffs (InVEST) model and Geographic Information System (GIS) were employed to quantify spatial and temporal value changes in carbon storage, habitat quality, and annual water yield. Results reveal a significant decline in the value of carbon storage and habitat quality under the regular growth scenario, driven by the expansion of built-up areas. In contrast, the optimization scenario enhances these ecosystem service values by increasing grassland coverage, although trade-offs emerge, particularly with a reduced annual water yield. Notably, the impact on annual water yield is significantly constrained by regional precipitation patterns, as the Lanyang River Basin is a subtropical humid region. Our insights highlight the importance of tailored sustainable regional planning that considers land-use types, geographic characteristics, and factors such as vegetation diversity in grasslands to optimize spatial resource use. This study provides an innovative framework for integrating ecosystem service values with scenario simulation to inform sustainable land-use planning. The findings offer actionable insights for suburban sustainability in rapidly urbanizing regions. Future research should incorporate socioeconomic realities and policies to refine simulation model accuracy and enhance decision-making, supporting a balanced approach to ecological conservation and regional development.

How to cite: Chou, C.-W. and Liaw, S.-C.: Scenario Simulation of Ecosystem Service Values for Suburban Sustainability: A Case Study of the Lanyang River Basin, Taiwan, EGU General Assembly 2025, Vienna, Austria, 27 Apr–2 May 2025, EGU25-17112, https://doi.org/10.5194/egusphere-egu25-17112, 2025.

EGU25-17991 | Orals | BG3.2

A Comprehensive Assessment of Urban Forest Scenarios Using LCA and InVEST Models 

Jiangong Bi, Yoonji Kim, Yoon Jung Kim, and Junga Lee

Urban forests play a critical role in addressing various urban environmental challenges, such as mitigating climate change, enhancing biodiversity, and improving habitat connectivity. To optimize the spatial allocation and management of urban forests, it is essential to consider both environmental impacts (e.g., carbon emissions and resource consumption) and ecosystem services (e.g., carbon storage and habitat quality)(Chaplin-Kramer et al., 2017). In this context, this study employs Life Cycle Assessment (LCA) to evaluate the environmental costs associated with urban forest establishment and maintenance, and the InVEST model to assess the localized impacts on ecosystem services through spatially detailed analysis. By integrating these methodologies, a comprehensive evaluation of urban forest development strategies is conducted.

To address the environmental challenges associated with rapid urban development in Sejong City, this study evaluates two urban forest development scenarios: centralized (large-scale, contiguous forests) and decentralized (multiple, small-scale forests). Sejong City, designated in 2007 and officially launched in 2012 as Korea’s administrative capital, has undergone extensive urbanization over the past decade, resulting in significant habitat loss, degradation of ecological quality, and increased ecosystem fragmentation (Sejong City, 2024). These trends highlight the critical need for mitigation strategies, with urban forest development emerging as a promising solution.

This study employs openLCA software to quantify environmental costs, including carbon emissions, energy consumption, and resource usage, incurred during the establishment and maintenance of urban forests. Furthermore, the InVEST Carbon Storage and Sequestration model and Habitat Quality model are utilized to simulate spatially explicit changes in carbon storage and habitat quality under the two scenarios. By integrating these results, the study provides a comprehensive assessment of the environmental and ecological performance of each scenario, offering valuable insights for the formulation of sustainable land-use strategies in urban forest planning.

The analysis revealed that decentralized urban forest development, characterized by the establishment of small forests across multiple locations, effectively mitigates habitat fragmentation, provides suitable habitats for diverse species, and enhances biodiversity by strengthening ecological connectivity and increasing species richness in urban environments. In contrast, centralized urban forest development incurs higher initial environmental costs but provides greater long-term carbon storage and habitat stability through large contiguous forests.

This study demonstrates that the integration of LCA and spatial modeling provides a robust framework for comprehensively evaluating the environmental and ecological impacts of urban forest development strategies. By quantitatively assessing the trade-offs between environmental costs and ecological benefits, this research identifies the importance of balanced land-use strategies that consider both centralized and decentralized approaches.


*This work was supported by the Core Research Institute Basic Science Research Program through the National Research Foundation of Korea (NRF) funded by the Ministry of Education(NRF-2021R1A6A1A10045235).

How to cite: Bi, J., Kim, Y., Kim, Y. J., and Lee, J.: A Comprehensive Assessment of Urban Forest Scenarios Using LCA and InVEST Models, EGU General Assembly 2025, Vienna, Austria, 27 Apr–2 May 2025, EGU25-17991, https://doi.org/10.5194/egusphere-egu25-17991, 2025.

EGU25-18014 | ECS | Posters on site | BG3.2

Arctic expansion of boreal forests: can the BVOC emission impact rival the albedo effect? 

Adele Zaini, Sara M. Blichner, Jing Tang, Rosie A. Fisher, Marianne T. Lund, and Terje K. Berntsen

As global surface temperatures continue to rise, vegetation is expected to adapt, with high-latitude forests projected to migrate northward into the Arctic regions. This shift will result in significant changes in land cover, influencing the climate through various biogeophysical and biogeochemical feedback mechanisms. While many studies have shown that changes in albedo drive substantial warming, a more comprehensive evaluation of the impacts associated with changes in Biogenic Volatile Organic Compound (BVOC) emissions is needed. Some studies suggest that BVOC-related effects could significantly influence climate in these pristine regions, potentially counteracting the albedo effect. BVOCs play a crucial role in atmospheric chemistry and aerosol formation; changes in their emissions can alter aerosol properties, subsequently affecting cloud characteristics and potentially leading to a cooling effect. In this study, we use the Norwegian Earth System Model v2 (NorESM2) with projected vegetation migration, running nested experiments under current climatic conditions and warmer climate forcing scenarios to assess the radiative forcing of BVOC-related impacts, in comparison with the albedo change. Preliminary findings suggest that under current climate conditions, BVOC-related impacts are insufficient to rival the warming effect of albedo changes; however, their relative role could be significantly amplified in warmer future climates.

How to cite: Zaini, A., Blichner, S. M., Tang, J., Fisher, R. A., Lund, M. T., and Berntsen, T. K.: Arctic expansion of boreal forests: can the BVOC emission impact rival the albedo effect?, EGU General Assembly 2025, Vienna, Austria, 27 Apr–2 May 2025, EGU25-18014, https://doi.org/10.5194/egusphere-egu25-18014, 2025.

EGU25-18466 | ECS | Orals | BG3.2

Bottom-up estimate of the carbon dioxide removal potential of land-based mitigation technologies using a coupled ESM/ land-use change model framework 

Lina Teckentrup, Etienne Tourigny, Florian Wimmer, Markus Donat, Raffaele Bernadello, Isabel Cano Martínez, Francis X. Johnson, Leon Merfort, Stefan Olin, Rüdiger Schaldach, Eise Spijker, and David Wårlind

Carbon dioxide removal (CDR) strategies are critical for climate stabilisation under the Paris Agreement. All current IPCC scenarios that achieve the Paris Agreement’s objectives rely on CDR, and implementing CDR explicit representations into Earth System Models will allow the production of more realistic future scenario projections for CMIP7 and beyond. Here we present results from the LANDMARC project which aims to explore the efficiency of carbon dioxide removal as well as risks associated with land-based mitigation technologies (LMTs). We employ a coupled modeling system consisting of the EC-Earth3-CC Earth System Model with the LPJ-GUESS dynamic global vegetation model, and the LandSHIFT-G land-use model, and simulate five different LMTs, specifically i) fixing carbon in vegetation and soils by afforestation/ reforestation; increasing soil carbon by ii) no/reduced tillage agriculture and iii) combining the substitution of fossil fuels with biofuels and medium to long-term storage of carbon by iv) bioenergy and carbon capture and storage (BECCS) and biochar as well as v) reducing deforestation through agro-forestry and agro-pastoral practices. Based on two different portfolios, assuming an either moderate or high ambition to employ LMTs, we estimate the potential carbon removal through LMTs, and their impact on the average and variability in climate. We find that implementing LMTs has the potential to achieve net-negative emissions before the end of the century, and to reduce the atmospheric CO2 concentration by 47 - 62 ppm depending on the LMT portfolio investigated. The carbon removal is simulated to dampen the global increase in temperature by roughly 0.4°C by the end of the century. While this reduction alone is insufficient to meet the Paris Agreement goals, it highlights the need to invest significantly in both CDR and emissions reductions, which serve as complementary means for achieving climate stabilisation alongside sustainable development goals.

How to cite: Teckentrup, L., Tourigny, E., Wimmer, F., Donat, M., Bernadello, R., Cano Martínez, I., Johnson, F. X., Merfort, L., Olin, S., Schaldach, R., Spijker, E., and Wårlind, D.: Bottom-up estimate of the carbon dioxide removal potential of land-based mitigation technologies using a coupled ESM/ land-use change model framework, EGU General Assembly 2025, Vienna, Austria, 27 Apr–2 May 2025, EGU25-18466, https://doi.org/10.5194/egusphere-egu25-18466, 2025.

EGU25-19650 | ECS | Orals | BG3.2

Afforestation as climate change mitigation strategy in West Africa: potential impacts on the terrestrial carbon cycle 

Souleymane Sy, Joel Arnault, Jan Bliefernicht, Benjamin Quesada, Verena Huber García, Gregory Duveiller, Abdel Nassirou Yahaya Seydou, Samuel Guug, Thomas Rummler, Patrick Laux, and Harlad Kunstmann

The forest landscape in West Africa faces significant challenges from rapid population growth, agricultural expansion, and urbanization. These anthropogenic land-use and land-cover changes (LULCC), including deforestation and afforestation, impact ecosystem-climate-carbon cycle interactions through biogeochemical emissions and greenhouse gas uptake. However, the capacity of the land-based carbon sink, encompassing LULCC emissions and CO2 uptake, remains uncertain. This study employs the fully coupled WRF-Hydro system, incorporating surface and subsurface hydrology and a dynamic carbon cycle, to perform high-resolution (3 km) convection-permitting simulations for the period 2011-2022. It assesses regional impacts of idealized LULCC scenarios by comparing several land use and afforestation simulations representing specific land cover transitions in the Sudan savannah belt of Burkina Faso and Ghana.

Model performance was validated using gross primary production (GPP) data from four eddy covariance sites along a land-use gradient (pristine savanna forest, cropland, and degraded grassland) in the Sudan savannah belt of Burkina Faso and Ghana and further evaluated by comparing simulated GPP and leaf area index (LAI) with Copernicus Land Monitoring satellite products. Overall, the model showed the best performance at the pristine savanna forest site with homogeneous vegetation.

Analysing of carbon cycle variables, including GPP, NPP, NEE, carbon residence time, and soil and vegetation carbon stocks, our results reveal that deforestation reduces GPP by 60% (-1.08 ± 0.1 gC/m²), carbon stocks by 45% (-1.79 ± 0.19 kgC/m²), and carbon residence time by 25% (-3.6 ± 0.9 years). Conversely, afforestation strategies, such as converting grassland to evergreen or mixed forest, can mitigate carbon losses by significantly increasing total carbon stocks (1.6 ± 0.19 kgC/m²) through increased canopy cover. Furthermore, our results indicate that converting grassland to evergreen forest can approximately double the carbon residence time in soils and ecosystems compared to afforestation options involving woody savanna or savanna. The study also investigates the underlying physical mechanisms behind LULCC-induced terrestrial carbon cycle responses.

How to cite: Sy, S., Arnault, J., Bliefernicht, J., Quesada, B., García, V. H., Duveiller, G., Seydou, A. N. Y., Guug, S., Rummler, T., Laux, P., and Kunstmann, H.: Afforestation as climate change mitigation strategy in West Africa: potential impacts on the terrestrial carbon cycle, EGU General Assembly 2025, Vienna, Austria, 27 Apr–2 May 2025, EGU25-19650, https://doi.org/10.5194/egusphere-egu25-19650, 2025.

EGU25-20336 | ECS | Posters on site | BG3.2

On the Impact of Tree-Line Expansion: A Threat to Hydropower Resources? 

Gunnar Thorsen Liahjell

Centuries of mountain farming and forestry have caused the treeline in Norway to be situated up to hundreds of meters below its climatic potential. With climate change further raising this potential, vast areas of mountainous Norway are becoming open to tree growth. This shift in land cover significantly alters the hydrological balance, as trees typically have higher evapotranspiration rates than the vegetation they replace. Given that Norway’s power mix is largely dominated by hydropower, these changes in hydrology pose a potential threat to energy production.

To quantify the impact of this shift, we employ a high-resolution coupled atmosphere-land model (WRF-CTSM) using current and projected vegetation maps from the Natural History Museum in Oslo.

As the evapotranspiration (ET) levels in Norway are currently not well-constrained targeted fieldwork with mobile eddy covariance towers is being conducted to measure turbulent fluxes in representative areas. This data will be used to update the model's plant functional types to better represent the local vegetation.

The updated model will then be run under different SSP scenarios to provide more robust estimates of current and future ET levels in Norway and their potential impact on hydropower production.

How to cite: Thorsen Liahjell, G.: On the Impact of Tree-Line Expansion: A Threat to Hydropower Resources?, EGU General Assembly 2025, Vienna, Austria, 27 Apr–2 May 2025, EGU25-20336, https://doi.org/10.5194/egusphere-egu25-20336, 2025.

EGU25-2158 | Orals | BG3.3 | Highlight

Optimal trait theory: an emerging route towards better land ecosystem models 

Iain Colin Prentice

The last two decades have seen steadily increasing interest in plant functional ecology, and an orders-of-magnitude improvement in the scope and availability of data on plant traits and ecosystem processes. These developments have been propelled in part by a perceived need for a more solid scientific foundation for global vegetation and land-surface models, which are used to explore terrestrial carbon cycling and to represent the interactions of ecosystems and climate. However, this need remains substantially unfulfilled. I will argue that a key reason is the absence of any agreed theoretical framework for the analysis of trait-environment relationships. One consequence of this ‘theory gap’ is the continued reliance of models on plant functional types (PFTs) with fixed trait values – long after it became clear that most traits vary more within PFTs than between them. Another is the prevalence in the ecological literature of statistical analyses marred by arbitrary choices of environmental predictors, and misattribution of cause and effect in the controls of plant traits. Fortunately, eco-evolutionary optimality hypotheses are now helping to fill the theory gap, and have shown striking success in generating realistic predictions from universal, PFT-independent rules. The emerging ‘optimal trait theory’ has the potential to underpin a new, unified understanding of photosynthesis, respiration, transpiration, carbon allocation and nutrient acquisition at leaf, plant and ecosystem levels. Such understanding is a pre-requisite for next-generation models that will be more robust and reliable than those currently in use.

How to cite: Prentice, I. C.: Optimal trait theory: an emerging route towards better land ecosystem models, EGU General Assembly 2025, Vienna, Austria, 27 Apr–2 May 2025, EGU25-2158, https://doi.org/10.5194/egusphere-egu25-2158, 2025.

EGU25-3398 | Orals | BG3.3

Ecological implications of variation in whole-plant leaf:wood allocation, allometry, costs and benefits. 

Ian Wright, Shubham Chhajed, and Andrea Westerband

Improved whole-plant cost:benefit understanding of allocation and activities of leaf versus wood tissues should in principle yield better understanding of differences among species in growth rates and differences among sites in vegetation productivity. To this end we measured whole-plant allocation to sapwood versus leaves in terms of mass and area for 180 woody species sampled from 11 sites arrayed across broad precipitation and temperature gradients in Australia (10-28 oC range in mean annual temperature; 380-2600 mm range in annual precipitation). Physiological rates (photosynthesis, sapwood respiration) and other standard traits were also measured. We quantified coordination between tissue-level traits and whole-plant allocation to leaf versus wood, and the role of site climate and soil properties in driving trait variation. Most but not all observed trait–trait and trait–environment relationships were consistent with predictions based on optimality theory and prior knowledge. Sapwood respiration, expressed at a standard temperature, showed clear patterning with site climate and soil nutrients. Mass-basis sapwood:leaf allocation showed clear patterning with site climate but area-basis allocation far less so. Wide variation and clear taxonomic patterning was observed among co-occurring species in key properties suggesting that cost:benefit considerations should include trait coordination and competitive effects as well as environmental drivers. Taken together, our findings suggest a fresh direction for understanding links between plant traits, environmental adaptation and – appropriately scaled up – ecosystem-scale processes.

How to cite: Wright, I., Chhajed, S., and Westerband, A.: Ecological implications of variation in whole-plant leaf:wood allocation, allometry, costs and benefits., EGU General Assembly 2025, Vienna, Austria, 27 Apr–2 May 2025, EGU25-3398, https://doi.org/10.5194/egusphere-egu25-3398, 2025.

EGU25-3853 | ECS | Orals | BG3.3

Optimality-based modelling of plant traits and primary production along the Northeast China Transect 

Ruijie Ding, Ning Dong, Jian Ni, Sandy P. Harrison, and Iain Colin Prentice

Traits are fundamental to understanding plant function and represent key variables for ecosystem modelling. An expanding class of models based on eco-evolutionary optimality (EEO) theory shows great potential in predicting trait–trait and trait–environment relationships at both leaf and whole-plant levels, via universal formulations that apply equally to all plant functional types. According to this theory gross primary production (GPP), the basis of the terrestrial carbon cycle, is jointly determined by the ratio of intercellular to ambient CO₂ concentrations (χ), leaf-level photosynthetic capacity (V­cmax) and absorbed light, which depends on incident solar radiation and leaf area index (LAI). The effect of nitrogen (N) supply on GPP is mediated by the allocation of carbon (C) to leaves, while leaf-level photosynthetic traits (e.g. χ and Vcmax), morphological traits (e.g leaf mass per area, LMA) and biomass allocation (to roots, shoots and stems) are shaped by climate and light. The amount of N per unit area of leaf (Narea) is related in part to the quantity of photosynthetic enzymes, indexed by carboxylation capacity at standard temperature (Vcmax25), and in part to LMA. Plant N isotope ratios (δ15N) are sensitive to the partitioning of N loss from soil between the gaseous and leaching pathways (a balance that is strongly under climatic control), and also to plants’ N uptake strategy (mycorrhizal type, or symbiotic N-fixation).

This study tested quantitative trait predictions derived from EEO principles using published and unpublished data from the Northeast China Transect (NECT), which spans a precipitation gradient from moist forest to semi-desert. Predicted and observed (or inferred) values of χ, LAI, GPP and biomass decreased with dryness, while LMA and leaf nitrogen per unit area (Narea) increased. Plant δ15N increased with dryness and soil temperature. This implied fraction of N lost in gaseous forms (fgas) increased strongly towards the dry end of the transect. By reproducing observed patterns of trait variation along the NECT, these findings provide empirical support for an emerging, optimality-based theory for the coupling of C, N and water cycles in terrestrial ecosystems.

How to cite: Ding, R., Dong, N., Ni, J., Harrison, S. P., and Prentice, I. C.: Optimality-based modelling of plant traits and primary production along the Northeast China Transect, EGU General Assembly 2025, Vienna, Austria, 27 Apr–2 May 2025, EGU25-3853, https://doi.org/10.5194/egusphere-egu25-3853, 2025.

EGU25-4326 | ECS | Posters on site | BG3.3

The biogeography and functional understanding of buttress roots in tropical forests 

Haozhi Ma, Philipp Brun, Daniel Maynard, Johan van den Hoogen, Yunpeng Luo, Dirk Karger, Lidong Mo, Wenna Ding, Elena Plekhanova, Manuel Popp, and Niklaus Zimmermann

Buttress roots are iconic features of tropical rainforests, yet the mechanisms underlying their global distribution remain poorly understood. Two prevailing hypotheses, mechanistic support and nutrient acquisition, have been explored through numerous studies, but no global consensus has emerged. To address this gap, we conducted a global biogeographic analysis, identifying 847 tree species capable of generating buttress roots and integrating this data with forest inventory datasets worldwide. Our findings reveal that while buttress root species are associated with higher canopy heights, they are not adapted to high wind speeds or shallow soils, challenging the mechanistic support hypothesis. Instead, we found that soil phosphorus limitations and relatively acidic soils enhance the presence of buttress roots, supporting their role in nutrient acquisition. Climatic factors,  including the lowest temperature of the coldest month and site water balance, also appear to constrain the distribution of buttress root species, potnetially due to photosynthesis-related trait limitations. Our geospatial models estimate that buttress root species cover approximately 21% of global tropical forests, emphasizing their ecological significance in tropical forest structure. These findings highlight the critical role of buttress roots in forest ecosystems and their importance for global conservation efforts.

How to cite: Ma, H., Brun, P., Maynard, D., van den Hoogen, J., Luo, Y., Karger, D., Mo, L., Ding, W., Plekhanova, E., Popp, M., and Zimmermann, N.: The biogeography and functional understanding of buttress roots in tropical forests, EGU General Assembly 2025, Vienna, Austria, 27 Apr–2 May 2025, EGU25-4326, https://doi.org/10.5194/egusphere-egu25-4326, 2025.

EGU25-4643 | Orals | BG3.3

Do stem and leaf functional traits explain differences in water use between tropical evergreen trees and lianas during the dry season? 

Daniel Epron, Yuma Sakaue, Yutaro Fujimoto, Seiya Sunayama, Ando Harilalao Rakotomamonjy, Wataru Noyori, Tojotanjona Razanaparany, Zo Lalaina Razafiarison, Hiroki Sato, and Kaoru Kitajima

Liana abundance increases with the seasonality of rainfall in tropical forests, and evergreen lianas and trees may compete for water during the dry season. Several studies suggest functional divergence of water use strategies between lianas and trees, with lianas experiencing less water stress and exhibiting growth advantage over trees during the dry season.

Our aim was to test the hypothesis that evergreen lianas are less drought tolerant and more water spending than evergreen trees. If so, we expected that, compared to trees, lianas should have (i) less sclerophyllous leaves, (ii) larger but fewer xylem vessels in their branches, (iii) higher predawn and midday water potentials, (iv) lower water use efficiency, (v) access to deeper water sources.

We tested our hypothesis in a seasonally dry tropical forest on a white-sand hill in Ankarafantsika National Park, north-western Madagascar (MAP, 1600 mm; dry season, April to November). We studied three liana and three tree species in June 2023, and seven liana and eight trees species in September 2024. We measured leaf mass per area, nitrogen content and δ13C, leaf predawn and midday water potentials, diameter and density of xylem vessels of branches, and δ18O of xylem water.

We found that lianas had lower leaf mass per area, higher leaf predawn water potentials, larger and fewer xylem vessels, and lower δ18O of xylem water than trees. Overall, our results confirm that evergreen trees are more drought tolerant than lianas while evergreen lianas are more water spending than trees but not consistently across families.

How to cite: Epron, D., Sakaue, Y., Fujimoto, Y., Sunayama, S., Rakotomamonjy, A. H., Noyori, W., Razanaparany, T., Razafiarison, Z. L., Sato, H., and Kitajima, K.: Do stem and leaf functional traits explain differences in water use between tropical evergreen trees and lianas during the dry season?, EGU General Assembly 2025, Vienna, Austria, 27 Apr–2 May 2025, EGU25-4643, https://doi.org/10.5194/egusphere-egu25-4643, 2025.

Understanding global biodiversity patterns and the impacts of climate change on these patterns remains a critical challenge in Earth system science. Shifts in plant functional diversity are pivotal drivers of ecosystem processes, including the carbon cycle. Fundamental plant traits—governing photosynthesis, carbon storage, and water/nutrient uptake—directly influence vegetation function. Therefore, high-resolution global maps of these traits are essential for studying ecosystem dynamics, identifying environmental threats, and guiding conservation strategies. However, existing trait maps are limited by sparse, regionally biased observations and reliance on statistical extrapolations, leading to low explanatory power and ecological inconsistencies across diverse environments.

The VESTA (Vegetation Spatialization of Traits Algorithm) project addresses these challenges by integrating a trait-based dynamic global vegetation model (DGVM) with Earth observation (EO) data to produce global maps of above- and below-ground plant traits for both current and future scenarios. Trait-based DGVMs offer process-based approaches that directly link environmental factors to plant ecology and vegetation patterns. The VESTA model is initialized with data from comprehensive global trait databases, while EO data are used to calibrate and optimize the model. This calibration adjusts trait-relationship curves to align model outputs with satellite-derived measurements of vegetation structure and productivity.

A critical aspect of VESTA is accounting for the distinctiveness of plant functional types (PFTs) in trait-relationship modeling. Analysis of global plant trait databases confirms that relationships between traits, such as specific leaf area (SLA) and carbon-to-nitrogen ratios (C:N), vary significantly across PFTs. Grouping these relationships by functional type enhances explanatory power compared to assuming a single global relationship. For example, plots of trait relationships grouped by PFT reveal distinct patterns, with PFT-specific ranges and correlations that are essential for improving model accuracy.

Preliminary global simulations at a 0.5° resolution using climatic data from the CRUJRA dataset and fixed global trait relationships reproduce general SLA spatial patterns, such as lower values in boreal regions. However, comparisons with reference SLA maps highlight the limitations of the fixed-relationship approach, underscoring the need for VESTA’s optimization methods. By addressing these limitations, the VESTA project aims to provide robust, ecologically consistent trait maps that enhance our understanding of global biodiversity patterns and support effective ecosystem management under changing environmental conditions.

How to cite: Dantas de Paula, M. and Hickler, T.: Integrating a Dynamic Global Vegetation Model (LPJ-GUESS-NTD) and Earth Observation data for mapping functional traits of vegetation, EGU General Assembly 2025, Vienna, Austria, 27 Apr–2 May 2025, EGU25-5663, https://doi.org/10.5194/egusphere-egu25-5663, 2025.

EGU25-7360 | ECS | Posters on site | BG3.3

Assessing Carbon Storage and Age in Urban Trees Using Radiocarbon Analysis 

Tamás Varga, Dominik Nagy, Mihály Molnár, Timothy A.J. Jull, István Futó, Carlos A. Sierra, Boaz Hilman, Danny Vargas, and Zsuzsa Lisztes-Szabó

Terrestrial plants maintain carbon reserves to support their functions during periods when metabolic demand exceeds carbon supply, such as during the dormant season (Carbone et al. 2013). Urban trees may differ in the size and age of these carbon pools due to their specific environmental conditions, especially more stressful environment and occasional lack of water. In order to better understand the carbon storage strategy of urban trees, tree-ring core samples were collected in a medium-sized Hungarian city, Debrecen, from Celtis occidentalis trees located in different urban areas, such as downtown and suburban sampling points. In addition to the tree rings, bud samples were also collected to determine the age of carbon used for the production of new plant tissue during spring. The accelerator mass spectrometry-based bomb-radiocarbon approach was used determine the age of the carbon stored in the plant and bud samples (Richardson et al. 2015, Richter et al. 2009.). The results show that fresh carbon was used to produce new spring buds and the results show that the possible fossil contribution in urban areas can shift the age of fresh plant material. In contrast, our previous study showed that non-urban trees use much older carbon to produce buds (Varga et al. 2024). Although the trees studied used fresh carbon to build new tissues, the sugar and starch concentrations and their radiocarbon ages show that there is a low but considerable amount of stored carbon in the urban trees. The 14C measurement reveals the turnover time and mixing of old and fresh carbon in the tree, and shows a declining trend in the stored carbon concentration by the years.

 References

Carbone et al. 2013., Age, allocation and availability of nonstructural carbon in mature red maple trees. New Phytologist 200(4): 1145–1155.

Richardson et al., 2015. Distribution and mixing of old and new nonstructural carbon in two temperate trees. New Phytologist 206(2): 590–597.

Richter et al., 2009. Preparation of starch and soluble sugars of plant material for the analysis of carbon isotope composition: a comparison of methods. Rapid Commun. Mass Spectrom. 23, 2476–2488.

Varga, et al., 2024. Spring buds of European woody plants have old 14C age. Heliyon 10. 

How to cite: Varga, T., Nagy, D., Molnár, M., Jull, T. A. J., Futó, I., Sierra, C. A., Hilman, B., Vargas, D., and Lisztes-Szabó, Z.: Assessing Carbon Storage and Age in Urban Trees Using Radiocarbon Analysis, EGU General Assembly 2025, Vienna, Austria, 27 Apr–2 May 2025, EGU25-7360, https://doi.org/10.5194/egusphere-egu25-7360, 2025.

EGU25-7741 | ECS | Orals | BG3.3

Uncertainty in tundra plant functional traits outweighs climate scenario uncertainty 

Katya Jay, Will Wieder, Sarah Elmendorf, Marko Spasojevic, and Katharine Suding

Plant functional traits provide a link to scale from organism to community and ecosystem levels, making it critical to understand how traits will mediate ecosystem responses to climate change. Combinations of these functional traits, which are likely to shift under climate change, also provide insight into plant resource use strategies, determining whether plants have resource-use acquisitive or conservative growth strategies. In this study, we used meteorological and eddy covariance tower data from the Niwot Ridge Long Term Ecological Research site (Colorado, USA) to run point-scale Community Land Model (CLM; the terrestrial component of the Community Earth System Model) simulations with plant functional trait observations. We modified plant traits and parameters–including foliar traits, phenological characteristics, and hydraulic traits–to represent tundra growth strategies and to configure dry, moist, and wet tundra communities driven by differences in snow accumulation. After validating our simulations with local observations, we quantified the relative contributions of plant trait and climate change scenario uncertainties to future productivity outcomes by modifying parameters to represent more resource-use conservative or acquisitive communities under two climate change scenarios. We found that using foliar trait observations from each plant community significantly improved productivity estimates compared to overestimates in the default simulation. In addition, the relative contributions of plant trait and climate scenario uncertainties varied among communities and over time in future simulations. Overall, uncertainty in plant functional trait shifts had a larger effect on ecosystem carbon-cycle responses than uncertainty in the forced response from medium and high emissions scenarios. Our findings demonstrate the importance of plant functional traits in shaping ecosystem responses to climate change and the value of incorporating site-level observations into ecosystem models as a means to predict climate change impacts on ecosystem function. 

How to cite: Jay, K., Wieder, W., Elmendorf, S., Spasojevic, M., and Suding, K.: Uncertainty in tundra plant functional traits outweighs climate scenario uncertainty, EGU General Assembly 2025, Vienna, Austria, 27 Apr–2 May 2025, EGU25-7741, https://doi.org/10.5194/egusphere-egu25-7741, 2025.

Root phosphatase activity (RPA) is an important physiological root trait, serving as hydrolyzing soil organic phosphorus into bioavailable orthophosphate and reflecting plants’ ability to acquire phosphorus. However, the global variation and its link with other root traits remains uncertain. By synthesizing the first global dataset of RPA comprising 607 observations across 258 species, we found that while RPA varies tremendously among species, N-fixers exhibited significantly higher RPA than non-fixers. However, RPA showed minimal variation across different growth forms and mycorrhizal types. Moreover, our results revealed globally widespread coordination and trade-offs between RPA and root morphology, architecture, and mycorrhizal symbiosis that are directly linked to phosphorus acquisition. However, there are few exceptions in certain groups, likely due to outlier species that employ unique strategies. Additionally, root nutrients are good predictors of RPA. RPA aligns closely with the collaboration dimension of the root economics space globally. We suggest that plants employ a range of phosphorus acquisition strategies, which could explain species coexistence in phosphorus-limited soils.

How to cite: Ao, G. and Zhu, B.: Linking root phosphatase activity to root chemical and morphological traits across species – a global synthesis., EGU General Assembly 2025, Vienna, Austria, 27 Apr–2 May 2025, EGU25-7832, https://doi.org/10.5194/egusphere-egu25-7832, 2025.

EGU25-9389 | ECS | Orals | BG3.3

Nitrogen and phosphorus constraints to photosynthetic capacity across different plant functional types 

Xiaofeng Lin, Fei Wang, Lifeng Guo, Zhongyong Xiao, and Jingchun Fang

Nitrogen (N) and phosphorus (P) are considered the most significant limiting factors for plant growth in natural ecosystems. While Vcmax and Jmax can be predicted reasonably well based on N content, as included in some existing models, predictions improve when P content is taken into account. However, the evidence supporting the role of P in relation to Vcmax and Jmax mainly in tropical ecosystems and the relationship between leaf nutrient traits (both N and P) and photosynthetic parameters across global biomes and climate zones remains unclear due to a lack of data from temperate and boreal regions. In this study, we analyze observations from species across 21 plant functional types (PFTs), 7 biomes, and 4 climate zones, encompassing both broadleaf and needle-leaf temperate and boreal species, to investigate how these N and P influence photosynthetic parameters while considering the variations among different PFTs. The results show that the interaction between leaf nitrogen and phosphorus content significantly affects Vcmax for different plant functional types. Additionally, the explanatory power of N and P as individual variables varies among the different functional types. For most temperate and boreal PFTs, the relationship between Jmax and Vcmax is significantly influenced by the inclusion of N or P. Our analysis highlights the importance of differentiating the relationships between photosynthetic capacity and nutrients across various plant functional types, providing a quantitative framework for understanding the constraints of N and P on photosynthesis.

How to cite: Lin, X., Wang, F., Guo, L., Xiao, Z., and Fang, J.: Nitrogen and phosphorus constraints to photosynthetic capacity across different plant functional types, EGU General Assembly 2025, Vienna, Austria, 27 Apr–2 May 2025, EGU25-9389, https://doi.org/10.5194/egusphere-egu25-9389, 2025.

EGU25-9557 | ECS | Orals | BG3.3

Acclimation to drought and warming alters stress response to heatwaves in tree seedlings 

Leonie Schönbeck, Karl-Johan Bergstrand, and Magnus Löf

Increasing frequency and intensity of droughts and heatwaves worldwide cause reductions in forest productivity, threatening the ecosystem services that forests provide and their carbon sequestration potential. A better understanding of the trait variability in space and time would improve the predictability of models on individual and ecosystem scale. We looked at the acclimation potential of drought and heat tolerance in three important tree species in Sweden: Picea abies, Betula pendula and Quercus robur. We hypothesized that i) tree species can acclimate to warming and drought leading to better resistance to heatwaves, and ii) heat and drought tolerance are coupled and that acclimation to drought would lead to increased heat tolerance and vice versa. In a climate chamber experiment in southern Sweden, seedlings of the three species were planted in pots and exposed to two different temperatures, and a well-watered and drought treatment. After a three-month acclimation phase, the trees were exposed to two consecutive heat waves with a two-week recovery period. Before and after acclimation and heatwaves, drought and heat tolerance indicators were measured, such as turgor loss point (ψTLP) and leaf thermal tolerance (T50). Leaf drought and heat tolerance acclimated to respective treatments, with different magnitudes depending on species. The three species also had different survival strategies to heatwaves. The results reveal the acclimation potential of tree species to drought, warming and the combination. They underline the importance to consider trait acclimation and the combined effects of drought and heat on tree physiology in plant and ecosystem models.  

How to cite: Schönbeck, L., Bergstrand, K.-J., and Löf, M.: Acclimation to drought and warming alters stress response to heatwaves in tree seedlings, EGU General Assembly 2025, Vienna, Austria, 27 Apr–2 May 2025, EGU25-9557, https://doi.org/10.5194/egusphere-egu25-9557, 2025.

EGU25-11448 | ECS | Posters on site | BG3.3

Peatland shrub roots increase resource acquisition with warming 

Tiia Määttä, Nikhil Chari, Joanne Childs, Colleen Iversen, Verity Salmon, Geoffrey Schwaner, Sören Weber, and Avni Malhotra

Biogeochemical cycling and properties of ecosystems depend, in part, on the assimilation of carbon and uptake of mineral nutrients and water by plants. Belowground, these processes can be studied with the root economic spectrum (RES) which describes plant resource acquisition strategies along a spectrum of fast (e.g., longer and thinner roots) to slow acquisition (e.g., shorter and thicker roots). However, plant-mediated controls on ecosystem functions have often been studied aboveground, leaving the belowground processes largely understudied. This is especially true for water-saturated wetlands, such as peatlands, where drivers of root resource acquisition strategies may be very different than in upland soils. In order to reliably predict peatland plant responses to environmental change and the subsequent shifts in biogeochemical cycles, we need a better understanding of plant fine root trait plasticity under climate warming. 


We investigated RES trait-environment linkages at a peatland whole-ecosystem climate change experiment (SPRUCE, Minnesota, USA). We collected shrub and tree (spruce and larch) fine root samples from root ingrowth cores installed in enclosures (n=10) with warming (+0 ℃ to +9 ℃) and elevated CO2 (ambient and +500 ppm above ambient) treatments, and plots without enclosure (n=2), over five years (2014-2017 and 2022-2023). We obtained root economic trait data, such as specific root length (SRL) and root tissue density (RTD), from the samples using a root scanning software, as well as root chemistry using an isotope-ratio mass spectrometer. In addition, we collected root exudation rate data from trees and shrubs in each enclosure in 2022. To estimate the contribution of increased soil temperature and elevated CO2 on RES traits, we will build linear mixed effect models for each root trait (response variables) with soil temperature, soil moisture and elevated CO2 treatment as fixed effects and year and microtopography (hummock and hollow) as random effects. 


Preliminary results suggest that shrubs respond to warming by shifting to a stronger resource acquisition strategy, as indicated by increasing SRL by soil temperature and slightly decreasing RTD. Tree SRL did not change along the warming and elevated CO2 treatments, but RTD seems to decrease, particularly in the 9 ℃ warming treatment, in general indicating a slow resource acquisition strategy. We also found indications of an increasing nutrient-mining strategy with warming for shrubs, where increasing root exudation rates in higher soil temperature may lead to increasing plant-available N and increased root N uptake. 

How to cite: Määttä, T., Chari, N., Childs, J., Iversen, C., Salmon, V., Schwaner, G., Weber, S., and Malhotra, A.: Peatland shrub roots increase resource acquisition with warming, EGU General Assembly 2025, Vienna, Austria, 27 Apr–2 May 2025, EGU25-11448, https://doi.org/10.5194/egusphere-egu25-11448, 2025.

EGU25-11638 | ECS | Orals | BG3.3

Towards Resilient Forests: Uncovering the Role of Plant Traits and Functional Diversity 

Maik Billing, Boris Sakschewski, Werner von Bloh, Sarah Bereswill, Jamir Priesner, and Kirsten Thonicke

Plant traits connect individual organisms to ecosystem functions and offer a valuable perspective on ecosystem responses to rapid global change. This talk highlights the potential of flexible-trait modelling to advance our understanding of trait ecology and forest stability.

The flexible-trait model LPJmL-FIT, which was built upon data from the TRY Plant Trait Database, enables us to explore how key plant traits and their interactions over space and time. By integrating process-based vegetation models with machine learning and advanced statistics, we demonstrate how this approach can complement observations to uncover links between biodiversity, plant traits, and ecosystem functioning.

The talk will share key insights from studies on the role of functional diversity in enhancing forest resilience to climate change (Billing et al., 2022, 2024; Sakschewski et al., 2015; Thonicke et al., 2020). Our findings demonstrate that functional trait diversity supports long-term forest biomass, particularly through mechanisms such as functional complementarity. However, the benefits of diversity diminish under extreme warming and vary across site conditions, underscoring the context-dependent nature of these dynamics and the need for continued model development. Further progress in trait-based modelling depends on broader datasets, particularly for belowground traits, which remain underrepresented in current measurements. These efforts might bridge key gaps and refine our understanding of future plant dynamics.

Billing, M., Sakschewski, B., Werner Von Bloh, , Vogel, Johannes, & Thonicke, K. (2024). ‘How to adapt forests?’—Exploring the role of leaf trait diversity for long-term forest biomass under new climate normals. Global Change Biology, 30(4), e17258. https://doi.org/10.1111/GCB.17258

Billing, M., Thonicke, K., Sakschewski, B., von Bloh, W., & Walz, A. (2022). Future tree survival in European forests depends on understorey tree diversity. Scientific Reports, 12(1), 1–12. https://doi.org/10.1038/s41598-022-25319-7

Sakschewski, B., von Bloh, W., Boit, A., Rammig, A., Kattge, J., Poorter, L., Peñuelas, J., & Thonicke, K. (2015). Leaf and stem economics spectra drive diversity of functional plant traits in a dynamic global vegetation model. Global Change Biology, 21(7), 2711–2725. https://doi.org/10.1111/gcb.12870

Thonicke, K., Billing, M., von Bloh, W., Sakschewski, B., Niinemets, Ü., Peñuelas, J., Cornelissen, J. H. C., Onoda, Y., van Bodegom, P., Schaepman, M. E., Schneider, F. D., & Walz, A. (2020). Simulating functional diversity of European natural forests along climatic gradients. Journal of Biogeography, 47(5), 1069–1085. https://doi.org/10.1111/jbi.13809

How to cite: Billing, M., Sakschewski, B., von Bloh, W., Bereswill, S., Priesner, J., and Thonicke, K.: Towards Resilient Forests: Uncovering the Role of Plant Traits and Functional Diversity, EGU General Assembly 2025, Vienna, Austria, 27 Apr–2 May 2025, EGU25-11638, https://doi.org/10.5194/egusphere-egu25-11638, 2025.

EGU25-11749 | ECS | Orals | BG3.3

From satellites to smartphones: harnessing citizen science and Earth observation to unlock global perspectives on plant functional diversity 

Daniel Lusk, Sophie Wolf, Daria Svidzinska, Jens Kattge, Francesco Maria Sabatini, Helge Bruelheide, Gabriella Damasceno, Álvaro Moreno Martinez, and Teja Kattenborn

Understanding global patterns of functional diversity is essential for exploring ecosystem functioning, yet our current knowledge is limited to specific regions and geographically restricted datasets.. Meanwhile, rapidly growing citizen science initiatives, such as iNaturalist or Pl@ntNet, have generated millions of ground-level species observations across the globe. Despite citizen science species observations being noisy and opportunistically sampled, previous studies have shown that integrating them with large functional trait databases enables the creation of global trait maps with promising accuracy. However, aggregating citizen science data only allows for the generation of relatively sparse and coarse trait maps, e.g. at 0.2 to 2.0 degree spatial resolution.

Here, by using such citizen science data in concert with vegetation surveys and high-resolution Earth observation data, we extend this approach to model the relationships between functional traits and their structural and environmental determinants, providing global trait maps with globally continuous coverage and high spatial resolution (up to 1km). This fusion of ground-based citizen science and continuous satellite data allows us not only to map more than 30 ecologically relevant traits but also to derive crucial functional diversity metrics at a global scale. These metrics—such as functional richness and evenness—provide new opportunities to explore the role of functional diversity in ecosystem processes, particularly in areas previously lacking in data availability.

Our approach presents a scalable framework to advance understanding of plant functional traits and diversity, opening the door to new insights on how ecosystems may respond to an increasingly variable and extreme climate.

How to cite: Lusk, D., Wolf, S., Svidzinska, D., Kattge, J., Maria Sabatini, F., Bruelheide, H., Damasceno, G., Moreno Martinez, Á., and Kattenborn, T.: From satellites to smartphones: harnessing citizen science and Earth observation to unlock global perspectives on plant functional diversity, EGU General Assembly 2025, Vienna, Austria, 27 Apr–2 May 2025, EGU25-11749, https://doi.org/10.5194/egusphere-egu25-11749, 2025.

EGU25-12285 | ECS | Orals | BG3.3

Challenges and opportunities in building a global model of plant hydraulics 

Manon Sabot, Martin De Kauwe, Andy Pitman, Rachael Gallagher, Anne Verhoef, Nicolas Martin-StPaul, Hervé Cochard, Miquel de Cáceres, Víctor Flo, Pin-Hsin Hu, Belinda Medlyn, Phillip Papastefanou, Anna Ukkola, Sönke Zaehle, and Yijian Zeng

Observations of drought-driven damage to vegetation are widespread but, until recently, large-scale terrestrial models used to study climate-vegetation interactions did not capture the contrasting sensitivities of plants to drought. This is changing with the advent of a generation of models that consider plant hydraulics. Plant hydraulics link plant water status to pedoclimatic conditions; as such, explicit consideration of plant hydraulics should make models more mechanistic and predictive. Models, however, diverge in how they represent the plant water transport pathway and relate it to other plant functions (e.g., photosynthesis), so they further diverge in their parameterisation approach for hydraulic processes. Only at the most basic level do plant hydraulic implementations converge on a common set of measurable traits or parameters: two that describe a hydraulic vulnerability curve (e.g., P12 and P50, the water potentials at which 12% and 50% of a plant’s hydraulic conductivity are lost, respectively), and one that quantifies the efficiency of water movement within the plant (e.g., maximum hydraulic conductance). Regrettably, we do not yet know how to obtain regional- or global-scale hydraulic parameters from local-scale measurements, nor how to connect them to other plant traits. In this study, we propose strategies to leverage cross-species hydraulic diversity when scaling traits from the species level into model parameters. We also emphasise the importance of accounting for (i) within-species trait variability across space (e.g., interactions between hydraulic traits and their environment) and (ii) cross-functional trait covariation (i.e., interactions – or lack thereof – among traits that characterise different functional axes). Beyond advancing regional and global plant hydraulic modelling, efforts to address the suggested strategies would ready models for simulations that capture the resilience of vegetation communities worldwide.

How to cite: Sabot, M., De Kauwe, M., Pitman, A., Gallagher, R., Verhoef, A., Martin-StPaul, N., Cochard, H., de Cáceres, M., Flo, V., Hu, P.-H., Medlyn, B., Papastefanou, P., Ukkola, A., Zaehle, S., and Zeng, Y.: Challenges and opportunities in building a global model of plant hydraulics, EGU General Assembly 2025, Vienna, Austria, 27 Apr–2 May 2025, EGU25-12285, https://doi.org/10.5194/egusphere-egu25-12285, 2025.

EGU25-12647 | ECS | Posters on site | BG3.3

How seasonal drought events alter carbon allocation and mycorrhizal respiration in a Central-Hungarian dry grassland 

Giulia De Luca, Szilvia Fóti, Ádám Mészáros, Krisztina Pintér, Zoltán Nagy, and János Balogh

Arbuscular mycorrhizal fungi (AMF) as symbiotic microorganisms mediate carbon allocation between plants and soil by acting as a pathway of carbon to soil organic matter and between soil and atmosphere through mycorrhizal respiration. In 2022 an experiment focusing on the  contribution of mycorrhizal fungi to soil respiration was set up in a Central-Hungarian dry sandy grassland. In this drought prone area drought events occur throughout the year and the limited water availability causes seasonal changes in plant growth, carbon uptake and thus in soil respiration as well.


During this study CO2 gas exchange was monitored by two different systems: eddy covariance (EC) and automated soil respiration measuring system (ASRS). In case of the ASRS four treatments were separated using the collar deployment method: i) undisturbed, root and AMF included, ii) disturbed, root and AMF included, iii) root excluded and iv) root and AMF excluded.

Here we present our results from two consecutive, yet - regarding water availability - dissimilar years (2023 and 2024).

How to cite: De Luca, G., Fóti, S., Mészáros, Á., Pintér, K., Nagy, Z., and Balogh, J.: How seasonal drought events alter carbon allocation and mycorrhizal respiration in a Central-Hungarian dry grassland, EGU General Assembly 2025, Vienna, Austria, 27 Apr–2 May 2025, EGU25-12647, https://doi.org/10.5194/egusphere-egu25-12647, 2025.

EGU25-13693 | Orals | BG3.3

Linking vegetation to ecosystem function through plant paleo-traits 

Jonathan Wilson, William Matthaeus, Joseph White, Daniel Peppe, Wray Jones, Owen Cross, Rebecca Hametz-Berner, Shoshi Hornum, and Wyatt Mattison

Plants are a key interface in the Earth system, modulating hydrology, nutrient cycles, and surface properties such as albedo through their physiological activity, growth, and development. Because evolution has shaped these plant properties, the representation of geological-age-appropriate vegetation in ecosystem and climate models is critically important for the examination of environmental change over geologic time. The last >400 million years of plant evolution has recorded paradigm shifts in plant anatomical traits in response to adaptation to environmental conditions. The disparity between extinct traits and living traits challenges the validity of extrapolating past ecosystem function from observations made using living plants. Major plant environmental resistances (i.e., to drought and frost) can be opaque to reconstruct in deep-time ecosystems because extinct organisms contained anatomical features with no living analog, but these properties are related to plant traits and can be derived directly from fossilized plant anatomy.

Recent advances integrate measurements of plant fossils containing anatomical detail with process-based ecosystem models. This approach allows quantitative plant traits to be derived for extinct plants and the effects of these paleo-traits to be simulated in the context of age-appropriate environments. Key measurements of plant vascular anatomy from fossilized wood, branches, and leaves are made from field-collected plant fossils or material already present in museum collections using minimally destructive techniques. These measurements are transformed using biophysical, biochemical, or statistical models of plant function into quantitative or qualitative traits, or are used directly as parameters in the process-based ecosystem model Paleo-BGC.

Application of this linked anatomy-trait-model approach across Earth history shows that appropriate modeling of traits may have profound effects on simulated biogeochemical cycles. For example, the replacement of one plant type—a sphenopsid—by another closely related plant within the same taxonomic group with different traits likely had significant effects on the collapse of the Carboniferous rainforest during the Carboniferous-Permian transition (~303 Ma). Likewise, exploring the effect of ecosystem replacement across a singular environmental event (the Triassic-Jurassic mass extinction, ~201 Ma) illustrates how changes in plant community composition, by modifying vegetation traits present in ecosystems, transformed the relative magnitude of plant carbon and water cycle effects in response to Earth system events. Linking deep-time plant anatomy to ecosystem function through quantitative and qualitative paleo-traits is an underutilized, accessible, and informative approach to identifying vegetation response through time. Applying these methods across the evolutionary history of land plants, as recorded in the fossil record, will yield a better understanding of the feedbacks between vegetation and climate and a more complete picture of how the evolution of plant traits influenced plant-environment feedbacks through time.

How to cite: Wilson, J., Matthaeus, W., White, J., Peppe, D., Jones, W., Cross, O., Hametz-Berner, R., Hornum, S., and Mattison, W.: Linking vegetation to ecosystem function through plant paleo-traits, EGU General Assembly 2025, Vienna, Austria, 27 Apr–2 May 2025, EGU25-13693, https://doi.org/10.5194/egusphere-egu25-13693, 2025.

EGU25-14001 | ECS | Orals | BG3.3

Invasive winners and losers: the influence of traits on climate-driven invasive plant range changes 

Gabriela Nunez-Mir, Eduardo Tovar, Jenica Allen, and Amanda Suzi-Simmons

Climate change is expected to impact the distribution of invasive plants, with certain species forecasted to expand, contract and/or shift their invasive ranges. However, the mechanisms and associated species traits driving these distinct biogeographical responses are not well understood. In this study, we investigate the relationships between functional and niche traits of invasive plant species and their forecasted range responses to climate change. We leveraged previously published species distribution models for invasive terrestrial plants in the United States, as well as a comprehensive invasive traits database, to assemble a dataset of current and future ranges (based on average projected climate in 2040-2060) of 476 invasive plants. We also compiled functional and niche traits for these species, such as specific leaf area, dispersal vectors and environmental tolerances. Our findings indicate that species with larger current ranges, moderately thick, resource-efficient leaves, and long-distance animal dispersal capabilities showed smaller range centroid shifts. Conversely, changes in range area were smaller for species with broad hardiness zone ranges, a preference for higher elevations, and tolerance to extreme precipitation regimes. Minimum hardiness zone emerged as the strongest predictor of range expansion or contraction within the U.S., with species adapted to warmer climates and with restricted current ranges more likely to expand.  This work provides valuable insights into the mechanisms underlying invasive plant range responses to climate change and offers a framework for integrating trait-based approaches with predictive modeling to inform management strategies.

How to cite: Nunez-Mir, G., Tovar, E., Allen, J., and Suzi-Simmons, A.: Invasive winners and losers: the influence of traits on climate-driven invasive plant range changes, EGU General Assembly 2025, Vienna, Austria, 27 Apr–2 May 2025, EGU25-14001, https://doi.org/10.5194/egusphere-egu25-14001, 2025.

EGU25-14210 | ECS | Orals | BG3.3

Climate sensitivity and carbon dynamics of Eucalyptus obliqua within wet and dry Tasmanian forests: Implications for future growth under climate change 

Justin Mathias, Torrey Stephenson, Cooper Moon, Menna Jones, Tara Hudiburg, and Laurel Lynch

The eucalyptus forests of Tasmania, Australia are some of the most productive and carbon dense in the world. Of the eucalypt species that are native to Tasmania, messmate stringybark (Eucalyptus obliqua, Euob) dominates 20% of the forested landscape. Moreover, Euob is distributed across both dry and wet forests that exhibit vastly different microclimates and subdominant vegetation communities. However, warming temperatures and increasingly stochastic precipitation events threaten their fate. Here, we reconstruct historical growth and physiology to characterize the sensitivity and timing of Euob tree responses to climate in two contrasting forest types (i.e. wet versus dry). We then combine these data with stand-level surveys and total carbon inventories to scale our findings within their respective geographical footprints. Finally, we develop a novel modeling framework to contextualize differences in the growth potential of trees in each environment under current and future projected environmental conditions. We found Euob tree growth in dry forests is highly sensitive to climate in the late spring, while growth in wet forests is more complacent and driven to a greater extent by mean climate over the course of a growing season. Moreover, intrinsic water use efficiency, the ratio of net photosynthesis to stomatal conductance to water, remains constant across a range of soil moisture in wet Euob forests, but declines with increasing water availability in dry forests. Our data suggest Euob growth, and subsequently carbon uptake and allocation to stem wood, is energy-limited in wet forests and water-limited in dry forests. Growth modeling revealed that, even under ideal conditions (i.e. maximum realized growth potential), stand-level carbon stocks in dry Euob forests achieve only 90% of those currently observed in wet forests. Our results suggest Euob trees in energy-limited wet forests could benefit under future climate, as Tasmania is expected to become warmer in most regions, while dry forests may be particularly vulnerable.


How to cite: Mathias, J., Stephenson, T., Moon, C., Jones, M., Hudiburg, T., and Lynch, L.: Climate sensitivity and carbon dynamics of Eucalyptus obliqua within wet and dry Tasmanian forests: Implications for future growth under climate change, EGU General Assembly 2025, Vienna, Austria, 27 Apr–2 May 2025, EGU25-14210, https://doi.org/10.5194/egusphere-egu25-14210, 2025.

EGU25-16006 | Posters on site | BG3.3

Belowground carbon allocation has stronger influence on soil respiration than soil organic carbon content in a dry temperate grassland  

János Balogh, Giulia de Luca, Krisztina Pintér, Zoltán Nagy, Péter Koncz, Gabriella Süle, Levente Kardos, Dániel Cserhalmi, Györgyi Gelybó, Györgyi Kampfl, and Szilvia Fóti

As the major carbon sources of soil respiration (Rs) are the soil organic carbon content (SOC) and the belowground carbon allocation, we aimed to reveal their effects on actual CO2 efflux from soil. For that reason, we measured soil respiration and additional variables in a dry grassland site in Hungary in the same spatial grid (78 points, 0.54 ha) during 23 campaigns in eight years covering a broad range of environmental conditions. The measuring positions at the study site had high spatial variability of topsoil organic carbon content (range was 2-14%, 0-10 cm). The source of belowground carbon allocation is plant photosynthesis, therefore we used gross primary productivity (GPP) as a predictive variable of Rs. GPP was derived from eddy-covariance measurements and downscaled to the measuring positions by using above-ground biomass and vegetation index data. To visualize the multidimensional data, principal component analysis was performed. To describe the partial effects of the measured variables general additive models (GAM) were fitted and the relative importance of predictor variables in GAM models was estimated. According to the results, GPP had similar importance in the models as soil temperature (Ts) and soil water content (SWC), while the importance of SOC was negligible. GPP was the most important predictor variable in the middle of the vegetation period, while SWC was the most important in the first part of the vegetation period and Ts in the late season. The overall relative importance of SWC, GPP and Ts were 35.7%, 31.8% and 29.2%, respectively. The shape of the partial effect of GPP was linear suggesting that the whole range of GPP could be an important factor in soil respiration models.

How to cite: Balogh, J., de Luca, G., Pintér, K., Nagy, Z., Koncz, P., Süle, G., Kardos, L., Cserhalmi, D., Gelybó, G., Kampfl, G., and Fóti, S.: Belowground carbon allocation has stronger influence on soil respiration than soil organic carbon content in a dry temperate grassland , EGU General Assembly 2025, Vienna, Austria, 27 Apr–2 May 2025, EGU25-16006, https://doi.org/10.5194/egusphere-egu25-16006, 2025.

Leaves and trunk bark are the main parts of woody species burned in canopy and surface fires, yet lack of knowledge of flammability of different plant parts and their coordination have impeded the understanding of plant flammable strategies to fire disturbance, and the ecological feedbacks between fire and vegetation.

We sampled 271 common woody species in subtropical semi-humid forest, then measured 10 flammability traits of leaves and bark using the cone calorimeter (including heat release, time to ignition, flame height, smoke production). Bark and leaf flammability showed large difference across woody species. Leaves were generally more ignitable, consumable and combustible, but the sustainability was lower than that of the bark. Moreover, we show that bark flammability and leaf flammability are decoupled because they were driven by size-related traits and economics-related traits, respectively.

According to the decoupling between leaves and bark, we defined plant flammability syndromes based on the different combinations of flammability strategies of leaves and bark, and assessed the impact of fire frequency on different flammability syndromes. Furthermore, the results also indicated that 40.0%, 39.1% and 20.9% woody plant species had hot-, fast-, and low-flammable leaves, respectively; and 28.2%, 35.7% and 36.1% species had hot-, fast- and low- flammable bark. Tree species (47.5%) had a higher percentage of flammability strategy separation between leaves and bark than large shrub (19.7%) and shrub species (18.2%). Community-level evidence showed that species with fast- or hot- flammable leaves and bark may gain a notable advantage with repeated fires. Structural equation models indicated that more frequently burned forests were associated with infertile soil, shrub enrichment and lower species richness, subsequently leading to a favor on flammable plant species.

Therefore, the difference and coordination between leaves and bark flammability, might help to well characterize the flammability strategies of plants. The positive feedback loop would generate between the dominance of flammable species in the plant communities and the fire frequency, fostering the characteristics of fire regimes in the semi-humid evergreen broadleaved forests.

How to cite: Luo, C.: Bark and leaf flammability in subtropical semi-humid forest in China, and  plant flammable syndromes how to respond to  fire frequency, EGU General Assembly 2025, Vienna, Austria, 27 Apr–2 May 2025, EGU25-16656, https://doi.org/10.5194/egusphere-egu25-16656, 2025.

EGU25-17721 | ECS | Orals | BG3.3

Anthropocene Plant Migration: Regional Shifts in Trait Patterns and Functional Diversity 

Sophie Wolf, Daria Svidzinska, Miguel Mahecha, and Teja Kattenborn

Over the past centuries, human activities have profoundly reshaped global plant migration patterns, accelerating the movement of species across vast distances. These new arrivals—whether deliberately introduced or transported unintentionally—often possess distinct functional traits that transform local community trait spaces and, in turn, ecosystem processes. Despite these widespread changes, the extent of functional conversions remains poorly understood.

In this study, we combine crowd-sourced plant occurrence data with naturalized species lists to reconstruct global trait distributions for two scenarios: (i) considering all species observed in a region and (ii) excluding neophyte species. By comparing these distributions, we estimate how neophyte introductions have reconfigured ecosystem functional spaces.

Our findings suggest distinct, region-specific shifts in functional traits along the global spectrum of plant form and function. These shifts are particularly evident in principal component 1 (PC1), which is associated with size-related traits such as plant height, rooting depth, and seed mass, and principal component 2 (PC2), which reflects traits like specific leaf area (SLA) and leaf nitrogen per area. For instance, in the Mediterranean, communities appear to have shifted toward larger trait values on PC1, while in Eastern and Central North America, shifts tend toward smaller values. In Western North America, the primary shift occurs along PC2, with increases in SLA and declines in leaf nitrogen per area. In Southern Australia, trait space shifts along both PC1 and PC2, combining smaller size traits with higher SLA values.

These results highlight the significant and varied impacts of Anthropocene plant migration on ecosystem functional properties worldwide, while also identifying gaps and biases in the extensive yet heterogenous crowd-sourced observation data. Moreover, the set of current and past trait patterns may open new opportunities to model the anthropogenic impact on ecosystem processes and properties.


How to cite: Wolf, S., Svidzinska, D., Mahecha, M., and Kattenborn, T.: Anthropocene Plant Migration: Regional Shifts in Trait Patterns and Functional Diversity, EGU General Assembly 2025, Vienna, Austria, 27 Apr–2 May 2025, EGU25-17721, https://doi.org/10.5194/egusphere-egu25-17721, 2025.

EGU25-17820 | Posters on site | BG3.3

Mapping Tree Hydraulics and Assemblages at Continental Scale 

Álvaro Moreno-Martínez, Jordi Muñoz-Marí, Jose Adsuara, James Knighton, Pablo Sanchez-Martinez, Leander Anderegg, Benjamin Dechant, Fabian D. Schneider, Jens Kattge, Teja Katternborn, Daniel Lusk, Akash Koppa, Diego Miralles, Maria Piles, Maurizio Mencuccini, David Chaparro, and Gustau Camps-Valls

Plant hydraulic traits are critical in regulating plant–water interactions and essential for understanding vegetation responses to environmental stress. Building on our earlier methodology for mapping global plant functional traits, we now incorporate a newly-available dataset of hydraulic traits for 55,779 tree species. This integrated framework leverages remotely sensed imagery, crowdsourced biodiversity data, and trait databases to estimate and map key hydraulic parameters, including maximum stomatal conductance (gsMAX), xylem pressure at 50% and 88% conductance loss (P50, P88), and photosynthetic water use efficiency (WUE).

The tree trait data underlying our study accounts for the large phylogenetic signals inherent in these hydraulic traits by leveraging phylogenetically-informed machine learning models and novel trait imputation methods. These enhanced predictions of hydraulic traits are subsequently integrated into our trait-mapping workflow, which has previously demonstrated high accuracy (r > 0.5; rME < 6%; rRMSE < 11%) for leaf-level traits at a 1 km spatial resolution. While the hydraulic trait maps have not yet been validated due to a lack of independent validation data, the observed patterns are consistent with a meta-analysis based on recent literature.

We also capture the full distribution of hydraulic traits (standard deviation, skewness, and kurtosis) at the grid-cell level to reflect the non-Gaussian variability of community-level traits.  This added detail helps elucidate the ecological strategies of species assemblages and refines our understanding of ecosystem vulnerability to climate extremes. Overall, this work offers a new avenue for improving global ecosystem models and Earth system simulations by providing spatially explicit community-level hydraulic trait estimates at large scales. Our results highlight the importance of merging global remote sensing data with state-of-the-art trait imputation and phylogenetic information to advance research on plant functioning and ecosystem dynamics.

How to cite: Moreno-Martínez, Á., Muñoz-Marí, J., Adsuara, J., Knighton, J., Sanchez-Martinez, P., Anderegg, L., Dechant, B., Schneider, F. D., Kattge, J., Katternborn, T., Lusk, D., Koppa, A., Miralles, D., Piles, M., Mencuccini, M., Chaparro, D., and Camps-Valls, G.: Mapping Tree Hydraulics and Assemblages at Continental Scale, EGU General Assembly 2025, Vienna, Austria, 27 Apr–2 May 2025, EGU25-17820, https://doi.org/10.5194/egusphere-egu25-17820, 2025.

EGU25-18957 | Orals | BG3.3

Beyond Mean Reaction Norms: Trait Plasticity and Growth of Trees under Interspecific Competition Above and Below Ground 

Boris Rewald, Hans Sandén, Douglas L. Godbold, and Ramona Werner

Mixed-species forests have the potential to enhance ecosystem resilience and productivity in the context of global change. While plant traits are increasingly being used to extend the scope of Earth observations to the organismal level and to link them to ecosystem functioning, intraspecific trait variability and plasticity are often neglected - models often rely on species-level means from databases. Furthermore, studies of species interactions and trait dynamics often overlook belowground plasticity. We investigated how competitive interactions influence growth and functional traits of four temperate deciduous tree species. We hypothesized that (1) growth effects in mixtures occur not only at the level of wood biomass, but also at the level of leaves and fine roots, resulting in overyielding effects at the stand level, (2) competitive interactions in mixed-species communities increase trait dissimilarity at the community level, and (3) species acclimation to intra vs. interspecific competition follows different types of reaction norms, including changes in trait mean and/or variability, depending on competitive status.

A forest inventory was conducted in planted monocultures, 2-species and 4-species mixtures of European Acer, Tilia, Quercus and Carpinus, representing a spectrum from acquisitive to conservative tree species. Competition effects were assessed with linear mixed effects models at the level of biomass and space acquisition, including leaf, canopy, stem and fine root traits. Using monocultures and 4-species mixtures, we analysed trait dissimilarity, means and variability of traits related to resource acquisition and use, including an extended ectomycorrhizal trait space, using kernel density-based metrics and generalised linear mixed models.

Most diverse stands, especially those with acquisitive Acer, exhibited aboveground overyielding, 1.5 to 1.9 times higher than monocultures. Fine roots showed significant overyielding in 4-species stands. Biomass allocation were highly species-specific and varied significantly at the diversity level. At the community level, aboveground traits other than specific leaf area showed limited plasticity, but belowground there was a marked difference between competitive superior and inferior species. Reaction norms of aboveground traits were dominated by shifts in mean and variability, whereas root traits were dominated by increases in variability in mixture. Trait dissimilarities, as a measure of plasticity across diversity levels, differed markedly between species, competitive dominance, and above and below ground. Overall, dominant Acer acclimated least to interspecific competition, whereas inferior Tilia and Carpinus showed variability-driven plasticity above and below ground. Quercus showed mean-driven reaction norms below ground, with minimal changes in trait variability in the mixture.

Our data highlights the need to increasingly consider effects at the whole-plant level, as both above- and belowground components contribute significantly to overyielding in mixed-species environments. Our results further underscore how species mixing and competitive hierarchies drive trait plasticity at the level of mean and/or variability, highlighting distinct above- and belowground strategies (i.e. reaction norms) that may drive resource complementarity and thus govern longer-term coexistence and biogeochemical cycling in mixed-species stands.

How to cite: Rewald, B., Sandén, H., Godbold, D. L., and Werner, R.: Beyond Mean Reaction Norms: Trait Plasticity and Growth of Trees under Interspecific Competition Above and Below Ground, EGU General Assembly 2025, Vienna, Austria, 27 Apr–2 May 2025, EGU25-18957, https://doi.org/10.5194/egusphere-egu25-18957, 2025.

EGU25-20925 | Posters on site | BG3.3

Stoichiometry character of larch forests in China 

Wenjing Fang

Ecological stoichiometry studies the chemical balance and their coupling relationships of carbon (C), nitrogen (N), phosphorus (P) and other elements in ecological processes, and plays an important role in revealing the mechanisms underlying biogeochemical cycles and ecosystem functions. This study focused on cold temperate coniferous forests, i.e. larch forests, and explored its stoichiometry character in China and how plant community structure and environmental factors affect the CNP stoichiometry of its soil and different organs of constructive species. The results following: (1) The needle and twig N:P ratios of larch species were less than 10, and the N:P ratio of cone was less than 14, indicating that constructive species growth was limited by N in Chinese larch forest. There were significant differences in the CNP stoichiometry characteristics among different organs of the constructive species. Although CNP stoichiometric characteristics of cone were significantly correlated with the C and N contents and C:N ratio of shallow soils, the reproductive organs had greater internal stability of the element stoichiometry than needle and twig, which were more easily affected by soil stoichiometry. (2) Altitude is an important factor affecting soil CNP stoichiometry in larch forests. And, the C and N contents, and C:N, C:P and N:P ratios in different soil layers significantly increased with the stand age, indicating that the growth of larch forests is conducive to the accumulation of soil nutrients. (3) Climatic factors were the main factors for the C content of twig, the N content of cone, and the N:P ratios of all organs in larch forests. Topographic factors were the main factors affecting needle C and N contents. The larch forest type was the main factor affecting cone C content, C:N and C:P ratios. Community factors were the main factors affecting the C:N ratio of soil and P content of cone. The relationships between CNP stoichiometric characteristics of different organs of constructive species and community factors were mainly reflected in average tree height and stand density, while the relationships between soil CNP stoichiometric characteristics and community factors were mainly reflected in stand age. This study elucidated the CNP stoichiometric characteristics of larch forests in China, and revealed the important influence of community factors on the stoichiometry of larch forests. These results will help to understand the adaptation and evolution process of alpine forest ecosystem to nutrient environment.

How to cite: Fang, W.: Stoichiometry character of larch forests in China, EGU General Assembly 2025, Vienna, Austria, 27 Apr–2 May 2025, EGU25-20925, https://doi.org/10.5194/egusphere-egu25-20925, 2025.

EGU25-20941 | Posters on site | BG3.3

Large-scale patterns of Fagus regeneration in China 

Qiong Cai

Natural regeneration is important for the study of vegetation dynamics under the background of global climate change, as well as for forest production management. Fagus species are an important component of temperate forests in the Northern Hemisphere and also have significant socio-economic value. However, large-scale studies on the regeneration of Fagus populations are currently insufficient. This study, based on community survey data from 150 natural Fagus forest plots, explores the large-scale pattern of Fagus population regeneration in China and analyzes the impacts of various factors, including natural disturbances, stand age, community structure, climate, soil physicochemical properties, and topography. The results showed that the density of Fagus seedlings generally exhibited a geographical pattern of being higher in the north and lower in the south, higher in the west and lower in the east, and increasing with elevation. Multiple regression analysis indicated that the density of standing dead trees (indicating disturbances), average tree height, and the density of Fagus trees in the canopy layer have relatively greater positive effects on the density of Fagus seedlings, while stand age and annual average temperature have relatively greater negative effects. Structural equation modeling further showed that the impact of mean annual temperature on the density of Fagus seedlings was mainly a direct negative effect. Stand age, on the one hand, had a directly negative impact on the density of Fagus seedlings, and on the other hand, had a indirectly opposite effect by reducing the density of Fagus trees in the canopy layer and increasing the average tree height. The density of standing dead trees had a direct promoting effect on the density of Fagus seedlings. The study results emphasize the importance of spatial scale in regeneration research, as well as the potential application of using the quantity of dead wood to represent small-scale disturbances in large-scale regeneration studies. They also provide a theoretical reference for the protection and utilization of Fagus resources in China.

How to cite: Cai, Q.: Large-scale patterns of Fagus regeneration in China, EGU General Assembly 2025, Vienna, Austria, 27 Apr–2 May 2025, EGU25-20941, https://doi.org/10.5194/egusphere-egu25-20941, 2025.

Biodiversity and community functional traits are critical to preserving the lake ecosystem stability under global environmental changes, which is essential for sustaining the vital ecosystem services we depend on. However, how species diversity and the key functional trait affect the multiple dimensions (temporal stability, resistance, resilience and recovery) and facets (function, composition, diversity and functional trait) of stability of macrophyte communities to algal bloom disturbances in freshwater lakes remains unclear. Here, based on sediment nutrient gradient experiments and three-year seasonal monitoring of macrophyte communities in Erhai Lake before and after the occurrence of algal blooms, we found that species diversity and stoichiometric homeostasis of phosphorus (HP) have positive relationships with functional and compositional temporal stability, resistance, and recovery, indicating that ecosystems with high species diversity and community HP are more resistant and stable in response to external algal bloom disturbances. However, species diversity and community HP have no positive or even negative relationships with resilience, suggesting that high biodiversity with high-HP species-dominated ecosystems is not beneficial for the rapid recovery from disturbances, probably due to the slow growth and reproduction rate of high-HP species. In addition, we found strong positive correlations between functional and compositional stability across the four dimensions of stability, while stability of species diversity and the key functional trait (HP) exhibit complex relationships, implying the difficulty of optimizing multiple dimensions and facets of stability simultaneously. Our results highlight the importance of macrophyte species diversity and community HP in determining the multiple dimensions and facets of stability in response to disturbances, which provides new insights for predicting the responses of macrophyte-dominated lake ecosystems to the current increasing frequency of algal blooms.

How to cite: Su, H.: Linking macrophyte species diversity and community stoichiometric homeostasis with multidimensional stability under algal bloom disturbances, EGU General Assembly 2025, Vienna, Austria, 27 Apr–2 May 2025, EGU25-20958, https://doi.org/10.5194/egusphere-egu25-20958, 2025.

EGU25-21106 | Orals | BG3.3

Functional responses of Mediterranean flora to fire: a community-scale perspective 

Leys Bérangère, Michelle Leydet, Eric Meineri, Arne Saatkamp, and Cyrille Violle
Fire regime is predicted to change, particularly in Mediterranean climate regions, towards more severe and frequent fire events. From a predictive perspective, trait-based ecology offers a comprehensive framework to characterize vegetation responses to fire. Since fires induce erosion and decrease soil nutrients, species’ functional traits and their distribution at community level should reflect these changes. Despite a vast literature focused on plant traits involved in resistance to fire, quantification of community trait responses to fire is lacking, particularly for traits that are linked to resource strategies. Here, we emphasis on plant traits related to morphology (height, specific leaf area, stem and wood density) and resource acquisition strategies (leaf nitrogen, leaf dry mass, seed dry mass). We compiled three different databases compiling vegetation, fire and functional traits for the flora of Southern France. We analyzed the relationships between these three components at both species and community levels. Fire numbers and area burnt did not impact species trait distributions. At community level, a clear pattern emerged between the number of fires and the distribution of different traits considered, with two main axes: on the positive PC2 axis vegetative height and seed mass; and on negative PC1 axis leaf carbon and positive PC1 axis nitrogen content and leaf area. We also showed that vegetative height is positively correlated to the aridity index distribution in the region studied.

How to cite: Bérangère, L., Leydet, M., Meineri, E., Saatkamp, A., and Violle, C.: Functional responses of Mediterranean flora to fire: a community-scale perspective, EGU General Assembly 2025, Vienna, Austria, 27 Apr–2 May 2025, EGU25-21106, https://doi.org/10.5194/egusphere-egu25-21106, 2025.

EGU25-21911 | Orals | BG3.3

Traits mediate global change effects on wood carbon fluxes 

Zhenhong Hu, Guiyao Zhou, and Marcos Fernandez-Martínez

CO2 fluxes from wood decomposition represent an important source of carbon from forest ecosystems to the atmosphere, which are determined by both wood traits and climate influencing the metabolic rates of decomposers. Previous studies have quantified the effects of moisture and temperature on wood decomposition, but these effects were not separated from the potential influence of wood traits. Indeed, it is not well understood how traits and climate interact to influence wood CO2 fluxes. Here, we examined the responses of CO2 fluxes from dead wood with different traits (angiosperm and gymnosperm) to drought and nutrient enhancement across seasonal temperature gradients. Our results showed that drought significantly decreased wood CO2 fluxes, but its effects varied with both taxonomical group and drought intensity. Drought-induced reduction in wood CO2 fluxes was larger in angiosperms than gymnosperms for the 35% rainfall reduction treatment, but there was no significant difference between these groups for the 70% reduction treatment. This is because wood nitrogen density and carbon quality were significantly higher in angiosperms than gymnosperms, yielding a higher moisture sensitivity of wood decomposition. Further, nutrient additions significantly increased wood CO2 fluxes via fungal composition, but effects varied with nutrient types and taxonomic groups. Specifically, phosphorus addition significantly increased wood CO2 fluxes (65%) through decreased acid phosphatase activity and increased abundance of fast-decaying fungi (e.g., white rot), while nitrogen addition marginally increased it (30%). Phosphorus addition caused a greater increase in CO2 fluxes in gymnosperms than in angiosperms (83.3% vs. 46.9%), which was associated with an increase in Basidiomycota:Ascomycota operational taxonomic unit abundance in gymnosperms but a decrease in angiosperms. Our results highlight the key role of wood traits in regulating moisture and nutrient response of wood CO2 fluxes. Given that the range of angiosperm species may expand under climate warming and forest management, our data suggest that expansion will increase drought effects but decrease nutrient effects on forest carbon cycling in forests previously dominated by gymnosperm species.

How to cite: Hu, Z., Zhou, G., and Fernandez-Martínez, M.: Traits mediate global change effects on wood carbon fluxes, EGU General Assembly 2025, Vienna, Austria, 27 Apr–2 May 2025, EGU25-21911, https://doi.org/10.5194/egusphere-egu25-21911, 2025.

In a terrestrial ecosystem, water and carbon cycles are coupled with the linking eco-hydrological trait, water use efficiency (WUE). Understanding the dynamics of these fluxes in managed croplands is crucial in implementing sustainable irrigation strategies. However, knowledge of these fluxes, especially in semi-arid regions is poorly addressed due to lack of long-term flux measurements. This study is aimed at analysing the dynamics of carbon, water and WUE fluxes observed in a maize crop irrigated with both alternative furrow (AFI) and conventional furrow (CFI) schemes.  During the experiments, water-carbon fluxes and other related micro-metrological and environmental variables are continuously monitored using two eddy covariance (EC) flux towers installed in the maize fields. The results showed that: mean WUE is in the range 1.61 ± 0.23, and 1.21 ± 0.25 µmol m-2 s-1 CO2 mm day-1 H2O for AFI and CFI respectively. A higher WUE in AFI by 1.33 times over CFI treatment is attributed to the differences in net ecosystem exchange (NEE). The correlation analysis showed that WUE is mainly affected by net ecosystem exchange (R2 = 0.75 in AFI and 0.60 in CI) rather than ET fluxes. The environmental drivers of vapor pressure deficit of air and net solar radiation are mainly controlling WUE dynamics. Results concluded that the AFI irrigation treatments have more significant water-saving potential without compromising on carbon intake. These findings can set as a reference for the scientific development of typical water-saving practices of agriculture in India.

How to cite: Chintala, S. and kbvn, P.: Understanding the dynamics of carbon, water and water use efficiency fluxes at ecosystem scale in Maize crop, EGU General Assembly 2025, Vienna, Austria, 27 Apr–2 May 2025, EGU25-607, https://doi.org/10.5194/egusphere-egu25-607, 2025.

EGU25-4103 | ECS | PICO | BG3.4

Multi-model data fusion for improved streamflow prediction based on hydrological and data-driven models 

Mitra Tanhapour, Juraj Parajka, Silvia Kohnová, and Kamila Hlavčová

Sustainable management of water resources relies on accurate river flow prediction. This study explored how multi-model data fusion techniques enhance the reliability of rainfall-runoff modeling by integrating the strengths of process-based and data-driven approaches. Accordingly, we employed different streamflow prediction models, comprising the TUW (Technische Universität Wien) model and the Long-Short-Term Memory (LSTM)-based models, LSTM and Stack-LSTM, to predict streamflow in the Hron River basin in Slovakia during the 2007–2020 time period. An enhanced streamflow prediction system was then developed by merging predictions from multiple models using the Simple Average Method (SAM) and the Bayesian Model Averaging (BMA) approach. The findings revealed that the Stack-LSTM model performed similarly to the LSTM algorithm, and both outperformed the TUW method. Evaluation and analysis showed that the Stack-LSTM model achieved a Nash-Sutcliffe efficiency coefficient (NSE) of 0.98 and a Mean Absolute Percentage Error (MAPE) of 6.96% during the test stage. Furthermore, the comparison of outcomes from the multi-model averaging methods revealed that the BMA approach outperformed the SAM. As a result, the MAPE for the BMA method was reduced by 50.2% compared to the SAM. This research provides a robust tool for streamflow prediction, enhancing decision-making in water resources management.

How to cite: Tanhapour, M., Parajka, J., Kohnová, S., and Hlavčová, K.: Multi-model data fusion for improved streamflow prediction based on hydrological and data-driven models, EGU General Assembly 2025, Vienna, Austria, 27 Apr–2 May 2025, EGU25-4103, https://doi.org/10.5194/egusphere-egu25-4103, 2025.

The runoff coefficient still represents a crucial part of predicting extreme runoff for the safe design of water structures. Despite its importance, it remains a subject of many hydrological discussions. The issue lies in how many unknown processes control the runoff in catchments. Therefore, in recent years, we have witnessed that the estimation of the runoff coefficient using tables and formulas has been abandoned, and the current hydrological community focuses on direct estimations from real observed data. The presented study uses rainfall-runoff data to directly estimate the peak runoff coefficient for the return period for 2-, 5-, 10-, 50- and 100- years.

The subjects of the study are three catchments with sizes from 45 to 250 km2 located in the territory of Slovakia. The catchments Horné Orešany (stream Parná), Liptovský Mikuláš (stream Jalovecký potok) and Liptovský Hrádok (stream Belá) have different landscape characters, from rural lowlands to mountains landscape.

The runoff and rainfall data series used to estimate the peak runoff coefficient are measured in hourly time steps from 1989 to 2023.

The data were subsequently subjected to the manual and automatic separation of flood wave characteristics, such as flood volume, flood peak, duration of the flood wave, and the time to peak duration. The maximum flood waves from the summer and winter seasons were selected for each year. The reason for dividing the annual data into summer and winter seasons is to reduce the impact of phenomena that we cannot yet exclude from the measured data (snow, soil saturation).

The study shows differences in the chosen method of estimating the peak runoff coefficient. The winter seasons revealed higher values of estimated peak runoff coefficients than the summer seasons. The question also arises about the impact of the length of the available data series on the estimated runoff coefficients.

The study results are intended to help understand the extent to which different estimation methods are applicable in practical engineering.

Acknowledgements

This study was supported by the VEGA Grant Agency No 1/0577/23. The authors thank the agency for supporting their research.

How to cite: Paulíková, L. and Kohnová, S.: Estimation of the runoff coefficient: Advantages and disadvantages of using observed rainfall-runoff data in a small catchment, EGU General Assembly 2025, Vienna, Austria, 27 Apr–2 May 2025, EGU25-4109, https://doi.org/10.5194/egusphere-egu25-4109, 2025.

EGU25-4115 | ECS | PICO | BG3.4

Climaax project: Heat wave toolbox 

Martina Kubáňová, Martin Kubáň, Milan Kalaš, Milica Aleksic, Natalia Aleksandrova Aleksandrova, and Christopher Polster

As climate change accelerates, European regions are increasingly vulnerable to extreme weather events, rising temperatures, and other climate-related hazards, posing significant threats to communities, economies, and ecosystems. The urgent need for adaptation is further exacerbated by limited resources and expertise in many municipalities, leaving them unprepared to address these escalating challenges effectively. The CLIMAAX (CLIMAte risk and vulnerability Assessment framework and toolboX) project addresses this critical gap by equipping local authorities with advanced tools to develop robust and targeted climate adaptation strategies.

Featuring a user-friendly interface and real-time data integration, the CLIMAAX toolboxes empower municipalities to identify and address localized risks, optimize resource allocation, and foster collaboration with scientific institutions and stakeholders. These innovative tools offer actionable insights for climate risk assessment and scenario planning, ensuring accessibility and relevance. As a vital resource, the CLIMAAX toolboxes enable cities to implement scientifically sound and locally tailored adaptation strategies, building resilience against the growing impacts of climate change.

How to cite: Kubáňová, M., Kubáň, M., Kalaš, M., Aleksic, M., Aleksandrova, N. A., and Polster, C.: Climaax project: Heat wave toolbox, EGU General Assembly 2025, Vienna, Austria, 27 Apr–2 May 2025, EGU25-4115, https://doi.org/10.5194/egusphere-egu25-4115, 2025.

EGU25-4927 | PICO | BG3.4

Nature-Positive Watershed Management Strategies for Enhanced Carbon Sequestration: A Case Study of Watersheds in Maharashtra, India 

Sachin nandgude, Mansi Tripathi, Alok Sikka, Jai Rana, Bhaupatil Gavit, Sangita Shinde, Rahul Shelar, and Dnyaneshwar More

The global need for sustainable natural resource management and climate mitigation has highlighted the significance of nature-positive watershed management strategies for climate change mitigation. Carbon sequestration is one of the prudent steps in climate change mitigation. So, the study was conducted in the Chichondi village of Ahmednagar district, Maharashtra, focusing on two distinct watersheds: Watershed 1 (136 ha) and Watershed 2 (63 ha). The region experiences a tropical monsoon climate with an average annual rainfall of 1,740 mm. Both watersheds were treated with diverse soil and water conservation measures, including deep Continuous Contour Trenches (CCT), contour bunding, recharge pits and farm ponds. These treatments were implemented on about 30% of the area for both watersheds. The primary objectives were to assess soil and carbon loss and evaluate the impact of watershed development measures on carbon sequestration. Soil loss was estimated using the Universal Soil Loss Equation (USLE), while carbon loss was measured through sediment yield using total organic carbon (TOC) analyser. Runoff and sediment were measured using installed weirs and stage-level recorders at watershed outlets. Key findings demonstrated the efficacy of implemented conservation measures. In Watershed 1, soil loss reduced from 32.63 t/ha/yr to 26.73 t/ha/yr (18% reduction) and carbon loss decreased from 554 kg/ha/yr to 412 kg/ha/yr (25% reduction). Watershed 2 exhibited a similar trend, with soil loss decreasing from 30.82 t/ha/yr to 24.65 t/ha/yr (20% reduction) and carbon loss reducing from 612 kg/ha/yr to 479 kg/ha/yr (22% reduction). Over a five-month period, Watershed 1 recorded a runoff volume of 10,29,792 m³, corresponding to a cumulative carbon loss of 19.35 tonnes (142.4 kg/ha), whereas Watershed 2 experienced a runoff of 4,31,068 m³, with a cumulative carbon loss of 8.04 tonnes (126.6 kg/ha). The outcomes affirm that nature-positive interventions in watershed management significantly reduce soil erosion and enhance carbon sequestration. These conservation measures not only conserve soil and water resources but also mitigate carbon loss, contributing to climate resilience. The findings provide data-driven insights for policymakers, enabling the promotion of sustainable, climate-adaptive solutions in similar agro-ecological regions. This research underscores the transformative potential of watershed management programs, advocating for broader implementation of nature-positive solutions to achieve dual goals of natural resource sustainability and climate change mitigation.


How to cite: nandgude, S., Tripathi, M., Sikka, A., Rana, J., Gavit, B., Shinde, S., Shelar, R., and More, D.: Nature-Positive Watershed Management Strategies for Enhanced Carbon Sequestration: A Case Study of Watersheds in Maharashtra, India, EGU General Assembly 2025, Vienna, Austria, 27 Apr–2 May 2025, EGU25-4927, https://doi.org/10.5194/egusphere-egu25-4927, 2025.

EGU25-5372 | PICO | BG3.4

Asymmetry, Bimodality and Design Values of Daily Air Temperature 

Pavla Pekarova, Jan Pekar, Pavol Miklánek, and Igor Lescesen

Understanding how daily air temperature characteristics are expected to evolve in the future is critical for all countries, as air temperature influences numerous societal sectors. Reliable estimates of future extreme air temperatures are essential for public health, agriculture, hydrology, engineering, and economic planning.

In this study, the long-term trends of selected daily air temperature indices—average, minimum, and maximum—were analyzed for the Hurbanovo and Liptovský Hrádok climatological stations in Slovakia over the period 1871–2020. Furthermore, empirical histograms of daily minimum (TN), mean (Td), and maximum (TX) air temperatures were constructed using data from five climatological stations at different altitudes in the High Tatra Mountains, covering the period 1961–2010. The causes of asymmetry and bimodality observed in these temperature characteristics were investigated.

The findings indicate that the asymmetric bimodal shape of air temperature histograms in Central Europe is primarily caused by the latent heat of freezing, as thermal coupling occurs between snow/ice surfaces and the air. The asymmetry in these histograms is attributed to the lower specific heat capacity of cold air below 0°C compared to the heat capacity of air above 0°C. The energy-intensive phase transitions of ice and water near the freezing point result in a higher frequency of ground-layer air temperatures around 0°C, producing the observed local maximum. This has significant implications for the calculation of annual mean air temperatures at climatological stations, where negative temperatures should be assigned less weight than positive ones, while temperatures in the range of 0–6°C should receive higher weight.

Finally, theoretical probability distributions were developed for individual temperature indices to estimate T-year temperatures at the Hurbanovo station. The distribution functions were analyzed for three periods: 1901–1960, 1961–2020, and 1991–2020. For TN,min, the 100-year temperature increased from –35.75°C in 1901–1960 to –28.69°C in 1961–2020 and further to –26.52°C in 1991–2020. For TX,max, the 100-year temperature increased from 39.4°C in 1901–1960 to 39.63°C in 1961–2020. The most notable changes were observed for TN,min, where an increase of up to 9.23°C was recorded.

Acknowledgment: This research was supported by the project APVV-20-0374, “Regional detection, attribution and projection of impacts of climate variability and climate change on runoff regimes in Slovakia”

How to cite: Pekarova, P., Pekar, J., Miklánek, P., and Lescesen, I.: Asymmetry, Bimodality and Design Values of Daily Air Temperature, EGU General Assembly 2025, Vienna, Austria, 27 Apr–2 May 2025, EGU25-5372, https://doi.org/10.5194/egusphere-egu25-5372, 2025.

EGU25-6804 | ECS | PICO | BG3.4

Flash droughts threaten global managed forests 

Jianzhuang Pang, Zhiqiang Zhang, Hang Xu, Xiaoyun Wu, and Kexin Xing

Flash drought (FD), characterized by its increasing frequency and rapid onset, has emerged as a critical threat to ecosystem stability and functions.  However, a global consensus on how forests respond to FD events remains elusive.  Furthermore, the roles of FD characteristics (e.g., onset rate, peak stress, and stress duration) and forest management practices in mediating these responses have yet to be fully explored.  Here, we explored the responses of intact and managed forests to FD events using a newly produced high-resolution Standardized Precipitation-Evapotranspiration Index (SPEI) dataset from 1982 to 2022 and investigated the synergistic regulations of forest management practices, FD characteristics, background climate, and meteorological anomalies during FD events based on an interpretable machine learning framework.  Global forests have experienced faster onset, greater intensity, and prolonged duration FD events over the past four decades.  Those FD events drive the browning of managed forests worldwide, which are unable to adapt to sustained extreme high temperatures.  However, elevated temperatures during FD events leads to forest greening in the Amazon and Siberia regions due to enhanced photosynthesis.  Notably, current management practices have further exacerbated the vulnerability of managed forests to FD events globally.  Our findings underscore the escalating risks posed by more frequent and prolonged FD events to managed forests, highlighting the urgent need to incorporate forest resistance and resilience to extreme climatic events into the development of forest management strategies.

How to cite: Pang, J., Zhang, Z., Xu, H., Wu, X., and Xing, K.: Flash droughts threaten global managed forests, EGU General Assembly 2025, Vienna, Austria, 27 Apr–2 May 2025, EGU25-6804, https://doi.org/10.5194/egusphere-egu25-6804, 2025.

EGU25-7124 | ECS | PICO | BG3.4

Flash drought effects on carbon dynamics in an agroecosystem – insights from the eastern German lowlands 

Mostafa Sayeed, Charuta Murkute, Rezwan Ahmed, Sebastian Scholz, and Katja Trachte

Flash droughts pose a serious threat to agriculture due to their abrupt onset and rapid intensification. The increasing frequency of such events presents considerable challenges and uncertainties for agricultural carbon sequestration, particularly during the growing season. To effectively assess carbon dynamics in agroecosystems under ongoing climate change, it is crucial to understand the complex interactions among energy, water, and carbon fluxes, as well as their connection to vegetation.

An open-path eddy-covariance (EC) measurement system (Licor Smartflux Measurement Suite) was installed over an apple tree stock in eastern Germany (Brandenburg) to monitor microclimatic conditions and the water and carbon budgets at the ecosystem level. Brandenburg, one of the driest regions in Germany, has approximately 48.79% of its land used for agriculture. These agricultural landscapes are highly vulnerable to climate-related stresses, such as water scarcity and flash droughts. The stress conditions can increase irrigation demands, disrupt phenological cycles, and influence atmospheric water and carbon cycles, making them critical areas of investigation in the context of land use and climate change. This study investigates the interactions between microclimatic conditions and soil water levels, and their effect on gross primary production (GPP) in an agricultural region of eastern Germany during a flash drought event that occurred during the growing season. Key variables analyzed include surface energy fluxes (sensible heat H, latent heat LE), the net-ecosystem exchange (NEE) with its partitioned components of GPP and ecosystem respiration (Reco), as well as the water-related variables such as precipitation, irrigation, and soil water content (SWC).

The results indicated that during the flash drought event, the concurrence of low SWC and high vapor pressure deficit (VPD) led to elevated net radiation (Rn), which caused high H and depleted soil water availability. This exacerbated plant water stress and suppressed GPP. Furthermore, irrigation efforts during the event were insufficient to mitigate these adverse impacts, underscoring the vulnerability of agroecosystems to extreme climatic events. The findings highlight the critical role of the coupling between SWC and VPD in regulating carbon sequestration during flash droughts.

How to cite: Sayeed, M., Murkute, C., Ahmed, R., Scholz, S., and Trachte, K.: Flash drought effects on carbon dynamics in an agroecosystem – insights from the eastern German lowlands, EGU General Assembly 2025, Vienna, Austria, 27 Apr–2 May 2025, EGU25-7124, https://doi.org/10.5194/egusphere-egu25-7124, 2025.

Ecosystem health is an important approach to measuring urban and regional sustainability. In previous studies, the spatiotemporal changes of ecosystem health have been addressed using comprehensive assessment index system. However, the quantitative contribution of human activities and climate change to ecosystem health was less examined. In this study, Shuozhou City, a coal resource-based city, was chosen to explore the response of ecosystem health to human activities using the Geographically Weighted Artificial Neural Network (GWANN) model. The results showed a distinct improvement of ecosystem health in Shuozhou City from 1990 to 2020. The contribution of human activities increased during the study period, while the contribution of climate change decreased as a consequence of coal mining expanding. By 2020, human activities contributed 76% to ecosystem health compared with 24% of climate change. The direct impact of coal mining on ecosystem health occurred mainly in the surrounding areas within a radius of 6 km and 17 km under low and high mining intensity respectively. Ecosystem health will further decline by 2030 based on the scenario in which current coal mining is continued. However, only stopping mining activities in small coal mining areas for ecological restoration but keeping large coal mining areas in production, will realize 92.6% of restoration effects on ecosystem health as compared to ceasing all mining activities. This study examines the effects of coal mining on ecosystem health in resource-based cities, and underscores the importance of large coal mining sites in ecological restoration.

How to cite: Chen, Y., Yu, X., Xu, D., and Peng, J.: A spatial machine learning approach to exploring the impacts of coal mining and ecological restoration on regional ecosystem health, EGU General Assembly 2025, Vienna, Austria, 27 Apr–2 May 2025, EGU25-7744, https://doi.org/10.5194/egusphere-egu25-7744, 2025.

EGU25-8736 | PICO | BG3.4

Evaluation of ASCAT-DIREX soil moisture product using in situ measurements in a small mountain catchment 

Michal Danko, Patrik Sleziak, Martin Jančo, Ladislav Holko, Isabella Greimeister-Pfeil, Mariette Vreugdenhil, and Juraj Parajka

Recent improvements in satellite-based soil moisture mapping (higher spatial and temporal resolution) add value to using remotely sensed soil moisture estimates in many hydrological applications (e.g. flood forecasting, drought monitoring, understanding climate change impacts, etc.). However, further analyses are required to validate these data sets reasonably in an alpine environment. This study aims (1) to compare satellite-derived ASCAT-DIREX soil moisture data with in situ surface soil moisture measurements in the well-documented experimental catchment (the Jalovecký Creek catchment), located in the Western Tatra Mountains in Slovakia, (2) to assess the factors controlling the mapping accuracy. As a reference, we used in situ surface soil moisture measurements between 2012 and 2019 at depths of 5 cm (open area, 1500 m a.s.l.) and 10 cm (forest, 1420 m a.s.l.), respectively. Satellite soil moisture estimates are obtained by combining ASCAT and Sentinel-1 data (the ASCAT-DIREX dataset), offering relative daily soil moisture measurements at a 500 m spatial resolution. These estimates represent four characteristic timescales (T = 1, 2, 5, and 10 days) and are compared with in situ surface soil moisture observations. The Pearson correlation coefficient (r) is used to describe the consistency between the two soil moisture estimates. The results reveal that satellite-derived soil moisture correlates more strongly with in situ measurements at the open site and with a T-value of 10 days. The correlations exhibit a pronounced seasonal pattern, with low (negative) values in winter/spring and higher correlations in summer/autumn. The primary cause of low correlations during winter/spring is the insufficient masking of the snowpack. After masking days with snowpack, the correlation in April increases to 0.68 (open site) and 0.92 (forest site), respectively. The reliability of soil moisture estimates during summer is influenced by factors such as small-scale variations in precipitation and vegetation dynamics.

Acknowledgments

This work was supported by the Slovak Research and Development Agency under Contract No. APVV-23-0332 and the VEGA Grant Agency No. 2/0019/23. The support by the Danube Region Programme: DRP0200156 Danube Water Balance is also gratefully acknowledged.

How to cite: Danko, M., Sleziak, P., Jančo, M., Holko, L., Greimeister-Pfeil, I., Vreugdenhil, M., and Parajka, J.: Evaluation of ASCAT-DIREX soil moisture product using in situ measurements in a small mountain catchment, EGU General Assembly 2025, Vienna, Austria, 27 Apr–2 May 2025, EGU25-8736, https://doi.org/10.5194/egusphere-egu25-8736, 2025.

EGU25-8897 | ECS | PICO | BG3.4

The influence of rainfall intensity on runoff and humus content of roof substrate 

Jana Grečnárová, Michaela Danáčová, and Matúš Tomaščík

Vegetated roofs are valuable solutions for water management improvements in urban areas as they can store and delay rainfall water. Vegetated roofs cannot be considered static systems, whose performances remain constant over time. This study is based on the use of a laboratory-scale experiment. In addition to evaluating the hydrological performance of the vegetated roof substrate after rainfall events, the impact of humus fraction transport as sediment in roof runoff are assessed.

The laboratory experiment simulated a 15-minute rainfall event with different intensities (low, medium and extreme). After each simulated rainfall event, runoff was filtered through a filter paper to capture the fine substrate particles. A total of 27 measurements were taken. The results showed that with increasing rainfall intensity, there was a higher volume of runoff, which led to an increase in the amount of sediment captured in the runoff. The sediment sampling is crucial for an accurate quantitative assessment of erosion processes on vegetated roofs, transport of humus parts of substrate and their environmental impacts.

The composition of the roof substrate plays a key role in the initial performance and sustainability.


Keywords: roof substrate, rainfall, vegetated roof, rainfall simulator

Acknowledgement: VEGA 1/0577/23

How to cite: Grečnárová, J., Danáčová, M., and Tomaščík, M.: The influence of rainfall intensity on runoff and humus content of roof substrate, EGU General Assembly 2025, Vienna, Austria, 27 Apr–2 May 2025, EGU25-8897, https://doi.org/10.5194/egusphere-egu25-8897, 2025.

Our previous work reveals that daily maximum temperature (Tmax) over land has warmed at an accelerated rate in recent decades, contrasting with the faster warming of daily minimum temperature (Tmin) observed in earlier periods. This faster warming of Tmax relative to Tmin globally has led to a broadening of the diurnal temperature range (DTR), defined as the difference between Tmax and Tmin. However, the impacts of this accelerated daytime warming and increased DTR on the water and carbon cycles have remained largely unexplored.

Here, we show that the asymmetric warming rates between Tmax and Tmin have amplified the atmospheric vapor pressure deficit (VPD)—the difference between saturated vapor pressure (SVP) and actual vapor pressure (AVP). This amplification arises because a faster rise in Tmax compared to Tmin drives a larger SVP increase, due to the near-exponential relationship between temperature and SVP. Simultaneously, AVP is more strongly influenced by Tmin, as air is typically closer to saturation during the cooler nighttime hours. We quantified that the increase in DTR accounted for approximately 20% of the additional increase in global VPD over land.

We further investigated the response of terrestrial net primary production (NPP) to changes in DTR in the extratropical Northern Hemisphere over the past two decades. Our findings reveal divergent impacts of increased DTR on vegetation productivity in humid and arid zones, mirroring the contrasting effects of VPD on vegetation productivity in these regions. In humid zones, increases in DTR have promoted NPP, while in arid zones, the opposite effect is observed. This contrast is largely explained by the greater impact of accelerated daytime warming on increased VPD in arid zones, which inhibits NPP.

Additionally, we employed flux tower measurements to analyze the effects of DTR on net ecosystem carbon exchange (NEE, with negative values indicating net carbon uptake by the land) across various ecosystems. Our results demonstrate differential responses of ecosystems to changes in DTR. For example, in deciduous broadleaf forests, increases in DTR have had a dual negative impact on NEE, enhancing plant daytime photosynthesis driven by higher daytime temperatures while a more gradual rise in Tmin slows nighttime respiration increases. In evergreen needleleaf forests, the faster increase in Tmax relative to Tmin generally resulted in increased NEE, leading to a weak positive correlation between DTR and NEE.

Our findings provide compelling evidence that accelerated daytime warming over recent decades has significantly contributed to increased atmospheric dryness and has had divergent impacts on vegetation productivity in humid and arid zones. These results underscore the importance of understanding the responses of land surface hydrological processes, ecosystem productivity, and extreme events such as drought and wildfires to recent asymmetric warming dynamics.

How to cite: Zhong, Z. and Chen, H.: The impact of recent diurnally asymmetric warming on atmospheric dryness and terrestrial vegetation productivity, EGU General Assembly 2025, Vienna, Austria, 27 Apr–2 May 2025, EGU25-8926, https://doi.org/10.5194/egusphere-egu25-8926, 2025.

In the current period of global warming, declining biodiversity and continued pressures of urbanisation, it is the moment to reconsider the role and quality of urban streams. Unfortunately, they have become increasingly invisible: over-built, channelised and degraded by anthropogenic use. Creating green and blue corridors not only significantly contributes to building climate-resilient cities by improving microclimatic conditions in overheated cities or providing fresh air corridors, but it also connects stream reaches, provides floral and faunal habitats, as well as recreational spaces that improve human wellbeing. However, stream restorations in urban areas using nature-based approaches (NBA) face many barriers and challenges: lack of space in intensively built-up areas, property rights of surrounding land, funding, different stakeholder interests, acceptance, and flood protection. To face these challenges, it is necessary to perform an integrated analysis of river hydraulics, ecology, stakeholder interests, institutional frameworks, social perspectives and urban space requirements.

Pilot restoration measures are being implemented in four study urban stream areas located in Dresden (DE), Jablonec nad Nisou (CZ), Poznan (PL) and Senica (SK). Current urban challenges and opportunities of these four case studies are being identified and analysed together with stakeholder groups with different perspectives. The trade-offs between the social and ecological requirements in the context of urban planning and institutional settings are being extracted.

The Slovak pilot reach - Teplica River in Senica is struggling with specific problems of insufficient flood capacity, poor morphological and ecological quality, low summer flows, upstream dam operation and poorly utilized public space. All of these are being addressed in case study, the outcomes of which will serve as inputs for further analysis. Experiences from multiperspective, transdisciplinary, participatory and integrated analyses in four pilot reaches will help to better design future urban restoration projects and will enable practitioners and decision makers in urban planning to utilise social-ecological integrated NBA for urban multifunctional areas that promote biodiversity and provide ecosystem services.


Acknowledgements:

This research has been supported by the Interreg CE programme under Contract No. CE0200754 ReBioClim and Scientific Grant Agency under Contract No. VEGA 1/0067/23. The author thanks the agencies for their research support.

How to cite: Škrinár, A.: Restoring urban streams to promote biodiversity, climate adaptation and to improve quality of life in cities, EGU General Assembly 2025, Vienna, Austria, 27 Apr–2 May 2025, EGU25-9196, https://doi.org/10.5194/egusphere-egu25-9196, 2025.

EGU25-9668 | ECS | PICO | BG3.4

Investigating the effects of climate change over two periods at the Botanical Garden station, in Sopron, Hungary 

Lili Muraközy, Zoltán Gribovszki, Kamilla Hlavčová, and Jan Szolgay

The effects of climate change can be studied using a wide variety of methods and measurements. It is important to monitor the different impacts of climate change not only regionally, but also locally, as this can provide valuable information and help local interventions to succeed. Using the available data (long-term daily air temperature and precipitation data series), we have carried out studies focusing on changes in the hydrological system. Changes in the elements of the hydrological regime, changes in snow and changes in seasonality were investigated. The results show that the largest changes in the elements of the water balance was a decrease in runoff and recharge potential by 58.7%, followed by a decrease in snow storage by 46.8%, a decrease in soil moisture storage by 12%, an increase in evapotranspiration by 9.5%, and finally a decrease in water input by 2.2%. The snow analysis also shows a decrease in average annual snowfall and the number of snow days. The seasonality test shows seasonality, with July as the average month of occurrence in both periods, but with a slight increase for the present (from 0.188 to 0.227).

Acknowledgements: This study was financially supported by the Slovak Research and Development Agency under Contract No. VEGA 1/0577/23. The research was supported by the OTKA grant 143972SNN, the Slovenian Research and Innovation Agency grant N2-0313 and the associated project TKP2021-NKTA-43. The project TKP2021-NKTA-43 was implemented with the support of the Ministry of Innovation and Technology through the National Fund for Research Development and Innovation, funded by the TKP2021-NKTA call for proposals.

How to cite: Muraközy, L., Gribovszki, Z., Hlavčová, K., and Szolgay, J.: Investigating the effects of climate change over two periods at the Botanical Garden station, in Sopron, Hungary, EGU General Assembly 2025, Vienna, Austria, 27 Apr–2 May 2025, EGU25-9668, https://doi.org/10.5194/egusphere-egu25-9668, 2025.

EGU25-11197 | ECS | PICO | BG3.4

Effect of gap size and gap shape on chemical soil characteristics in a Hungarian oak-hornbeam forest 

Merle Nolte, Adrienn Horváth, Pál Balázs, Péter Ódor, and András Bidló

Gap-cuttings in the framework of a continuous cover forestry system have an ecological effect on the chemical soil properties. The Pilis Gap Experiment (https://piliskiserlet.ecolres.hu/en) starting in 2019 in the Pilis Mountains in Hungary, investigates the effect of gap size and shape on soil properties in a mature oak-hornbeam forest. This study analyses the soil samples from 2023 regarding the effect of treatments on the pH value, the humus, and soil water content.

A full-factorial design was applied for gap size (small: 150 m2 or large: 300 m2) and shape (circular or elongated) including an uncut control. For each treatment, six replicates were used in block design (five treatments, six replicates, altogether 30 plots). From each plot, two 20 cm deep soil samples were taken in the spring of 2023.

The statistical analysis concludes that the effect of the different treatments is not significant on the pH-value, on the humus content of the soil and the soil water content.

The pH value, measured in H2O, ranges between 4.2 and 5.3 with a mean of 4.60. The values in the circular gaps are higher than the values in the elongated gaps, but the models are not significant. Due to less litter, the soil could be less acidic in circular gaps, where the tree crown is less able to reach the middle of the gap.

The result is similar in the humus content with a mean of 2.8 %. Here, the values in the elongated gaps are higher than the values in the circular gaps, but not significantly. This also can be explained by the amount of litter that reaches the soil. Therefore, with more litter more organic material can be degraded into humus.

Also, the soil water content did not significantly differ from each other. The values are higher in circular gaps than in the elongated gaps and the control. This can be explained by the lower evapotranspiration and interception effect in the circular gaps, where neither the roots nor the crowns of the neighbouring trees can reach the gap centre compared to the elongated ones.

We can conclude that gap-cutting in these dimensions does not modify the soil conditions. In circular gaps, a moderate soil water increment is detectable which can accelerate the regeneration processes.

This article was made in the frame of the project TKP2021-NKTA-43 which has been implemented with the support provided by the Ministry of Innovation and Technology of Hungary (successor: Ministry of Culture and Innovation of Hungary) from the National Research, Development and Innovation Fund, financed under the TKP2021-NKTA funding scheme.

How to cite: Nolte, M., Horváth, A., Balázs, P., Ódor, P., and Bidló, A.: Effect of gap size and gap shape on chemical soil characteristics in a Hungarian oak-hornbeam forest, EGU General Assembly 2025, Vienna, Austria, 27 Apr–2 May 2025, EGU25-11197, https://doi.org/10.5194/egusphere-egu25-11197, 2025.

The hydrological cycle in Hungary, and consequently in its west Transdanubian region, has undergone significant changes in recent decades due to climate change. The distribution of precipitation throughout the year has changed, and the probability of intense precipitation events has increased, but the annual amount of precipitation has not changed much. Furthermore, droughts have become more severe and prolonged due to rising average annual temperatures and longer rain-free periods. Consequently, evaporation intensity has also increased, which, when combined with the previously mentioned factors, has decreased the quantity of groundwater and surface water resources.

In our previous work, we examined the changes in the specific discharge of several watercourses in the West-Transdanubian region over the past 40 years. We found that the annual specific discharge of all watercourses shows a decreasing trend, despite the fact that the annual precipitation amount does not change significantly. In the case of watercourses originating in the Alps, this decreasing trend is not as steep as in the case of watercourses whose catchment area is entirely located in the Carpathian Basin. In this work, we examined the trends in the change of the watershed land cover and the annual water resource decrease of the watercourses, in order to explore possible connections between the change in watershed land cover and the decrease in specific discharge.

The research was supported by the OTKA grant 143972SNN, the Slovenian Research and Innovation Agency grant N2-0313 and the associated project TKP2021-NKTA-43. The project TKP2021-NKTA-43 was implemented with the support of the Ministry of Innovation and Technology through the National Fund for Research Development and Innovation, funded by the TKP2021-NKTA call for proposals.

How to cite: Juhász, I., Gribovszki, Z., and Kalicz, P.: Changes in water resources due to climate change and watershed land cover in the West-Transdanubian region of Hungary, EGU General Assembly 2025, Vienna, Austria, 27 Apr–2 May 2025, EGU25-12165, https://doi.org/10.5194/egusphere-egu25-12165, 2025.

EGU25-15439 | ECS | PICO | BG3.4

Comparison of rainfall characteristics and rainfall erosivity between two experimental sites in Austria and Slovenia 

Borbála Széles, Juraj Parajka, Mojca Šraj, Günter Blöschl, Dusan Marjanovic, Nejc Bezak, Klaudija Lebar, Andrej Vidmar, Peter Strauss, Carmen Krammer, Elmar Schmaltz, Patrick Hogan, and Katarina Zabret

The aim of this study was to compare the rainfall characteristics and rainfall erosivity between two locations in the Danube River Basin, the Hydrological Open Air Laboratory (HOAL) agricultural catchment in Austria and an experimental plot located in an urban park in Ljubljana, Slovenia. The variability of rainfall characteristics and rainfall erosivity were investigated using 5-year-long measurements (2014 – 2018) of rainfall (amount, duration and intensity of rainfall) and drop size distributions (diameter, velocity and median volume diameter of the drops). Despite having the same Köppen-Geiger climate classification, differences were found between the two study sites. The long-term annual average total precipitation was almost twice as much in Ljubljana compared to the HOAL. According to the results of the hierarchical clustering analysis, larger and more intense rainfall events occurred in Ljubljana than in the HOAL, but the average drop characteristics were lower for the events in Ljubljana. Furthermore, if the events were not extreme, their characteristics were similar regardless of location. The rainfall intensities tended to peak in the summer months at both sites, when rainfall durations were shorter, and larger and faster drops were observed. The rainfall erosivity was found to be between 2-5 times greater in each year in Ljubljana than in the HOAL because of the more intense rainfall and single faster and larger drops during events.


Acknowledgment: This contribution is part of the ongoing research project entitled “Evaluation of the impact of rainfall interception on soil erosion” supported by the Slovenian Research and Innovation Agency (J2-4489) and the Austrian Science Fund (FWF) I 6254-N.

How to cite: Széles, B., Parajka, J., Šraj, M., Blöschl, G., Marjanovic, D., Bezak, N., Lebar, K., Vidmar, A., Strauss, P., Krammer, C., Schmaltz, E., Hogan, P., and Zabret, K.: Comparison of rainfall characteristics and rainfall erosivity between two experimental sites in Austria and Slovenia, EGU General Assembly 2025, Vienna, Austria, 27 Apr–2 May 2025, EGU25-15439, https://doi.org/10.5194/egusphere-egu25-15439, 2025.

EGU25-15498 | PICO | BG3.4

The impact of afforestation on soil properties 

András Bidló, Pál Balázs, Máté Katona, Péter Végh, and Adrienn Horváth

Over the past hundred years, Hungary's forest area has increased from 12% to 24%, thanks to afforestation efforts. Accordingly, it is crucial to examine the impact of forests on soils.

In our study, we compared 1. a cropland, 2. a 19-year-old pedunculate oak stand, and 3. a 79-year-old pedunculate oak stand at the Szentkirály area of the Great Hungarian Plain to investigate changes in the soil. On adjacent areas with calcareous chernozem soil, undisturbed soil samples were taken every 10 cm down to a depth of 110 cm and analyzed in the laboratory.

By examining the soil pH, it was determined that the soil under the cropland and the young stand was weakly alkaline to alkaline (7.9 (pHH2O) to 8.6 (pHH2O)). In contrast, the upper soil layers under the old forest exhibited an acidic pH (5.4 (pHH2O)). Intensive leaching was observed, affecting the upper 50 cm layer. The soil carbonate content values also corresponded to the pH levels. Based on particle size distribution analysis, the soil was classified as sandy loam, with no differences observed under the various land uses.

The humus content in the soil samples ranged from 0.1% to 3.5%. The lowest humus content (0.1%-1.7%) was found in the cropland, while the highest humus content was observed in the old oak forest, where the top layer contained 3.0% humus. Overall, it can be concluded that the nearly 80 years of afforestation significantly impacted soil development. Leaching intensified, and following the cessation of plowing, organic matter accumulation began in the soils. Field observations also indicated a marked improvement in soil structure. The forest improved the soil properties, creating conditions more favorable for itself.

This article was made in the frame of the project TKP2021-NKTA-43 which has been implemented with the support provided by the Ministry of Innovation and Technology of Hungary (successor: Ministry of Culture and Innovation of Hungary) from the National Research, Development and Innovation Fund, financed under the TKP2021-NKTA funding scheme. Some of the tools used during the research were acquired within the framework of the "Investigation of the conditions for the cultivation of wood biomass - GINOP-2.3.3-15-2016-00039" project.

How to cite: Bidló, A., Balázs, P., Katona, M., Végh, P., and Horváth, A.: The impact of afforestation on soil properties, EGU General Assembly 2025, Vienna, Austria, 27 Apr–2 May 2025, EGU25-15498, https://doi.org/10.5194/egusphere-egu25-15498, 2025.

EGU25-15715 | ECS | PICO | BG3.4

 Analysis of changes in forest soil carbon stocks due to different site conditions and the impact of climate change 

Adrienn Horváth, Pál Balázs, Máté Katona, Péter Végh, and András Bidló

One of the greatest challenges of the 21st century is combating global climate change and adapting to its effects. In addition to reducing CO2 emissions, natural processes capable of absorbing CO2 are of paramount importance. Forest ecosystems play a critical role in this regard as they are the largest terrestrial absorbers of CO2 and organic carbon reservoirs. 

Our research revealed that in recent decades, systematic surveys of soil (and litter layer) organic carbon content have not been conducted in Hungary. Existing soil data are often incomplete (e.g., lack measurements of bulk density), were obtained using different analytical methods (e.g., determining soil humus content), and do not always include forest stand data. Data on litter layers are even more scarce. Consequently, our primary goal was to expand this dataset. To achieve this, we began assessing the effects of tree species, site conditions, and silvicultural interventions on the organic carbon stocks of soils and litter layers in Hungarian forest stands.

Soil samples were collected using a motorized auger to a depth of 1–1.1 meters. The undisturbed samples were divided into 10 cm sections rather than genetic horizons, and for each section, a 100 cm³ cylinder was used to extract undisturbed samples for bulk density determination. The remaining soil in each section was retained for further analysis. From a 5-meter radius around each sampling point, litter samples were randomly collected from three locations per stand. The litter included all decomposing leaves and small to medium-sized twigs above the raw soil surface. Each sample was placed in a separate bag, resulting in 25 samples per location.

This study focuses on results from beech (Fagus sylvatica) stands, as laboratory analyses are still ongoing. The collected soil samples were analyzed for bulk density, pH, lime content, acidity, particle size distribution, and organic carbon content. For the litter samples, in addition to dry mass, pH, the proportions of various fractions, and C/N content were determined.

In the approximately 40 examined beech stands, the average soil pH was 5.17 pHH2O, with minimum and maximum values of 3.87 pHH2O and 8.4 pHH2O, respectively. Humus content in individual layers ranged from 0.16% to 15.65%. The average organic carbon stock of the 10 cm soil layers was 6.39 C t/ha, with a minimum of 1.46 C t/ha and a maximum of 34.03 C t/ha.

Based on the results, the carbon stocks under beech stands in Hungary, which are retreating due to climate change, are likely to disappear if the pace of climate change accelerates in the Carpathian Basin.

This article was made in the frame of the project TKP2021-NKTA-43 which has been implemented with the support provided by the Ministry of Innovation and Technology of Hungary (successor: Ministry of Culture and Innovation of Hungary) from the National Research, Development and Innovation Fund, financed under the TKP2021-NKTA funding scheme. Some of the tools used during the research were acquired within the framework of the "Investigation of the conditions for the cultivation of wood biomass - GINOP-2.3.3-15-2016-00039" project.

How to cite: Horváth, A., Balázs, P., Katona, M., Végh, P., and Bidló, A.:  Analysis of changes in forest soil carbon stocks due to different site conditions and the impact of climate change, EGU General Assembly 2025, Vienna, Austria, 27 Apr–2 May 2025, EGU25-15715, https://doi.org/10.5194/egusphere-egu25-15715, 2025.

EGU25-15843 | PICO | BG3.4

Research on the responses of a beech stand to extreme drought in Eastern Bakony, Hungary 

Gergely Levente Kökény, Zoltán Gribovszki, and Péter Kalicz

In forest management, there is an outstanding importance of water cycle of the forest because of ecological and economical viewpoints, including the water management of woody plants. Examining the reactions of trees to environmental stress – warming, extreme drought or intense rains – and the phenomena derived from this, help to provide the correct answers to challenges affecting forestry. An investigation was started in a beech stand in Magas-Bakony, which was significantly affected by early leaf loss caused by the drought of 2022. Taking into account the meteorological data of the site, the study focuses on the change in trunk diameter, on the state of health and regeneration through photosynthetic activity and on the annual growth change with annual ring analysis.


The research was supported by Verga forestry, Private Limited Liability Company, Veszprém, Hungary, the OTKA grant 143972SNN, the Slovenian Research and Innovation Agency grant N2-0313 and the associated project TKP2021-NKTA-43. The project TKP2021-NKTA-43 was implemented with the support of the Ministry of Innovation and Technology through the National Fund for Research Development and Innovation, funded by the TKP2021-NKTA call for proposals and the Project No. 2023-2.1.2-KDP-2023-00013 was implemented with the support of the Ministry of Culture and Innovation through the Fund of National Research Development and Innovation, funded by the KDP-2023 Tender Program.

How to cite: Kökény, G. L., Gribovszki, Z., and Kalicz, P.: Research on the responses of a beech stand to extreme drought in Eastern Bakony, Hungary, EGU General Assembly 2025, Vienna, Austria, 27 Apr–2 May 2025, EGU25-15843, https://doi.org/10.5194/egusphere-egu25-15843, 2025.

EGU25-16000 | PICO | BG3.4 | Highlight

Semi-intensive green roofs - a solution for negative impacts of climate change in urban landscapes 

Oleg Panferov, Elke Hietel, Ute Rößner, and Klemens Seelos

Green roofs are often proposed as climate change adaptation and environmental protection measures in urban environments. The goals are to cool down the environment, to handle the extreme precipitation events, to increase the CO2-sequestration and to enhance the biodiversity. However, the most widely used extensive roof greening is not very efficient for climate cooling, CO2 sequestration and biodiversity. Intensive green roofs are much more efficient, but often are resource- and energy-consuming. The aim of our study was, therefore, to investigate the microclimatic effects of semi-intensive rainwater-irrigated green roof, which could be implemented with little technical and financial effort. For this purpose, an extensive green roof was equipped with solar-powered rainwater irrigation system and planted with selected plant species. The substrate used (10 cm layer) has maximum water storage capacity of vol. 40%. The roof is irrigated during the summer months with 2 l m-2 day-1. The effects on microclimate, water balance, particulate matter binding and biodiversity are measured continuously starting in 2020. The microclimatic effects are measured with automatic weather stations on the semi-intensive model roof and a control area (parking lot) at the heights of 2m and 0.5 m above surface. In addition, manual albedo measurements as well as the measurements with manual and drone-borne thermal cameras were carried out. The green roof albedo values vary between 0.147-0.174 and are higher than parking lot (0.139-0.145). The measurements show that the effects of semi-intensive roof on the microclimate are quite variable. The reduction of temperature extremes (up to 2°C) and especially warm nights is observed. The roof surface is particularly cooler under calm conditions, with minimal external influences. There are, however, also the well-expressed warming effects of the roof depending on the weather conditions. The effects of different plant species and substrate to total cooling or warming of green roof were also quantified.

How to cite: Panferov, O., Hietel, E., Rößner, U., and Seelos, K.: Semi-intensive green roofs - a solution for negative impacts of climate change in urban landscapes, EGU General Assembly 2025, Vienna, Austria, 27 Apr–2 May 2025, EGU25-16000, https://doi.org/10.5194/egusphere-egu25-16000, 2025.

EGU25-16066 | PICO | BG3.4

Rainfall interception estimation of a Beech Forest with dynamic storage capacity model 

András Herceg and Gribovszki Zoltán

A comprehensive understanding of rainfall distribution processes within tree canopies is crucial for studying the forest hydrological cycle and its ecosystem. Canopy interception is a dynamic component of the water balance, as the canopy's storage capacity varies seasonally. Building on these insights, the primary aim of this study was to develop a canopy interception model for the European beech (Fagus sylvatica L.). The model incorporates physical parameters as well as considers the seasonally variable storage capacity of the canopy, by the help of remotely sensed Leaf Area Index (LAI) data. The model was tested using annual precipitation data from 2017 to 2022.


The model results highlighted the significant impact of interception on rainfall distribution, with interception accounting for 20% of total precipitation, particularly affecting small rainfall events (0-5 mm) with 61 %. The results of seasonal variability for the investigated six years are 23% in the growing season, while 13% in the dormancy.

Acknowledgement
This article was made within frame of Project No 143972SNN (OTKA) and TKP2021-NKTA-43. The TKP2021-NKTA-43 project which has been implemented with support provided by the Ministry of Innovation and Technology of Hungary (successor: Ministry of Culture and Innovation of Hungary) from the National Research, Development and Innovation Fund and financed under the TKP2021-NKTA funding scheme.

How to cite: Herceg, A. and Zoltán, G.: Rainfall interception estimation of a Beech Forest with dynamic storage capacity model, EGU General Assembly 2025, Vienna, Austria, 27 Apr–2 May 2025, EGU25-16066, https://doi.org/10.5194/egusphere-egu25-16066, 2025.

EGU25-17071 | PICO | BG3.4

Response of Pedunculate oak – Common ash mixed floodplain forests to global and climate change 

Dejan Stojanovic, Nikola Perendija, Milutin Đilas, Bojan Tubić, Marko Marinković, Andrijana Bauer-Živković, Bratislav Matović, Vladimir Višacki, and Saša Orlović

Pedunculate oak (Quercus robur L.) and Common ash (Fraxinus angustifolia Vahl.) mixed forest represent common mixture in central and southeastern Europe. They are vulnerable in the context of global change, especially to the rise of temperature and groundwater table decline, which is present in Serbian floodplain forests. We took wood samples of pedunculate oak and common ash from Sava River Basin. Samples were dried, polished, and scanned in high resolution. Tree-ring widths were measured. General trend of growth decline in past decades was observed. Special emphasize was on analyzing past 10 years period, which were the hottest period since the beginning of measurements on Earth. Significant correlations between temperature and precipitation were observed. Further analysis in context of interactions between two species will be carried out.

Acknowledgment:

The study was supported by the Ministry of Science, Technological Development and Innovation of the Republic of Serbia (Contract No. 451-03-66/2024-03/200197 and co-funded by Science Fund of the Republic of Serbia, call DIASPORA, project SmartTogether and Long-term cooperation between Institute of Lowland Forestry and Environment and PE “Vojvodinašume”.

How to cite: Stojanovic, D., Perendija, N., Đilas, M., Tubić, B., Marinković, M., Bauer-Živković, A., Matović, B., Višacki, V., and Orlović, S.: Response of Pedunculate oak – Common ash mixed floodplain forests to global and climate change, EGU General Assembly 2025, Vienna, Austria, 27 Apr–2 May 2025, EGU25-17071, https://doi.org/10.5194/egusphere-egu25-17071, 2025.

EGU25-18772 | PICO | BG3.4

Mitigating the Effects of Climate Change through Water Retention: A Case Study from the Hidegvíz Valley, Hungary 

Zoltán Gribovszki, Júlia Kovács, András Herceg, Katalin Anita Zagyvai-Kiss, and Péter Kalicz

Precipitation patterns have become increasingly extreme in recent decades, leading to more frequent droughts. For certain vegetation types, such as the riparian alder forest (Alnus glutinosa), surplus water is essential for survival. To address this, we investigated the effects of temporary water retention in the Hidegvíz Valley, located in the Sopron Hills.

A detailed groundwater monitoring network has been operational in this area for over a decade, focusing on the impacts of temporary water retention. As part of this study, the network was expanded to include 21 groundwater wells, some of which were equipped with automatic water level recorders. Data from six and a half years of manual measurements were analyzed, and automatic data loggers recorded the water table for one month following the installation of a log weir.

The water retention intervention resulted in a 40 cm rise in streamwater levels and a several-decimeter (dm) increase in groundwater levels within 3–4 meters of the streambed within a few hours. This rise provided a more favorable groundwater table for the alder forest along the stream during the typically dry months of July and August.

Acknowledgement: The research was supported by the OTKA grant 143972SNN and the associated project TKP2021-NKTA-43.

How to cite: Gribovszki, Z., Kovács, J., Herceg, A., Zagyvai-Kiss, K. A., and Kalicz, P.: Mitigating the Effects of Climate Change through Water Retention: A Case Study from the Hidegvíz Valley, Hungary, EGU General Assembly 2025, Vienna, Austria, 27 Apr–2 May 2025, EGU25-18772, https://doi.org/10.5194/egusphere-egu25-18772, 2025.

EGU25-19145 | ECS | PICO | BG3.4

Reforestation after Calamity Events with Direct Sowing of Pellet Seeds by Drone 

Lea-Marie Pollok, Simon Goldenberg, Ieva Bebre, and Conrad Jackisch

Forest calamity events such as wind breakage, forest fires, and pest infestations have increased in the past due to anthropogenic climate change. These disturbances, while natural succession processes, now occur with unprecedented frequency and severity. To prevent subsequent degradation spirals involving soil erosion, humus loss, and carbon release, rapid ecosystem restoration through reforestation has become crucial, with emphasis on establishing both pioneer vegetation and target tree species. The direct sowing of pelletised seeds by drone is an inexpensive and effective method for reforestation, in contrast to the frequently practised planting. Even areas that are difficult to access can be reached through a targeted species-specific composition and biodiversity can be increased. However, the low germination and establishment rates of the seedlings are challenging. Water availability and other site characteristics have been identified as decisive factors for success. But harsh conditions after calamities are difficult to control. 

In the PICO we present a study aiming to reduce the negative impacts through improved germination and establishment rates under dry environmental conditions. To achieve this, different pellet compositions were analysed in a factorial germination experiment for three tree species (Pinus sylvestris, Ulmus laevis, Alnus glutinosa) on undisturbed topsoil samples. The six weeks experiment has three replications for every pellet composition. The pellets exposed to different a) moisture, b) soils, c) sowing depth, and d) to herbaceous vegetation as additional seeds. The biomass, the number and the survival rate of the seedlings were used as variables from 300 individual samples. The influencing variables were identified using generic multivariate models (Random Forest and Boosted Regression Tree). The experiment complemented with data from field trials for a wide range of species and locations for evaluation.

Using generic multivariate models, their supporting effect is confirmed. Moisture and site characteristics were identified as essential influencing variables. The positive effect of hydrogel and magnesium lime in the pellet composition is evident at different moisture levels at the locations. Dry climatic phases can be specifically overcome. The results corroborate the improvement of germination and establishment of seedlings in direct sowing by drones in reforestation. They also point to site-specific optimisation options for direct sowing of pellet seeds by drone. 

How to cite: Pollok, L.-M., Goldenberg, S., Bebre, I., and Jackisch, C.: Reforestation after Calamity Events with Direct Sowing of Pellet Seeds by Drone, EGU General Assembly 2025, Vienna, Austria, 27 Apr–2 May 2025, EGU25-19145, https://doi.org/10.5194/egusphere-egu25-19145, 2025.

EGU25-239 | ECS | Orals | BG3.5

Global nitrogen fixation patterns in moss-cyanobacteria associations 

Yunyao Ma, Philipp Porada, and Kathrin Rousk

Nitrogen (N) fixation by cyanobacteria on mosses is a critical N source, particularly in moss-abundant and pristine ecosystems such as boreal forests, where it is estimated to contribute over 50% of total ecosystem N input. However, the upscaling of these field estimates in N fixation carries considerable uncertainty because they rely on point sampling of a limited number of species, which fails to capture the potential large spatial and temporal variation in N fixation. As a result, the global spatial pattern of moss-associated N fixation remains poorly understood, limiting the assessment of its relative importance at the global scale. Additionally, modeling global N fixation rates is constrained by the lack of a comprehensive understanding of how moss-associated N fixation relates to the full range of key abiotic drivers across diverse climate zones.

To address these uncertainties, we measured the response of N fixation rates in 2-3 dominant moss species across five climate zones (arctic, boreal, temperate, mediterranean, and tropical) to a full range of key abiotic drivers (i.e., water content, surface temperature, and incident light intensity). By identifying the key parameters of each response curve, we integrated the N fixation process into the process-based model LiBry. We then applied this extended LiBry model to simulate the global pattern of N fixation and assess its relative importance across climate zones.

Our results reveal that different species within the same climate zones exhibit similar response curves to light, water, and temperature, with comparable optimum values for temperature, light, and water content. Moreover, the optimum temperature (~27 °C) and water content (~100%) remain consistent not only across species but also across climate zones, regardless of variations in local temperature and humidity conditions, while the optimum light intensity varied among climate zones. However, moss-associated N fixation rates were higher in boreal, tundra, and mediterranean habitats compared to tropical lowlands and temperate regions. These results indicate that the responses of N fixation to temperature, light, and water content show little species specificity, and further, optimum temperature and water content were unaffected by sample origin (climate).

Our study provides the first global assessment of N fixation in moss-cyanobacteria associations, highlighting variation across climate zones. Our results also stress the need for ecosystem models to incorporate moss-associated N fixation as an essential component of total ecosystem N input, especially in unpolluted systems such as boreal and mediterranean forests and arctic tundra.

How to cite: Ma, Y., Porada, P., and Rousk, K.: Global nitrogen fixation patterns in moss-cyanobacteria associations, EGU General Assembly 2025, Vienna, Austria, 27 Apr–2 May 2025, EGU25-239, https://doi.org/10.5194/egusphere-egu25-239, 2025.

Changes in heat and moisture significantly co-alter ecosystem functioning. However, knowledge on dynamics of ecosystem responses to climate change is limited. Here, we quantify long-term ecosystem sensitivity based on weighted ratios of vegetation productivity variability and multiple climate variables from satellite observations, greater values of which indicate more yields per hydrothermal condition change. Our results show ecosystem sensitivity exhibits large spatial variability and increases with the aridity index. A positive temporal trend of ecosystem sensitivity is found in 61.28% of the study area from 2001 to 2021, which is largely attributed to declining vapor pressure deficit and constrained by solar radiation. Moreover, carbon dioxide plays a dual role; which in moderation promotes fertilization effects, whereas in excess may suppress vegetation growth by triggering droughts. Our findings highlight moisture stress between land and atmosphere is one of the key prerequisites for ecosystem stability, offsetting part of the negative effects of heat.

How to cite: Hu, Y.: Ecosystems in China have become more sensitive to changes in water demand since 2001, EGU General Assembly 2025, Vienna, Austria, 27 Apr–2 May 2025, EGU25-1136, https://doi.org/10.5194/egusphere-egu25-1136, 2025.

EGU25-1374 | ECS | Posters on site | BG3.5

A network of 18 wildfire chronosequences reveals key drivers of the boreal nitrogen balance 

Stefan F. Hupperts, Frank Berninger, Han YH Chen, Nicole Fenton, Mélanie Jean, Kajar Köster, Markku Larjavaara, Michelle C. Mack, Marie-Charlotte Nilsson, Marjo Palviainen, Anatoly Prokushkin, Jukka Pumpanen, Meelis Seedre, Martin Simard, and Michael J. Gundale

Ecosystem productivity and carbon uptake in the circumpolar boreal forest are contingent on available nitrogen, which ultimately originates from inputs via deposition and biological nitrogen fixation. Nitrogen deposition rates in boreal forests are relatively small compared to other biomes, and most biological nitrogen fixation research has focused on moss-diazotroph associations. However, the relative contributions of these two primary nitrogen inputs to ecosystem nitrogen stocks have not been widely investigated. In this study, we combined a mass balance approach and literature synthesis to estimate rates of nitrogen accumulation and nitrogen inputs across a network of 18 wildfire chronosequences spanning the boreal biome. We found that nitrogen accumulation rates were strongly linked with fire regime (stand-replacing versus surface fires) and canopy dominance (deciduous versus evergreen canopies). Furthermore, a considerable amount of accumulating nitrogen in these boreal forests was unexplained by the known inputs estimated from the literature synthesis, particularly in forests with stand-replacing fire regimes and more deciduous tree cover that together had the highest nitrogen accumulation rates. This unexplained fraction of nitrogen inputs in some forests may originate from poorly quantified niches of biological nitrogen fixation. Exploring this research frontier will help improve predictions of boreal forest nitrogen cycling and carbon uptake in changing climate and wildfire regimes.

How to cite: Hupperts, S. F., Berninger, F., Chen, H. Y., Fenton, N., Jean, M., Köster, K., Larjavaara, M., Mack, M. C., Nilsson, M.-C., Palviainen, M., Prokushkin, A., Pumpanen, J., Seedre, M., Simard, M., and Gundale, M. J.: A network of 18 wildfire chronosequences reveals key drivers of the boreal nitrogen balance, EGU General Assembly 2025, Vienna, Austria, 27 Apr–2 May 2025, EGU25-1374, https://doi.org/10.5194/egusphere-egu25-1374, 2025.

Fine root decomposition is essential for the cycling of carbon (C) and nutrients in terrestrial ecosystems. Although nitrogen (N) deposition is known to affect this process, the primary regulatory mechanisms remain uncertain. In this study, we investigated the impact of N addition on fine root decomposition through a three-year experiment, using two distinct N addition timelines: “Before” (fine roots collected from N addition plots and decomposed in control plots) and “During” (fine roots collected from control plots and decomposed in N addition plots). Our findings showed that N addition “Before” significantly inhibited fine root decomposition, while N addition “During” had no noticeable effect. Random forest analyses identified substrate N concentration as the key factor influencing decomposition rates. Specifically, decomposition rates were negatively correlated with N concentration and positively correlated with C:N ratios, regardless of the N addition timeline. These results support the N inhibition hypothesis and emphasize the dominant role of substrate chemistry in regulating fine root decomposition. This study offers valuable insights into ecosystem C cycling under increasing N deposition and underscores the importance of incorporating substrate chemical traits into predictive models.

How to cite: Xu, X.: Fine root decomposition in poplar plantations: Negative regulation by initial root nitrogen content, EGU General Assembly 2025, Vienna, Austria, 27 Apr–2 May 2025, EGU25-1668, https://doi.org/10.5194/egusphere-egu25-1668, 2025.

EGU25-2441 | ECS | Posters on site | BG3.5

Impacts of Climate Change on Terrestrial Carbon and Nitrogen Cycles 

Jinglan Cui and Baojing Gu

To address the key question of how future climate change will affect terrestrial ecosystems in terms of biogeochemical cycles, we propose a model framework integrating multi-source observations and global carbon-nitrogen cycle models. This allows us to explore the response patterns of carbon and nitrogen fluxes in global forests, grasslands, and croplands under elevated atmospheric carbon dioxide (CO2), warming, and altered precipitation regimes.

We find that elevated CO2 generally benefits terrestrial ecosystems by enhancing carbon and nitrogen cycling, leading to increased productivity and reduced nitrogen loss. On the other hand, warming and altered precipitation tend to exacerbate inequalities in global carbon and nitrogen cycles, widening the development gap between the Global South and North.

Understanding these biogeochemical feedbacks under climate change is crucial for guiding effective adaptation and mitigation strategies, which are essential for maintaining the health of terrestrial ecosystems and the planet as a whole.

How to cite: Cui, J. and Gu, B.: Impacts of Climate Change on Terrestrial Carbon and Nitrogen Cycles, EGU General Assembly 2025, Vienna, Austria, 27 Apr–2 May 2025, EGU25-2441, https://doi.org/10.5194/egusphere-egu25-2441, 2025.

EGU25-2522 | Orals | BG3.5

Impacts of photosynthetic capacity acclimation and adaptation to temperature and CO2 

Rebecca Oliver, Lina Mercado, Belinda Medlyn, Phil Harris, and Doug Clark

The response of photosynthesis to temperature and CO₂ remains poorly represented in land surface models, contributing to significant uncertainty in land carbon sink estimates. Here, we incorporate photosynthetic capacity adaptation and acclimation to temperature into the JULES land surface model, and we investigate the sensitivity of photosynthesis to CO₂ acclimation. Using an RCP8.5 climate scenario, we quantify the impact of these processes on Gross Primary Productivity (GPP). Simulations accounting for adaptation and acclimation to temperature and CO2 increases modelled global GPP by 2050. Temperature acclimation in the extra tropics enhances GPP, but adaptation in the tropics weakens the CO2 fertilisation response decreasing GPP. CO2 acclimation down-regulates photosynthetic capacity, causing a universal decline in the rate of GPP enhancement across biomes. Our findings emphasize the need for models to incorporate temperature adaptation and acclimation to avoid underestimating global carbon uptake and to better capture spatial variability in responses to rising temperatures. In addition, improving our understanding of CO₂ acclimation across biomes and its integration into models is critical for reducing uncertainties in future carbon cycle predictions.

How to cite: Oliver, R., Mercado, L., Medlyn, B., Harris, P., and Clark, D.: Impacts of photosynthetic capacity acclimation and adaptation to temperature and CO2, EGU General Assembly 2025, Vienna, Austria, 27 Apr–2 May 2025, EGU25-2522, https://doi.org/10.5194/egusphere-egu25-2522, 2025.

EGU25-2630 | Posters on site | BG3.5

Ecosystem water use efficiency in a forest and a peatland in northern Patagonia 

Jorge Perez-Quezada, David Trejo, Javier Lopatin, David Aguilera, Bruce Osborne, Mauricio Galleguillos, Luca Zattera, Juan Luis Celis, and Juan Armesto

During 8 years (2015-2022), we measured net ecosystem exchange of CO2 (NEE) and evapotranspiration (ET) using eddy covariance systems in a temperate rainforest and an anthropogenic peatland in northern Patagonia (southern Chile). NEE was partitioned into gross primary production (GPP) and ecosystem respiration (Reco), while ET was partitioned into evaporation (E) and transpiration (T), which in turn were used to calculate different formulas of water use efficiency (WUE). We identified the main environmental drivers of WUE, GPP, ET, E and T. Results showed that while the forest was a consistent carbon sink (-17.82 Mg CO2 ha-1 year-1), the peatland was in average a small source (1.21 Mg CO2 ha-1 year-1). Only the expressions of WUE that included atmospheric water demand showed seasonal variation. Variations in WUE were more related to changes in ET than with changes in GPP. For both ecosystems, E increased with higher global radiation and higher surface conductance and when water table depth was closer to the soil surface. Also, higher values of E were related to higher wind speed in the forest and higher air temperature in the peatland. The absence of a close relation between ET and GPP was likely related to the dominance of plant species with low or no stomatal control. The observed increase in potential ET suggests that WUE could increase in the future in these ecosystems.

How to cite: Perez-Quezada, J., Trejo, D., Lopatin, J., Aguilera, D., Osborne, B., Galleguillos, M., Zattera, L., Celis, J. L., and Armesto, J.: Ecosystem water use efficiency in a forest and a peatland in northern Patagonia, EGU General Assembly 2025, Vienna, Austria, 27 Apr–2 May 2025, EGU25-2630, https://doi.org/10.5194/egusphere-egu25-2630, 2025.

EGU25-2870 | ECS | Orals | BG3.5

The role of plant-soil-microbe interactions on nitrogen cycling under drought and warming in grasslands 

Helena Vallicrosa, Pierre Mariotte, and Charlotte Grossiord

An accurate understanding of the plant-soil biogeochemical cycles is crucial to model the impacts of global change. However, further exploration is needed to disentangle the role of microbes in plant carbon and nitrogen uptake under warming and drought. In this study we perform a manipulative experiment increasing temperature and water deficit in 240 pots, considering six different grassland species (2 forbs, 2 grasses, and 2 N-fixers) and two different soil types (coming from intensive and extensive managing practices). By analyzing N content, N labeling, and biomass production in the soil, microbial, belowground, and aboveground compartments we study potential interactions between the plant-microbial-soil system in different conditions. Preliminary results indicate that water availability is more important than warming to regulate biomass production and nutrient uptake. In addition, N availability determines the interaction between plants and the microbial community. These findings will help better incorporate the role of microbes in nutrient cycling and better understand the impacts of future conditions, anticipated to be warmer and dryer.

How to cite: Vallicrosa, H., Mariotte, P., and Grossiord, C.: The role of plant-soil-microbe interactions on nitrogen cycling under drought and warming in grasslands, EGU General Assembly 2025, Vienna, Austria, 27 Apr–2 May 2025, EGU25-2870, https://doi.org/10.5194/egusphere-egu25-2870, 2025.

EGU25-3654 | ECS | Orals | BG3.5

Nitrogen dynamics and Microbial Adaptations in High-Latitude soils under Decadal Warming 

Ana Leticia Zevenhuizen Martínez, Andreas Richter, Lucia Fuchslueger, Judith Prommer, Niel Verbrigghe, Josep Peñuelas, Bjarni Diðrik Sigurdsson, and Sara Marañón-Jiménez

Soils at high latitudes are experiencing significant warming due to climate change, raising concerns about potential disruptions in nitrogen (N) and carbon (C) cycling. This study investigates the decadal effects of soil warming on microbial N transformations in an Icelandic grassland. To this purpose, a geothermal gradient was utilized, where soil temperatures varied naturally from +0ºC to +12.3°C, simulating enhanced warming effects. Seasonal sampling of N pools and rates of gross N transformations—including amino acid, ammonia, and nitrate consumption and production—provided insights into microbial responses to prolonged warming. 

Warming accelerated the turnover of amino acids, driven by increased rates of microbial production and consumption, but did not affect net protein depolymerization. Ammonia consumption rates increased with temperature, although production rates remained constant. Additionally, total soil N content decreased substantially after five years of warming but remained stable between 5 and 10 years of warming. These findings suggest that N losses induced by warming occurred primarily within the first five years, stabilizing in a new equilibrium without further N losses. The enhanced microbial C limitation in warmed soils likely compelled microorganisms to rely more on the turnover of organic N pools as a dual source of both C and N to meet their heightened metabolic demands, thus preventing further N losses.  

Overall, these findings challenge the assumption of progressive N depletion under warming conditions and highlight the role of microbial physiological adaptations in maintaining soil N availability despite increased metabolic demands. 

How to cite: Zevenhuizen Martínez, A. L., Richter, A., Fuchslueger, L., Prommer, J., Verbrigghe, N., Peñuelas, J., Sigurdsson, B. D., and Marañón-Jiménez, S.: Nitrogen dynamics and Microbial Adaptations in High-Latitude soils under Decadal Warming, EGU General Assembly 2025, Vienna, Austria, 27 Apr–2 May 2025, EGU25-3654, https://doi.org/10.5194/egusphere-egu25-3654, 2025.

EGU25-4478 | ECS | Posters on site | BG3.5

Detection of the effects of hydraulic activation of stomata (HAS) on the water use efficiency of crops 

Shuaishuai Deng, Jürgen Burkhardt, Ronny Lauerwald, Christophe Flechard, Jürgen Knauer, Carmen Kalalian, Benjamin Dumont, Nicolas Viovy, and Benjamin Loubet

Hydraulic activation of stomata (HAS) is the process of wicking water from the leaf interior to the surface, promoted by deliquescent salt on the leaf surface, serving as a critical physiological mechanism that affects stomatal behavior, water fluxes, and ultimately water use efficiency (WUE) in vegetation. This study is the first to evaluate the HAS effect under field conditions, investigating the potential role of hygroscopic urea ammonium nitrate (UAN) foliar application promoting HAS and detecting its effects through changes in transpiration, stomatal slope (g1), carbon-water exchange rate (λ), and inherent water use efficiency (IWUE) at the ecosystem scale.

Using eddy covariance (EC) observations across four ICOS European cropland sites (FR-Gri, BE-Lon, DE-Kli, DE-Geb) from 2005 to 2020, our findings revealed distinct crop-specific responses, with HAS influencing transpiration dynamics after foliar UAN application. Barley, maize, and winter wheat exhibited significantly increased transpiration, as evidenced by substantial increases in g1 and λ (p < 0.05). These changes were accompanied by reductions in IWUE, reflecting enhanced stomatal conductance and more water loss under the HAS effect. In contrast, rapeseed showed reductions in transpiration, g1, and λ, but an increase in IWUE, suggesting improved water use efficiency through distinct physiological response. Except for rapeseed, foliar UAN application enhanced CO2 assimilation, leading to a larger difference in CO2 concentrations (CaCs) and decreased temperature gradient (TaTs) between air and surface, which was attributed to cooling effects induced by elevated transpiration across sites. Notably, g1 remained stable over a one-month period in the absence of foliar UAN application, indicating that observed changes in WUE are primarily driven by the effects of UAN rather than intrinsic stomatal regulation under natural growth conditions.

These findings highlight HAS’s distinct impacts on transpiration, surface energy fluxes, and WUE under field conditions, underscoring the need to incorporate HAS into ecosystem models. The neglect of HAS in current models results in an overestimation of WUE following foliar fertilization in cereals. This limitation may also extend to other vegetation types due to hygroscopic deposition of aerosols, emphasizing the broader significance of integrating HAS into models to improve WUE predictions and support sustainable ecosystem management practices.

How to cite: Deng, S., Burkhardt, J., Lauerwald, R., Flechard, C., Knauer, J., Kalalian, C., Dumont, B., Viovy, N., and Loubet, B.: Detection of the effects of hydraulic activation of stomata (HAS) on the water use efficiency of crops, EGU General Assembly 2025, Vienna, Austria, 27 Apr–2 May 2025, EGU25-4478, https://doi.org/10.5194/egusphere-egu25-4478, 2025.

EGU25-4984 | ECS | Posters on site | BG3.5

A general framework for nitrogen deposition effects on soil respiration in global forests 

Xiaoyu Cen, Peter Vitousek, Nianpeng He, Ben Bond-Lamberty, Shuli Niu, Enzai Du, Kailiang Yu, Mianhai Zheng, James Raich, Kevin Van Sundert, Lizzie Paulus, Liyin He, Li Xu, Mingxu Li, and Klaus Butterbach-Bahl

Soil respiration (SR) is one of the largest land-atmosphere carbon fluxes. Since the industrial revolution, human activities have altered atmospheric nitrogen (N) deposition in forests, potentially affecting biotic activities and changing SR. However, this is highly uncertain, as mixed effects of N inputs on SR (i.e., increasing vs. decreasing) were observed in global forests. Here we synthesized data from global N addition experiments to quantitatively analyze how N increases or decreases SR. The revealed patterns were consistent with the observed SR changes across the natural N deposition gradient, providing a general framework to explain the diverse effects of N input on SR in global forests. Using a novel probabilistic approach, we estimated that N deposition decreased SR in 2.9% of global forests, mostly N-saturated forests in eastern China, western Europe, and eastern USA. But the net effect of N deposition increased the global forest SR budget by 5.1% (1.7 PgC yr–1). If N pollution could be effectively controlled, global forest SR and its variability would decrease, thereby reducing the uncertainty in the projected terrestrial carbon dynamics.

How to cite: Cen, X., Vitousek, P., He, N., Bond-Lamberty, B., Niu, S., Du, E., Yu, K., Zheng, M., Raich, J., Van Sundert, K., Paulus, L., He, L., Xu, L., Li, M., and Butterbach-Bahl, K.: A general framework for nitrogen deposition effects on soil respiration in global forests, EGU General Assembly 2025, Vienna, Austria, 27 Apr–2 May 2025, EGU25-4984, https://doi.org/10.5194/egusphere-egu25-4984, 2025.

EGU25-7279 | Posters on site | BG3.5

Drivers of the enhanced amplitude of atmospheric CO2 in northern terrestrial ecosystems 

Naixin Fan and Matthias Forkel

Airborne and ground-based measurements have consistently shown a rise in the seasonal amplitude of atmospheric CO2 concentration since the 1960s, particularly notable in the high northern latitudes. For instance, Barrow (BRW, 71ºN) witnessed a 50% increase in CO2 amplitude from 1960 to 2011, compared to a 15% increase at Mauna Loa (MLO, 20ºN). This trend suggests significant alterations in biosphere-atmosphere interactions and a changing carbon cycle in northern ecosystems. Previous studies suggest that the enhanced amplitude of atmospheric CO2 is mainly caused by the amplified plant productivity in northern ecosystems. However, the major factors that drive the increasing CO2 amplitude in the northern ecosystems are still subjected to debate, reflecting the fact that the underlying mechanisms or processes that govern the changes still remain unclear. Our study aims to understand these changes from both modelling and observational perspectives by using long-term (1980-2018) monthly CO2 concentration records, incorporating climate data, land cover changes, fire emissions, and ecosystem carbon fluxes (including gross primary production and ecosystem respiration). In parallel, we employed the LPJmL dynamic global vegetation model coupled with the TM3 atmospheric transport model (LPJmL+TM3) to simulate the seasonal CO2 concentration shifts and investigate the cause of the increasing CO2 amplitude. Our results show that the LPJmL+TM3 successfully captures both the interannual variability and the rising trend in CO2 amplitude from 1980 to 2018. We assessed the impact of various factors on CO2 amplitude changes. Our results suggest that the inter-annual variability of gross primary production plays an important role in the rising trend of CO2 amplitude. Further analysis shows that the long-term CO2 amplitude trend is a result of the combined effect of vegetation and climate change.

How to cite: Fan, N. and Forkel, M.: Drivers of the enhanced amplitude of atmospheric CO2 in northern terrestrial ecosystems, EGU General Assembly 2025, Vienna, Austria, 27 Apr–2 May 2025, EGU25-7279, https://doi.org/10.5194/egusphere-egu25-7279, 2025.

Wetlands play important roles in the ecological balance and sustainable development of arid oases. However, the interactions and feedback mechanisms in oasis hydrology–soil–vegetation systems are unclear. We conducted a 5-year field study in swamp, riparian, grassland, shrubland, and reclamation oasis wetlands to analyze the hydroclimatic processes, soil physicochemical properties, vegetation characteristics, and their interactions and feedback mechanisms in northwestern China. The precipitation was low (122.5±12.3 mm yr-1), and the differences among different wetland types were significant, with an average annual evapotranspiration of 598.2 to 654.5 mm yr-1, a groundwater depth of 85.4±5.3 to 130.1±14.8 mm), and a soil water content (SWC) of 0.26±0.03 to 0.39±0.09 v/v). Groundwater depth significantly affected  SWC, pH, EC, nutrients, ions, and microbial and vegetation diversity. The differences among wetlands were significant. Reclamation for agriculture significantly increased Cl-, CO32-, Mg2+, and K+, but significantly decreased SO42-, HCO3-, Ca2+, and Na+. The overall vegetation community contained 17 families, 40 genera, and 46 species, of which dicotyledons were dominant, accounting for 56.5% of total number. Path modeling showed that groundwater depth directly affected soil water content (88%), soil ion contents (56%), and nutrient contents (32%), thereby indirectly affecting soil microbe and vegetation diversity. SWC affected vegetation diversity more strongly than groundwater depth in the wetlands, resulting in differences of vegetation diversity (total effect size, 85.3%), with a direct effect of 62.9% and an indirect effect of 23.2%. Our results show that the interactions among hydroclimatic processes, soil physicochemical properties, and human activities affect species diversity and vegetation characteristics in oasis wetlands.

How to cite: Liu, B.: Interaction process and feedback mechanisms of hydrology -soil-vegetation systems in oasis wetland, northwest China, EGU General Assembly 2025, Vienna, Austria, 27 Apr–2 May 2025, EGU25-9350, https://doi.org/10.5194/egusphere-egu25-9350, 2025.

EGU25-9595 | ECS | Orals | BG3.5

Sensitivity of Terrestrial Ecosystem Respiration to Soil Moisture Under Different Aridity Conditions in Australia 

Eva-Marie Metz, Sanam N. Vardag, Andrew F. Feldman, Benjamin Poulter, and André Butz

Terrestrial ecosystem respiration (TER) is the second largest CO2 flux between biosphere and atmosphere after photosynthesis. It is therefore crucial to understand the dynamics and drivers of TER to be able to accurately model the net CO2 exchange between biosphere and atmosphere under a changing climate. Most studies focus on the temperature dependence of TER. However, precipitation and soil moisture can also have a major impact on TER, especially in arid environments. Disentangling the impacts of temperature and soil water on TER is an important challenge to reduce uncertainties in modelling the carbon cycle and its climate change feedbacks.

Here we use daily nighttime net ecosystem exchange (NEE) data as proxy for TER collected by more than 30 flux tower stations within the OzFlux network over the last 20 years in Australia. These stations cover a broad range of climate conditions enabling us to analyze the dependence of TER on soil moisture under varying aridity conditions. We find that the sensitivity of TER to soil moisture variability is much stronger in semi-arid regions than in arid or humid areas. For the most arid stations, soil respiration is in general limited by the small amount of available litter substrate. Soil respiration fluxes at humid stations, however, are large but show only low or even negative sensitivity to the high soil moisture levels indicating that TER at humid stations is not water-limited. We show that common model approaches assuming a constant TER sensitivity for all soil moisture levels fail in reproducing the observed TER behavior in Australia. Hence a more sophisticated description of TER with respect to its soil moisture dependence is necessary to capture TER dynamics under different climate conditions accurately.

How to cite: Metz, E.-M., Vardag, S. N., Feldman, A. F., Poulter, B., and Butz, A.: Sensitivity of Terrestrial Ecosystem Respiration to Soil Moisture Under Different Aridity Conditions in Australia, EGU General Assembly 2025, Vienna, Austria, 27 Apr–2 May 2025, EGU25-9595, https://doi.org/10.5194/egusphere-egu25-9595, 2025.

Temperature anomalies, such as heatwaves and cold spells, are becoming increasingly common, posing significant challenges to ecosystem functioning and carbon sequestration. While temperature anomalies have been shown to influence broad-scale carbon flux patterns, their fine-scale effects, particularly in conjunction with agricultural management, remain poorly understood. This study investigates the impact of air temperature (Tair) anomalies on CO₂ fluxes in an upland mesic grassland under two grazing management regimes: low cattle grazing intensity and high cattle grazing intensity and fertilisation. Using 18 years (2003–2021) of CO₂ flux and climate data, we assessed gross primary productivity (GPP) and ecosystem respiration (Reco) responses to temperature anomalies, including cold, warm, extreme cold, and extreme warm conditions. The study site experienced an average of 40 anomalous temperature days per year, including ~10 days of extreme events. CO₂ fluxes were most affected by temperature anomalies during the early growing season, with the strongest increases in GPP and Reco observed in spring. Warm anomalies generally enhanced CO₂ fluxes in spring but suppressed them in summer and autumn, particularly under extreme warm conditions lasting more than six days. This suppression likely reflects the exceedance of a temperature stress threshold (~20°C). Management intensity modulated these responses. High-intensity grazing and fertilisation increased the sensitivity of CO₂ fluxes to warm anomalies, whereas low-intensity grazing appeared to buffer fluxes against temperature-induced stress. Cold anomalies promoted asynchrony between patterns of grassland carbon uptake and release, adding further complexity to temperature–flux relationships. Our findings emphasize the importance of management × climate interactions in shaping CO₂ flux responses. Low-intensity management regimes may enhance ecosystem resilience to warming in cool temperate grasslands, providing a potential adaptation strategy under climate change. This study highlights the importance of long-term, field-based research to refine our understanding of how grasslands can maintain their carbon sink capacity amidst increasing temperature extremes.

How to cite: Klumpp, K., Bloor, J. M. G., and Winck, B.: Effects of management and temperature anomalies on grassland CO2 fluxes using a long-term eddy covariance dataset , EGU General Assembly 2025, Vienna, Austria, 27 Apr–2 May 2025, EGU25-11206, https://doi.org/10.5194/egusphere-egu25-11206, 2025.

EGU25-13195 | ECS | Posters on site | BG3.5

The effects of a non-native insect on Antarctic soil biogeochemistry and potential greenhouse gas emissions 

Octavia Brayley, Peter Convey, Sami Ullah, and Scott Hayward

Terrestrial biodiversity in Antarctica is low compared to most temperate and tropical systems, resulting in nutrient-limited ecosystems characterised by low complexity. The establishment of a single non-native species can profoundly disrupt these ecosystems. One such species is the flightless midge, Eretmoptera murphyi (Diptera: Chironomidae), a fly with soil-dwelling detritivorous larvae that was accidentally introduced to Signy Island (South Orkney Islands, maritime Antarctic) from its native South Georgia (South Sandwich Islands, sub-Antarctica) in the 1960s. The fly now occurs with an overall biomass exceeding that of all native microarthropod species combined in some areas of the island. Studies have shown that high larval densities are associated with significant increases in soil nitrate concentrations, potentially impacting native flora and fauna and creating favourable conditions for further invasions by non-native species.

This study investigated the influence of E. murphyi presence on a broader range of soil biogeochemical properties, utilising advanced biochemical methods to measure nitrate, ammonia, phosphorus, total nitrogen and total carbon content. The results indicate that Signy Island soils inhabited by the fly have high organic content (~32% carbon) and are acidic (pH ~4.5). Soils colonised by E. murphyi exhibited significantly higher concentrations of nitrate and ammonia compared to control sites, while phosphate levels showed no significant difference, likely due to the acidic substrate.

The potential future impact of E. murphyi presence and climate change on greenhouse gas emissions from these soils was explored through incubation experiments. Over three-month incubations, elevated temperatures representing medium (9°C) and high (14°C) future warming scenarios increased emissions of nitrous oxide (N₂O) and carbon dioxide (CO₂) from the soils, compared to the current annual average temperature (4°C). Soils from E. murphyi-occupied sites released significantly more N₂O and CO₂ than control soils, possibly due to increased microbial activity. This may be due in part to the higher water content in E. murphyi soils, which may increase microbial abundance and activity. Methane (CH₄) emissions decreased over time in all scenarios, suggesting a shift in microbial community composition.

We suggest it is possible that E. murphyi increases microbial biomass through the introduction of its non-native microbiome, resulting in increased microbial respiration rates and, thereby, amplifying greenhouse gas emissions from Antarctic soils as temperatures rise. Notably, the observed increase in N₂O emissions suggests that E. murphyi may introduce or promote the activity of microorganisms capable of ammonia oxidation, a suggestion supported by parallel microbiome studies. In a separate study of E. murphyi’s microbiome, we confirmed the presence of archaea and bacteria known to carry out ammonia oxidation and other N₂O-producing processes, such as denitrification. Key taxa identified include Crenarchaeota, Actinobacteria, Chloroflexi, and Proteobacteria. Collectively, these findings emphasise the potential for E. murphyi to significantly alter Antarctic soil processes and contribute to climate change-driven feedback loops in these polar ecosystems.

How to cite: Brayley, O., Convey, P., Ullah, S., and Hayward, S.: The effects of a non-native insect on Antarctic soil biogeochemistry and potential greenhouse gas emissions, EGU General Assembly 2025, Vienna, Austria, 27 Apr–2 May 2025, EGU25-13195, https://doi.org/10.5194/egusphere-egu25-13195, 2025.

EGU25-13578 | ECS | Orals | BG3.5

Optimizing phenological parameters for bridging remote sensing and QUINCY model in permafrost regions 

Yu Zhu, Fabrice Lacroix, and Sönke Zaehle

Vegetation leaf phenology (i.e. the timing of leaf onset and offset) determines the temporal bounds of the growing season. Thereby leaf phenology strongly influences the exchanges of energy and CO2 between the atmosphere and the biosphere. However, accurate parameterization of leaf phenology processes in terrestrial biosphere models is challenging due to a poor understanding of the physical drivers of leaf recovery and senescence and their co-variance in space. Vegetation phenology in Northern Hemisphere permafrost regions is affected by more complex permafrost processes compared with the other terrestrial ecosystems. Yet the heterogeneity of vegetation response within permafrost regions is often overlooked in global simulations that treat the region as a whole. Further, PFT-based biogeochemistry models set phenological parameters as simply constants, but do not take into account the vegetation heterogeneity within the same plant functional type. 

Here, we derive optimal heat-related phenological parameters within the QUINCY model by inversing remote sensing information. Compared to the model’s default parameters, these optimized parameters significantly improve the prediction of the growing season start and ending in more than 70% and 80% of Northern Hemisphere permafrost regions, respectively. Our results reveal significant variability in vegetation phenological responses across different permafrost regions covered by herbaceaous vegetation types. This suggests that phenological parameters in terrestrial biosphere models must be tailored to local environmental conditions. This implication is further verified by QUINCY model. This study provides insights into the potential for enhancing model performance with the help of remote sensing information, and emphasizes the necessity for local parameterization across different ecosystems within Northern Hemisphere permafrost regions by terrestrial biosphere models.

How to cite: Zhu, Y., Lacroix, F., and Zaehle, S.: Optimizing phenological parameters for bridging remote sensing and QUINCY model in permafrost regions, EGU General Assembly 2025, Vienna, Austria, 27 Apr–2 May 2025, EGU25-13578, https://doi.org/10.5194/egusphere-egu25-13578, 2025.

EGU25-13663 | Posters on site | BG3.5

CO2 Fluxes at high-altitude mountain ecosystems: a comparative study of two grasslands in the Aosta valley 

Gianna Vivaldo, Daria Ferraris, Ilaria Baneschi, Alice Baronetti, Maria Silvia Giamberini, Antonello Provenzale, Brunella Raco, and Marta Galvagno

Mountain ecosystems are highly sensitive to the impacts of climate change. Nevertheless, our knowledge of critical biogeochemical processes—key to understanding how these ecosystems cope to shifting environmental conditions—remains limited.

This study examines and compares carbon dioxide (CO2) turbulent flux measurements, obtained through the eddy covariance (EC) method at two Italian high-altitude sites: Torgnon and Nivolet in the Western Alps. These sites, part of the ICOS (Integrated Carbon Observatory System) network as Associated stations IT-Tor (Torgnon) and IT-Niv (Nivolet), are unmanaged subalpine grasslands situated at elevations of 2050 m and 2750 m, respectively, with different plant species compositions. Snow typically covers these areas from late October to late May at IT-Tor and until June at IT-Niv, restricting the growing season to approximately four to five months. Continuous EC measurements of CO2 fluxes have been conducted continuously since June 2017 at IT-Tor and since June 2019 at IT-Niv.

This work focuses on comparing CO2 fluxes from both sites under comparable meteorological conditions to explore the differences between the two canopies from an ecophysiological perspective. Additionally, phenological patterns are analyzed to evaluate how each grassland responds to extreme weather events, including the 2022 summer drought, the most severe drought event recorded in the last 17 years.

Our results emphasize the sensitivity of mountain ecosystems to climate change and highlight the importance of continuous monitoring to better understand and manage these fragile environments. The ecophysiological responses of these two mountain ecosystems to varying environmental conditions will be discussed considering their different altitude, species composition, and historical management.

Further research, combining long-term data with advanced modeling approaches, will be crucial for developing a more comprehensive understanding of how climate extremes affect mountain ecosystems across Europe.

How to cite: Vivaldo, G., Ferraris, D., Baneschi, I., Baronetti, A., Giamberini, M. S., Provenzale, A., Raco, B., and Galvagno, M.: CO2 Fluxes at high-altitude mountain ecosystems: a comparative study of two grasslands in the Aosta valley, EGU General Assembly 2025, Vienna, Austria, 27 Apr–2 May 2025, EGU25-13663, https://doi.org/10.5194/egusphere-egu25-13663, 2025.

Climate change has been occurring at a rapid rate and is being exacerbated by anthropogenic activities that increase global temperatures and atmospheric concentrations of greenhouse gases such as CO2. This greatly impacts ecosystems worldwide, resulting in more frequent and intense extreme weather events such as heat waves and drought. Understanding how ecosystems respond to elevated CO2 is critical for predicting the impacts of climate change on ecosystem processes, such as their ability to sequester carbon. Temperate ecosystems, in particular, are important in mitigating climate change, holding around 20% of the global plant biomass and approximately 10% of the global terrestrial carbon (Bonan, 2008). However, the capacity of these ecosystems to continue sequestering additional carbon dioxide in the future is uncertain when predicted using current terrestrial biosphere models (TBMs). To address this, improved mechanistic representations of ecosystem states and processes under changing climatic conditions are crucial, as well as the initialisation of the models using real-world observations. In this regard, ecosystem-scale experiments, such as Free-air CO2 enrichment (FACE) experiments, are extremely useful and powerful tools for improving model predictions and have frequently been used for model-data synthesis and ecosystem analysis (Walker et al, 2015). 

In this study, we examined the responses of mature temperate forests to rising atmospheric CO2 and changing climatic conditions using the Ecosystem Demography model (ED2), which is a cohort-based terrestrial biosphere model (TBM). We parameterised the model with data collected from the Birmingham Institute of Forest Research, Free-air CO2 Enrichment (BIFoR FACE) experiment site. As the first study using a TBM at BIFoR, this study analysed the model’s capacity to simulate ecosystem responses to elevated CO2 (+150 ppm above ambient) and extreme weather events such as the European drought of 2022 (Gharun et al, 2024). We ran two simulations and compared model outputs against field measurements of key eco-physiological measurements such as maximum rate of carboxylation, soil moisture, and Net Primary Production (NPP). This study demonstrates the capability and the limitations of the TBM to simulate the responses of a mature temperate forest to elevated CO2 conditions under changing and extreme climatic conditions.  

How to cite: Healy, S.: Modelling mature temperate forest responses to elevated CO2 and changing climatic conditions: insights from the BIFoR FACE experiment, EGU General Assembly 2025, Vienna, Austria, 27 Apr–2 May 2025, EGU25-13821, https://doi.org/10.5194/egusphere-egu25-13821, 2025.

EGU25-14277 | Orals | BG3.5

An ecosystem-scale flooding experiment to disentangle mechanisms of coastal forest resilience and vulnerability to extreme flooding events  

Ben Bond-Lamberty, Kennedy Doro, Anya Hopple, Nate McDowell, Kendalynn Morris, Allison Myers-Pigg, Stephanie Pennington, Evan Phillips, Peter Regier, Radha Srinivasan, Alice Stearns, Nicholas Ward, Vanessa Bailey, and J. Patrick Megonigal

Climate change, increasing storms, and sea level rise are increasingly affecting coastal forest ecophysiology and mortality, leading to widespread ‘ghost forests’ and marsh incursion. However, it is difficult to predict the rapid changes observed at these terrestrial-aquatic interfaces as the complex interplay of hydrological, ecological, biogeochemical, and physiological responses driving ecosystem stress and change is not well understood. We describe TEMPEST, a unique manipulative experiment to simulate extreme freshwater and estuarine-water disturbance events over multiple years in 2000 m2 plots. This experiment was implemented in a deciduous coastal US forest with no known prior exposure to seawater. A dense network of environmental, soil, and tree sensors captured the cascading effects of each of the three annual flood treatments—300 m3 or 15 cm water per day per plot—with sensor data streaming in real time to project scientists and then openly available for community analysis.

The first TEMPEST event in 2022 significantly but temporarily impacted the system’s hydrology, with more subtle influences on biogeochemical, soil gas flux, and vegetation components. Pedological changes and vegetation stress built rapidly in subsequent years, however, and by years two and three sap flow rates in three deciduous tree species were disproportionately and negatively affected in the saltwater plot: growing season sap flux of tulip poplars was 25% lower than in the control plot, with the trees exhibiting canopy loss. Maple and beech were also negatively affected but to a lesser extent. The novel TEMPEST experiment provides insight into how the impacts of storm surges accumulate in upland coastal ecosystems’ soils and vegetation, explores the relative influence of flooding and salinity on the magnitude of change, and will be a crucial reference to improve our models of understudied coastal ecosystems.


How to cite: Bond-Lamberty, B., Doro, K., Hopple, A., McDowell, N., Morris, K., Myers-Pigg, A., Pennington, S., Phillips, E., Regier, P., Srinivasan, R., Stearns, A., Ward, N., Bailey, V., and Megonigal, J. P.: An ecosystem-scale flooding experiment to disentangle mechanisms of coastal forest resilience and vulnerability to extreme flooding events , EGU General Assembly 2025, Vienna, Austria, 27 Apr–2 May 2025, EGU25-14277, https://doi.org/10.5194/egusphere-egu25-14277, 2025.

EGU25-14369 | ECS | Posters on site | BG3.5

The Development of Global GPP and ET Products of Enhanced BESS Model Derived from GCOM-C SGLI Datasets 

Shuai Shao, Misaki Hase, and Kazuhito Ichii

Remote sensing-based global carbon flux and water products have gained worldwide prominence due to their feasibility to capture spatial patterns, interannual variability and long-term trend of ecosystem carbon and water dynamics from landscape to global scales. The Breathing Earth System Simulator (BESS), a sophisticated coupled process-based diagnostic terrestrial model, integrates multiple physical and bio-geological processes, including atmospheric transfer, canopy radiative transfer, and soil system. BESS has demonstrated robust performance across temporal and spatial scales from 1982 to 2019 when equipped with MODIS Atmosphere and Land products. This study aims to produce global gross primary productivity (GPP) and evapotranspiration (ET) products from 2018 to 2024 using the BESS model, utilizing datasets such as land surface temperature (LST), albedo, leaf area index (LAI), and shortwave radiation (SWR) from the GCOM-C SGLI satellite. Operated by JAXA, Japan, GCOM-C SGLI provides medium spatial resolution (250 m to 1 km) and an 8-day temporal resolution, offering improved sensor stability compared to BESS’s default inputs from MODIS datasets. The main results of this study are: (1) The initial GPP and ET outputs showed fine showed fine linear relations with measurements of GPP (R2 = 0.56), and ET (R2 = 0.45) from 300 collected global flux sites from Fluxnet Ameriflux, Ozflux, Asiaflux; (2) Interannual variations from in response to climate extremes were captured, such as the 2020 Russian heatwave and the 2022 extreme dry summer in southwestern China. (3) From a sensitivity analysis of 21 BESS input parameters, 8 were selected and optimized using the Distributed Alternating Direction Method of Multipliers (D-ADMM), resulting in improved performance with GPP (R² = 0.81) and ET (R² = 0.72). Our GPP and ET products (250m and 1km) will be soon released on the JAXA website, aiming to improve better understanding of global climate and carbon cycle changes.

How to cite: Shao, S., Hase, M., and Ichii, K.: The Development of Global GPP and ET Products of Enhanced BESS Model Derived from GCOM-C SGLI Datasets, EGU General Assembly 2025, Vienna, Austria, 27 Apr–2 May 2025, EGU25-14369, https://doi.org/10.5194/egusphere-egu25-14369, 2025.

EGU25-14398 | Posters on site | BG3.5

Modelling solar-induced chlorophyll fluorescence (SIF) with terrestrial biosphere model QUINCY  

Tea Thum, Tristan Quaife, Greg Duveiller, Marika Honkanen, Hannakaisa Lindqvist, Troy Magney, Zoe Pierrat, and Sönke Zaehle

Satellite observations provide unique opportunities for the development and evaluation of terrestrial biosphere models (TBMs). Solar-induced chlorophyll fluorescence (SIF) is one of the remotely sensed variables that is directly related to photosynthetic activity. Chlorophyll fluorescence (ChlF) is one of the pathways for the absorbed radiation within leaves, along with photochemistry and non-photochemical quenching (NPQ). However, the relationship between photosynthesis and ChlF depends on environmental conditions and on the level and saturation of NPQ. Therefore having a process-based representation of SIF within a TBM will help to fully exploit the data stream available from the remote sensing in carbon cycle studies.


We have implemented a leaf-level model of ChlF in the QUINCY ('QUantifying Interactions between terrestrial Nutrient CYcles and the climate system') TBM. Based on a previous study testing different alternatives for describing the radiative transfer of SIF, we used a radiative transfer model L2SM (developed by T. Quaife) for the SIF signal. Observed leaf level SIF spectra were used to convert the model output to observed units.


As data sources we used satellite observations of the SIF from TROPOMI as well as data products using previous satellite missions and machine learning that go further back in time, as the TROPOMI observations begin in 2018. We extracted satellite observations at the carbon dioxide (CO2) flux tower sites in different ecosystems and used these satellite SIF observations, along with gross primary production (GPP) from the flux observations to evaluate and improve our model. Since the footprints of flux towers are different from TROPOMI observations, we focus on flux towers located in homogeneous landscapes.  We emphasize the use of data from research infrastructures,  such as ICOS, because they have up-to-date data coverage. In addition, we used some in situ tower-based SIF observations.


According to our results, the formulation of NPQ required different parameterizations for sustained NPQ in different temperature regimes and we also tested a new formulation for NPQ in drought conditions. The magnitude of the simulated SIF signal was too high at evergreen conifer sites when compared to the in situ -observations but it was at a similar level to the satellite observations. The seasonal cycle of grassland phenology was off in the model and satellite SIF provided another data stream to work on improving it. Satellite-based SIF proved to be a useful addition for model development and having a process-based representation for SIF enhances its usefulness.

How to cite: Thum, T., Quaife, T., Duveiller, G., Honkanen, M., Lindqvist, H., Magney, T., Pierrat, Z., and Zaehle, S.: Modelling solar-induced chlorophyll fluorescence (SIF) with terrestrial biosphere model QUINCY , EGU General Assembly 2025, Vienna, Austria, 27 Apr–2 May 2025, EGU25-14398, https://doi.org/10.5194/egusphere-egu25-14398, 2025.

EGU25-14894 | Posters on site | BG3.5

Global change experiments in mountain ecosystems: A systematic review 

Georg Niedrist, Harald Crepaz, Roberta Bottarin, Julia Seeber, Veronika Fontana, Chiara Paniccia, Ulrike Tappeiner, Nikolaus Obojes, Michael Steinwandter, Elia Guariento, Andreas Hilpold, and Matteo Dainese

Mountain ecosystems are particularly sensitive to global change and are therefore often used as early warning systems while providing essential ecosystem services. For this reason, researchers aim to understand how these ecosystems develop under climate change. While focus increased in the last decades, mainly due to manipulation experiments, our understanding of how these ecosystems respond to environmental changes remains fragmented. In this study we systematically reviewed 767 manipulation experiments on global change effects in mountain environments over the past three decades, analyzing 3082 ecological responses across different organizational levels. Temperature manipulation was the most common experiment type (45% of studies), showing strong effects on plant phenology, soil respiration, and nutrient cycling. Water availability significantly impacted productivity and carbon cycling, while nutrient manipulations altered community composition and biomass production. Plant responses dominated the research (71% of studies), showing species-specific adaptations to warming. Soil microbial communities exhibited significant responses to warming, affecting decomposition processes and nutrient availability. However, critical knowledge gaps remain. Experimental studies on adult trees in tropical and boreal regions are scarce, and animal responses, biotic interactions, and aquatic environments require more attention. Furthermore, most experiments (73%) were short-term, with a duration under 5 years and focused on single factors, limiting our understanding of long-term and interactive effects. A network of standardized experiments across mountain regions, combining different research methods and collaboration between research groups, could address these gaps.


How to cite: Niedrist, G., Crepaz, H., Bottarin, R., Seeber, J., Fontana, V., Paniccia, C., Tappeiner, U., Obojes, N., Steinwandter, M., Guariento, E., Hilpold, A., and Dainese, M.: Global change experiments in mountain ecosystems: A systematic review, EGU General Assembly 2025, Vienna, Austria, 27 Apr–2 May 2025, EGU25-14894, https://doi.org/10.5194/egusphere-egu25-14894, 2025.

EGU25-15554 | ECS | Posters on site | BG3.5

Nitrogen nutrition effects on δ13C of plant respired CO2 are mostly caused by concurrent changes in organic acid utilization and remobilization 

Yang Xia, Julie Lalande, Franz Badeck, Cyril Girardin, Camille Bathellier, Gerd Gleixner, Roland Werner, Shiva Ghiasi, Chantal Fresneau, Guillaume Tcherkez, and Jaleh Ghashghaie

     In the short- or mid-term, the variation of leaf-respired δ13CO2 has important consequences for δ13C of CO2 in air in terrestrial ecosystems. Therefore, the isotope composition of plant respired CO2 is of crucial importance for understanding plant and ecosystem carbon balance. It has previously been shown in tobacco (Nicotiana tabacum) that the balance between ammonium and nitrate has an influence on δ13C of leaf-respired CO2. However, uncertainty remains as to whether (i) the effect of N nutrition is observed in all species, (ii) N source also impacts on respired CO2 in roots, and (iii)  there is a relationship or equation predicting δ13C of respired CO2 that can be applied regardless of N conditions and species, this uncertainty represents a hurdle in plant 13C budget modelling.

     Here, we carried out isotopic measurements of respired CO2 and various metabolites using two species (spinach, French bean) grown under different NH4+:NO3- ratios. Both species showed a similar pattern, with a progressive 13C-depletion in leaf respired CO2 as the ammonium proportion increased, while δ13C in root-respired CO2 showed little change. Supervised multivariate analysis showed that δ13C in respired CO2 was mostly determined by organic acid (malate, citrate) metabolism, in both leaves and roots. We then took advantage of non-stationary, two-pool modelling that explained 73% of variance in δ13C in respired CO2. It demonstrates the critical role of the balance between the utilization of respiratory intermediates and the remobilization of stored organic acids, regardless of anaplerotic bicarbonate fixation by phosphoenolpyruvate carboxylase and the organ considered.

How to cite: Xia, Y., Lalande, J., Badeck, F., Girardin, C., Bathellier, C., Gleixner, G., Werner, R., Ghiasi, S., Fresneau, C., Tcherkez, G., and Ghashghaie, J.: Nitrogen nutrition effects on δ13C of plant respired CO2 are mostly caused by concurrent changes in organic acid utilization and remobilization, EGU General Assembly 2025, Vienna, Austria, 27 Apr–2 May 2025, EGU25-15554, https://doi.org/10.5194/egusphere-egu25-15554, 2025.

EGU25-15673 | Posters on site | BG3.5

Understanding interactions between deadwood decay, fungal communities and saproxylic insects based on novel field experiments 

Mathias Neumann, Maximilian Böhm, and Sebastian Schmid

Deadwood is an important and large carbon pool in unmanaged forests and will become more important in managed forests, as changes in forest management and/or more frequent disturbances will likely lead to higher deadwood amount in Central European forests. Future deadwood dynamics can be currently not accurately assessed due to lack of a conceptual understanding and data on deadwood carbon stocks, carbon fluxes, importance of fungi for deadwood decay and the habitat value of deadwood. In an upcoming 3-year project funded by the Austrian Science Fund, abbreviated with DD FOR, the project team will introduce a conceptual understanding of deadwood dynamics during its observable lifetime from deadwood creation to fragmentation and incorporation into the soil. DD FOR will utilize field experiments of deadwood decay spanning Central European temperature and precipitation gradients (~3-8 °C average annual temperature, ~700-1700 mm annual precipitation sum). The field experiments will focus on important tree species in Central Europe (e.g. Picea abies, Pinus sylvestris, Fagus sylvatica, Quercus sp.). For selected deadwood pieces we will conduct monitoring of saproxylic insects using suitable traps and quantify the fungal communities using wood samples, fruiting body inventories and state-of-the-art analytical methods, including meta bar-coding. This will establish decay rate benchmarks for fungal species, depending on climate and their host species.

We hypothesis that temperature is the main driver of deadwood decay and that moisture modulates decay with implications on fungal communities and insect habitat quality. Presence and diversity of saproxylic insects may explain variation in fungal diversity, not explained by site or stand conditions. Pilot studies suggest that (1) novel techniques are needed to quantify properties of well-decayed deadwood, including drill-resistance tools and moisture sensors, (2) deadwood position and deadwood treatment affects deadwood decay and (3) permanent plots are valuable assets and can serve as field labs for understanding deadwood dynamics. Results of DD FOR will assist deadwood-focused forest management and better consideration of deadwood in greenhouse gas reportings.

Literature
Neumann, Mathias, Sebastian Echeverria, and Hubert Hasenauer. 2023. “A Simple Concept for Estimating Deadwood Carbon in Forests.” Carbon Management 14(1):1–12. doi: 10.1080/17583004.2023.2197762.

Neumann, Mathias, Clemens Spörk, and Hubert Hasenauer. 2023. “Changes in Live and Deadwood Pools in Spruce-Fir-Beech Forests after Six Decades of Converting Age Class Management to Single-Tree Selection.” Trees, Forests and People 12(January):100382. doi: 10.1016/j.tfp.2023.100382.

Kušar, Gal, and Mathias Neumann. 2024. “Patterns of Deadwood Volume and Dynamics in Slovenian Forests.” Acta Silvae et Ligni 133:1–12. doi: 10.20315/ASetL.133.1.

How to cite: Neumann, M., Böhm, M., and Schmid, S.: Understanding interactions between deadwood decay, fungal communities and saproxylic insects based on novel field experiments, EGU General Assembly 2025, Vienna, Austria, 27 Apr–2 May 2025, EGU25-15673, https://doi.org/10.5194/egusphere-egu25-15673, 2025.

EGU25-16272 | ECS | Posters on site | BG3.5

From Semi-Mechanistic Model to Explainable Machine Learning: A New Approach to Evapotranspiration Estimation 

Subhrasita Behera and Debsunder Dutta

Accurate estimation of evapotranspiration (ET) is critical for understanding the terrestrial water and energy cycles, especially under the context of climate change and its impact on vegetation dynamics. Traditional semi-mechanistic models often struggle to accurately capture ET variability due to uncertainties in parameterizations and assumptions about vegetation responses to environmental drivers. In this study, we leverage the potential of machine learning (ML) models to improve ET estimation by integrating key biophysical and environmental variables: solar-induced chlorophyll fluorescence (SIF), photochemical reflectance index (PRI), and vapor pressure deficit (VPD). These variables provide a direct and dynamic representation of vegetation activity and environmental stress. Our results show that ML models outperform semi-mechanistic models in capturing ET dynamics across diverse spatial and temporal scales. Using explainable machine learning techniques, we further interpret the ML model's performance by identifying the relative importance of input variables and their interactions. SIF emerges as a dominant predictor, providing direct insights into photosynthetic activity and stomatal conductance. VPD is also shown to play a critical role, highlighting its influence on atmospheric demand for water. PRI contributes by offering a proxy for photoprotective mechanisms, which are crucial under stress conditions. The comparative analysis underscores the limitations of semi-mechanistic models in capturing non-linear relationships and rapid responses. Explainable ML techniques reveal that the improved performance stems from the ML model's ability to account for complex, non-linear interactions between variables and dynamically adjust to changing conditions. The findings have significant implications for hydrological modeling, water resource management, and climate change impact assessments.

How to cite: Behera, S. and Dutta, D.: From Semi-Mechanistic Model to Explainable Machine Learning: A New Approach to Evapotranspiration Estimation, EGU General Assembly 2025, Vienna, Austria, 27 Apr–2 May 2025, EGU25-16272, https://doi.org/10.5194/egusphere-egu25-16272, 2025.

Canopy structural and leaf photosynthesis parameterizations such as maximum carboxylation capacity, slope of the Ball–Berry stomatal conductance model, leaf area index, leaf chlorophyll content and canopy height are crucial for modelling plant physiological processes and canopy radiative transfer. These parameterizations also represent the largest sources of uncertainty in predictions of mass and energy exchange across ecosystems. While gradient-based inversion methods are commonly used, they often lack accuracy due to their susceptibility to becoming trapped in local minima. Stochastic approaches on the other hand alleviate this problem but they suffer the disadvantage of being computationally intensive, requiring substantial computing power to explore the full parameter space. Additionally, many process based models exhibit high nonlinearity and discontinuities, making gradient computation challenging. We propose an optimal moving window inversion framework based on genetic algorithms, using the Soil Canopy Observation Photochemistry and Energy Fluxes (SCOPE 2.0) model to constrain key ecosystem parameters. This inversion framework incorporates constraints from observed turbulent and energy fluxes, as well as net outgoing radiation and spectral reflectance, to narrow the parameter search space. Results from several ecosystems showing the advantage of this method featuring both C3 and C4 photosynthetic pathways under stressed and unstressed conditions will be presented. Further, the potential of this approach to address parameter equifinality issues commonly encountered when optimizing multiple parameters will also be discussed.

How to cite: Dutta, D. and Biswas, S.: Optimizing Ecosystem Parameterization Using Genetic Algorithm: Addressing Uncertainties and Equifinality in Modeling Plant Physiological Processes and Canopy Radiative Transfer, EGU General Assembly 2025, Vienna, Austria, 27 Apr–2 May 2025, EGU25-16276, https://doi.org/10.5194/egusphere-egu25-16276, 2025.

EGU25-16670 | Posters on site | BG3.5

ECOSENSE: Assessment of spatiotemporal dynamics in ecosystem processes and fluxes by smart autonomous sensor networks 

Christiane Werner, Simon Haberstroh, and Ulrike Wallrabe and the ECOSENSE Team

Compound events, such as the co-occurrence of heat and drought, have increasingly impacted European forests in recent years, though with a large spatial variability. To date, we still lack a mechanistic understanding of the complex interactions in the soil-plant-atmosphere system at different spatiotemporal scales, which drive the response of ecosystems and the tree individuals therein to stressors, such as heat or drought. Currently, there is a lack of appropriate measurement, data and modelling tools to fully capture relevant processes and their dynamics at different spatiotemporal scales in real time, especially at remote sites with limited access or power availability. Thus, there is an urgent need for novel sensor networks, which are mobile, easy deployable, cost-efficient and energy autonomous. At the interface of environmental and engineering science, the interdisciplinary project ECOSENSE (Werner et al. 2024) tackles these challenges to develop a new versatile, distributed and intelligent sensor network to measure carbon and water fluxes and stress responses (such as volatile organic compounds (VOCs) and chlorophyll fluorescence) at high temporal dynamics in forests. With this new ECOSENSE Toolkit, we will open new opportunities for a rapid assessment of spatiotemporal ecosystem processes in the face of climate change.

The ECOSENSE Toolkit is currently being developed and tested in a mixed European Beech and Douglas Fir forest in SW-Germany with three canopy access towers and an eddy covariance system at 46 m height. Continuous measurements of CO2, H2O and VOC fluxes from soils, stems, leaves and atmosphere are conducted at different spatiotemporal scales since March 2024. Additionally, stress responses are captured by leaf and remotely sensed chlorophyll fluorescence. Novel sensors and sensor networks are continuously developed, tested, and finally integrated into the existing measurement infrastructure, such as a novel, light-weight cuvette for continuous leaf-level gas exchange and volatile organic compound emission measurements.

Reference:

Werner C, Wallrabe U, Christen A, Comella L, Dormann C, Göritz A, Grote R, Haberstroh S, Jouda M, Kiese R, Koch B, Korvink J, Kreuzwieser J, Lang F, Müller J, Prucker O, Reiterer A, Rühe J, Rupitsch S, Schack-Kirchner H, Schmitt K, Stobbe N, Weiler M, Woias P, Wöllenstein J (2024). ECOSENSE - Multi-scale quantification and modelling of spatio-temporal dynamics of ecosystem processes by smart autonomous sensor networks. Research Ideas and Outcomes 10: e129357. https://doi.org/10.3897/rio.10.e129357

How to cite: Werner, C., Haberstroh, S., and Wallrabe, U. and the ECOSENSE Team: ECOSENSE: Assessment of spatiotemporal dynamics in ecosystem processes and fluxes by smart autonomous sensor networks, EGU General Assembly 2025, Vienna, Austria, 27 Apr–2 May 2025, EGU25-16670, https://doi.org/10.5194/egusphere-egu25-16670, 2025.

EGU25-17161 | ECS | Orals | BG3.5

Changed Root Dynamics in a Mature Temperate Forest Under Elevated CO2 

Grace Handy, Marie Arnaud, Adriane Esquivel-Muelbert, Imogen Carter, Angeliki Kourmouli, Carolina Mayoral, and A. Rob Mackenzie

Tree roots adapt their morphological, physiological and biochemical functional traits to optimise nutrient acquisition, notably in response to global changes. Therefore, it is hypothesized that, to increase nutrient acquisition under elevated CO2 (eCO2) to sustain productivity, trees will allocate more carbon assimilates into their root systems. As fine roots are thought to represent ~1/3 of global NPP, understanding how much of the additional carbon (C) introduced into the forest ecosystem by increased photosynthesis is allocated belowground, will improve the accuracy of coupled biosphere-atmosphere models and our understanding of future global C budgets.

We assess the effect of eCO2 on the biomass, morphology, depth distribution and turnover of fine roots of 180-year-old English Oak trees in years 4-7 of an ongoing study (2017-2031) at the Birmingham Institute of Forest Research free air carbon dioxide enrichment (BIFoR FACE) experiment. BIFoR FACE is currently the only experiment in a mature temperate forest simulating the CO2 concentrations predicted to be the 2050 planetary norm (+150ppm above ambient). For ambient and eCO2 treatments, 1-metre soil cores were used to assess fine root standing stock, morphology (length, diameter and specific root length (SRL)) and depth distribution. A minirhizotron camera was used to assess fine root production, mortality and turnover across 2 years.

There was >40% more fine root biomass under eCO2 in all depth profiles down to 50cm, driven by an increase in fine root length. This displays how more carbon assimilates were allocated to the fine root systems of this mature, temperate forest under eCO2. Below 50cm the roots were longer and thinner under eCO2, showing how an increase in the available surface area of the root system for nutrient uptake is achieved through a shift in morphology alongside an increase in standing stock. Contrary to our expectation, the distribution of fine root biomass did not shift to greater depths under eCO2. Long-term minirhizotron data shows strong seasonal cycles in fine root production and mortality, modulated by eCO2.

How to cite: Handy, G., Arnaud, M., Esquivel-Muelbert, A., Carter, I., Kourmouli, A., Mayoral, C., and Mackenzie, A. R.: Changed Root Dynamics in a Mature Temperate Forest Under Elevated CO2, EGU General Assembly 2025, Vienna, Austria, 27 Apr–2 May 2025, EGU25-17161, https://doi.org/10.5194/egusphere-egu25-17161, 2025.

EGU25-17792 | Orals | BG3.5

Rising dissolved inorganic carbon in Alpine rivers evidence enhanced soil respiration driven by climatic warming over the past decades 

Frank Hagedorn, Timo Rhyner, Florian Storck, Alexander Brunmayr, Roman Flury, Luisa Minich, Jürg Zobrist, and Timothy Eglinton

Anthropogenically-induced climate change is rapidly altering Earth’s carbon cycles. However, information on long-term and large-scale responses of soil respiration—a key process releasing CO₂—remains limited. Soil CO₂ production, driven by rhizosphere and microbial respiratory activity, is inherently temperature sensitive. Yet, thermal adaptation, substrate depletion and other constraints such as drought may dampen responses to climate warming. Assessing soil respiration at broader temporal and spatial scales is hampered by its high variability and the labor-intensive nature of CO₂ flux measurements. Consequently, evidence for longer-term enhancement of soil respiration in response to ongoing climatic warming remains scarce.

Here, we analyze 50-year long records of dissolved inorganic carbon (DIC) from Swiss rivers draining Alpine catchments to infer long-term and large-scale responses of soil CO₂ production. Riverine DIC flux originates from CO₂ dissolved in water, with approximately half derived from belowground respiratory activity and the remainder released through weathering processes. Our radiocarbon and stable isotope analyses confirm these sources in Swiss rivers.

Long-term records from the Swiss national river surveillance program reveal that average DIC concentrations in rivers draining the Swiss Alps (Rhine, Inn, Ticino) have increased by 1.6% per decade since the 1980s. This decadal-scale rise in DIC concentrations correlated significantly with the increase in water temperatures by approximately 1.3°C in this period. The DIC increase is not linked to multi-annual variations in river discharge, which drive interannual variability. Analyzing the relationship between discharge and DIC concentrations shows that, for a given discharge, DIC concentrations in the Rhine, Inn, and Ticino have increased in recent decades compared to levels observed in the 1980s and 1990s.

Export of DIC by Swiss rivers only accounts for approximately 2% of the CO2 released from Swiss ecosystems. Nevertheless, the decadal-scale increase in DIC indicates that CO2 production in the soil must have increased. The DIC increase occurred despite a decreasing CO₂ solubility with rising water temperatures. Linking the observed DIC increase to the warming of 0.35°C per decade yields a temperature dependency (Q₁₀) of 2.2. This aligns with values from annual monitoring efforts and short-term soil warming studies across Swiss ecosystems, ranging between 2.3 and 5.3. Our finding indicates a sustained, large-scale stimulation of soil respiration in Alpine environments driven by climate warming, with little thermal adaptation over decadal timescales.

How to cite: Hagedorn, F., Rhyner, T., Storck, F., Brunmayr, A., Flury, R., Minich, L., Zobrist, J., and Eglinton, T.: Rising dissolved inorganic carbon in Alpine rivers evidence enhanced soil respiration driven by climatic warming over the past decades, EGU General Assembly 2025, Vienna, Austria, 27 Apr–2 May 2025, EGU25-17792, https://doi.org/10.5194/egusphere-egu25-17792, 2025.

EGU25-19204 | Posters on site | BG3.5

Does visually assessed sapwood depth lead to an underestimation of whole tree water use calculations for sessile oak? 

Timo Gebhardt, Benjamin D. Hesse, David Dluhosch, Thorsten E.E. Grams, and Peter Annighöfer

Forest ecosystems face considerable long-term risks in the context of escalating drought and rising temperatures. Consequently, studies examining the water balance of individual trees and entire forest stands are imperative to assess potential impacts and explore potential silvicultural strategies to mitigate the effects of climate change.

A range of methods have been employed to measure tree sapflow density (SFD), including TD (thermal dissipation), TTD (transient thermal dissipation), HRM (heat ratio method), and HFD (heat field deformation). Each method comes with advantages and disadvantages. However, when calculating the total water use of trees, two additional variables to SFD must be considered. The first is the conducting sapwood depth, and the second is the xylem sapflow profile, which represents the decrease in SFD from the outer to the inner part of the conductive sapwood. In the case of oak, the literature suggests that the conducting sapwood area/sapwood depth has primarily been determined using the light transmission method in combination with coloration due to the ring-porous properties and the formation of different colored heartwood.

In this study, the HFD method was used to measure the SFD at 1 cm intervals up to a total depth of 7.5 cm in Quercus petraea (Matt.) Liebl. (sessile oak). In addition, the sapwood depth of each tree was assessed via the light transmittance method in combination with heartwood coloring and yielded an average sapwood depth of 2.7 ± 0.6 cm for the measurement trees within a diameter range from 31.5 cm to 42.0 cm. These results are consistent with the results on sapwood depth reported in the literature for various oak species, which indicate and were interpreted with more or less zero sap flow with the beginning of the heartwood. However, the HFD data showed that xylem sapflow extended to an average depth of 5.5 cm with a steep logarithmic decline, but resulting in relative sapflow rates still around 30% at the visual axis between sapwood and heartwood.

Furthermore, both the actual measured sap flow profile and a sapwood depth-based model were used to calculate the whole tree water use. Within a range of daily water use per tree of 6 to 60 L d-1, the calculation based on the measured sap flow profile was on average 19.3 ± 0.6 % higher than with the sapwood-based profile. This daily offset of about 20 % is particularly important when calculating the water use of trees and stands under good weather conditions with high sap flow rates.

How to cite: Gebhardt, T., Hesse, B. D., Dluhosch, D., Grams, T. E. E., and Annighöfer, P.: Does visually assessed sapwood depth lead to an underestimation of whole tree water use calculations for sessile oak?, EGU General Assembly 2025, Vienna, Austria, 27 Apr–2 May 2025, EGU25-19204, https://doi.org/10.5194/egusphere-egu25-19204, 2025.

EGU25-20038 | ECS | Posters on site | BG3.5

The Impact of Understory Presence on Soil CO2 Flux Dynamics in Temperate Forests 

Minseop Jeong, Gayoung Yoo, and Jeehwan Bae

Understory with forest floor, which constitutes the canopy structure in temperate forest, plays a significant role in carbon cycle through various mechanisms. It alters soil environmental conditions and microbial dynamics, both of which contribute to soil CO2 fluxes. By increasing carbon input to the forest floor, the understory promotes the formation of thicker litter layers, which in turn modify soil CO2 flux through direct and indirect pathways. Despite its importance, field-based studies examining the effects of understory or litter layers on soil CO2 flux, as well as how these effects vary across seasonal patterns, remain limited. In this study, we conducted both the understory experiment and the litter experiment. The understory experiment aimed to investigate changes in soil CO2 flux and various environmental factors associated with the presence or absence of understory. For this, we setup two treatment sites: one with understory (CU) and the other without understory (CO) in a temperate deciduous forest (Mt. Nam) located in Seoul, South Korea. The litter experiment was designed to evaluate the influence of litter on CO2 flux, soil temperature, and soil water content by manipulating litter depths: no litter (NL), normal litter (Con; 5.5 cm), and double litter (DL; 11 cm) in a temperate urban forest located close to the undestory experiment. Soil CO2 flux, soil temperature, and soil water content were periodically monitored in both experiments. Soil CO2 flux was consistently higher in CU than in CO across all seasons, with increases ranging from 41.9% to 130%. The largest difference was observed in winter (Dec.–Feb.), where soil CO2 flux was 0.22 g C m⁻² day⁻¹ in CO and 0.51 g C m⁻² day⁻¹ in CU. This significant difference in CU was attributed to higher soil temperature (by 0.5 C, Dec.–Feb.).Additionally, soil water content in CU was higher than in CO in all seasons except autumn (Sep.–Nov.), which could be related to deep litter layer. These results from the understory experiment can be attributed to the significantly deeper litter layer in CU compared to CO (p < 0.01). Deep litter layer could reduce the sensitivity of soil temperature to atmospheric temperature fluctuations and decrease soil water evaporation. Supporting this finding, the litter experiment demonstrated that daily mean soil water content was highest in DL followed by Con and NL. Consistently, the litter experiment showed that litter layer contributed 12.6–22.0% to the total CO2 flux from the forest floor. Intergrating the findings from both experiments, we found that the presence of understory increases annual soil CO2 flux by 60.1%. Additionally, increased litter depth influenced by understory could locally enhance the CO2 flux, contributing to the spatial dynamics of carbon cycle in the temperate forest ecosystem. Overall, our results suggest that such changes can significantly influence the dynamics of soil CO2 flux within the temperate forest carbon cycle.

How to cite: Jeong, M., Yoo, G., and Bae, J.: The Impact of Understory Presence on Soil CO2 Flux Dynamics in Temperate Forests, EGU General Assembly 2025, Vienna, Austria, 27 Apr–2 May 2025, EGU25-20038, https://doi.org/10.5194/egusphere-egu25-20038, 2025.

EGU25-135 | Posters on site | BG3.6

Trying to bend the rules: precipitation-productivity relationship in desert grassland 

Scott Collins, Mariah Patton, and Renée Brown

The relationship between precipitation (PPT) and aboveground net primary productivity (ANPP) has intrigued ecologists for decades because of its fundamental importance to the global carbon cycle. Across gradients from grassland to forest, the PPT-ANPP relationship is statistically well-defined and non-linear. Temporal patterns within a site over time, however, are generally weaker than spatial patterns and nearly always linear despite statistical attempts to bend the line. Linear relationships are inconsistent with positive asymmetry occurring when the increase in ANPP in a wet year is greater than the decline in ANPP in a comparably dry year. This led to the double asymmetry model which predicts that non-linear, concave down responses will occur when extreme wet and dry PPT years occur in a time series. Using long-term ANPP data from ambient plots, along with rainfall addition and reduction experiments in a Chihuahuan Desert grassland we tested the hypothesis that extending the range of precipitation would lead to a non-linear relationship between PPT and ANPP as predicted by the double asymmetry model. Based on a historical precipitation calculator for the past 2000 years, our experimental rain addition treatments matched the wettest years in the record, whereas our extreme drought experiments reduced precipitation ~43mm below historic lows. By extending the precipitation gradient to extremes through drought, water and nitrogen addition treatments we found support for the double asymmetry model with one important exception. The response was concave up under high precipitation under nitrogen fertilization. Without N addition, the response under high precipitation was linear. By experimentally extending the range of monsoon precipitation we were able to bend the rules and generate a non-linear PPT-ANPP relationship in this desert grassland, but only when nutrient limitation was alleviated. Because of strong water limitation, dryland ANPP is highly sensitive to year-to-year variability in precipitation. Water limitation under drought and nutrient limitation in wet years govern non-linear responses of ANPP to precipitation variability in this dryland ecosystem.

How to cite: Collins, S., Patton, M., and Brown, R.: Trying to bend the rules: precipitation-productivity relationship in desert grassland, EGU General Assembly 2025, Vienna, Austria, 27 Apr–2 May 2025, EGU25-135, https://doi.org/10.5194/egusphere-egu25-135, 2025.

EGU25-245 | ECS | Orals | BG3.6

The impact of warming on peak-season ecosystem carbon uptake is influenced by dominant species in warmer sites 

Rose Brinkhoff, Nathan Sanders, Jeremiah Henning, Greg Newman, Quentin Read, Maja Sundqvist, Mark Hovenden, Case Prager, Kenna Rewcastle, Lara Souza, Olivia Vought, and Aimee Classen

Climatic warming influences ecosystem-scale carbon fluxes directly via effects on photosynthesis and respiration, and indirectly via effects on the plant community. Here, we report on a 10-year factorial warming and dominant plant species removal experiment established in both a high- and in a low-elevation montane meadow to explore how dominant plants modify the effect of warming on the carbon cycle across space and over time. At low-elevation, warming increased peak-season net carbon uptake in most years, driven by higher primary productivity, but only in plots where the dominant was left intact. Here, net carbon uptake tended to be positive, but was more likely to be negative when the dominant plant was removed, and in dry years. Surprisingly, the high-elevation site was unaffected by the warming and plant removal treatments, suggesting these sites are resistant to these disturbances. Taken together, these results demonstrate that dominant plant species can modify the impacts of warming on carbon fluxes, but show how this influence can vary spatially and temporally. These findings provide insight into when and how abiotic and biotic factors influence ecosystem carbon source/sink dynamics.

How to cite: Brinkhoff, R., Sanders, N., Henning, J., Newman, G., Read, Q., Sundqvist, M., Hovenden, M., Prager, C., Rewcastle, K., Souza, L., Vought, O., and Classen, A.: The impact of warming on peak-season ecosystem carbon uptake is influenced by dominant species in warmer sites, EGU General Assembly 2025, Vienna, Austria, 27 Apr–2 May 2025, EGU25-245, https://doi.org/10.5194/egusphere-egu25-245, 2025.

EGU25-611 | ECS | Orals | BG3.6

A Greening and Browning Atlas of India: Role of diverse global and local drivers 

Dilip Naidu and Jagdish Krishnaswamy

Greening and browning of vegetation of terrestrial ecosystems in response to climate change and its variability, global change, as well as ground anthropogenic drivers, has been widespread across the globe. India is the most populous country with two global biodiversity hotspots, complex monsoonal and other climate systems interacting with diverse biomes.  It is undergoing high rates of land-use change due to development pressures. It also offers a diversity of social-ecological systems with potentially variable responses to climate dynamics and global warming. We investigate the role of climate dynamics in the greening and browning of vegetation, as well as other local and regional drivers. Such interplay between complex local and regional factors on vegetation has implications for both semi-wild and agro-biodiversity, and human well-being linked to ecosystem services. Here, we evaluate how global and local drivers influence the greening and browning trends over the past four decades for the Indian region using GIMMS (1982-2022) and MODIS (2000-2023) data. We used a multi-dimensional vegetation index measured as the mahalanobis distance which captures complex vegetation dynamics and is a better measure of vegetation greening/browning. We find widespread greening (51.3%, 1.65 million sq.km) across India, predominantly in arid and semi-arid regions driven by increase in monsoonal rainfall and change in winter temperatures. Browning of vegetation (13.5%, 0.43 million sq.km) was restricted to some regions, especially Gangetic plains. Interestingly, Gangetic plains showed reversal of trends in vegetation from browning to greening over the past two decades. Rest of the regions (nearly 1.12 million sq.km) showed no major change in vegetation responses despite changes in climate and other factors. Protected areas showed differential rates of greening and browning compared to nearby areas across various biogeozones. An analyses of hotspots of greening revealed the role of factors such as spread of invasive species, woody encroachment in floodplain grasslands, tree plantations and changes in cropping patterns. Importantly, we find that urban areas showed greening within the city centre possibly subsidised by increase in water supply, but outskirts and peri-urban areas showed drastic browning trends due to replacement of vegetated areas by built up land-use. Although greening trends in vegetation provide positive contribution to climate change mitigation, they can have trade-offs with other ecosystem services. Overall, a holistic understanding of such greening and browning trends and its drivers, is vital for climate adaptation, biodiversity conservation, carbon sequestration and sustenance of ecosystem services.

How to cite: Naidu, D. and Krishnaswamy, J.: A Greening and Browning Atlas of India: Role of diverse global and local drivers, EGU General Assembly 2025, Vienna, Austria, 27 Apr–2 May 2025, EGU25-611, https://doi.org/10.5194/egusphere-egu25-611, 2025.

Flash droughts have received widespread attention due to their abrupt onset or swift intensification, which makes it challenging to forecast and prepare for them, hence posing serious impacts on ecosystems, socioeconomic development, and agriculture. Most of the studies deal with conventional drought and lack knowledge of flash drought. To date, how the terrestrial ecosystem responds to flash over India has not been examined. As we know India is an agricultural-based economy, where a large fraction of the population relies on agriculture. In the present study, we have developed a novel method to quantitatively establish the definition of FD using the Aridity Index (AI). The spatiotemporal characteristics, including trends, and the causes of FDs in 25 significant river basins across India between 1981 and 2021 were then examined using this novel methodology. The hydrometeorological conditions were assessed extensively during the study at various flash drought stages. Also, we investigated flash drought's impact on the terrestrial ecosystem. The results show that FDs with rapid intensification are more common in humid areas compared to semi-arid and sub-humid areas. Furthermore, the study shows that in a substantial area of the research area, temperature and precipitation are both important major FD triggers. The differential effects of precipitation and soil moisture serve as FD triggers in some areas, such as the Western Ghats and northeast India. Furthermore, atmospheric aridity can create conditions that are favorable for the occurrence of FDs. It may accelerate the rapid onset of these flash droughts when combined with decreased soil moisture. The terrestrial ecosystem has been found to be extremely vulnerable to flash drought episodes, with the Ganga basin and Southern India exhibiting the most severe responses. Further, a serious decrease in Water Use Efficiency (WUE) and underlying WUE is also observed over some parts of Southern India and Ganga river basin, which indicates the non-resilient nature of the ecosystem towards flash drought conditions. The findings will provide policymakers with helpful information for developing appropriate effective regulations to reduce the effects of FDs on crop production, water scarcity, and allow them to develop proper water resource utilization methods in India.

Keywords: Aridity; Drivers, Flash drought; Drought intensification; Vapor pressure deficit.

How to cite: Poonia, V.: An Innovative Approach to Characterize Intensified Flash Drought Detection and its Impact on Terrestrial Ecosystem across Indian River Bains , EGU General Assembly 2025, Vienna, Austria, 27 Apr–2 May 2025, EGU25-625, https://doi.org/10.5194/egusphere-egu25-625, 2025.

EGU25-987 | ECS | Orals | BG3.6

Drought and successional stage affects leaf and flower phenology 

Kristine Birkeli, Vigdis Vandvik, and Inge Althuizen

Due to climate change there have been major shifts in weather events, with a predicted increase in extreme drought events in Western Norway. These events in combination with land-use change, are putting the red-listed ecosystem coastal heathlands under high pressure. In Norway, there has been a loss of 90% of coastal heathland cover over the last decades, with the remaining 10% being dominated by the mature successional stage.

In recent years, there has been research highlighting how the mature heathlands are vulnerable to drought. This includes a higher input of litter into the system and also less seeds seeds, which are of lower quality when exposed to drought. These results indicate an effect on the leaf and flower phenology of the dominant species in coastal heathlands.

To expand our knowledge, this project has investigated the responses to drought through leaf and flower phenology for the dominating dwarf-shrub species in coastal heathlands; Calluna vulgaris, Empetrum nigrum, Vaccinium myrtillus and Vaccinium vitis-idaea. The project was conducted from April 2023 until May 2024 using the DroughtNet rainout shelters established at Lygra in 2017. This experiment is one of few long term drought experiments in coastal heathlands. Within the site there are 3 successional stages (young, intermediate, mature), with 3 drought treatments (control, 60% and 90% roof coverage), which is replicated by 3, resulting in 27 plots. Within each plot a replica of 5 for each species were subjected to phenology measurements: plant height, branch length and thickness, flowering time, number of flowers, and number, length, and colouration of leaves. 

Our results show an earlier flowering in the mature stage, with less flowers with increasing drought. The number of leaves seems to be less affected by drought, except in the mature stage, where the leaf count is overall lower, especially in the extreme drought treatment (90% roof coverage). Our results build upon previous research and confirms that the older mature successional stage is more sensitive to drought.

How to cite: Birkeli, K., Vandvik, V., and Althuizen, I.: Drought and successional stage affects leaf and flower phenology, EGU General Assembly 2025, Vienna, Austria, 27 Apr–2 May 2025, EGU25-987, https://doi.org/10.5194/egusphere-egu25-987, 2025.

EGU25-1022 | ECS | Posters on site | BG3.6

Changing Global Vegetation-Climate interaction during recent decades  

Rahul Kashyap and Jayanarayanan Kuttippurath

The atmosphere–land interaction is crucial to the climate and earth system through the exchange of energy, water, momentum and carbon among vegetation and atmosphere. In recent times, a great deal of variability in anthropogenic land use along with climate variability has greatly altered the terrestrial biosphere all around the globe. The global vegetation dynamics has garnered substantial attention due to its potential impact on food security, water cycle and terrestrial carbon sinks. The non-climatic factors have a very straightforward and regional impact on vegetation. However, there remains uncertainty regarding the response of the terrestrial ecosystems to climate change as vegetation-climate interactions is very intricate and intriguing. In the recent times, higher temperature (T) and evapotranspiration (ET) accompanied by insufficient precipitation (P) has depleted soil moisture (SM). We find temperature (T) is the dominant driver of global photosynthesis. Across biomes and land cover types, moisture availability (P and SM) is the key climatic control in tropical and arid but T in temperate and cold biomes. For croplands and forests, T is the predominant driver, but P is the key driver for grasses suggests Machine Learning (ML) based Random Forest (RF) model. However, there is decline in the control of temperature on photosynthesis due to saturation of boreal warming-induced greening and increasing dryness stress. The influence of water availability and energy has substantially grown on global photosynthesis. Interestingly, in regions where both increase in energy and decrease in water availability is present, the photosynthetic activity is largely moisture controlled. Therefore, the global photosynthesis is largely driven by moisture ahead of warmth and energy in the drying world.

How to cite: Kashyap, R. and Kuttippurath, J.: Changing Global Vegetation-Climate interaction during recent decades , EGU General Assembly 2025, Vienna, Austria, 27 Apr–2 May 2025, EGU25-1022, https://doi.org/10.5194/egusphere-egu25-1022, 2025.

The severity and frequency of extreme droughts have increased dramatically due to global change, often causing devastating consequences because of their high intensity. Grasslands, which cover approximately 40% of Earth's surface and provide essential resources and services to humanity, are particularly sensitive to changes in precipitation. With models predicting a rising probability of drought events in many regions worldwide, it is increasingly crucial to understand their impacts on grassland ecosystems to accurately assess ecosystem resistance to climate change and predict future ecosystem functionality. While previous studies have shown that extreme droughts often lead to significant declines in grassland productivity, key questions remain unanswered: What are the overarching patterns at larger spatial scales? How do these responses evolve over time? And how do grasslands recover after extreme drought events? To address these questions, we conducted a coordinated, distributed experiment to explore the relationship between productivity sensitivity to drought and mean annual precipitation, the multi-year effects of extreme drought on grassland productivity, and the resilience of productivity in the aftermath of extreme drought.

How to cite: Yu, Q.: The Impacts of Extreme Drought on Grassland Primary Productivity, EGU General Assembly 2025, Vienna, Austria, 27 Apr–2 May 2025, EGU25-1231, https://doi.org/10.5194/egusphere-egu25-1231, 2025.

EGU25-1956 | Posters on site | BG3.6

Evidence for a threshold in ecosystem functioning during an extreme drought in a semi-arid grassland 

Alan Knapp, Greg Tooley, and Melinda Smith

Climate change has intensified the severity and duration of droughts in grasslands globally, increasing the risk of extreme multiyear droughts.  While most grasslands are considered to be resilient to short-term drought, extreme multiyear droughts can have longer-lasting consequences. For instance, full recovery of ecosystem structure after the 1930s central US Dust Bowl drought required 20 years. Due to the rarity of such multiyear droughts, we know little about the influence of drought duration on ecosystem recovery post-drought or the mechanisms influencing recovery. Here, we evaluated the recovery dynamics of carbon uptake (estimated via aboveground net primary productivity, ANPP) in a semi-arid shortgrass steppe ecosystem after 4 vs. 5-years of experimental drought (66% precipitation reduction). We also assessed the influence of post-drought precipitation amounts on recovery by implementing treatments equivalent to 150% of long-term average (LTA) for this site after the drought ended. Non-droughted plots experienced similar treatments.  We observed dramatic differences in recovery in the 150% LTA treatments after four vs. five years of drought, and thus identified a clear threshold in drought duration impacts in this grassland. After four years of drought, C4 grass productivity increased substantially in the first year and fully recovered by the second. In contrast, there has been little to no recovery of C4 grasses after five years of drought. Plant communities in the 5-year drought treatment shifted to dominance by annual (weedy) forbs, with 3-4 times greater ANPP compared to non-droughted plots. This increase in ANPP was likely due to a 20-fold increase in available soil nitrogen in the recovery period. Our results demonstrate the existence of an abrupt threshold in response to drought duration in this grassland. Once this drought duration threshold is crossed, catastrophic changes in vegetation structure, carbon dynamics, and ecosystem recovery ensue.

How to cite: Knapp, A., Tooley, G., and Smith, M.: Evidence for a threshold in ecosystem functioning during an extreme drought in a semi-arid grassland, EGU General Assembly 2025, Vienna, Austria, 27 Apr–2 May 2025, EGU25-1956, https://doi.org/10.5194/egusphere-egu25-1956, 2025.

EGU25-2147 | ECS | Orals | BG3.6

Increasing CO2 seasonal cycle amplitude in the north: analysis with an eco-evolutionary optimality model 

Wenjia Cai, Iain Colin Prentice, and Joram Hooghiem

Land-atmosphere carbon exchanges and feedbacks constitute one of the largest uncertainties in future climate projections. A large increase in the seasonal cycle amplitude (SCA) of CO2 has occurred since the 1950s, especially in northern high latitudes, reflecting enhanced vegetation activity. However, global land-surface and dynamic vegetation models have produced a very wide range of magnitudes for the SCA, and have generally (sometimes drastically) underestimated its increase. We explored the controls of the SCA using a parameter-sparse eco-evolutionary optimality (EEO) model for gross primary production, the ‘P model’, combined with simple, generic representations of plant and decomposer respiration, to simulate seasonal cycles and decadal trends of net ecosystem exchange (NEE). Simulated NEE fields were used to generate near-surface CO2 concentrations with the help of the atmospheric chemistry-transport model TM5. Modelled CO2 SCA and SCA trends were similar to those observed at CO2 monitoring stations in northern high latitudes, outperforming state-of-the-art Earth System Models. Rising CO2 was shown to be the primary driver of increasing SCA. Climate showed a mixed but overall positive impact; however, the influence of climate shifted from positive to negative in the late 1990s, resulting in a slight reduction in SCA amplitude over the satellite era.

How to cite: Cai, W., Prentice, I. C., and Hooghiem, J.: Increasing CO2 seasonal cycle amplitude in the north: analysis with an eco-evolutionary optimality model, EGU General Assembly 2025, Vienna, Austria, 27 Apr–2 May 2025, EGU25-2147, https://doi.org/10.5194/egusphere-egu25-2147, 2025.

The climate crisis is pushing forests to a limit. Modern forest management aims to help forests maintain viability and ecosystem functions and services. However, making appropriate management decisions is difficult since our understanding of the connections between climate variations and detailed tree physiological and phenotypic responses is not well interlinked or well represented in current models. We need to open the black box of physiological and metabolic processes that provide the missing link between environmental and phenotypically observable changes. Once achieved, we can refine and test hypotheses about which processes must be better represented and incorporated into models.

New high-resolution bioanalytical mass spectrometers offer high-throughput metabolite identification and compound- and intramolecular position-specific isotope analysis in the natural isotope abundance range. Changes in the commitment of substrates to metabolic pathways and the activation or deactivation of others alter enzyme-specific isotope effects. This leads to differences in reaction products’ intra-molecular and compound-specific isotope compositions. Substantial intramolecular position-specific isotope information of intermediates of metabolic pathways is integrated into the tree ring chemical compounds, allowing to inversely model metabolic fluxes and pathway commitments. By combining disciplines, such as metabolomics, stable isotope ecology and tree ring research, we can use this “multidimensional isotopic fingerprint” in the tree ring archive to unveil the mechanisms of metabolism-environment interaction on scales ranging from cellular regulation to whole plant resource allocation. This will allow retrospective testing of whether processes such as sink control and stomatal growth optimisation respond to selected environmental drivers and affect tree functioning and whether they are correctly incorporated into models. Hence, deciphering past processes will allow us to reveal insights into the future trajectories of forests.

How to cite: Gessler, A.: What if we could reconstruct tree metabolism and explore how environmental factors influence it through tree rings?, EGU General Assembly 2025, Vienna, Austria, 27 Apr–2 May 2025, EGU25-2529, https://doi.org/10.5194/egusphere-egu25-2529, 2025.

EGU25-4706 | Orals | BG3.6

Biodiversity mitigates drought effects in the decomposer system across biomes 

Junwei Luan, Siyu Li, Yi Wang, and Shirong Liu

Multiple facets of global change affect the Earth System interactively with complex consequences for ecosystem functioning and stability. Simultaneous climate and biodiversity change are of particular concern, because biodiversity may contribute to ecosystem resistance and resilience and may mitigate climate change impacts. Yet, the extent and generality of how climate and biodiversity change interact, remain insufficiently understood, especially for the decomposition of organic matter, a major determinant of the biosphere – atmosphere carbon feedbacks. Decomposition depends on the characteristics and diversity of plant-produced organic matter as the primary energy source, and is further regulated by an astounding diversity of soil organisms ranging from prokaryotes to macro-invertebrates that are organized in highly complex food webs. With an inter-biome experiment, we tested here how biodiversity in the multi-trophic decomposer system drives decomposition in forest ecosystems under drier conditions. Our results show at a relevant spatial scale covering distinct climate zones that forest floor biodiversity across trophic levels has a strong potential to mitigate drought effects on C and N dynamics during decomposition.  Preserving biodiversity at multiple trophic levels contributes to ecosystem resistance and appears critical to maintain ecosystem processes under ongoing climate change.

How to cite: Luan, J., Li, S., Wang, Y., and Liu, S.: Biodiversity mitigates drought effects in the decomposer system across biomes, EGU General Assembly 2025, Vienna, Austria, 27 Apr–2 May 2025, EGU25-4706, https://doi.org/10.5194/egusphere-egu25-4706, 2025.

EGU25-6305 | ECS | Posters on site | BG3.6

A Process-Cognizant Remote Sensing Model for Subtropical Vegetation Drought in the Hunan-Jiangxi Region, China 

Zhimei Zhang, Zhijun Jiao, and Lixin Wu

In the context of global climate warming, the rising temperatures have triggered a surge in both the frequency and severity of drought in subtropical regions. Consequently, extensive vegetation mortality has emerged, posing a substantial threat to vegetation ecosystems. Accurate quantification and understanding of vegetation drought are imperative for regulating vegetation mortality rates of drought events. However, controversy persists surrounding the precise quantification of vegetation drought. Therefore, the development of timely and effective methods for the accurate monitoring of widespread vegetation drought is of utmost importance. Despite the studies revealing vegetation drought at different temporal and spatial scales, the precise quantification of drought variations among various vegetation covers, as well as within the same vegetation cover, remains unexplored.

In this study, for the precise quantification of "same vegetation cover with different drought degrees" and "same drought degree with different vegetation covers", a vegetation drought response (VDR) module is developed. This module accurately characterizes the spatiotemporal response of vegetation to soil moisture over time, based on spatio-temporal features constructed using the multispectral-based modified vegetation index and land surface temperature. To scientifically define drought boundaries, the study leverages knowledge involving "decreasing soil moisture leading to withering vegetation" and "increasing soil moisture resulting in flourishing vegetation" to identify the time intervals during the vegetation drought process (VDP). Within the VDP intervals, the sensitivity of vegetation response to soil moisture determines the characteristics of VDR in the beginning of drought, which is then utilized to establish the vegetation drought threshold (VDT). By applying the VDT to VDR, the study constructs a process-cognizant vegetation drought model (PCVDM) to achieve a quantitative inversion of vegetation drought. Using the Hunan-Jiangxi region in the central subtropical zone of China as a case study, this research employs remote sensing techniques to quantitatively retrieve the spatiotemporal changes in vegetation drought from 2000 to 2023. Furthermore, it conducts a spatiotemporal differentiation analysis and causation discrimination by integrating altitude and lithology conditions.

The findings of this study highlight the valuable insights on the spatiotemporal dynamics of vegetation drought supported with the PCVDM. The PCVDM can be utilized for remote sensing monitoring of vegetation drought in subtropical regions, enabling the identification of spatial differentiation in vegetation drought in the Hunan-Jiangxi region based on altitude and geological lithology. This study reveals the overall trends in vegetation changes in the Hunan-Jiangxi region since the beginning of this century: areas at higher altitudes (>800m) exhibit increased greenness due to rising temperatures, while lower altitude areas (<200m) experience intensified vegetation drought due to increased evapotranspiration. Meanwhile, moderate altitude areas (~400m) are influenced by the spatial differences in geological lithology, where increased greenness coexists with vegetation drought phenomena.

How to cite: Zhang, Z., Jiao, Z., and Wu, L.: A Process-Cognizant Remote Sensing Model for Subtropical Vegetation Drought in the Hunan-Jiangxi Region, China, EGU General Assembly 2025, Vienna, Austria, 27 Apr–2 May 2025, EGU25-6305, https://doi.org/10.5194/egusphere-egu25-6305, 2025.

EGU25-6970 | Posters on site | BG3.6

Drought severity interacts with duration to erode resistance of terrestrial ecosystem productivity 

Melinda Smith, Timothy Ohlert, Scott Collins, and Alan Knapp and the The International Drought Experiment Network

We quantified the impacts of four years of nominal (within the historic range of variability) and extreme (1-in-100-year recurrence frequency) droughts on aboveground productivity with the International Drought Experiment (IDE), a coordinated, distributed network of 74 grassland and shrubland sites located on six continents across the globe. We expected that aboveground productivity, a key measure of terrestrial ecosystem functioning, would be impacted progressively (i.e., decline over time) as duration and severity of droughts increased. An alternative prediction is that acclimation may occur, whereby – productivity is either maintained or may even recover when drought is prolonged over multiple years. On average across all IDE sites and irrespective of whether drought was nominal or extreme, aboveground productivity declined significantly in the first of year drought, but the magnitude of loss in productivity did not change in years 2 to 4. Thus, we found evidence overall for acclimation to prolonged drought, and a similar acclimation response was observed with prolonged, nominal drought. Yet, when drought was extreme, progressive losses in ecosystem productivity was observed, with the largest losses observed with increasing drought severity in the third and fourth years of drought. Furthermore, the largest losses in productivity (>70%) were observed when drought was extreme for more than two consecutive years. Our results provide evidence for a strong interaction between drought severity and duration. When drought is within the historic range of variability, grassland and shrubland ecosystems have the potential to acclimate, but when extreme, ecosystems that historically were resistant may experience profound losses in functioning over time. This finding has important implications for terrestrial ecosystem functioning in the future, given forecasts for more severe and longer duration droughts with climate change - ecosystems may shift from being resistant to prolonged drought to experiencing catastrophic losses in ecosystem functioning.

How to cite: Smith, M., Ohlert, T., Collins, S., and Knapp, A. and the The International Drought Experiment Network: Drought severity interacts with duration to erode resistance of terrestrial ecosystem productivity, EGU General Assembly 2025, Vienna, Austria, 27 Apr–2 May 2025, EGU25-6970, https://doi.org/10.5194/egusphere-egu25-6970, 2025.

Climate change is expected to increase the frequency, intensity, and duration of droughts in most regions around the world. The ecohydrological response will not occur immediately because it involves changes ranging from rapid physiological change to slower evolutionary and community composition change. Acclimation is the speed by which these phenomena occur while reaching a new state in equilibrium with novel climate conditions. Data show that average aboveground net primary production is relatively more sensitive to changes in average precipitation than when observing the same changes of precipitation in one site. The spatial model relating average production and precipitation represents full acclimation and the temporal model minimum acclimation. Estimating acclimation is critical for predicting the impacts of future climate change and requires an in-depth understanding of its ecohydrological mechanisms. Our long-term experimental drought in the Chihuahuan Desert in the SW provides evidence of the direct and indirect mechanisms driving acclimation. Experimental drought, when lasting less than 4 years, caused immediate reduction in primary production driven by changes in plant ecophysiology and relative species abundance. On the contrary, sustained drought caused changes in species composition that offset the direct effects and reduced the speed of acclimation. Finally, the mechanisms and the rate of acclimation show thresholds highlighting acclimation rate not just as a linear time process but a more complex phenomenon involving multiple scales and discontinuities. Thresholds result from cumulative ecological phenomena, such as reductions in grass tiller density, acting in combination with broad-scale climatic patterns, such as El Niño and the Pacific Decadal Oscillation. 

How to cite: Sala, O. and Maurer, G.: Unexpected indirect effects of field simulated drought offset direct climate-change impacts, EGU General Assembly 2025, Vienna, Austria, 27 Apr–2 May 2025, EGU25-7444, https://doi.org/10.5194/egusphere-egu25-7444, 2025.

EGU25-8346 | Orals | BG3.6

Drought intensity alters nitrogen cycling at the tree and soil interface in Scots pine mesocosms  

Emily F. Solly, Astrid C. H. Jaeger, Matti Barthel, Louise Humbert, Johan Six, Ralf C. Mueller, and Martin Hartmann

More frequent and intense episodes of drought are expected to affect terrestrial nitrogen (N) cycling by altering N transformation rates, the functioning of soil microorganisms, and plant N uptake. However, there is limited empirical evidence of how progressive water loss affects N cycling processes at the plant-soil interface. In this study, we addressed this challenge by employing 15N tracing techniques, and metagenomic analyses of microbial genes involved in N cycling. Our goal was to assess how different levels of soil water availability influence the fate of N derived from decomposing needle litter within a Scots pine saplings and forest soil mesocosm platform. We observed that with increasing water limitation, the release of N from the decomposing needle litter into the soil declined rapidly. However, moderate levels of water limitation barely affected the microbial metagenome associated with N cycling processes and the uptake of N by the saplings. Comparatively, severe levels of water limitation clearly impaired plant N uptake, and increased the prevalence of microbial N cycling genes potentially involved in mechanisms that protect against water stress, as opposed to genes associated with the uptake and release of N during mineralization and nitrification processes. An increased allocation of N to fine roots was further observed under reduced levels of soil moisture, to support the physiology of the saplings and potentially enhance drought resilience. Our study overall indicates that when soil water becomes largely unavailable, the cycling of N at the plant-soil interface is slowed down, and microbial and plant tolerance mechanisms may prevail over N uptake and microbial decomposition processes.

How to cite: Solly, E. F., Jaeger, A. C. H., Barthel, M., Humbert, L., Six, J., Mueller, R. C., and Hartmann, M.: Drought intensity alters nitrogen cycling at the tree and soil interface in Scots pine mesocosms , EGU General Assembly 2025, Vienna, Austria, 27 Apr–2 May 2025, EGU25-8346, https://doi.org/10.5194/egusphere-egu25-8346, 2025.

EGU25-8558 | ECS | Orals | BG3.6

Ecosystem multifunctionality is positively affected by remotely-sensed biodiversity at global eddy covariance sites 

Ulisse Gomarasca, Gregory Duveiller, Javier Pacheco-Labrador, Alessandro Cescatti, Christian Wirth, Markus Reichstein, and Mirco Migliavacca

Biodiversity affects ecosystem functioning by regulating the biogeochemical exchange of carbon, water, energy, and nutrients within and between ecosystems. While this has been proven experimentally, ecosystem-level investigations of the effects of biodiversity on measured biogeochemical processes are understudied.

We leveraged fine-scale remote sensing data from Sentinel-2 to estimate plant diversity at 148 flux network sites across the globe. At these sites, measured eddy covariance fluxes of carbon, water, and energy can be used to compute ecosystem functions and metrics of multifunctionality, i.e. the simultaneous provision of multiple ecosystem functions. We estimated remotely-sensed biodiversity through the entropy-based metric known as Rao Q. To assess the effect of biodiversity on the biogeochemical functioning of ecosystems, we then related Rao Q to the derived ecosystem functions and ecosystem multifunctionality metrics.

Rao Q computed from near-infrared reflectance of vegetation (NIRv) was a major predictor of single ecosystem functions and multifunctionality metrics, highlighting the mostly positive effects of biodiversity on the functioning of ecosystems. Rao Q was generally more important than meteorology and comparable to vegetation structural components in predicting ecosystem functions and multifunctionality. In addition, Rao Q was more important than traditional biodiversity indices of taxonomic diversity measured at a subset of sites in North America where systematic plant species surveys were available. This reinforces the idea that structural and functional diversity, rather than species diversity per se, are key aspects in the worldwide functioning of natural ecosystems.

We provide strong evidence for significant positive effects of a biodiversity-proxy derived from satellite remote sensing measurements on single ecosystem functions and ecosystem multifunctionality. The positive biodiversity effects are robust to the inclusion of most major meteorological and structural parameters that might drive ecosystem functioning or confound the biodiversity-ecosystem functioning relationship. Considering recent and future advances in remote sensing of both diversity and ecosystem functions, our study paves the way to continuous spatiotemporal assessments of the biodiversity-ecosystem functioning relationship at the landscape, regional, and global scales.

How to cite: Gomarasca, U., Duveiller, G., Pacheco-Labrador, J., Cescatti, A., Wirth, C., Reichstein, M., and Migliavacca, M.: Ecosystem multifunctionality is positively affected by remotely-sensed biodiversity at global eddy covariance sites, EGU General Assembly 2025, Vienna, Austria, 27 Apr–2 May 2025, EGU25-8558, https://doi.org/10.5194/egusphere-egu25-8558, 2025.

EGU25-11463 | Orals | BG3.6

Simulating Climate Future: Long-Term Drought Impacts on Mediterranean Ecosystem Structure and Function 

Marcelo Sternberg, Ofer Cohen, and Jaime Kigel

Climate change is profoundly affecting ecosystems globally, increasing the frequency and severity of droughts. The eastern Mediterranean, characterized by high climatic variability and water scarcity, faces critical challenges to biodiversity and ecosystem functionality. This study leverages over two decades of rainfall manipulation experiments at the Matta LTER site in Israel to investigate how Mediterranean ecosystems respond to chronic and extreme drought conditions and altered rainfall patterns.

Experimental treatments included 30% and 66% reductions in annual precipitation, coupled with variations in rainfall distribution, simulated through rainout shelters. Results revealed that the ecosystem demonstrated resistant to moderate drought, with minimal changes in biomass and species diversity under a 30% rainfall reduction. However, extreme drought conditions (66% reduction) significantly impacted aboveground biomass and altered species composition, suggesting the presence of ecological thresholds. The study highlights the importance of soil moisture dynamics, drought-resistant plant traits, and seed bank contributions in maintaining ecosystem functionality under stress.

The findings underline the critical need for long-term monitoring and advanced methodologies, including AI-driven modeling, to identify tipping points and predict ecosystem responses under future climate scenarios. These insights provide valuable guidance for adaptive management strategies to enhance the resilience and sustainability of Mediterranean ecosystems amid accelerating climate change.

How to cite: Sternberg, M., Cohen, O., and Kigel, J.: Simulating Climate Future: Long-Term Drought Impacts on Mediterranean Ecosystem Structure and Function, EGU General Assembly 2025, Vienna, Austria, 27 Apr–2 May 2025, EGU25-11463, https://doi.org/10.5194/egusphere-egu25-11463, 2025.

EGU25-12015 | ECS | Posters on site | BG3.6

Getting to the root of allocation change: identifying allocation trade-offs under drought 

Zishu Tang, Manon Sabot, Tarek-Sebastian El-Madany, Anke Hildebrandt, Jianbei Huang, Richard Nair, Enrico Weber, and Sönke Zaehle

Forest ecosystems in Europe are under a growing threat from recurring drought and heat extremes. Resource acquisition and allocation strategies determine the ability of species to cope with such stresses, so better understanding their variation with the environment is key to forecasting species and forest resilience. Resilience to weather and climate extremes also varies with the efficiency of a plant’s hydraulic transport system, yet limited information is available on how hydraulics influence investments into root, stem, branch, and leaf growth. This calls for an exploration of how plant hydraulic function interacts with carbon allocation over time. Here, we propose a new experimental design for the paired monitoring of above- and belowground carbon allocation and water fluxes in two European oak species (Quercus robur and Quercus cerris) with different drought tolerance levels. The growth and functional status of 52 4-year-old saplings of each species, transplanted in two different soils, are to be recorded between March 2025 and December 2025, including during a 4-month-drought treatment (i.e., stepwise decreased watering until significant canopy damage is achieved). Both root and canopy dynamics (e.g., growth, desiccation/wilting) will be recorded on sub-daily timescales using automated robotic minirhizotrons and measurements of canopy transmittance; dendrometers will monitor stem growth. Diurnal canopy gas exchange and photosynthetic response curves will be measured monthly. Above-ground hydraulic variables and traits (water potential, hydraulic conductance, P50) and non-structural carbohydrates in different organs will be measured periodically, as will synchronous leaf and woody anatomical traits. Taken together, the data gathered in our experiment will form a comprehensive picture of inter-species differences in whole-tree carbon allocation patterns and their hydraulic control under drought.

How to cite: Tang, Z., Sabot, M., El-Madany, T.-S., Hildebrandt, A., Huang, J., Nair, R., Weber, E., and Zaehle, S.: Getting to the root of allocation change: identifying allocation trade-offs under drought, EGU General Assembly 2025, Vienna, Austria, 27 Apr–2 May 2025, EGU25-12015, https://doi.org/10.5194/egusphere-egu25-12015, 2025.

EGU25-13569 | ECS | Orals | BG3.6

Assessing the knowledge base on long-term trends in forest growth, mortality and Water Use Efficiency in Europe using a multi-scale approach 

Caitlin Lewis, Danielle Creek, Nikolaos Fyllas, Mathieu Lévesque, Thomas Pugh, Maurizio Menucuccini, Denis Loustau, Jakub Černý, Klaudia Ziemblinska, Gerbrand Koren, Daniela Dalmonech, Paulina F. Puchi, Mariangela Fotelli, Nikos Markos, Peter Petrík, Carmen Romeralo, Nicola La Porta, Marcin Klisz, and Rossella Guerrieri

The increasing frequency and intensity of extreme climate events threaten the continued provision of forest ecosystem services. Large-scale mortality events and changes in growth and Water Use Efficiency (WUE) in European forest ecosystems have already been observed in response to stressors such as droughts and climate-related outbreaks in tree pests and diseases. Long-term changes in mean temperature and precipitation are also expected to drive forest growth, mortality and WUE in the coming decades. The need for European forest ecosystems to adapt to climate change comes at a time when these ecosystems are still recovering from the impacts of elevated sulphur and nitrogen deposition, with many still exposed to the latter. Sulphur and nitrogen deposition were observed as key drivers of forest growth and mortality in Central Europe in the 1980s, with the impacts on soil chemistry still evident today.  

As part of the WG2 activities in the COST Action CA21138 CLEANFOREST - Joint effects of CLimate Extremes and Atmospheric depositioN on European FORESTs- we are conducting a systematic review on trends in European forest growth, mortality and water use efficiency (WUE). The direction of trends in forest growth, mortality and WUE as observed between 1990-2023 by a range of methods, from dendrochronology, ecosystem fluxes, to remote sensing, were extracted from published literature alongside a wealth of information on forest type and characteristics, covering >1100 observations from  >500 papers.

The produced database provides the opportunity to evaluate agreement between spatial scales and identify needs for integration to understand mechanisms underpinning forest responses to changes in atmospheric deposition and extreme climatic events. We will broadly discuss opportunities to connect existing long-term monitoring networks with new approaches to fill knowledge gaps.

How to cite: Lewis, C., Creek, D., Fyllas, N., Lévesque, M., Pugh, T., Menucuccini, M., Loustau, D., Černý, J., Ziemblinska, K., Koren, G., Dalmonech, D., Puchi, P. F., Fotelli, M., Markos, N., Petrík, P., Romeralo, C., La Porta, N., Klisz, M., and Guerrieri, R.: Assessing the knowledge base on long-term trends in forest growth, mortality and Water Use Efficiency in Europe using a multi-scale approach, EGU General Assembly 2025, Vienna, Austria, 27 Apr–2 May 2025, EGU25-13569, https://doi.org/10.5194/egusphere-egu25-13569, 2025.

EGU25-15519 | Posters on site | BG3.6

Evaluation of water stress modeling methods for estimating gross primary production in Mediterranean grasslands 

Maria P. González-Dugo, Maria J. Muñoz-Gómez, Ana Calbet, Alma Garcia-Moreno, and Ana Andreu

Mediterranean grasslands of southwest Spain and Portugal are a crucial part of the largest agroforestry ecosystem in Europe, known as dehesa in Spain. This multi-use system is recognized to be a balanced combination of environmental and economic values. Grasslands contribute to both aspects, with a high diversity of plant species, providing essential feeding resources for extensive livestock, the primary economic activity in many of these areas. Water availability is the main limiting factor for plant growth in the region, and the production of the grasslands is closely linked to its continental Mediterranean climate, resulting in significant differences in biomass production throughout the seasons and between years. Optimizing grassland management and adapting it to the increase in droughts and extreme events described by climate projections is vital for preserving a healthy and productive ecosystem. Accurate and timely information on grassland productivity is needed at appropriate spatial and temporal scales to meet management requirements.

Light use efficiency (LUE) models link plant growth to incident solar radiation to estimate gross primary production (GPP) or aboveground biomass. The advancements and availability of remote sensing technology have led to a renewed interest in this approach, resulting in extensive research and numerous applications across various land uses, particularly at global or large scales. This study aims to improve the monitoring of grassland productivity by developing a model specifically designed to estimate GPP for this water-controlled and highly variable grassland ecosystem.

Several methods for modeling water stress in LUE models have been compared using a series of CO2 exchange measurements from eddy covariance systems at three sites in southern Spain over eight years. The opportunities and limitations of the different methods are evaluated, and a proposal is presented that effectively balances operativity and accuracy for monitoring grasslands at a high spatial and temporal resolution.

How to cite: González-Dugo, M. P., Muñoz-Gómez, M. J., Calbet, A., Garcia-Moreno, A., and Andreu, A.: Evaluation of water stress modeling methods for estimating gross primary production in Mediterranean grasslands, EGU General Assembly 2025, Vienna, Austria, 27 Apr–2 May 2025, EGU25-15519, https://doi.org/10.5194/egusphere-egu25-15519, 2025.

EGU25-17041 | ECS | Orals | BG3.6

Shade tree root traits in cocoa agroforestry systems are associated with their functional leaf phenology groups 

Issaka Abdulai, Munir Hoffmann, Helena Kahiluoto, Mutez A. Ahmed, Michaela A. Dippold, Richard Asare, and Reimund P. Rötter

Analysing root traits to identify below ground acquisition mechanisms and relating them to above ground traits, such as leaf phenology, can improve the understanding and design of resource use efficiency in drought resilient agroforestry systems. Shade trees play a key role in regulating above and below ground resource use dynamics in agroforestry systems. Specific shade tree functional traits such as leaf phenological development, crown architecture and leaf traits such as specific leaf area and nitrogen content have been related to shade tree impact on productivity, ecosystems service provision and drought resilience of agroforestry systems. Understanding the influence of many different shade tree species on resource use and the productivity outcome resulting from their interaction with cocoa plants have, so far, mainly focused on aboveground traits. Yet, there is an urgent need to put adequate emphasis to the equally important belowground processes, root systems, and root-rhizosphere interactions. Root trait research is significantly limited in tropical communities, constraining understanding of belowground processes and interactions within complex systems such as agroforestry. There is lack of understanding of strategies in belowground resource acquisition among functional groups of shade tree species. In this study, two key roots traits, i.e. fine root length density and fine root diameter of 13 common shade trees species belonging to 6 functional (leaf phenology) groups and cocoa were evaluated under farmer field conditions. Fine root samples were acquired for 4 replicates of each shade tree species through extensive root coring up to 60 cm depth and at three horizontal shade tree impact zones (inner, mid and outer). Scanned sorted shade tree and cocoa plant root images were analysed with WINRHIZO.  All cocoa plants irrespective of their associated shade tree functional group exhibited resource acquisitive (non-conservative) fine root traits, i.e. with higher root length density and smaller diameter. Similarly, shade trees in the ‘brevi deciduous during dry season’ functional group exhibited the notable paradox of leaf flushing during dry season characterized by higher, leaf area-related, water uptake in the dry season exhibited non-conservative root traits. Evergreen and complete deciduous functional groups showed a conservative root trait showing lower fine root length density and larger diameter. Shade trees with conservative root traits are therefore considered complementary to the cocoa plant acquisitive traits, thereby enhancing belowground resource use efficiency and drought resilience in cocoa agroforestry systems.

How to cite: Abdulai, I., Hoffmann, M., Kahiluoto, H., Ahmed, M. A., Dippold, M. A., Asare, R., and Rötter, R. P.: Shade tree root traits in cocoa agroforestry systems are associated with their functional leaf phenology groups, EGU General Assembly 2025, Vienna, Austria, 27 Apr–2 May 2025, EGU25-17041, https://doi.org/10.5194/egusphere-egu25-17041, 2025.

EGU25-17956 | Orals | BG3.6

Extreme press and pulse droughts diversify rooting depth in a semi-natural grassland 

Michaela Zeiter and Andreas Stampfli

In Central Europe extreme summer droughts are becoming more intense while extremely long periods with intermittent drought stress are likely getting extended as sequential precipitation deficits follow one another at shorter intervals with climate warming. Since the effects of long and mild ‘press’ vs. short and intense ‘pulse’ droughts have rarely been directly compared at the same site so far, the interplay between drought duration and intensity is largely unknown. Using precipitation-reduction and precipitation-exclusion shelters consecutively in a Swiss semi-natural grassland we investigated the impacts of a mild but extremely long (4 years) press drought and an extremely intense but short (5 months) pulse drought on species composition and biomass from 2015-2021.
The press drought showed a consistently lower intensity than the pulse drought based on meteorological and soil moisture metrics: treatments resulted in a tenfold smaller average daily water deficit between gains from precipitation and losses from evapotranspiration and a tenfold smaller average daily difference compared to controls in topsoil water potential for the press than for the pulse drought. Contrary, tenfold longer reduction than exclusion of precipitation resulted in higher drought severity based on meteorological, but lower drought severity based on soil moisture metrics: treatments showed a threefold larger cumulative reduction in precipitation, but an eightfold shorter duration of limiting conditions for plant growth (topsoil moisture <−100 kPa) for the press drought than for the pulse drought.
Plant responses to both extreme droughts were not related to precipitation-based, but mirrored soil moisture-based drought severity metrics. Productivity and composition showed higher resistance but lower resilience to the press drought than to the pulse drought. Secondly, the interactions between press and the pulse drought were only faint and overshadowed by additive main effects expressed by species groups that differ in maximal rooting depth. Specifically, press drought had a strong persistent impact on forb coverage and persistently changed the coverage of species that maximally root at medium (50-100 cm) depth, while pulse drought had a strong persistent impact on graminoid coverage and the coverage of species without deep roots.
Thus, the impact of intermittent and intense stress induced by sequential very extreme precipitation-reduction and precipitation-exclusion treatments in a temperate-humid climate was moderated by different plant functional groups supporting the idea that extreme droughts of various intensity and duration contribute to the coexistence of functional groups in semi-natural grassland.

How to cite: Zeiter, M. and Stampfli, A.: Extreme press and pulse droughts diversify rooting depth in a semi-natural grassland, EGU General Assembly 2025, Vienna, Austria, 27 Apr–2 May 2025, EGU25-17956, https://doi.org/10.5194/egusphere-egu25-17956, 2025.

EGU25-18391 | ECS | Posters on site | BG3.6

Characterizing Anthropogenic Modification of Root Zone Storage Capacity 

Vajira Lasantha, Lan Wang-Erlandsson, Juan Rocha, Ruud van der Ent, and Markus Hrachowitz

Vegetation plays a crucial role in regulating the water cycle through transpiration, which is influenced by the root zone storage capacity (SR). SR is dynamically influenced by climate, land use, and vegetation, with ecosystems adapting to environmental changes by modulating SR. Human interventions, such as deforestation, agriculture, and irrigation, significantly alter SR by changing vegetation cover and water availability. This study aims to quantify human-induced modifications to SR at global scale. Through a lens of human domination, we highlight the repurposing of SR and its implications for ecosystem resilience.

A random forest model was developed to estimate SR based on climate, land and vegetation related variables, trained on available present-day estimates of SR derived from process-based methods. By substituting actual vegetation with potential natural vegetation (PNV) and altering climate variables to reflect preindustrial, present, and future conditions, we assess the impact of land use change and climate change on SR.

Under current land use, average SR is approximately 7.5 mm lower than in the PNV scenario, assuming the same climate conditions. In future extreme warming scenarios (RCP8.5), SR requirements are projected to increase from about 136 mm to 243 mm, which is deemed unrealistic, suggesting potential transgression of limits to root zone adaptation in ecosystems.

These findings underscore the significant and widespread anthropogenic modification of root zone storage capacity, and point at risks for ecosystem resilience loss in regions where climate change outpaces adaptive capacity. We call for more systematic and observation-based studies to understand these dynamics better.

How to cite: Lasantha, V., Wang-Erlandsson, L., Rocha, J., van der Ent, R., and Hrachowitz, M.: Characterizing Anthropogenic Modification of Root Zone Storage Capacity, EGU General Assembly 2025, Vienna, Austria, 27 Apr–2 May 2025, EGU25-18391, https://doi.org/10.5194/egusphere-egu25-18391, 2025.

EGU25-19396 | Posters on site | BG3.6

Dynamic nitrogen resorption improves predictions of nutrient cycling responses to global change in a next generation ecosystem model 

Gabriela Sophia, Silvia Caldararu, Benjamin Stocker, and Sönke Zaehle

Nutrient resorption from senescing leaves is a critical process of plant nutrient cycling that can significantly affect plant nutrient status and growth, making it essential for land surface models (LSMs) in order to predict long-term primary productivity. Most models assume leaf resorption to be a fixed value of 50% for nitrogen (N) partially because we lack the knowledge of what drives this process, making it unclear what its implications are when simulating nutrient cycling. Based on our own analysis of global patterns of nutrient resorption from trait data (Sophia et al., 2024), we developed a dynamic scheme of N resorption driven by leaf structure and environmental limitation and implemented it in the QUINCY model. This scheme assumes that all metabolic N is fully mobilizable and available for resorption, representing the maximum resorption capacity for each plant functional type based on the leaf construction costs. Environmental limitations then downregulate the remaining mobilizable nutrients considering soil N availability relative to plant demand, adjusting their internal recycling in face of N stress and leaf C:N ratio. The model performance was validated by comparing the model's predicted values of N resorption against observational data analyzed in Sophia et al., 2024, using spatial-scale measurements of resorption efficiency across diverse plant types and climate zones, as well as gross primary productivity (GPP) observational data from plumber sites (Ukkola, et al., 2022) used for model application. We present the implications of this novel scheme for ecosystem functioning and show that we can improve the plant internal N available to growth with cascading implications for ecosystem nutrient pools and fluxes, better predicting plant and soil nutrient dynamics at steady state and crucially, under elevated CO2 conditions. For the first time, we show the importance of an ecologically realistic representation of nutrient resorption in an LSM and its implication for predicting the future of the terrestrial biosphere.

How to cite: Sophia, G., Caldararu, S., Stocker, B., and Zaehle, S.: Dynamic nitrogen resorption improves predictions of nutrient cycling responses to global change in a next generation ecosystem model, EGU General Assembly 2025, Vienna, Austria, 27 Apr–2 May 2025, EGU25-19396, https://doi.org/10.5194/egusphere-egu25-19396, 2025.

EGU25-19430 | ECS | Orals | BG3.6

Ecosystem resistance to concurrent and propagated soil moisture droughts 

Amitesh Gupta and Karthikeyan Lanka

Soil moisture droughts are defined by the prolonged, abnormally dry conditions in the soil. These extreme dry events directly impact terrestrial ecosystem activities like photosynthesis, biomass production, rehydration, and carbon uptake, which can be monitored at regular intervals using satellite-retrieved different vegetation descriptors such as solar-induced fluorescence, leaf-area index, vegetation optical depth, and gross primary productivity, respectively. While previous studies have primarily focused on the vegetation anomalies during drought and its recovery time, very little attention was put on how the ecosystem resistance can vary in terms of different vegetation descriptors. The resistance is defined as the ratio between the maximum perturbance in vegetation and the time taken to reach it. It can infer which ecosystem activity is more vulnerable to drought events or can persist through such abnormal dry conditions.

Previous investigations have demonstrated that soil moisture droughts are frequently initiated by meteorological droughts at the sub-seasonal-to-seasonal scale. Therefore, the onset of a soil moisture drought event coincides with or succeeds by a meteorological drought. Alongside, a soil moisture drought can also arise due to a , primarily overserved over dryland regions, which depends on the evapotranspiration constraint imposed by the regional soil moisture deficiency. The state of land (dry-down rate) and atmosphere (specific humidity and vapour pressure deficit) differ across these conditions under which the soil moisture drought occurs. Due to this, the expected response of the terrestrial ecosystem under the three scenarios of soil moisture drought would also be different. The current work examines the effects in different vegetation descriptors due to soil moisture droughts occurring under three situations: 1) soil moisture and meteorological droughts co-occurring, 2) delayed onset of soil moisture drought from the onset of meteorological drought, and 3) self-propagating soil moisture droughts. While the concurrence of meteorological and soil moisture drought would be severely devastating for agricultural practices, self-propagated and meteorological drought-driven soil moisture drought could pose a continuous threat to the natural ecosystems. We hypothesise that the anomalies in land-atmosphere conditions during a drought govern the ecosystem resistance. Since the initiation of soil moisture drought could vary, as mentioned earlier, the subsequent resistance by an ecosystem would also differ. In addition, we checked how these associations vary for different vegetation descriptors for different plant-functional types (croplands, grasslands, shrublands, and evergreen, deciduous and mixed forests). Our study encompasses the soil moisture drought events that occurred at a seasonal scale during the period of 2003-2020, which were identified using the GLEAM data. The vegetation descriptors are acquired from multi-satellite sources.

This study will help to infer how land and atmosphere anomalies jointly attribute to the ecosystem state in subsequent times and how much these impacts vary in terms of different vegetation descriptors. A region-specific global-level analysis would also highlight the most vulnerable regions, where a seasonal early-warning system can be designed using the inferences drawn from the current study looking into the land and atmospheric anomalies during a drought event. 

How to cite: Gupta, A. and Lanka, K.: Ecosystem resistance to concurrent and propagated soil moisture droughts, EGU General Assembly 2025, Vienna, Austria, 27 Apr–2 May 2025, EGU25-19430, https://doi.org/10.5194/egusphere-egu25-19430, 2025.

EGU25-20116 | Orals | BG3.6

Implications of plant metabolic source-sink feedbacks for modelling the terrestrial carbon balance 

Andrew Friend, Yizhao Chen, Annemarie Eckes-Shephard, Patrick Fonti, Eva Hellmann, Tim Rademacher, Andrew Richardson, and Patrick Thomas

Dynamic global vegetation models (DGVMs) are used to attribute historical and forecast future atmosphere-land carbon (C) exchange. While mean long-term behaviour across DGVMs is compatible with observational constraints on the global C cycle over recent decades, differences between models are high both in annual fluxes and attribution of the long-term net carbon uptake to drivers such as atmospheric CO2, indicating significant uncertainty regarding process understanding. These models are largely C source-driven, with behaviour primarily determined by the environmental responses of photosynthesis. However, real plants are integrated wholes, with feedbacks between sources (e.g. photosynthesis) and sinks (e.g. growth) resulting in homeostatic concentrations of metabolites such as sugars. An approach to implementing such behaviour in a plant growth model is presented and its implications for responses to environmental factors assessed. The approach uses Hill functions to represent inhibition of C sources (net photosynthesis) and activation of sinks (structural growth) based on sugar concentrations. The model is parameterised for a mature tropical rainforest site and its qualitative behaviour is found to be consistent with experimental observations. Key findings are that sinks and sources strongly regulate each other. For example, doubling potential net photosynthesis (i.e. the rate that would occur without feedback) results in growth increasing by only 1/3 at equilibrium, with increased sugar concentration causing feedback-inhibition of photosynthesis. A C source-only driven response, as in current DGVMs, would result in close to a doubling of growth. Hence, in this approach, environmental factors that affect potential net photosynthesis, such as atmospheric CO2, have greatly reduced effects on growth and net C uptake when homeostatic behaviour of sugars is considered. Implications for understanding and modelling the global carbon cycle are discussed.

How to cite: Friend, A., Chen, Y., Eckes-Shephard, A., Fonti, P., Hellmann, E., Rademacher, T., Richardson, A., and Thomas, P.: Implications of plant metabolic source-sink feedbacks for modelling the terrestrial carbon balance, EGU General Assembly 2025, Vienna, Austria, 27 Apr–2 May 2025, EGU25-20116, https://doi.org/10.5194/egusphere-egu25-20116, 2025.

EGU25-20559 | Orals | BG3.6

Increasing drought recurrence and severity alter legacies on grassland carbon and water fluxes 

Michael Bahn, Jesse Radolinski, Javier García Favre, Bernice Hwang, Marie-Louise Schärer, and Maud Tissink

In a future climate, drought events are expected to become more frequent and severe, with largely unknown consequences for ecosystem functioning. Based on a number of experiments in temperate mountain grasslands we show that drought recurrence, simulated for more than 16 subsequent years, altered the responses of ecosystem productivity and of carbon and water fluxes to subsequent drought. Under future conditions of recurrent drought combined with warming and elevated atmospheric CO2 concentrations, drought severity and its impacts on grassland carbon and water fluxes were further enhanced. Moreover, under such future conditions the movement and storage of water in soil upon post-drought rewetting was substantially altered, with implications for plant water access and use. We conclude that increasing drought recurrence and severity alter their legacies on grassland carbon and water fluxes through changes in species composition as well as changes in soil structure, with cascading consequences for grassland functioning in a future world.

How to cite: Bahn, M., Radolinski, J., García Favre, J., Hwang, B., Schärer, M.-L., and Tissink, M.: Increasing drought recurrence and severity alter legacies on grassland carbon and water fluxes, EGU General Assembly 2025, Vienna, Austria, 27 Apr–2 May 2025, EGU25-20559, https://doi.org/10.5194/egusphere-egu25-20559, 2025.

EGU25-21934 | Posters on site | BG3.6

Quantity and quality of carbon from ash deposits associated with desert fire 

Nancy Grimm, Jack Barendrick, Leah Gaines-Sewell, Julia Grabow, and Tamara K. Harms

Large-scale fire in the desert Southwest was historically rare but is
becoming more common owing to human activity. In June 2020, a large wildfire burned the
eastern half of the Sycamore Creek, AZ watershed, leaving the mainstem and western half
unburned. During storms, which occurred twice during the year of the fire and not again until a
year later, large quantities of ash were transported to the stream and deposited on stream banks
as well as along upland flowpaths. Because up to 70% of this fire-associated carbon transported
during floods was consumed over 21 d, we investigated the properties of the ash, including
amounts of carbon and nutrients leached from the ash, utilization (measured as loss of carbon
across 3- and 21-d incubations), and carbon quality of the DOC leached from the ash and of that
remaining after incubations.
We found that heavy but episodic subsidies of DOC to desert stream ecosystems occur following
fire. Spatial and temporal patterns of rainfall that produced runoff determined the amount of
these subsidies. Ash collected from upland and riparian depositional areas contained measurable
quantities of carbon that were consumed during laboratory incubations with an inoculum of
microbial communities from stream sediments. Leached ash also released inorganic and organic
nitrogen and other materials. These data suggest that catastrophic release of materials during fire,
when transported to desert streams, can support microbial metabolism by enhancing nutrient-
limited primary production or supplying a novel source of organic matter to heterotrophic microbes. 

How to cite: Grimm, N., Barendrick, J., Gaines-Sewell, L., Grabow, J., and Harms, T. K.: Quantity and quality of carbon from ash deposits associated with desert fire, EGU General Assembly 2025, Vienna, Austria, 27 Apr–2 May 2025, EGU25-21934, https://doi.org/10.5194/egusphere-egu25-21934, 2025.

EGU25-968 | ECS | Orals | BG3.7

Impact of Elevated CO2 on Plant Water Stress and Vegetation Productivity in India 

Akash Verma, Sachin Budakoti, Sampelli Anoop, and Subimal Ghosh

Global warming poses significant threats to ecosystems, primarily due to increasing atmospheric CO2 levels. While literature has enhanced our understanding of carbon and water cycle interactions, a critical question remains: how will plants respond to the changing climate? The present study addresses this gap by investigating the critical soil moisture threshold, which signifies plant water stress. Using the Weather Research and Forecasting model coupled with the Noah-MP land surface model, we conducted three simulations over India, the second highest contributor to global greening, for the period 2004-2018: (1) Varying CO2, (2) Fixed CO2 at 2004 (low CO2), and (3) Fixed CO2 at 2022 (high CO2). We identified the critical soil moisture threshold as the point during drydown where vegetation productivity begins to decline due to decreasing soil moisture and increasing vapor pressure deficit, indicating when plants experience stress. Our findings reveal that critical soil moisture threshold has decreased in response to enhanced water use efficiency by plants under elevated CO2, reflecting variations in plant physiology. Despite this, vegetation productivity has declined under elevated CO2 conditions. This can be attributed to the two-way carbon-climate feedback: while increased atmospheric CO2 enhances plant carbon gain by regulating physiological responses such as altering stomatal conductance, it also acts as a radiative forcing agent, driving temperature increases, altering precipitation patterns, and reducing the effectiveness of ecosystems as carbon sinks. This warming effect, coupled with soil moisture deficit and atmospheric aridity, explains the reduction in vegetation productivity. Our study highlights that although plant physiological alterations in response to elevated CO2 are significant, they are insufficient to counteract the warming and drying impacts. Thus, both feedback mechanisms must be considered when analyzing plant responses to changing climate conditions.

How to cite: Verma, A., Budakoti, S., Anoop, S., and Ghosh, S.: Impact of Elevated CO2 on Plant Water Stress and Vegetation Productivity in India, EGU General Assembly 2025, Vienna, Austria, 27 Apr–2 May 2025, EGU25-968, https://doi.org/10.5194/egusphere-egu25-968, 2025.

The eddy covariance (EC) approach is our most advanced technique for measuring mass and energy exchanges on the Earth’s surface. Yet the EC approach cannot close the Earth surface’s energy budget. This problem has puzzled Earth system scientists for many decades. It casts doubt on the reliability of data used to validate Earth system models, and questions whether our current understanding of energy processes in our living environments is complete. We find that the current EC theory ignores the close coupling of mass and total (internal, kinetic, and potential) energy transfer on the Earth’s surface, which leads to simplistic equating of heat energy with enthalpy exchange, formation of misconceived concepts and theories, and misguided measurements of turbulent heat flux. Furthermore, the current EC theory assumes that the ideal gas law, which is valid only under the state equilibrium, is applicable in turbulent flows in open thermodynamic systems. This assumption leads to an inappropriate approach for constraining the mean vertical wind velocity which cannot be measured accurately enough by sonic anemometers, loss of covariance between wind and dry air density, and underestimation of diurnal variations in the mean vertical wind velocity and energy transfer due to mass motion. We propose a new EC theory based on the first principles of physical fluid mechanics and thermodynamics, and demonstrate that surface energy balance closure is much improved with measurements guided by our new EC theory.

How to cite: Gu, L.: A new eddy covariance theory for more accurate mass and energy flux measurements, EGU General Assembly 2025, Vienna, Austria, 27 Apr–2 May 2025, EGU25-2184, https://doi.org/10.5194/egusphere-egu25-2184, 2025.

In the context of global change, desert ecosystems within extremely arid regions, such as the Taklamakan Desert, are confronting severe environmental challenges. This desert is particularly characterized by an annual rainfall of merely 35.1 mm and soils deficient in nutrients, making water and nutrient availability primary limiting factors for vegetation growth. Among the flora in this region, Alhagi sparsifolia, a deep-rooted desert plant, is pivotal for sand stabilization and maintaining the ecological security of oases. This research, conducted through long-term controlled field experiments, delves into the impacts of two critical factors associated with global change—groundwater level and nitrogen deposition—on the survival strategies of A. sparsifolia. The findings indicate that inappropriate groundwater levels, whether excessively deep or shallow, considerably restrict the biomass accumulation in A. sparsifolia. This limitation compels the plant to reallocate biomass among its organs to adapt to environmental stress. Notably, fluctuations in groundwater levels predominantly influence the phosphorus and potassium content within the leaves, while the effects on carbon and nitrogen levels are minimal. The study further reveals that juvenile A. sparsifolia (1-2 years old) respond to groundwater level variations by extensively adjusting their nitrogen, phosphorus, and potassium utilization and recycling strategies. In contrast, older, perennial plants primarily modify their phosphorus and potassium recycling approaches to cope with environmental shifts. Additionally, nitrogen deposition has been found to significantly alter the α-diversity of soil bacteria and the nutrient content of desert plants, underscoring the broader implications of global change. In regions with shallow groundwater, surface nutrients emerge as the most significant environmental factor influencing the nutrient content of A. sparsifolia leaves. Conversely, the impacts of groundwater level, groundwater mineralization, and soil salinity are comparatively minor. These insights highlight the profound effects of global environmental changes on the survival strategies and adaptability of deep-rooted desert plants. This research not only enhances our understanding and predictive capacity regarding the responses of desert plants to global changes in extremely arid regions but also provides a scientific foundation for plant restoration and conservation initiatives in these challenging environments.

How to cite: Zhang, B. and Zeng, F.: Global Change Impacts on Growth Strategies of Deep-Rooted Plants in Hyperarid Deserts, EGU General Assembly 2025, Vienna, Austria, 27 Apr–2 May 2025, EGU25-3394, https://doi.org/10.5194/egusphere-egu25-3394, 2025.

EGU25-3670 | Orals | BG3.7

From Drought Propagation to Dryland Expansion: The Role of Land Feedbacks in Spreading Aridity 

Diego G. Miralles, Akash Koppa, Jessica Keune, and Dominik L. Schumacher

Half a century after Apollo 17's iconic "Blue Marble" photograph, depicting our Earth's life-sustaining hydrosphere, concerns about the future of this hydrosphere have intensified. Climate change is thought to be shifting ecosystems toward drier and more hostile conditions over land, threatening biodiversity and human resilience. Global warming accelerates evaporation, yet precipitation trends remain uncertain, leading to projections of overall desertification and dryland expansion. The IPCC highlights potential catastrophic risks, especially for subhumid ecosystems, and stresses the urgent need for understanding the mechanisms driving this dryland expansion. However, our time series of reliable observations are not sufficiently long to study this slow, creeping process at the global scale with sufficient accuracy. To bridge this knowledge gap, we propose to study the parallels between short-term drought propagation and long-term dryland expansion, hypothesising that the physical mechanisms underlying both are the same.

Specifically, we focus on a critical feedback from drying soils that has proven crucial for drought spatiotemporal propagation: as prolonged dry events decrease land evaporation, both atmospheric humidity and the likelihood of rainfall are further reduced. Simultaneously, drying soils release more sensible heat into the atmosphere, amplifying temperatures, reducing rainfall efficiency and often triggering compound heatwaves. Together, these feedbacks perpetuate drought conditions, reducing rainfall, both locally and downwind, and thus exacerbating droughts' spatial and temporal extent. Using a Lagrangian atmospheric model and four decades of reanalysis data, we confirm that droughts and heatwaves can self-propagate through these land–atmosphere interactions.

Interestingly, this same process may also drive dryland self-expansion over multi-decadal periods. Our findings suggest that nearly half of the 5.2 million km² of humid land that became drylands in the past four decades did so due to dryland self-expansion via land–atmospheric feedbacks. Existing drylands warmed and dried the air flowing towards downwind subhumid regions, decreasing rainfall and increasing potential evaporation there, causing their eventual transition into drylands. These results may help in predicting the broad impacts of dryland expansion, including disruptions to carbon sequestration, nutrient cycling, and land productivity. Identifying self-expansion hotspots enables targeted interventions in land-use and ecosystem management to mitigate dryland growth. Conservation in upwind drylands can slow down this process, while prioritizing vulnerable downwind regions for strategies like restoring vegetation and soil health can preserve their biodiversity and curtail their aridification. Furthermore, our findings highlight the need for improved climate models to predict future ecosystem transitions and emphasize the relevance of land feedbacks to understanding paleoclimatic tipping points.

How to cite: Miralles, D. G., Koppa, A., Keune, J., and Schumacher, D. L.: From Drought Propagation to Dryland Expansion: The Role of Land Feedbacks in Spreading Aridity, EGU General Assembly 2025, Vienna, Austria, 27 Apr–2 May 2025, EGU25-3670, https://doi.org/10.5194/egusphere-egu25-3670, 2025.

EGU25-4000 | ECS | Posters on site | BG3.7

Hybrid-Modeling of Land-Atmosphere Fluxes Using Machine Learning integrated in the ICON-ESM Modeling Framework 

Reda ElGhawi, Christian Reimers, Reiner Schnur, Markus Reichstein, Marco Körner, Nuno Carvalhais, and Alexander J. Winkler

The exchange of water and carbon between the land-surface and the atmosphere is regulated by meteorological conditions as well as plant physiological processes. Accurate modeling of the coupled system is not only crucial for understanding local feedback loops, but also for global scale carbon and water cycle interactions. Mechanistic modeling approaches, e.g., the Earth system model ICON-ESM with the land component JSBACH4, are mainly applied to study land-atmosphere coupling. However, these models are hampered by relatively rigid and ad-hoc formulations of terrestrial biospheric processes, e.g., semi-empirical parametrizations for stomatal conductance, which often result in non-plausible and biased dynamics.

Here, we develop data-driven, flexible parametrizations controlling terrestrial carbon-water coupling based on eddy-covariance flux measurements (FLUXNET) to be implemented in the JSBACH4 model. Specifically, we introduce a hybrid modeling approach (integration of data-driven and mechanistic modeling), that aims to replace specific empirical parametrizations in JSBACH4’s modules computing coupled photosynthesis (gross primary production, GPP ) and transpiration (Etr) fluxes based on a multi-task feed-forward neural network (FNN) modelling approach pre-trained on observations. First, as a proof-of-concept, we train parametrizations based on original JSBACH4 output to showcase that our approach succeeds in reconstructing the original parametrizations, namely latent dynamic features for stomatal conductance (gs), the maximum carboxylation rate (Vcmax) and maximum electron transport rate (Jmax) that decisively control GPP and Etr . Second, we replace JSBACH4’s original parametrizations by dynamically calling the emulator parameterizations trained on original JSBACH4 output using a Python-FORTRAN bridge. This allows us to understand how small changes can propagate over time and enables us to evaluate the effects of data-driven parameterizations on the results produced by the coupled land-surface model. In the last step, we adopt the approach to infer these parametrizations from FLUXNET observations to construct an observation-informed modelling of water and carbon fluxes within the land model JSBACH4.

Our hybrid approach almost perfectly reproduces the original JSBACH4 parametrizations by emulating the latent variables yielding R 2 values ranging between 0.99-1.0 for GPP and Etr  at hourly scale for forest and grassland sites. JSBACH4 equipped with these plugged-in emulations of the parametrizations reveal that the NN parametrizations are capable of reproducing the targets with relatively high accuracy while learning gs , Vcmax and Jmaxwithout prior information. By training the hybrid model on FLUXNET observations and we obtain observations-informed parametrizations to be plugged-in JSBACH4. We find that Hybrid-JSBACH can better capture the variability of GPP and Etr  across different ranges of atmospheric and soil dryness in comparison to JSBACH by analyzing the mean hourly residuals for the target variables. While challenges persist in fully integrating carbon and water cycles due to physical constraints in carbon cycle modeling, the Hybrid-JSBACH modeling framework already enables observation-guided coupling of land-atmosphere interactions for the water cycle with key biospheric processes represented by our hybrid observation-informed land-surface model. These developments are key to critically advance our understanding of hydrological processes and linked feedbacks in the climate system, especially in the context of changing climatic conditions.

How to cite: ElGhawi, R., Reimers, C., Schnur, R., Reichstein, M., Körner, M., Carvalhais, N., and Winkler, A. J.: Hybrid-Modeling of Land-Atmosphere Fluxes Using Machine Learning integrated in the ICON-ESM Modeling Framework, EGU General Assembly 2025, Vienna, Austria, 27 Apr–2 May 2025, EGU25-4000, https://doi.org/10.5194/egusphere-egu25-4000, 2025.

EGU25-4936 | Orals | BG3.7

Rethinking nitrogen availability in dryland: how arid vegetation overcomes nutrient scarcity 

Jiayuan Liao, Mario Corrochano-Monsalve, Kunkun Fan, Lucio Biancari, Corey Nelson, and Fernando T. Maestre

Nitrogen (N), after water, is considered the key factor limiting net primary production in drylands. However, whether vegetation is N-limited depends on the balance between N supply and biological demand, a relationship that remains unclear in drylands. Here, we established a standardized field survey across 25 countries, including 326 plots, to assess how plant N limitation responds to aridity in global drylands. We found that while N availability decreased with aridity, soil and plant δ¹⁵N—an indicator of the balance between N supply and biological demand—unexpectedly increased in arid regions (aridity > 0.8), suggesting that plants in these regions may not have N-limitation as common views. Variations in soil N forms, functional genes, and fungal data provide further evidence that dryland vegetation has evolved a unique strategy for N uptake and utilization to overcome soil N availability declines. Data support the hypothesis that, with increasing aridity, plants favor the uptake of ammonium, a more toxic but metabolically efficient N source, and reduce their dependence on mycorrhizal associations, relying instead on direct root uptake for more efficient N allocation. Our work also highlights the impact of grazing on the development of this strategy, particularly in grasslands. These results clarify dryland plant N-use patterns and challenge the view that plants become more N-limited with increasing aridity, a perspective that should be considered when evaluating global change and human stress on drylands.

How to cite: Liao, J., Corrochano-Monsalve, M., Fan, K., Biancari, L., Nelson, C., and T. Maestre, F.: Rethinking nitrogen availability in dryland: how arid vegetation overcomes nutrient scarcity, EGU General Assembly 2025, Vienna, Austria, 27 Apr–2 May 2025, EGU25-4936, https://doi.org/10.5194/egusphere-egu25-4936, 2025.

EGU25-6025 | ECS | Orals | BG3.7

Impact of altered nutrient balance on radiative forcing of a Mediterranean semi-arid savanna 

Bayu Hanggara, Tarek El-Madany, Arnaud Carrara, Stefan Metzger, Gerardo Moreno, Rosario Gonzalez-Cascon, Vicente Burchard-Levine, Anke Hildebrandt, Markus Reichstein, and Sung-Ching Lee

Net radiative forcing (RF) of terrestrial ecosystems is controlled by changes in greenhouse gas fluxes (biogeochemical cycles) and albedo (biophysical properties). Semi-arid savannas, characterized by tree-grass coexistence, are highly sensitive to elevated nitrogen (N) deposition, which can alter biophysical and biogeochemical interactions on the land-atmosphere continuum. This study examines how altered N-to-phosphorus (P) ratios (simulated in a fertilization trial) affect RF at the top of the atmosphere (TOA) and surface temperature (Ts) at both the ecosystem and grass layer scales. We analyzed a long-term dataset (2014–2023) from three co-located eddy-covariance (EC) sites in a Mediterranean savanna in Spain: control (ES_LMa), N-added (ES_LM1 or NT; 16.9 ha), and N+P-added (ES_LM2 or NPT; 21.5 ha). Each site featured two enclosed-path EC systems at heights of 1.6 m and 15 m to capture grass and ecosystem-scale fluxes, respectively. Comparing between fertilized and control sites, we found net RF at TOA was dominated by change of albedo (± 98 %) over net ecosystem exchange (ΔNEE), with NT showing a stronger cooling effect (mean ± SD: -2.37 ± 1.52 Wm-2) than NPT (-2.01 ± 1.82 Wm-2). Interestingly, cooling effect that captured at TOA did not consistently correspond to Ts change (ΔTs) on the surface. At the ecosystem level, NT experienced cooler Ts (ΔTs = -0.41± 0.47 °C), whereas NPT had slightly warmer Ts (i.e., ΔTs = 0.03 ± 0.28 °C). At the grass layer, both fertilization treatments resulted in warming, with higher Ts observed for NPT (ΔTs = 0.80 ± 0.77 °C) than NT (ΔTs = 0.63 ± 0.46 °C). Surface conductance (Gs) patterns also diverged across scales, with NT showing the highest Gs at the ecosystem level, while NPT had the highest Gs at the grass layer. These findings emphasize differences in energy transfer processes across layers and highlight that N addition alone (without P) enhances tree canopy cooling capacity more effectively than combined N+P addition. Conversely, both treatments increased Ts at the grass layer, reshaping eco-physiological interactions in this water- and nutrient-limited ecosystem. Our results underscore the importance of nutrient stoichiometry in regulating biophysical and biogeochemical processes in semi-arid savannas, with implications for ecosystem management and climate modeling.

How to cite: Hanggara, B., El-Madany, T., Carrara, A., Metzger, S., Moreno, G., Gonzalez-Cascon, R., Burchard-Levine, V., Hildebrandt, A., Reichstein, M., and Lee, S.-C.: Impact of altered nutrient balance on radiative forcing of a Mediterranean semi-arid savanna, EGU General Assembly 2025, Vienna, Austria, 27 Apr–2 May 2025, EGU25-6025, https://doi.org/10.5194/egusphere-egu25-6025, 2025.

EGU25-6202 | ECS | Posters on site | BG3.7

High-resolution carbon flux upscaling in Arctic landscapes based on the example of Trail Valley Creek, Canada 

Kseniia Ivanova, Anna-Maria Virkkala, and Mathias Göckede

Arctic regions play a critical role in the global carbon cycle, acting as both a sink and a source of carbon. However, it remains challenging to estimate methane (CH4) and carbon dioxide (CO2) fluxes across Arctic landscapes due to the sparsity of measurements and the complex interactions between environmental factors. Upscaling fluxes from local measurements to broader landscapes is challenging, especially in capturing the variability of land cover types and their unique carbon dynamics. Addressing this heterogeneity is critical to improving flux estimates and reducing uncertainties in Arctic carbon budgets.

Our study domain (~6 km2), the Trail Valley Creek area (Northwest Territories, Canada) illustrates this challenge, featuring a mosaic of upland, shrub, and lichen tundras alongside heterogeneous wetlands, each with distinct moisture regimes and carbon flux contributions. Our study integrates diverse datasets to upscale carbon fluxes with statistical and machine learning models at high spatial resolution (10 m), ensuring that small-scale variations are preserved. We combine chamber measurements of CH₄ and CO₂ fluxes from 39 sites, with different temporal resolutions ranging from high-frequency half-hourly data to a few measurements per day, spanning the entire vegetation season, with soil temperature (from topsoil to 30 cm depth)  and soil moisture data (at different depth down to 30 cm depth), remote sensing products such as Sentinel-2 imagery, UAV-derived vegetation height and classifications (1 m resolution), and DEM/DSM (10 cm resolution). Based on these remote sensing products we calculated vegetation and moisture indices (NDVI, NDWI, NDMI, TWI), which provide insight into seasonal variability, and the snow index (NDSI) highlights the timing of snowmelt and its influence on fluxes. This approach allows us to examine both the spatial heterogeneity of fluxes across different land cover types and their temporal dynamics in response to climate-driven changes in soil and vegetation conditions.

How to cite: Ivanova, K., Virkkala, A.-M., and Göckede, M.: High-resolution carbon flux upscaling in Arctic landscapes based on the example of Trail Valley Creek, Canada, EGU General Assembly 2025, Vienna, Austria, 27 Apr–2 May 2025, EGU25-6202, https://doi.org/10.5194/egusphere-egu25-6202, 2025.

EGU25-6460 | ECS | Posters on site | BG3.7

Parameter learning and scaling in hybrid ecosystem models for improved understanding of carbon and water dynamics 

Chao Wang, Shijie Jiang, and Yi Zheng

Accurate modeling of terrestrial carbon, energy, and water cycles is critical for understanding ecosystem processes and their responses to environmental change. However, a key challenge lies in the parameterization of these complex processes, which vary across scales and ecosystems. This study investigates how hybrid modeling approaches can enhance ecosystem parameter learning and provide deeper insights into terrestrial carbon and water dynamics across Europe. Specifically, we used a hybrid modeling framework that integrates the coupled photosynthesis-evapotranspiration model as a differentiable ecosystem model with a deep neural network to optimize parameter learning. Long-term observations from multiple FLUXNET sites across Europe, including daily evapotranspiration (ET) and gross primary productivity (GPP) data, were used to constrain model parameters in an end-to-end mode. The calibrated model was then used to generate spatial distribution maps of key ecosystem parameters, revealing how they vary under different climatic and ecological conditions. 

Results demonstrate that the hybrid model significantly improves simulation accuracy for ET and GPP while capturing parameter variability across European ecosystems. Post-hoc analyses of the embedded neural network quantified the influence of key environmental drivers, such as climate, soil properties, and vegetation, on the learned parameters. These results highlight the value of hybrid modeling for improving understanding of ecosystem processes, providing actionable insights for climate adaptation and ecosystem management in Europe and for improving terrestrial biosphere models.

How to cite: Wang, C., Jiang, S., and Zheng, Y.: Parameter learning and scaling in hybrid ecosystem models for improved understanding of carbon and water dynamics, EGU General Assembly 2025, Vienna, Austria, 27 Apr–2 May 2025, EGU25-6460, https://doi.org/10.5194/egusphere-egu25-6460, 2025.

EGU25-6536 | Posters on site | BG3.7

Temperature-Dependent maximum dark-adapted Fluorescence in Lantana camara: Implications for Accurate NPQ Measurements 

Albin Hammerle, Tobias Pilz, Anna de Vries, and Georg Wohlfahrt

Continuous active chlorophyll fluorescence measurements, e.g. using the MONI- or MICRO-PAM instruments by Walz, are widely used because they provide valuable, real-time information about the photosynthetic activity and stress status of plants by measuring chlorophyll fluorescence. Its ability to provide non-invasive, precise data on photosystem performance makes it an essential tool in both research and practical applications.

However, some derived parameters from these measurements depend on measurements taken from dark-adapted leaves. With continuous measurements, these values are collected during the night. Considering that, in addition to light availability, many other environmental parameters (such as temperature, VPD, etc.) differ significantly from daytime conditions, the question arises whether directly relating parameters measured at night to those measured during the day might lead to errors. One such parameter that is potentially affected is NPQ (non-photochemical quenching), which is calculated from the ratio of the maximum fluorescence of a dark-adapted leaf (Fm) to the maximum fluorescence of a light-adapted leaf (F’m).

We thus present here the results of a laboratory experiment in which we investigated the temperature dependence of Fm in Lantana camara under otherwise constant conditions. We were able to demonstrate that Fm shows a clear dependence on ambient temperature, with Fm increasing as the temperature rises. This implies that, under typical field conditions, where night-time temperatures are lower than daytime temperatures, Fm measured at night would underestimate the actual values of Fm observed under warmer daytime conditions. Ultimately, this leads to an underestimation of NPQ, when calculated from these underestimated Fm values.

In parallel, we investigated whether a typical dark adaptation period of 30 minutes is sufficient to reach a dark-adapted state during daytime conditions. Our results showed that 30 minutes was never enough to ensure adequate dark adaptation in the leaves.

How to cite: Hammerle, A., Pilz, T., de Vries, A., and Wohlfahrt, G.: Temperature-Dependent maximum dark-adapted Fluorescence in Lantana camara: Implications for Accurate NPQ Measurements, EGU General Assembly 2025, Vienna, Austria, 27 Apr–2 May 2025, EGU25-6536, https://doi.org/10.5194/egusphere-egu25-6536, 2025.

The amount of precipitation used by plants is an essential quantity for assessing ecosystem water-use efficiency and forecasting vegetation responses to environmental change in arid and semi-arid regions. The ratio of annual transpiration to annual precipitation (f0) is an important yet neglected parameter, required for the accurate estimation of potential maximum leaf area index, light absorption and gross primary production in water-limited environments. This study estimated transpiration using three methods: the Penman-Monteith equation, Fick’s law, and an energy-balance technique based on flux measurements. Results showed a consistent pattern whereby f0 initially increases with aridity but eventually declines, peaking at around 0.5–0.6 when the aridity index – defined as the ratio of annual (Priestley-Taylor) potential evapotranspiration to P – lies in the range from 2 to 3. This finding establishes a non-linear relationship between water supply and ecosystem water use, and points to a need to incorporate adaptive f₀ values in ecosystem models.

How to cite: Gao, M. and Prentice, I. C.: Shifting dynamics of water use: nonlinear decline of transpiration-to-precipitation ratios with aridity, EGU General Assembly 2025, Vienna, Austria, 27 Apr–2 May 2025, EGU25-7750, https://doi.org/10.5194/egusphere-egu25-7750, 2025.

EGU25-7976 | Orals | BG3.7

Supporting EU Climate Goals through Improved Forest Monitoring, Modelling and Management 

Mirco Migliavacca and the Participants JRC expert meeting on forest ecosystems

The EU's climate goals depend primarily on reducing greenhouse gas emissions. However, carbon sequestration by forest ecosystems is an important component in achieving carbon neutrality, but their ability to do so is declining. Between 1990 and 2022, European forests removed about 434 Mt CO2eq yr-1 from the atmosphere, equivalent to about 10% of the EU's total emissions. However, the forest carbon sink has decreased by nearly a third, from an average of  -457Mt CO2eq yr-1  between 2010-2014  to -332 Mt CO2eq yr-1 between 2020-2022. To meet the EU's 2050 climate neutrality goal, the forest sector needs to offset 8% of emissions per year, but it is currently only achieving 6% per year. This is a 2% shortfall, equivalent to the emissions of Latvia and Estonia together.

In recent years, significant developments have been made in forest monitoring and modeling and in the understanding of forest ecosystem dynamics. However, scientific and practical challenges still limit the information available for policy decisions. Here, we propose a roadmap for enhanced research and forest management actions for climate adaptation and mitigation from the stand to the continental scale. The aim is to identify forest monitoring and modeling advances needed to inform sustainable policy decisions on forest and land management. 

This roadmap includes:

Short-term (< 3 years): Improving monitoring of forest disturbances types and intensity, tree mortality, and biodiversity using satellite data, ground observations, as well as improving the secure access to private forest data.

Medium-term (< 5 years): Understanding how forest management, biodiversity, and climate change affect carbon sinks and forest resilience, in particular the response to climate extremes, and developing long-term projections of the European forest carbon sink (including under worse case scenarios).

Long-term (beyond 5 years): Deepening understanding of how management practices affect deadwood and soil organic carbon to guide policies that integrate these factors into broader forest management and climate adaptation strategies.

We highlight new research results that can contribute to the goals and support the EU's climate objectives, including achieving climate neutrality by 2050, by providing policymakers with robust and reliable information on forest resources and carbon sink.

How to cite: Migliavacca, M. and the Participants JRC expert meeting on forest ecosystems: Supporting EU Climate Goals through Improved Forest Monitoring, Modelling and Management, EGU General Assembly 2025, Vienna, Austria, 27 Apr–2 May 2025, EGU25-7976, https://doi.org/10.5194/egusphere-egu25-7976, 2025.

EGU25-10152 | ECS | Orals | BG3.7

Predicting tree-level sap flow from point dendrometer and climate data 

Morgane Merlin, Holger Lange, Junbin Zhao, Ryan Bright, Danielle Creek, and Helge Meissner

Climatic drought and changes in precipitation patterns are key features of the ongoing and predicted climatic changes in northern latitudes such as the boreal forest of Norway. Recent droughts highlight on the possible difficult future of spruce forests in southern Norway. To better understand and monitor these forests under a more extreme climate, it is crucial to gain a better understanding of the water relations of spruce trees across forest stands. Sap flow sensors are typically used for directly measuring the water demands for transpiration in individual trees. There are however limitations to their use in examining the hydraulic and physiological responses to extreme water supply variability: i) manufactured high-resolution sensors such as those following the Heat Ratio Method (HRM) or Heat Field Deformation (HFD) are expensive, limiting their deployment to a few trees in a stand, and ii) the sap flow sensors only measure the movement of water within the active sapwood, not accessing other physiological mechanisms and responses (radial growth, water storage) associated with stress response. Point dendrometers have become increasingly used, monitoring sub-daily stem size fluctuations resulting from both seasonal patterns of radial growth increment and the dynamics of plant tissue water balance. Manufactured point dendrometers are much cheaper to buy and easier to install and maintain than manufactured sap flow sensors. They can therefore be much more extensively deployed across forest stands. We aimed to analyse the relationship between sub-daily stem diameter changes and sap flow using point dendrometers and HRM sap flow sensors installed in a Norway spruce forest located 50 km north of Oslo, Norway. We linked these relationships with individual tree physical attributes, meteorology and soil climate over two growing seasons in 2022 and 2023. Our goal was to assess whether a predictive model of sap flow could be built from measured diameter changes, tree properties and climate, to ultimately reduce the uncertainty of stand level transpiration estimation at the daily resolution across entire forest stands.

How to cite: Merlin, M., Lange, H., Zhao, J., Bright, R., Creek, D., and Meissner, H.: Predicting tree-level sap flow from point dendrometer and climate data, EGU General Assembly 2025, Vienna, Austria, 27 Apr–2 May 2025, EGU25-10152, https://doi.org/10.5194/egusphere-egu25-10152, 2025.

EGU25-10284 | ECS | Orals | BG3.7

Multi-proxy analysis confirms the tight coupling of carbon assimilation and allocation, with divergent NSCs strategies in two boreal forest species 

Paulina F. Puchi, Daniela Dalmonech, Daniele Castagneri, Giancarlo Genovese, Lorenzo Brilli, and Alessio Collalti

Understanding the link between photosynthesis and carbon allocation to woody biomass remains a critical gap in predicting forest responses to climate change due to the pervasive lack of comprehensive carbon-based data at the whole-stand level. We employed an integrated approach combining micrometeorological techniques (Eddy Covariance, EC), process-based and biogeochemical modelling, tree ring width (TRW), and quantitative wood anatomy to assess changes in carbon fluxes and allocation dynamics over mature stands of black spruce (Picea mariana Mill.) and jack pine (Pinus banksiana Lamb.) from 1999 to 2021 in Canada. We used Gross Primary Production (GPP) from EC to calibrate and validate GPP simulations from the 3D-CMCC-FEM model, incorporating tree ring width (TRW) and wood anatomical traits, such as cell wall area (CWA), as proxies for carbon fixation.

Our findings demonstrated that the forest ecosystem model effectively captured GPP at daily, monthly, and annual scales, strongly correlating with EC-based estimates (P < 0.001). Both stands revealed a strong association between observed and modelled GPP and CWA, highlighting that CWA better reflects carbon assimilation in woody biomass than TRW. Species-specific differences in non-structural carbohydrates (NSCs) dynamics were also evident, as model simulations indicated that Pinus banksiana actively utilized NSCs for growth, while Picea mariana relied on NSCs as a buffer under cold conditions. This multi-proxy approach enhanced our understanding of carbon dynamics and temporal and spatial carbon flux pathways. Our findings provide critical insights into carbon allocation strategies, contributing valuable knowledge for refining climate change models in boreal ecosystems.

How to cite: Puchi, P. F., Dalmonech, D., Castagneri, D., Genovese, G., Brilli, L., and Collalti, A.: Multi-proxy analysis confirms the tight coupling of carbon assimilation and allocation, with divergent NSCs strategies in two boreal forest species, EGU General Assembly 2025, Vienna, Austria, 27 Apr–2 May 2025, EGU25-10284, https://doi.org/10.5194/egusphere-egu25-10284, 2025.

EGU25-10779 | ECS | Posters on site | BG3.7

Assessing the Spatiotemporal Dynamics of Soil Water Vapor Adsorption Using a Global Observation Network 

Sinikka J. Paulus, Jacob A. Nelson, Sung-Ching Lee, Rene Orth, Anke Hildebrandt, Markus Reichstein, and Mirco Migliavacca

The movement of water vapor between the soil and the atmosphere plays a crucial role in soil-atmosphere interactions, especially under dry conditions. A previously little-noticed process known as water vapor adsorption in soil occurs when water vapor from the atmosphere is adsorbed in the soil during the night, caused by cooling at the soil surface. This process is based on the fundamental principle that equilibrium vapor pressure decreases in the vicinity of dry soil material, creating conditions under which evaporation turns into condensation. While this phenomenon is well understood at small scales under controlled conditions, its effects on ecosystems at larger scales remain poorly understood due to the lack of continuous, direct measurements.

In this study, we investigate across a worldwide network of eddy covariance measurements under which conditions negative latent heat fluxes (vapor movement towards the soil) are consistent with an established theoretical understanding of soil water vapor adsorption. We find an emerging functional relationship between latent heat flux direction, soil water content, and near-surface relative humidity which facilitates the investigation of adsorption events across the eddy covariance network. Our results confirm that soil water vapor adsorption occurs most frequently in arid areas with sparse vegetation, such as savannahs or dry shrublands. The average duration of soil water vapor adsorption is 4 hours per day in all ecosystems and up to 9 hours per day in some sites. The number of days per year where soil water vapor adsorption was measurable for three hours or longer varied by ecosystem, reaching up to 150 days per year. Our results further suggest that soil texture has a relatively minor influence on the occurrence under field conditions compared to the results of laboratory experiments.

Our analysis confirms recent findings that soil water adsorption can be isolated from eddy covariance measurements. It not only expands our knowledge of the spatial distribution of soil water vapor adsorption in different ecosystems but also facilitates future research to investigate interannual dynamics, management, and extremes. Thus, the study contributes to the understanding of a long-overlooked aspect of soil-atmosphere interaction.

How to cite: Paulus, S. J., Nelson, J. A., Lee, S.-C., Orth, R., Hildebrandt, A., Reichstein, M., and Migliavacca, M.: Assessing the Spatiotemporal Dynamics of Soil Water Vapor Adsorption Using a Global Observation Network, EGU General Assembly 2025, Vienna, Austria, 27 Apr–2 May 2025, EGU25-10779, https://doi.org/10.5194/egusphere-egu25-10779, 2025.

EGU25-11348 | ECS | Posters on site | BG3.7

Modeling plant-environment interactions with integrated machine learning and optimality theory 

Jialiang Zhou, Shijie Jiang, Anke Hildebrandt, Sujan Koirala, and Nuno Carvalhais

Understanding vegetation dynamics is essential for predicting water, carbon, and energy exchanges in terrestrial ecosystems. Despite advances in plant-environment interaction models, challenges remain in accurately representing how key plant traits, such as roots, respond to environmental variability, particularly in arid ecosystems. Current models often rely on fixed mathematical representations, limiting their ability to address complex and dynamic plant-environment interactions. For instance, optimality-based vegetation models, which use long-term carbon profit optimization principles, show promise but are typically still constrained by predefined functional forms.

This work presents a conceptual framework that attempts to integrate machine learning with optimality-based vegetation modeling, aiming to combine the strengths of mechanistic modeling and data-driven approaches. This framework is designed to capture diverse plant-environment processes, such as root development, over various temporal scales. Within this hybrid framework,  plants in simulated environments are enabled to dynamically adjust their responses based on optimization objectives. Preliminary simulations with the FLUXNET datasets suggest that the framework has the potential to better predict ecosystem fluxes and improve our understanding of vegetation dynamics under changing conditions.

This study highlights the potential of integrating machine learning with plant physiological processes to address current limitations in modeling plant-environment interactions. The proposed framework could serve as a flexible tool for exploring vegetation dynamics and their implications for ecosystem function.

How to cite: Zhou, J., Jiang, S., Hildebrandt, A., Koirala, S., and Carvalhais, N.: Modeling plant-environment interactions with integrated machine learning and optimality theory, EGU General Assembly 2025, Vienna, Austria, 27 Apr–2 May 2025, EGU25-11348, https://doi.org/10.5194/egusphere-egu25-11348, 2025.

EGU25-11486 | ECS | Posters on site | BG3.7

Adjusting Standardized Precipitation Index to Analyze Long-Term Drought Patterns from Documentary Records in the Chinese dynasties Since the Mid-14th Century  

Chih-Hsuan Chang, Kuanhui Elaine Lin, Wan-Ling Tseng, Cheng-Wei Lin, Hsin-Cheng Huang, and Pao K Wang

This study integrates modern observational data (CRU)(1901-2023) with historical documentary records (REACHES) to reconstruct and analyze long-term drought patterns in the Chinese dynasties since the mid-14th centuries (1368-1911). By focusing on the Standardized Precipitation Index (SPI), we examine spatio-temporal drought trends across multiple timescales. SPI indices for 12-month, 36-month, and 60-month periods (SPI12, SPI36, SPI60) were calculated to capture variability across different temporal scales. Empirical orthogonal function (EOF) analysis was conducted to identify major spatial patterns and analyze temporal series, facilitating the identification of extreme drought periods and sequences of significant anomalies. Wavelet analysis was employed to detect potential periodicities and dominant cycles within the data. Further analysisis underway to assess whether variations in drought patterns might differ when considering evapotranspiration (SPEI). This aspect remains exploratory, offering a potential insight into the broader implications of integrating long-term and additional climatic variables into drought analysis.

How to cite: Chang, C.-H., Lin, K. E., Tseng, W.-L., Lin, C.-W., Huang, H.-C., and Wang, P. K.: Adjusting Standardized Precipitation Index to Analyze Long-Term Drought Patterns from Documentary Records in the Chinese dynasties Since the Mid-14th Century , EGU General Assembly 2025, Vienna, Austria, 27 Apr–2 May 2025, EGU25-11486, https://doi.org/10.5194/egusphere-egu25-11486, 2025.

EGU25-11495 | ECS | Posters on site | BG3.7

Continuous spectral monitoring below forest canopies: an IoT-based approach 

Davide Andreatta, Luca Belelli Marchesini, Loris Vescovo, and Damiano Gianelle

Climate change and climate extremes are severely impacting forest ecosystems, threatening their functioning and diversity. Our ability to accurately monitor forest responses to climatic impacts, however, is limited. This study introduces and discusses the monitoring potential of Internet of Things (IoT) spectral sensors for continuous below-canopy radiation measurements. At the canopy scale, light partitioning into absorbed, reflected and transmitted light is strongly modulated by architectural parameters in addition to leaf level chemistry (canopy pigments and water content). These determine a high spatial, temporal and spectral variability of transmitted light, which requires a large sampling effort to be described at stands and forest scale. The recent availability of spectral sensors connected through IoT technologies is opening new possibilities in the dynamic characterization of forest canopy spectral features. The proposed approach enables the monitoring of structural and physiological traits continuously in time and on larger extents compared to hand-carried instruments. Key applications include validating satellite vegetation products, analyzing light quality variations, investigating tree responses to environmental stresses like drought and heatwaves, exploring the role of light quality in forest renovation, and understanding complex forest ecosystem interactions. We have yet to fully imagine potential applications that could go beyond traditional plant ecology boundaries, ranging from wildlife light preferences to tree insect damage monitoring. By providing continuous, high-resolution data from previously understudied forests, this approach bridges technological innovation with ecological research, potentially revolutionizing our understanding of forest functioning under changing climate conditions.

How to cite: Andreatta, D., Belelli Marchesini, L., Vescovo, L., and Gianelle, D.: Continuous spectral monitoring below forest canopies: an IoT-based approach, EGU General Assembly 2025, Vienna, Austria, 27 Apr–2 May 2025, EGU25-11495, https://doi.org/10.5194/egusphere-egu25-11495, 2025.

EGU25-12055 | ECS | Orals | BG3.7

Strong impact of groundwater on long-term photosynthesis 

Francesco Giardina, Jiangong Liu, Sonia I. Seneviratne, Benjamin D. Stocker, and Pierre Gentine

Plants can access underground water reserves to sustain their activity, releasing moisture into the atmosphere—a critical survival mechanism during drought. Understanding the role of groundwater in regulating photosynthesis is thus key for predicting land-surface processes. However, the impact of groundwater on terrestrial ecosystem productivity remains poorly quantified, particularly when compared to well-known factors like aridity. Here, we use satellite observations of solar-induced fluorescence as a proxy for photosynthesis, together with model estimates of water table depth and aridity, quantified by the moisture index with reanalysis data, to investigate the relationship between groundwater and photosynthesis. Using causality-guided explainable machine learning (Causal Shapley values), we demonstrate that groundwater plays a crucial role in determining spatial patterns of photosynthesis, with varying importance across ecosystem types, and that its effect is comparable to aridity. We show that the relative importance of groundwater accounts for 48 to 101% of the effect attributed to aridity in modulating forest photosynthesis across the contiguous USA. The relative importance of groundwater compared to the aridity remains substantial in savannahs and shrublands (30-58%), grasslands (22-42%), and croplands (15-32%). Our findings highlight the key role of groundwater in driving ecosystem long-term productivity.

How to cite: Giardina, F., Liu, J., Seneviratne, S. I., Stocker, B. D., and Gentine, P.: Strong impact of groundwater on long-term photosynthesis, EGU General Assembly 2025, Vienna, Austria, 27 Apr–2 May 2025, EGU25-12055, https://doi.org/10.5194/egusphere-egu25-12055, 2025.

EGU25-12794 | ECS | Orals | BG3.7

Resolving the links between wood production, leaf phenology and whole-ecosystem carbon fluxes in temperate forests 

Daniela Krebber, Robin Battison, Katja Kowalski, Yadvinder Malhi, Cornelius Senf, and Tommaso Jucker

Wood production is an essential component of terrestrial carbon dynamics, but we only have a limited understanding of the environmental cues that trigger wood production to start and stop during the growing season and how these vary among temperate tree species. Moreover, we lack a clear picture of how the seasonal timings of wood production relate to leaf phenology and whole-ecosystem carbon fluxes - severely limiting our ability to estimate woody productivity from remote sensing or eddy covariance flux tower data. To address this knowledge gap, between 2023 and 2024 we used automated dendrometers to take hourly measurements of stem diameter variations across 160 trees representing seven locally-dominant broadleaf and coniferous species in the Wytham Woods 18-ha ForestGEO plot in the UK. We combined these with overlapping flux tower measurements of gross primary production (GPP) and net ecosystem exchange (NEE), NDVI time-series generated from Sentinel-2 to capture canopy phenology and local microclimate data. Using these complementary datasets we found that wood growth started later and ended much earlier than one might estimate from NDVI alone. Moreover, temporal trends in wood production (including the onset, maximum rate and cessation of growth) varied significantly between species - with beech and oak trees growing almost 60 days longer per year than sycamore and ash. This variation in wood phenology across species significantly complicates any attempts to infer wood production from flux tower measurements of GPP and NEE. Our study advances our understanding of the synchronization and mismatches between ecosystem carbon uptake and investment in wood production in temperate forests. We highlight the potential of combining remote sensing, flux tower and high-resolution dendrometer data to improve our ability to track terrestrial carbon cycling at scale and predict its responses to climate change.

How to cite: Krebber, D., Battison, R., Kowalski, K., Malhi, Y., Senf, C., and Jucker, T.: Resolving the links between wood production, leaf phenology and whole-ecosystem carbon fluxes in temperate forests, EGU General Assembly 2025, Vienna, Austria, 27 Apr–2 May 2025, EGU25-12794, https://doi.org/10.5194/egusphere-egu25-12794, 2025.

EGU25-12843 | Orals | BG3.7

Revisiting the primary production control on wetland methane emission 

Avni Malhotra, Patrick Megonigal, Inke Forbrich, Tiia Määttä, Kendalynn Morris, Roberta Bittencourt Peixoto, Stephanie Wilson, Jianqiu Zheng, and Vanessa Bailey

The relationship between plant primary production and wetland methane (CH4) emission is well established. This relationship is expected because plant production fuels methanogenesis and plants act as conduits for gas exchange between the soil and the atmosphere. Recent global increases in bottom-up measurements of wetland CH4 provide a new opportunity to revisit the hypothesis that plant production and CH4 flux have a positive linear relationship in wetlands. 

Using paired CH4 and gross primary productivity (GPP) measurements from 56 wetland sites, we found that CH4 and GPP are weakly related, with the maximum R2 from linear regressions being 0.14 (p= 0.0081). Instead, we found some support for a unimodal relationship (R2= 0.24, p= 0.0016) between GPP and CH4 flux. While flooded sites exhibited strong GPP-CH4 relationships, sites where the mean annual water table depth was below the soil surface showed weak or no GPP-CH4 relationship. This suggests that variable degrees of CH4 oxidation, among other factors, could be weakening the apparent relationship between GPP and CH4

In this presentation, we will discuss processes that could disrupt the expected positive linear relationship between plant production and CH4 using multi-scale examples from syntheses, lab and field experiments. We will also explore why the GPP-CH4 relationship may not scale across space and time and how this affects the utility of GPP as a CH4 predictor. 

How to cite: Malhotra, A., Megonigal, P., Forbrich, I., Määttä, T., Morris, K., Bittencourt Peixoto, R., Wilson, S., Zheng, J., and Bailey, V.: Revisiting the primary production control on wetland methane emission, EGU General Assembly 2025, Vienna, Austria, 27 Apr–2 May 2025, EGU25-12843, https://doi.org/10.5194/egusphere-egu25-12843, 2025.

EGU25-12922 | Orals | BG3.7

Testing Tree Crown Economics with the USA National Ecological Observatory Network 

Brenden McNeil, Yiting Fan, and Andrew Elmore

Tree crown architecture, defined as the 3-D density, distribution and orientation of leaves within a tree crown, strongly influences the processes of photosynthesis, evapotranspiration, and spectral reflectance that help characterize key tree and forest responses to global change.  Tree crown economic theory posits that variability in tree functioning can be assessed by a suite of co-varying tree crown architectural traits describing an economic tradeoff of light capture versus water-use efficiency. Using new, consistent measurements from eight broadleaf deciduous forest sites that are part of the USA National Ecological Observatory Network (NEON), we quantified a suite of tree crown architectural traits and assessed whether they were predictive of NIRv, a spectral reflectance index of tree crown functioning. Specifically, we worked with NEON staff to measure: (1) the trait of sunlit mean leaf angle (MLA) from analysis of tower-based profile photographs of tree crowns, (2) the traits of top rugosity (Rt), plant area index (PAI), and accumulative plant area density within the top 50% of the crown (APAD50) from Airborne Observation Platform (AOP) LiDAR data extracted from field-delineated tree crown polygons, and (3) NIRv, the near-infrared reflectance of vegetation, from AOP imaging spectroscopy data. We found several tree crown architectural traits and NIRv to co-vary along a spectrum ranging from “tower” to “dome” crown architectural ideotypes. Optimized for light capture, trees closer to the “dome” ideotype had more horizontally-distributed crowns (lower APAD50) with more horizontal leaves (lower MLA), which was associated with higher NIRv.  Conversely, trees closer to the “tower” ideotype had more vertically-distributed crowns with more vertical leaves and lower NIRv. This expected covariation of traits and NIRv was related to species differences, but also to spatial variability within a single species, Liriodendron tulipifera, that occurred in five sites spread across a strong moisture gradient. These data and analyses are consistent with theory and suggest that measurable crown traits can define a branch- and crown-scale economic trade-off that governs how each tree adaptively distributes and orients leaves in their crown as a coordinated strategy affecting tree functioning and their responses to global change. 

How to cite: McNeil, B., Fan, Y., and Elmore, A.: Testing Tree Crown Economics with the USA National Ecological Observatory Network, EGU General Assembly 2025, Vienna, Austria, 27 Apr–2 May 2025, EGU25-12922, https://doi.org/10.5194/egusphere-egu25-12922, 2025.

EGU25-13313 | ECS | Posters on site | BG3.7

Reducing uncertainties in the Vegetation Photosynthesis and Respiration Model (VPRM) 

Marcia Joana Kroker, Theo Glauch, Sanam N. Vardag, Julia Marshall, and André Butz

The Vegetation Photosynthesis and Respiration Model (VPRM) is a light-use efficiency model used to estimate biogenic CO2 fluxes based on satellite indices, land cover maps, and meteorological data. It models net ecosystem exchange (NEE) with a simple function that uses four adjustable parameters for each vegetation type, fitted using eddy covariance measurements. VPRM is both accurate and computationally efficient, making it a popular choice for calculating CO2 fluxes at high spatial and temporal resolutions, such as in regional inversion studies.

Initially designed for use with MODIS satellite data at a 500-meter resolution, our updated implementation now supports Sentinel-2 data with a much finer 20-meter resolution. This higher resolution improves the accuracy of biospheric flux estimates by (1) better resolving heterogeneous landscapes, such as croplands, and (2) enabling the incorporation of time-dependent flux tower footprints into the parameter fitting procedure. We compared the flux footprint approach to the traditional implementation for Sentinel-2 for Europe. To ensure robust comparisons, we used Monte Carlo Markov Chain (MCMC) sampling to estimate the range of parameter values for both model versions.

How to cite: Kroker, M. J., Glauch, T., Vardag, S. N., Marshall, J., and Butz, A.: Reducing uncertainties in the Vegetation Photosynthesis and Respiration Model (VPRM), EGU General Assembly 2025, Vienna, Austria, 27 Apr–2 May 2025, EGU25-13313, https://doi.org/10.5194/egusphere-egu25-13313, 2025.

The Tarim River is the longest inland river in China, and its basin represents a typical ecologically fragile area within arid regions, highly susceptible to human activities and climate change. These factors contribute to increased regional desertification and the deterioration of the ecological environment. As the sole community-forming tree species in this basin, a timely understanding of the spatial distribution and growth status of Populus euphratica is essential for maintaining the ecological balance in the desert and ensuring the security of the oasis ecosystem. Currently, there is no spatial distribution map of Populus euphratica in the basin, primarily due to significant variations in stand density and tree branch architecture, along with a lack of high-spatial-resolution data. This study addresses the gap by constructing a comprehensive dataset of single-tree parameters for Populus euphratica through the integration of LiDAR and GF-2 satellite imagery. We developed a deep learning model tailored to different densities and crown architecture of Populus euphratica, enabling accurate quantification of the spatial distribution of these forests in the Tarim River basin. This study provides valuable insights for the inversion of large-scale fine forest structure parameters and serves as a crucial foundation for the management and conservation of forest resources in arid regions.

How to cite: Yang, Q.: Spatial distribution mapping of Populus euphratica in the Tarim River Basin using multi-source remote sensing data and deep learning, EGU General Assembly 2025, Vienna, Austria, 27 Apr–2 May 2025, EGU25-14715, https://doi.org/10.5194/egusphere-egu25-14715, 2025.

EGU25-14729 | ECS | Orals | BG3.7

Desert dust deposition enhances plant nutrition via direct foliar uptake in Mediterranean ecosystems 

Anton Lokshin, Daniel Palchan, Marcelo Sternberg, and Avner Gross

Atmospheric deposition of desert dust serves as a significant nutrient source, replenishing soil nutrient stocks and influencing the long-term productivity of infertile terrestrial ecosystems. However, the immediate impact on the vegetation after deposition remains unclear.

We present findings from a pioneering field experiment conducted in a natural Mediterranean ecosystem in Israel which regularly receives desert dust. In this study, we applied dust to three native plant species Salvia fruticosa, Teucrium capitatum and Cistus creticus over the course of three months (the dust period). Our results indicate that, while biomass and new growth organs remain unchanged compared to the control plants, dust application significantly increased the concentrations of Al, Mn, Fe, Ni, and Cu. In some cases, the increase was as high as 100% in the aboveground biomass across all three species, which are considered marginally bioavailable in the local soils due to their high alkalinity. We discovered that the nutrients were taken directly from the plant foliage and not via the roots and show that this unique process was facilitated by the acidic environment of the leaf surface which enables the partial dissolution of nutrients typically unavailable in alkaline soils.

These findings suggest that deposition of dust is an important source of mineral nutrients to plant and can enhance plant nutrition through foliar uptake mechanism, particularly in ecosystems with nutrient-poor soils. The acidic microenvironment on leaf surfaces plays a crucial role in solubilizing dust-borne nutrients, facilitating their uptake. This mechanism may be especially beneficial in regions experiencing frequent dust deposition, contributing to the resilience and productivity of plant communities in such environments.

How to cite: Lokshin, A., Palchan, D., Sternberg, M., and Gross, A.: Desert dust deposition enhances plant nutrition via direct foliar uptake in Mediterranean ecosystems, EGU General Assembly 2025, Vienna, Austria, 27 Apr–2 May 2025, EGU25-14729, https://doi.org/10.5194/egusphere-egu25-14729, 2025.

EGU25-16164 | Orals | BG3.7

Groundwater–NEE Relationship in Dutch Peatlands Derived by Machine Learning Using Airborne and Ground-Based Eddy Covariance Data 

Ronald Hutjes, Laura van der Poel, Laurent Bataille, Bart Kruijt, Wietse Franssen, Wilma Jans, Jan Biermann, Anne Rietman, Alex Buzacott, and Ype van der Velde

Peatlands worldwide have been transformed from carbon sinks to carbon sources due to years of intensive agriculture requiring low water tables. In the Netherlands, carbon dioxide (CO2) emissions from drained peatlands mount up to 5.6 Mton annually and, according the Dutch climate agreement, should be reduced by 1 Mton in 2030. It is generally accepted that mitigation measures should include raising the water level, and the exact influence of water table depth has been increasingly studied in recent years. Most studies do this by comparing annual Eddy Covariance (EC) site-specific CO2 budgets to mean annual effective water table depths (WTDe). However, here we apply a different approach: we integrate measurements from 16 EC towers with EC measurements from 141 flights by a low-flying research aircraft, in an interpretable machine learning framework. We make use of the different strengths of tower and airborne data, temporal continuity and spatial heterogeneity, respectively. We apply time frequency wavelet
analysis and a footprint model to relate the measured fluxes to the underlying surface. Using spatio-temporal data, we train and optimize a boosted regression tree (BRT) machine learning algorithm and use Shapley values and various simulations to interpret the model’s outputs. We find that emissions increase with 4.6 tonnes CO2 ha-1 yr-1 for every 10 cm WTDe up to a WTDe of 0.8 meter. For more drained conditions, emissions decrease again, following an optimum-based curve. Furthermore, we find that this effect is stronger in winter than in summer and that it varies between sites. This study shows the added value of using ML with different types of instantaneous data, and holds potential for future applications.

How to cite: Hutjes, R., van der Poel, L., Bataille, L., Kruijt, B., Franssen, W., Jans, W., Biermann, J., Rietman, A., Buzacott, A., and van der Velde, Y.: Groundwater–NEE Relationship in Dutch Peatlands Derived by Machine Learning Using Airborne and Ground-Based Eddy Covariance Data, EGU General Assembly 2025, Vienna, Austria, 27 Apr–2 May 2025, EGU25-16164, https://doi.org/10.5194/egusphere-egu25-16164, 2025.

EGU25-17313 | ECS | Orals | BG3.7

A unified modeling and understanding of the canopy CO2, COS and SIF processes with a process-based model 

Huajie Zhu, Mousong Wu, and Wenzhuo Duan

Photosynthesis is a fundamental ecosystem process coupled with terrestrial cycles of energy, carbon and water. As it is difficult to directly measure photosynthesis by partitioning the exchange of carbon dioxide (CO2) between plants and surrounding air, how photosynthesis responds to a variety of environmental drivers across temporal scales remains unclear. Carbonyl sulfide (COS) fluxes, and Sun-induced Chlorophyll Fluorescence (SIF), have been recently suggested as a promising proxy to infer photosynthesis and track stomatal processes at the ecosystem scale. However, the link between COS fluxes, SIF and CO2 uptake as well as stomatal opening varied with environmental factors across temporal scales remained unstudied given the tight coupling of leaf water and carbon fluxes. We first developed the CoupModel for simultaneous modeling of the COS, CO2, and SIF, and explicitly considered the mesophyll conductance in mediating COS and CO2 diffusion in leaf. By combining the long-term observations of the COS, CO2 fluxes as well as satellited-retrieved SIF from a boreal forest site with CoupModel, we disentangled the impacts of multiple environmental factors on COS, CO2 and SIF. Our results suggested leaf uptake of COS, SIF, gross primary productivity and transpiration show different response to variation in climatic controlling factors. We also demonstrated that the leaf uptake of COS is similar to CO2 on one hand mainly under light and temperature sufficient conditions, e.g., growing-season and daytime. On the other hand, the leaf uptake of COS under the light and temperature limited conditions such as non-growing season and nighttime is existing and different from CO2, as non-negligible uptake of COS occurs while the CO2 uptake is close to zero due to absence of photosynthesis. In summary, our study provides new insights into the controlling factors of COS-CO2-SIF and changes in COS-CO2-SIF relationships across temporal scales. We suggest that more mechanistic study for the ecosystem uptake of COS across multiple time scales is necessary for better utilizing COS to constrain the ecosystem water and carbon fluxes.

How to cite: Zhu, H., Wu, M., and Duan, W.: A unified modeling and understanding of the canopy CO2, COS and SIF processes with a process-based model, EGU General Assembly 2025, Vienna, Austria, 27 Apr–2 May 2025, EGU25-17313, https://doi.org/10.5194/egusphere-egu25-17313, 2025.

EGU25-17514 | ECS | Orals | BG3.7

Enhancing quantification of local carbon sinks through Eddy Covariance CO2 Flux and Machine Learning 

Luca Tuzzi, Marta Galvagno, Gianluca Filippa, and Jacob Nelson

Under the Paris Agreement, countries are encouraged to preserve and enhance existing carbon sinks. Europe, in particular, has committed to achieving climate neutrality—attaining a balance between anthropogenic emissions from sources and removals by sinks—by 2050. Achieving these ambitious goals requires accurate and credible estimation of CO2 fluxes. However, discrepancies between observations and global models hinder the tracking of collective progress towards climate neutrality. Efforts to improve transparency and data comparability are crucial to better align national mitigation strategies with global pathways. In particular, effective climate mitigation policies increasingly depend on local-level actions where detailed data on CO₂ removals from forests and other land uses are traditionally lacking. Addressing the uncertainty in land-sector mitigation potential and enhancing the availability and comparability of data are critical for achieving climate goals by cities and regions. Different models, including process-based and data-driven approaches, exist to estimate land carbon fluxes, but their application and accuracy often vary significantly depending on the scale and quality of input data.

In this study, we tested a data-driven method based on eddy covariance (EC) data to quantify the current role of the regional carbon sink of the Aosta Valley Region (Italy) through the integration of various approaches. Our model relies on FLUXCOM-X framework specifically trained to achieve robust results at the regional scale. An XGBoost model was developed using global hourly meteorological data from sites across the global eddy covariance networks paired with remote sensing data from MODIS. The algorithm was optimized through feature selection analysis and best training subset selection, identifying the ensemble of experimental sites that provided the most accurate predictions while avoiding overfitting. The optimal training subset was obtained via partitioning the full range of sites into subsets based on key characteristics (Plant Functional Type, geographical zone, biogeographical region, elevation). This approach ensured the biophysical comparability of the sites with the target region (Aosta Valley) while maintaining a balance between generalizability and specificity. Model evaluation focused on how the model performed on the local eddy covariance measurements. The resulting model was subsequently upscaled to the regional level. This was achieved using eddy covariance measurements of CO2 fluxes, MODIS NDVI (250 m resolution), daily gridded meteorological data at 100 m resolution, and a land cover map at 250 m resolution. Moreover, the methodology demonstrated potential for replication in other local realities such as regions, providing a flexible framework for assessing local carbon budgets and supporting climate-smart management strategies. Our results were finally compared with independent data from the National Forest Inventory (NFI) available for the target area (Aosta Valley). Discrepancies between methods will be analyzed, considering their strengths, weaknesses, and spatio-temporal variability. 

How to cite: Tuzzi, L., Galvagno, M., Filippa, G., and Nelson, J.: Enhancing quantification of local carbon sinks through Eddy Covariance CO2 Flux and Machine Learning, EGU General Assembly 2025, Vienna, Austria, 27 Apr–2 May 2025, EGU25-17514, https://doi.org/10.5194/egusphere-egu25-17514, 2025.

EGU25-19561 | ECS | Orals | BG3.7

A Protocol to Evaluate Carbon Dioxide Flux Partitioning Methods for Eddy Covariance Data 

Kai-Hendrik Cohrs, Jacob Nelson, Sung-Ching Lee, Matthias Cuntz, Phillip Papastefanou, Ngoc Nguyen, Weiwei Zhan, Mitra Cattry, Thomas Wutzler, Gherardo Varando, Pierre Gentine, Markus Reichstein, and Gustau Camps-Valls

Carbon dioxide (CO₂) flux partitioning involves separating net ecosystem exchange (NEE) into its gross primary production (GPP) and ecosystem respiration (RECO) components. Despite 25 years of flux research and abundant data from networks such as FLUXNET [1], the development and validation of new partitioning methods remain hindered by the lack of a standardized benchmark dataset and evaluation protocol. Existing parametric methods, including nighttime (NT) [2] and daytime (DT) [3] approaches, have become integral to FLUXNET data products but face limitations such as dependency on assumptions and variable robustness across biomes and conditions. Emerging machine-learning (ML)-based methods offer flexibility and reduced reliance on assumptions but require rigorous evaluation [4,5,6].

We establish a benchmark dataset and standardized evaluation protocol to address these challenges. The dataset includes synthetic data generated by multiple mechanistic models, allowing comparison against a known ground truth. These models simulate diverse biomes and environmental conditions, including rapid system changes and extreme events. Additionally, the dataset incorporates realistic data gaps and noise scenarios to test method resilience. The evaluation includes multiple performance metrics across different temporal scales. We assess the ability of methods to capture critical meteorological events and ecological transitions.

Our results indicate that for GPP, ML methods outperform parametric methods at half-hourly scales and in capturing daily anomalies, though the extent of improvement depends on the setup of the ML method. Conversely, NT method performs better at representing the monthly diurnal cycle and seasonal trends. For RECO, the NT method yields the most robust overall results but struggles to capture sudden changes in ecosystem dynamics, which ML methods handle more effectively. Across all methods, daily anomalies remain a persistent challenge, highlighting the need for dynamic ML models. Furthermore, we find that NEE data availability below approximately 30% for a site-year reduces the reliability of the current neural network methods, suggesting the need for transfer or meta-learning schemes or improved gap-filling strategies.

This initiative streamlines the development and comparison of partitioning methods, enabling transparent assessment of their strengths and weaknesses.

References: 

[1] Baldocchi, Dennis, et al. “FLUXNET: A new tool to study the temporal and spatial variability of ecosystem-scale carbon dioxide, water vapor, and energy flux densities.” Bulletin of the American Meteorological Society 82.11 (2001): 2415-2434.

[2] Reichstein, Markus, et al. "On the separation of net ecosystem exchange into assimilation and ecosystem respiration: review and improved algorithm. Global Change Biology 11.9 (2005): 1424-1439. https://doi.org/10.1111/j.1365-2486.2005.001002.x

[3] Lasslop, Gitta, et al. “Separation of net ecosystem exchange into assimilation and respiration using a light response curve approach: critical issues and global evaluation.” Global Change Biology 16.1 (2010): 187–208. https://doi.org/10.1111/j.1365-2486.2009.02041.x

[4] Tramontana, Gianluca, et al. “Partitioning net carbon dioxide fluxes into photosynthesis and respiration using neural networks.” Global change biology 26.9 (2020): 5235-5253. https://doi.org/10.1111/gcb.

[5] Zhan, Weiwei, et al. “Two for one: Partitioning co2 fluxes and understanding the relationship between solar-induced chlorophyll fluorescence and gross primaryp roductivity using machine learning.” Agricultural and Forest Meteorology 321 (2022): 108980. https://doi.org/10.1016/j.agrformet.2022.108980

[6] Kai-Hendrik Cohrs et al. “Causal hybrid modeling with double machine learning—applications in carbon flux modeling.” Machine Learning: Science and Technology 5 (2024): 035021. https://doi.org/10.1088/2632-2153/ad5a60 

How to cite: Cohrs, K.-H., Nelson, J., Lee, S.-C., Cuntz, M., Papastefanou, P., Nguyen, N., Zhan, W., Cattry, M., Wutzler, T., Varando, G., Gentine, P., Reichstein, M., and Camps-Valls, G.: A Protocol to Evaluate Carbon Dioxide Flux Partitioning Methods for Eddy Covariance Data, EGU General Assembly 2025, Vienna, Austria, 27 Apr–2 May 2025, EGU25-19561, https://doi.org/10.5194/egusphere-egu25-19561, 2025.

EGU25-19694 | Posters on site | BG3.7

Enhancing Light Efficiency Modeling with Symbolic Regression and KANs 

Jordi Muñoz-Marí, Álvaro Moreno Martínez, Egor Tiavlovsky, Johannes Hirn, and Gustau Camps-Valls

Maximum light use efficiency (LUEmax) is a key parameter in state-of-the-art global carbon models (GCMs), representing the maximum conversion rate of absorbed photosynthetically active radiation into vegetation biomass under non-stress conditions. Despite its significance, LUEmax is often oversimplified in most GCMs, where its variation is constrained by a limited number of plant functional types (PFTs). This coarse classification overlooks well-documented variability within PFTs and fails to account for adaptation and acclimation processes, introducing substantial uncertainty in carbon cycle estimates.

Recent studies suggest that replacing PFT-based parameterization with spatially explicit LUEmax maps could significantly enhance ecosystem productivity modeling. In this study, we explore the potential of symbolic regression, an emerging machine learning technique based on genetic algorithms for deriving explicit mathematical relationships, alongside Kolmogorov-Arnold Networks (KANs) based on parameterized neural networks, which facilitate interpretable functional discovery, to estimate LUEmax from climatic data and key ecosystem traits.

Using novel plant trait datasets and multiannual flux tower eddy covariance observations combined with MODIS data, we assess the ability of symbolic regression techniques and KANs to derive equations linking LUEmax to ecosystem traits. Our findings demonstrate that these approaches improve the generalization of LUEmax estimation and enhance interpretability, offering significant implications for global-scale environmental modeling and remote sensing applications.

How to cite: Muñoz-Marí, J., Moreno Martínez, Á., Tiavlovsky, E., Hirn, J., and Camps-Valls, G.: Enhancing Light Efficiency Modeling with Symbolic Regression and KANs, EGU General Assembly 2025, Vienna, Austria, 27 Apr–2 May 2025, EGU25-19694, https://doi.org/10.5194/egusphere-egu25-19694, 2025.

EGU25-19775 | ECS | Posters on site | BG3.7

Phenology-Driven Changes in Controls of the Surface Energy Balance Across Different Extratropical Ecosystems  

Olivia Hau, Alexander Winkler, Johanna Kranz, Matthias Forkel, and Mirco Migliavacca

Land surface phenology, which describes the seasonal dynamics of vegetated land, plays a crucial role in regulating the seasonality of water and energy exchange between the land and atmosphere. Changes in key phenological metrics, such as the start of season (SOS) and end of season (EOS), have been observed in extratropical ecosystems using satellite data, and are largely attributed to climate change. These changes can have significant impacts on the surface energy balance, affecting the exchange of heat, moisture, and radiation between the land and atmosphere. However, the magnitude and spatial distribution of these impacts are not yet well understood. 

This study aims to investigate the sensitivity of surface energy balance variables, including turbulent latent and sensible heat fluxes, evaporative fraction, surface albedo, and surface temperature, to changes in SOS and EOS in the extratropical northern hemisphere during the period 2001-2021. We develop a method to quantify the sensitivity of surface energy balance variables to changes in SOS and EOS, using a linear regression approach to extract the slope of the relationship between the phenological indicators and the surface energy balance variables. Our analysis integrates multiple datasets, including ERA5 reanalysis, MODIS remote sensing estimates, GLEAM and FLUXCOM-X observation-guided data products for the water and energy fluxes, and a land-cover type map, to provide a comprehensive assessment of the impacts of phenological changes on the surface energy balance across different plant functional types (PFT). 

Our results show that an earlier SOS is associated with increased turbulent heat fluxes, evaporative fraction, and surface temperature during the time around SOS, while later EOS has similar but less pronounced effects during the time around EOS, with spatial variability and differences among PFTs (for both phenological indicators within and between the different datasets of the surface energy balance variables). These spatial sensitivity patterns are generally consistent across multiple datasets, except for the sensible heat and evaporative fraction sensitivity to SOS, which exhibit considerable variability across datasets. Our analysis by PFT reveals a higher sensitivity of all surface energy balance variable to shifts in SOS in forests, compared to cropland, grassland, and shrubland. Finally, we place our findings on biogeophysical phenology impacts into perspective by comparing them to the effect strength of biogeochemical impacts, providing a comprehensive assessment of the relative importance of these two types of impacts at the land-surface. 

How to cite: Hau, O., Winkler, A., Kranz, J., Forkel, M., and Migliavacca, M.: Phenology-Driven Changes in Controls of the Surface Energy Balance Across Different Extratropical Ecosystems , EGU General Assembly 2025, Vienna, Austria, 27 Apr–2 May 2025, EGU25-19775, https://doi.org/10.5194/egusphere-egu25-19775, 2025.

EGU25-20679 | ECS | Orals | BG3.7

ClimaLand: Advancing Land Surface Modeling with Data-Driven Calibration and GPU Acceleration 

Renato K. Braghiere, Katherine Deck, Alexandre A. Renchon, Julia Sloan, Gabriele Bozzola, Edward Speer, Teja Reddy, Kevin Phan, Nathanael Efrat-Henrici, Oliver Dunbar, Christian Frankenberg, and Tapio Schneider

Land surface models (LSMs) play a pivotal role in Earth System Models by simulating energy, water, and carbon fluxes between the land and the atmosphere. However, existing LSMs face challenges with computational efficiency and the calibration of uncertain parameterizations, particularly for key carbon and water fluxes. To address these limitations, we introduce ClimaLand, a GPU-native LSM designed to integrate machine learning (ML)  parameterizations and calibration frameworks with physical models. ClimaLand's modular architecture allows seamless incorporation of data-driven approaches for unresolved processes, such as subgrid-scale hydrology and canopy-atmosphere coupling, for faster iterations and hypothesis testing.

In this study, we focus on calibrating the latent heat flux, or evapotranspiration, a major source of uncertainty in land-atmosphere interactions. Using observational data from flux towers and remote sensing, we demonstrate how ClimaLand employs Ensemble Kalman Processes (EKP) to optimize parameterizations of stomatal conductance and soil moisture evaporation. Calibration approaches reduced bias during extreme events compared to traditional LSMs.

Benchmarking on GPUs highlights ClimaLand’s computational efficiency, enabling rapid uncertainty quantification and parameter ensemble testing. Results showcase the model’s capacity to improve physical realism and predictive accuracy, particularly for water and energy cycles critical to climate risk assessments.

ClimaLand marks a step forward in leveraging modern computational tools and ML to enhance the accuracy and scalability of LSMs. Future developments will extend to optimality-submodels and increased spatial resolution. 

How to cite: Braghiere, R. K., Deck, K., Renchon, A. A., Sloan, J., Bozzola, G., Speer, E., Reddy, T., Phan, K., Efrat-Henrici, N., Dunbar, O., Frankenberg, C., and Schneider, T.: ClimaLand: Advancing Land Surface Modeling with Data-Driven Calibration and GPU Acceleration, EGU General Assembly 2025, Vienna, Austria, 27 Apr–2 May 2025, EGU25-20679, https://doi.org/10.5194/egusphere-egu25-20679, 2025.

EGU25-439 | ECS | Orals | BG3.8

Different dispersal abilities of plant species impact the future composition and distribution of biomes across the Arctic 

Ronja Schwenkler, Ulrike Herzschuh, Luca Zsofia Farkas, Boris Schröder, and Simeon Lisovski

Recent climate warming has been much faster in the Arctic than in the rest of the world, and is expected to accelerate in the future. These rapid changes will affect arctic biodiversity, threaten certain species and shift their distribution ranges. With a focus on dispersal abilities, we here aim to better understand the dynamics of plant species distributions over the next century, and how these changes may impact the composition and distribution of biomes across the terrestrial Arctic. We developed climate-driven species distribution models (SDM) to predict the emerging climate niches for 1174 plant species under different climate scenarios. The model was parameterized using field observations stored in the Global Biodiversity Information Facility database (GBIF) and temperature and bioclimatic variables from the CHELSA climate data set. Trait-based dispersal rates were assigned to each species according to Lososová et al. (2023) and were implemented and used to predict future habitat with a distance-based probability over time. Our results indicated that given the dispersal constraints, only 15 % of the emerging climate niche would be in reach for colonization of plant species until 2100. Characteristic “boreal forest”-biomes were predicted to gain area while the "tundra"-biome became squeezed between the “boreal forest”-biomes and the sea. The “Palearctic boreal forest”-biome was predicted to colonize more area while the "Nearctic boreal forest"-biome showed the largest spatial displacement to the north. The species composition of the vegetation biomes was predicted to change over time and habitat suitability declined overall. We find that the response of arctic plant species to climate change is not simply a straight migration towards the north but rather a complex interaction of different mechanisms leading to altered distribution ranges. The differences in species’ dispersal abilities could lead to compositional changes within the biomes, which can subsequently result in biome shifts from tundra to boreal forest. Extinction lag and establishment lag might substantially delay the predicted range shifts. For future studies, we recommend to include dispersal constraints as we could show that they substantially impact species distributions.

How to cite: Schwenkler, R., Herzschuh, U., Farkas, L. Z., Schröder, B., and Lisovski, S.: Different dispersal abilities of plant species impact the future composition and distribution of biomes across the Arctic, EGU General Assembly 2025, Vienna, Austria, 27 Apr–2 May 2025, EGU25-439, https://doi.org/10.5194/egusphere-egu25-439, 2025.

EGU25-463 | ECS | Posters on site | BG3.8

Microclimatic functioning of pine bogs in the Bialowieza Primeval Forest 

Adrian Kaszkiel, Kamil Pilch, Kaja Czarnecka, Marcin Klisz, Patrycja Kowalczyk, Michał Słowiński, Ewa Zin, and Sandra Słowińska

Climate change has the influence on the functioning of natural ecosystems, even those barely affected by human activity. Some of the endangered ecosystems, such as pine bogs, strictly depend on groundwater availability, which, due to progressive dry climatic conditions, may be limited in the future (IPCC 2022). Furthermore, the current microclimatic conditions of pine bogs remain poorly understood, making the future of these ecosystems difficult to predict. Having accurate microclimate datasets would enable the identification of relationships between individual components of this ecosystem, leading to increased accuracy in forecasting the impacts of climate change on it. 

The objective of the study was to investigate microclimatic functioning of the pine bogs of the Bialowieza Primeval Forest, which is the largest area of old-growth forest in Europe. The research was conducted at the eight study sites between 2023 and 2024.

In order to gain insight into the microclimatic functioning of the pine bogs, a series of air temperature and humidity measurements in the near ground air layer were conducted. Furthermore, comparisons were made between soil temperature and moisture at the sites, as well as with the reference station situated outside the forest. Additionally, groundwater level was recorded at each site and peat thickness was mapped. Analyses of vegetation composition and horizon obscuration were also performed.

The results indicate that the microclimate of the pine bogs in the Bialowieza Primeval Forest differs significantly from the climate of the open areas outside the forest, with the scale of these differences being seasonally determined. The sites exhibited notable differences in water conditions, peat thickness and vegetation, which influenced the microclimatic functioning. The subsequent step will be to attempt to model the microclimatic conditions of the pine bogs based on the collected data, which will facilitate the prediction of shifts occurring in these ecosystems in the context of climate change.

How to cite: Kaszkiel, A., Pilch, K., Czarnecka, K., Klisz, M., Kowalczyk, P., Słowiński, M., Zin, E., and Słowińska, S.: Microclimatic functioning of pine bogs in the Bialowieza Primeval Forest, EGU General Assembly 2025, Vienna, Austria, 27 Apr–2 May 2025, EGU25-463, https://doi.org/10.5194/egusphere-egu25-463, 2025.

Vegetation phenological shifts impact the terrestrial carbon and water cycle and affect the local climate system through biophysical and biochemical processes. Dynamic global vegetation models (DGVMs), serving as pivotal simulation tools for investigating climate impacts on terrestrial ecosystem processes, incorporate representations of vegetation phenological processes. Nevertheless, it is still a challenge to achieve an accurate simulation of vegetation phenology in the DGVMs. Here, we developed and implemented spring and autumn phenology algorithms into one of the DGVMs, LPJ-GUESS. The new phenology modules are driven by temperature and photoperiod and are parameterized for deciduous trees and shrubs by using remotely sensed phenological observations and the reanalysis data from ERA5. The results show that the LPJ-GUESS with the new phenology modules substantially improved the accuracy in capturing the start and end dates of growing seasons. For the start of the growing season, the simulated RMSE for deciduous trees and shrubs decreased by 8.04 and 17.34 d, respectively. For the autumn phenology, the simulated RMSE for deciduous trees and shrubs decreased by 22.61 and 17.60 d, respectively. Interestingly, we have also found that differences in the simulated start and end of the growing season also alter the simulated ecological niches and competitive relationships among different plant functional types (PFTs) and subsequentially influence the terrestrial carbon and water cycles. Hence, our study highlights the importance of accurate phenology estimation to reduce the uncertainties in plant distribution and terrestrial carbon and water cycling.

How to cite: Chen, S., Fu, Y. H., and Tang, J.: A new temperature–photoperiod coupled phenology module in LPJ-GUESS model v4.1: optimizing estimation of terrestrial carbon and water processes, EGU General Assembly 2025, Vienna, Austria, 27 Apr–2 May 2025, EGU25-692, https://doi.org/10.5194/egusphere-egu25-692, 2025.

EGU25-765 | ECS | Orals | BG3.8

Coupling LPJ-GUESS with ParFlow for Integrated Vegetation and Surface-subsurface Hydrology simulations 

zitong jia, Yongshuo H. fu, Shouzhi Chen, and Jing Tang

Climate change likely accelerates the global hydrological cycle, which poses escalating impacts on human health and the social economy. Soil and groundwater water flow influence vegetation processes by affecting the timing and amount of plant available water. However, most models do not comprehensively represent the interactions between vegetation dynamics and lateral surface-subsurface water processes, which hinders a full understanding of catchment and regional water and carbon fluxes in a changing climate. This study incorporated a fully integrated three-dimensional groundwater flow and overland flow model ParFlow into the dynamic vegetation model LPJ-GUESS to investigate the influence of lateral water connection on vegetation composition and ecosystem carbon cycle. We conducted the stand-alone LPJ-GUESS and the fully coupled LPJ-GUESS-ParFlow simulations in the Yangtze River and the Danube River Basin to assess lateral water flow on simulated hydrological variables, vegetation composition and carbon cycles, as well as their response to climate change. This fully coupled model showed improved performance in simulating catchment soil moisture and runoff, especially for the areas with steep slopes. The coupled model offers a mechanistic framework encompassing well-defined vegetation dynamics, surface-subsurface water interactions, and ecosystem biogeochemical processes, which could be tested in many other catchments to thoroughly study climate-induced modification on plant-water-carbon interactions. 

How to cite: jia, Z., H. fu, Y., Chen, S., and Tang, J.: Coupling LPJ-GUESS with ParFlow for Integrated Vegetation and Surface-subsurface Hydrology simulations, EGU General Assembly 2025, Vienna, Austria, 27 Apr–2 May 2025, EGU25-765, https://doi.org/10.5194/egusphere-egu25-765, 2025.

EGU25-779 | ECS | Posters on site | BG3.8

Dynamic Management Strategies for Plant Pollinator Networks under Anthropogenic Warming Scenarios 

Adrija Datta, Ashish Kumar, Sarth Dubey, and Udit Bhatia

The threat of large-scale pollinator decline is escalating globally due to multiple anthropogenic pressures. The physiological impacts of warming scenarios on terrestrial ectotherms often intensify with the increasing rate of warming. These effects also depend on the network structure of plant-pollinator networks and the physiological sensitivities of ectotherms to temperature changes over time. Previous conservation approaches have predominantly focused on applying consistent strategies over extended periods within single ecosystems. However, in practice, conservation funding is typically allocated for shorter durations. To implement effective conservation strategies, it is essential to first assess the health of a network and then devise an appropriate approach for the next 5-10 years. In this study, we present a new approach for designing region-specific dynamic management strategies tailored to individual networks, accounting for anthropogenic stressors like warming scenarios. Our approach uses sampled plant-pollinator network data from various climatic zones and temperature projections from Earth system models under different future scenarios. We found that plant-pollinator networks with low connectance respond more effectively to species-focused management strategies, such as pollinator management. Conversely, networks with high connectance show greater resilience under habitat-focused management approaches. These findings emphasize the need for dynamic assessment and the development of tailored management strategies for each region. This framework provides a strategic plan for conserving plant-pollinator networks by integrating network structure and regional warming scenarios. It bridges the gap between mutualistic network research and practical conservation ecology, offering a comprehensive approach to safeguarding these critical ecosystems.

How to cite: Datta, A., Kumar, A., Dubey, S., and Bhatia, U.: Dynamic Management Strategies for Plant Pollinator Networks under Anthropogenic Warming Scenarios, EGU General Assembly 2025, Vienna, Austria, 27 Apr–2 May 2025, EGU25-779, https://doi.org/10.5194/egusphere-egu25-779, 2025.

EGU25-2150 | ECS | Orals | BG3.8

Integrating Radiative Transfer with Ecosystem Models to Reflect Litter Dynamic  and Optical Vegetation Properties in Semi-Arid Grasslands 

Arvind Gauns, Javier Pacheco-Labrador, Egor Prikazuik, Christiaan van der Tol, Sönke Zaehle, and Sung-Ching Lee

Savannas, characterized by scattered trees with a grass layer, are key ecosystems in semi-arid regions. They profoundly influence global carbon (C) and water fluxes through high seasonal and inter-annual variations. Understanding these dynamics at the ecosystem scale is essential for better representing their impacts on the Earth’s climate system. Terrestrial ecosystem models (TEM) such as QUINCY (QUantifying Interactions between terrestrial Nutrient CYcles and the climate system), is a new generation TEM that integrates C, nitrogen (N), and phosphorus (P) cycles, are essential for assessing ecosystem responses to climate variability and extremes. However, these models' complexity and reliance on site-specific parameters can limit predictive accuracy, especially in complex ecosystems such as savannas.

Remote sensing (RS) images can be leveraged to improve TEM predictions (e.g., assimilation of RS data) when radiative transfer models (RTM) are coupled with TEMs. In semi-arid grasslands and savannas, the mixture of green and senescent vegetation challenges RS-based vegetation property retrieval. To address this, we integrated senSCOPE, an advanced version of the Soil-Canopy Observation of Photosynthesis and Energy fluxes (SCOPE) RTM that separately simulates green and senescent leaves, with QUINCY to improve the representation of absorbed photosynthetically active radiation (aPAR) and therefore photosynthesis and ecosystem dynamics using RS data.

To leverage the high computational demands of complex RTMs such as senSCOPE, we further developed simplified RTMs based on a two-leaf approach to maintain computational efficiency within QUINCY. These submodels can improve the representation of senescent material in nutrient cycling, thereby improving our understanding of ecosystem processes such as biomass production and litter decomposition. We evaluated the outputs, including gross primary productivity, aPAR, and albedo, against the standard QUINCY model over green and senescent material leaf area fractions using the goodness of fit measures (root mean square error, mean error, and mean absolute error).

By integrating the two-leaf-based advanced RTM and computationally efficient submodels within QUINCY, we achieved a more accurate and cost-effective representation of senescent material in grasslands, respectively.

How to cite: Gauns, A., Pacheco-Labrador, J., Prikazuik, E., van der Tol, C., Zaehle, S., and Lee, S.-C.: Integrating Radiative Transfer with Ecosystem Models to Reflect Litter Dynamic  and Optical Vegetation Properties in Semi-Arid Grasslands, EGU General Assembly 2025, Vienna, Austria, 27 Apr–2 May 2025, EGU25-2150, https://doi.org/10.5194/egusphere-egu25-2150, 2025.

EGU25-2673 | ECS | Orals | BG3.8

Climate Change effects on Nitrogen Cycles in Global Grasslands 

Miao Zheng, Jinglan Cui, Xiaoxi Wang, Xiuming Zhang, Luxi Cheng, Stefan Reis, Shu Kee Lam, Sitong Wang, Zhongrui Xie, Ruoxi Zhang, Xinpeng Xu, Jianming Xu, and Baojing Gu

Grasslands, as one of Earth’s major ecosystems, are critical for sustaining biodiversity, ecosystem services, and global food security. However, their nitrogen cycles are increasingly influenced by climate change, including elevated atmospheric CO2 (eCO2), warming, and shifting precipitation regimes. These changes significantly affect grassland productivity and nitrogen dynamics, with substantial regional variations. Using a synthesis of over 5,000 experimental observations coupled with multiple ecosystem models, we investigated the impacts of climate drivers on nitrogen dynamics under the SSP2-4.5 scenario. Elevated CO2 alone is projected to enhance global grassland net primary productivity (NPP) by 10% while reducing leaf nitrogen content by 8%, resulting in a net increase of 4 Tg yr-1 increase in nitrogen harvest by 2050. Enhanced nitrogen use efficiency (+29%) and biological nitrogen fixation (+66%) under eCO2 would reduce nitrogen surplus (-29 Tg yr-1) and fertilizer demand (-9 Tg yr-1), potentially mitigating nitrogen pollution and yielding economic benefits of 235 billion USD. Warming, as another driver, is projected to increase nitrogen inputs by 17 Tg yr-1 and nitrogen harvest by 12 Tg yr-1 but may exacerbate reactive nitrogen losses by 5 Tg yr-1. Adaptation measures to minimize nitrogen leakage could deliver economic gains of 121 billion USD by 2050. Precipitation shifts further complicate nitrogen dynamics. Regions with increased precipitation, such as the United States and mid-to-high latitude Asia, could see nitrogen harvest rise by 16 Tg yr−1, while areas facing reduced precipitation, including Sub-Saharan Africa and South Asia, risk a 9 Tg yr−1 harvest decline. These imbalances could worsen global inequalities in nitrogen cycles and food security. Our findings highlight the need for improved representation of these complex interactions in ecosystem models to guide climate adaptation strategies. Timely, targeted interventions can help balance benefits and risks, safeguard ecosystem health, and support sustainable, equitable grassland management in a changing climate.

How to cite: Zheng, M., Cui, J., Wang, X., Zhang, X., Cheng, L., Reis, S., Lam, S. K., Wang, S., Xie, Z., Zhang, R., Xu, X., Xu, J., and Gu, B.: Climate Change effects on Nitrogen Cycles in Global Grasslands, EGU General Assembly 2025, Vienna, Austria, 27 Apr–2 May 2025, EGU25-2673, https://doi.org/10.5194/egusphere-egu25-2673, 2025.

EGU25-4029 | ECS | Orals | BG3.8

Microclimate modelling from forest core to edge 

Emma Van de Walle, Steven De Hertog, Félicien Meunier, Kim Calders, Pieter De Frenne, Yanlu Li, Michiel Stock, Francis wyffels, Louise Terryn, Pieter Sanczuk, Tom E. Verhelst, Zhizhi Yang, and Hans Verbeeck

Quantifying forest microclimate dynamics is vital for improving our understanding of ecosystem processes, biodiversity patterns, and carbon sequestration. While existing mechanistic microclimate models effectively simulate conditions within forest cores, they often fail to capture the complexities inherent to forest edges. This limitation is increasingly critical as forest fragmentation creates more edge environments, profoundly influencing microclimate gradients.

To address this gap, we developed a high-resolution microclimate model capable of simulating temperature and radiation gradients from forest core to edge. This novel model integrates 3D heat transfer and 2D radiative processes for 3D explicit forest scenes constructed from terrestrial laser scanning, allowing to account for the unique spatial patterns of microclimate in forest edges. By integrating these mechanisms in full 3D, our model provides a realistic representation of fragmented forest microclimates.

The initial site for applying our model is a 135 m transect in a temperate forest in Gontrode, Belgium. Along this transect, various microclimate sensors are installed, including TMS-4 sensors and an ultrahigh-resolution (25 cm) distributed temperature sensor using optical fiber technology. The model successfully simulates the observed spatial gradients along the transect for different times of the day and across seasons. Moreover, we observe that without including lateral radiation or horizontal heat transfer, microclimate gradients cannot be modelled accurately. These processes are, therefore, essential for simulating microclimates near forest edges.

How to cite: Van de Walle, E., De Hertog, S., Meunier, F., Calders, K., De Frenne, P., Li, Y., Stock, M., wyffels, F., Terryn, L., Sanczuk, P., Verhelst, T. E., Yang, Z., and Verbeeck, H.: Microclimate modelling from forest core to edge, EGU General Assembly 2025, Vienna, Austria, 27 Apr–2 May 2025, EGU25-4029, https://doi.org/10.5194/egusphere-egu25-4029, 2025.

EGU25-4297 | ECS | Posters on site | BG3.8

Modeling carbon cycling in boreal soils under climate change 

Elisabeth Wörner, Matvey Vladimirovich Debolskiy, Rosie Fisher, Frans-Jan Parmentier, and Terje Koren Berntsen

Understanding and accurately representing ecological processes between land reservoirs and the atmosphere is crucial for predicting climate responses. However, the terrestrial carbon cycle in Earth system models remains a source of uncertainty. Particularly boreal soils, which store large amounts of organic matter, are an important player in the global carbon cycle, and are therefore a key component in terrestrial models. 

Recent advancements, such as microbial-explicit models, have improved the modeling of carbon cycling and soil decomposition processes. Further, is the symbiosis between mycorrhizal fungi and vegetation is a critical ecological process influencing climate dynamics. The exchange of nutrients between the symbionts not only affects carbon storage and vegetation growth, it also impacts biogeophysical aspects of the vegetation, such as albedo, surface roughness, and transpiration. Incorporating and refining those biogeochemical processes in the terrestrial carbon cycle in Earth system models is essential for enhancing predictions of soil and vegetation responses to global warming.

Coupling the microbial-explicit soil decomposition model, MIMICS+, into the Earth system model CTSM, and connecting the mycorrhizal component of MIMICS+ to the above-ground vegetation will enable feedback mechanisms between soils and vegetation. This integration aims to improve the representation of ecosystem-climate feedbacks and provide a more robust tool for understanding the impacts of climate change on terrestrial ecosystems.

How to cite: Wörner, E., Debolskiy, M. V., Fisher, R., Parmentier, F.-J., and Berntsen, T. K.: Modeling carbon cycling in boreal soils under climate change, EGU General Assembly 2025, Vienna, Austria, 27 Apr–2 May 2025, EGU25-4297, https://doi.org/10.5194/egusphere-egu25-4297, 2025.

EGU25-4898 | ECS | Orals | BG3.8

Synchronous monitoring of maize phenology stages and leaf area index by integrating Vision Transformer and ResNetV2_34d 

Haoze Zhang, Wenzhi Zeng, Tao Ma, Jing Huang, Yi Liu, Zhipeng Ren, and Chang Ao

AbstractCrop growth phenology and leaf area index (LAI) are essential monitoring indicators in precision agriculture, playing a key role in crop management, yield prediction, and assessing responses to environmental changes. Traditional agricultural monitoring methods are constrained by limitations such as low temporal resolution and poor spatial resolution. This study proposes a synchronous monitoring model (SMM) for maize phenological stages and LAI using Unmanned Aerial Vehicle (UAV) imagery, leveraging deep learning techniques to improve inversion accuracy. More exactly, the input variables include multispectral images, thermal infrared images, solar radiation (SRT), evapotranspiration (ETP), and effective accumulated temperature (Tsum). To effectively extract image features, the Vision Transformer (ViT) and ResNetV2_34d models were employed. These deep learning models effectively leverage the spatial information within the images, significantly improving the prediction accuracy of crop phenology (BBCH) and LAI. The results demonstrate that the SMM outperforms traditional methods, achieving substantial improvements in BBCH and LAI inversion accuracy. By integrating deep convolutional neural networks (CNN) with self-attention mechanisms, the ViT captures long-range dependencies in remote sensing images, while ResNetV2_34d enhances the model's ability to extract detailed features. Furthermore, the SMM exhibits superior robustness in spatial information extraction and feature fusion. This study presents an innovative deep learning framework for crop growth monitoring, integrating remote sensing data and climatic factors to facilitate more precise agricultural production management and regulation, thereby contributing to sustainable agricultural development.


Key words: Crop growth phenology; Leaf area index; Deep learning; Vision Transformer; Precision agriculture

How to cite: Zhang, H., Zeng, W., Ma, T., Huang, J., Liu, Y., Ren, Z., and Ao, C.: Synchronous monitoring of maize phenology stages and leaf area index by integrating Vision Transformer and ResNetV2_34d, EGU General Assembly 2025, Vienna, Austria, 27 Apr–2 May 2025, EGU25-4898, https://doi.org/10.5194/egusphere-egu25-4898, 2025.

EGU25-5554 | Orals | BG3.8

Canopy structure regulates autumn phenology by mediating microclimate in temperate forests 

Yanjun Su, Xiaoyong Wu, Chunyue Niu, Xiaoqiang Liu, Tianyu Hu, Yuhao Feng, Yingyi Zhao, Shuwen Liu, Zhonghua Liu, Guanhua Dai, Yao Zhang, Koenraad Meerbeek, Jin Wu, Lingli Liu, and Qinghua Guo

Autumn phenology plays a critical role in shaping the carbon sequestration capacity of temperate forests. Notable local-scale variations in autumn phenology have drawn increasing attention recently, potentially introducing substantial uncertainty when predicting temperate forest productivity. Yet, the underpinning mechanisms driving these variations remain inadequately elucidated. While macroclimate conditions are traditionally recognized as primary determinants of autumn phenology, they fail to explain inter-crown variations occurring within the same macroclimate environment. Here, we hypothesize that canopy structure serves as a key determinant of the local-scale variations of autumn phenology in temperate forests by mediating microclimate conditions. To test this hypothesis, we develope microForest, a novel lightweight forest microclimate model capable of efficiently and accurately predicting under-canopy air temperature at high temporal and spatial resolutions using readily available remote sensing data and meteorological reanalysis products as inputs. Our results reveal significant and consistent relationships between canopy structure and autumn phenology across six temperate forest sites, induced by the regulation effect of canopy structure on microclimate conditions. Incorporating the identified “canopy structure-microclimate-autumn phenology” pathway into existing autumn phenology models significantly improves the prediction accuracy and reduces the projected delay in the start of autumn over the remainder of the century. These findings offer a new perspective for interpreting the local variations of autumn phenology in temperate forests and emphasize the urgent need to integrate the identified pathway into Earth system and vegetation models, especially considering the asynchronous changes of macroclimate and microclimate conditions.

How to cite: Su, Y., Wu, X., Niu, C., Liu, X., Hu, T., Feng, Y., Zhao, Y., Liu, S., Liu, Z., Dai, G., Zhang, Y., Meerbeek, K., Wu, J., Liu, L., and Guo, Q.: Canopy structure regulates autumn phenology by mediating microclimate in temperate forests, EGU General Assembly 2025, Vienna, Austria, 27 Apr–2 May 2025, EGU25-5554, https://doi.org/10.5194/egusphere-egu25-5554, 2025.

EGU25-8571 | ECS | Orals | BG3.8

Modelling microclimatic variability in Andean forests of northern Patagonia 

Jonas Fierke, Birgitta Putzenlechner, Alois Simon, Juan Gowda, Ernesto Reiter, Helge Walentowski, and Martin Kappas

Information on microclimatic conditions beneath canopies is key to understanding small-scale ecological processes, especially concerning the response of biodiversity to climate change. In north-western Patagonia, where data on climate-driven species distribution are scarce, our study provides valuable insights by providing microclimatic models covering spatiotemporal dynamics at 30 x 30 m resolution. Applying in-situ data from 2022 to 2024, we employed a random forest-based regression to assess the impact of several biophysical predictor variables describing terrain and vegetation properties on four microclimatic response variables at three vertical levels within forests. We also interpolated this data spatiotemporally, using statistical downscaling of ERA5 data. Our analysis reveals that the influence of the predictor variables varies strongly by month and response variable. Moreover, significant variability was observed between the models and months regarding their explanatory power and error range. For instance, the model predicting maximum air temperature at a 2 m height achieved an R² of 0.88 and an RMSE of 1.5°C, while the model for minimum air temperature resulted in an R² of 0.73 and an RMSE of 1.8°C. Our model approach provides a benchmark for spatiotemporal projections in this data-scarce region, aligned with the climate normal from 1981 to 2010. Future refinement could benefit from data on snow cover, land use and land cover, soil, as well as structural information on vegetation over an extended period, to enhance the dynamical aspects of microclimatic modelling. We are confident that our present model will substantially enhance possibilities to analyse species distribution across vegetation types and terrain-related features within the area.

How to cite: Fierke, J., Putzenlechner, B., Simon, A., Gowda, J., Reiter, E., Walentowski, H., and Kappas, M.: Modelling microclimatic variability in Andean forests of northern Patagonia, EGU General Assembly 2025, Vienna, Austria, 27 Apr–2 May 2025, EGU25-8571, https://doi.org/10.5194/egusphere-egu25-8571, 2025.

EGU25-9296 | ECS | Orals | BG3.8

Exploring plant distribution shifts in a non-stationary climate with an ecohydrological model 

Fuxiao Jiang, Simone Fatichi, Gianalberto Losapio, and Nadav Peleg

Hydro-climatic conditions control the spatial distribution of many plant species, and with a changing climate, shifts in distribution patterns are foreseen. Beyond affecting species distribution, climate change at high elevation is altering land cover with processes such as glacier retreats providing new terrains for plant colonization and succession. Predicting plant distribution shifts under climate change has led to the development of various models in different communities, including species distribution models (SDMs) and dynamic global vegetation models (DGVMs). SDMs are predominantly data-driven and DGVMs often simplify processes representation of energy and water budget or look at very large scales. At finer scales, ecohydrological models comprehensively reproduce key components of hydrological cycle and vegetation dynamics but typically cannot explicitly simulate plant distribution dynamics. To address these limitations, we incorporate a seed dispersal and establishment kernel into the T&C mechanistic ecohydrological model. The model features the migration and interaction of plant species while maintaining accurate representations of water and energy budgets alongside plant physiological properties. Two catchments that have experienced substantial vegetation shifts over the past decades are chosen as evaluation sites. This model exhibits good quantitative agreement with historical vegetation records and provides insights through sensitivity analysis into the environmental factors driving rapid shifts in plant distribution. We show that ecohydrological models, enhanced with seed dispersal and establishment mechanisms, could be potentially used to investigate plant distribution dynamics at the catchment scale and can deepen our understanding of how climate change influences plant encroachment and disappearance.

How to cite: Jiang, F., Fatichi, S., Losapio, G., and Peleg, N.: Exploring plant distribution shifts in a non-stationary climate with an ecohydrological model, EGU General Assembly 2025, Vienna, Austria, 27 Apr–2 May 2025, EGU25-9296, https://doi.org/10.5194/egusphere-egu25-9296, 2025.

The canopies of mature trees establish a vertical microclimatic gradient, especially in light availability. The decreasing irradiance from top to bottom of canopies lead to significant differences in the seasonal C assimilation between the uppermost and lowest branches of mature tree crowns. But whether this translates also to differences in the seasonal net C-balance of sun- vs. shade branches remains unclear. Here, we present in-situ measurements of upper and lower branches from mature canopies of three conifer species and 6 broadleaved tree species at the mixed temperate forest of the Swiss Canopy Crane II facility. We combined a light-driven model of the seasonal photosynthesis with branch functional growth analyses to test whether the relative C investment in structural biomass and C reserves (starch) of one-year-old branches differ between the uppermost, sun-exposed and lowest, most shaded branches.

We found that amortization times for the C costs of one-year-old branches varied widely among species, but only in a few species also between sun and shade branches. Interestingly however, expressed as a percentage of the total branch C uptake, the structural C-costs were surprisingly similar across species and crown positions between 15 and 25 % of the total seasonal C assimilation per branch. Key shade acclimations included SLA, dark respiration rates and photosynthetic low-light efficiency. We further found that a similar proportion of the total C assimilation is required for the seasonal starch build-up in sun and shade branches. Our results thus show that the balance of assimilation and both structural and non-structural C costs at the branch-level is finely tuned along the vertical light gradient, suggesting a high degree of C autonomy even in the most shaded branches of our investigated trees.

How to cite: Hoch, G., Zehnder, M., Kahmen, A., and Zahnd, C.: Relative carbon costs for growth and starch formation of young branches are similar along the vertical microclimatic gradient of mature forest canopies, EGU General Assembly 2025, Vienna, Austria, 27 Apr–2 May 2025, EGU25-9558, https://doi.org/10.5194/egusphere-egu25-9558, 2025.

EGU25-10623 | ECS | Orals | BG3.8

The need and challenges of jointly simulating vegetation structure, diversity and ecosystem functioning: a tropical forest perspective 

Isabelle Maréchaux, Fabian Jörg Fischer, Sylvain Schmitt, and Jérôme Chave

Despite a long history of vegetation modelling, robustly simulating vegetation dynamics remains a complex but highly needed task. There is a growing consensus that vegetation models need to better integrate forest structure, diversity and ecosystem functioning to tackle this research challenge. However, this has long been hindered by a coarse-grained representation of vegetation and subsequent difficulties to assimilate field data. Here I will present recent developments in an individual- and trait-based model of forest dynamics, TROLL 4.0. I will discuss the modelling choices we made to jointly simulate carbon and water fluxes, leaf phenology, as well as individual tree size and trait distribution, and evaluate them against a range of field-based and remotely-sensed data at two Amazonian sites. Based on this example, I will finally discuss several challenges that remain to fully bridge the gap between plant ecology, vegetation remote sensing and ecosystem modelling, and to improve our understanding and predictive ability of vegetation contribution to the Earth’s system.

How to cite: Maréchaux, I., Fischer, F. J., Schmitt, S., and Chave, J.: The need and challenges of jointly simulating vegetation structure, diversity and ecosystem functioning: a tropical forest perspective, EGU General Assembly 2025, Vienna, Austria, 27 Apr–2 May 2025, EGU25-10623, https://doi.org/10.5194/egusphere-egu25-10623, 2025.

EGU25-10771 | ECS | Posters on site | BG3.8

Modeling Seasonal Carbon and Water Dynamics in Dryland Ecosystems: Challenges for Process-Based Models 

Aleksei Lipavskii, Phillip Papastefanou, René Orth, and Sönke Zaehle

Terrestrial ecosystems play a key role in the global carbon cycle, and drylands cover most of the land area and are very likely to expand as climate change causes evaporation to increase faster than precipitation. At the same time, they are often overlooked, and currently models cannot reproduce seasonal patterns of the vegetation in drylands.

The main reasons for this problem are the complexity and diversity of the processes that govern the terrestrial ecosystems' functioning; they may be missing or under-represented in the models. Among such processes, one can first emphasize the response of vegetation to water availability and its asymmetry, as well as soil and plant hydraulics, fires, and additional groundwater sources.

This study uses the terrestrial biosphere model QUINCY, that simulates the energy, water and carbon balance and vegetation dynamics of global terrestrial ecosystems. Our simulations cover 15 sites in the USA, Australia and Europe, which were chosen as arid sites based on water balance and temperature. The results are validated with data from the FLUXNET database and the Copernicus projects.

It was found that, on average, the QUINCY model overestimates gross primary productivity (GPP) and sensible heat (SH) values in dry areas. Also, water use efficiency (WUE) according to the model is higher compared to observations, and evaporation fraction (EF) is lower at most of the studied sites. Sensitivity analysis improved model performance at only a few sites, suggesting inadequate representation of key dryland vegetation dynamics. These results can be used to understand what processes need to be modified or added to improve performance.

How to cite: Lipavskii, A., Papastefanou, P., Orth, R., and Zaehle, S.: Modeling Seasonal Carbon and Water Dynamics in Dryland Ecosystems: Challenges for Process-Based Models, EGU General Assembly 2025, Vienna, Austria, 27 Apr–2 May 2025, EGU25-10771, https://doi.org/10.5194/egusphere-egu25-10771, 2025.

EGU25-10911 | ECS | Posters on site | BG3.8

Simulating the drought response of water and carbon cycle in European forests with a dynamic vegetation model  

Benjamin F. Meyer, João P. Darela-Filho, Allan Buras, and Anja Rammig

The forest carbon sink is crucial to climate change mitigation efforts. At the same time forests are threatened by climate-change induced extremes. In Europe, increasingly frequent and severe droughts are one of the main culprits endangering the forest carbon sink. Understanding how droughts may alter water- and carbon-cycle dynamics of forests is essential to preparing for an almost inevitably hotter and drier future. Here, dynamic vegetation models (DVMs) serve as useful tools for studying how extremes can impact the carbon and water cycles. In recent years, many DVMs have consequently begun including mechanistic representations of plant hydraulic architecture.


We use a version of LPJ-GUESS with plant hydraulic architecture, water-potential regulation strategies, and hydraulic failure mortality (LPJ-GUESS-HYD) and extend its capabilities by including aspects of turgor-driven growth dynamics to better simulate the impact of drought on the water and carbon cycles for common European forest tree species. We evaluate the performance of LPJ-GUESS for 12 European tree species across a network of 37 eddy-covariance flux sites covering a wide climatic and geographic gradient.


Our results indicate that LPJ-GUESS-HYD is able to simulate observed patterns of evapotranspiration more accurately than the standard version of LPJ-GUESS. Additionally, we show that LPJ-GUESS-HYD can simulate a wide range of species-specific evapotranspiration and canopy conductance in response to increasing VPD in line with established theories on the isohydric-anisohydric continuum. Lastly, our results suggest that the currently implemented model processes responsible for governing the response of water fluxes to drought are not as crucial in regulating the simulated carbon response to drought. This indicates that a shift toward more sink-driven model processes may be necessary to capture the full effect of drought on both the water and carbon cycles.


Given these results, future model development should focus on the interplay of source and sink processes in regulating tree response to extreme events such as drought. In particular, our results suggest that reliably modeling drought impacts entails improving the representation of water limitation not only on photosynthesis but, independently, also on growth. Here, we present results for the impact of drought on the modeled water cycle and discuss concepts and ideas related to improving the simulated effect of drought on the carbon cycle.

How to cite: Meyer, B. F., Darela-Filho, J. P., Buras, A., and Rammig, A.: Simulating the drought response of water and carbon cycle in European forests with a dynamic vegetation model , EGU General Assembly 2025, Vienna, Austria, 27 Apr–2 May 2025, EGU25-10911, https://doi.org/10.5194/egusphere-egu25-10911, 2025.

EGU25-11605 | ECS | Posters on site | BG3.8

Biomass allometry for shrubs at a UK rewilding site 

Emily Upcott, Douglas Kelley, Charles George, Richard Broughton, Rafael Barbedo, Josh Hall, and France Gerard

The planting and growth of trees and forests are a major component of meeting international net zero emissions targets. A more passive and cost-effective approach to meeting these targets is the natural regeneration or colonisation of native woody species, including shrubs. There has been much research into how trees and forests sequester carbon and increase in biomass, with a wealth of biomass calculations and allometric equations available. However, there is a contrasting lack of this information for shrubs. Biomass equations for shrubs need to differ to those for trees due to their inherent structural differences, and also recognise that we do not have the same levels of data to train models on this massively diverse vegetation type. Diameter at breast height (DBH) is often cited as the single most influential metric to derive biomass, but this can be impractical or unclear for many shrubs: a different metric must be used. Hawthorn (Crataegus monogyna; Jacq.) is a multi-stemmed, multi-branched thorny shrub native to Europe, North Africa and western Asia. Despite its broad geography, there is little information describing this species’ allometry or biomass.


Our aim was to generate an allometric equation for the above-ground biomass of distinct hawthorn shrubs by adapting existing allometric equations and using field-collected measurements to generate a coefficient that accounts for the diverse structural relationships brought about by the multi-stemmed nature of hawthorn compared to trees.


Our study site was a 150ha rewilding site in Bedfordshire, East of England. In the 35 years since farm management was withdrawn, shrubs and other vegetation have been allowed to naturally colonise the previously arable fields. Hawthorn is common here in an unmanaged distinct form, as well as in overgrown hedgerows and merged canopies with other shrubs and species. In a first visit, we measured shrub height and crown diameter measurements for 36 distinct hawthorn shrubs up to 5m in height. In a second visit, we destructively sampled 27 of these and an additional 55 hawthorn shrubs and measured wet weight in situ.


To analyze this data, we employed a Maximum Entropy allometric model using Bayesian inference. This approach enabled us to quantify the likely range of biomass values based on our allometric measurements while accounting for the inherent uncertainty caused by incomplete or missing data. Preliminary results from this model are promising, and we are working towards linking these findings with Earth Observation (EO) data to extend the application of shrub allometry to larger spatial scales. By integrating field-derived measurements with EO techniques, we aim to estimate biomass not only for individual shrubs but also for entire shrubland areas, providing a broader perspective on carbon storage potential.


Additionally, we welcome feedback on the types of allometric relationships we have assumed and invite discussions on how our newly developed models might find applications in other fields. These efforts could pave the way for improved understanding and management of shrubland ecosystems in the context of global carbon accounting.

How to cite: Upcott, E., Kelley, D., George, C., Broughton, R., Barbedo, R., Hall, J., and Gerard, F.: Biomass allometry for shrubs at a UK rewilding site, EGU General Assembly 2025, Vienna, Austria, 27 Apr–2 May 2025, EGU25-11605, https://doi.org/10.5194/egusphere-egu25-11605, 2025.

EGU25-13087 | ECS | Posters on site | BG3.8

A new implementation of dwarf-shrub plant functional type within the CLM-FATES land-surface model  

Jeanne Rezsöhazy, Rosie A. Fisher, Sonya R. Geange, Aud H. Halbritter, Hui Tang, and Vigdis Vandvik

Ericaceous dwarf-shrubs are a key actor of the boreal, arctic and alpine biomes in which they are locally dominant and extensively spread, affecting biodiversity, ecology and ecosystem functioning. In particular, they play  significant roles in ecosystem carbon sequestration and long-term storage through interactions with belowground fungal networks. These effects may have an important influence on feedback mechanisms between terrestrial ecosystems and the global climate system. This role may be noticeably affected by climate change. However, the dwarf-shrub interactions with climate are still poorly understood, and this plant functional type is currently underrepresented in climate-biosphere science.  

The objective of the DURIN project is to explore the role of dwarf-shrubs in climate responses and feedbacks across biomes and habitats in Norway, and to provide new insight on the direct and indirect effects of climate change on this plant functional type and its ecosystem functions and services. Land-surface models offer a particularly convenient framework to explore and quantify the complexity of the relationship between the climate system and dwarf-shrub plant functional type, as well as the impacts of climate change on related ecosystems across Norway.  

As part of this project, we propose here to implement dwarf-shrub plant functional type within the Community Land Model (CLM) coupled with the Ecosystem Demography model FATES (Functionally Assembled Terrestrial Ecosystem Simulator). By taking advantage of the enhanced understanding achieved through the other work packages of the project, we will first parametrize the new plant functional type and integrate it into the CLM-FATES model. We will use the field observations from the other work packages to calibrate the CLM-FATES model at site-level across environmental gradients of temperature, precipitation and light availability. Using the new implementation of dwarf-shrubs into the CLM-FATES model, we will ultimately assess the role of dwarf-shrubs in both biochemical and biophysical climate feedbacks.

How to cite: Rezsöhazy, J., Fisher, R. A., Geange, S. R., Halbritter, A. H., Tang, H., and Vandvik, V.: A new implementation of dwarf-shrub plant functional type within the CLM-FATES land-surface model , EGU General Assembly 2025, Vienna, Austria, 27 Apr–2 May 2025, EGU25-13087, https://doi.org/10.5194/egusphere-egu25-13087, 2025.

EGU25-14367 | Orals | BG3.8

Optimal light use strategy explains seasonal dynamics and trends in vegetation greenness 

Ziqi Zhu, Han Wang, Boya Zhou, Wenjia Cai, Sandy P. Harrison, Martin G. De Kauwe, and I. Colin Prentice

“Greenness” is a key indicator of the functional state of vegetation. However, physiological processes behind seasonal patterns in greenness are diverse and incompletely understood, hindering the predictability of climate-driven shifts in global foliage phenology. Optimality principles suggest plants invest in canopy architecture to maximize light capture. Therefore, we hypothesize, irrespective of specific physiological mechanisms, greenness (fAPAR: fractional canopy light absorption) tracks seasonal dynamics of potential production (A0: theoretical canopy carbon uptake with all light absorbed). In other words, plants everywhere display foliage when it is most productive. We show that observations confirm this hypothesis, and develop a model predicting fAPAR from the seasonal cycle of A0 with a time-lag increasing (from two weeks to three months) with moisture. This model captures 81% of observed variations in fAPAR and shows that light and environmentally regulated biophysical constraints drive global patterns of vegetation greenness, its seasonal cycle, and its recent increase. 

How to cite: Zhu, Z., Wang, H., Zhou, B., Cai, W., Harrison, S. P., De Kauwe, M. G., and Prentice, I. C.: Optimal light use strategy explains seasonal dynamics and trends in vegetation greenness, EGU General Assembly 2025, Vienna, Austria, 27 Apr–2 May 2025, EGU25-14367, https://doi.org/10.5194/egusphere-egu25-14367, 2025.

Under future climate change, plants are expected to experience increased water stress. Most terrestrial biosphere models use empirical soil moisture stress factors to capture the impacts of droughts on stomatal conductance and photosynthesis. However, this empirical approach lacks a mechanistic representation of water flow in the soil-plant-atmosphere continuum (SPAC) and causes uncertainties in simulated carbon and water fluxes. In this study, a plant hydraulic module was developed and integrated into the process-based Biosphere-atmosphere Exchange Process Simulator (BEPS-EcoHydro). The plant hydraulic module considers three mechanisms of water uptake: water supply driven by the water potential gradient between soil and leaf, water demand due to potential transpiration, and water storage within the plant. Finally, the effect of water stress on photosynthesis is quantified via a linkage to leaf water potential. BEPS-EcoHydro and original BEPS were run to simulate water and carbon fluxes in a drought-prone temperate deciduous forest located in the Ozark region of central Missouri, USA, during 2005-2019. The results showed that BEPS-EcoHydro effectively captured variations in predawn leaf water potential at the ecosystem scale, and also outperformed the original BEPS in simulating soil moisture. Additionally, BEPS-EcoHydro performed better than the original model in simulating evapotranspiration (ET) and gross primary production (GPP), especially at the hourly scale. Importantly, BEPS-EcoHydro captured drought impact better than the original BEPS. These results suggest that consideration of plant hydraulics in process-based ecosystem models is needed to better understand vegetation responses to climate extremes.

How to cite: Hu, L., Wu, M., and Ju, W.: Improved drought impacts detection with the novel implementation of plant hydraulics into an ecosystem model, EGU General Assembly 2025, Vienna, Austria, 27 Apr–2 May 2025, EGU25-15237, https://doi.org/10.5194/egusphere-egu25-15237, 2025.

EGU25-15573 | ECS | Orals | BG3.8

Quantifying CO2 and CH4 fluxes and their seasonal dynamics in a temperate wetland with water table fluctuations  

Bingqian Zhao, Wenxin zhang, Peiyan Wang, Adrian Gustafson, Stefan Olin, and Bo Elberling

Wetlands are the largest and most uncertain natural contributor of atmospheric methane (CH4) with water table fluctuations being a key factor controlling spatial and temporal variations. Natural dry summer months are here linked to low water table, increased oxygen diffusing into the soil and corresponding carbon dioxide (CO2) and CH4 fluxes in a Danish temperate wetland north of Copenhagen. We used the process-based model LPJ-GUESS to quantify the dynamic changes in CO2 and CH4 fluxes in the past 17 years, with an improved methane algorithm considering both methane production and oxygen transport influenced by water table level, CH4 consumption rates with the vertical distribution of methanotrophs. Our findings show that the model successfully can reproduce the temporal of pattern five-year (2007-2011) oxygen concentration in the soil profile with water fluctuation and corresponding CO2 and CH4 fluxes. For 2007-2023, the calibrated model simulates the site as a net CO2 sink of -77 ± 81 g C-CO2 m-2 year-1 and a CH4 source of 1.48 ± 0.84 g C-CH4 m-2 year-1. For changes in seasonal pattern, precipitation has a significant declining trend in early- and mid-growing season (March to July) (-9.2 mm per year, p < 0.05), with the largest reduction in June (-4.8 mm per year, p < 0.01), encountering the growth peak of vegetation. Such reduced precipitation mitigates methane emission (-0.04 g C-CH4 m-2 per year, p < 0.01) and increases net ecosystem exchange (+5.1 g C-CO2 m-2 per year, p < 0.05) in early and mid of the growing season with the interplay of a lower water table. The average budget of radiative balance with a lower annual mean water table (-0.31 m) was enhanced to -58 g C-eq m-2 year-1, while -556 g C-eq m-2 year-1 with a higher annual mean water table (-0.14 m), which is mainly explained by that lower water table decreased C assimilation and increased soil respiration.

How to cite: Zhao, B., zhang, W., Wang, P., Gustafson, A., Olin, S., and Elberling, B.: Quantifying CO2 and CH4 fluxes and their seasonal dynamics in a temperate wetland with water table fluctuations , EGU General Assembly 2025, Vienna, Austria, 27 Apr–2 May 2025, EGU25-15573, https://doi.org/10.5194/egusphere-egu25-15573, 2025.

EGU25-17149 | ECS | Orals | BG3.8

Temperatures at global forest edges exceed vegetation productivity optima 

Josephine Reek, Thomas Crowther, Thomas Lauber, Sebastian Schemm, David Parastatidis, Nektarios Chrysoulakis, Mengtian Huang, Shilong Piao, and Gabriel Smith

Ongoing fragmentation puts increasing parts of the world’s forests in proximity to edges. Forest edges are known to differ from interiors for many ecosystem variables like biomass and species diversity, but also microclimate. While it is documented that temperatures change with presence and absence of forests, our knowledge of edge effects in temperatures (temperature change with distance to forest edge) is largely restricted to local studies and shorter timeframes. Here, we use satellite data to investigate edge effects in surface temperature of forests across the globe and across seasons. We find that edge effects indeed exist, with the forest interior generally being cooler, though effect sizes differ with biome and season. Worryingly, summer temperatures at forest edges lie above the optimal temperature for ecosystem level vegetation productivity across the globe, especially in the tropics. Our analyses suggest that the creation of forest edges through fragmentation reduces the ability of remnant forest patches to regulate their local temperatures, leading to hotter edges, which may hamper ecosystem productivity.

How to cite: Reek, J., Crowther, T., Lauber, T., Schemm, S., Parastatidis, D., Chrysoulakis, N., Huang, M., Piao, S., and Smith, G.: Temperatures at global forest edges exceed vegetation productivity optima, EGU General Assembly 2025, Vienna, Austria, 27 Apr–2 May 2025, EGU25-17149, https://doi.org/10.5194/egusphere-egu25-17149, 2025.

EGU25-17385 | ECS | Posters on site | BG3.8

Forest microclimate representations in land surface and ecosystem models: an inter-comparison 

Julien Alléon, Catherine Ottlé, Jérôme Ogée, Klara Bouwen, Rémi Lemaire-Patin, and Philippe Peylin

Land Surface Models (LSMs) are key components of Earth system models as they describe the spatial and temporal dynamics of vegetation and how it exchanges energy, momentum, water and CO2 with the atmosphere. These models have been greatly improved over the last fifty years to include more and more processes such as carbon and nutrient cycling, plant hydraulics or vegetation dynamics. However, in most LSMs, the vertical structure of vegetation canopies is taken into account only implicitly, through surface parameters such as displacement height or roughness height. This implicit representation of vegetation canopies prevents the estimation of the microclimate within and below the canopy and its influence on the energy, water and carbon exchanges. The representation of below-canopy microclimate seems to be a key development in order to improve energy and water balance descriptions in LSMs and our knowledge on forest response to a changing climate. This need justifies the current efforts of the land surface community to explicitly represent canopy microclimate in LSMs. This poster presents the main developments introduced in the ORCHIDEE LSM to address this need. A multi-layer energy budget representation previously implemented in an earlier version of ORCHIDEE (Ryder et al. (2015)) has been re-implemented, adapted and improved in the main ORCHIDEE version (i.e. Trunk) in order to represent the exchange of water and energy between vegetation and the atmosphere, and the turbulent transport of mass, energy and momentum within vegetation canopies. This model is evaluated against in situ observations, and compared with a more complex ecosystem model, MuSICA (Ogée et al. (2003)). To provide a comprehensive understanding of the strengths and drawbacks of the two models, and to pave the way to future improvements to the ORCHIDEE LSM, this model inter-comparison is carried out over a dataset that gathers measurements of intra-canopy temperature and humidity profiles and fluxes from 10 forest sites. In addition to the results of this inter-comparison, new perspectives for the ORCHIDEE community and general thoughts on microclimate modelling in LSMs induced by these developments will be drawn.

How to cite: Alléon, J., Ottlé, C., Ogée, J., Bouwen, K., Lemaire-Patin, R., and Peylin, P.: Forest microclimate representations in land surface and ecosystem models: an inter-comparison, EGU General Assembly 2025, Vienna, Austria, 27 Apr–2 May 2025, EGU25-17385, https://doi.org/10.5194/egusphere-egu25-17385, 2025.

EGU25-17750 | ECS | Posters on site | BG3.8

Drivers and Divergent Impacts of Rising Vapor Pressure Deficit on Global Vegetation Productivity 

Shanshan Chen and Minchao Wu

Atmospheric vapor pressure deficit (VPD) is a critical climate variable influencing vegetation productivity and the global carbon cycle. With climate warming, VPD has been increasing globally, but its effects on gross primary production (GPP) remain poorly understood, leading to uncertainties in predicting terrestrial ecosystem responses. This study classified the causes of VPD increase into three different types: temperature-driven, combined temperature and relative humidity-driven, and relative humidity-driven, to investigate the spatial heterogeneity and drivers of VPD impacts on GPP using three datasets-FLUXCOM_GPP, GOSIF_GPP, and VPM_GPP-spanning 2000 to 2018. By integrating trend analysis, partial correlation techniques, and random forest models, the results reveal a distinct latitudinal gradient in the relationship between VPD and GPP, characterized by a "Z-shaped" pattern. Near the equator and at high latitudes, VPD positively influences GPP, whereas in mid-latitudes, the relationship is predominantly negative. This variation is shaped by the climatic background and the interplay of water and energy-related factors. For example, in regions with synchronous changes in temperature and humidity, VPD effects on GPP tend to be neutral or positive. Conversely, asynchronous changes exacerbate negative effects, particularly in humidity-driven regions. This study provides a mechanistic understanding of the drivers of interannual GPP variability across different climatic contexts, implying the importance of biodiversity in shaping vegetation responses to climate extremes and affecting the overall ecosystem vulnerability and global carbon cycle under future warming.

How to cite: Chen, S. and Wu, M.: Drivers and Divergent Impacts of Rising Vapor Pressure Deficit on Global Vegetation Productivity, EGU General Assembly 2025, Vienna, Austria, 27 Apr–2 May 2025, EGU25-17750, https://doi.org/10.5194/egusphere-egu25-17750, 2025.

EGU25-18924 | Orals | BG3.8

Biodiversity affects microclimate - plant diversity and functional traits driving temperature and humidity using proximal sensing. 

Claudia Guimaraes-Steinicke, John English, Nicholas Sookhan, and Alexandra Wright

Microclimate ecology conveys fundamental information about how organisms react to and feedback to influence climate change. Evidence shows that vegetation and its spatial variation modify microclimate temperature and relative humidity, mediating thermal regulation and energy exchange with the atmosphere by affecting vapour pressure deficit (VPD) [2]. This process influences crucial eco-physiological processes such as carbon capture,  nutrient cycling, and flower visitation, promoting ecosystem productivity. Diverse communities typically display complex canopies due to functionally dissimilar species that spatially complement each other. The differences in diverse communities' canopy have the potential to modulate energy exchange and affect canopy surface temperature [1]. 

However, microclimate measurements are typically made at the coarse spatial scale using climate means based on meteorological stations or satellites, which ignore the bounded exchange between upper and lower canopy layers. Our approach integrates sub-canopy sensors with remotely sensed products and reveals that microclimate is driven by plant functional traits, groups, and the diversity of plant communities [1, 2, 3]. In biodiversity experiments, we assessed microclimate using under- and upper-canopy microclimate sensors and estimated plant canopy structure with a high spatial resolution (proximal sensing such as terrestrial laser scanning). 

We demonstrate that examining trait-microclimate relationships reveals the potential of diverse communities and communities dominated by species with particular traits to buffer ecosystems from the negative effects of warming and air dryness. Fundamentally, we propose that future work focuses on the facilitative effects of vegetation microclimate, indicating how plant community composition and diversity feedback on vegetative cooling and air humidification under more frequent and intense climate change events.

[1] Guimarães-Steinicke et al. (2021) J Ecol. 109: 1969–1985, http://doi.org/10.1111/1365-2745.13631
[2] Wright et al. (2024) Journal of Ecology, 112, 2462–2470. https://doi.org/10.1111/1365-2745.14313

[3] English et al. (2022) Frontiers, 10, https://doi.org/10.3389/fevo.2022.921472

How to cite: Guimaraes-Steinicke, C., English, J., Sookhan, N., and Wright, A.: Biodiversity affects microclimate - plant diversity and functional traits driving temperature and humidity using proximal sensing., EGU General Assembly 2025, Vienna, Austria, 27 Apr–2 May 2025, EGU25-18924, https://doi.org/10.5194/egusphere-egu25-18924, 2025.

EGU25-19013 | Posters on site | BG3.8

A Composite Spatial Network Model for Delineating Interpatch Influence in Habitat Analysis  

Tianlu Qian and Jiechen Wang

The degradation and loss of natural habitats caused by human activities have become a serious threat to the survival of wildlife. Existing habitat models struggle to represent the complex interactions of landscape matrices that drive biogeographical processes, limiting their ability to simulate and analyze habitats on a large scale. Therefore, conducting in-depth interdisciplinary research between GIS and zoogeography is of significant practical value for wildlife and habitat conservation. By leveraging GIS’s advantages in integrating updated high-precision data sources and spatial data analysis, a habitat analysis model based on composite spatial networks is developed to study the likely consequences of surrounding changes. The model constructs a high-dimensional heterogeneous spatial network to comprehensively simulate the effects of surrounding geographical environments on habitats, providing a more reasonable and comprehensive evaluation of species’ potential habitats under the influence of human activities at the macro level, and offering technical methods for empirical research in animal geography. Simulations and empirical tests of the model show that it performs steadily with changes in parameters and effectively characterizes the variations in the simulated environment as parameters change. Additionally, in habitat restoration and wildlife conservation practices, the composite spatial network offers more complete and scientific scenario simulations, providing technical support for balancing economic development and wildlife protection.

How to cite: Qian, T. and Wang, J.: A Composite Spatial Network Model for Delineating Interpatch Influence in Habitat Analysis , EGU General Assembly 2025, Vienna, Austria, 27 Apr–2 May 2025, EGU25-19013, https://doi.org/10.5194/egusphere-egu25-19013, 2025.

EGU25-20310 | ECS | Orals | BG3.8

Reconstructing long-term forest microclimate dynamics: validating mechanistic modeling with historical measurements 

Marie Finocchiaro, Matěj Man, Martin Macek, Jan Wild, and Martin Kopecký

Accurately assessing the impacts of climate change on forest ecosystems requires understanding how macroclimate and microclimate interact over time. Forest microclimates, strongly influenced by canopy cover and terrain, often deviate significantly from regional macroclimate. Recent research has highlighted the role of forest microclimate buffering for understory plant communities, which seem to be less impacted by global climate change. However, the increasing magnitude and frequency of macroclimatic extremes and associated forest disturbances could still threaten these communities, potentially overwhelming the forest buffering capacity and significantly altering plant community composition. Addressing these uncertainties requires long-term microclimate time-series. Yet, long-term datasets on forest microclimatic dynamics remain scarce. 

Here, we aim to fill this gap by leveraging detailed historical microclimate measurements from the 1950s in central European forests. These unique data serve as a foundation for developing and validating mechanistic microclimate models, enabling the reconstruction of long-term microclimate dynamics. Using biophysical principles, mechanistic modeling provides a robust approach to simulating near-ground temperature and humidity conditions based on macroclimatic inputs and local landscape and vegetation characteristics. By integrating macroclimate data with our in situ microclimate measurements, this research paves the way for exploring how forest microclimates influence plant community composition over time and disentangling the relative contributions of micro- and macroclimatic drivers to long-term vegetation change.

How to cite: Finocchiaro, M., Man, M., Macek, M., Wild, J., and Kopecký, M.: Reconstructing long-term forest microclimate dynamics: validating mechanistic modeling with historical measurements, EGU General Assembly 2025, Vienna, Austria, 27 Apr–2 May 2025, EGU25-20310, https://doi.org/10.5194/egusphere-egu25-20310, 2025.

EGU25-20421 | ECS | Orals | BG3.8

Understanding Microclimatic Impacts on Soil Moisture and Crop Productivity in Urban Rooftop Farming 

Matina Shakya, Paulsen Lindsay, Yashi Dadhich, and Franco Montalto

Urban rooftop farms offer unique challenges and opportunities for sustainable agriculture, shaped by the variability in microclimatic conditions. This study investigates the influence of microclimatic factors, including solar radiation, wind, air temperature, rainfall characteristics, and relative humidity, on soil moisture, soil temperature, and crop productivity at the Jacob K. Javits Convention Center rooftop farm in New York City. Two distinct plots, categorized by solar exposure (sunny and shady), were monitored to evaluate variations in soil and atmospheric conditions and their effects on three sequentially planted crops: turnips, beets, and broccoli. Data was collected continuously at five-minute intervals. Key findings reveal that the greater incoming solar radiation at the sunny plot has a greater influence on soil temperature and soil moisture than witnessed at the shady plot. Soil temperature was consistently higher on the sunny plot, while soil moisture was lower due to increased evaporation driven by sun exposure. Crop productivity varied by species, with turnips thriving on the sunny side, while beets and broccoli were more productive on the shady side. These results emphasize the critical role of microclimatic conditions in urban rooftop farming and demonstrate the potential to optimize crop yields through strategic crop selection and placement. This research provides valuable insights into improving the sustainability and productivity of urban agriculture in constrained environments.

How to cite: Shakya, M., Lindsay, P., Dadhich, Y., and Montalto, F.: Understanding Microclimatic Impacts on Soil Moisture and Crop Productivity in Urban Rooftop Farming, EGU General Assembly 2025, Vienna, Austria, 27 Apr–2 May 2025, EGU25-20421, https://doi.org/10.5194/egusphere-egu25-20421, 2025.

EGU25-20506 | Orals | BG3.8

Impact of agrivoltaic systems on crop microclimate in France 

Mélodie Trolliet, Apolline Duchalais, Lucie Lorieau, and Quentin Vialle

Renewable energy developers are highlighting the co-benefits of agrivoltaic systems for energy production and crop production. To quantify these co-benefits, an essential step is to understand the impact of photovoltaic structures on the micro-climate provided to the crop. This study investigates the impact of a tracking agrivoltaic structure, referred to as a canopy, on local micro-climate over a nine-year period. This presentation highlights the first-year results at four sites commissioned in France. Micro-climate monitoring includes 15min data for air and soil temperature and humidity, wind speed, irradiation, and precipitation for each site. These measurements are taken under the canopy and on a control plot adjacent to the plant. The differences between the canopy and the control micro-climates are analysed, with a particular focus on quantifying the adaptation potential of the canopy for crops regarding climate change. Hydro-meteorological indicators are also studied, in order to understand more precisely the impact of micro-climate on crops. The following observations were made :

  • The canopy mitigated extreme air temperatures by an average of -2°C and +1.5°C for respectively extreme high and low temperatures. It reduced soil temperatures by an average of 1°C during summer hot days;
  • Evapotranspiration decreased under the canopy, while air moisture levels were, on average, 1% higher than in the control plot;
  • Sharing light resources under the canopy is a major challenge especially for specific phenological stages of the crop. Adaptations of tracking angles are considered to combine the protective effect of the structures with the crops' need for light at these stages. To implement such adaptations, modelling tools are developped, including irradiance model. Caracterization of the irradiance models regarded to the in-situ measurments is presented.

This study determines that agrivoltaic systems such as canopies can increase the resilience of agricultural systems, notably by absorbing shocks due to extrem events. This can only be true if we think of a synergistic tracking system that optimizes food and energy productions. At that condition, those systems then have the capacity to grow a farm’s sustainability regarding climate change and economic swings.

How to cite: Trolliet, M., Duchalais, A., Lorieau, L., and Vialle, Q.: Impact of agrivoltaic systems on crop microclimate in France, EGU General Assembly 2025, Vienna, Austria, 27 Apr–2 May 2025, EGU25-20506, https://doi.org/10.5194/egusphere-egu25-20506, 2025.

EGU25-21668 | ECS | Posters on site | BG3.8

Improving future agricultural sustainability by optimizing crop distributions in China 

Qi Guan, Jing Tang, Kyle Frankel Davis, Mengxiang Kong, Lian Feng, Kun Shi, and Guy Schurgers

Improving agricultural sustainability is a global challenge, particularly for China’s high-input and low-efficiency cropping systems with environmental trade-offs. Although national strategies have been implemented to achieve Sustainable Development Goals in agriculture, the potential contributions of crop switching as a promising solution under varying future climate change are still under-explored. Here, we optimize cropping patterns spatially with the targets of enhancing agriculture production, reducing environmental costs, and achieving sustainable fertilization across the different climate scenarios. Compared with that maintains the historical cropping patterns, the optimal crop distributions under different climate scenario consistently suggest allocating the planting areas of maize and rapeseed to the other crops (rice, wheat, soybean, peanut and potato). Such crop switching can consequently increase crop production by 14.1%, with the reduction in environmental impacts (8.2% for leached nitrogen and 24.0% for irrigation water use) across three representative Shared Socio-economic Pathways (SSPs) from 2020 to 2100. The sustainable fertilization rates vary from 148-173 kg N ha-1 in 2030 to 213-253 kg N ha-1 in 2070, significantly smaller than the current rate (305 kg N ha-1). These outcomes highlight large potential benefits of crop switching and fertilizer management for improving China’s future agricultural sustainability.

How to cite: Guan, Q., Tang, J., Davis, K. F., Kong, M., Feng, L., Shi, K., and Schurgers, G.: Improving future agricultural sustainability by optimizing crop distributions in China, EGU General Assembly 2025, Vienna, Austria, 27 Apr–2 May 2025, EGU25-21668, https://doi.org/10.5194/egusphere-egu25-21668, 2025.

EGU25-92 | ECS | Posters on site | BG3.10

Marine heatwaves: physiological and morphological effects on the seagrass Cymodocea nodosa 

Alizé Deguette, Isabel Barrote, and João Silva

Marine heatwaves (MHWs) are increasing in frequency and intensity as part of climate change, yet their impact on marine angiosperms is poorly known. The present work evaluated the effects of a simulated spring-like MHW on the physiology and morphology of the seagrass Cymodocea nodosa, a temperate-warm adapted species. C. nodosa shoots were transplanted into a mesocosm facility. Water temperature was raised gradually from 20 to 28 °C, kept for 7 days at 28 °C, cooled down back to 20 °C and then maintained at 20 °C during an 8-day recovery period. The photosynthetic performance, antioxidative stress level and area/dry weight ratio of the plant’s leaves were investigated at the end of the heatwave and after the recovery period. The effective quantum yield of photosystem II increased during the heatwave and was higher in the mature parts of the leaves, allowing the plants to maintain their photosynthetic activity at the control level. Negative effects on the photosynthetic performance and leaf biomass of C. nodosa were observed during the recovery period. No significant oxidative stress was observed throughout the experiment. Although C. nodosa showed a relative tolerance to MHWs compared to other species, results show that the negative effects of a MHW may only become evident in the aftermath of the heatwave peak. In the Ria Formosa coastal lagoon, southern Portugal, C. nodosa is likely to be negatively affected by recurrent MHWs in the forecasted climate change scenarios, threatening the perennity of seagrass meadows’ ecosystems.

How to cite: Deguette, A., Barrote, I., and Silva, J.: Marine heatwaves: physiological and morphological effects on the seagrass Cymodocea nodosa, EGU General Assembly 2025, Vienna, Austria, 27 Apr–2 May 2025, EGU25-92, https://doi.org/10.5194/egusphere-egu25-92, 2025.

EGU25-1482 | ECS | Posters on site | BG3.10

Plasticity in leaf-to-sapwood area ratio enables saplings to increase growth under long-term drought in Amazon 

Mateus Silva, Paulo Bittencourt, David Bartholomew, André Giles, Pablo Sanchez Martinez, Lion Martius, Vanessa Rodrigues, Maurizio Mencuccini, Patrick Meir, João Junior, Antonio da Costa, and Lucy Rowland

Frequent and severe drought events in the Amazon threaten the carbon sink capacity of the world’s largest tropical rainforest. However, the extent to which trees can buffer the impacts of drought by adjusting their physiology to sustain growth remains uncertain. This is particularly relevant for the understory strata, which comprise trees that will mature over decades to centuries, shaping the future forest structure and function. Here, we leveraged 22 years of experimental throughfall exclusion in a 1-ha plot in Eastern Amazon, paired with a similarly sized control plot, to investigate how prolonged drought affects the growth of understory saplings. Given that drought has reduced the above-ground biomass by half and increased canopy openness, we hypothesized that (1) saplings grow faster under long-term drought conditions, (2) traits which correlate with sapling growth rate differ under drought and control conditions, and (3) trait plasticity under drought conditions increased sapling growth during drought. Our findings suggest that two decades of imposed drought increased sapling growth rates relative to saplings in control conditions. Despite sapling density being 51% lower in the droughted plot, droughted saplings grew on average three times faster than their control counterparts. In the droughted plot, growth rates increased with leaf-to-sapwood area ratio, leaf nitrogen content, stem conductivity, and leaf minimum conductance. Whereas growth rates increased with embolism vulnerability in the control plot. Within species, plasticity in the leaf-to-sapwood ratio emerged as the single driver of faster growth rates observed in droughted individuals relative to control individuals. In conclusion, we found that prolonged drought reduces understory sapling abundance, alleviating competition, and enabling the surviving individuals to maximize photosynthetic capacity and growth. This implies that drought reshapes the forest into a novel, low-density, fast-growing state which understory trees respond to by increasing their total leaf area.

How to cite: Silva, M., Bittencourt, P., Bartholomew, D., Giles, A., Sanchez Martinez, P., Martius, L., Rodrigues, V., Mencuccini, M., Meir, P., Junior, J., da Costa, A., and Rowland, L.: Plasticity in leaf-to-sapwood area ratio enables saplings to increase growth under long-term drought in Amazon, EGU General Assembly 2025, Vienna, Austria, 27 Apr–2 May 2025, EGU25-1482, https://doi.org/10.5194/egusphere-egu25-1482, 2025.

EGU25-1566 | ECS | Orals | BG3.10

The fate of Amazon rain forests under drought: collapse or stabilisation?  

Pablo Sanchez Martinez, Lion R. Martius, Paulo Bittencourt, Mateus Silva, Oliver Binks, Ingrid Coughlin, Vanessa Negrão-Rodrigues, João Athaydes Silva Junior, Antonio Carlos Da Costa, Lucy Rowland, Maurizio Mencuccini, and Patrick Meir

Drought-induced mortality is expected to cause substantial biomass loss in the Amazon Basin. However, responses by rain forest to prolonged drought remain largely unknown. Critically, how drought impacts individual trees over decades, whilst potential changes in forest structure alter competition for resources, remain unreported for any tropical forest globally. We demonstrate that an Amazonian rain forest subjected to more than two decades of drought at a throughfall-exclusion experiment reached long-term eco-hydrological stability. The stabilisation was largely driven by ecosystem-level structural changes that resulted in the remaining trees to no longer experiencing drought stress. The loss of the largest trees to drought-related mortality during the first 15 years of the experiment led to increasing water availability for the remaining trees, facilitating a stabilisation in biomass in the last seven years of the experiment. The elimination of water stress led to hydraulic variables commonly associated with physiological stress, such as leaf water potential, sap flow, and tissue water content to be equal to those in corresponding non-droughted control forest, indicating hydraulic homeostasis. This work reveals that significant resilience to persistent (multi-decadal) soil drought in tropical rain forest. The resilience emerges from structural feedbacks at ecosystem scale that prevent drought-induced collapse, whilst also resulting in a forest with reduced biomass and lower but positive net wood productivity.

How to cite: Sanchez Martinez, P., R. Martius, L., Bittencourt, P., Silva, M., Binks, O., Coughlin, I., Negrão-Rodrigues, V., Athaydes Silva Junior, J., Da Costa, A. C., Rowland, L., Mencuccini, M., and Meir, P.: The fate of Amazon rain forests under drought: collapse or stabilisation? , EGU General Assembly 2025, Vienna, Austria, 27 Apr–2 May 2025, EGU25-1566, https://doi.org/10.5194/egusphere-egu25-1566, 2025.

EGU25-2787 | ECS | Posters on site | BG3.10

The role of sediment transport in regulating ecosystem CO₂ fluxes during flood events in a restored floodplain grassland 

Anna Lindenberger, Hans Peter Rauch, Kuno Kasak, and Magdalena von der Thannen

The occurrence of flood events in wetlands has a significant impact on ecosystem dynamics, particularly regarding carbon cycling and storage. While there is a consensus that an understanding of the dynamics of restored wetlands is essential for the mitigation of climate change, the potential for carbon sequestration in floodplain grasslands remains understudied. Two floods in June and July 2024 in a restored floodplain grassland in Austria, exhibited distinct ecosystem responses, notably in gross primary productivity (GPP), net ecosystem exchange (NEE), and ecosystem respiration (Reco), as well as methane exchange, measured via the eddy covariance (EC) method with open path gas analysers (LI-7500 DS and LI-7700, LI-COR Biosciences, Lincoln, NE, USA).

Following the floods, carbon uptake significantly declined due to complete submersion of around 2m water levels above grounds continuing for six days for the first flood and 1m lasting three days for the second flood. However, ecosystem recovery varied, with slower recovery after the June flood. Sediment deposition during the first flood in June hindered photosynthesis in older plant parts, as evidenced by a brown sediment layer, while new growth remained green and photosynthetically active. This sediment layer contributed to reduced GPP during recovery. Conversely, the sediment-light July flood caused only a brief decline in NEE and GPP, with rapid recovery and no sediment deposition. The contrasting sediment loads stemmed from the floods’ origins: the first from sediment-heavy Danube backwater following upstream precipitation and the second from a sediment-light sluice opening on the Morava River. These differences explain the varying impacts on plant vitality, photosynthesis, and CO₂ exchange. One month after the first flood net CO₂ uptake remained below pre-flood levels, reflecting ecosystem stress and adaptation. In addition, climatic conditions also played a role in ecosystem responses. The favourable temperatures and abundant rainfall in May 2024 provided an environment conducive to plant growth. However, heat and the natural decline of the growing period in July led to an exacerbation of the flood impacts. These differing growth stages likely contributed to the varying plant sensitivities to the flood events, intensifying GPP reductions in response to sediment transport. The prolonged presence of water bodies during recovery, with slow withdrawal and evaporation, further influenced evapotranspiration dynamics during flooding.

These findings indicate that sediment transport dynamics during floods can significantly influence plant vitality and photosynthesis, with implications for ecosystem CO₂ exchange. The interplay between sediment deposition, plant recovery, and flood timing underscores the necessity for further research to elucidate these processes and their role in carbon cycling, as well as ecosystem resilience and vulnerability in floodplain grasslands. This study illuminates the intricate interactions between hydrology, plant processes, and carbon cycling in floodplain grasslands under climatic extremes by linking sediment dynamics with ecosystem recovery.


Funded by the European Union. Views and opinions expressed are however those of the author(s) only and do not necessarily reflect those of the European Union or CINEA. Neither the European Union nor the granting authority can be held responsible for them.

How to cite: Lindenberger, A., Rauch, H. P., Kasak, K., and von der Thannen, M.: The role of sediment transport in regulating ecosystem CO₂ fluxes during flood events in a restored floodplain grassland, EGU General Assembly 2025, Vienna, Austria, 27 Apr–2 May 2025, EGU25-2787, https://doi.org/10.5194/egusphere-egu25-2787, 2025.

EGU25-3170 | ECS | Posters on site | BG3.10

Do sapflow and soil parameters shape tree growth in a near-natural beech forest? 

Gabriela Fontenla-Razzetto, Peter Petrik, Alexandra Koller, Britt Kniesel, Alina Azekenova, Robin Schäfferling, Patrick Wordell-Dietrich, Karl-Heinz Feger, Goddert von Oheimb, Stefan Julich, and Karsten Kalbitz

Climate change is leading to rising temperatures and erratic rainfall patterns. Higher temperatures in combination with changes in frequency and intensity of precipitation have a strong effect on physiological processes in trees. For central european forest ecosystems higher frequency of droughts is predicted, which could lead to increased forest decline and tree mortality rates particularly for drought-sensitive species such as european beech (Fagus sylvatica L.; Dolschak et al., 2019). To assess the factors affecting beech tree growth in a changing climate, a better understanding of the coping mechanisms of beech forest under drought conditions is needed. How the relationship between tree growth and the site water balance is altered due to changing climatic conditions remains unclear. To improve the knowledge on this relationship is particularly important as tree growth can contribute significantly to the site’s carbon balance.

In our research we aim at: 1) quantify tree growth along a natural gradient of dry, intermediate, and wet soil conditions in a near-natural beech forest on sandy-textured soils, and 2) determine the influence of meteorological and soil parameters and sapflow dynamics on stem growth of beech trees. The overall research question is: to what extent do sapflow, soil variables, and meteorological parameters explain the differences in stem growth along a soil moisture gradient from wet to dry conditions? Under the same climatic and stand management conditions we hypothesize: 1) there is a stronger correlation among weather variables, sapflow, and growth under wet soil moisture conditions, and 2) the correlation between soil matric potential, sapflow, and growth is more pronounced under dry soil moisture conditions.

The research is carried out under the framework of the Beneath Project, which focuses on understanding how soil moisture and water balance influence carbon dynamics in beech forests. For this purpose, three sites along a soil moisture gradient have been selected for the installation of three intensive monitoring plots (IMPs). The IMPs are located at a dominant beech tree of the respective site; the monitored trees present similar characteristics. At each IMP, the monitoring of different elements of the hydrological and C cycles is carried out.  Soil moisture and matric potential, sap flow, stem growth, leaf area index (LAI) and meteorological variables were measured for two growing seasons (June-October 2022 and 2023) in the Dübener Heide Nature Park in Saxony, Germany. The expected differences in growth among sites would suggest that the consideration of interdisciplinary approaches i.e. including soil-plant factors is necessary to improve the knowledge of growth dynamics in beech forests under a changing climate.

Reference:

Dolschak et al., 2019 The impact of rising temperatures on water balance and phenology of European beech (Fagus sylvatica L.) stands. https://doi.org/10.1007/s40808-019-00602-1

How to cite: Fontenla-Razzetto, G., Petrik, P., Koller, A., Kniesel, B., Azekenova, A., Schäfferling, R., Wordell-Dietrich, P., Feger, K.-H., von Oheimb, G., Julich, S., and Kalbitz, K.: Do sapflow and soil parameters shape tree growth in a near-natural beech forest?, EGU General Assembly 2025, Vienna, Austria, 27 Apr–2 May 2025, EGU25-3170, https://doi.org/10.5194/egusphere-egu25-3170, 2025.

EGU25-3416 | Posters on site | BG3.10

Ice and air: Visualisation of freeze-thaw embolism and freezing spread in young L. tulipifera leaves  

Kate Johnson, Muriel Scherer, Dominic Gerber, Robert Style, Eric Dufresne, and Craig Brodersen

Spring freezing is an unforgiving stress for young leaves, often leading to death, with consequences for tree productivity and survival. With an increasingly unpredictable climate leading to more spring freezing events, it is important the we understand how freezing damages young leaf tissue. While both the plant water transport system and living tissues are vulnerable to freezing, we do not know whether damage to one or both of these systems causes death in young leaves exposed to freezing and thawing. Whole saplings of Liriodendron tulipifera were exposed to freezing and thawing trajectories designed to mimic natural spring freezes. We visualised freezing damage to the water transport system (xylem embolism) and living tissues (mesophyll freezing, decline in chlorophyll fluorescence). We 1.) provide the first visualisation of freeze-thaw embolism in leaves and compare this to drought-embolism, 2.) reveal a predictable progression of ice formation within the mesophyll which is strongly influenced by leaf vein architecture, notably the presence or absence of bundle-sheath extensions, and 3.) show that freeze-thaw embolism occurs only in the largest vein orders where mean vessel diameter exceeds 30µm. With evidence of both freeze-thaw embolism and damage to photosynthetic tissue, we conclude that this dual-mode lethality may be common among other wide-vesseled angiosperm-leaves, potentially playing a role in limiting tree distributions, and show that bundle-sheath extensions may stall or even prevent freezing spread.

How to cite: Johnson, K., Scherer, M., Gerber, D., Style, R., Dufresne, E., and Brodersen, C.: Ice and air: Visualisation of freeze-thaw embolism and freezing spread in young L. tulipifera leaves , EGU General Assembly 2025, Vienna, Austria, 27 Apr–2 May 2025, EGU25-3416, https://doi.org/10.5194/egusphere-egu25-3416, 2025.

EGU25-3569 | ECS | Orals | BG3.10

Photosynthetic and respiratory acclimation cannot compensate reduced plant-level carbon uptake in beech and oak saplings under prolonged warming and drought 

Janisse Deluigi, Margaux Didion-Gency, Jonas Gisler, Eugénie Mas, Laura Mekarni, Alvaro Poretti, Marcus Schaub, Yann Vitasse, and Christoph Bachofen

The combination of higher air temperatures and lower precipitation has become increasingly frequent under global warming, potentially exacerbating their individual effects. Higher air temperatures constrain photosynthesis while simultaneously accelerating respiration, and might decrease tree net C uptake. Thermal acclimation may mitigate this negative effect, but its capacity to do so under concurrent soil drought remains uncertain.

Using a five-year open-top chamber experiment, we determined acclimation of leaf-level photosynthesis (thermal optimum Topt and rate Aopt) and respiration (rate at 25°C R25 and thermal sensitivity Q10) to chronic +5°C warming, soil drought, and their combination in European beech (Fagus sylvatica L.) and downy oak (Quercus pubescens Willd.) saplings. Using a process-based model, we evaluated the impacts of acclimation on plant-level net C uptake (Atot).

Our study showed that both species acclimated to warmer conditions by shifting their Topt to higher temperatures, but to a lower extent when combined with drought, and slightly reducing R25 and Q10. In contrast, drought reduced Topt (in oak), Aopt, and, to a lower extent, R25 and Q10 (in beech). However, despite these acclimation processes, Atot decreased drastically under warming and drought, mainly due to reduced plant leaf area. Our results suggest that, while photosynthetic and respiratory acclimation might moderate the adverse impacts of warming and soil drought on leaf-level C exchange, plant-level net C uptake may still decline in a persistently hotter and drier climate because of structural adjustments toward sparser canopies.

How to cite: Deluigi, J., Didion-Gency, M., Gisler, J., Mas, E., Mekarni, L., Poretti, A., Schaub, M., Vitasse, Y., and Bachofen, C.: Photosynthetic and respiratory acclimation cannot compensate reduced plant-level carbon uptake in beech and oak saplings under prolonged warming and drought, EGU General Assembly 2025, Vienna, Austria, 27 Apr–2 May 2025, EGU25-3569, https://doi.org/10.5194/egusphere-egu25-3569, 2025.

EGU25-3591 | ECS | Posters on site | BG3.10

Amazônia doesn’t forget: Tropical trees with drought memory resist El Niño 

Lion Rafael Martius, Pablo Sanchez Martinez, Vanessa Negrão-Rodrigues, Paulo Bittencourt, Antonio Carlos Da Costa, Maurizio Mencuccini, and Patrick Meir

Amazônia is the largest tropical rainforest in the world storing between 150-200 petagrams of carbon in its vegetation and soils, and it contributes significantly to the stability of the Earth’s climate system. However, there is alarming evidence of a continuous decline of Amazônia’s capacity to absorb net CO2. Abnormal carbon losses and an overall weakening of Amazônia’s carbon sink have been related to land use and climate change, raising concerns about its long-term stability and the potential culmination of a related tipping point. The 2023/24 El Niño marked the worst drought in the Amazon on record, with large impacts on forest functioning. This suggests that Amazonian rainforest trees were exposed to immense hydraulic stress during that period. Insights into how the Amazon rainforest responds to recurrent droughts can be gained from results from a long-term throughfall exclusion experiment (TFE) based in the eastern Amazon in Caxiuanã, simulating the recurrence of an El Niño type drought for 23 consecutive years. However, how do trees that have been subjected to recurrent droughts respond to future extreme events? Critically, we need to understand whether recurrent drought exposure affects the long-term future drought responses of Amazonian trees: could Amazonian trees have drought memory?

We tested this idea during the historic 2023/24 El Niño drought, by quantifying resistance, resilience, plant water-use regulation and growth in Amazonian rainforest trees. We compared tree performance between trees that had experienced natural rainfall over the past 23 years (control trees, CTs), and those that had survived repeated drought (drought-exposed trees, DETs) by being subjected to 23 years of artificial El Niño-type soil moisture reduction within the droughted forest plot (TFE plot). At the onset of the El Niño drought, both the TFE and Control plots displayed similar values of available soil water per biomass, indicating that all trees in each plot had a similar water availability. Astonishingly, the DETs were significantly more resistant than CTs during the 2023/24 El Niño and were more resilient post-drought as far as hydraulic transport is concerned. In addition, DETs were much less conservative with regard to water loss during the dry season. However, at the peak of the drought, control trees had used significantly more soil water despite strong water use regulation. While CTs displayed apparent negative stem growth due to the loss of water stored in their trunks, some DETs displayed positive stem growth, indicating that these trees not only survived, but physiologically functioned and grew during the extreme drought of 2023/24, without depleting available soil water. These findings suggest that Amazonian trees that have been subjected to recurrent drought events may build a form of drought memory that enables functional responses to future drought that exceed those from short-term phenotypic plasticity. Such plant memory may underpin phenotypic acclimation to new environmental conditions, ensuring survival and competitive advantage even in a rapidly changing climate.

How to cite: Martius, L. R., Sanchez Martinez, P., Negrão-Rodrigues, V., Bittencourt, P., Da Costa, A. C., Mencuccini, M., and Meir, P.: Amazônia doesn’t forget: Tropical trees with drought memory resist El Niño, EGU General Assembly 2025, Vienna, Austria, 27 Apr–2 May 2025, EGU25-3591, https://doi.org/10.5194/egusphere-egu25-3591, 2025.

EGU25-3924 | ECS | Orals | BG3.10

Does physiology alone explain Betula pendula recovery from drought? 

Yuwen Zhang, Yan Wang, Ram Oren, and Yann Salmon

Increasing drought intensity, duration and frequency worldwide challenges tree health. In addition to the importance of drought resistance, post-drought recovery capacity is a vital determinant in tree growth and survival. However, the capacity of trees to recover from different types of drought stress remains largely unquantified. In this study, we applied three different drought treatments (short-term drought, long-term drought, and repeated drought) and a well-watered control to 3-year-old silver birch (Betula pendula) saplings growing in a greenhouse. Ecophysiological traits regarding key water- and carbon-relation processes such as sap flow, stem radial variation, leaf gas exchange, water potential, and leaf phenology were continuously measured throughout the drought-recovery process. The preliminary results indicate that water consumption, photosynthesis and tree growth were greatly diminished in all drought treatments, though their recovery capabilities and timing differed. None of the stressed treatments recovered to pre-drought status after re-watering, which might be attributed to their limited ability to repair xylem embolism and restore leaf area. The adjustment of tree-level leaf area emerged as a key strategy to cope with the drought, shedding light on traits other than physiology requiring consideration when studying drought resistance and resilience.

How to cite: Zhang, Y., Wang, Y., Oren, R., and Salmon, Y.: Does physiology alone explain Betula pendula recovery from drought?, EGU General Assembly 2025, Vienna, Austria, 27 Apr–2 May 2025, EGU25-3924, https://doi.org/10.5194/egusphere-egu25-3924, 2025.

EGU25-4151 | ECS | Posters on site | BG3.10

Understanding the Impact of Multi-Year Droughts on Vegetation: An Observational and Model Approach 

Denise Ruijsch, Jonna van Mourik, Hester Biemans, Sandra Hauswirth, and Niko Wanders

Multi-year droughts (MYDs), droughts lasting more than a year, have devastating effects on vegetation. Due to climate change, MYDs are expected to become more frequent and intense, making it crucial to assess their impact on vegetation accurately.

In this study, we combined MODIS satellite observations, ERA5 meteorological reanalysis data, and the LPJmL dynamic vegetation model to evaluate the sensitivity of vegetation to droughts and to quantify the impact of MYDs on seven types of vegetation in six different regions across the globe during the 21st century. To measure the response of vegetation to drought, we used the standardized Enhanced Vegetation Index (EVI) and compared this to EVI climatology.

As anticipated, the overall impact of MYDs on vegetation was negative, but our findings revealed significant spatial and temporal variations with areas showing significant greening during MYDs (around 35% of the world). In general, shrublands experienced the largest decrease in greenness, while trees flourished. The natural water availability of a region is the primary factor influencing vegetation response to MYDs.  Vegetation in water-limited areas tends to suffer during MYDs, whereas vegetation in energy-limited areas thrives as long as sufficient water is available. Compared to normal droughts (NDs), MYDs generally caused stronger negative EVI anomalies.

To address the limitations of the short observational record and the relatively low number of MYDs during the 21st century, we extended the analysis back to 1901 using the LPJmL-5 dynamic global vegetation model. Simulating vegetation dynamics over this 120-year period allowed us to increase the number of MYDs available for study, improving the statistical robustness of our results.

How to cite: Ruijsch, D., van Mourik, J., Biemans, H., Hauswirth, S., and Wanders, N.: Understanding the Impact of Multi-Year Droughts on Vegetation: An Observational and Model Approach, EGU General Assembly 2025, Vienna, Austria, 27 Apr–2 May 2025, EGU25-4151, https://doi.org/10.5194/egusphere-egu25-4151, 2025.

EGU25-5263 | ECS | Orals | BG3.10

Atmospheric dryness effects on canopy chlorophyll fluorescence and GPP in a deciduous forest during heat waves 

Zhaohui Li, Gabriel Hmimina, Gwendal Latouche, Daniel Berveiller, Abderrahmane Ounis, Yves Goulas, and Kamel Soudani

Sun-Induced chlorophyll Fluorescence (SIF) is the most promising optical indicator of Gross Primary Production (GPP) in terrestrial ecosystems. However, the interpretation of SIF as a proxy of GPP is challenged when plants experience abiotic stress, particularly during extreme climatic events whose frequency is projected to increase in the future. Recently, the feasibility of canopy-scale active chlorophyll fluorescence measurements (LED-induced chlorophyll fluorescence), which directly measure the apparent fluorescence yield (FyieldLIF), has provided new perspectives on detecting the physiological responses of plants to abiotic stress. This study was conducted during summer 2022 European heat waves in a mixed temperate deciduous broadleaf forest, located in the Fontainebleau-Barbeau station (Integrated Carbon Observation System FR-Fon site), about 50 km South-East of Paris, France. Continuous measurements of carbon dioxide (CO2) and energy exchanges, SIF, FyieldLIF, and ancillary environmental variables were acquired. We investigated how atmospheric dryness, measured as Vapor Pressure Deficit (VPD), affected canopy chlorophyll fluorescence (both SIF and FyieldLIF) and GPP, as well as their relationships. Our results indicated that high VPD has a negative impact on GPP and FyieldLIF at both half-hourly and daily scales. In contrast, SIF exhibits a positive response to high VPD at the half-hourly scale, but this relationship reverses, showing a negative response at the daily scale. At the half-hourly scale, our results revealed a decrease of the correlation between SIF and GPP (R² decreased from 0.49 to 0.17) as atmospheric dryness increased. In contrast, the correlation between FyieldLIF and GPP strengthened significantly under the same conditions (R² increased from 0.07 to 0.43). However, at the daily scale, the correlations between SIF and GPP and between FyieldLIF and GPP showed an overall increase, suggesting a time-scale-dependent response of these relationships to atmospheric dryness. This study also highlighted the advantages of FyieldLIF over SIF in detecting plant responses to high atmospheric dryness. This underlines the potential of canopy-level active chlorophyll fluorescence measurements for understanding and quantifying the nature of the relationship between canopy chlorophyll fluorescence and photosynthesis in ecosystems under extreme climatic conditions.

How to cite: Li, Z., Hmimina, G., Latouche, G., Berveiller, D., Ounis, A., Goulas, Y., and Soudani, K.: Atmospheric dryness effects on canopy chlorophyll fluorescence and GPP in a deciduous forest during heat waves, EGU General Assembly 2025, Vienna, Austria, 27 Apr–2 May 2025, EGU25-5263, https://doi.org/10.5194/egusphere-egu25-5263, 2025.

EGU25-5923 | Orals | BG3.10

High tree transpiration despite extreme summer heatwaves supports atmospheric cooling in urban systems 

Christoph Bachofen, Marion Peillon, Naika Meili, and Ilann Bourgeois

Urban trees cool their environment by transpiration (latent heat flux, LE) and shading, modifying thereby the energy budget and alleviating urban heat. However, the cooling effect from LE may be critically reduced during heatwaves, when trees reduce stomatal conductance (gS) to prevent hydraulic dysfunctions. Recent advances in our understanding of stomatal behaviour under high temperatures indicate that gS may still be maintained during extreme heat to allow canopy cooling, but implications for urban heat stress mitigation remain elusive.

We continuously recorded sap flow on eight Platanus x acerifolia trees in Geneva to assess LE and canopy conductance (GAsw) during the summer of 2023, which was characterised by two record-breaking heatwaves. We further repeatedly assessed leaf water potentials at pre-dawn and midday (Ψpre, Ψmid), stomatal conductance (gS), and leaf, canopy, and ground surface temperatures in shaded and sunlit parts around the trees (Tleaf, Tcan, Tsurf). Using the ecohydrological model UT&C, we determined the total energy budget of the urban square, and assessed whether LE predictions match empirical measurements during heatwaves.

We found that despite prolonged heatwaves with air temperature (Tair) reaching 39.1 ºC, trees were only marginally water stressed, with Ψmid mostly above -1.7 MPa, and continued transpiring throughout the day up to 37.1 kg h-1 (i.e. LE of 25.3 kW). Despite reduced GAsw measured LE was similar during heatwaves (i.e., Tair> 30 ºC) as during cooler periods and accounted for approximately 34 % of the urban heating by incoming solar radiation (Q*) throughout the season. In contrast, LE model predictions showed a marked decrease of urban cooling during heatwaves, thereby underestimating actual tree transpiration cooling.

Despite unprecedentedly high Tair during two summer heatwaves, trees maintained high transpiration, and thereby efficiently cooled the urban environment. Measured LE at Tair above 30 ºC surpassed model estimations due to continued tree transpiration. Consequently, actual cooling effects of urban trees during heatwaves might be considerably underestimated by current model predictions. Cities with intermittent heatwaves may thus continue to rely on effective vegetation cooling by transpiration.

How to cite: Bachofen, C., Peillon, M., Meili, N., and Bourgeois, I.: High tree transpiration despite extreme summer heatwaves supports atmospheric cooling in urban systems, EGU General Assembly 2025, Vienna, Austria, 27 Apr–2 May 2025, EGU25-5923, https://doi.org/10.5194/egusphere-egu25-5923, 2025.

EGU25-6066 | ECS | Orals | BG3.10

Soil-plant hydraulics explain stomatal efficiency-safety tradeoff 

Gaochao Cai, Andrea Carminati, Sean Gleason, Mathieu Javaux, and Mutez Ahmed

The efficiency-safety tradeoff has been thoroughly investigated in plants, especially concerning their capacity to transport water and avoid embolism. Stomatal regulation is a vital plant behaviour to respond to soil and atmospheric water limitation. Recently, a stomatal efficiency-safety tradeoff was reported where plants with higher maximum stomatal conductance (gmax) exhibited greater sensitivity to stomatal closure during soil drying, that is, less negative leaf water potential at 50% gmax (ψgs50). However, the underlying mechanism of this gmax-ψgs50 tradeoff remains unknown. Here, we utilized a soil-plant hydraulic model, in which stomatal closure is triggered by nonlinearity in soil-plant hydraulics, to investigate such tradeoff. Our simulations show that increasing gmax is aligned with less negative ψgs50. Plants with higher gmax (also higher transpiration) require larger quantities of water to be moved across the rhizosphere, which results in a precipitous decrease in water potential at the soil-root interface, and therefore in the leaves. We demonstrated that the gmax-ψgs50 tradeoff can be predicted based on soil-plant hydraulics, and is impacted by plant hydraulic properties, such as plant hydraulic conductance, active root length and embolism resistance. We conclude that plants may therefore adjust their growth and/or their hydraulic properties to adapt to contrasting habitats and climate conditions.

How to cite: Cai, G., Carminati, A., Gleason, S., Javaux, M., and Ahmed, M.: Soil-plant hydraulics explain stomatal efficiency-safety tradeoff, EGU General Assembly 2025, Vienna, Austria, 27 Apr–2 May 2025, EGU25-6066, https://doi.org/10.5194/egusphere-egu25-6066, 2025.

EGU25-6182 | ECS | Orals | BG3.10

Hydraulic stress diminishes acclimation of leaf thermoregulation in European trees exposed to hot-drought. 

Alyssa Kullberg, Arianna Milano, Maxwell Bergström, Thibaut Juillard, Jonas Gisler, and Marcus Schaub

Hydraulic status plays a large role in leaf thermoregulation, which is important for maintaining leaves below thermal thresholds during heatwaves. Still, little is known about how acclimation to warming and drought may affect trees’ abilities to avoid critical temperature thresholds. Using a five-year open-top chamber experiment, we studied the single and interactive effects of heat and soil drought on leaf temperature regulation, heat tolerance, hydraulic status, and gas exchange in two temperate tree species with contrasting water management strategies: common beech (Fagus sylvatica) and pubescent oak (Quercus pubescens). Drought-exposed trees were less homeothermic than control and warmed trees, leading to larger leaf-to-air temperature differentials and greater leaf temperature maxima, especially in hot-drought conditions. During the peak summer heat (ambient temperature reaching > 40°C), gas exchange and hydraulic safety margins in drought-exposed trees (including with added warming) were strongly reduced, particularly in beech, compared to the control and heat exposure alone. Indeed, drought induced extreme hydraulic stress, which limited the trees' ability to preserve thermal safety margins. Consequently, despite acclimation of heat tolerance to leaf temperature maxima, drought, and especially hot drought, led to narrower (even negative) leaf thermal safety margins, widespread leaf scorching, and early senescence. Our results show that while thermoregulation acclimates to increased temperatures, drought remains the dominant driver of canopy damage, which may be exacerbated when combined with heat waves.

How to cite: Kullberg, A., Milano, A., Bergström, M., Juillard, T., Gisler, J., and Schaub, M.: Hydraulic stress diminishes acclimation of leaf thermoregulation in European trees exposed to hot-drought., EGU General Assembly 2025, Vienna, Austria, 27 Apr–2 May 2025, EGU25-6182, https://doi.org/10.5194/egusphere-egu25-6182, 2025.

EGU25-6257 | ECS | Orals | BG3.10

Stomatal decoupling: New insights into environmental drivers and underlying physiological mechanisms during simulated heatwaves in temperate and tropical tree species 

Philipp Schuler, Thibaut Juillard, Günter Hoch, Ansgar Kahmen, and Margaux Didion-Gency

By 2024, anthropogenic greenhouse gas emissions have increased global average surface temperatures 1.55 °C above pre-industrial levels. This has led to an increase in both the intensity and frequency of heat waves. In recent years, it has been shown that the strong relationship (e.g., the coupling) between net photosynthetic CO2 assimilation (Anet) and stomatal conductance (gs) is decreased or even lost at high temperatures (Diao et al., 2024; Marchin et al., 2023). However, the isolated effect of environmental drivers (e.g. air temperature, vapour pressure deficit; VPDair) and the underlying plant physiological mechanisms are not yet fully understood (Mills et al., 2024).

To improve our understanding why at high temperatures gs continues to increase while Anet decreases, we conducted a climate chamber experiment with 3 temperate (Alnus cordata, Acer platanoides, Phillyrea angustifolia) and 3 tropical (Terminalia microcarpa, Terma tomentosa, Syzygium jambos) tree species. In one chamber, we increased the air temperature (Tair) from 20 to 40 °C in 5 °C steps (2 days at every temperature) while keeping the VPDair at 1.2 kPa. In the second chamber, we increased Tair the same way, but simultaneously increased VPDair every step from 1.2 to 6 kPa. One subset per chamber was kept well-watered (e.g. at capacity; ~35 vol-%), while in the other subset the trees were exposed to soil drought (~8 vol-%). Every second day, we conducted leaf gas exchange measurements.

Across all species, we observed gs to continue to increase while Anet decreased (but never reached 0 or negative values) at high temperatures above 35 °C under constant VPD, while increasing VPD maintained the coupling between the two by decreasing gs. However, the transpiration rate (E) showed the same pattern of decoupling under both VPD regimes. Since E is directly driven by gs and VPD, plants need to upregulate gs in order to upregulate E if VPD is too low. While E is important for the regulation of leaf temperature, it is also crucial for other plant physiological processes. We speculate that another reason for increasing E may be that E drives sap flow, which is important for the internal transport and distribution of nutrients, O2 and CO2 in plants. Thus, an increased sap flow might be crucial to sustain tree functioning during high-temperature driven periods of accelerated metabolic activity. Future specifically designed experiments are needed to simultaneously investigate plant physiological responses in different tissues as well as at the whole plant level.


Diao, H., Cernusak, L.A., Saurer, M., Gessler, A., Siegwolf, R.T.W., Lehmann, M.M., 2024. Uncoupling of stomatal conductance and photosynthesis at high temperatures: mechanistic insights from online stable isotope techniques. New Phytologist 241, 2366–2378. https://doi.org/10.1111/nph.19558

Marchin, R.M., Medlyn, B.E., Tjoelker, M.G., Ellsworth, D.S., 2023. Decoupling between stomatal conductance and photosynthesis occurs under extreme heat in broadleaf tree species regardless of water access. Global Change Biology gcb.16929. https://doi.org/10.1111/gcb.16929

Mills, C., Bartlett, M.K., Buckley, T.N., 2024. The poorly‐explored stomatal response to temperature at constant evaporative.pdf. Plant, Cell & Environment.

How to cite: Schuler, P., Juillard, T., Hoch, G., Kahmen, A., and Didion-Gency, M.: Stomatal decoupling: New insights into environmental drivers and underlying physiological mechanisms during simulated heatwaves in temperate and tropical tree species, EGU General Assembly 2025, Vienna, Austria, 27 Apr–2 May 2025, EGU25-6257, https://doi.org/10.5194/egusphere-egu25-6257, 2025.

EGU25-6279 | ECS | Orals | BG3.10

Thermal  acclimation fails to confer a carbon budget advantage to invasive species over natives 

Thibaut Juillard, Marco Conedera, Mattéo Dumont, Jean-Marc Limousin, Arianna Milano, Gianni Boris Pezzatti, Alberto ViIagrosa, and Christoph Bachofen

Both native and invasive plants can adjust photosynthesis and respiration when exposed to warmer temperatures. However, it is uncertain if invasive plants are more plastic and exhibit higher acclimation to rising temperatures than native ones, a trait that could contribute to their invasive behavior in novel environments.

We compared the capacity of a highly invasive palm in central Europe (Trachycarpus fortunei) and two native co-occurring species (Ilex aquifolium and Tilia cordata) to acclimate photosynthesis and respiration to air temperature changes using a two-year-long transplant experiment across Europe (mean temperatures ranging from 8.4 to 21.8°C). We measured the optimal temperature of photosynthesis (Topt), the assimilation at optimal temperature (Aopt), the thermal breath of photosynthesis (T80), the respiration at 25°C (R25), the temperature sensitivity of respiration (Q10), and simulated the whole-plant carbon budget.

For all species, Topt, Aopt, and T80 increased with warming, while R25 decreased in the native species and Q10 decreased in the invasive species only. Consequently, acclimation enhanced the carbon budget of the invasive and native plants in the warm and hot sites. The invasive palm had a similar or lower acclimation capacity than other species and a lower but constant carbon budget across the European temperature gradient. Our work reveals that not all invasive plants exhibit greater photosynthetic plasticity than native ones, suggesting that temperature-driven enhancement of their carbon budget may play a limited role in future invasion processes.

How to cite: Juillard, T., Conedera, M., Dumont, M., Limousin, J.-M., Milano, A., Pezzatti, G. B., ViIagrosa, A., and Bachofen, C.: Thermal  acclimation fails to confer a carbon budget advantage to invasive species over natives, EGU General Assembly 2025, Vienna, Austria, 27 Apr–2 May 2025, EGU25-6279, https://doi.org/10.5194/egusphere-egu25-6279, 2025.

A statistical crop yield model developed by the author, ABSOLUT (Conradt 2022, https://doi.org/10.1007/s00484-022-02356-5 ), is capable of identifying the time aggregates of meteorological variables or indices most relevant for agricultural yields. Using climate change scenarios as input to the model calibrated on recent weather and yield data future crop yields have been projected for the districts of Germany and for Europe's NUTS-2 regions.

Previous research has shown that while large parts of inter-annual crop yield variations can already be explained by aggregates of temperature, precipitation, and solar radiation only, model performances are regularly increased by also including drought indices representing water stress related to soil conditions (see also Eini et al. 2023, https://doi.org/10.1016/j.agwat.2022.108107 ). This holds especially for maize and root crops (e.g. potatoes, sugar beets) grown in mid-latitudes and harvested in autumn. Consequently, all crop yield scenarios presented here are obtained from predictors including Standardized Precipitation Evaporation Indices (SPEI, Vicente-Serrano et al. 2010, https://doi.org/10.1175/2009JCLI2909.1 ) on 3- or 12-month scales.

Results show strong weather effects on green maize (high coefficients of determination in leave-one-out validation) and a generally negative outlook for the future: The median scenario under CMIP6 SSP370 climate shows 5–15% declines in green maize yields for the years around 2050 compared to nowadays levels in most European regions. Southern France, Northern Italy, and Bulgaria are predicted to experience yield losses of even more than 20%, albeit with lower reliability. The Mediterranean countries however include also some regions with positive trends on low confidence levels. In a more distant future of the years around 2080 the spatial pattern remains unaltered, but the strength of the changes will have doubled.

For winter wheat the model performs better in the eastern parts of Europe. Only slight declines in yield of 0–10% are projected there for the 2050 time slice; for the years around 2080 losses of more than 25% have to be expected, though. Drastic losses of 20–50% and exceeding 50% in the more distant future threaten many Mediterranean regions. There is however also a stable outlook for Britain and Ireland, The Netherlands, Belgium, and the North-Western parts of France. Yield increases are projected for Southern Finland and the Baltic states. This regional exception to the general downward perspective is in good agreement with a map presented in the European Drought Risk Atlas (Rossi et al. 2023, https://doi.org/10.2760/608737 ).

How to cite: Conradt, T.: Mapping future crop yield trends across Europe by auto-adaptive regression modelling, EGU General Assembly 2025, Vienna, Austria, 27 Apr–2 May 2025, EGU25-6574, https://doi.org/10.5194/egusphere-egu25-6574, 2025.

EGU25-6648 | ECS | Orals | BG3.10

Are microclimate extremes always buffered in the understory, irrespective of tree density? Consequences for tree seedling survival. 

Klara Bouwen, Marie Charru, Jean-Christophe Domec, Rémi Lemaire-Patin, and Jérôme Ogée

Tree seedlings have their leaves very close to the ground and their roots are very shallow. They therefore experience more severe heat and water stress during hot summers than mature trees. As droughts and heatwaves increase in severity and frequency, the growth and survival of tree seedlings thus become more difficult, impairing forest regeneration in many regions. In response, forest managers are increasingly shifting from thinning regimes that promote light availability and seedling growth to regimes that promote seedling survival and the buffering of climate extremes. However, the identification of such thinning regimes is not trivial because the mechanisms underpinning the impact of canopy cover on understory microclimate, although all well understood, can have opposite effects on climate extremes. In particular, wind attenuation and water consumption by the remaining adult trees can sometimes create conditions for seedlings in the understory hotter and drier than in an open field. This has led researchers to hypothesize the existence of thinning thresholds beyond which forest canopies transition from buffering to amplifying climate extremes. Metrics such as leaf area index (LAI), crown aggregation and canopy height have emerged as critical factors, as well as other local factors such as species composition or water availability. Here, we use a physics-based model of forest hydrology, physiology and microclimate (MuSICA), in combination with microclimate observations from a variety of forest types across Europe, to address the following questions. (1) Is the threshold in LAI and/or crown aggregation below which summertime temperature and evaporative demand become amplified in the understory generic, or is this threshold site-specific? (2) How does understory microclimate evolve during heatwaves depending on the structure of the canopy above and the duration of the heatwave? (3) How does this translate in terms of plant water and heat stress for understory species?

How to cite: Bouwen, K., Charru, M., Domec, J.-C., Lemaire-Patin, R., and Ogée, J.: Are microclimate extremes always buffered in the understory, irrespective of tree density? Consequences for tree seedling survival., EGU General Assembly 2025, Vienna, Austria, 27 Apr–2 May 2025, EGU25-6648, https://doi.org/10.5194/egusphere-egu25-6648, 2025.

EGU25-8174 | ECS | Posters on site | BG3.10

Drought Avoidance: A Shared Strategy for Perennial Herbaceous Flowers and Leaves through Distinct Mechanisms 

Yuxin Li, Zhe Zhang, Yukang Li, and Yanhong Tang

Turgor loss point (φTLP) serves as an indicator of plant drought acclimation strategies and is closely linked to water loss. While leaf φTLP has been extensively studied, little is known about flower φTLP, particularly its role in the drought acclimation strategies of flowers or its integration into whole-plant responses. In a semi-arid to semi-humid grassland on the Inner Mongolia Plateau, precipitation was reduced by 0%, 20%, 50%, and 80% using shelters. Hydraulic traits, gas exchange, temperature and morphological traits of a native perennial herb, Bupleurum smithii, were measured in both flowers and leaves. Results revealed that: (1) Both flowers and leaves employ drought avoidance strategies, with increased φTLP under drought. (2) Unlike leaves, higher flower  φTLP does not effectively reduce water loss. (3) Drought avoidance in flowers is accomplished through easier decaying, and less dry mass is allocated into flowers to reduce carbon loss. (4) Morphological adaptations enable flowers to maintain attractiveness and reproductive function despite water stress. This highlights the functional specialization of plant organs, with flowers prioritizing reproduction under resource constraints.

How to cite: Li, Y., Zhang, Z., Li, Y., and Tang, Y.: Drought Avoidance: A Shared Strategy for Perennial Herbaceous Flowers and Leaves through Distinct Mechanisms, EGU General Assembly 2025, Vienna, Austria, 27 Apr–2 May 2025, EGU25-8174, https://doi.org/10.5194/egusphere-egu25-8174, 2025.

EGU25-10071 | ECS | Posters on site | BG3.10

Comparing vegetation impacts of single vs. consecutive dry events 

Pia Marie Müller, Rene Orth, and Xueyan Cheng

Dryness can negatively affect vegetation functioning, including both immediate effects as well as effects extending beyond the duration of the dryness. Such legacy effects are for example related to hydraulic damage of plants or a reduced amount of leaves. While the impact of singular dry events are relatively well-studied, the impact of consecutive events on ecosystem functioning is less understood. Our study hypothesis here is that legacy effects may be more likely after consecutive dry periods as the vegetation adaptation potential (e.g. through carbon reserves) is exhausted after a previous dry period. In particular, we follow a four-step approach: (1) identify dry events through dry soil moisture, using a reanalysis soil moisture dataset from 2000 to 2023; (2) determine single and consecutive events by examining the temporal proximity of other dry events to a primary event. A single event is defined as a dry period with no subsequent or preceding dry events occurring within a two-year window, whereas consecutive events are further classified based on when, during this two-year period, another event occurs; (3) assess vegetation responses to single versus consecutive dry events, and their recovery, using anomalies of the Normalised Difference Vegetation Index (NDVI); and (4) use generalized additive models (GAMs) to explore the aspects contributing to vegetation response and recovery. We consider dry event characteristics, including timing, magnitude, and hydrological conditions during the event, as well as static variables such as climate and vegetation type. Preliminary results indicate that severe previous dry events events can induce legacy effects on vegetation, with impacts comparable in magnitude to those driven by dry event characteristics and static environmental variables. Notably, these legacy effects manifest as both positive and negative responses. By understanding how ecosystems are shaped by recurring climatic extremes, this research aims to provide insights for ecosystem response and management in a changing climate with more frequent dry periods.

How to cite: Müller, P. M., Orth, R., and Cheng, X.: Comparing vegetation impacts of single vs. consecutive dry events, EGU General Assembly 2025, Vienna, Austria, 27 Apr–2 May 2025, EGU25-10071, https://doi.org/10.5194/egusphere-egu25-10071, 2025.

Forests are the primary terrestrial carbon sinks on Earth due to trees' unique capacity to absorb and store atmospheric carbon dioxide (CO2) through photosynthesis. However, increasing extreme hot-dry events, significantly contribute to global forest mortality. Severe soil drought can lead to xylem embolism, while heat can increase leaf transpiration and impair trees' capacity to cool their leaves, possibly leading to large-scale canopy mortality. Both extreme heat and water scarcity can accelerate widespread tree dieback and shift forests from carbon sinks to carbon sources. On the other hand, the continual rise in atmospheric CO2 from human activities may enhance plant net photosynthesis while reducing tree transpiration. Under elevated CO2 (eCO2) conditions, water use efficiency improves, which could, in turn, reduce the sensitivity of trees growing under elevated CO2 to depleted soil moisture levels. While the individual effects of heat, drought, and eCO2 have been studied, there is still a lack of critical data on how mature forests respond to the combined stress of eCO2 and hot droughts (both atmospheric and soil droughts). In this talk, I will review our current understanding and aim of identifying key knowledge gaps on the individual and combined impacts of heat, drought, and elevated CO2 on tree physiological responses. A better understanding of these interactions will improve the accuracy of current climate-vegetation models in predicting forest carbon dynamics under climate change. 

How to cite: Gauthey, A.: Forest dynamics under climate change: the dual impacts of elevated carbon dioxide and hot-dry events on tree carbon and water relations, EGU General Assembly 2025, Vienna, Austria, 27 Apr–2 May 2025, EGU25-10517, https://doi.org/10.5194/egusphere-egu25-10517, 2025.

EGU25-11602 | ECS | Posters on site | BG3.10

Studying the transition from meteorological to ecological drought in the disaster risk framework 

Chunhui Zhan and René Orth

A meteorological drought occurs when high atmospheric water demand and low water supply lead to water scarcity. This can develop into an ecological drought, affecting ecosystems through hydraulic failure, carbon limitation, and ultimately plant mortality. The transition from meteorological to ecological drought is a complex process, influenced by the interplay of three fundamental components that are often used in the field of disaster risk management: the characteristics of the drought event itself (hazard), the inherent susceptibility of the ecosystem to drought (vulnerability), and the environmental conditions of the ecosystem (exposure). Specifically, we investigate how multiple water-related variables shape the hazard, how plant functional traits determine ecosystem vulnerability, and how groundwater levels affect the exposure of ecosystems to drought.

To investigate the transition, we integrate eddy covariance observations, plant trait databases, and groundwater level data within the hazard-vulnerability-exposure framework. Using a data-driven approach, we assess the relative importance of these components in driving ecological drought. Our findings are then compared with model simulations to provide a comprehensive understanding of the underlying mechanisms.

How to cite: Zhan, C. and Orth, R.: Studying the transition from meteorological to ecological drought in the disaster risk framework, EGU General Assembly 2025, Vienna, Austria, 27 Apr–2 May 2025, EGU25-11602, https://doi.org/10.5194/egusphere-egu25-11602, 2025.

EGU25-13514 | Orals | BG3.10

Drought stress in European forests: Integrating novel experimental data to improve vegetation modelling  

Phillip Papastefanou, Laura Donfack Somenguem, Anne Klosterhalfen, Ruth-Kristina Magh, Sharath Shyamappa Paligi, Manon Sabot, Konstantin Schellenberg, and Sönke Zaehle

Drought events are threatening forest ecosystems worldwide and are also expected to increase in intensity and frequency in the future. Around Europe, multiple experimental sites have been set up to investigate the impacts of drought, for example, by excluding rainfall from trees. Over the years, these experiments have increasingly incorporated high-resolution temporal sensors. These sensors collect data on tree physiology—such as changes in diameter, sap flow, and stem water potential — at intervals as frequent as once every 30 minutes. While these experiments provide valuable insights into the impacts of drought on tree function, they are typically limited to the specific environmental conditions and species present at the study site.

Vegetation modelling offers a way to generalise from experiments. Multiple state-of-the-art vegetation models now incorporate plant hydraulics which (1) allows for simulating water movement throughout whole trees in detail and (2) introduces a hydraulic failure-based mortality process that describes how trees may succumb to extreme drought stress. However, representing plant hydraulic processes comes at the expense of introducing additional, often difficult to constrain, parameters to models.

Here, we show how new experimental data can be integrated into process-based vegetation modelling. More specifically, we use high-resolution sapflow and stem water potential data to effectively constrain the most crucial plant hydraulic parameters of the terrestrial biosphere model QUINCY: saturated xylem hydraulic conductivity, and stem and leaf water storage capacitance.

We further apply QUINCY to several FLUXNET sites and show that our parameterizations are consistent across different environmental conditions. We also discuss how the incorporation of hydraulic failure-based mortality mechanisms may alter modelled carbon dynamics and how future experiments could help reduce uncertainty in modelling drought-induced mortality.

How to cite: Papastefanou, P., Donfack Somenguem, L., Klosterhalfen, A., Magh, R.-K., Paligi, S. S., Sabot, M., Schellenberg, K., and Zaehle, S.: Drought stress in European forests: Integrating novel experimental data to improve vegetation modelling , EGU General Assembly 2025, Vienna, Austria, 27 Apr–2 May 2025, EGU25-13514, https://doi.org/10.5194/egusphere-egu25-13514, 2025.

EGU25-13833 | ECS | Posters on site | BG3.10

Increased crossing of thermal stress thresholds of vegetation under global warming 

Xiangyi Li, Chris Huntingford, Kai Wang, Jiangpeng Cui, Hao Xu, Nazhakaiti Anniwaer, Hui Yang, Josep Peñuelas, and Shilong Piao

Temperature extremes exert a significant influence on terrestrial ecosystems, but the precise levels at which these extremes trigger adverse shifts in vegetation productivity have remained elusive. In this study, we have derived two critical thresholds, using standard deviations (SDs) of growing-season temperature and satellite-based vegetation productivity as key indicators. Our findings reveal that, on average, vegetation productivity experiences rapid suppression when confronted with temperature anomalies exceeding 1.45 SD above the mean temperature during 2001-2018. Furthermore, at temperatures exceeding 2.98 SD above the mean, we observe the maximum level of suppression, particularly in response to the most extreme high-temperature events. When Earth System Models are driven by a future medium emission scenario, they project that mean temperatures will routinely surpass both of these critical thresholds by approximately the years 2050 and 2070, respectively. However, it's important to note that the timing of these threshold crossings exhibits spatial variation and will appear much earlier in tropical regions. Our finding highlights that restricting global warming to just 1.5°C can increase safe areas for vegetation growth by 13% compared to allowing warming to reach 2°C above preindustrial levels. This mitigation strategy helps avoid exposure to detrimental extreme temperatures that breach these thresholds. Our study underscores the pivotal role of climate mitigation policies in fostering the sustainable development of terrestrial ecosystems in a warming world.

How to cite: Li, X., Huntingford, C., Wang, K., Cui, J., Xu, H., Anniwaer, N., Yang, H., Peñuelas, J., and Piao, S.: Increased crossing of thermal stress thresholds of vegetation under global warming, EGU General Assembly 2025, Vienna, Austria, 27 Apr–2 May 2025, EGU25-13833, https://doi.org/10.5194/egusphere-egu25-13833, 2025.

EGU25-14250 | Posters on site | BG3.10

Multiscale response of vegetation growth to climate extremes 

Duqi Liu, Guishan Cui, and Zhen Xu

In recent decades, the intensity and frequency of extreme climatic events have increased markedly, causing remarkable effects on terrestrial ecosystems. Understanding how these climate extreme climatic events affect vegetation growth is important for the global change ecology. We used vegetation index with satellite observations, including the normalised difference vegetation index (NDVI), enhanced vegetation index (EVI), and solar-induced chlorophyll fluorescence (SIF) to assess vegetation growth, and applied event coincidence analysis and sensitivity analysis to study how the climate extreme (extreme heat, cold, wet and drought) lead to abnormal vegetation growth in different areas. First, taking Northeast Asia as an example, our results show that extreme heat promotes vegetation growth, while extreme cold adversely affects vegetation growth. The beneficial effect of extreme heat on vegetation growth weakens with increasing temperature gradients, but amplifies with rising humidity gradients. This indicated that extreme heat is beneficial for vegetation growth in cold and humid regions. To further verify the above conclusions, we extended the study area to the Northern Hemisphere. In the Northern Hemisphere, extreme heat and cold are important climatic factors affecting the abnormal vegetation growth in the cold and humid ecosystems. Water-related extreme events were less influential to abnormal vegetation growth, mainly affecting relatively warm and arid ecosystems. In summary, our results emphasise the crucial role of background hydrothermal conditions in the attribution of vegetation growth extremes to diverse climate extremes.

How to cite: Liu, D., Cui, G., and Xu, Z.: Multiscale response of vegetation growth to climate extremes, EGU General Assembly 2025, Vienna, Austria, 27 Apr–2 May 2025, EGU25-14250, https://doi.org/10.5194/egusphere-egu25-14250, 2025.

EGU25-14439 | ECS | Orals | BG3.10

Temperature extremes from a leaf perspective: Micro- vs macro-climate predictors of dwarf-shrub thermal tolerance limits 

Sonya Geange, Alba Torre, Sebastian Sangha, Vanessa Carteron, Yanis Oudina, Mathéo Touriere, Kristine Birkeli, Josef Garen, Nicole Bison, Sean Michlaetz, Hui Tang, Dagmar Egelkraut, Aud Halbritter, and Vigdis Vandvik

Despite their broad climatic and geographic ranges and dominant ecosystem roles across boreal, alpine and arctic vegetation zones; dwarf shrubs can be sensitive to climatic changes, in particular shifting thermal regimes. But questions remain as to the macro-or micro-climatic conditions we should focus upon when considering these changing plant-climate relationships. As a case study highlighting how microclimate insights may contribute at scales from the field through to land-surface models, in the DURIN project we explore how thermal microclimate measures at plant- and leaf-levels can be used to better inform models regarding the thermal tolerance limits of leaves. At high-latitudes, increasing summer heat extremes and aseasonal freezing events associated with changing snowpack dynamics, will expose dwarf-shrubs to potentially stressful conditions for photosynthesis and carbon gain. We explore thermal damage by quantifying temperature at which there is a 50% decline in the maximum quantum yield of photosystem II (FV/FM), for a range of dwarf shrub species growing across habitats and bioclimatic zones. We then compare the extent of photosystem damage to various estimates of temperature extremes as derived from plant-level climate sourced from TOMST loggers, FLIR imagery, and leaf-level thermocouples deployed in dwarf-shrub and non-dwarf-shrub plots. The time-series of fine-scale characterization of dwarf-shrub microclimates in-situ will be correlated with downscaled microclimate estimates from NicheMapR, along with nearby weather station data to highlight the discrepancies between macro- and microclimates. These comparisons allow us to additionally ask fundamental questions about the ways in which we should assess thermal tolerance taking into greater consideration methods for quantifying heat stress.  Classical assays of photosynthetic thermal tolerance limits have focused on singular and short exposure times to temperature stress, but increasingly the field is moving towards providing more biologically meaningful insights into thermal tolerance exposures, enabling us to better define and experimentally impose thermal stress events. An emerging discussion surrounds the use of the thermal death time framework, where cumulative thermal stress is applied, e.g. a range of exposure times at varying temperatures. Our work will help develop protocols for the thermal death time framework which requires a more nuanced understanding of thermal stress events at plant and leaf-level, integrating our micro-and macro-climate insights.

How to cite: Geange, S., Torre, A., Sangha, S., Carteron, V., Oudina, Y., Touriere, M., Birkeli, K., Garen, J., Bison, N., Michlaetz, S., Tang, H., Egelkraut, D., Halbritter, A., and Vandvik, V.: Temperature extremes from a leaf perspective: Micro- vs macro-climate predictors of dwarf-shrub thermal tolerance limits, EGU General Assembly 2025, Vienna, Austria, 27 Apr–2 May 2025, EGU25-14439, https://doi.org/10.5194/egusphere-egu25-14439, 2025.

Since the early 2000s, the western U.S has been entrenched in a historic 20 year "megadrought," ranked one of the worst in 1200 years. In addition to decreases in precipitation, atmospheric aridity, or vapor pressure deficit (VPD) has been also increasing. The important role that VPD plays in regulating plant growth has recently been implicated in a handful of studies, but primarily from the ecosystem perspective. The possibility of direct effects of VPD on cellular-to-organismic growth processes has not been adequately explored, beyond the obvious influences on stomatal conductance and photosynthesis. We hypothesize that from a biophysical perspective, persistent seasonal trends of high VPD may also play an important role at the whole tree scale. In a Pinus ponderosa forest in southern Arizona, USA, we collected bi-weekly micro-core samples and found that although earlywood cambial cell expansion occurs during spring (under high soil moisture and low VPD), the carbon and oxygen isotope ratios (13C/12C, 18O/16O ) of early-wood cellulose reflect the mid-summer climate of low soil moisture and high VPD. Using cellular modeling of xylogenesis, we have shown that the reason for these contrasting observations is a multi-week offset between cell expansion and cell-wall thickening. Thus, the deposition of isotopically-enriched sugars (revealed by 18O/16O and 13C/12C) occurs as a "backfilling" process during the weeks following cell expansion. The cellular modeling of xylogenesis also revealed that between our two sampling years, 2018 (drier winter, wetter summer) and 2019 (wetter winter, drier summer), there were differences in the timing and duration of cell enlargement and cell wall thickening, which correlated with VPD. Our next step is to conduct quantitative wood anatomy measurements to characterize the seasonal rates of carbon accumulation and to assess how this highly variable seasonal climate fluctuation influences seasonal rates of carbon accumulation.

How to cite: Hu, J. and Morino, K.: The influence of precipitation and vapor pressure deficit on xylem phenology: a case study in a semi-arid conifer forest, EGU General Assembly 2025, Vienna, Austria, 27 Apr–2 May 2025, EGU25-14863, https://doi.org/10.5194/egusphere-egu25-14863, 2025.

EGU25-15076 | ECS | Orals | BG3.10

Dry Heatwaves Alone Do Not Reduce Tree Resilience, but Their Compounding with Soil Drought Does 

Erez Feuer, Yakir Preisler, Eyal Rotenberg, Dan Yakir, and Yair Mau

In this study, we examine tree resilience in response to compound atmospheric and soil droughts, using dendrometer-based stem diameter measurements in a semi-arid pine forest. Our main question is: what is the differential impact of atmospheric and soil drought on plant growth and resilience? By analyzing data from an irrigation experiment on mature pine trees, we developed new tools for characterizing heatwaves, and introduced novel resilience indices, especially designed for robust evaluation of recovery and resistance in trees experiencing short and intense heatwaves against the backdrop of a long soil drought. Our findings show that irrigation effectively shielded trees from the negative impacts of heatwaves. Non-irrigated trees exhibited a significant decline in resilience during the dry season, primarily during compound droughts, which irrigated trees did not experience. Following the beginning of the wet season, the resilience of non-irrigated trees increased rapidly, matching that of the irrigated trees, suggesting minimal compromise in hydraulic functioning. These findings have significant implications for understanding forest resilience in the face of escalating climate change and provide practical tools for real-time monitoring and assessment.

How to cite: Feuer, E., Preisler, Y., Rotenberg, E., Yakir, D., and Mau, Y.: Dry Heatwaves Alone Do Not Reduce Tree Resilience, but Their Compounding with Soil Drought Does, EGU General Assembly 2025, Vienna, Austria, 27 Apr–2 May 2025, EGU25-15076, https://doi.org/10.5194/egusphere-egu25-15076, 2025.

EGU25-15346 | ECS | Posters on site | BG3.10

Blue light reduces leaf-level water-use efficiency via contrasting physiological mechanisms in two tree species 

Haoyu Diao, Marco M. Lehmann, Meisha Holloway-Phillips, Arthur Gessler, Rolf T.W. Siegwolf, and Matthias Saurer

Blue light-dependent photosynthesis and stomatal opening have been intensively studied in herbaceous crops but less so in tree species, where forests face more complex light environments compared with crops in agricultural fields. The light spectral environment in forests is influenced by factors such as the multi-layered canopy structure, dynamic light availability and shading through canopy gaps, and the occurrence of sun flecks. These factors result in dynamic variability in blue-to-red light ratio perceived by trees. Therefore, we conducted leaf gas exchange measurements, combined with online isotope discrimination, photorespiration and chlorophyll fluorescence on two contrasting tree species grey alder (Alnus incana) and holm oak (Quercus ilex) across a full gradient of blue light fraction, with the remaining fraction supplied as red light to maintain a constant total light intensity. Photosynthetic and stomatal responses to increasing blue light differed markedly between the two species but led to a consistently decreasing water-use efficiency (WUE). For grey alder, the decrease in WUE was primarily due to blue light-induced photosynthesis reduction, which is associated with light stress on the photosynthetic apparatus as detected by chlorophyll fluorescence; whereas for holm oak, blue light-stimulated stomatal opening played the major role in reducing WUE. Although isotope-based estimates of mesophyll conductance were lower at higher blue light levels, especially in grey alder, the changes in mesophyll conductance did not result in a CO2 shortage at the site of Rubisco under higher compared with lower blue light levels. However, across species, the component responding to blue light differed: the chloroplast membrane in grey alder and the cell wall and plasma membrane in holm oak. We suggest that, in tree species, blue light decreases WUE through distinct coordination between photosynthesis and stomata and species-specific blue light sensitivities of underlying mechanisms influencing the CO2 diffusion pathway.

How to cite: Diao, H., Lehmann, M. M., Holloway-Phillips, M., Gessler, A., Siegwolf, R. T. W., and Saurer, M.: Blue light reduces leaf-level water-use efficiency via contrasting physiological mechanisms in two tree species, EGU General Assembly 2025, Vienna, Austria, 27 Apr–2 May 2025, EGU25-15346, https://doi.org/10.5194/egusphere-egu25-15346, 2025.

EGU25-15754 | ECS | Posters on site | BG3.10

Atmospheric aridity and soil moisture fluctuations regulate GPP in a temperate peat bog 

Sandeep Thayamkottu, Mohit Masta, June Skeeter, Jaan Pärn, Sara H Knox, T. Luke Smallman, and Ülo Mander

Despite only covering ~3% of the land area, peatlands store more carbon (650 gigatons (Gt) of C) than global terrestrial vegetation (409 GtC). However, this C is vulnerable to climate warming and drainage. Plants mediate land-atmosphere C exchange and its coupling with water by regulating stomatal opening and root water intake during droughts. Stomatal regulation and photosynthesis are dependent on soil water content (SWC), air temperature (Tair), and vapour pressure deficit (VPD). However, the role of SWC on gross primary productivity (GPP) is still not straightforward, as evidenced by several contradictory literature. Considering this, we asked whether there is a threshold at which SWC drawback starts to regulate GPP in a peat bog in Vancouver, Canada. We used weekly time step eddy covariance data spanning five years (2016-2020). Our analysis suggests that stomatal regulation in response to increased VPD caused a reduction in GPP during the 2016 drought (~2.5gC m-2 day-1). On the other hand, an absence of stomatal regulation in 2017 and 2018 (to maximise C assimilation) following the initial drought caused the peat surface to dry out in 2019. This resulted in SWC regulating GPP more than VPD by 2019. We report a SWC threshold of 82.5% (-8 cm water table depth), below which it starts to regulate GPP at this site. The interaction between energy and water limitations on GPP is expected to intensify with the projected increase in the frequency of drought events across the northern hemisphere.

How to cite: Thayamkottu, S., Masta, M., Skeeter, J., Pärn, J., H Knox, S., Smallman, T. L., and Mander, Ü.: Atmospheric aridity and soil moisture fluctuations regulate GPP in a temperate peat bog, EGU General Assembly 2025, Vienna, Austria, 27 Apr–2 May 2025, EGU25-15754, https://doi.org/10.5194/egusphere-egu25-15754, 2025.

EGU25-16453 | ECS | Orals | BG3.10

Persistent drought legacy effects in a Scots Pine forest after years of concurrent drought and heat 

Simon Haberstroh, Markus Sulzer, Fabio Scarpa, Thomas Plapp, Andreas Christen, and Christiane Werner

In Central Europe, re-occurring compound events (drought and heat) have caused substantial damage to forest ecosystems with significant changes in carbon and water fluxes. Here we investigate the impact of the 2018 compound event and following drought years on net ecosystem carbon exchange (NEE) and vegetation dynamics of a Scots Pine (Pinus sylvestris) forest in SW-Germany (ICOS Site DE-Har, Hartheim, Germany). The compound event of 2018 caused severe hydraulic damage to trees, which led to high mortality rates of Scots Pine trees (>60% until 2024). While the forest ecosystem was a strong annual carbon sink in the past (up to -603 g C m-2 year-1), the ecosystem shifted to almost carbon neutral in a cold and wet year (2021). All other years since 2018 were hotter (and drier) than the long-term average, which led, in combination with legacy effects of 2018, to an annual carbon release with maximum values of +298 ± 12 g C m-2 year-1 in 2022. These values correspond to a difference in NEE of up to +901 g C m-2 year-1compared to conditions before 2018.

Concurrently, the vegetation composition of the ecosystem is slowly shifting from an evergreen coniferous forest to a mixed/deciduous forest. Deciduous trees in the understory expressed a higher resilience (higher water potentials and sap flux density) towards compound events compared to Scots Pine, potentially due to microclimatic buffering effects. This vegetation shift was clearly visible in the enhanced vegetation index (EVI) of the site, which increased in summer and decreased in winter, indicating an ongoing shift in canopy type and greenness towards deciduous species since 2018.

In conclusion, the compound event of 2018 caused significant legacy effects at the ecosystem and community scales in the studied Scots Pine forest. These effects were further exacerbated by recurrent atmospheric and edaphic drought conditions after 2018, which led to a significant ecosystem carbon release since then. If climate extremes do occur with the same frequency as in 2018-2024, this could significantly delay or even prevent ecosystem recovery, putting more ecosystems in Central Europe at risk.

How to cite: Haberstroh, S., Sulzer, M., Scarpa, F., Plapp, T., Christen, A., and Werner, C.: Persistent drought legacy effects in a Scots Pine forest after years of concurrent drought and heat, EGU General Assembly 2025, Vienna, Austria, 27 Apr–2 May 2025, EGU25-16453, https://doi.org/10.5194/egusphere-egu25-16453, 2025.

EGU25-16659 | ECS | Orals | BG3.10

Life after drought: breaking out of the transpiration-assimilation feedback loop  

Qi Liu, Jan Weger, Martin Weiser, Vaclav Sipek, and Martin Bouda

Increasing drought extremes represent a major stress on ecosystem function through direct impacts on critical plant physiological processes such as transpiration and growth. While the immediate effects of drought are well-documented, vegetation recovery processes and associated time lags in ecosystem function remain poorly understood due to the scarcity of the requisite plant physiological data time series.

This study relates transpiration to evaporative demand, soil moisture, and tree growth during the recovery period following a multiyear drought cluster, centred on the extreme in 2018.  High-resolution time-series data were collected with dendrometers, stem sap flow, and soil water potential sensors in a Fagus sylvatica stand located in Pruhonice, Czech Republic.

We found unexpected evidence that transpiration may be xylem-limited during drought recovery by examining the different patterns in transpiration between 2021 (the first major drought recover year at our site) and 2022. During the 2022 (control) season, canopy transpiration achieved a balance between potential evapotranspiration and soil moisture, independent of seasonal stem growth. By contrast, in 2021, we observed an unexpected gradual increase in transpiration over the growing season corresponding to stem incremental growth but independent of soil moisture or potential transpiration.  These results indicate that post-drought recovery may involve a feedback loop between growth and transpiration until plants overcome xylem-limitation following drought.

In sum, this study observed surprisingly strong plant carbon-hydraulic feedback during drought recovery. If confirmed, this feedback may prove key to predicting the pathways of plant and soil water status following drought events and their impacts on ecosystem function. The findings also suggest a possibility that plants’ ability to break out of the feedback loop may be a key trait to track when choosing suitable species for future forest management.

How to cite: Liu, Q., Weger, J., Weiser, M., Sipek, V., and Bouda, M.: Life after drought: breaking out of the transpiration-assimilation feedback loop , EGU General Assembly 2025, Vienna, Austria, 27 Apr–2 May 2025, EGU25-16659, https://doi.org/10.5194/egusphere-egu25-16659, 2025.

EGU25-16732 | ECS | Orals | BG3.10

The role of the plant hydraulic conductance for the transpiration rate response to increasing VPD 

Tina Köhler, Ibrahim Bourbia, Mutez Ahmed, and Timothy Brodribb

A restricted transpiration rate (TR) response to rising vapor pressure deficit (VPD) is often considered a useful ‘trait’ for soil water conservation under circumstances of terminal drought. The plant hydraulic conductance (Kp) is debated to play a role in shaping water use under atmospheric drought. Here, we investigated whether a limited TR response to elevated VPD defines as a ‘trait’ (or whether it is rather the product of several interacting traits). Further, we aimed to identify which role limitations in Kp play for plant water use regulation during increasing VPD. To achieve that, we tested whether a reduction in Kp would lead to an altered TR-VPD response.

We exposed five individual maize (Zea mays L.) plants to rising VPD up to 2.3 kPa in a climate chamber in wet soil conditions while simultaneously and continuously monitoring whole plant TR with balances and stem water potential (Ψstem) dynamics using optical dendrometers. Kp was calculated from the slope between TR and Ψstem in the linear part of the relation. To achieve a reduction in Kp, we destructively cut the root system in several places. The TR-VPD profile was measured on: (1) intact plants, (2) plants of which the root system was cut, and (3) disturbed plants after five days of recovery.

In undisturbed conditions, plants transpired linearly until a VPD of 0.9 kPa, upon which TR increased to a lesser extent. In damaged plants, TR was restricted at comparable VPD but subsequently decreased with rising VPD beyond this threshold. Despite strong stomatal regulation, Ψstem declined further and became more negative compared to undisturbed plants.  Kp was reduced by merely 5% due to root cutting. Upon five days of recovery, plants transpired at a relatively lower initial rate compared to undisturbed conditions, but linearly with rising VPD.

Root cutting and recovery created new phenotypes of the same plant in terms of water-use regulation during atmospheric drought, implying (i) the difficulty of phenotyping for, and (ii) the context-dependency of water use responses. Root cutting leading only to a minor decrease in Kp indicates that root length does not linearly correlate with Kp. Given the minimal decline in Kp, we suggest that the strong change in the TR-VPD response that was associated with root cutting might be attributed to changes in the plant’s capacitive storage, modulating short-term Ψstem dynamics and stomatal response.

How to cite: Köhler, T., Bourbia, I., Ahmed, M., and Brodribb, T.: The role of the plant hydraulic conductance for the transpiration rate response to increasing VPD, EGU General Assembly 2025, Vienna, Austria, 27 Apr–2 May 2025, EGU25-16732, https://doi.org/10.5194/egusphere-egu25-16732, 2025.

EGU25-17801 | Posters on site | BG3.10

Exploring Non-Linear Memory Between Soil Moisture and Forest Greenness Dynamics 

Tristan Williams, Miguel D. Mahecha, and Gustau Camps-Valls

The terrestrial biosphere plays a crucial role in Earth's climate system, influencing energy, water, and carbon cycles, while supporting biodiversity and ecosystem services essential for human sustainability. Predicting how ecosystems will respond to climate change and their feedback effects remains a significant challenge [1]. One major difficulty arises from the complexity of the systems involved, with non-linear processes and interactions occurring across varying timescales. Vegetative systems, particularly forests, exhibit processes that span from seconds to decades, indicating their persistence [2]. Many of these dynamics are driven by weather patterns, which are short-term processes. Soil moisture (SM), a key ecohydrological variable, has been shown to exhibit long-term persistence and plays a critical role in these interactions [3]. Modeling studies have demonstrated that SM can improve seasonal climate predictions [4]. Therefore, investigating the persistence of soil moisture-plant interactions is crucial for understanding long-term changes in the terrestrial biosphere.

In this study, we examine the coupled non-linear persistence between remote sensing derived SM and vegetation greenness using kernel Detrended Fluctuation Analysis (kDFA), a novel multivariate non-linear extension of DFA [5]. This method allows us to explore the non-linear interactions between these variables across multiple scales within a persistence space. By doing so, we can quantitatively assess how moisture influences persistence in vegetative systems. Additionally, we investigate the relationships between SM-vegetation persistence, forest greenness, and other eco-physiological proxies using a non-linear regression algorithm. First, we perform a spatial analysis, followed by a temporal analysis using a moving window approach. Our goal is not only to assess how SM-forest interactions evolve over time, but also to link this persistence to ecosystem stress and identify areas vulnerable to hot and dry conditions as drought-heat events increase in frequency and intensity [6].

References: 

1. Overpeck, J., Whitlock, C., Huntley, B. (2003). Terrestrial Biosphere Dynamics in the Climate System: Past and Future. In: Alverson, K.D., Pedersen, T.F., Bradley, R.S. (eds) Paleoclimate, Global Change and the Future. Global Change — The IGBP Series. Springer, Berlin, Heidelberg. 

2. Williams, et al. Sub-Seasonal Forest Carbon Dynamics Lose Persistence Under Extremes. Submitted.

3. Orth, R., and Seneviratne, S.I. (2012).  Analysis of soil moisture memory from observations in Europe, J. Geophys. Res.,  117, D15115, doi:10.1029/2011JD017366.

4. Besnard, S., et al. (2019). Memory effects of climate and vegetation affecting net ecosystem CO2 fluxes in global forests. PloS one 14.2.

5. Williams et al. Kernel Detrended Fluctuation Analysis. Submitted.

6. Seneviratne, S.I., et al. (2021). Weather and Climate Extreme Events in a Changing Climate. In Climate Change 2021: The Physical Science Basis. Contribution of Working Group I to the Sixth Assessment Report of the IPCC. Cambridge University Press, Cambridge, United Kingdom and New York, NY, USA, pp. 1513–1766.

How to cite: Williams, T., Mahecha, M. D., and Camps-Valls, G.: Exploring Non-Linear Memory Between Soil Moisture and Forest Greenness Dynamics, EGU General Assembly 2025, Vienna, Austria, 27 Apr–2 May 2025, EGU25-17801, https://doi.org/10.5194/egusphere-egu25-17801, 2025.

EGU25-18068 | ECS | Posters on site | BG3.10

The cold acclimatization of root water uptake in temperate tree species 

Yating Li and Guenter Hoch

Plants are able to acclimatize to cold climates by developing physiological strategies to withstand periods of cold but nonfreezing temperatures during the growing season. In this study we investigated, if a long-term acclimation to low temperatures enables seedlings of temperate tree species to reduce the negative effects of low root temperatures on root water uptake and transport that has been observed in previous experimental studies. We investigated 7 common European tree species that differ largely in their natural elevational distribution ranges. To acclimatize the plants to different temperatures, newly germinated seedlings were raised at two different air temperatures (warm 22°C day/18°C night; cold, 12°C day/8°C night) for several months, and then were exposed to three different root temperatures (15, 7 and 2°C) in hydroponic systems while maintaining the same warm aboveground temperatures (20-25 °C) for a two-day period. We used stable isotope labelling with 2H-H2O source water to quantify the water uptake and transport from roots to leaves by the amount of 2H-label in leaf water after labelling. The species-specific sensitivity of root water uptake to low root temperatures was indentified by the relative change of 2H labels in leaf water at low root temperatures relative to 15°C. We found cold acclimation treatment did not improve the cold sensitivity of root water uptake, except for the two species with the lowest elevational distribution limits. In contrast, the majority of the investigated species showed a generally enhanced capacity of water uptake and transport after cold acclimation, regardless of the applied root temperatures. This results suggested a limited ability for physiological adjustemnts to overcome the cold limitation of water transport in roots, that is generally associated with decraesing efficiency of water diffusion across plasma membranes. The tendency towards an overall enhanced capacity for water movements in cold acclimatized seedlings might be due to the modified root anatomy and morphology that would help to improve root hydraulic conductance of trees in cold environments.

How to cite: Li, Y. and Hoch, G.: The cold acclimatization of root water uptake in temperate tree species, EGU General Assembly 2025, Vienna, Austria, 27 Apr–2 May 2025, EGU25-18068, https://doi.org/10.5194/egusphere-egu25-18068, 2025.

EGU25-18471 | ECS | Posters on site | BG3.10

Increased light exposure reduces drought survival in tree seedlings 

Romy Rehschuh, Jiri Kocum, Katja Skibbe, Bernhard Schuldt, and Goddert von Oheimb

Forests are increasingly subjected to drought stress and heatwaves, with recent years showing widespread tree mortality, particularly in monocultures. To improve the climate resilience of forests, a transformation towards mixed-species and more adaptive stands is essential. Thinning is one effective measure to enhance water and light availability for the (natural or artificial) regeneration of diverse tree species. To better understand how microclimatic factors such as light, vapor pressure deficit, and soil moisture influence drought resistance in the main tree species Abies alba, Fagus sylvatica, Quercus robur, and Pseudotsuga menziesii, seedlings were planted under controlled greenhouse conditions, with either full light or shaded conditions provided by shading nets. A simulated drought period was then applied to observe the time until stomatal closure and critical hydraulic failure, defined as the point at which trees reached the water potential at 88% loss of hydraulic conductivity. Predawn water potential and gas exchange measurements were combined and stem diameter change continuously monitored.

Light-exposed seedlings generally exhibited greater height and stem growth than shaded seedlings. However, predawn water potential measurements indicated that these seedlings suffered from drought earlier than shaded trees and consistently died earlier. This was attributed to higher transpiration rates of light-exposed trees, resulting from a higher evaporative demand, larger plant size and total leaf area compared to the shaded trees. Under light conditions, differences in the sequence of drought-induced mortality were more pronounced (Q. robur died first, followed by F. sylvatica and P. menziesii), whereas under shaded conditions, mortality times were more uniform across these species. Overall, A. alba demonstrated the highest drought resistance.

These results emphasize the critical role of total leaf area in determining drought resistance among tree species. While light generally promotes CO₂ uptake and growth in most tree species, it can also exacerbate drought stress under certain conditions. Considering species-specific drought tolerance and implementing adaptive forest management practices, such as promoting mixed-species stands and adjusting thinning regimes, will be key to balancing the benefits of light with the need for drought resistance during the juvenile stage for mitigating the impact of future heatwaves and droughts on European forests.

How to cite: Rehschuh, R., Kocum, J., Skibbe, K., Schuldt, B., and von Oheimb, G.: Increased light exposure reduces drought survival in tree seedlings, EGU General Assembly 2025, Vienna, Austria, 27 Apr–2 May 2025, EGU25-18471, https://doi.org/10.5194/egusphere-egu25-18471, 2025.

EGU25-18514 | ECS | Posters on site | BG3.10

Understanding the Snow Drought–Soil Moisture–Vegetation Feedback: The impacts of seasonal Memory Effects on GPP Anomalies  

Mariangela Varela, David Gampe, and Marianela Fader

Snow plays a critical role in ecosystems by providing a reliable water supply in spring as winter snow melts. However, “snow droughts” are emerging as a growing threat to terrestrial ecosystem functioning. Snow droughts, characterized by reduced or even absent winter snow accumulation, arise either from warmer conditions where precipitation falls as rain instead of snow (warm snow drought) or insufficient winter precipitation (dry snow drought). Consequently, the amount of water stored in the snow pack (“snow water equivalent”, -(SWE)) is reduced, altering snow melt and thus impacting streamflow discharge and groundwater recharge. Even more directly, soil water storage is reduced, which can diminish late-season water availability, potentially reducing plant productivity. Despite their critical implications, the links between snow droughts and their broader effects on the carbon cycle remain poorly understood and quantified.

 Using the LPJmL dynamic global vegetation model, we attribute spring gross primary productivity (GPP) anomalies in the Northern Hemisphere over the past decades to snow drought-induced soil moisture deficits. By tracking the seasonal progression of soil moisture and GPP, we quantify these linkages between snow droughts and subsequent soil moisture deficits, as well as their direct impact of GPP anomalies and their related “legacy or memory effects” on summer GPP anomalies.

This research highlights the feedback mechanisms between snow droughts, soil moisture, and vegetation, providing novel insights on drought impacts across seasons.

How to cite: Varela, M., Gampe, D., and Fader, M.: Understanding the Snow Drought–Soil Moisture–Vegetation Feedback: The impacts of seasonal Memory Effects on GPP Anomalies , EGU General Assembly 2025, Vienna, Austria, 27 Apr–2 May 2025, EGU25-18514, https://doi.org/10.5194/egusphere-egu25-18514, 2025.

EGU25-18776 | ECS | Orals | BG3.10

Impact of Recurrent Droughts on the Water Use and Growth Dynamics of Larch and Spruce: insights from a long-term experiment in the Austrian Alps 

Álex Tuñas Corzón, Bernice Hwang, Andreas Bär, Gerhard Wieser, Walter Oberhuber, Stefan Mayr, and Michael Bahn

In the face of climate change, droughts are becoming more frequent and intense, exposing trees to ever-increasing physiological stress. Despite extensive research, the effects of recurrent droughts on tree carbon and water relations remain poorly understood, particularly in mountain forests. At a subalpine Long-Term Ecological Research (LTER) site in the Austrian Alps, we investigated the impacts of eight years of recurrent summer droughts on two conifer species—larch (Larix decidua) and spruce (Picea abies). Using comprehensive dendrometer and xylem sap flow data from 2021–2024, encompassing three years of drought followed by one year of recovery, we tested the following hypotheses: (i) recurrent droughts amplify drought responses of radial tree growth dynamics and water use, (ii) drought history causes lagged responses on growth dynamics and water use during a recovery year, with larch exhibiting greater resilience. Our preliminary findings reveal significant drought-induced reductions in sap flow, as well as in mean and maximum growth rates for both species during the treatment years. Yet, contrary to our expectations, multiple recurrent droughts did not significantly amplify the growth and water use sensitivity of trees at this subalpine site. During the recovery year, sap flow did not show legacy effects for either species; however, growth rates remained consistently suppressed, most notably in larch. Thus, our results suggest that although recurrent summer droughts do not have any lagged effects on water use dynamics in a recovery year, legacies lead to major reductions in growth, particularly in larch, which may be less resilient than expected.

How to cite: Tuñas Corzón, Á., Hwang, B., Bär, A., Wieser, G., Oberhuber, W., Mayr, S., and Bahn, M.: Impact of Recurrent Droughts on the Water Use and Growth Dynamics of Larch and Spruce: insights from a long-term experiment in the Austrian Alps, EGU General Assembly 2025, Vienna, Austria, 27 Apr–2 May 2025, EGU25-18776, https://doi.org/10.5194/egusphere-egu25-18776, 2025.

EGU25-20405 | ECS | Orals | BG3.10

Differential effects of Soil Drought Alleviation on mitigating the Effects of Atmospheric Drought in mature Pine Forest Trees 

Diriba-Bane Nemera, Eyal Rotenberg, Nikos Markos, Yakir Preisler, Itay Oz, Jonathan Muller, and Dan Yakir

Forests play a vital role in the earth’s ecosystems by regulating global water and carbon cycles and carbon assimilation. While significant advancements have been made in understanding the impacts of drought on tree physiology and gas exchange, the extent to which alleviation of soil drought mitigates the impact of high vapor pressure deficit (VPD) on leaf net photosynthesis (Anet) remains unclear. In a six-year study of soil drought alleviation (SDA; using dry-season supplement irrigation), we investigated its mitigating effects on the response of branch-scale net photosynthesis (Anet) to high atmospheric drought in a mature pine forest (Pinus halepensis). We demonstrate that while SDA improves Anet response to VPD, VPD remains a major factor in shaping the daily Anet cycle and overall tree productivity. In fact, in summer, SDA trees show an early Anet peak, followed by a sharp decrease reflecting a relative sensitivity to VPD greater than that of the soil-droughted (SD; control) trees. Specifically, we show peak Anet of around 7 AM and 9 AM in the SD and SDA trees, compared to ~noon in winter. The data also indicate that increasing VPD above a threshold of ~4 kPa, the SDA trees show enhanced sensitivity to VPD, shaping the above-noted daily peak and limiting productivity. The analysis of the partial dependence of Anet on key microclimatic variables and soil moisture content, using generalized additive models (GAMs), confirmed that the branch-scale Anet in the SDA trees improved under VPD only up to 4 kPa compared to SD trees. Above this apparent threshold, Anet in SDA trees declined sharply, associated with reduced stomatal conductance, and with increased respiration due to the elevated temperatures at these times. Further analysis, across the entire observed VPD range, showed that SDA trees do, in fact, have a greater sensitivity of Anet to VPD (and in particular to extreme atmospheric drought). The results indicated that while SDA effectively buffers trees from moderate atmospheric drought, it does not provide efficient mitigation towards extreme conditions. Our findings underscore the complex interplay between soil and atmospheric drought impacts in shaping tree physiological responses in pine forests, offering a important basis for predicting their response to different climate change scenarios.

How to cite: Nemera, D.-B., Rotenberg, E., Markos, N., Preisler, Y., Oz, I., Muller, J., and Yakir, D.: Differential effects of Soil Drought Alleviation on mitigating the Effects of Atmospheric Drought in mature Pine Forest Trees, EGU General Assembly 2025, Vienna, Austria, 27 Apr–2 May 2025, EGU25-20405, https://doi.org/10.5194/egusphere-egu25-20405, 2025.

EGU25-1726 | Orals | BG3.11

Linking ATTO Black Carbon to Rainfall Patterns in the South America-Atlantic Tropical Zone 

Luiz Augusto Toledo Machado, Manoel A. Gan, Henrique J. M. Barbosa, Bruna Holanda, Andrea Pozzer, and Christopher Pöhlker

During the rainy season, black carbon (BC) particles exhibit strong variability in concentration. At the Amazon Tall Tower Observatory (ATTO), located in central Amazonia, elevated BC concentrations have been previously identified as originating from the African continent. However, BC mass concentrations approach zero during certain periods, characterizing pristine episodes. This study aims to identify the primary factors influencing BC concentration in the Amazon. The first analytical approach involved evaluating air mass back trajectories during episodes of high BC concentration (BC > 0.46 µg/m³, with the day of maximum concentration selected from neighboring days) and low BC concentration (BC < 0.08 µg/m³, with the day of minimum concentration chosen). Ensemble back trajectories, analyzed across multiple atmospheric levels, revealed minimal differences between the air trajectories associated with these two contrasting scenarios. The second approach examined accumulated rainfall at ATTO during the three days preceding the selected high- and low-concentration days. The results indicate that precipitation plays a dominant role in modulating BC concentrations. A histogram of precipitation data revealed two distinct patterns: one corresponding to high rainfall during pristine events and another to low or negligible rainfall during more polluted days. Using ERA-5 reanalysis data, this precipitation variability was observed to extend across the Intertropical Convergence Zone (ITCZ) over the Atlantic. Simulations were conducted using the ECHAM/MESSy Atmospheric Chemistry (EMAC) model to investigate this phenomenon further. The simulations demonstrated that rainfall variability influences the transport from Africa to the Amazonas of particles such as BC, dust, and gases, including CO₂ and O₃. Composite analyses of hemispheric synoptic patterns were performed by selecting days with high and low BC concentrations from January–February from 2015 to 2022. These composites revealed that the variability is driven by oscillations in the western hemisphere synoptic patterns linked to the positioning of cold fronts in both hemispheres. This variability has significant implications for transporting vital nutrients to the Amazon rainforest. Understanding the relationship between rainfall, synoptic patterns, and BC transport is crucial, particularly in the context of climate change, which could alter these patterns and profoundly impact the ecological systems of the Amazon basin.

This study was supported by FAPESP 2022/07974-0

How to cite: Toledo Machado, L. A., Gan, M. A., M. Barbosa, H. J., Holanda, B., Pozzer, A., and Pöhlker, C.: Linking ATTO Black Carbon to Rainfall Patterns in the South America-Atlantic Tropical Zone, EGU General Assembly 2025, Vienna, Austria, 27 Apr–2 May 2025, EGU25-1726, https://doi.org/10.5194/egusphere-egu25-1726, 2025.

EGU25-2667 | ECS | Posters on site | BG3.11

Spatial variations in forest succession rates revealed from multi-temporal habitat maps using Landsat imagery in subtropical Hong Kong 

Ivan H. Y. Kwong, Derrick Y. F. Lai, Frankie K. K. Wong, and Tung Fung

Secondary succession is one of the major processes in forest habitat restoration across degraded landscapes globally, especially in tropical regions. Hong Kong, situated on the northern fringes of the Asian tropics, has undergone near-complete clearing of its original forests due to human activities in history, and most of its current vegetation was formed by regenerations in recent decades. Understanding the dynamics of vegetation changes over time involves various biotic, abiotic, and anthropogenic factors related to different ecological processes. Remote sensing imagery, with the ability to discern habitat patterns across spatial and temporal scales, provides an effective tool for addressing this requirement. In particular, the Landsat satellite mission has provided continuous earth observation data since 1972 and has been widely used in time-series analyses of habitat transformations.

This study leveraged all available Landsat imagery to examine the coverage of six habitat classes in the forest-regenerating landscape of Hong Kong from 1973 to 2022. A multi-temporal classification workflow was developed, which combined cross-calibration of Landsat sensors, random forest classification, decision-level fusion after classification, and temporal smoothing. An overall accuracy of 90.1% was achieved when assessed using various office- and field-collected data, with accuracy exceeding 86% and 88% when individual classes and mapping periods were considered respectively. Based on the multi-temporal habitat maps produced from the classification workflow, survival analysis was used to examine the time required for successional changes, and correlation analysis was used to associate the transition time with various natural and anthropogenic factors.

The results indicate that (i) a single classification model could be developed using all images acquired by multiple Landsat sensors across years, including the earliest Landsat 1–5 MSS data, which is crucial in extending the temporal baseline and adding a decade of habitat information. (ii) Incorporating more images in the classification model enhanced overall accuracy, with the highest accuracy achieved when all available images were included. Classification performances for earlier years and transitional classes showed higher vulnerability to the reduced proportion of input images. (iii) The natural landscape in Hong Kong gradually transformed from being grassland-dominated in the 1970s to woodland-dominated in the 2010s. Grasslands took a median time of 21 years to become shrublands and another 29 years to become woodlands, but the first quartiles of 7 and 10 years respectively indicate a high spatial variability. Hill fire was the most important factor positively correlated with the transition time (restricting forest succession), while increasing proximity to seed sources and protected area designation produced the highest negative correlations (accelerating the process).

This study demonstrates the value of connecting the Landsat time series with human impacts and management practices to produce spatially explicit ecological insights. The experience of forest regeneration in Hong Kong, formed by both conservation interventions and natural succession, will benefit the increasing interest in forest protection and restoration in the wider tropical region.

How to cite: Kwong, I. H. Y., Lai, D. Y. F., Wong, F. K. K., and Fung, T.: Spatial variations in forest succession rates revealed from multi-temporal habitat maps using Landsat imagery in subtropical Hong Kong, EGU General Assembly 2025, Vienna, Austria, 27 Apr–2 May 2025, EGU25-2667, https://doi.org/10.5194/egusphere-egu25-2667, 2025.

EGU25-3862 | ECS | Orals | BG3.11

Optimization of JULES model in different sites of the Amazon biome 

Amauri Cassio Prudente Junior, Felipe Santos da Silva, Luan De Paula Cordeiro, Santiago Botía, Luciana Varanda Rizzo, Edmilson Dias Freitas, Tercio Ambrizzi, Paulo Eduardo Artaxo Netto, and Luiz Augusto Toledo Machado

The Amazon biome is one of the largest carbon reservoirs, a relevant carbon sink in the world. The large extension and diversity of the Amazon biome hampers the assessment of regional-scale carbon budget based solely on local observations. Land surface models can provide carbon flux estimates, but they require proper calibration to represent the dynamics of the different ecosystems, abiotic conditions and vegetation characteristics in the Amazon Basin. One of the most important land surface model is JULES being increasingly used in tropical forests to estimate carbon fluxes. However, there is a lack of parameterization information that can be applied to the Amazon biome. Thus, this study presents an optimization of JULES main sensitivities parameters for different sites of the Amazon biome. For this attempt, we selected four Eddy-covariance flux towers as a reference based on different regions of the Amazon biome: K34 (Manaus, 2.614S/60.12W); K67 (Santarem, 2.85S/54.97W); RJA (Reserva Jaru, 10.08S/61.93W and ATTO (São Sebastião do Uatumã, 2.15S/59.03W). The variables analyzed to reproduce the carbon dynamics were the Net Ecosystem Exchange (NEE), Gross Primary Production (GPP) and eutrophic respiration (RESP) during one year of analysis. JULES most sensitivities parameters adjusted were related to the Upper-temperature threshold for photosynthesis (tupp_io); Scale factor for dark respiration (fd_io); The maximum ratio of internal to external CO2 (f0_io) and Quantum efficiency (alpha_io).  The optimization was made using the Nelder-Mead method and after a leave-one-out cross-validation method was implemented to evaluate the simulation efficiency in each site. Also, the new parametrization in each site was compared with the default version of JULES and with another model Vegetation Photosynthesis and Respiration Model (VPRM). We selected the Wilmott index of agreement (d) and the Root Mean Square Error (RMSE) to analyze simulation efficiency. The Nelder-Mead optimization method reduced the error in GPP simulations in each Tower in comparison to the two models evaluated however the new parametrization of JULES was not able to improve RESP in these sites. However, the optimization procedure presented better results in NEE in each tower evaluated in the Amazon biome being the ATTO tower that demonstrated the most efficient simulations (d =0.60;  RMSE = 2.03 g C m-2 day-1) in comparison to the default version (d= 0.52; 3.09 g C m-2 day-1) and VPRM (d = 0.58; 2.29 g C m-2 day-1). In general, results demonstrated that the new parametrization of JULES reduced the error of simulation compared to the last version of JULES for tropical forests and better represented the seasonality compared to the VPRM model.

How to cite: Prudente Junior, A. C., Santos da Silva, F., De Paula Cordeiro, L., Botía, S., Varanda Rizzo, L., Dias Freitas, E., Ambrizzi, T., Artaxo Netto, P. E., and Toledo Machado, L. A.: Optimization of JULES model in different sites of the Amazon biome, EGU General Assembly 2025, Vienna, Austria, 27 Apr–2 May 2025, EGU25-3862, https://doi.org/10.5194/egusphere-egu25-3862, 2025.

EGU25-4199 | ECS | Posters on site | BG3.11

Forecasting CO2 transport in the Amazon: A WRF-GHG simulation under deforestation and climate change scenarios 

Noelia Rojas, Santiago Botia, Theo Glauch, Julia Marshall, Luciana Varanda Rizzo, Edmilson Dias de Freitas, and Luiz Augusto Toledo Machado

The Amazon rainforest is a critical component of the global carbon cycle, contributing approximately 16% of the terrestrial ecosystem's gross primary productivity and serving as a significant carbon sink through photosynthesis. The rainforest's ability to store carbon makes it an important sink, helping to mitigate climate change by absorbing carbon dioxide (CO₂) from the atmosphere. However, threats such as deforestation and land-use change can reduce this capacity, highlighting the importance of conserving and restoring the region. According to the Intergovernmental Panel on Climate Change (IPCC), if drastic measures are not taken to reduce greenhouse gas emissions, CO2 levels will continue to rise until 2100. This could have serious consequences for the global climate, including increased temperature, changes in precipitation patterns, and a rising sea level. One of the most concerning potential outcomes is the transition of the Amazon from a carbon sink to a carbon source, further amplifying climate change. Evaluating how the predicted climate change in Amazonas will impact the forest carbon uptake is important to quantify the effect, support adaptation, and reduce vulnerabilities.

The main objective is to predict biogenic CO2 transport in the Amazon region in future land-use and climate scenarios. We will use the Weather Research and Forecasting model with Greenhouse Gases (WRF-GHG) to simulates CO2 transport in the Brazilian Amazon under two contrasting future IPCC scenarios: SSP2-4.5 ("Middle of the Road") and SSP5-8.5 ("Fossil-fueled Development").  These scenarios represent moderate and high emissions pathways, respectively.  We will use climate projections from the Coupled Model Intercomparison Project Phase 6 (CMIP-6) and land-use projections from the Land-Use Harmonization 2 (LUH2) dataset for these simulations. These input data will be important to evaluate their effects on CO2 fluxes, concentrations, and transport dynamics. Through simulations under varying deforestation scenarios, we expect to observe substantial changes in CO2 distribution and atmospheric transport patterns across the Amazon.

How to cite: Rojas, N., Botia, S., Glauch, T., Marshall, J., Varanda Rizzo, L., Dias de Freitas, E., and Toledo Machado, L. A.: Forecasting CO2 transport in the Amazon: A WRF-GHG simulation under deforestation and climate change scenarios, EGU General Assembly 2025, Vienna, Austria, 27 Apr–2 May 2025, EGU25-4199, https://doi.org/10.5194/egusphere-egu25-4199, 2025.

EGU25-8516 | ECS | Posters on site | BG3.11

Investigating small-scale vertical concentration gradients of formaldehyde and glyoxal above the canopy at the Amazon Tall Tower Observatory (ATTO) using two MAX-DOAS instruments 

Sebastian Donner, Bianca Lauster, Steffen Ziegler, Paulo Artaxo, Steffen Beirle, Achim Edtbauer, Akima Ringsdorf, Jonathan Williams, and Thomas Wagner

Multi-AXis Differential Optical Absorption Spectroscopy (MAX-DOAS) measurements use trace gas absorptions in spectra of scattered sun light recorded under different elevation angles to retrieve vertical profiles of trace gas concentrations and aerosol extinctions in the lower troposphere as well as the corresponding total tropospheric vertical column densities (VCDs). These measurements allow observation of multiple trace gases e.g., formaldehyde (HCHO) and glyoxal (CHOCHO), for the same air mass simultaneously with one instrument. We operate two MAX-DOAS instruments at the Amazon Tall Tower Observatory (ATTO) at altitudes of 80 and 298 m above ground. Besides the full profile retrievals for both instruments, this measurement setup allows the determination of vertical gradients of trace gas and aerosol abundances in the altitude range between both instruments by directly comparing the VCDs and concentrations at instrument altitude. Such small-scale vertical gradients provide important insights into the chemical processing of the different species. Located in a pristine rainforest region in the central Amazon Basin about 150 km north-east of Manaus, the ATTO site offers a unique possibility to study the chemical processing of tropospheric trace gases far away from major anthropogenic emission sources.

Here, we present an overview of these small-scale vertical gradients of formaldehyde and glyoxal abundances at ATTO. We investigate their seasonal variations, the effects of meteorological parameters and compare them to the vertical concentration gradients of isoprene and monoterpenes both being precursor substances of formaldehyde and glyoxal. Also, a comparison to model simulations might yield interesting insights. The main result of our work is that formaldehyde is net formed in the altitude range (around 200 m) between both instruments, while glyoxal is already net degraded in this altitude range. Together with their characteristic profile shapes, these findings indicate different chemical processing (production and degradation) of formaldehyde and glyoxal although both compounds can be produced from isoprene. In particular, glyoxal is likely formed and then photolyzed very rapidly in that height range.

How to cite: Donner, S., Lauster, B., Ziegler, S., Artaxo, P., Beirle, S., Edtbauer, A., Ringsdorf, A., Williams, J., and Wagner, T.: Investigating small-scale vertical concentration gradients of formaldehyde and glyoxal above the canopy at the Amazon Tall Tower Observatory (ATTO) using two MAX-DOAS instruments, EGU General Assembly 2025, Vienna, Austria, 27 Apr–2 May 2025, EGU25-8516, https://doi.org/10.5194/egusphere-egu25-8516, 2025.

EGU25-10816 | Orals | BG3.11

The science plan for AmazonFACE, a large-scale Free Air CO2 Enrichment Experiment in the Amazon rainforest 

Anja Rammig and David Lapola and the AmazonFACE Team

Tropical rainforests play an important role in the global carbon cycle. They store massive amounts of biomass in their trees and soils, and contribute to climate mitigation by removing carbon from the atmosphere through photosynthesis. In a large-scale free-air CO2 enrichment (FACE) experiment in a highly diverse, old-growth, tropical forest in the Brazilian Amazon, we will assess the ecosystem responses to rising atmospheric CO2 concentrations. The main questions are (1) whether elevated atmospheric CO2 directly and sustainably stimulates photosynthesis (the so-called CO2-fertilization effect) and (2) will reduce stomatal conductance, leading to reduced water loss at leave-level and whether this will result in canopy-scale changes in transpiration and soil water availability, (3) how low nutrient availability (particularly phosphorus) will limit the CO2-fertilization effect, and (4) whether elevated CO2 concentration will alter the functional composition of vegetation. Also the role of biodiversity (through functional traits) and socio-environmental implications of CO2 fertilization will be investigated, with a focus on impacts, adaptations and the science-policy interface. Through integrative modelling activities, the long-term goal of the project is to improve the projections of the Amazon rainforest carbon cycle and regional and global climate under increasing atmospheric CO2 concentrations. We here present the AmazonFACE science plan, give an update on the state of the experiment construction and show baseline measurements and simulation results.

How to cite: Rammig, A. and Lapola, D. and the AmazonFACE Team: The science plan for AmazonFACE, a large-scale Free Air CO2 Enrichment Experiment in the Amazon rainforest, EGU General Assembly 2025, Vienna, Austria, 27 Apr–2 May 2025, EGU25-10816, https://doi.org/10.5194/egusphere-egu25-10816, 2025.

EGU25-11302 | Orals | BG3.11

Simulating plant functional acclimation and trait evolution using an eco-evolutionary vegetation model (PlantFATE) 

Florian Hofhansl, Shipra Singh, Elisa Stefaniak, Tania Maxwell, and Jaideep Joshi

In the face of ongoing global crises, such as climate change and biodiversity loss, we urgently need to understand dynamic and complex responses of global forest ecosystems. To do so, we need to develop modeling frameworks that account for multiple temporal and organizational scales, and therefore capture functional adaptations of individuals, species, and ecosystems in response to the environment.

Here we present Plant-FATE (Plant Functional Acclimation and Trait Evolution) an eco-evolutionary vegetation model that embodies functional diversity by representing plant life-history strategies, and adaptations by accounting for short-term physiological acclimation, mid-term demographic shifts, and long-term trait evolution.

Tested with data obtained from an hyperdiverse site in the Amazon Forest, our model predicts a nonlinear response of tropical forests to increasing atmospheric CO2 due to diverse aspects of the growth-mortality tradeoff. At moderately elevated CO2, we found that evolution towards higher wood density increases vegetation C sequestration. By contrast, under highly elevated CO2 levels, a darkening understorey rather triggers lower wood densities, thus reversing gains from the proposed CO2 fertilization effect.

Our results suggest that competition for resources may modulate community-level eco-evolutionary dynamics of forest ecosystems, such that competition-induced changes in wood density may render forests more vulnerable to future climatic extreme events. Our study highlights the importance of accounting for eco-evolutionary dynamics when simulating the functional response of forest ecosystems to projected climate change.

How to cite: Hofhansl, F., Singh, S., Stefaniak, E., Maxwell, T., and Joshi, J.: Simulating plant functional acclimation and trait evolution using an eco-evolutionary vegetation model (PlantFATE), EGU General Assembly 2025, Vienna, Austria, 27 Apr–2 May 2025, EGU25-11302, https://doi.org/10.5194/egusphere-egu25-11302, 2025.

EGU25-11396 | ECS | Posters on site | BG3.11

Effect of elevated CO2 in a late-stage leaf litter decomposition process in the understory of Amazonian forest: the role of plant root and microbial interaction on nutrient availability  

Nathielly Martins, Lucia Fuchslueger, Laynara Lugli, Anja Rammig, Iain Hartley, and Carlos Quesada and the AmazonFACE team

More than 60% of the Amazonian rainforest grows on old and weathered soil with low availability of important rock-derived nutrients like phosphorus (P), and efficient nutrient recycling is the main source of nutrients to maintain forest productivity. Thus, the effect of the elevated CO2 atmospheric concentrations (eCO2) on tree productivity (i.e., fertilization effect) may depend on the capacity of plants to access currently unavailable nutrients or increase nutrient acquisition efficiency. In some Amazon regions, the high root proliferation in the litter layer, where roots intercept newly mineralized nutrients before they are leached into the soil, is an important mechanism. These roots can also influence nutrient mobilization directly by exuding phosphatase enzymes to hydrolyze organic P without releasing carbon or indirectly by exuding labile carbon (i.e., glucose, sucrose) that can be used as energy for the microbial community to increase the decomposition and nutrient release from leaf litter. 

In an Open-Top Chamber experiment in a lowland understory forest in the Central Amazon, we investigated how elevated CO2 influences plant-root-microbe interactions during a late-stage (i.e., after one year) leaf litter decomposition. We found that under eCO2 leaf litter mass loss did not change. However,  we observed that under eCO2, higher root net production in the leaf litter decreased litter mass loss. This may suggest that increased root exudates under eCO2 influence microbial litter decomposition. Furthermore, we observed a decrease in microbial biomass carbon (C) and an increase in the ratio of enzymes responsible for degrading C, nitrogen (N), and P, normalized by microbial biomass C. This could suggest microbial C and nutrient limitation, which means that the plant root exudates under eCO2 were not benefiting microbial growth, and they needed to invest energy in maintenance and resource acquisition. The lack of change or decrease in mass loss under eCO2, even with a possible microbial C limitation, may be related to the stage of the litter decomposition process and the more recalcitrant C fractions available,  or antagonistic interaction between plant and microbial community. Nevertheless, we found a significant decrease in leaf litter P concentration under eCO2 without changing litter decomposition. Still, the decrease in the inorganic microbial P may suggest that C microbial investment did not result in a microbial P mobilization, and probably trees directly took up this available P, indicating that eCO2 intensifies the P competition between plants and microbes. 

Our results suggest that under eCO2, trees may change the microbial stoichiometry to increase resource acquisition, and the shift in the competition for P between plants and microbes may be the key factor in controlling plant P mobilization in a late-stage decomposition process. This suggests that plant-microbial interaction may be an important strategy for increasing nutrient availability in scenarios under elevated CO2 atmospheric concentrations, possibly directly impacting the Amazon forest productivity and resilience to climate change. 

How to cite: Martins, N., Fuchslueger, L., Lugli, L., Rammig, A., Hartley, I., and Quesada, C. and the AmazonFACE team: Effect of elevated CO2 in a late-stage leaf litter decomposition process in the understory of Amazonian forest: the role of plant root and microbial interaction on nutrient availability , EGU General Assembly 2025, Vienna, Austria, 27 Apr–2 May 2025, EGU25-11396, https://doi.org/10.5194/egusphere-egu25-11396, 2025.

EGU25-11765 | ECS | Orals | BG3.11

Global importance of Amazonian white-sand peat carbon 

Adam Hastie, Raphael Hererra Fernández, Euridice N. Honorio Coronado, and R. Scott Winton

White sand ecosystems (WSE)- known locally as Campinarana, Campinarana florestada (in Brazil) or Caatinga Amazonica (Venezuela) are typically thin-stemmed, nutrient scarce, low canopy ecosystems located on sandy soils (podzols) distributed across the Amazon basin. It has been previously documented that WSEs can form histosol layers capable of storing significant carbon, but existing studies are limited in geographic scope and quantity of data points. Notably a new study measured up to 2m of peat in Colombian WSEs, but we lack a wider understanding of the distribution and dynamics of peat forming WSEs across Amazonia.

Here we undertake a simple spatial analysis, overlapping a recently published Amazon peat map with previously published WSE distributions. We combine this with recent carbon density data and insights gained from an in-depth study of Colombian white sand peatlands (WSP) by Winton et al. (in review).

We estimate a total white sand peatland area of 78,832 (40,403 – 117,133) km2 across the Amazon basin, corresponding to 26% of all white sand ecosystems. The greatest concentration is in the Rio Negro basin in Brazil. We predict that 39%, 26%, 15% and 6% of Amazon basin WSE forests are underlain by peat in Venezuela, Brazil, Colombia and Peru respectively. We in turn estimate a total carbon stock of 3.86 (0.64–7.48) Pg C in the WSPs of the Amazon basin, comparable to that of the largest known peatland region in the South America- the Pastaza-Maranon Foreland Basin.

We conclude that WSPs are critically understudied ecosystems and represent a fundamental gap in our understanding of the Amazon basin carbon cycle. Crucially, no existing studies appear to be located in the most concentrated areas of peat, with Colombia being the only substantial WSP region to be densely sampled. Our results can inform future research priorities in WSPs.

How to cite: Hastie, A., Fernández, R. H., Honorio Coronado, E. N., and Winton, R. S.: Global importance of Amazonian white-sand peat carbon, EGU General Assembly 2025, Vienna, Austria, 27 Apr–2 May 2025, EGU25-11765, https://doi.org/10.5194/egusphere-egu25-11765, 2025.

EGU25-13543 | Orals | BG3.11

Dissolved greenhouse gases in the Rio Negro (Amazonia, Brazil): the influence of humans versus wetlands 

Hella van Asperen, Thorsten Warneke, Carla Estefani Batista, Jonismar Souza da Silva, Luciana Rizzo, Alexandra Klemme, Rafael Lopes e Oliveira, Sergio Duvoisin Junior, Bruce Forsberg, and Susan Trumbore

The Amazon, with its vast wetlands, is a significant hotspot for greenhouse gas emissions. However, the emissions from aquatic systems remain poorly understood. The Rio Negro is one of the main tributaries of the Amazon river but, to date, there have been few measurements on GHG concentrations and fluxes, and none for the upper Rio Negro region.

We present the first continuous measurements of dissolved CO2, CH4, N2O and CO in the Rio Negro, between the cities of Manaus and São Gabriel de Cachoeira (~1000 km). From a moving research vessel, water was sampled continuously from a depth of 50 cm and passed through a bubble-type-equilibrator. A closed air stream was circulated through the equilibrator, and continuously measured by an in-situ FTIR analyzer. In addition, variables such as pH, air and water temperature, DOC and coliform bacteria were determined.

All measured gases were supersaturated in the water with respect to the atmosphere, indicating an outgoing flux toward the atmosphere. CH4 concentrations showed elevated concentrations in the middle Rio Negro, contrasting with CO2, which peaked in the upper and lower Rio Negro. Both CH4 and CO2 displayed distinct hotspot regions, many of which were centered around human settlements and are therefore likely of anthropogenic origin, as also confirmed by the observed bacterial communities. A few hotspots appeared to be linked to surrounding wetlands, which may release large amounts of CH4 during the rising water phase when reconnected to the main river. N2O showed elevated concentrations in the upper Rio Negro, possibly linked to the extensive white sand forest areas in this part of the catchment. CO concentrations showed a clear diurnal pattern, with highest concentrations coinciding with highest incoming solar radiation.

Based on our measurements, we suggest that anthropogenic influences on remote rivers such as the Rio Negro may be greater than previously assumed, potentially affecting the representativeness of both past and future field measurements.

How to cite: van Asperen, H., Warneke, T., Estefani Batista, C., Souza da Silva, J., Rizzo, L., Klemme, A., Lopes e Oliveira, R., Duvoisin Junior, S., Forsberg, B., and Trumbore, S.: Dissolved greenhouse gases in the Rio Negro (Amazonia, Brazil): the influence of humans versus wetlands, EGU General Assembly 2025, Vienna, Austria, 27 Apr–2 May 2025, EGU25-13543, https://doi.org/10.5194/egusphere-egu25-13543, 2025.

EGU25-14346 | ECS | Posters on site | BG3.11

Amazon upland forest CH4 fluxes: A small sink or a small source? A case study 

Lívia Rosalem, Hella van Asperen, Shujiro Komiya, Sam P. Jones, Santiago Botía, Fernanda Cunha, Susan Trumbore, and Cléo Quaresma Dias Júnior

Methane (CH4) is an important greenhouse gas whose natural sources are still poorly understood, and significant uncertainties in their quantification remain. Tropical upland forests generally present a small CH4 sink with occasional local emission hotspots, making it challenging to determine the net ecosystem flux. This study employs two complementary micro-meteorological methods to estimate methane (CH4) fluxes from a Terra Firme (upland forest) ecosystem in the central Amazon. At the Amazon Tall Tower Observatory (ATTO) field site, CH4 and CO2 concentrations are continuously monitored at five different heights above and below the canopy (79, 53, 38, 24, 4 meters). Additionally, Eddy Covariance measurements of CO2 and H2O fluxes, along with micro-meteorological observations, are conducted at various heights. To estimate ecosystem CH4 fluxes, the Modified Bowen Ratio (MBR) technique was applied. This method uses the concentration gradient and the flux of a trace gas (in this study CO2 and H2O), to calculate the eddy diffusivity (k), which is then used to estimate the flux of another trace gas (in this study CH4). MBR CH4 fluxes were estimated for the period 2014-2021. Additionally, vertical concentration profiles were analyzed to gain further insights into the temporal patterns of CH4 fluxes. The MBR flux estimates and vertical profile analyses revealed clear seasonal patterns. During the wet season, positive concentration gradients indicated net CH4 emissions from the forest, while in the dry season, negative gradients suggested net CH4 uptake. Ecosystem median CH4 fluxes, estimated with the MBR technique, dominantly showed CH4 uptake and ranged between -2 and 2 nmol m-2 s-1. With these results, we aim to highlight the seasonal and interannual patterns of upland forest CH4 fluxes, which are essential for understanding the contribution of tropical upland forests to the Amazon's CH4 budget.

How to cite: Rosalem, L., van Asperen, H., Komiya, S., P. Jones, S., Botía, S., Cunha, F., Trumbore, S., and Quaresma Dias Júnior, C.: Amazon upland forest CH4 fluxes: A small sink or a small source? A case study, EGU General Assembly 2025, Vienna, Austria, 27 Apr–2 May 2025, EGU25-14346, https://doi.org/10.5194/egusphere-egu25-14346, 2025.

EGU25-14652 | ECS | Orals | BG3.11

Carbon flux dynamics in montane tropical wet and dry forests: A comparative study in Southern Ecuador 

Charuta Murkute, Mostafa Sayeed, Franz Pucha-Cofrep, Volker Raffelsbauer, Rezwan Ahmed, Sebastian Scholz, Oliver Limberger, Galo Carillo-Rojas, Andreas Fries, Jörg Bendix, and Katja Trachte

Tropical forests, spanning wet and dry forest ecosystems, are pivotal in regulating the global carbon cycle and climate through dynamic exchanges of energy, water, and carbon. These ecosystems influence regional and global climate patterns via biogeochemical feedback mechanisms. However, climate change is altering these processes, with rising temperatures intensifying evaporative demand and affecting photosynthetic activity, as indicated by changes in net ecosystem exchange (NEE). Vegetation and biomass variations further impact microclimates, feeding back into heat and water budgets. Understanding the dynamics and meteorological drivers of carbon and water fluxes is essential for comprehending land surface–atmosphere interactions.

This study compares the climatological and ecological functions of tropical wet and dry forests by examining two contrasting sites in the tropical Andes Mountains of southern Ecuador: the montane dry forest (MDF) in the Laipuna Reserve and the montane rain forest (MRF) in the Reserva Biológica San Francisco. The MDF is characterized by a deciduous forest and exhibits pronounced seasonality, with distinct dry (June–December) and wet (January–May) periods, driven by the inter-hemispheric shift of the Intertropical Convergence Zone (ITCZ). In contrast, the MRF experiences year-round rainfall, sustaining an evergreen lower montane forest type. Eddy-covariance measurements were used to monitor water and carbon fluxes under these contrasting climatic regimes. This comparison provides valuable insights into the differential roles of these ecosystems in regulating the Earth's energy and carbon budgets under changing climatic conditions. The objective of the study is (i) to quantify the magnitude and seasonality of NEE and its partitioned components, gross primary production (GPP), and ecosystem respiration (Reco) And (ii) to identify the meteorological drivers responsible for the variations in carbon exchange within each ecosystem. The results reveal significant variations in NEE in the MDF between wet and dry seasons. During the wet season, the average NEE was -3.9 μmol m⁻² day⁻¹, while in the dry season, it declined substantially to -0.8 μmol m⁻² day⁻¹. In contrast, the MRF demonstrated a consistently higher average NEE of -18 μmol m⁻² day⁻¹. These variations are driven by distinct environmental factors. In the MDF, water availability, regulated primarily by precipitation, is the dominant factor influencing carbon exchange. Conversely, the carbon dynamics in MRF are predominantly governed by energy inputs, with light playing a critical role in driving its NEE.

How to cite: Murkute, C., Sayeed, M., Pucha-Cofrep, F., Raffelsbauer, V., Ahmed, R., Scholz, S., Limberger, O., Carillo-Rojas, G., Fries, A., Bendix, J., and Trachte, K.: Carbon flux dynamics in montane tropical wet and dry forests: A comparative study in Southern Ecuador, EGU General Assembly 2025, Vienna, Austria, 27 Apr–2 May 2025, EGU25-14652, https://doi.org/10.5194/egusphere-egu25-14652, 2025.

EGU25-16269 | Posters on site | BG3.11

Ten years of carbon dioxide fluxes and carbon balance at a mixed cultivated savannah and an open forest in a tropical humid climate in West Africa 

Renaud Koukoui, Ossénatou Mamadou, Franck Houénou, Bernard Heinesch, Mamadou Bousso, and Jean-Martial Cohard

The huge pressure on tropical forests due to agricultural expansion threats the capacity of the West African region to sequester atmospheric CO2, a region which is supposed to account for 20% of CO2 emissions of the whole continental tropical belt. Yet, the scarcity of eddy covariance measurements in the tropical humid African region has led to significant challenges in understanding the carbon sequestration potential of forest ecosystems and more broadly the amount of CO2 which will be lost when they are converted into culture. Taking advantage of two nearby eddy covariance sites established in Northern Benin, a mixed crop savannah (Nalohou, lat. 9.74°N, long. 1.60°E) and a clear forest (Bellefoungou, lat. 9.79°N, long.1.72°E), this study compares their net ecosystem exchange (NEE) dynamics and their carbon balance, using data spanning from 2007 to 2017. Driven by the precipitation pattern, the CO2 dynamics display strong seasonality above both ecosystems, with moderate uptakes during extreme precipitation years. We determined the optimal respiration model for both ecosystems, enabling the partitioning of NEE fluxes into total ecosystem respiration (Reco) and gross primary production (GPP).  Soil moisture was found to be the main driver of nighttime CO2 emissions, with a sigmoidal model the most appropriate for representing Reco. When using soil moisture as an input in the ecosystem respiration model for partitioning NEE, we found, based on the ten years dataset, an average annual NEE of  -512 ± 69 g C m⁻² y⁻1 at the forest site and of -202 ± 53 g C m⁻² y⁻1 at the mixed crop site. Finally, these tropical humid ecosystems were observed to be, during all years analyzed, a net sink of atmospheric CO2, showing that forest CO2 sequestration is 2.5 times the cultivated site one.  These results constitute a paramount information for earth system models regarding carbon budget of these typical and understudied African ecosystems.

How to cite: Koukoui, R., Mamadou, O., Houénou, F., Heinesch, B., Bousso, M., and Cohard, J.-M.: Ten years of carbon dioxide fluxes and carbon balance at a mixed cultivated savannah and an open forest in a tropical humid climate in West Africa, EGU General Assembly 2025, Vienna, Austria, 27 Apr–2 May 2025, EGU25-16269, https://doi.org/10.5194/egusphere-egu25-16269, 2025.

EGU25-17267 | ECS | Orals | BG3.11

Linking form to function: Simulating plant hydraulic strategies’ impact on tree drought response in a tropical montane rainforest 

Alexandra Pongracz, Thomas A. M. Pugh, Stefan Olin, Annemarie Eckes-Shephard, Johan Uddling, Göran Wallin, Olivier J. L. Manzi, Maria Wittemann, Donat Nsabimana, Etienne Zibera, Camille Ziegler, Aloysie Manishimwe, Phillip Papastefanou, and Anja Rammig

Multidimensional trait relationships are imperative to understanding forest functioning in the face of ongoing environmental changes. Warming and more frequent and severe water stress are expected to adversely affect tropical forests’ large carbon uptake capacity. Therefore, it is, important to evaluate how tropical trees would perform under future climate scenarios. It is challenging to analyse trait-performance relationships solely based on observational data. However, process-based models representing key plant trait trade-offs can be applied to investigate the influence of different plant hydraulic strategies on tropical tree performance.

We used a hydraulics-enabled version of the Lund-Potsdam-Jena General Ecosystem Simulator (LPJ-GUESS) to study how trait relationships influence tropical plant performance on three study sites included in the RwandaTREE (Rwanda tropical elevation gradient) experiment. We parameterised four endemic species based on observational data and ran simulations by varying selected traits within the potential ranges to evaluate how these parameters affect the simulated biomass and woody growth rate.

The results showed a variation in optimum trait values which led to realistic simulated woody growth rates, depending on successional strategies and study sites. This can be attributed to the emerging functional strategies defined by the trait relationships. 

Our results highlight that we can evaluate complex trait relationships and trade-offs that cannot feasibly be measured across large scales. This allows us to formulate new hypotheses on which hydraulic and structural trait correlations define plant performance. Increased understanding of drought-related vegetation processes can be used to decrease uncertainty in simulating tropical forest resilience and extreme weather impact on Pan-African carbon stocks.

How to cite: Pongracz, A., Pugh, T. A. M., Olin, S., Eckes-Shephard, A., Uddling, J., Wallin, G., Manzi, O. J. L., Wittemann, M., Nsabimana, D., Zibera, E., Ziegler, C., Manishimwe, A., Papastefanou, P., and Rammig, A.: Linking form to function: Simulating plant hydraulic strategies’ impact on tree drought response in a tropical montane rainforest, EGU General Assembly 2025, Vienna, Austria, 27 Apr–2 May 2025, EGU25-17267, https://doi.org/10.5194/egusphere-egu25-17267, 2025.

Large-scale deforestation poses a significant threat to ecosystem stability and climate, leading to increased carbon dioxide emissions, which exacerbates global warming and ecological imbalance. To achieve sustainable forest management, precise large-scale monthly deforestation mapping has become increasingly important. The open access to Sentinel-1 data provides unprecedented opportunities for monthly deforestation mapping. However, previous monthly mapping based on Sentinel-1 and deep learning still needs improvement in accuracy, and the best strategies for large-scale model transfer have not been fully explored. This study proposes a new approach for monthly deforestation mapping based on Sentinel-1 data and an adapted Segment Anything Model (SAM), combined with active learning and transfer learning strategies for large-scale model transfer. The model was tested and evaluated in four different study sites: Rondônia in Brazil, Guangxi in China, California in the USA, and Hainan in China. The results showed the superior performance of our proposed adapted SAM method, with F1 scores ranging from 0.74 to 0.88 and IoU from 0.58 to 0.78. The combined model for the four regions achieved an F1 score of 0.81 and an IoU of 0.68, outperforming the baseline U-net model (combined F1 score of 0.78 and IoU of 0.64). When applied to new sites, the fine tune-based transfer learning significantly improved the model’s spatial generalization capability with the addition of a small number of target domain samples. Moreover, compared with random sampling approach, the active learning technique help reduce the required number of training samples to achieve the same level of accuracy. This study provides a comprehensive workflow for improved monthly deforestation mapping, emphasizing the advantages of combining Sentinel-1 SAR data with advanced models and strategies. Our method offers a reliable and efficient solution for large-scale deforestation monitoring, aiding in the timely detection of deforestation activities and supporting sustainable forest management strategies.

How to cite: Zhao, F.: Monthly mapping of deforestation in the Amazon using Sentinel-1 data and a vision foundation model, EGU General Assembly 2025, Vienna, Austria, 27 Apr–2 May 2025, EGU25-19757, https://doi.org/10.5194/egusphere-egu25-19757, 2025.

EGU25-20489 | ECS | Posters on site | BG3.11

Nitric oxide (NO) mixing ratio above the canopy in the Amazon rainforest (ATTO site) 

Carolina Monteiro, Anywhere Tsokankunku, and Hartwig Harder

Nitrogen oxides (NOx = nitric oxide (NO) and nitrogen dioxide (NO2)) play a crucial role in atmospheric chemistry by influencing the concentrations of ozone (O3) and hydroxyl radicals (HOx = OH and HO2), which are key oxidants in the atmosphere. In pristine ecosystems, these oxidants interact with biogenic volatile organic compounds (BVOCs) like isoprene, leading to the production of oxidized secondary organic compounds. Subsequent reactions with NOx contribute to nitrate formation, which enhances particle growth and cloud condensation nuclei activity. This underscores the significance of NOx even in regions with low atmospheric concentrations.

At the Amazon Tall Tower Observatory (ATTO), located in the central Amazon rainforest, we monitor NO and O3 in a pristine tropical environment. Our study focuses on measurements from a walk-up tower at 40 m, but also a first look into NO and O3 mixing ratios collected at multiple heights ranging from 5 cm to 79 m, covering the vertical profile above and below the canopy (canopy height is approximately 36 m). We analyze diurnal and nocturnal variations at 40 m and seasonal differences between the wet and dry periods to hint at how much NO is coming out of the canopy and its role in this unique ecosystem.

How to cite: Monteiro, C., Tsokankunku, A., and Harder, H.: Nitric oxide (NO) mixing ratio above the canopy in the Amazon rainforest (ATTO site), EGU General Assembly 2025, Vienna, Austria, 27 Apr–2 May 2025, EGU25-20489, https://doi.org/10.5194/egusphere-egu25-20489, 2025.

EGU25-20842 | Posters on site | BG3.11

Field Spectroscopy for Assessing Midday Leaf Water Potential in Amazonian Forest Environments: Preliminary Results 

Flavia Machado Durgante, Caroline Lorenci Mallman, Hilana Louise Hadlich, Caroline da Cruz Vasconcelos, Jochen Schöngart, Maria Teresa Fernandez Piedade, and Florian Wittmann

The increasing severity of droughts and their direct impact on the health of Amazon forest ecosystems underscore the urgent need to understand this phenomenon and to develop tools for large-scale monitoring. Leaf water potential (ψleaf) is a critical indicator of plant water status. However, traditional methods for measuring ψleaf are often logistically challenging and costly. Field spectroscopy offers a more efficient means of assessing plant water status, allowing scaling of information through predictive models that can be combined with imaging spectroscopy techniques from orbital and suborbital sensors. This study collected hyperspectral leaf data from three Amazonian forest environments during the El Niño period in October 2023: White Sand Forest, Flood Forest, and Upland Forest, all located at the Atto site. We collected two species from the forest canopy in each environment, resulting in six species and 43 samples. The reflectance measurements were taken immediately after the ψ measurement using a Scholander pump, around midday, with an ASD spectroradiometer covering the range from 350 nm to 2500 nm. The prediction model was developed using the entire data set by applying an optimized Partial Least Squares (PLS) regression model in Python. This was done after pre-processing the spectral data, which included jump correction functions, a Savitzky-Golay filter, and first derivative analysis. The resulting model showed good performance, with an R² of 0.73 and a mean squared error (MSE) of 0.21, although it still showed moderate generalization ability. The spectral bands that provide the most information about water potential are found in the near-infrared (NIR) range between 780 and 1100 nm, and the shortwave infrared (SWIR) range around 1700 and 2250 nm. These preliminary results support the idea that spectroscopic techniques can effectively indicate plant responses to water stress, which is critical in climate change. Such studies may facilitate more efficient monitoring of water status in Amazonian forest ecosystems. Future research should improve the use of spectroscopy in ecological studies of plant responses to environmental change by expanding sampling to more tree species and considering additional variables that reflect water stress, such as fuel moisture content (FMC), leaf water content (LWC), equivalent water thickness (EWT), and relative water content (RWT).

How to cite: Durgante, F. M., Lorenci Mallman, C., Hadlich, H. L., Vasconcelos, C. D. C., Schöngart, J., Piedade, M. T. F., and Wittmann, F.: Field Spectroscopy for Assessing Midday Leaf Water Potential in Amazonian Forest Environments: Preliminary Results, EGU General Assembly 2025, Vienna, Austria, 27 Apr–2 May 2025, EGU25-20842, https://doi.org/10.5194/egusphere-egu25-20842, 2025.

EGU25-20870 | ECS | Orals | BG3.11

Leaf phenological type, functional traits, and hyperspectral reflectance to predict volatile isoprenoid emissions in central Amazon Forest trees 

Michelle Robin, Flávia Durgante, Caroline Lorenci Mallmann, Hilana Hadlich, Christine Römermann, Ülo Niinemets, Johnathan Gershenzon, Jianbei Huang, Bruce Nelson, Tyeen Taylor, Vinícius de Souza, Davieliton Pinho, Lucas Falcão, Caroline Lacerda, Sérgio Duvoisin, Axel Schmidt, Maria Teresa Fernandez Piedade, Jochen Schöngart, Florian Wittmann, and Eliane Gomes Alves

Volatile isoprenoids take part in a wide range of forest-atmosphere processes that scale from plant cell regulation to atmospheric particle formation. Major drivers of plant leaf emissions are light and temperature - i.e., seasonality - and leaf age, suggesting leaf phenological type (i.e., evergreen or brevideciduous) may exert control over emission rates. The Amazon Forest is the greatest and most diverse source of volatile isoprenoid emissions, but the lack of leaf-level studies and the logistical challenges of measuring in such remote and highly bio-diverse sites bring high levels of uncertainty to modeled estimates. Studies indicate that hyperspectral leaf reflectance is an effective tool for estimating leaf morphological, physiological, and chemical traits, being perhaps a promising tool for remotely assessing volatile isoprenoid emissions from vegetation. Considering this, our research aimed at evaluating i) whether leaf phenological type and functional traits are determinants of the presence and magnitude of isoprene emissions and of mono- and sesquiterpene storage, and ii) whether leaf-level hyperspectral reflectance can be used to predict the presence of isoprene emissions and mono- and sesquiterpene storage in central Amazon forest trees. We found that isoprene-emitting evergreen trees were less likely to store monoterpenes and had tougher and less photosynthetically active leaves, while higher isoprene emission rates in brevideciduous trees associated with higher storage of sesquiterpene and phenolic compounds, suggesting that isoprene emissions possibly mediate a mechanical-chemical defense trade-off in evergreen and brevideciduous trees in this forest. Furthermore, we saw that dry leaf hyperspectral reflectance data and fresh leaf reflectance at selected wavelengths (616, 694, and 1155 nm) predicted the presence of isoprene emissions with accuracies of 0.67 and 0.72, respectively. Meanwhile, the presence of terpene storage was well predicted from fresh leaf reflectance data for monoterpene storage (accuracy = 0.65) and sesquiterpene storage (accuracy = 0.67). These results indicate the possibility of using spectral readings from herbarium specimens to assist in the development of more efficient sampling designs targeted at potential isoprene emitters, as well as of using fresh leaf reflectance data to calibrate multi-sensor equipment to remotely detect potential isoprene emitters or orientate sampling efforts in the field toward potential terpene-storing trees. The use of spectral tools for detecting potential volatile isoprenoid emitters and a more functional trait-based, mechanistic representation of emissions can combine to reduce modeling emission uncertainties and contribute to understanding the roles of volatile isoprenoids within forest-atmosphere interactions, atmospheric chemistry, and the carbon cycle.

How to cite: Robin, M., Durgante, F., Mallmann, C. L., Hadlich, H., Römermann, C., Niinemets, Ü., Gershenzon, J., Huang, J., Nelson, B., Taylor, T., de Souza, V., Pinho, D., Falcão, L., Lacerda, C., Duvoisin, S., Schmidt, A., Piedade, M. T. F., Schöngart, J., Wittmann, F., and Gomes Alves, E.: Leaf phenological type, functional traits, and hyperspectral reflectance to predict volatile isoprenoid emissions in central Amazon Forest trees, EGU General Assembly 2025, Vienna, Austria, 27 Apr–2 May 2025, EGU25-20870, https://doi.org/10.5194/egusphere-egu25-20870, 2025.

EGU25-20894 | ECS | Posters on site | BG3.11

Soil and Litter BVOC and GHG Fluxes in Central Amazonia: Variability Across Forest Types and Seasons  

Debora Pinheiro-Oliveira, Hella van Asperen, Murielli Garcia Caetano, Michelle Robin, Achim Edtbauer, Nora Zannoni, Joseph Byron, Jonathan Williams, Layon Oreste Demarchi, Maria Teresa Fernandez Piedade, Jochen Schöngart, Florian Wittmann, Sergio Duvoisin-Junior, Carla Batista, Rodrigo Augusto Ferreira de Souza, and Eliane Gomes Alves

The Amazon rainforest, characterized by its vast biodiversity and diverse vegetation formations, plays a crucial role in global biogeochemical cycles, including the emission and consumption of biogenic volatile organic compounds (BVOCs) and greenhouse gases (GHGs). Soil and litter fluxes have been suggested as important contributors to the overall forest BVOC budget, but these fluxes remain understudied and are therefore poorly understood. Moreover, only a few observations exist from the Amazon rainforest, an ecosystem expected to be the largest BVOC source in the global atmosphere. Even less studied is the influence of the diversity of soils and vegetation types on BVOC and GHG flux (emission and consumption) patterns. This study aimed to assess the fluxes of BVOCs and GHGs, and their potential drivers, in three dominant forest types in Central Amazonia: upland forest (terra firme), ancient river terrace forest (terraço fluvial), and white sand forest (campinaranas). Soil fluxes were determined using flux chambers, from which sampling bags were collected and subsequently analyzed by a PTR-MS (isoprene, monoterpenes, sesquiterpenes) and a Los Gatos Analyzer (CO2, CH4). In addition, soil temperature and moisture were determined, and soil and litter samples were taken to analyze nutrients and microbial biomass. Measurements were conducted in the dry-to-wet transition period, and repeated for the white sand forest in the wet season. In the dry-to-wet season, the highest BVOC fluxes, predominantly emission, were found in the white sand forest, particularly for acetaldehyde and sesquiterpenes. The upland forest exhibited lower fluxes than the white sand forest but stood out for emission and consumption of dimethyl sulfide (DMS) and isoprene. The ancient river terrace forest showed no significant fluxes. Soil moisture and temperature were identified as the primary drivers in the white sand forest, while microbial biomass was the determining factor in the upland forest. In the wet season, fluxes in the white sand forest shifted strongly toward dominance of BVOC consumption and increased methane emissions. Soil phosphorus microbial biomass was identified as a predictor of most BVOC fluxes and CH4 emissions, highlighting the critical role of phosphorus in the wet season. This study offers a significant contribution to the understanding of gas fluxes in Amazonian forest types, emphasizing how nutrients, soil, litter microbial biomass, and seasonality affect BVOC and GHG emissions. These findings provide valuable insights into how environmental changes may impact biogeochemical cycles on the Amazon, providing valuable information for the conservation and management of tropical forests.

How to cite: Pinheiro-Oliveira, D., van Asperen, H., Garcia Caetano, M., Robin, M., Edtbauer, A., Zannoni, N., Byron, J., Williams, J., Oreste Demarchi, L., Piedade, M. T. F., Schöngart, J., Wittmann, F., Duvoisin-Junior, S., Batista, C., Ferreira de Souza, R. A., and Gomes Alves, E.: Soil and Litter BVOC and GHG Fluxes in Central Amazonia: Variability Across Forest Types and Seasons , EGU General Assembly 2025, Vienna, Austria, 27 Apr–2 May 2025, EGU25-20894, https://doi.org/10.5194/egusphere-egu25-20894, 2025.

EGU25-20981 | Posters on site | BG3.11

 Drought response of water use and stem growth dynamics of trees in central Amazonia  

Viviana Horna, Cléo Quaresma Dias-Júnior, Adriana Simonetti, Flávia Machado Durgante, Daniel Magnabosco Marra, and Susan Trumbore

Large areas of the central Amazon basin are characterized by a dense rainforest cover and subtle variation in topography, microclimate and edaphic conditions. This leads to pronounced differences in tree species composition with their specific functional traits. Major forest types in the Central Amazon are seasonally flooded riparian forest along blackwater rivers (igapó), mesic forest in small valleys dissecting the terra firmeplateaus (baixios), extremely nutrient-poor forest on white sands (campinas), and upland terra firme forest on plateaus.

We hypothesize that transpiration patterns and stem growth dynamics of these forest types are significantly different in their response to drought. Therefore, we investigate their reaction and adaptation to reduced soil water availability and atmospheric heat stress during extended droughts.

Information on the water status of trees can be derived from monitoring of hourly radial stem changes using high resolution dendrometers. Such changes are mainly due to two physiological processes: irreversible stem expansion due to cambial growth or reversible variations in stem size driven by call hydration or dehydration. Concurrent measurements of stem xylem sap flow, soil water content and atmospheric conditions allow to determine when and to what extent trees undergo water stress. By observing the daily amplitudes of stem contraction, it is possible to recognize whether and how fast trees recover from drought stress and resume cambial stem growth.

During the first phase of this study, we monitored fifteen trees in a terra firme forest to determine both the effects of water scarcity on the seasonality of stem increment and water uptake and the thresholds for stress caused by heat or soil water shortage. First results indicate significantly reduced transpiration in most trees during the dry season, partly due to leaf shedding, while radial stem growth showed very different dynamics.

How to cite: Horna, V., Dias-Júnior, C. Q., Simonetti, A., Machado Durgante, F., Magnabosco Marra, D., and Trumbore, S.:  Drought response of water use and stem growth dynamics of trees in central Amazonia , EGU General Assembly 2025, Vienna, Austria, 27 Apr–2 May 2025, EGU25-20981, https://doi.org/10.5194/egusphere-egu25-20981, 2025.

EGU25-314 | ECS | Posters on site | BG3.12

Deciphering Phenological Dynamics: Multiscale Geospatial Synthesis of Climate Interactions in the Tropical Dry Deciduous Forest Ecosystem of India 

Dhruvi Sedha, Chandra Prakash Singh, Hitesh Solanki, and Jincy Rachel Mathew

Climate change presents an unmatched challenge to global forest ecosystems and tropical forests serve as important sentinels of ecological transformation. Forest phenology is recognized as an important indicator of ecosystem health and nuanced understandings into the complicated interactions between biological systems and climate variability are offered by it. This study aimed to assess the responses of forest ecosystems using high-resolution PhenoCam images and multi-scale geospatial analysis. We used an integrated method, combining ground-based PhenoCam observations with satellite imagery from AVHRR and Sentinel-2, using ERA-5 Land climate reanalysis data. To produce comprehensive ecological assessments at various geographical and temporal scales, we integrated Normalized Difference Vegetation Index (NDVI) observations with Green Chromatic Coordinate (GCC) analysis. Our finding reveals that the Gir Forest's growth season lasts 203 days and shows a notable upward trend (R² = 0.78, p < 0.01), which is explained by warming temperatures. Interannual variations in Season Start (SOS) and Season End (EOS) were noted, with EOS delaying by 4.2 days each decade and SOS advancing by an average of 3.5 days per decade. This pattern demonstrated the impact of climatic factors by extending the growing season length by roughly 7.7 days every decade. Species-specific responses demonstrated varying susceptibilities to climate variables. Temperature had the strongest correlation with SOS shifts (R² = 0.82), followed by precipitation (R² = 0.68) and soil moisture (R² = 0.55). These findings emphasize the complex interactions between phenological shifts and environmental gradients. By bridging observational scales and methodological techniques, this research offers an important framework for comprehending the dynamics of forest ecosystems. The results highlight the need of using high-resolution remote sensing and sophisticated ecological modelling to track phenological changes and provide crucial information about how climate variability affects tropical dry deciduous forests.

Keywords: Climate change, Phenology, Phenometrics, Remote Sensing, Near surface sensor

How to cite: Sedha, D., Singh, C. P., Solanki, H., and Mathew, J. R.: Deciphering Phenological Dynamics: Multiscale Geospatial Synthesis of Climate Interactions in the Tropical Dry Deciduous Forest Ecosystem of India, EGU General Assembly 2025, Vienna, Austria, 27 Apr–2 May 2025, EGU25-314, https://doi.org/10.5194/egusphere-egu25-314, 2025.

EGU25-472 | ECS | Orals | BG3.12

Interrelation of Forest Structure and Variability of Ecosystem Functional Properties Derived from Eddy Covariance Flux Measurements 

Tim Schacherl, Julia Kelly, Natascha Kljun, Anne Klosterhalfen, and Alexander Knohl

Climate change impacts European forests both directly, through shifts in temperature and precipitation, and indirectly, by increasing the frequency and intensity of extreme weather events such as droughts. As a result, understanding forests’ capacity to sustain their functions under stress has become a critical research area. This capacity is often represented by the variability of ecosystem functional properties (EFP), derived from eddy covariance flux measurements, with lower variability indicating higher resistance to stress and greater resilience to drought. EFP variability is hypothesized to be influenced by meteorology, soil conditions, and forest structure. Unravelling the specific role of forest structure in this variability could inform forest management strategies to enhance future resilience.

Previous studies have focused either on individual ecosystem functions or few site samples, not allowing to fully understand the drivers of EFP. Within the EU Horizon project CLIMB-FOREST, we collected data on CO₂, H₂O, and energy fluxes from 59 European forests to calculate key EFPs: underlying water use efficiency (uWUE), photosynthetic capacity (GPPsat), Bowen ratio (β), canopy conductance (Gs), and albedo (α). These were analyzed for their distribution and variability, then correlated with forest structure metrics such as forest type, management regime, stand age, canopy height, and species diversity.

Our analysis revealed that deciduous broadleaf forests (DBF) exhibited higher uWUE, GPPsat, and Gs compared to evergreen needleleaf forests (ENF) and mixed forests (MF), but also displayed the greatest variability in uWUE, GPPsat, and β. Variability in GPPsat decreased with increasing canopy height, with a slight upswing in stands exceeding 30 meters. Albedo variability was highest in young forests (0–49 years) and lowest in forests with an age between 100–149 years. However, no significant correlations emerged between forest structure variables and EFP variability. The limited availability of structural data likely constrained our correlation analysis, potentially masking significant trends.

To address these limitations, we aim to expand the dataset and apply advanced correlation techniques to better identify the drivers of EFP variability.

How to cite: Schacherl, T., Kelly, J., Kljun, N., Klosterhalfen, A., and Knohl, A.: Interrelation of Forest Structure and Variability of Ecosystem Functional Properties Derived from Eddy Covariance Flux Measurements, EGU General Assembly 2025, Vienna, Austria, 27 Apr–2 May 2025, EGU25-472, https://doi.org/10.5194/egusphere-egu25-472, 2025.

EGU25-2785 | ECS | Posters on site | BG3.12

Increased tree growth by thinning promotes hydraulic vulnerability and drought stress in pine plantations 

Antonio M. Cachinero-Vivar, J. Julio Camarero, and Oscar Perez-Priego

Tree growth responses to climate depend on factors including species, site-specific conditions, and stand structure, which can be amended by the implementation of forest management practices. Among silvicultural techniques, thinning is known to proficiently enhance forest growth and physiology in seasonally dry environments, influencing tree functional and structural attributes over time. However, its impact on wood hydraulic vulnerability to drought remains unclear. To address this gap, we examined how thinning alters radial growth (BAI), wood anatomy, non-structural carbohydrates (NSC), hydraulic traits and drought resilience in two managed pine plantations (P. sylvestris (PS) and P. nigra (PN)) in a thinning trial along an altitudinal gradient with the following specific objectives: i) to assess the impact of contrasting growth dynamics by the implementation of thinning operations on xylem anatomy, NSC pools (SS and S), and hydraulic traits; and ii) to determine the extent to which thinning-induced growth patterns impacted xylem hydraulic vulnerability and stem variation-derived indices related to water stress for the two study species We found a significant relationship between tree-ring growth and NSC in needles (R2 = 0.83, p < 0.001), weakening from fine roots to sapwood pools. Increased growth induced wood anatomical changes (cell number and lumen area), affecting the wood hydraulic diameter (HD). Consequently, a greater potential hydraulic conductivity was observed for both thinned treatments, with 80.55% and 13.81% increase in PS and PN as compared to control plots, respectively. However, the percent loss of hydraulic conductivity (P50) increased by up to 43.35% (PST) and 38.31% (PNT), supporting that growth follows the safety-efficiency trade-off, i.e., growth-patterns promoted hydraulic efficiency (HD; R2 = 0.79) over hydraulic safety (P50; R2 = 0.84). Water-stress indices derived from trunk variations showed greater sensitivity to water-shortage in thinned plots, with treatment differences of 68.67% for PS and 8.75% for PN. These insights represent the next critical step towards elevating forest management risks to a level that can contribute to our understanding of species-specific responses to thinning and the trade-offs inherent in tree physiology between growth and hydraulic vulnerability in water-scarce environments.

How to cite: Cachinero-Vivar, A. M., Camarero, J. J., and Perez-Priego, O.: Increased tree growth by thinning promotes hydraulic vulnerability and drought stress in pine plantations, EGU General Assembly 2025, Vienna, Austria, 27 Apr–2 May 2025, EGU25-2785, https://doi.org/10.5194/egusphere-egu25-2785, 2025.

Recently, several studies provided model-based insights on how climate change may alter European tree-species distributions. Yet, none of those have considered the implications of a collapse of the Atlantic Meriodional Overturning Circulation (AMOC), even though recent research indicates an already declining AMOC and a significant chance of a complete shutdown within the 21st century. Since an AMOC collapse results in cooler and drier climatic conditions across Europe that differ significantly from current climate model projections we need to increase our understanding of the impacts of an AMOC collapse on European forests.

Under this framework, we projected future tree-species distributions across Europe for various CMIP6 scenarios, emphasizing on differences between scenarios with an active vs. an inactive AMOC. In particular, we trained climate envelope models for the 24 most abundant European tree species and performed model simulations with quantile-mapped climate projections at a very high spatial resolution of 1 km². To quantify the effects of an AMOC collapse, we compared projections based on regular CMIP6 scenarios (SSPs 1-2.6, 2-4.5, 5-8.5, 10 different models) with such resembling an AMOC collapse. In our statistical evaluation, we emphasized on relative changes in abundance probability, redistribution of species-specific core areas, and the diversity of forest’s tree-species portfolios.

Our results show a stark contrast between the scenarios that account for an AMOC collapse and the control scenarios across all considered SSPs. Specifically, we observed an increase in abundance probabilities of selected tree species in Central Europe and the Mediterranean, while abundance probabilities in Scandinavia decreased substantially, indicating local extinction of the dominant tree species Norway spruce and Scots pine. Taken together, our study highlights a diverse picture of an AMOC collapse with catastrophic impacts on Europe’s boreal forests.

How to cite: Buras, A., Rammig, A., and Heubel, S.: Projecting the impact of a collapsing Atlantic Meridional Overturning Circulation on European tree-species distributions , EGU General Assembly 2025, Vienna, Austria, 27 Apr–2 May 2025, EGU25-3275, https://doi.org/10.5194/egusphere-egu25-3275, 2025.

EGU25-3665 | ECS | Posters on site | BG3.12

Risk of weather-related tree and branch fall – now and in the future 

Rike Lorenz, Nico Becker, and Uwe Ulbrich

Tree and branch fall is a risk to traffic infrastructure, forestry, buildings and the energy system. Next to biological and ecological factors like tree species, tree size or soil type, meteorological factors influence tree fall and branch fall risk. While both these types of tree damage are caused by high wind speed tree fall is also connected to storm lengths and changes in root anchorage caused by soil moisture and soil frost. Branch fall is reported to increase with high temperatures.
We aim to identify meteorological factors influencing branch and tree fall, analyse potential most extreme events and estimate future changes in weather-related risks.

In a first step we developed a logistic regression model predicting tree fall risk in winter based on a dataset of tree and branch fall events provided by Germany's national railway company (Deutsche Bahn) and meteorological data derived from ERA5. Here, we used a stepwise model selection process and 10-fold cross validation. Our findings suggest that high wind speeds, a low gust factor, and prolonged duration of strong winds, especially in combination with wet conditions (high precipitation and high soil moisture) and high air density, increase tree fall risk. While severe winter wind storms cause the highest daily numbers in tree fall events, we found that a quarter of all trees fall on days when ERA5 wind speeds are below 11 m/s. 

In a second step we are currently extending this existing model for tree fall to the summer season. Furthermore, we are developing a model for branch fall. We will test if additional predictor variables based on tree species and biomass data, convective events and the drought index SPEI will improve these models. 

In the near future we will use these models to investigate potential most extreme tree fall hazards and the changes in tree and branch fall risks in future climate scenarios based on climate model output data from CMIP6.

How to cite: Lorenz, R., Becker, N., and Ulbrich, U.: Risk of weather-related tree and branch fall – now and in the future, EGU General Assembly 2025, Vienna, Austria, 27 Apr–2 May 2025, EGU25-3665, https://doi.org/10.5194/egusphere-egu25-3665, 2025.

EGU25-4160 | ECS | Posters on site | BG3.12

Understanding Forest Resilience to Drought through Resilience Principles 

Sara Anamaghi, Massoud Behboudian, and Zahra Kalantari

With the intensification of climate change and anthropogenic activities, water scarcity and drought have become critical challenges around the world, threatening various ecosystems, particularly forests. Forests are social-ecological systems that provide numerous services to humans, who, in return, alter them. While it is impossible to prevent droughts, understanding the attributes of forests, particularly their resilience, may facilitate the mitigation of drought-related adverse consequences. Resilience is a multifaceted concept that has been interpreted through various lenses in the literature, with engineering resilience emphasizing system recovery, ecological resilience investigating the adaptive capacity of forests, and social-ecological resilience highlighting the interconnectedness of human and natural systems in resilience assessment.

Building on these conceptual foundations, seven principles of resilience, maintaining diversity and redundancy (P1), managing connectivity (P2), managing slow variables and feedback (P3), fostering complex adaptive system thinking (P4), encouraging learning and experimentation (P5), broadening participation (P6), and promoting polycentric governance (P7) offer a comprehensive approach to building, evaluating, and enhancing resilience. This review aims to investigate the extent to which resilience principles have been integrated into the discourse of forest resilience to drought in the literature.

Searching the Web of Science database for studies on forest resilience from 1998 to 2024 resulted in 47 papers. Among the reviewed studies, 51% investigated resilience through the lens of ecological resilience, 30% utilized the social-ecological concept, and 19% employed engineering resilience. P4 is frequently examined using tree ring data and drought severity indices (e.g., SPEI). Species richness and composition have often been considered to evaluate P1. A close examination of the methodologies of the reviewed studies revealed that 34% are evidence-based or conceptual studies aimed at understanding the mechanisms contributing to resilience, and 21% are experimental and field studies, which often involve the use of collected field data, such as tree ring width, vegetation growth rate, to explore the response of forest systems to natural or experimentally induced drought events.

The limited use of modeling, specifically landscape or ecosystem services models, in studying forest resilience to drought is evident, with only three studies conducted on this topic. Furthermore, the case studies are nearly evenly distributed across Africa, Europe, North America, and Asia, with 7, 10, 10, and 8 studies, respectively. Four studies investigated the resilience of forests in South America, and another four focused on a global scale. A closer exploration of the reviewed studies revealed that no studies have attempted to consider all seven resilience principles jointly, highlighting a significant research gap in this area and emphasizing the need for more studies to tackle the intricate relationships between ecosystems and human communities and societies.

How to cite: Anamaghi, S., Behboudian, M., and Kalantari, Z.: Understanding Forest Resilience to Drought through Resilience Principles, EGU General Assembly 2025, Vienna, Austria, 27 Apr–2 May 2025, EGU25-4160, https://doi.org/10.5194/egusphere-egu25-4160, 2025.

EGU25-4276 | ECS | Orals | BG3.12

Computer-vision based automated assessment of post-disturbance forest resilience 

Kilian Hochholzer, Maria Potterf, Rupert Seidl, and Werner Rammer

As a result of climate change, disturbances regimes are changing around the globe. This is challenging the sustainable provisioning of ecosystem services to society. Understanding the disturbance resilience of forest ecosystems is crucial for forest management, yet estimating resilience in the field remains difficult. A rapid assessment of important indicators associated with failing tree regeneration post disturbance would help managers to prioritize efforts on disturbed areas.

Here, we propose an innovative approach for resilience assessment leveraging recent advancements in computer vision and deep neural networks (DNNs) to estimate post disturbance resilience based on indicators derived from GoPro-photos taken in the field. We build on an extensive empirical dataset of post-disturbance development pathways (resilience, restructuring, replacement or reassembly) derived across four forest types (spruce, beech, pine, oak) in Bavaria. We use these empirical data in combination with computer vision models trained on images collected from disturbed plots and their surroundings (N=1240 images) to predict indicators related to ground cover (e.g., percent covered by grass) and forest structure (e.g., deadwood, structural complexity). These computer-vision derived indicators were subsequently related to field-based assessments to test their suitability of detecting disturbances and disturbance strength as well as their ability of predicting post-disturbance pathways. Preliminary results demonstrate a medium to strong ability of computer vision-derived indicators to correctly detect disturbances and predict post-disturbance forest development.

Our findings suggest that computer-vision methods offer a low-cost, low-threshold tool to support forest managers in prioritizing post-disturbance management decisions.

How to cite: Hochholzer, K., Potterf, M., Seidl, R., and Rammer, W.: Computer-vision based automated assessment of post-disturbance forest resilience, EGU General Assembly 2025, Vienna, Austria, 27 Apr–2 May 2025, EGU25-4276, https://doi.org/10.5194/egusphere-egu25-4276, 2025.

EGU25-5661 | Orals | BG3.12

High VPD mitigates the impact of soil drought in Pinus sylvestris L. through earlier stomatal closure 

Giovanni Bortolami, Jonas Gisler, Arianna Milano, Marcus Schaub, Richard Peters, and Charlotte Grossiord

Climate change scenarios foresee a drastic increase in atmospheric and soil droughts, driven by elevated vapor pressure deficit (VPD), in the future. However, the impact of coupled high VPD and soil water deficit on tree physiology is mainly untested, especially in the field. To disentangle VPD and soil moisture effects on mature trees, we installed a unique experimental setup in a 130-year-old natural pine tree forest. By misting water vapor towards tree canopies and excluding precipitation, we decreased VPD by 20-30% and/or precipitation by 50%. We continuously measured sap flow and trunk growth with punctual dial dynamics of gas exchange and leaf water potential for one growing season. We found that high VPD under well-watered (WW) soil conditions increased tree water loss and reduced secondary growth compared to WW trees at reduced VPD. Oppositely, high VPD at dry soil water conditions (WD) reduced whole-plant transpiration by earlier stomatal closure, and increased secondary growth compared to WD trees at lower VPD. Consequently, high VPD can mitigate the adverse effects of soil drought through its impact on stomatal sensitivity, with significant consequences on tree growth. These results highlight the complexity of the physiological response of mature trees under (un-)coupled stresses.

How to cite: Bortolami, G., Gisler, J., Milano, A., Schaub, M., Peters, R., and Grossiord, C.: High VPD mitigates the impact of soil drought in Pinus sylvestris L. through earlier stomatal closure, EGU General Assembly 2025, Vienna, Austria, 27 Apr–2 May 2025, EGU25-5661, https://doi.org/10.5194/egusphere-egu25-5661, 2025.

EGU25-5742 | ECS | Orals | BG3.12

Beetles, wind, and fire: integrating disturbance predisposition assessments into decision support systems for climate-adapted management of mountain forests 

Simon Mutterer, Clemens Blattert, Leo Bont, Verena Griess, and Janine Schweier

Strategic long-term planning of mountain forests in the European Alps requires a balancing act between sustaining forest biodiversity and ecosystem services (BES) and mitigating disturbance risks, particularly under climate change. In this context, close-to-nature forestry (CNF) is considered an effective strategy to adapt mountain forests to climate change while sustaining BES. However, it remains unclear for forest management whether current CNF strategies sufficiently reduce forests’ predisposition to climate-change-induced shifts in disturbance regimes.

Decision support systems (DSSs) can help address this challenge by integrating climate-sensitive forest modelling with indicator frameworks for evaluating BES provision and disturbance predisposition, including risks from bark beetle infestations and windthrow. These DSS frameworks have proven a flexible applicability across various forest models, spatial scales, forest types, and environmental conditions. However, climate-change-induced changes of disturbance regimes require adaptations of existing DSS frameworks by accounting for emerging disturbance agents, such as forest fires.

To address this complexity, we integrated the forest gap model ForClim with a disturbance predisposition assessment system (PAS) and assessments of BES provision. Specifically, we integrate a novel forest fire predisposition indicator with an established PAS for bark beetle and windthrow disturbances, along with an indicator framework for evaluating BES. Simulations were conducted for a forest enterprise in the Central Swiss Alps, covering a large elevation gradient, under three climate scenarios (historical, SSP2-4.5, and SSP5-8.5) and six management strategies, including CNF variants with different management intensities and climate-adapted approaches.

Our results indicate that climate change will dynamically alter disturbance predisposition across elevation gradients. Site-related predisposition to fire and bark beetle infestation generally increased under climate change, while stand-related predisposition varied with climate scenario and elevation. Under moderate warming (SSP2-4.5), stand-related predisposition to fire and windthrow increased across all elevations. In contrast, under severe warming (SSP5-8.5), long-term reductions in stand-related predisposition to fire, bark beetle infestation, and windthrow occurred at lower elevations due to declining forest productivity, while predisposition increased at higher elevations with improved growing conditions. CNF emerged as a balanced approach for reducing predisposition to bark beetle infestation and windthrow while maintaining BES. However, CNF promoted stand characteristics that increase stand-related predisposition to forest fires. Our results further show that increasing management intensity generally reduces stand-related disturbance predisposition but can also lead to trade-offs, such as reduced BES provision.

We conclude that climate-adapted forest management must account for both stand-related and site-related predisposition to prioritize disturbance-prone ‘hotspots’, especially in areas of high BES value. Proactively reducing disturbance predisposition may involve short-term trade-offs regarding BES provision but may be crucial to avoid larger, long-term BES losses from severe disturbances. Our study underscores the need for decision support systems to support informed decision-making in mountain forest management.

How to cite: Mutterer, S., Blattert, C., Bont, L., Griess, V., and Schweier, J.: Beetles, wind, and fire: integrating disturbance predisposition assessments into decision support systems for climate-adapted management of mountain forests, EGU General Assembly 2025, Vienna, Austria, 27 Apr–2 May 2025, EGU25-5742, https://doi.org/10.5194/egusphere-egu25-5742, 2025.

EGU25-6130 | Posters on site | BG3.12

Simulation of drought-induced forest mortality with the LandscapeDNDC ecosystem model 

Martin Thurner, Rüdiger Grote, Pia Labenski, Daniel Nadal-Sala, Yanick Ziegler, and Nadine K. Ruehr

Drought stress causes widespread forest mortality globally, for instance recently in temperate forests of Central Europe during and after the extremely dry summers in 2018, 2019 and 2022. Trees may die in consequence of hydraulic damage from xylem embolism, but also due to long-term effects caused by allocation into repair and adaptation that may deplete carbon (C) reserves, reduce competition strength and lower resistance to subsequent insect and pathogen infestations. We review implementations of drought-induced tree and forest mortality in ecosystem models and test different implementations in LandscapeDNDC, a terrestrial ecosystem model designed for simulations of the C and nitrogen cycles at site and regional scales. Based on tree hydraulic processes recently integrated into the model, we simulate tree mortality either a) when a threshold in xylem hydraulic conductivity loss is exceeded, or b) when tree water storage is depleted. In addition, we consider c) tree mortality as a result of depleted C reserves and low growth efficiency caused by drought legacy effects. Direct and legacy effects of drought stress on tree mortality rates are parameterized for common European temperate tree species (Fagus sylvatica, Picea abies, Pinus sylvestris, Quercus robur). We evaluate our simulations of drought-related tree mortality rates by comparing them to estimates from forest inventory and remote sensing approaches covering recent drought events. An improved modelling of direct and lagged drought-induced forest mortality is essential to understand the response of the vegetation C cycle to climate change and the options of forest management to increase the resistance of European temperate forests to drought.

How to cite: Thurner, M., Grote, R., Labenski, P., Nadal-Sala, D., Ziegler, Y., and Ruehr, N. K.: Simulation of drought-induced forest mortality with the LandscapeDNDC ecosystem model, EGU General Assembly 2025, Vienna, Austria, 27 Apr–2 May 2025, EGU25-6130, https://doi.org/10.5194/egusphere-egu25-6130, 2025.

This contribution reports on the effects of drought legacies on mature trees after five years of experimental summer drought in a mixed forest in southern Germany. The study objects are c. 70-80 year old European beech (Fagus sylvatica) and Norway spruce (Picea abies) trees growing in either monospecific or mixed species interactions; a total of about 100 trees in 12 plots under experimental drought (Kranzberg Forest Roof Project: KROOF). For five consecutive years, trees were subjected to complete throughfall exclusion during the growing season. This resulted in up to 80% reduction in physiological and morphological parameters such as reduced photosynthesis, growth and leaf area development. In general, the drought effect was much stronger in the more isohydric spruce compared to the more anisohydric beech. After 5 years of throughfall exclusion, drought release was initiated in the early summer of 2019, resulting in faster recovery in beech compared to spruce.

This presentation will focus on the response of previously drought-stressed trees to a natural summer drought in 2022, three years after the start of drought release, with significant legacy effects under the renewed drought. Previously drought-stressed trees showed increased resistance to renewed drought, with higher stomatal conductance, pre-dawn twig water potential and soil water availability, resulting from lower water use of spruce. We interpret this as a positive legacy effect resulting from leaf area acclimation to the preceding drought. At the end of the five years of experimental drought, spruce reduced its leaf area by more than 60%. After three years of drought recovery, spruce leaf area was still reduced by 1/3 compared to unstressed spruce.

Interestingly, drought stress was also reduced in neighboring beech trees in the absence of leaf area reduction. A 2H-labeling experiment of soil water on the experimental plots showed that beech root water uptake reaches far into the spruce-dominated soil area. These results are supported by analyses of the distribution of beech and spruce roots in the plots. We conclude that during drought, the more anisohydric beech effectively accesses water in the soil under the more isohydric spruce, and thus benefits from the water-saving strategy of spruce even years after previous drought events.

How to cite: Grams, T.: Positive legacy effects after experimental drought in a beech-spruce forest, EGU General Assembly 2025, Vienna, Austria, 27 Apr–2 May 2025, EGU25-6200, https://doi.org/10.5194/egusphere-egu25-6200, 2025.

EGU25-6297 | ECS | Orals | BG3.12

Exploring European forest disturbance interaction effects in a changing climate 

Catrin Stadelmann, Anne Gnilke, and Tanja GM Sanders

In Europe, forest disturbances increased in scale and severity over the past 70 years producing large amounts of disturbed timber volume [1]. Projections show a further increase of natural disturbances in severity and frequency under a changing climate [2]. In addition, climate change also causes shifts in forest biome distribution due to changes in growing conditions [3] and disturbance patterns [4].

As different disturbance types are interconnected and effects of these interactions have been identified [5], investigating them is especially relevant as they can cause amplification of disturbance effects.

Current ground-based monitoring programs, such as national forest inventories, cannot provide comprehensive and continuous coverage of large areas over time. Therefore, remote sensing applications improve existing data gathering and availability of spatially explicit records for the monitoring of affected areas [6].

For European forests, several different databases collect spatially explicit data on different types of forest disturbances, such as windthrow, fire, and pathogen or insect infections [1]. Across Europe, data from these databases indicate several hotspots, where disturbance interactions can be investigated.

In this study, we investigate several different areas affected by natural disturbances along a gradient in Europe by combining climate data and data on drought occurrence to identify and assess spatio-temporal combinations of predisposing large-scale climate conditions preceding disturbance events. In addition to assessing current interactions between climate and natural disturbance occurrences, our goal is to relate those to projected climate change scenarios in order to investigate the impacts of disturbances on future forest ecosystems.


References:

[1] Patacca, M., Lindner, M., Lucas-Borja, M. E., Cordonnier, T., Fidej, G., Gardiner, B., Hauf, Y., Jasinevičius, G., Labonne, S., Linkevičius, E., Mahnken, M., Milanovic, S., Nabuurs, G.-J., Nagel, T. A., Nikinmaa, L., Panyatov, M., Bercak, R., Seidl, R., Ostrogović Sever, M. Z., Socha, J., Thom, D., Vuletic, D., Zudin, S., and Schelhaas, M.-J.: Significant increase in natural disturbance impacts on European forests since 1950, Global change biology, 29, 1359–1376, https://doi.org/10.1111/gcb.16531, 2023.

[2] Machado Nunes Romeiro, J., Eid, T., Antón-Fernández, C., Kangas, A., and Trømborg, E.: Natural disturbances risks in European Boreal and Temperate forests and their links to climate change – A review of modelling approaches, Forest Ecology and Management, 509, 120071, https://doi.org/10.1016/j.foreco.2022.120071, 2022.

[3] Kirschbaum, M. U. F.: Forest growth and species distribution in a changing climate, Tree physiology, 20, 309–322, https://doi.org/10.1093/treephys/20.5-6.309, 2000.

[4] Altman, J., Fibich, P., Trotsiuk, V., and Altmanova, N.: Global pattern of forest disturbances and its shift under climate change, The Science of the total environment, 915, 170117, https://doi.org/10.1016/j.scitotenv.2024.170117, 2024.

[5] Burton, P. J., Jentsch, A., and Walker, L. R.: The Ecology of Disturbance Interactions, BioScience, 70, 854–870, https://doi.org/10.1093/biosci/biaa088, 2020.

[6] Gnilke, A. and Sanders, T. G. M.: Distinguishing Abrupt and Gradual Forest Disturbances With MODIS-Based Phenological Anomaly Series, Frontiers in plant science, 13, 863116, https://doi.org/10.3389/fpls.2022.863116, 2022.

How to cite: Stadelmann, C., Gnilke, A., and Sanders, T. G.: Exploring European forest disturbance interaction effects in a changing climate, EGU General Assembly 2025, Vienna, Austria, 27 Apr–2 May 2025, EGU25-6297, https://doi.org/10.5194/egusphere-egu25-6297, 2025.

EGU25-6656 | ECS | Posters on site | BG3.12

Long-term carbon sequestration and heatwave resilience in an old hemiboreal upland coniferous forest 

Svyatoslav Rogozin, Alisa Krasnova, Ülo Mander, Veiko Uri, and Kaido Soosaar

Boreal forests play a critical role in the global carbon cycle due to their vast coverage and ability to consistently absorb significant amounts of atmospheric carbon. In contrast, hemiboreal forests, which serve as a transitional zone between southern boreal and northern temperate forests, remain relatively understudied. Given their unique position and the rapidly changing climatic conditions in the Northern Hemisphere, hemiboreal forests are increasingly vulnerable to extreme weather events. To improve scientific understanding of long-term carbon dynamics in hemiboreal forests, we investigated annual and seasonal carbon fluxes, their connections to environmental factors, and the forest's response to an extreme weather event—the 2018 heatwave. Using the eddy covariance method, we studied an old upland coniferous hemiboreal forest in Estonia over an eight-year period (2016–2023). This forest is representative of coniferous forests in the hemiboreal zone, and our study provides one of the few long-term datasets available for this region. Our multiyear study reveals that the forest shifted between being a carbon sink and a carbon-neutral state, becoming carbon-neutral in 2020 due to Estonia's warmest autumn in 19 years and atypical weather events in June of the same year. In the following years, the forest's sink strength recovered. Moreover, air temperature was confirmed as the most significant driver of the forest's carbon dynamics. During the 2018 heatwave from mid-July to early August, we observed reductions in ecosystem respiration and gross ecosystem productivity, but by autumn, they had returned to their usual multi-year ranges with no legacy effect in 2019. While our results raise some concerns about the forest’s carbon sink stability, the absence of a legacy effect highlights its resilience to extreme weather events. This underscores the need for long-term monitoring of carbon dynamics in the hemiboreal forest zone to better understand their responses to both rapid and gradual temperature changes.

How to cite: Rogozin, S., Krasnova, A., Mander, Ü., Uri, V., and Soosaar, K.: Long-term carbon sequestration and heatwave resilience in an old hemiboreal upland coniferous forest, EGU General Assembly 2025, Vienna, Austria, 27 Apr–2 May 2025, EGU25-6656, https://doi.org/10.5194/egusphere-egu25-6656, 2025.

EGU25-6686 | ECS | Posters on site | BG3.12

Are drought-resistant non-native species adapted to Central European cold winter?  

Ginevra Fabiani, Yann Vitasse, and Petra D'Odorico

The increasing frequency and intensity of severe droughts linked to climate change has recently led to significant regional dieback of certain forest species, even at the core of their geographical distribution. The introduction of non-native species, i.e. by assisted migration, from regions with climatic conditions similar to those expected for the target area, could complement other management strategies to maintain sustainable ecosystem services in the future. However, not only drought but also frost is a key physiological stressor shaping trees species distribution. It is therefore essential to assess to what extent the introduced species can withstand cold temperatures and potential extreme frost events. Buds which comprise the leaf primordia are the most vulnerable part of the tree to winter frost damage and different species have evolved contrasting morphological and biochemical strategies to achieve varying degrees of  cold-hardiness in winter.

To assess whether, and to what degree, buds from non-native species can withstand severe frosts compared to the phylogenetically related native-species, we sampled branches from five non-native species (Tilia tomentosa, Fagus orientalis, Abies bornmuelleriana, Cedar libani, and Tsuga heterophylla) planted in Switzerland in 2012 and, when present, branches from native species phylogentenically close (Tilia cordata, Fagus sylvatica, Abies alba, and Quercus petraea) growing in the close proximity of the experimental stand. Since cell tolerance to cold temperature is a dynamic trait, reaching a minimum value in deep winter and increasing in spring, we repeated the sampling in January and February 2025 and combined it with an artifical hardening and dehardening treatment (3 days at -4°C and +15°C, respectively). Shortly after sampling, or after the hardening/dehardening treatment, we exposed the buds to different freezing temperatures (-8, -15, -2, -25, -30, and -35°C) and measured cold hardiness of each species using the electrolyte leakage method. The hardening and dehardening treatments aimed to determine the species-specific maximum frost resistance as well their capacity to loose freezing resistance when exposed to a warm spell, which can be critical in the study climate. Additionally, to assess the depth of winter dormancy across all studied species, we placed twigs from each species in a growth chamber set at +20°C, and monitored the time to budbreak and the subsequent phenological development.

We hypothesize that (i) native species are better adapted to withstand extreme frost events compared to the non-native counterparts, and that (ii) non-native species will exhibit higher phenological plasticity by tracking earlier warming at the start of the season, allowing them to take advantage of the favourable growing conditions but potentially exposing them to frost. In contrast, native species, being adapted to the local climate, may escape the frost damage through a later phenological development (temporal frost exclusion) but might be less responsive to take advantage of extended favourable growing season induced by climate warming.

How to cite: Fabiani, G., Vitasse, Y., and D'Odorico, P.: Are drought-resistant non-native species adapted to Central European cold winter? , EGU General Assembly 2025, Vienna, Austria, 27 Apr–2 May 2025, EGU25-6686, https://doi.org/10.5194/egusphere-egu25-6686, 2025.

EGU25-7913 | ECS | Orals | BG3.12

Flush to Crush: The Paradox of Favourable Springs Leading to Tree Mortality 

Pascal Schneider, Agnès Pellissier-Tanon, Chuanlong Zhou, Philippe Ciais, Christian Piedallu, Alba Viana-Soto, Jelle Lever, and Arthur Gessler

European forests are increasingly vulnerable to climate change, with mortality rates rising across major tree species. Using data from the French National Forest Inventory (NFI), we examined mortality trends between 2014 and 2023 for over 600,000 trees spanning 52 species and major climate zones. Mortality rates significantly increased, particularly in northeastern France matching spatial patterns of warming temperatures and declining precipitation. Employing explainable machine learning, we identified forest demography (e.g., tree size, competition) and climate anomaly variables as the primary contributors to a tree’s probability of dying. In addition to warmer, drier summers being associated with higher mortality through intensified drought stress, an unexpected contributor to mortality was the occurrence of warmer and wetter springs. This result is consistent with the ‘structural overshoot’ hypothesis that rapid canopy growth during favorable warmer, wetter springs predisposes trees to hydraulic failure during subsequent droughts. Species-specific analysis revealed diverse responses, with drought-adapted Mediterranean tree species showing a lower risk of structural overshoot than temperate trees. Different drought stress mechanisms revealed by our empirical data appear to play compounding roles, with emerging drivers of mortality being chronic dryness (possibly depleting tree reserves and weakening them), acute droughts (causing hydraulic failure), and insufficient post-drought rainfall (hindering recovery). Milder winters and springs also contributed to increased mortality, likely because they enhanced pest survival and disrupted winter dormancy, further exerting stress. With rainfall projected to shift from summer to winter and rising temperatures, future droughts are expected to become increasingly harmful. These findings underscore the urgent need for adaptive policies to safeguard forest ecosystems and their essential functions.

How to cite: Schneider, P., Pellissier-Tanon, A., Zhou, C., Ciais, P., Piedallu, C., Viana-Soto, A., Lever, J., and Gessler, A.: Flush to Crush: The Paradox of Favourable Springs Leading to Tree Mortality, EGU General Assembly 2025, Vienna, Austria, 27 Apr–2 May 2025, EGU25-7913, https://doi.org/10.5194/egusphere-egu25-7913, 2025.

EGU25-8407 | ECS | Orals | BG3.12

Changes in the functional species composition of forests across a wide latitudinal range in Japan 

Lea Végh, Yayoi Takeuchi, and Tetsuro Yoshikawa

Japan has several long-term forest monitoring datasets from publications and national programmes such as the Monitoring 1000 sites and the JaLTER network. These various datasets were recently collected and organised for ease of access, resulting in observations from almost 200 plots. We analysed these data to observe long-term forest changes and assess the major factors affecting the functional composition of species over time. Tree species were classified into four plant functional groups (PFTs): boreal conifer species (BC), temperate conifer species (TC), deciduous broadleaf species (DB), and evergreen broadleaf species (EB). These PFTs can be ordered based on their latitudinal range and corresponding climatic preferences, so that from the north to the south dominance is shifting from the cold-tolerant BCs to DBs, then to warm-favouring TCs, and finally to warm-climate EBs. However, the traditional species composition might be affected by the changing climate, causing a disalignment between the functional composition of mature trees and saplings. We hypothesised that the sapling composition might shift towards warmer PFTs than those found among the mature trees, i.e.: DB saplings appearing in traditionally BC forests, and TC and EB saplings appearing in traditionally DB forests. To test this hypothesis, we analaysed species-level data from long-term forest plots with at least 20 years of observation, covering the northern-southern latitudinal range of Japan. We found that while not all plots displayed a change in PFT composition, there were many that did show a characteristic change. These changes could be seen in the increased overlap of PFTs among saplings from originally distinct forest plots, and also in the different trends of relative abundance among PFTs. However, the change could not be clearly contributed to the impact of climate change, as anthropogenic and other factors of natural disturbance had also a pronounced role in shaping the species composition of the forests. In addition to slow changes caused directly by climate change, sudden changes, attributed to herbivory, pest outbreaks, and other extreme disturbances indirectly related to climate change, were also common among the plots. Our results indicate that climate change affects forest ecosystems both directly and indirectly, with relatively quick changes once a tipping point is reached. These findings can aid future management practices to preserve the diversity and ecosystem services of the forests across a wide latitudinal range in Japan.

How to cite: Végh, L., Takeuchi, Y., and Yoshikawa, T.: Changes in the functional species composition of forests across a wide latitudinal range in Japan, EGU General Assembly 2025, Vienna, Austria, 27 Apr–2 May 2025, EGU25-8407, https://doi.org/10.5194/egusphere-egu25-8407, 2025.

EGU25-8453 | Orals | BG3.12

Tree crown defoliation as an early warning signal of increased mortality risk 

Stefan Hunziker and Arthur Gessler

Crown condition is considered as one of the most important indicators of a tree’s vitality. As part of the monitoring program Long-term Forest Ecosystem Research, the defoliation of tree crowns in Swiss forests has been monitored on an annual time scale since 1985. This long-term data set makes it possible to track the progress of defoliation until the trees die and to take into account a variety of stress factors that may have played a role in this process.

In Swiss forests, the average defoliation of trees and tree mortality has increased in the past decades. However, this only occurred in areas at lower altitude, where climate change has particularly intensified the atmospheric water demand. The importance of water stress as a driver for this development is also confirmed by some of the highest annual increases of defoliation that directly followed exceptionally dry and hot summers.

The probability that individual trees die within a few years starts to increase when the crown defoliation exceeds about 30%. Around 75-85%, most trees seem to reach a point of no return, from which they cannot recover, and which leads to death within a few years, even if no further stress occurs. In the needles of such strongly defoliated Scots pines (Pinus sylvestris L.), we found elevated levels of many stress-related metabolites (particularly osmoprotectants, defense compounds and antioxidants), whereas the levels of these metabolites were homeostatic in the needles of trees in lower defoliation classes. In contrast to the needles, these metabolites were reduced in fine roots of the strongly defoliated trees, suggesting that mainly belowground carbon starvation may impair key functions for tree survival, consequently leading to early death.

How to cite: Hunziker, S. and Gessler, A.: Tree crown defoliation as an early warning signal of increased mortality risk, EGU General Assembly 2025, Vienna, Austria, 27 Apr–2 May 2025, EGU25-8453, https://doi.org/10.5194/egusphere-egu25-8453, 2025.

EGU25-8952 | Orals | BG3.12

Grazing can alleviate drought stress in trees of Mediterranean forests at the edge of the desert 

José Grünzweig, Omri Hasson, Levi Burrows, Dor Pinchevsky, Yael Navon, Yakir Preisler, and Yagil Osem

Mediterranean oak and pine forests support a large diversity of plants and animals, and provide multiple ecosystem services to the benefit of people. Many of these forests are threatened by climate change-induced drought, especially in marginal habitats and at the dry edge of their distribution. Livestock grazing is widespread in drylands, but research on the impact of grazing focuses mainly on the herbaceous vegetation and much less is known on the consequences for woody vegetation, including trees. The overarching objective of this series of studies was to evaluate the impact of livestock grazing on trees in natural oak woodlands and planted pine forests in the drylands of the eastern Mediterranean region that are affected by climate change.

Our results showed that mortality of oak trees (Quercus calliprinos) in a marginal habitat for this species increased non-linearly with decreasing annual precipitation in a 10-year monitoring study. Cattle grazing in a semi-arid woodland consistently improved the water status, storage and use of oaks, and led to enhanced tree growth. The presence of cattle under the tree canopy led to increased soil moisture, microbial activity, and nutrient availability, and raised the trophic level of the soil detritivore community. Pine mortality (Pinus halepensis) in an arid forest was particularly pronounced in extreme drought years and in soils with a low stone content, thus accelerating seasonal soil desiccation. Sheep grazing tended to improve the water status and increased the growth response to precipitation of these trees. In semi-arid regions, goat grazing in a P. pinea forest led to increased soil nutrient cycling and availability (nitrogen, phosphorus), while cattle grazing in a P. brutia forest reduced drought stress in trees.

These studies showed that grazing can be applied as an adaptive land management tool to mitigate some of the negative impacts of extreme drought on oak and pine trees. Grazing might advance the conservation of natural oak woodlands and the sustainability of planted pine forests in drylands. This mitigation potential of livestock grazing might be key for survival of forest trees in a future warmer and drier climate.

How to cite: Grünzweig, J., Hasson, O., Burrows, L., Pinchevsky, D., Navon, Y., Preisler, Y., and Osem, Y.: Grazing can alleviate drought stress in trees of Mediterranean forests at the edge of the desert, EGU General Assembly 2025, Vienna, Austria, 27 Apr–2 May 2025, EGU25-8952, https://doi.org/10.5194/egusphere-egu25-8952, 2025.

EGU25-9282 | Orals | BG3.12

Pantropical drought-induced tree mortality: a first estimate using tree-ring and plot data 

Pieter Zuidema, Flurin Babst, Peter Groenendijk, Valerie Trouet, and Miaznur Rahman and the Tropical Tree-ring Network

One of the most pervasive drought impacts on tropical forests is increased tree mortality. While satellite imagery can detect large-scale drought-induced tree mortality events, it cannot detect individual tree mortality that is scattered in space and lagged in time. To estimate the latter mortality drought-induced growth anomalies from tree-ring data can be combined with plot-based growth-mortality associations. Here we combine data from 158 globally distributed tree-ring chronologies with plot-based growth-mortality associations to present a first pantropical estimate of drought-associated mortality.

For the 10% driest years, our pantropical estimate of angiosperm lowland tree mortality is 0.1% y-1 (confidence interval: 0.08-0.15%) on top of 1% y-1 background mortality. This value is slightly higher for the 5% driest years.

Direct empirical associations between growth and mortality for tree-ring forming species are needed to refine this estimate. Tree mortality likely increases under ongoing climate change, leading to reduced carbon residence time in tropical forests.

How to cite: Zuidema, P., Babst, F., Groenendijk, P., Trouet, V., and Rahman, M. and the Tropical Tree-ring Network: Pantropical drought-induced tree mortality: a first estimate using tree-ring and plot data, EGU General Assembly 2025, Vienna, Austria, 27 Apr–2 May 2025, EGU25-9282, https://doi.org/10.5194/egusphere-egu25-9282, 2025.

EGU25-9457 | Orals | BG3.12

Remotely sensed photoprotection reveals drought stress across contrasting mature temperate tree species and functional types subjected to precipitation manipulation 

Petra D'Odorico, Dominic Fawcett, Michael Eisenring, Arthur Gessler, Günter Hoch, Ansgar Kahmen, Richard L. Peters, David N. Steger, Tobias Zhorzel, Roman Zweifel, and Christian Ginzler

Monitoring forest drought stress requires indicators able to explain tree water relations across different species, scales, and functional types. While changes detected by remote sensing indicators of vegetation greenness often represent drought legacies, i.e., lagged responses of trees occurring in the years following a severe drought, measurements of tree function can capture drought signals in real-time. Among these is the photochemical reflectance index (PRI) which detects changes in xanthophyll cycle pigment dynamics. This process reflects increases in photoprotective non-photochemical quenching activity resulting from drought-induced photosynthesis downregulation. However, the complexity of species-specific light and water resource use strategies over short and long timescales, challenges interpretation of this index across species and raises the need for a more mechanistic understanding of remote sensing signals under water limitations.

We combined drone-based multispectral imagery with measurements of tree water relations, pigments, and environmental parameters over one summer in an old-growth mixed forest subject to precipitation manipulation. Our goal was to assess the potential of remote sensing indicators of greenness (Normalized Difference Vegetation Index; NDVI) and photoprotection dynamics (PRI) to track variations in tree hydraulic traits (predawn leaf water potential, Ψleaf_pd; minimum tree water deficit, TWDmin) for seven common European tree species (Abies alba, Picea abies, Pinus sylvestris, Acer pseudoplatanus, Fagus sylvatica, Carpinus betulus, Quercus sp.).

We found NDVI-greenness captured irreversible crown defoliation and browning for the two most drought-stressed deciduous species. In contrast, PRI revealed a strengthening of xanthophyll-cycle induced thermal dissipation during drought, followed by the downregulation of photoprotection activity upon soil water replenishment, for all species and functional types and in agreement with dynamics of measured tree hydraulic traits. The combination of both remote sensing indices and tree height performed best in explaining tree water relations at our site, evidencing the importance of legacy effects captured by greenness in addition to short-term light utilization requirements revealed by PRI. Species-specific diurnal PRI-light response curves, obtained from drone flights conducted at various times of the day, were further analysed to derive metrics aimed at isolating the xanthophyll cycle response (facultative PRI response) from pigment pool size effects (constitutive response), enhancing the comparability across different species and functional types. We found species experiencing greater drought stress mostly exhibited higher photoprotection rates early in the day and a broader operational range of photoprotective systems throughout the day.

This study demonstrates the potential of PRI for drought stress monitoring in mixed forest sites, yet it also underscored the need for further investigations of the combined impact of water and light stress to develop robust cross-species drought monitoring approaches based on remote sensing signals.


How to cite: D'Odorico, P., Fawcett, D., Eisenring, M., Gessler, A., Hoch, G., Kahmen, A., Peters, R. L., Steger, D. N., Zhorzel, T., Zweifel, R., and Ginzler, C.: Remotely sensed photoprotection reveals drought stress across contrasting mature temperate tree species and functional types subjected to precipitation manipulation, EGU General Assembly 2025, Vienna, Austria, 27 Apr–2 May 2025, EGU25-9457, https://doi.org/10.5194/egusphere-egu25-9457, 2025.

EGU25-9902 | ECS | Posters on site | BG3.12

Identifying Climate Analogues and Selecting Resilient Tree Species for Future Austrian Forests 

Katharina Enigl, Konrad Mayer, Matthias Schlögl, Carina Heiling, Samuel Aspalter, and Silvio Schüler

Climate change poses substantial challenges to forest ecosystems, with increasing temperatures and prolonged droughts driving tree mortality and pest outbreaks across Europe. In Austria, such events threaten the productivity, the forest carbon sink capacity and other forest ecosystem services, necessitating evidence-based strategies to enhance forest resilience. This study addresses this challenge by identifying climate-analogous regions and selecting suitable tree species for Austrian forest ecoregions under changing climatic conditions.

We utilize the CHELSA V2.1 climate data set to identify target regions across the Northern hemisphere where current climatic conditions mirror those projected for the Austrian forest ecoregions by 2100 using three different climate scenarios (SSP1.26, SSP3.70 and SSP5.85). This specifically involves the analysis of a comprehensive set of climate indicators reflecting drivers causing heat stress and drought events, to ensure a precise match with expected conditions. Having tested different metrics, we employ Euclidian distance as measure for climatic similarity. The resulting climate analogues serve as reference areas for identifying tree species that thrive under comparable environmental conditions

The selection of putative tree species from across the northern hemisphere is based on species distribution maps from in total 832 tree species, from which about 15–25 tree species are being selected for each of the nine forest ecoregions. The climatic analysis of putative origins of future tree species or seed provenances is accompanied by a literature analysis of wood characteristics, ecological risks (i.e. invasive potential) and legal constraints for the utilization of the candidate tree species.

By focusing on both the ecological and practical dimensions of species selection, the study provides actionable insights for forest managers. The findings will be integrated into tools such as the "tree species traffic light (https://www.klimafitterwald.at/baumarten/)" facilitating the implementation of forest adaptation strategies with climate-resilient trees in Austrian forests. This research offers a transferable methodology for regions globally, addressing the critical intersection of climate change adaptation and sustainable forest management.

How to cite: Enigl, K., Mayer, K., Schlögl, M., Heiling, C., Aspalter, S., and Schüler, S.: Identifying Climate Analogues and Selecting Resilient Tree Species for Future Austrian Forests, EGU General Assembly 2025, Vienna, Austria, 27 Apr–2 May 2025, EGU25-9902, https://doi.org/10.5194/egusphere-egu25-9902, 2025.

Forest fires are becoming more frequent and intense due to climate change, leading to serious impacts on forest ecosystems. Beyond the immediate damage, they can trigger complex and long-lasting effects on forest health, leading to episodes of tree mortality that can occur even years after the fire event. Understanding these long-term processes and identifying early warning signs of post-fire mortality is a major challenge for forest management in the context of global warming.  Multidisciplinary approaches, such as dendro-anatomy and high-resolution sap flow monitoring, have emerged as key tools for studying these processes. Dendro-anatomy provides data on growth and structural changes in xylem, while sap flow monitoring offers insights into water and carbon use dynamics in trees.  In our study, we focused on a Pinus piaster Aiton forest in the Vesuvio National Park, southern Italy, which was impacted by a fire in 2017. Since 2021, we have been monitoring dominant trees in both a burned area and an adjacent control site using Tree Talker devices that measure daily sap flow and microenvironmental variables. Our goal is to follow the post-fire dynamics of tree sap flow and integrate these data with dendro-anatomical analyses of wood cores to assess the effects of fire on tree growth and xylem function in the years. This approach aims to allow the identification of potential signals of decline that could precede tree mortality. Preliminary results of sap flow monitoring showed different eco-physiological responses between burned and control trees. In the years immediately following the fire, burned trees exhibited increased sap flow, suggesting a strategy of increased stomatal opening to counteract carbon starvation caused by severe defoliation. However, in the last years, sap flow has decreased, falling below control site levels, indicating a progressive physiological decline, that could suggest these trees have entered a critical phase, approaching a tipping point. Although dendro-anatomy analyses are ongoing, we expect to observe reduced growth and alterations in xylem functionality in burned trees that could corroborate the observed eco-physiological trends and provide further insights into carbon reserve depletion and mortality thresholds. This case study aims to provide an integrated view of the long-term eco-physiological processes in tree species hit by fire, offering valuable tools for adaptive forest management in the face of climate change.

How to cite: Battipaglia, G., kabala, J. P., and Niccoli, F.: Long-term monitoring of sap flow and dendro-anatomy indicate increase mortality risk in fire-damaged Pinus pinaster Aiton forests of southern Italy, EGU General Assembly 2025, Vienna, Austria, 27 Apr–2 May 2025, EGU25-10063, https://doi.org/10.5194/egusphere-egu25-10063, 2025.

EGU25-10830 | ECS | Posters on site | BG3.12

Assessing the impact of Kaolin treatment on the development and overall health of cork oak trees after cork stripping. 

Salvatore Riggi, Elena Brunori, Mauro Maesano, Mario Contarini, Leonardo Guidoni, Andrea Vannini, and Riccardo Valentini

Cork oak forests play a crucial role in the Mediterranean region, providing ecological, social, and economic benefits. Factors such as wildfires, pests, diseases, and climate change have led to a decline in cork oak ecosystems. This study evaluates the effectiveness of kaolin treatment in mitigating multiple stress factors following cork removal, including water stress while maintaining the canopy’s photochemical efficiency and the long-term vigor of the trees. The research, conducted in a Spanish cork oak forest, assessed physiological parameters such as stomatal conductance, chlorophyll fluorescence, and leaf chlorophyll concentration. Additionally, TreeTalker® devices were employed to monitor sap flow, tree stability, and climatic conditions, offering a comprehensive view of the trees’ physiological responses. Proximal vegetation indices (NDVI and NDRE) were analyzed to evaluate vegetative growth, with no significant differences observed in the short term. Results demonstrated that kaolin application positively impacted photosynthetic performance and water dynamics, as treated trees maintained higher efficiency and resilience than untreated ones. These findings suggest that kaolin treatments could enhance tree resilience to environmental stressors. Further research on the long-term implications for cork production and tree health is recommended to optimize this management strategy.

How to cite: Riggi, S., Brunori, E., Maesano, M., Contarini, M., Guidoni, L., Vannini, A., and Valentini, R.: Assessing the impact of Kaolin treatment on the development and overall health of cork oak trees after cork stripping., EGU General Assembly 2025, Vienna, Austria, 27 Apr–2 May 2025, EGU25-10830, https://doi.org/10.5194/egusphere-egu25-10830, 2025.

EGU25-11245 | Posters on site | BG3.12

Capturing drought and post-drought impacts on forest GPP using a range of satellite indices 

Julia Kelly, Tim Schacherl, Lars Eklundh, Anne Klosterhalfen, and Natascha Kljun

Europe’s forests are under threat from rising air temperatures and increasingly severe and frequent drought. Yet the carbon storage capacity of these forests is a vital part of the European Green Deal and efforts to mitigate climate change. Due to the multiple demands placed on forests, it is essential to develop accurate methods to monitor their carbon sink strength over large spatial extents, for example by using satellite data. However, capturing drought effects on forest gross primary productivity (GPP) using remote sensing is not straight forward. Drought causes multiple changes to tree physiology and structure over varying timescales that are not always reflected in the optical vegetation indices most commonly used by the remote sensing community.   

As part of the EU Horizon project CLIMB-FOREST, we tested the ability of fifteen indices derived from MODIS to detect the negative impact of severe drought on forest GPP. These included indices that respond to changes in leaf pigments, canopy structure, canopy water content and land surface temperature. The analysis compared GPP during drought and non-drought periods at 14 flux tower sites across Europe between 2003-2023. We found that drought during the mid- to late-growing season led to a decline in GPP compared to non-drought years whereas drought during the early growing season was associated with increased GPP. The only MODIS indices that showed significant changes during drought compared to non-drought conditions were NDVI, CCI, PRI and LST. However, several other indices were significantly lower in the year after a drought event, despite GPP returning to average values, which may be evidence of drought legacy effects on forests. Further work will examine how remote sensing indices are linked to changes in ecosystem functional properties during and after drought. By disentangling the relationship between remote sensing indices and drought-related changes to forest carbon fluxes and function, our findings will help improve the accuracy of remote-sensing based models of forest GPP.

How to cite: Kelly, J., Schacherl, T., Eklundh, L., Klosterhalfen, A., and Kljun, N.: Capturing drought and post-drought impacts on forest GPP using a range of satellite indices, EGU General Assembly 2025, Vienna, Austria, 27 Apr–2 May 2025, EGU25-11245, https://doi.org/10.5194/egusphere-egu25-11245, 2025.

EGU25-11617 | ECS | Posters on site | BG3.12

Long-term dynamics of CO2 fluxes over a managed and an unmanaged beech forest 

Anne Klosterhalfen, Christian Markwitz, Franziska Koebsch, Martina Mund, Frank Tiedemann, Edgar Tunsch, and Alexander Knohl

Forests are important natural carbon sinks and can help mitigate climate change. The drought and heat waves of recent years have severely affected forests in Germany, resulting in reduced net CO2 uptake. How forest management, age and species composition moderate the negative impacts of weather extremes on net CO2 uptake or its recovery is still unknown.

For around 25 years, gross primary production, ecosystem respiration and net ecosystem exchange as well as evapotranspiration have been studied in a unmanaged, uneven-aged and mixed beech stand in the Hainich National Park (DE-Hai) and a managed, even-aged and pure beech stand near Leinefelde (DE-Lnf) in Thuringia, Germany.

Both forest stands were and are a substantial CO2 sink (DE-Hai: 512±89 gC m-2 a-1; DE-Lnf: 590±190 gC m-2 a-1), whereby the annual CO2 uptake of the managed stand varied significantly more than that of the unmanaged stand. The CO2 sink function of both stands persisted even in the extremely dry and hot year 2018, though the annual CO2 uptake was reduced by 27% (DE-Hai) and 64% (DE-Lnf) compared to the long-term average from 2002-2017. A reduction in CO2 uptake was also evident in the following year, which can mainly be attributed to persistently low soil water availability. In addition, a loss of tree vitality was observed, which affected the CO2 balance in the following years. In contrast to the unmanaged stand, however, the managed stand already reached higher uptake rates again in 2020. The differences between the stands can mainly be explained by differences in tree age and stand structure. With a mean age of about 130 years, the managed stand consists almost exclusively of vigorous beech trees (optimal phase), whereas the unmanaged stand comprises all age classes and developmental stages, in particular a high proportion of very old trees (> 180 years), which were particularly badly damaged by the drought.

Long-term flux measurement covering 25 years revealed divergent responses of the two differently managed and structured forest stands to drought. In a next step, more sites covering a range of management strategies, species and ages need to be included.

How to cite: Klosterhalfen, A., Markwitz, C., Koebsch, F., Mund, M., Tiedemann, F., Tunsch, E., and Knohl, A.: Long-term dynamics of CO2 fluxes over a managed and an unmanaged beech forest, EGU General Assembly 2025, Vienna, Austria, 27 Apr–2 May 2025, EGU25-11617, https://doi.org/10.5194/egusphere-egu25-11617, 2025.

EGU25-12937 | Orals | BG3.12

Emerging signals of declining forest resilience under climate change 

Giovanni Forzieri, Vasilis Dakos, Nate McDowell, Romain Alkama, and Alessandro Cescatti

The stability of forest ecosystems depends on their capacity to withstand and recover from natural and anthropogenic perturbations, i.e., their resilience. Experimental evidence of sudden increases in tree mortality is raising concerns about variation in forest resilience, yet little is known about how it is evolving in response to climate change. Here, we integrate satellite-based vegetation indices with machine learning to show how forest resilience, quantified in terms of critical slowing down indicators, has changed over the period 2000-2020. We show that tropical, arid and temperate forests are experiencing a significant decline in resilience, likely related to the increasing water limitations and climate variability. In contrast, boreal forests show an increasing trend in resilience, likely benefitting from warming and CO2 fertilization, which may outweigh the adverse effects of climate change. These patterns emerge consistently in both managed and intact forests corroborating the existence of common large-scale climate drivers. Reductions in resilience are statistically linked to abrupt declines in forest productivity, occurring in response to a slow drifting toward a critical resilience threshold. Approximately 23% of intact undisturbed forests, corresponding to 3.32 Pg C of gross primary productivity, have already reached a critical threshold and are experiencing a further degradation in resilience. Together, these signals reveal a widespread decline in forests’ capacity to withstand perturbation that should be accounted for in the design of land-based mitigation and adaptation plans.

How to cite: Forzieri, G., Dakos, V., McDowell, N., Alkama, R., and Cescatti, A.: Emerging signals of declining forest resilience under climate change, EGU General Assembly 2025, Vienna, Austria, 27 Apr–2 May 2025, EGU25-12937, https://doi.org/10.5194/egusphere-egu25-12937, 2025.

EGU25-13552 | ECS | Posters on site | BG3.12

Decline of European beech (Fagus sylvatica L.): impact of the local environment and climate change on beech forests in southern Belgium 

Marie-Pierre Tasseroul, Philippe Lejeune, Hugues Claessens, Hugues Titeux, and Yves Brostaux

Fagus sylvatica L. is one of the most widespread tree species in temperate forests of Western Europe which plays an important role in both ecological and economic terms. European beech stands were especially adapted to the past climate but have suffered a decline in last recent years. Climate change and the increased frequency of extreme events (droughts, heatwaves but also extreme rainfall) seem to be impacting their vitality even if the exact description of this phenomenon is still unclear.

In this context, we have monitored around 97 plots in southern Belgium in which we have evaluated the state of health of ten to fifteen dominant or co-dominant beech trees during the growing season (2022). To describe the state of health, we used the French method DEPERIS and a simplified version of the European ICP-Forests protocol. The aim of this study is to understand the decline phenomenon in its globality and how local and regional factors can influence it. For each plot, topographic, pedological, past and present climate, local tree environment and sylvicultural data were collected (raster layers or in the field) and considered explanatory variables for beech decline. Stand decline, described as the mean defoliation of trees on the plot, and individual tree defoliation are both considered in the analyses. A Random Forest model combined to an analysis of Shapley values allow to explain more than 40% of the variability in beech decline. The results show that (i) climatic factors, such as the rise of mean temperatures compared with the long-term climate of the past and the change in rainfall distribution, and (ii) abiotic factors, such as available water capacity and the trees’ direct local environment, are the most relevant explanatory factors. This research confirms the complexity and interactions between climate change and abiotic conditions in the decline of European beech.

How to cite: Tasseroul, M.-P., Lejeune, P., Claessens, H., Titeux, H., and Brostaux, Y.: Decline of European beech (Fagus sylvatica L.): impact of the local environment and climate change on beech forests in southern Belgium, EGU General Assembly 2025, Vienna, Austria, 27 Apr–2 May 2025, EGU25-13552, https://doi.org/10.5194/egusphere-egu25-13552, 2025.

EGU25-14853 | ECS | Posters on site | BG3.12

Regional Climate Stressors and Their Differential Impact on Vegetation Response in Peninsular India’s Forest Ecosystems 

Devosmita Sen, Joy Monteiro, and Deepak Barua

While global climate change is a critical concern, its regional impacts on terrestrial ecosystems remain poorly understood. Primary abiotic drivers like temperature and soil moisture are key in shaping vegetation response and distribution, but global warming is expected to amplify their variability, alter frequencies, and disrupt interactions. This creates significant uncertainty regarding their effects on ecosystems. It is unclear whether vegetation responses will be uniform or exhibit contrasting patterns, potentially shifting mean values, distribution, variability, and ecosystem resilience. Understanding these dynamics is vital for predicting ecological outcomes and informing effective mitigation and adaptation strategies.

In this study, satellite observations of vegetation health from 2004 to 2022 are used to assess ecosystem sensitivity to climate stressors across forest ecosystems in Peninsular India, focusing on Deciduous and Evergreen Plant Functional Types (PFTs) in the Eastern and Western Ghats. Our analysis highlights soil moisture (SM) as a primary driver of vegetation productivity, while temperature anomalies, especially during the critical pre-monsoon months (February to May), play a significant role in explaining productivity anomalies, exerting distinct and variable influences across these months. Consequently, these months should be prioritized when assessing temperature-related risks. Regional and PFT-specific interactions with Temperature and Soil Moisture are crucial, with temperature anomalies having a more significant impact in the Eastern Ghats (EG) compared to the Western Ghats (WG), and the influence of SM being greater for deciduous than evergreen PFTs. Additionally, the strength of the response varies across different quantiles, revealing unequal sensitivity and variation in vegetation response throughout the distribution.

Our findings suggest that increased extreme weather events will likely enhance heterogeneous vegetation response and underscores the need for region-specific, adaptive strategies to mitigate the complex and uneven impacts of climate variability on ecosystem productivity.


How to cite: Sen, D., Monteiro, J., and Barua, D.: Regional Climate Stressors and Their Differential Impact on Vegetation Response in Peninsular India’s Forest Ecosystems, EGU General Assembly 2025, Vienna, Austria, 27 Apr–2 May 2025, EGU25-14853, https://doi.org/10.5194/egusphere-egu25-14853, 2025.

EGU25-15552 | Posters on site | BG3.12

Is a multifunctional forest more resilient to disturbances?  

Laura Dobor, Marco Baldo, Katarína Merganičová, Agnish Kumar Das, Lukáš Bílek, and Tomáš Hlásny

Managing forests for resilience has become an important research area in response to escalating climate change and intensifying disturbances. However, it remains unclear whether emphasizing resilience influences the provision of ecosystem services and the overall degree of forest multifunctionality. We hypothesized that forests with higher multifunctionality are also more resilient to natural disturbances—namely, they can better withstand the disturbance and recover—given that factors like species diversity and structural complexity may support both resilience and multifunctionality. We studied this trade-off in a Central European forest landscape using forest landscape and disturbance model iLand. We simulated multidecadal forest development under five management narratives ranging from the emphasis on biomass production through the low-intensity management promoting natural dynamics to unmanaged development. Individual narratives differed in terms of the proportion of species planted after harvest, rotation period, retention of mature trees after harvests, level of control of ungulate populations and sanitary removal of dead and infested trees to prevent bark beetle outbreaks. This experiment was driven by historical climate data and eight climate projections of four climate models and two RCP scenarios. Forest multifunctionality encompassed wood production (represented by annual wood increment and harvested wood volume), biodiversity (Shannon-index and deadwood amount), water protection function (leaf area index and standing volume) and climate regulation function (net ecosystem production and carbon stock). Forest resilience was evaluated through the overall level of disturbed growing stock and the recovery time from a singular disturbance impact. To assess the potential trade-offs, we confronted the newly proposed multifunctionality score with individual resilience indicators. 

How to cite: Dobor, L., Baldo, M., Merganičová, K., Kumar Das, A., Bílek, L., and Hlásny, T.: Is a multifunctional forest more resilient to disturbances? , EGU General Assembly 2025, Vienna, Austria, 27 Apr–2 May 2025, EGU25-15552, https://doi.org/10.5194/egusphere-egu25-15552, 2025.

EGU25-15559 | Orals | BG3.12

A random forest model for Norway spruce and Scots pine tree rings in Europe 

Sonja Vospernik, Kamil Bielak, Gediminas Brazaitis, Aksel Granhus, Stig-Olof Holm, Magnus Löf, Aris Jansons, Marek Metslaid, Thomas Nord-Larsen, Arne Nothdurft, Hans Pretzsch, Ricardo Ruiz-Peinado, and Roman Sitko

Norway spruce, which is sensitive to drought, and Scots pine, which is drought-resistant, are two of the most significant conifer species in Europe. In mixed stands, they can utilize resources more efficiently than in pure stands, leading to higher yields and reduced risk. Tree ring research is often used to study their growth in response to complex environmental factors. Machine learning, though rarely applied to tree ring analysis, might be well suited for modelling these complex relations. Data from 22 triplets (1 mixed and two pure plots of Norway spruce and Scots pine) covering a temperature and precipitation gradient of 3.2-9.2°C and 613 to 1075 mm respectively, were used in this study. On each plot, trees were mapped and measured for dbh, height and height to the crown base. 4490 increment cores were collected and synchronized in the lab. A random forest model with relative DBH, age, competition, mixture and climate variables explained 76.4% of the variation and proved effective in describing ecological relationships.

How to cite: Vospernik, S., Bielak, K., Brazaitis, G., Granhus, A., Holm, S.-O., Löf, M., Jansons, A., Metslaid, M., Nord-Larsen, T., Nothdurft, A., Pretzsch, H., Ruiz-Peinado, R., and Sitko, R.: A random forest model for Norway spruce and Scots pine tree rings in Europe, EGU General Assembly 2025, Vienna, Austria, 27 Apr–2 May 2025, EGU25-15559, https://doi.org/10.5194/egusphere-egu25-15559, 2025.

EGU25-16154 | ECS | Orals | BG3.12

How repeated droughts impact the stability of the Amazon forest 

Johanna Van Passel, Ben Somers, Koenraad Van Meerbeek, Wanda De Keersmaecker, and Paulo Bernardino

The Amazon forest has traditionally served as an important carbon sink, but mounting evidence suggests that it is transitioning into a carbon source. This shift is driven by both local and regional disturbances, including extreme drought events. To anticipate how the Amazon may respond to climate change, we analysed its response to recurrent extreme drought events using satellite data.

Our study explored the concept of stability through multiple lenses. We first examined how the Amazon forest responded to individual droughts, considering the legacy effects of preceding droughts and wet periods. Then, we also quantified the stability of the Amazon in response to cumulative drought impacts, assessing its potential transition to a degraded ecosystem when a critical precipitation threshold is crossed.

We found that more severe droughts caused a more pronounced decrease in canopy vitality within a year following the event. Moreover, the response of the Amazon was influenced by legacy effects: recent dry periods reduced the forest’s stability, while preceding wet events mitigated the drought impact. Increased drought frequency also led to signs of critical slowing down in the Amazon forest vegetation. Regions experiencing more intense and prolonged droughts were more vulnerable to this phenomenon, although the severity of impacts varied regionally.

In summary, while the Amazon forest has shown resilience to past extreme drought events, the predicted increase in drought intensity and duration is likely to amplify critical slowing down across the forest, particularly in the more seasonal southern regions. The intricate connection between the Amazon forest vegetation and its water sources could trigger cascading effects, leading to further stability loss with global repercussions.

How to cite: Van Passel, J., Somers, B., Van Meerbeek, K., De Keersmaecker, W., and Bernardino, P.: How repeated droughts impact the stability of the Amazon forest, EGU General Assembly 2025, Vienna, Austria, 27 Apr–2 May 2025, EGU25-16154, https://doi.org/10.5194/egusphere-egu25-16154, 2025.

EGU25-16445 | Posters on site | BG3.12

National-scale mapping of soil moisture and nutrient regimes in Norwegian forests 

Stephanie Eisner, Clara Antón Fernández, Paul McLean, and Rasmus Astrup

Recent drought events in the Nordic have led to an uptick in drought damage and forest mortality particularly in Norway spruce, either as consequence of the drought itself or caused by subsequent bark beetle attacks. In Norway, this has sparked a debate about existing spruce plantations on unsuitable sites, i.e. sites with insufficient moisture supply, and the need for alternative management strategies. However, identifying those sites at highest risk necessitates a high-resolution, national-scale map of soil water retention characteristics which does not exist. In order to overcome the paucity of mapped soil information relevant for forest management decisions and particularly species selection, we combine registrations from the national forestry inventory (NFI), machine learning and various landscape covariates to qualitatively map soil moisture and nutrient regimes of forest soils at national scale.

In detail, we used registrations of vegetation type from the NFI to classify all plots along seven soil moisture classes (wet to dry) and five soil nutrient classes (poor to rich) placing each plot on an edaphic grid showing relative moisture and nutrient regimes. We employed machine learning, i.e.  boosted regression tress, to develop models that predict the probability of belonging to a certain class based on an extensive set of potential predictor variables. These include high-resolution maps and data products covering climate, land cover, terrain characteristics and soil parent material as well as remotely sensed information on forest structure (airborne laser scanning) and spectral vegetation properties (Sentinel-2).  

Results showed on overall good agreement between field registrations and predicted soil moisture and nutrient class. We found that models utilizing remotely sensed information on vegetation structure and spectral properties performed significantly better than those that solely relied on climatic and physiographic information.

How to cite: Eisner, S., Antón Fernández, C., McLean, P., and Astrup, R.: National-scale mapping of soil moisture and nutrient regimes in Norwegian forests, EGU General Assembly 2025, Vienna, Austria, 27 Apr–2 May 2025, EGU25-16445, https://doi.org/10.5194/egusphere-egu25-16445, 2025.

EGU25-16479 | ECS | Posters on site | BG3.12 | Highlight

Monitoring forest dieback phenomenon in Italy: the key role of the SilvaCuore application 

Maria Castellaneta, Marco Borghetti, Michele Colangelo, Angelo Rita, Giacomo Colle, Martina Pollastrini, Filippo Bussotti, Giovanni Iacopetti, Salvatore Seddaiu, Pino A. Ruiu, Bruno Scanu, Giovanni Piras, Andrea Lentini, Donato Salvatore La Mela Veca, Eustachio Tarasco, Agatino Sidoti, and Francesco Ripullone

Over the last years several forest dieback and mortality phenomena were reported across the Italian Peninsula underline an enhanced forest vulnerability due to the occurrence of extreme climate events, such as heat waves and severe droughts. During summer 2024 acute and extensive impacts, with severe defoliation, dieback and mortality, on Mediterranean forests (Quercus ilex, Quercus suber, Phillyrea spp. and several other sclerophyllous shrubs) were detected in various regions of Italy predominantly in Apulia, Sardinia and Sicily. Currently, in Italy as well as in other Mediterranean countries is lacking a clear picture of this emerging phenomenon, of the forest species more sensitive and the quantification of the affected forest surfaces. It is, therefore, necessary to improve the monitoring network within the regional territories to assess environmental drivers and dynamics of impacts with a multidisciplinary approach that includes ecophysiological and phytopathological aspects. In this contest, the SilvaCuore application, the first App designed in Italy by the University of Basilicata and Effetreseizero S.r.l., as a part of a Citizen Science project, can play a key role to survey declining forest stands within the Italian territory. The support of an active users’ community can not only allow researchers to survey declining forest sites, but also to better plan research activities and management measures. Specifically, SilvaCuore is a Web-application that can be used directly from smartphone, tablet or PC, and drives the user in reporting information step by step with few simple clicks thanks to a user-friendly interface. The data to be provided are the tree species, symptom detected (i.e. defoliation, drying crown, bark necrosis etc.), the uploading of some descriptive photos and the geo-localization on the map. In this context, the App allowed to identify most of the affected areas by mapping the extension and contributing to the development of a valuable scientific database in Italy. Monitoring of forest health is crucial for implementing appropriate adaptive management strategies and for improving the resilience of declining stands. Indeed, the selection approach may drive the existing legislation and forest management still ill-suited to the current conditions of forest stands affected by climate change.

How to cite: Castellaneta, M., Borghetti, M., Colangelo, M., Rita, A., Colle, G., Pollastrini, M., Bussotti, F., Iacopetti, G., Seddaiu, S., Ruiu, P. A., Scanu, B., Piras, G., Lentini, A., La Mela Veca, D. S., Tarasco, E., Sidoti, A., and Ripullone, F.: Monitoring forest dieback phenomenon in Italy: the key role of the SilvaCuore application, EGU General Assembly 2025, Vienna, Austria, 27 Apr–2 May 2025, EGU25-16479, https://doi.org/10.5194/egusphere-egu25-16479, 2025.

EGU25-18669 | Orals | BG3.12

Mapping individual tree mortality using sub-meter Earth observation data: Advances toward a large-scale global database 

Samuli Junttila, Anis Rahman, Einari Heinaro, Antti Polvivaara, Mete Ahishali, Minna Blomqvist, Tuomas Yrttimaa, Nataliia Rehush, Markus Holopainen, Eija Honkavaara, Juha Hyyppä, Ville Laukkanen, Mikko Vastaranta, Heli Peltola, Clemens Mosig, Teja Kattenborn, Kristjan Ait, Miroslav Svoboda, Yan Cheng, and Stephanie Horion

The increasing frequency and intensity of droughts and heat waves driven by climate change have led to a significant increase in tree mortality worldwide. However, the lack of accurate and consistent data on the location, timing, species, and structure of dead trees across vast geographical areas limits our understanding of climate-induced tree mortality. Furthermore, standing dead and dying trees are crucial indicators of forest health and biodiversity but are often overlooked in existing forest resource mapping systems.

To address this, we present novel advancements in mapping individual tree mortality events using high-resolution (≤ 0.5 m) multi-temporal Earth Observation data, including both satellite and aerial imagery, combined with deep learning techniques. Our approach represents the first steps towards building an open large-scale database of individual tree mortality events across time. We have trained several U-Net-based deep learning models for detecting individual dead and dying trees from a wide array of imagery, including high-resolution aerial and satellite imagery from boreal, temperate, and Mediterranean forest biomes, enabling the creation of wall-to-wall datasets on tree mortality at national scales. We show results from the first nationwide individual tree mortality mapping, demonstrating the accuracy of sub-meter resolution satellite imagery in providing annual tree mortality data. We also discuss the challenges and limitations associated with detecting and characterizing detected dead trees across entire countries. 

Currently, our database already includes tree mortality data for 10 years in boreal, temperate, and Mediterranean forest biomes for several countries. We welcome scientists from around the globe to contribute to creating a database on individual tree mortality events to support a wide range of tree mortality data needs in different scientific disciplines.

How to cite: Junttila, S., Rahman, A., Heinaro, E., Polvivaara, A., Ahishali, M., Blomqvist, M., Yrttimaa, T., Rehush, N., Holopainen, M., Honkavaara, E., Hyyppä, J., Laukkanen, V., Vastaranta, M., Peltola, H., Mosig, C., Kattenborn, T., Ait, K., Svoboda, M., Cheng, Y., and Horion, S.: Mapping individual tree mortality using sub-meter Earth observation data: Advances toward a large-scale global database, EGU General Assembly 2025, Vienna, Austria, 27 Apr–2 May 2025, EGU25-18669, https://doi.org/10.5194/egusphere-egu25-18669, 2025.

EGU25-18995 | Posters on site | BG3.12

XLA Petiole Index: A Novel Hydraulic Function Metric for Interpreting Drought-Induced Dieback in Mediterranean Ring-Porous Oak Forests 

Michele Colangelo, Carmine Guadagno, Castellaneta Maria, Ripullone Francesco, and Borghetti Marco

Climate-induced forest mortality is an increasing global phenomenon occurring at both regional and local scales, with implications for ecosystem functioning and the provision of essential ecosystem services. In recent years, the Italian peninsula has experienced widespread oak forest decline, with forests showing increased susceptibility to severe heat waves and prolonged droughts. Our study examined a drought-induced tree mortality episode in the Mediterranea region (Pollino National Park, Southern Italy) focusing on deciduous oak forest stands (Quercus frainetto Ten.). We employed a comprehensive approach, combining ecophysiological and dendro-ecological analyses to compare non-decaying (ND) and decaying (D) coexisting trees. Recent advancements in understanding the relationship between petiole xylem anatomy and leaf form and function have revealed a positive correlation between petiole vessel diameter and leaf size, both within and across species. Leaf petioles, serving as the singular entry point for water into the leaf venation system, offer a standardized basis for comparing xylem investment with downstream transpirational demands. To quantify this relationship, we employed a novel index derived from quantitative wood anatomy of petioles. This integrative trait characterizes leaf water transport function by measuring the ratio of cross-sectional xylem area (XA) at the petiole to the downstream leaf area, termed the XLA petiole Index. Our assessment of XLA petiole variation can provide evidence supporting a safety-efficiency trade-off in oak leaves, a crucial aspect of plant hydraulic strategy.

How to cite: Colangelo, M., Guadagno, C., Maria, C., Francesco, R., and Marco, B.: XLA Petiole Index: A Novel Hydraulic Function Metric for Interpreting Drought-Induced Dieback in Mediterranean Ring-Porous Oak Forests, EGU General Assembly 2025, Vienna, Austria, 27 Apr–2 May 2025, EGU25-18995, https://doi.org/10.5194/egusphere-egu25-18995, 2025.

EGU25-20026 | ECS | Orals | BG3.12

Assessing Tree Response to Climatic Stressors: Insights from IoT-Driven Forest Monitoring 

Jim Yates, Francesco Renzi, Shahla Asgharinia, and Riccardo Valentini

Forest ecosystems are increasingly affected by intensified disturbance regimes driven both localized and larger scaled climate variation, with impacts on tree growth, physiological processes, and ecosystem productivity. This study utilizes an IoT-enabled sensor network to monitor forest dynamics in a Quercus cerris L. stand, aiming to assess tree responses to climatic variability over two consecutive years, 2021 and 2022.

High-frequency data on radial growth, sap flux density, spectrometric observations, rainfall, stem saturation percentage, temperature and humidity, were collected, providing a comprehensive view of tree-level responses to environmental drivers. Preliminary results suggest a notable reduction in radial growth in 2022 compared to 2021, alongside variations in sap flow and differences in leaf out periods across both years. Furthermore, noticeable differences in both seasonal patterns of RH and Temperature collected by the network of sensors are evident. These changes appear to align with shifts in climatic conditions, particularly precipitation patterns across each year, though the precise mechanisms remain to be fully explored.

The study highlights the potential of IoT-enabled monitoring systems to uncover complex interactions between climate drivers and forest dynamics, offering valuable insights into tree vulnerability. By analyzing diverse datasets, this research contributes to understanding forest sensitivity to climatic stressors and informs the development of adaptive management strategies for sustaining forest health and productivity under changing environmental conditions.

How to cite: Yates, J., Renzi, F., Asgharinia, S., and Valentini, R.: Assessing Tree Response to Climatic Stressors: Insights from IoT-Driven Forest Monitoring, EGU General Assembly 2025, Vienna, Austria, 27 Apr–2 May 2025, EGU25-20026, https://doi.org/10.5194/egusphere-egu25-20026, 2025.

Drought is increasingly recognized as a critical driver of forest dynamics, altering tree species' dominance, growth, and survival. To better understand these dynamics, we tested a recently developed predisposing-inciting (PI) framework for drought-related tree mortality within the forest gap model ForClim v4.1, focusing on two key European species: European beech (Fagus sylvatica) and Norway spruce (Picea abies). To better capture contributing factors of drought-related stress, we also developed a bark beetle module for Norway spruce to better account for interactions between abiotic and biotic stress factors.

Our study addressed three hypotheses:

  • The PI framework remains effective across broader ecological and climatic ranges beyond its initial application.
  • Soil water holding capacity (AWC) exerts a significant influence on drought-induced mortality, complementing climatic drivers.
  • Reduced soil heterogeneity amplifies mortality risks by limiting microsite variability, thereby exacerbating drought stress.

We conducted simulations across hundreds of ICP-Level II sites in Germany, spanning diverse climate and soil gradients.

Results indicate that ForClim can reproduce general patterns of drought-induced mortality, though mismatches in magnitude and trends highlight areas for improvement. Discrepancies were attributed to sparse mortality data, the drought sensitivity of the bark beetle submodule, and limited regional calibration. 

Soil water availability emerged as a critical driver of drought resilience. Sites with low AWC experienced significantly elevated mortality rates, while high AWC provided a buffering effect, bringing modeled outcomes closer to observed data. Furthermore, soil heterogeneity played a mitigating role: sites with uniform soils exhibited higher mortality risks, thus emphasizing the importance of spatial variability in dampening drought impacts.

This study underscores the value of process-based models like ForClim in disentangling the mechanisms underlying forest vulnerability and drought-induced mortality. However, improvements such as finer-resolution mortality and crown condition data, as well as regional model calibration, are essential to enhance predictive accuracy. By advancing our understanding of drought-induced mortality, these findings contribute to better forecasting and management of forest resilience under current and future climate scenarios.

How to cite: Marano, G., Hiltner, U., Knapp, N., and Bugmann, H.: Simulating drought-driven mortality of European Beech and Norway Spruce in German forests:insights on predisposing, inciting and contributing factors, EGU General Assembly 2025, Vienna, Austria, 27 Apr–2 May 2025, EGU25-20770, https://doi.org/10.5194/egusphere-egu25-20770, 2025.

EGU25-3534 | ECS | Posters on site | BG3.13

Growth and herbivore defense of clonal plants under single and combined modes of interconnection 

Yuanhao Zhang, Mark Anthony, Enjian Chen, and Shaolin Peng

Both clonal plant capabilities for physiological integration and common mycorrhizal networks (CMNs) formed by arbuscular mycorrhizal fungi (AMF) can influence the growth and insect resistance among interconnected individuals. Using a microcosm model system, we disentangled how CMNs interact with clonal integration to influence plant growth, development and herbivore defense. We grew Sphagneticola trilobata clones with isolated root systems in individual, adjacent containers while preventing, disrupting, or allowing clonal integration aboveground via spacers and belowground CMNs to form. We assessed multiple metrics of plant development, 15N transfer from donor (mother) to receiver (daughter) plants, variation in AMF communities, and changes in chemical defenses. We show that spacer formation between ramets and the capacity to form CMNs promoted and inhibited the growth of smaller, daughter plants, respectively. However, the effects on defense signals were inconsistent. When the two modes of interconnection co-occurred, CMNs significantly weakened promotion of daughter plants by clonal integration but enhanced the defense signal transmittance. AMF species richness was also negatively correlated with overall plant growth. Our results demonstrate that two common modes of plant interconnection interact in non-additive ways to affect clonal plant integration, growth and defense, questioning the underlying assumptions of the positive effects of both AMF CMNs and species richness in comparison to direct plant interconnections.

How to cite: Zhang, Y., Anthony, M., Chen, E., and Peng, S.: Growth and herbivore defense of clonal plants under single and combined modes of interconnection, EGU General Assembly 2025, Vienna, Austria, 27 Apr–2 May 2025, EGU25-3534, https://doi.org/10.5194/egusphere-egu25-3534, 2025.

EGU25-3980 | ECS | Orals | BG3.13

The influence of active restoration of tropical rainforests on ecosystem carbon sequestration: potential links with ectomycorrhizal fungi 

Nadine Keller, Andrea Jilling, Lian Pin Koh, and Mark A. Anthony

Active forest restoration in tropical forests of Southeast Asia may alter mycorrhizal community structures with consequences for carbon sequestration at the ecosystem scale. While tropical rainforests are generally dominated by arbuscular mycorrhizal fungi, restoration efforts in Southeast Asia often entail the planting of tree species from the family Dipterocarpaceae (short: dipterocarps), which form associations with ectomycorrhizal fungi. With increased cover of dipterocarps, we expect a concomitant increase in ectomycorrhizal fungi and in turn altered forest biogeochemistry. In particular, an increase in the occurrence of ectomycorrhizal fungi could boost ecosystem carbon sequestration in actively restored compared to naturally regenerating forests via the suppression of decomposition belowground and enhancement of aboveground biomass. We tested this hypothesis at a restoration site in Sabah, Malaysian Borneo, which was selectively logged in the 1980s – 1990s and partly restored with enrichment planting and accompanying silvicultural interventions. In contrast to expectation, our results show that a higher density of trees forming symbioses with ectomycorrhizal fungi is associated with lower soil carbon stocks and altered biodiversity of soil fungi. These results highlight the need to better understand how active restoration of tropical rainforests may alter the net potential of these ecosystems to sequester carbon, and that fungi, not trees alone, can control carbon storage outcomes.

How to cite: Keller, N., Jilling, A., Koh, L. P., and Anthony, M. A.: The influence of active restoration of tropical rainforests on ecosystem carbon sequestration: potential links with ectomycorrhizal fungi, EGU General Assembly 2025, Vienna, Austria, 27 Apr–2 May 2025, EGU25-3980, https://doi.org/10.5194/egusphere-egu25-3980, 2025.

EGU25-6078 | ECS | Posters on site | BG3.13

Fungi and tree growth facilitation in European forests under drought conditions. 

Christos Papakoutis, Manuel Walde, Yann Vitasse, Artin Zarsav, and Mark Anthony

Droughts in forest ecosystems are a central concern for current and future biodiversity loss, carbon sequestration, and ecosystem functioning. Trees rely on symbiotic relationships with fungi to enhance nutrient uptake and improve stress tolerance, but the impacts of drought on plant-fungal relationships remain unclear and vary across different tree species compositions. This study investigated how inter- and intraspecific interactions among three prominent tree species in European forests—Fagus sylvatica (European beech), Quercus petraea (Sessile oak), and Tilia cordata (small-leaved lime)—shift under simulated drought conditions in relation to their rhizosphere fungal communities. We hypothesized that drought would shift the diversity and functional capacity of fungal communities, with these effects being dependent on the tree species and competitive context. To test this, we set up raised-bed experiments with seedlings of the three species as mono- or polycultures, exposing them to ambient rainfall conditions or two years of reduced precipitation using plastic roofing. We assessed tree seedling growth and development, and at the end of the experiment, we sampled rhizosphere soils from individual trees to characterize fungal diversity using full-length ITS DNA metabarcoding on an Oxford Nanopore Technology PromethION platform. Intraspecific versus interspecific competition provided more favourable conditions for tree growth under drought conditions. Our results show that fungal communities were responsive to variations in plant species, competitive context, and drought, and that fungal biodiversity explained unique patterns in plant growth responses to drought and competition, particularly for plant-symbiotic ectomycorrhizal fungi. This study highlights the variable effects of drought on fungal communities and underscores the importance of species-specific interactions in forest ecosystem responses to climate stress. These findings contribute to our understanding of the ecological role of fungi in forest species' resilience to climate change and may inform future forest management strategies aimed at mitigating the effects of drought in temperate regions.

How to cite: Papakoutis, C., Walde, M., Vitasse, Y., Zarsav, A., and Anthony, M.: Fungi and tree growth facilitation in European forests under drought conditions., EGU General Assembly 2025, Vienna, Austria, 27 Apr–2 May 2025, EGU25-6078, https://doi.org/10.5194/egusphere-egu25-6078, 2025.

EGU25-6330 | Orals | BG3.13 | Highlight

Mycorrhizal networks and mother trees – what is theoretically possible? 

Oskar Franklin, Nils Henriksson, Mona N. Högberg, John Marshall, and Torgny Näsholm

Mycorrhizal fungi connect with plant roots and facilitate exchange of nutrients (N) and carbon (C) in a symbiotic relationship between fungi and plants, sometimes linking multiple plants in a mycorrhizal network. The question is, do such networks support resource sharing among plants?  In this talk I will discuss potential mechanisms of resource transfer among plants and their plausibility based on current theory and empirical knowledge. Mycorrhizal networks have sparked a huge interest not only among ecologists but also in popular media, where it has become a “wood wide web” claimed to serve as the trees’ internet for communication and as a social support system for sharing resources. As the stories have moved far beyond the scientific evidence, a debate has started among scientists about the true nature of the network and its ecological role. Because of the dynamic and cryptic existence of fungal hyphae underground, and the many other potential ways resources can move in the soil, it has been difficult to obtain reliable quantifications of C and N transport between plants through the network. In absence of empirical facts, theoretical models may guide us in terms of what is possible or likely, based on the principles of nature and our current state of knowledge. The classic C-N trading relationship between single plants and fungi is well established and more recent market models can also explain differentiation among multiple trading partners, as well as stabilizing ecosystem level feedbacks. It is more challenging to explain resource transfers in the opposite direction, such as a C transport from fungi to plants, which is necessary for trees to supply carbon to other trees via the mycorrhizal network as implied by the mother-tree hypothesis. Do we need more complex market models, or are there completely different mechanisms at work?

How to cite: Franklin, O., Henriksson, N., N. Högberg, M., Marshall, J., and Näsholm, T.: Mycorrhizal networks and mother trees – what is theoretically possible?, EGU General Assembly 2025, Vienna, Austria, 27 Apr–2 May 2025, EGU25-6330, https://doi.org/10.5194/egusphere-egu25-6330, 2025.

EGU25-6851 | Orals | BG3.13

Biotrophic root-fungal systems of beech and spruce acclimatised to five years of repeated experimental drought. 

Fabian Weikl, Jasmin Danzberger, Kyohsuke Hikino, Thorsten Grams, and Karin Pritsch

The Kranzberg Roof Experiment investigates the impact of five years of recurrent drought and subsequent recovery in a mature forest of European beech (Fagus sylvatica L.) and Norway spruce (Picea abies [L.] KARST).

Within this framework, we studied fine-root-associated fungal communities, fine-root vitality, and ectomycorrhizal functionality in relation to mixed and monospecific tree root zones.

Changes in the fungal community peaked in the third year of drought but later stabilised, indicating a gradual acclimatisation to drought over time that was maintained during early recovery. Thereby, tree species was the dominant factor in structuring root-associated fungal functional groups, suggesting a strong relationship with tree-species-specific fine-root reactions to drought.

However, the trees’ root-fungal systems were functionally resilient, and the system's capabilities were mainly quantitatively affected due to the loss of surviving fine roots. 

This fits well with results that quantitative effects (e.g., fewer leaves – fewer fine roots) may have driven tree acclimation. Beyond that, it suggests that the surviving root-fungal systems (i.e., ectomycorrhizal root tips) functioned as moist islands within dried-out soil, kept alive by an interplay between tree-redistributed water and fungal symbionts. Elucidating this is one of the challenging topics for the final phase of the Kranzberg Roof Experiment, a terminal drought now beginning.

How to cite: Weikl, F., Danzberger, J., Hikino, K., Grams, T., and Pritsch, K.: Biotrophic root-fungal systems of beech and spruce acclimatised to five years of repeated experimental drought., EGU General Assembly 2025, Vienna, Austria, 27 Apr–2 May 2025, EGU25-6851, https://doi.org/10.5194/egusphere-egu25-6851, 2025.

EGU25-7677 | Posters on site | BG3.13

Global-Scale Host Effects in Shaping Ectomycorrhizal Fungal Communities 

Weile Chen, Yin Yang, and Shuang Liang

Nearly two-thirds of Earth’s trees form symbiotic relationships with ectomycorrhizal (EM) fungi, which play a critical role in shaping tree growth and rhizosphere biogeochemistry through functionally diverse communities. While local studies suggest that tree species or genera host distinct EM fungal communities, the global consistency of these host effects remains unclear. To address this, we analyzed root-associated EM fungal communities across 10 cosmopolitan tree genera at 204 forest sites worldwide. Our global dataset demonstrates that host tree genera consistently influences EM fungal composition across local to global scales. Specifically, long-distance exploratory fungi are predominantly associated with Pinus, while medium-distance, short-distance, and contact exploration types are more common in Betula/Alnus, Populus, and Acer, respectively. Network analysis reveals frequent partner specificity, including the well-documented Pinus-Suillus association and novel symbioses involving both coniferous and broadleaved hosts. These specific EM partnerships often persist across vast environmental gradients, though the relative abundance of fungal partners may vary. Our findings advance the understanding of global tree-fungal symbioses and provide a framework for predicting the biogeography and functional dynamics of this essential mutualism.

How to cite: Chen, W., Yang, Y., and Liang, S.: Global-Scale Host Effects in Shaping Ectomycorrhizal Fungal Communities, EGU General Assembly 2025, Vienna, Austria, 27 Apr–2 May 2025, EGU25-7677, https://doi.org/10.5194/egusphere-egu25-7677, 2025.

EGU25-8280 | ECS | Orals | BG3.13

Is leaf spectral reflectance an integrator of mycorrhizal types? 

Thomas Guzman, Jean-Baptiste Féret, Jérôme Ogée, Pierre Petriacq, Yves Gibon, Josep Valls-Fonayet, Thomas Dussarrat, Nicolas Devert, Cédric Cassan, Amélie Flandin, and Lisa Wingate

Light reflectance by foliage across visible and infrared wavebands is determined by chemical and structural traits that reveal how plants evolved to support growth and defense in different climate and environments. These spectral fingerprints have emerged as powerful tools to estimate plant functional and taxonomic diversity across scales, giving rise to a new approach in ecology called spectranomics. In this context, the widespread co-evolution of plants with different mycorrhizal fungi has likely led to chemical, structural and thus spectral dissimilarities that are strong enough to be intrinsic features of each mycorrhizal association. Such spectral dissimilarities may therefore help to better estimate the mycorrhizal dominance and associated belowground functions at large scales using remote sensing techniques. From a combination of chemical and spectral measurements on leaves of 32 European tree species forming either arbuscular (AM) or ectomycorrhizal (EM) symbiosis, we investigated the existence of “mycorrhizal optical types” and the leaf traits that may underpin them. Our results demonstrate that tree species associated with AM and EM fungi have distinct leaf colour and spectral fingerprints that can be linked to differences in leaf metabolism. In this talk, I will discuss the various factors that may have led to these spectral fingerprints as well as the potential and constraints of aboveground spectral signals acquired at the large scale to serve as optical surrogates of plant mycorrhizal associations and belowground function.

How to cite: Guzman, T., Féret, J.-B., Ogée, J., Petriacq, P., Gibon, Y., Valls-Fonayet, J., Dussarrat, T., Devert, N., Cassan, C., Flandin, A., and Wingate, L.: Is leaf spectral reflectance an integrator of mycorrhizal types?, EGU General Assembly 2025, Vienna, Austria, 27 Apr–2 May 2025, EGU25-8280, https://doi.org/10.5194/egusphere-egu25-8280, 2025.

EGU25-8935 | ECS | Posters on site | BG3.13

Nitrogen dynamics and mycorrhizal interactions between ectomycorrhizal and ericoid mycorrhizal plants 

Jasmin Danzberger and Nils Henriksson

Mycorrhizal fungi are critical players in nutrient dynamics within forest ecosystems. Although typically associated with specific plant groups, evidence suggests that some species of ericoid mycorrhizal fungi can colonise ectomycorrhizal plants, and vice versa, with potential for nutrient exchange across these associations. Carbon (C) transfer from plants to mycorrhizal fungi and reciprocal nitrogen (N) transfer from fungi to plants are well-established processes. However, single studies report N loss from pine seedlings associated with mycorrhizal fungi and forest ground vegetation underscoring the complexity of these interactions.

Our study investigates whether such cross-functional colonisations may occur between Pinus sylvestris seedlings and Calluna vulgaris plants, and if they result in measurable N transfer, and evaluates the direction and magnitude of N movement between these plants and their mycorrhizal symbionts.

Therefore, we planted C. vulgaris plants in pots alongside 15N-labelled pine seedlings with varying degrees of interspecies connectivity: full root and hyphal contact, hyphal contact only, disrupted hyphal contact, and no contact. Some pots were enriched with additional nitrogen to assess the influence of nutrient availability on fungal-mediated nutrient transfer. Nitrogen transfer was quantified by measuring 15N content in roots and shoots of both species, as well as in fungal hyphae grown in ingrowth bags. To identify shared fungal taxa, we performed ITS sequencing on fungal communities associated with both C. vulgaris and pine roots.

To assess C exchange and hyphal connectivity, pine seedlings were 13C-labeled, allowing us to trace 13C allocation to fungal hyphae and C. vulgaris. Additionally, fungal biomass and enzyme activity were analysed to provide a detailed understanding of fungal contributions to nutrient dynamics.

In boreal forests, the field vegetation is frequently dominated by ericaceous dwarf shrubs, and their interactions with tree seedlings can therefore have far-reaching implications. This is particularly true if forest management practices change, for instance if the use of mechanical site preparation were to be reduced.  Our study aims to elucidate the mechanisms underlying nitrogen and carbon fluxes in mixed ectomycorrhizal-ericaceous systems, providing insights into nutrient sharing and potential ecological implications in forest ecosystems.

How to cite: Danzberger, J. and Henriksson, N.: Nitrogen dynamics and mycorrhizal interactions between ectomycorrhizal and ericoid mycorrhizal plants, EGU General Assembly 2025, Vienna, Austria, 27 Apr–2 May 2025, EGU25-8935, https://doi.org/10.5194/egusphere-egu25-8935, 2025.

EGU25-10489 | ECS | Posters on site | BG3.13

Arbuscular mycorrhizal contribution to plant water supply 

Eva Demullier, Jérôme Ogée, Guillaume Rambert-Banvillet, Paul Arette-Hourquet, Ming Zeng, Nicolas Devert, Yangyang Dong, Nerea Ubierna, Nicolas Fanin, Congcong Zheng, Thomas Guzman, and Lisa Wingate

Understanding the adaptations of terrestrial plants to water stress is crucial as climate change is already altering precipitation patterns. Mycorrhizal fungi enhance host water status through indirect mechanisms like nutrient uptake or plant osmoregulation. Direct water transport via fungal hyphae has also been demonstrated, but its exact contribution to total plant water uptake is still debated.

To demonstrate and quantify the direct transport of water from arbuscular mycorrhizal fungi (AMF) to its host plant, we utilized a plant mesocosm comprised of two compartments, separated by a porous membrane and an air gap. In the ‘plant-hyphae’ compartment, seedlings of microtomatoes were grown and inoculated with Rhizophagus irregularis. Hyphae, rather than plant roots, could cross the physical barrier of the porous membrane and the air gap to enter the ‘hyphae-only’ compartment. After several weeks of plant and hyphal growth, the ‘hyphae-only’ compartment was labelled with deuterated water (2H2O) and the isotopic composition of plant transpiration and soil water of both compartments were determined at different times after irrigation.

The presence of deuterated water in the plant transpiration stream confirmed that there was direct water transport via AMF hyphae to the plant. Previous studies have quantified the relative contribution of fungal-transported water by solving an isotope mass balance that includes the leaf transpired water and water extracted from soils of both ‘plant-hyphae’ and ‘hyphae-only’ compartments. This framework assumes that movement of deuterated water from the ‘hyphae-only’ to the ‘plant-hyphae’ compartment occurs only through fungal hyphae. However, we found that there was also diffusion of deuterated water vapour across the air gap separating the two compartments. This contamination led to overestimations of the relative contribution of AMF to total plant water uptake. After accounting for this contamination, the water contributed by AMF hyphae was quantified to 1% to 6% of total plant water uptake. Furthermore, using plant biomass as a weighing factor in the mixing model to account for differences in soil volume exploration by plant roots was critical for an accurate estimate of the contribution.

How to cite: Demullier, E., Ogée, J., Rambert-Banvillet, G., Arette-Hourquet, P., Zeng, M., Devert, N., Dong, Y., Ubierna, N., Fanin, N., Zheng, C., Guzman, T., and Wingate, L.: Arbuscular mycorrhizal contribution to plant water supply, EGU General Assembly 2025, Vienna, Austria, 27 Apr–2 May 2025, EGU25-10489, https://doi.org/10.5194/egusphere-egu25-10489, 2025.

EGU25-12007 | Posters on site | BG3.13

Variation in ectomycorrhizal fungal exploration types 

Mark Anthony, Thomas Mansfield, and Artin Zarsav

Fungi are among the most diverse ecological communities with distinct roles in mediating terrestrial biogeochemical cycles. Plant associated mycorrhizal fungi provide vital nutrients to host plants, but their ecological strategies vary across guilds. Ectomycorrhizal fungi associate with >60% of trees on Earth, possessing distinct capacities for decomposition, nutrient uptake, and soil exploration due to variation in their niches and distributions. Recently, we demonstrated the ectomycorrhizal fungal composition is linked to continental scale forest productivity across Europe. Differences in ectomycorrhizal fungal exploration types based on the quantity and composition of emanating hyphae and associated traits help explain this connection. What factors define and shape the ecological strategy of ectomycorrhizal fungal exploration can provide fundamental insight into their differential roles in forests. To address this, we compared genomic variation and modeled species distribution patterns of ectomycorrhizal fungal taxa from different exploration types. The exploration type concept has received considerable scrutiny because it can vary within an individual species, has not been sufficiently investigated across a wide range of taxa, and local distributional patterns often vary across disparate studies. These are important short comings of the exploration type trait that I will discuss. Despite limitations, we observe clear signatures of fungal exploration type in fully sequenced fungal genomes and in species distribution patterns across Europe. Our results emphasize that biomass production volume and rhizomorph formation are important sub-traits of exploration types. We further demonstrate that exploration types often merged into single exploration categories should be separated to observe distinct distributional patterns. Our results also provide insight into which ectomycorrhizal fungal traits are associated with forest nitrogen and phosphorus limitations and in turn overall forest productivity.

How to cite: Anthony, M., Mansfield, T., and Zarsav, A.: Variation in ectomycorrhizal fungal exploration types, EGU General Assembly 2025, Vienna, Austria, 27 Apr–2 May 2025, EGU25-12007, https://doi.org/10.5194/egusphere-egu25-12007, 2025.

EGU25-15087 | ECS | Posters on site | BG3.13

From Ashes to Insights: Mycorrhizal Fungi Functions in Post-Fire Landscapes 

Solomon Maerowitz-McMahan, Adam Frew, Chris Gordon, Rachael Nolan, and Jeff Powell

Communities in fire-affected ecosystems possess unique traits that aid survival and ecosystem recovery post-fire. As fires increase in frequency and intensity due to climate change, we enter a time increasingly influenced by fire therefore understanding the functions of these communities in forested systems is essential. While previous work has been done on the presence or absence of mycorrhizal fungi post-fire, generally using DNA-based approaches, there is limited knowledge about the functions they serve. This work aimed to identify functional traits of mycorrhizal fungi that correlate with fire regime and vegetative composition.

Thirty dry sclerophyll forest sites surrounding the Sydney basin that burned in the 2019-2020 black summer fires of Australia were selected based on historical gradients in fire severity and interval. Vegetative composition, fungal communities as well as soil carbon and nutrient availability were analysed from each site, from these, a subset of sites were selected for further study to distinguish direct (via effects on fire regimes) and indirect (via effects on nutrient availability) on mycorrhizal fungal functional traits associated with biomass production, hyphal chemistry (carbon, nitrogen, and phosphorus concentrations). For this, we harvested mycorrhizal fungal biomass using mesh in-growth bags filled with plastic resin-beads that absorb mineralized nutrients.

Available nutrients influenced mycorrhizal fungal community structure and biomass production in material collected from in-growth bags, whereas fire regime and vegetative structure had no effect. Hyphal chemistry was not significantly associated with nutrient availability, vegetative structure, or fire regime. In contrast, soil-derived data revealed significant effects of fire frequency on community structure, but no influence of nutrient availability or vegetative structure.

By integrating responses related to functional traits, fungal community composition, vegetation structure, and environmental factors, we aim to understand not only the functions that individual fungi provide in forested systems but also how these communities function collectively. We highlight the contrasting effects of fire frequency and nutrient availability on mycorrhizal communities in soil compared to those collected with mesh in-growth bags. These differences in community structure across sites likely reflect fungal growth strategies and their sensitivity to nutrient availability.

How to cite: Maerowitz-McMahan, S., Frew, A., Gordon, C., Nolan, R., and Powell, J.: From Ashes to Insights: Mycorrhizal Fungi Functions in Post-Fire Landscapes, EGU General Assembly 2025, Vienna, Austria, 27 Apr–2 May 2025, EGU25-15087, https://doi.org/10.5194/egusphere-egu25-15087, 2025.

EGU25-15545 | Posters on site | BG3.13

 Investigating differences in the metabolomes of ectomycorrhizal fungi and their link to GHG fluxes 

Paul Arette-Hourquet, Eva Demullier, Thomas Guzman, Josep Valls-fonayet, Nicolas Devert, Jérome Ogée, Pierre Petriacq, Nerea Ubierna-lopez, and Lisa Wingate

Mycorrhizal fungal species are widespread across nearly all ecosystems worldwide and are generally found in symbiotic association with most plant species. In forested ecosystems, mycorrhizal fungi play a crucial role in facilitating plant nutrient acquisition and defending the plant from abiotic and biotic stress events, such as drought or pathogen attack.

We have recently shown that different tree species that associate with either arbuscular mycorrhizal (AM) fungi or ectomycorrhizal (EM) fungi exhibit distinct phytochemical differences, that might be linked to the type of fungal symbiont. In this study, we investigated the metabolic diversity of several ectomycorrhizal (EM) fungal species commonly found in forests, with the aim of linking their metabolic toolkits to functional processes important in forest ecosystems, such as soil respiration and enzyme activities.

In this presentation, we show that ectomycorrhizal fungi contain a diverse suite of metabolites (> 10000 metabolic features in the 5 species studied) composed largely of lipids and benzenoids with many of these metabolic features serving as reliable predictors that facilitate the distinction of different EM fungal species from one another.

We also present the results of a microcosm gas exchange experiment on the 5 EM fungal species grown under controlled temperature and CO₂ concentration conditions to investigate the link between fungal metabolic profiles and primary functions, such as respiration and enzymatic activity.

This research aims to deepen our understanding of plant-fungal symbioses in forests and the potential shifts in plant and fungal metabolism and function during interaction with one another and when exposed to changes in climate and atmospheric chemistry.

Arette-Hourquet P., Demullier E., Ogée J., Guzman T., Valls-Fonayet J. Petriacq P., Devert N., Ubierna N. Wingate L.

How to cite: Arette-Hourquet, P., Demullier, E., Guzman, T., Valls-fonayet, J., Devert, N., Ogée, J., Petriacq, P., Ubierna-lopez, N., and Wingate, L.:  Investigating differences in the metabolomes of ectomycorrhizal fungi and their link to GHG fluxes, EGU General Assembly 2025, Vienna, Austria, 27 Apr–2 May 2025, EGU25-15545, https://doi.org/10.5194/egusphere-egu25-15545, 2025.

EGU25-16537 | ECS | Posters on site | BG3.13

Ectomycorrhiza: Back to the future 

Matthäus Ploderer, Magdalena Hasenzangl, Claudia Dielacher, Kolia Erlbacher, Irmgard Krisai-Greilhuber, Markus Gorfer, Ika Djukic, Barbara Kitzler, Kerstin Michel, Rainer Reiter, and Harald Berger

With forests covering roughly half of the Austrian land area, forest ecosystems have been monitored and characterized for centuries. While some aspects remain the same long-term, we are about to experience rapid changes due to climate change and loss of species. At the same time, emerging technologies like high throughput sequencing allow us to have deeper insights into the occurrence and diversity of species. For the hidden subsoil, metabarcoding of environmental DNA can uncover invisible soil life. This includes under-explored mycorrhizal fungi, especially species which do not regularly form fruiting bodies.

Supported by the Austrian biodiversity fund, the project „Zurück in die Zukunft“ (Back to the future) analyses archived forest soil samples from the past 32 years in order to capture diversity of ectomycorrhizal fungi. The dataset comprises samples from all federal states reaching from meadow forests of Pannonian regions to montane forests of the inner alps. Initial analyses detected >7000 fungal species, including >800 species of ectomycorrhizal fungi. The results provide an addition to already existing fungi databases of fruiting-body records. Fungal community composition is highly dependent on site-specific factors, which is thought to be explored using records of bio-geochemical data, vegetation and climate. By comparing the fungal communities of the 1990s, early 2000s and 2024, long-term changes and trends can be identified. The status of endangered species and potential neobiota in different habitats will be evaluated. We also aim to get a glance of future developments regarding forest ecosystems and their ecosystem functions.

How to cite: Ploderer, M., Hasenzangl, M., Dielacher, C., Erlbacher, K., Krisai-Greilhuber, I., Gorfer, M., Djukic, I., Kitzler, B., Michel, K., Reiter, R., and Berger, H.: Ectomycorrhiza: Back to the future, EGU General Assembly 2025, Vienna, Austria, 27 Apr–2 May 2025, EGU25-16537, https://doi.org/10.5194/egusphere-egu25-16537, 2025.

EGU25-17131 | ECS | Orals | BG3.13

Mid-Project Analysis of Carbon and Nitrogen Transfer in Boreal Forests Using Game Theory, Optimization and Fixed Ratios  

Joanna Simms, Elisa Stefaniak, Jaideep joshi, Pauliina Schiestl-Aalto, Oskar Franklin, Jussi Heinonsalo, and Annikki Mäkelä

Nitrogen availability often limits photosynthesis and growth in boreal forests, where nitrogen is a key constraint for plant productivity. Trees and other plants acquire nitrogen through a complex belowground interface comprising fine roots, symbiotic, and non-symbiotic microorganisms. To sustain this interface, photosynthetically derived carbon is allocated to fine root growth, mycorrhizal symbiosis, and exudation—either into the surrounding soil or directly to associated microbial communities. These exudates serve as critical energy sources for both symbiotic and non-symbiotic microbes, which, in turn, provide nitrogen to the tree through direct transfer or organic matter decomposition. This highlights the importance of the entire belowground infrastructure in the nitrogen acquisition of trees. 

This study investigates carbon-nitrogen dynamics in boreal forest ecosystems with an emphasis on eco-evolutionary processes and ecosystem function. Specifically, three nitrogen transfer strategies—game theory, optimization, and fixed ratios—are analysed from the perspectives of Scots pine roots and their ectomycorrhizal partners. This framework aims to illuminate the underlying relationships governing carbon exchange and nitrogen acquisition, contributing to ongoing debates on carbon source-sink dynamics and contrasting models of carbon allocation, including the "Surplus Carbon Hypothesis" and "Biological Market Models". 

The approach integrates a custom soil model, an adapted ectomycorrhizal model based on, a tree growth model (CASSIA), and a modified photosynthetic assimilation model (p-hydro) that incorporates nitrogen limitations. By including both symbiotic and non-symbiotic microbes, the study aims to capture nutrient cycling feedbacks, such as the priming effect, and explore microbial community shifts driven by functional dynamics. 

Incorporating seasonal variability and rigorous modelling of tree carbon storage, allocation, and exudation provides insights into how these patterns influence next year's growth and soil ecosystem functioning. Additionally, accounting for temperature and soil moisture effects enables the disentanglement of environmental influences from sugar inputs in driving belowground processes. This comprehensive framework offers a robust tool for understanding nutrient dynamics and tree-microbe interactions in boreal forests under changing environmental conditions. 

This work is in the calibration stage so preliminary results will be presented. These include soil-side results, such as trenching simulations to capture the change in microbial composition and their contribution to the priming effect. On the tree side; simulations including determination of differing root growth by the value of nitrogen in the optimisation of photosynthesis will be presented. Additionally, a comparison of three photosynthesis input models and two sugar allocation models within the CASSIA framework is conducted to evaluate the effects of differing modelling approaches. 

How to cite: Simms, J., Stefaniak, E., joshi, J., Schiestl-Aalto, P., Franklin, O., Heinonsalo, J., and Mäkelä, A.: Mid-Project Analysis of Carbon and Nitrogen Transfer in Boreal Forests Using Game Theory, Optimization and Fixed Ratios , EGU General Assembly 2025, Vienna, Austria, 27 Apr–2 May 2025, EGU25-17131, https://doi.org/10.5194/egusphere-egu25-17131, 2025.

EGU25-17953 | Orals | BG3.13

Clear-cut forestry has long-term effects on the community composition of ectomycorrhizal fungi in boreal forest 

Björn Lindahl, Karina Clemmensen, Johan Stendahl, and Anders Dahlberg

Rotation forestry based on clear-cutting is a common practice in boreal forests. Clear-cutting has detrimental short-term effects on ectomycorrhizal fungal communities, and the communities that re-establish after clear-cutting differ in species composition from old forests, but the long-term time trajectories of ectomycorrhizal fungal biomass, species richness and community composition in secondary forest remains uncertain. We collected soil samples from almost 1600 locations distributed systematically across Swedish coniferous forests, in conjunction with the Swedish National Forest and Forest Soil Inventories, and analysed ectomycorrhizal fungal communities by sequencing of amplified ITS2 markers.

We found that the relative abundance of ectomycorrhizal species in the fungal community increases to similar levels as before clear-cutting within two decades. In the following decades, species richness increases to a somewhat higher level than in old stands, peaking about 40 years after harvesting. Clear-cutting has strong and long-lasting effects on the composition of ectomycorrhizal fungal communities, with harvesting effects remaining for up to 100 years. Many species that attain high abundance in old forests (mainly certain Cortinarius and Russula species) are adapted to the acidic, unfertile soil conditions and have a well-developed capacity to mobilise nutrients from recalcitrant organic matter. These species are negatively affected by rotation forestry, which raises pH and increases nutrient availability.

This means that rotation forestry based on clear-cutting seems to be sustainable with regards to the abundance and species richness of ectomycorrhizal fungi, which return to pre-harvest levels well within the time limits of a rotation period and even reach somewhat higher levels than in old forests. However, rotation forestry progressively changes the ectomycorrhizal community at the landscape level. Many of the species that are characteristic of the predominantly nutrient poor and acidic boreal forests decrease in abundance. This declining community is also likely to contain many rare species, which risk extinction in large areas if transformation of the forest landscape proceeds.

How to cite: Lindahl, B., Clemmensen, K., Stendahl, J., and Dahlberg, A.: Clear-cut forestry has long-term effects on the community composition of ectomycorrhizal fungi in boreal forest, EGU General Assembly 2025, Vienna, Austria, 27 Apr–2 May 2025, EGU25-17953, https://doi.org/10.5194/egusphere-egu25-17953, 2025.

EGU25-18224 | Posters on site | BG3.13

Mycorrhizal fungi enhance plant productivity but reduce soil organic matter stocks 

Malin Forsberg, Björn Lindahl, Marie Spohn, Birgit Wild, and Stefano Manzoni

Mycorrhizal fungi and plants form symbiotic relationships that are essential for plant nutrition and carbon (C) storage in soil. Plants invest photosynthetically fixed C in their fungal partners in exchange for nutrients, especially nitrogen (N), which the fungi obtain from inorganic sources or by breaking down organic matter. This exchange also helps to stabilize root-derived C, as mycorrhizal necromass can persist in the soil, but it can also promote C loss when mycorrhizal fungi act as decomposers. Capturing these relationships in process-based models is crucial for quantifying C and N cycles and understanding how mycorrhizae influence ecosystem processes.

In this study, we utilized an ecosystem model calibrated with field data from a boreal forest in northern Sweden to compare ecosystem functions with and without ectomycorrhizal fungi (EMF) and to investigate how variations in parameters encoding microbial traits affect model outcomes. Through simulations involving different scenarios of elevated CO₂ and N deposition, both individually and in combination, we assessed how the presence or absence of EMF influences ecosystem responses.

We found clear differences between ecosystems with and without ectomycorrhizal fungi. Plant productivity and saprotrophic biomass were generally higher and soil C more stabile when EMF were present in the ecosystem model. But, EMF also increased decomposition resulting in higher plant growth at the cost of reduced soil C storage. Increasing CO2 and N deposition had similar effects in most of the cases. However, N addition had little effect on soil organic N suggesting that plants and microbes together control the soil organic N pool.

These findings demonstrate the significance of ectomycorrhizal fungi in influencing ecosystem responses to changing environmental conditions and highlight the benefit of including microbial interactions in ecosystem models to improve predictions of C and N dynamics.

How to cite: Forsberg, M., Lindahl, B., Spohn, M., Wild, B., and Manzoni, S.: Mycorrhizal fungi enhance plant productivity but reduce soil organic matter stocks, EGU General Assembly 2025, Vienna, Austria, 27 Apr–2 May 2025, EGU25-18224, https://doi.org/10.5194/egusphere-egu25-18224, 2025.

EGU25-20101 | Posters on site | BG3.13

Effect of Urban Environmental Stress on Tree Vitality and ectomycorrhiza of Roadside Tilia sp. 

Hans Sandén, Boris Rewald, Douglas Godbold, and Dylan Goff

Urban trees face numerous stress factors including de-icing salt in order to provide ecosystem services to cities. Mycorrhiza can mitigate environmental stresses but their role in mitigating urban specific stresses is not well known. We examined the effects soil chemistry on Tilia sp. planted along streets and it´s associated ectomycorrhiza. We compared park trees, trees from side streets, and trees from main streets with different salt stress levels . We show that 1) Tree vitality as well as ectomycorrhizal colonization decreases with increasing additions and sodium levels, 2) Tree vitality and colonisation as well at morphotype diversity were positively correlated to soil Mg. External mycelia production, measured with ingrowth bags was on the other hand higher in street trees than in parks and was not negatively correlated with Na but showed on the other hand a negative correlation to dissolved N. An explanation to the opposite patterns of colonization rate and production could be that the stressed environment causes high belowground turnover of roots and mycelia.

How to cite: Sandén, H., Rewald, B., Godbold, D., and Goff, D.: Effect of Urban Environmental Stress on Tree Vitality and ectomycorrhiza of Roadside Tilia sp., EGU General Assembly 2025, Vienna, Austria, 27 Apr–2 May 2025, EGU25-20101, https://doi.org/10.5194/egusphere-egu25-20101, 2025.

EGU25-21141 | Posters on site | BG3.13

Drought reduces soil carbon inputs by roots and mycorrhizal fungi and alters soil microbial communities in a pine forest 

Claudia Guidi, Beat Frey, Konstantin Gavazov, Xingguo Han, Martina Peter, Mathias Meyer, Yueqi Zhang, Beat Stierli, Ivano Brunner, and Frank Hagedorn

Drought impacts soil organic carbon (SOC) cycling. Yet, there is limited understanding of how water limitation affects C inputs from rhizosphere, which contribute to new SOC formation while fueling soil microbial communities. We quantified C inputs and losses from roots and mycorrhizal fungi after two decades of irrigation in a dry Scots pine forest using 13C-enriched soil ingrowth bags. Fungal and bacterial communities in the ingrowth bags and in adjacent soils were analyzed by Illumina MiSeq sequencing.

In the first year, the new SOC formation was stimulated by water addition as compared to natural drought both in root-accessible (+25%) and mycorrhizal-accessible (+50%) bags. After two years, the overall new SOC formation was 5 times greater in root-accessible than in mycorrhizal-accessible bags. Although root ingrowth increased by 70% in root-accessible bags, the irrigation had a limited effect on the amount of new C accumulated in root-accessible and mycorrhizal-accessible bags. The lacking irrigation effect on net new SOC formation may relate to higher respiratory losses of new C, which agrees well with the observed increase by 55% in old C losses under irrigation. This suggests that enhanced C inputs by roots and mycorrhizal fungi were rapidly mineralized under irrigated conditions. Increased supply and turnover of rhizosphere C under irrigation were paralleled by shifts in fungal and bacterial communities in ingrowth bags as well as in adjacent soils. Accordingly, the presence of roots was a main driver of fungal and bacterial community structures in the ingrowth bags.

Overall, our results indicate that naturally dry conditions slow SOC cycling, suppressing rhizosphere C inputs as well as C losses. The reduced supply of belowground C leads to cascading effects on soil microbial community composition under drought.

How to cite: Guidi, C., Frey, B., Gavazov, K., Han, X., Peter, M., Meyer, M., Zhang, Y., Stierli, B., Brunner, I., and Hagedorn, F.: Drought reduces soil carbon inputs by roots and mycorrhizal fungi and alters soil microbial communities in a pine forest, EGU General Assembly 2025, Vienna, Austria, 27 Apr–2 May 2025, EGU25-21141, https://doi.org/10.5194/egusphere-egu25-21141, 2025.

EGU25-21819 | Orals | BG3.13

Freezing Tolerance of Ectomycorrhizal and Saprotrophic Fungi 

Douglas Godbold, Hangyu Lan, Gorfer Markus, and Burenjargal Otgonsuren
In boreal and temperate forests, symbiotroph and saprotroph soil fungi must survive months of low temperatures or freezing during winter. In the temperate biome, this is particularly the case for high-elevation mountain forests. Soil freezing is thus an important stress factor in these forests. The objective of this study was to assess how temperature and freezing conditions affect the growth and survival of symbiotic and saprotrophic fungi. To assess the cold and freezing tolerance of ectomycorrhizal (EM) and saprotrophic (SAP) fungi, we conducted a study from 2021 to 2023, using isolates from forests located at lower and high-elevation mountain sites, as well as from forests in Mongolia, at altitudes ranging from 525 m to 1800 m. The isolates were grown in vitro at temperatures of 22, 15, and 4 °C and exposed to freezing conditions at −4 or −18 °C. The response to temperature and freezing was determined based on radial growth. Triphenyltetrazolium chloride (TTC) reduction was used to measure relative metabolic activity and viability. Fungi that originated from higher-elevation mountain sites, and thus colder climate conditions, tended to have a lower response to temperature and a higher tolerance to freezing. We could find no evidence of a higher freezing tolerance among different exploration types of ectomycorrhizal fungi. Sensitivity to low temperatures appears to be taxa-specific rather than exploration-type-specific.

How to cite: Godbold, D., Lan, H., Markus, G., and Otgonsuren, B.: Freezing Tolerance of Ectomycorrhizal and Saprotrophic Fungi, EGU General Assembly 2025, Vienna, Austria, 27 Apr–2 May 2025, EGU25-21819, https://doi.org/10.5194/egusphere-egu25-21819, 2025.

Mycorrhizal associations drive plant community diversity and ecosystem functions. Arbuscular mycorrhiza (AM) and ectomycorrhiza (EcM) are two widespread mycorrhizal types and are thought to differentially affect plant diversity and productivity by nutrient acquisition and plant–soil feedback. However, it remains unclear how the mixture of two mycorrhizal types influences tree diversity at large spatial scales. Here, we explored these issues using data from 698 plots (400 m2 for each) across natural forests located in Southwest China. Both AM-dominated and EcM-dominated forests show relatively lower tree species richness, species evenness and Shannon diversity, whereas forests with the mixture of mycorrhizal strategies support more tree diversity. Interestingly, the impacts of EcM dominance depend on climate and soils. Our findings suggest that mycorrhizal dominance influences tree diversity in forest ecosystems.

How to cite: Ma, S.: Mycorrhizal dominance influences on forest tree diversity in Southwest China, EGU General Assembly 2025, Vienna, Austria, 27 Apr–2 May 2025, EGU25-21826, https://doi.org/10.5194/egusphere-egu25-21826, 2025.

EGU25-989 | ECS | Orals | BG3.18

Mercury mapping in northern Scandinavian permafrost peatlands  

Charlotte Haugk, Sofi Jonsson, and Alyssa Azaroff

Permafrost is changing rapidly as it continues to thaw, releasing mercury (Hg) and potentially creating hotspots for Hg methylation as organic matter decomposes. If Hg is remobilszed and bioaccumulates as methylmercury (MeHg) in food webs, it could pose a serious health risk to northern communities and wildlife. Here, we have investigated cycling of Hg in five peatlands of northern Scandinavia, that are underlain by sporadic permafrost. To investigate natural thaw gradients, we sampled a total of 47 peat plateau cores that are representing intact permafrost conditions, and 47 fens soil cores, representing thawed permafrost conditions and characterized them based on their distribution of total Hg, MeHg and organic matter. Where permafrost peat had degraded into wet fens, we found that total Hg levels were lower compared to the dry peat plateaus, while MeHg were higher upon thaw. Our results suggest a significant Hg loss and potentially increased methylation due to thermokarst in permafrost-affected peatland ecosystems. A large spatial coverage of sampling locations allows us to investigate the distribution, the variability and transformation of Hg on a regional scale, thereby improving our understanding of Hg mobility from thawing permafrost in northern Scandinavia.

How to cite: Haugk, C., Jonsson, S., and Azaroff, A.: Mercury mapping in northern Scandinavian permafrost peatlands , EGU General Assembly 2025, Vienna, Austria, 27 Apr–2 May 2025, EGU25-989, https://doi.org/10.5194/egusphere-egu25-989, 2025.

EGU25-4430 | Orals | BG3.18

Stabilization of fresh organic matter from recent plant litter in thawing permafrost  

Christian Knoblauch, Carolina Voigt, and Christian Beer

The response of greenhouse gas fluxes from the circum-Arctic tundra to rapidly rising temperatures is one of the deep uncertainties in climate change research. Numerous studies have substantially increased our understanding on the production of greenhouse gases from thawing permafrost. However, we do not know how fast and to which extent fresh organic matter (OM) from decaying plant litter, the amounts of which are increasing in warming permafrost landscapes, may be stabilized in thawing permafrost.

To investigate the stabilization of fresh plant litter in thawing permafrost, we incubated permafrost samples from two Siberian islands for nine years with 13C-labelled plant litter under oxic and anoxic conditions. Within this experiment, we quantified CO2 and CH4 formation from two carbon sources: soil organic carbon (SOC) and litter carbon (litter-C). These data were used to calibrate a two-pool carbon decomposition model for determining the mean residence times (MRT) of the labile and stable carbon pools of SOC and litter-C. At the end of the incubation, we fractionated the remaining OM into the dissolved, the particulate and the mineral associated SOC and litter-C.

Roughly halve of added litter-C were mineralised to CO2 and CH4 after the nine years. Most of the SOC and of the litter-C were bound to the mineral fraction. However, the final litter-C mineralisation rates were 10-fold higher than those of SOC, indicating that the mineral associated carbon fraction contains OM of different decomposability. The median MRT of the stable litter-C pool was 18yr (oxic) and 52yr (anoxic), indicating a substantial stabilization of litter-C in thawing permafrost. However, the MRT of the stable permafrost SOC pool was one order of magnitude higher, demonstrating that permafrost OM is dominated by relatively stable OM. Our data shows that carbon from fresh plant litter is preferentially bound to pre-existing SOC in the mineral fraction and that this carbon still has a relatively high decomposability. Furthermore, we did not find evidence that the particulate OM is more labile than the mineral associated OM, or that the particulate OM fraction may be used as a proxy for a more decomposable carbon pool in thawing permafrost.

How to cite: Knoblauch, C., Voigt, C., and Beer, C.: Stabilization of fresh organic matter from recent plant litter in thawing permafrost , EGU General Assembly 2025, Vienna, Austria, 27 Apr–2 May 2025, EGU25-4430, https://doi.org/10.5194/egusphere-egu25-4430, 2025.

The greenhouse gas (GHG) balance of northern peatlands is being influenced by the combined effects of rapid permafrost thaw and increasing frequency and severity of droughts. Our soil chamber flux measurements revealed that thermokarst fens in the discontinuous permafrost zone of boreal western Canada (Lutose, Alberta) acted as stronger net sources of carbon dioxide (CO2) and consistently emitted more methane (CH4) than thermokarst bogs during two extreme-drought years. Peatlands in the discontinuous permafrost zone store large amounts of soil carbon, but thawing permafrost results in changes to hydrology and vegetation, which have the potential to substantially impact their greenhouse gas balance. As permafrost thaws, thermokarst bogs and fens develop and expand, further modifying GHG dynamics. Although thermokarst fens account for approximately 30% of peatlands in the discontinuous zone, they have received little attention, and there is limited understanding of how the GHG balance varies along the trophic gradient from poor fens to extreme-rich fens.

This study explored the spatial and temporal variability of greenhouse gas fluxes across four sites, including a thermokarst bog, poor fen, rich fen, and an extreme-rich fen. Trophic status of each site was classified based on pH, electrical conductivity (EC), vegetation, and concentrations of magnesium (Mg) and calcium (Ca). Fluxes were measured over two growing seasons and one winter (June 2023 to October 2024). Controls on greenhouse gas fluxes were explored using data on vegetation composition, water chemistry, hydrology, and climatic conditions. Our analysis showed that CH4 emissions generally increased along the trophic gradient, with the exception of the extreme-rich fen, where high sulfate concentrations suppressed emissions. Non-growing season CH4 emissions were also a significant contributor to annual emissions across all sites.

Overall, our findings indicate that trophic status plays an important role in determining the greenhouse gas balance of thermokarst bogs and fens following permafrost thaw. Understanding the drivers of the carbon dioxide balance and methane emissions in these ecosystems during extreme drought years is essential for refining models of peatland carbon dynamics and predicting their future role in the global carbon cycle as climate change continues.

How to cite: Kempton, K. and Olefeldt, D.: Greenhouse gas balance of thermokarst fens and bogs in the discontinuous permafrost zone during extreme drought years, EGU General Assembly 2025, Vienna, Austria, 27 Apr–2 May 2025, EGU25-4987, https://doi.org/10.5194/egusphere-egu25-4987, 2025.

EGU25-5063 | Orals | BG3.18

Impacts of warming and permafrost thaw on chemical weathering and riverine carbon fluxes on the Qinghai-Tibet Plateau 

Aaron Bufe, Liwei Zhang, Joshua F. Dean, Gerard Rocher-Ros, Emily H. Stanley, Ryan A. Sponseller, David E. Butman, Jan Karlsson, Ran Liu, and Tom I. Battin

Climate warming and associated permafrost thaw can have multi-faceted impacts on carbon fluxes from inorganic and organic sources. Permafrost thaw unlocks large stores of organic carbon that can be mineralized and emitted as carbon dioxide (CO2) from rivers to the atmosphere, or transported downstream. Concurrently, permafrost thaw exposes minerals to weathering reactions that can both sequester or emit carbon. Finally, climate warming can affect reaction kinetics and the cycling of reactive fluids through the subsurface. To date, the tradeoff between these competing effects and their net effect on landscape-scale carbon fluxes remain unclear.

Here, we present fluxes of dissolved solutes, riverine CO2 emissions, and carbon-isotope data from rivers that drain over 700,000 km2 of the Qinghai-Tibet Plateau, and that span a gradient in permafrost cover and temperature. Our data provide evidence for an interplay of organic-carbon degradation and inorganic chemical weathering that appear to modulate the balance of carbon sinks and sources. We find that net CO2 drawdown-fluxes from rock-weathering across the region account for ~35% of river CO2 emissions. Importantly, chemical weathering and organic carbon fluxes vary across the sampled permafrost gradient. In catchments underlain by continuous permafrost, CO2 drawdown from chemical weathering accounts for only ~25% of riverine CO2 outgassing. Conversely, carbon drawdown from weathering substantially outpaces riverine emissions in catchments with discontinuous or isolated permafrost.

Based on these results, carbon fluxes from chemical weathering may become increasingly important with ongoing permafrost thaw, potentially even outpacing riverine CO2 emissions. In landscapes where carbonate and silicate weathering dominate – such as over a large part of the QTP – a substantial portion of additional CO2 production from permafrost thaw could, therefore, be buffered by weathering on human timescales.

How to cite: Bufe, A., Zhang, L., Dean, J. F., Rocher-Ros, G., Stanley, E. H., Sponseller, R. A., Butman, D. E., Karlsson, J., Liu, R., and Battin, T. I.: Impacts of warming and permafrost thaw on chemical weathering and riverine carbon fluxes on the Qinghai-Tibet Plateau, EGU General Assembly 2025, Vienna, Austria, 27 Apr–2 May 2025, EGU25-5063, https://doi.org/10.5194/egusphere-egu25-5063, 2025.

EGU25-5761 | ECS | Posters on site | BG3.18

Asymmetric response of nitrous oxide emissions to active layer thawing in permafrost 

Wei Zhou, Guibiao Yang, and Yuanhe Yang

Permafrost stores large amounts of organic matter. As warming-induced thawing, this organic matter becomes accessible for microbial decomposition, potentially leading to substantial nitrous oxide (N₂O) emissions. However, previous studies have primarily focused on rapid permafrost collapse and its effects on N₂O fluxes, the impact of gradual thawing of active layer remains unclear. Here, we conducted a whole-ecosystem warming experiment on the Tibetan permafrost region to simulate a 2°C increase in ecosystem temperature accompanied by increasing active layer. In-situ monitoring of N₂O fluxes was combined with 15N site preference (SP) and δ18O isotopomers of N2O, microbial high-throughput sequencing, and meta transcriptomics to elucidate the change in N₂O emissions upon the increasing thawing of active layer and its underlying mechanisms. Our results reveal an asymmetric response of N₂O fluxes to thawing of active layer throughout the growing season. In the early growing season, thawing increased N₂O fluxes by 261 %, with significant changes in δ18O and SP, as well as change the soil organic matter, microbial diversity, and activity. In contrast, no significant effects were observed in the later season. These findings suggest that, during early-season, thawing accelerates nutrient release, alleviating nitrogen competition and promoting microbial growth, which enhances nitrification-driven N₂O emissions. During later-season, plant nutrient depletion intensifies competition, suppressing microbial activity and N₂O fluxes. This study is the first in-situ to report N₂O emissions in response to gradual active layer thawing, providing important evidence for understanding ecosystem responses to climate change.

How to cite: Zhou, W., Yang, G., and Yang, Y.: Asymmetric response of nitrous oxide emissions to active layer thawing in permafrost, EGU General Assembly 2025, Vienna, Austria, 27 Apr–2 May 2025, EGU25-5761, https://doi.org/10.5194/egusphere-egu25-5761, 2025.

EGU25-5785 | ECS | Posters on site | BG3.18

Methane emissions from thermokarst lakes amplified by nutrient release upon permafrost thaw 

Zhihu Zheng, Guibiao Yang, and Yuanhe Yang

Thermokarst lakes have been widely observed to function as strong atmospheric methane (CH4) sources. The warming-induced development of thermokarst lakes is simultaneously accompanied by a considerable release of nutrients, which may in turn exhibit reverberation on CH4 emissions. However, the effect of a coupled carbon and nutrient cycle on CH4 emissions has yet been explored in any experimental studies. Here, by conducting in-situ nutrient addition experiments at two representative sites, coupled with incubating sediments from thermokarst lakes at 30 sites across a 1,100-km permafrost transect on the Tibetan Plateau, we explore the response of CH4 emissions to nutrient input across thermokarst lakes. We find that nitrogen input accelerates CH4 emissions by 38.6-54.4%, while phosphorus input doesn’t generate additional effects. Random forest model analysis reveals that methanogen is the dominant driver for the intensity of positive nitrogen effect, which is confirmed by the increased RNA-methanogenic abundance after nitrogen input. These results demonstrate that nutrient release upon permafrost thaw will enhance CH4 emissions from thermokarst lakes, highlighting that their enhancements should be considered by land surface models when projecting CH4 fluxes in permafrost regions under warming climate.

How to cite: Zheng, Z., Yang, G., and Yang, Y.: Methane emissions from thermokarst lakes amplified by nutrient release upon permafrost thaw, EGU General Assembly 2025, Vienna, Austria, 27 Apr–2 May 2025, EGU25-5785, https://doi.org/10.5194/egusphere-egu25-5785, 2025.

EGU25-6261 | Posters on site | BG3.18

Multiproxy analysis of peatland permafrost initiation in northern Norway 

Elina Kiss, Niina Kuosmanen, A. Britta K. Sannel, and Minna Väliranta

Palsa mires are located at the southern border of the permafrost zone making them highly sensitive to climate warming. When annual temperature and precipitation conditions are optimal, palsas form and collapse in a natural cycle. However, due to current climate warming, permafrost is widely thawing and palsas are degrading rapidly. In addition to being unique and valuable habitats for many species, palsas store significant amount of ancient carbon (C), which is released by reactivated decomposition processes when permafrost thaws, potentially changing the peatlands temporarily from C sinks to C sources. However, the age and extent of the C released remain uncertain.  

To predict how palsas will respond to ongoing climate change, understanding of the past dynamics is vital. In this study, we determined the permafrost aggradation date and reconstructed the past dynamics of a palsa in Karlebotn, northern Norway. A peat profile was radiocarbon (14C) dated, and oribatid mite analysis together with a peat type analysis and peat properties (C, nitrogen and bulk density) were performed. Oribatid mites are a diverse group of soil-living arthropods that have shown potential as environmental indicators. Recent findings suggest they can indicate the past initiation of permafrost.

Our results suggest that gradual permafrost aggradation at the Karlebotn palsa began after 1500 calibrated years Before Present (cal yr BP; present = 1950 AD) and that at 700 cal yr BP the permafrost conditions had stabilized. Using multiproxy analysis, we identified three phases in the palsa history. The first phase was characterized by moist fen conditions, the second phase was a transition phase with wet and dry condition species occurring together and the last phase was dominated by species adapted to dry conditions, and which are typical in permafrost environments. Our data also indicate that during permafrost conditions, the C accumulation rate was lower than in the early non-permafrost fen stage. While permafrost thaw will temporarily increase C emissions, the C sink capacity may ultimately increase again as the peatland shifts back to a fen stage following ground subsidence.

Only few palaeoecological studies exist from Fennoscandia where age of permafrost formation is determined. Most studies have used vegetation succession and peat properties to infer past permafrost presence, however, these methods are associated with uncertainties such as the absence of permafrost indicator plant species. This study provides additional data on historical palsa dynamics with a relatively robust chronology, based on multiple proxies, including oribatid mite community analysis. These findings contribute to our understanding of how palsas are responding to the ongoing and future climate change.

How to cite: Kiss, E., Kuosmanen, N., Sannel, A. B. K., and Väliranta, M.: Multiproxy analysis of peatland permafrost initiation in northern Norway, EGU General Assembly 2025, Vienna, Austria, 27 Apr–2 May 2025, EGU25-6261, https://doi.org/10.5194/egusphere-egu25-6261, 2025.

EGU25-6749 | ECS | Posters on site | BG3.18

Mapping and Monitoring of Sweden’s largest coherent palsa mire 

Cas Renette, Maurico Fuentes, Bengt Liljebladh, Mirko Pavoni, Mark Peternell, Petter Stridbeck, Sofia Thorsson, and Heather Reese

Palsas are a permafrost landform found in northern peatlands, characterized by peat mounds with a frozen core. Climatic changes cause widespread degradation of palsas, affecting biodiversity, hydrology, carbon fluxes, and local infrastructure. Therefore, palsa mires are considered a priority habitat under the EU Species and Habitat Directive and are integrated into Sweden’s environmental goals, such as maintaining Thriving Wetlands. Despite their threatened status, the largest coherent palsa mire in Sweden, Vissatvuopmi (N68°47’, E21°11′), has no protective status. At this site, we monitor several palsas and peat plateaus, using a wide range of methods to understand both exterior and interior dynamics. We use a UAV with a LiDAR scanner to obtain high-resolution terrain models and track topographical changes. Between September 2022 and September 2024, we observed several “degradation hotspots” that undergo rapid collapse. Annual LiDAR data are supported by UAV orthophotos and the monitoring of active layer thickness, ground temperatures in six boreholes (2–6 m deep), and the local climate. Regarding the palsas’ interior, we present a comprehensive pseudo-3D survey of Electrical Resistivity Tomography (ERT). The results indicate that the shape of the frozen core on a palsa is highly heterogeneous, with a maximum depth roughly three times the height of the palsa. Finally, cores down to 5 m reveal a thick (up to 2 m) peat layer and thick ice lenses at depth. This multi-method approach provides a comprehensive view of palsas’ structure and will help advance our understanding of how peatland permafrost responds to a rapidly changing climate.

How to cite: Renette, C., Fuentes, M., Liljebladh, B., Pavoni, M., Peternell, M., Stridbeck, P., Thorsson, S., and Reese, H.: Mapping and Monitoring of Sweden’s largest coherent palsa mire, EGU General Assembly 2025, Vienna, Austria, 27 Apr–2 May 2025, EGU25-6749, https://doi.org/10.5194/egusphere-egu25-6749, 2025.

EGU25-7822 | ECS | Orals | BG3.18

Fire, drought and permafrost thaw: interactive effects on dissolved organic carbon, mercury, and nutrients in peatland-rich watersheds of boreal western Canada.   

Fares Mandour, Jazmin Greyeyes-Howell, Renae Shewan, Lauren Thompson, Irene Graham, Mike Low, Matthew Munson, Ryan Connon, and David Olefeldt

Permafrost thaw, wildfires, and increased amplitude of floods and droughts are all aspects of climate change that risk affecting the downstream mobilization of dissolved organic carbon (DOC), the neurotoxin methylmercury (MeHg), and various nutrients from boreal peatlands. In this study, we monitored water chemistry at the outflow of eighteen peatland-rich catchments (125 – 1700 km2) across a climate gradient in boreal western Canada. Our study included a wetter year (2022) and two extreme drought years (2023 and 2024) which also resulted in extensive fires that affected nine of the watersheds in 2023. Flood conditions in 2022 resulted in high hydrological connectivity, particularly in comparison to 2023 and 2024, where drought conditions coupled with extensive wildfires limited connectivity and combusted existing carbon stores. This reduced the mobilization of the co-transported MeHg in streams during the drought years, as well as resulting in no observable effects of the wildfires overall on water chemistry due to this limited connectivity within the peatlands.

Peatlands, covering over 30% of the Dehcho Region and Hay River watershed, are likely the primary source of these deleterious solutes due to the biogeochemistry of anoxic waterlogged soils. The goals of this monitoring program were developed collaboratively with the Dene Tha’, K'atl'odeeche, and Dehcho First Nations; their perspectives have been critical for this project. Community members expressed concerns about declining water quality potentially related to climate change, and the associated impacts on ecosystem health and fish resources. To assess the temporal variability of water quality, we studied four creeks with similar catchment sizes and peatland extent along a permafrost gradient using in-situ field sensors and grab samples. Additionally, a Before-After-Control-Impact methodology was used to evaluate the impacts of wildfires on water quality in eighteen streams along a permafrost gradient to assess northern vulnerability. Previous research has observed that peatlands in the discontinuous permafrost zone have poorer hydrological connection to the stream network compared to peatlands south of the permafrost boundary, resulting in higher solute concentrations in the southern region extent. Higher flow conditions during the spring resulted in minor peaks in MeHg and DOC concentrations, with decreasing concentrations as freshet ended. However, warmer temperatures that accelerate microbially associated DOC and MeHg generation resulted in the highest annual concentrations, despite extreme drought conditions that should’ve limited surface water sourcing.

Understanding the interactive impacts of permafrost conditions, wildfire and inter-annual climate variability on water quality is essential for managing and protecting the health of northern communities, ecosystems, and food webs. This research provides vital data to inform decision-making, support the resilience of local First Nations, and guide effective environmental stewardship in the face of ongoing climate change. We believe our findings are likely representative of northern peatland-rich regions broadly and will thus be of great interest to understand the global impacts of permafrost thaw and wildfire on carbon and mercury cycling.

How to cite: Mandour, F., Greyeyes-Howell, J., Shewan, R., Thompson, L., Graham, I., Low, M., Munson, M., Connon, R., and Olefeldt, D.: Fire, drought and permafrost thaw: interactive effects on dissolved organic carbon, mercury, and nutrients in peatland-rich watersheds of boreal western Canada.  , EGU General Assembly 2025, Vienna, Austria, 27 Apr–2 May 2025, EGU25-7822, https://doi.org/10.5194/egusphere-egu25-7822, 2025.

EGU25-8271 | Posters on site | BG3.18

Death of a spruce: Soil decomposition processes under dying spruce trees at the forest-tundra ecotone 

Birgit Wild, Ruud Rijkers, Lewis Sauerland, Rica Wegner, Allister Carter, and Larissa Frey

Arctic warming is facilitating the encroachment of trees into tundra landscapes. Trees at the forest-tundra ecotone are typically small, slow-growing and show high mortality rates. Tree necromass enters the soil as root, leaf and stem litter. This material can be decomposed or contribute to long-term soil organic matter stocks, as well as change decomposition of native soil organic matter (priming). We here tested whether decomposition processes change under dying spruce trees in tundra soils in a controlled laboratory experiment. The opportunity for addressing this question came up within a laboratory macrocosm experiment on the effect of various living tundra plants on carbon and nitrogen cycling in a tundra soil. For this experiment, root-picked soil was homogenized and filled into macrocosms, reconstructing the original horizon sequence. Plants with washed roots were placed in the soil and macrocosms watered regularly from the top. The small (ca. 50 cm) spruce trees died early in the experiment, and we kept the experiment running to assess changes in carbon and nutrient cycling resulting from the decomposition of spruce necromass compared to the plant-free control soil. Pore gas CO2 concentrations at 7 cm depth were significantly higher in spruce than in the control soils. We further observed significantly lower pH values, as well as significantly, ca. 25% lower potential activities of hydrolytic (leucine-aminopeptidase, cellobiohydrolase, N-acetyl-beta-D-glucosaminidase), but not oxidative extracellular enzymes. These findings suggest that the input of root and needle-leaf litter altered the functioning of the soil decomposer community. These differences extended into the deeper soil below the rooting zone of spruce plants, pointing at an important role of leaching. These first observations will be compared with surface CO2 fluxes, dissolved organic and microbial carbon concentrations to dissect the decomposition dynamics of spruce necromass at the forest-tundra ecotone.

How to cite: Wild, B., Rijkers, R., Sauerland, L., Wegner, R., Carter, A., and Frey, L.: Death of a spruce: Soil decomposition processes under dying spruce trees at the forest-tundra ecotone, EGU General Assembly 2025, Vienna, Austria, 27 Apr–2 May 2025, EGU25-8271, https://doi.org/10.5194/egusphere-egu25-8271, 2025.

EGU25-8342 | ECS | Posters on site | BG3.18

Effect of changing tundra vegetation on greenhouse gas emissions from Arctic permafrost soil 

Larissa Frey, Allister Carter, Ruud Rijkers, Lewis Sauerland, Rica Wegner, and Birgit Wild

The Arctic is warming rapidly, causing permafrost thaw and vegetation shifts. As a result, shrubs and trees from lower latitudes are encroaching into the tundra, altering biomass distribution above and below ground. These changes impact greenhouse gas (GHG) emissions by influencing litter input, root distribution, and microbial activity. A key mechanism in GHG production in soils is the rhizosphere priming effect, where labile carbon inputs from plants into the soil stimulate microorganisms to produce enzymes that decompose both labile and recalcitrant soil organic matter (SOM). However, the effects of rhizosphere priming on SOM decomposition and its influence on greenhouse gas emissions under natural conditions remain poorly understood. To address this, we simulated sub-Arctic vegetation changes in a controlled environment using tundra soil and plants sampled from the Northwest Territories, Canada. The soil was processed, homogenized, and placed into macrocosm chambers while preserving the original horizon sequence. The experiment included four vegetation types and one control, with plant species that are characteristic for the transition from sub-Arctic to lower Arctic bioclimate zones and included a small tree (Picea mariana), deciduous shrubs (Betula glandulosa, Alnus viridis) and graminoids (Eriophorum vaginatum, Carex sp.). Over three months, representing one growing season, weekly soil pore gas samples were taken at different depths, and surface efflux was measured additionally every three weeks. Preliminary results indicate that soil pore gas concentrations of CO2 increased with depth and over the experiment's duration across all vegetation groups and the control, and showed variability among vegetation types. Soil pore gas concentrations will be compared with soil efflux, dissolved organic carbon, microbial carbon contents, extracellular enzyme activity, and other parameters currently under evaluation. These data will help us to elucidate the role of woody plant species for permafrost soil processes and their contribution to GHG production in Arctic tundra ecosystems.

How to cite: Frey, L., Carter, A., Rijkers, R., Sauerland, L., Wegner, R., and Wild, B.: Effect of changing tundra vegetation on greenhouse gas emissions from Arctic permafrost soil, EGU General Assembly 2025, Vienna, Austria, 27 Apr–2 May 2025, EGU25-8342, https://doi.org/10.5194/egusphere-egu25-8342, 2025.

EGU25-8852 | Posters on site | BG3.18

Enhanced CO2 Emissions Driven by Flooding in a simulation of Palsa Degradation 

Mélissa Laurent, Jörg Schaller, Mackenzie R. Baysinger, Matthias Lück, Mathias Hoffmann, Torben Windirsch, Ruth H. Ellenbrock, Jens Strauss, and Claire C. Treat

With climate change, discontinuous permafrost is thawing rapidly and part of Permafrost-affected peatlands are at risk of disappearing within decades. Thawing in permafrost-affected peatlands can occur gradually (decades to centuries) or abruptly (weeks to years). While abrupt degradation is less frequent, it may contribute to higher carbon (C) loss.  However, predicting C loss with permafrost thaw from organic-rich soils, such as in Palsas, remains challenging. This highlights the need for laboratory studies focused on biogeochemical and hydrological changes, as well as C emissions during permafrost thaw. In this study, we simulated a gradual and an abrupt Palsa degradation under varying hydrological conditions to observe the impact of these different scenarios on the degradation rate of organic matter (OM). We used a meso-scale incubation setup to continuously measure CO2 and CH4 emissions, while deepening the permafrost table with three thaw stages over the 90 days duration of the incubation. This approach enabled the quantification of C contribution from deeper layers. Additionally, we assessed the OM degradation stage by using a FTIR approach. Our results showed a net CH4 uptake for all the Palsa cores and a twofold increase in CO2 emission rates following the thawing events for all the treatments simulating abrupt thaw (flooded conditions). We found that the physical disruptions of macro-agglomerates and redox changes due to the flooding enhanced OM lability in the active layer. In contrast, deepening the permafrost table increased emissions from Palsa cores under gradual thaw by a factor of two (dry conditions), while CO2 emissions remained constant under the abrupt thaw simulation. This outcome supports higher C contribution from permafrost layers under dry conditions. Finally, the increase in CO2 emissions with thaw from the saturated peatland highlight the potential role of deep-rooted vegetation as a transport pathway for CO2 in water-saturated soils outside the growing season.

How to cite: Laurent, M., Schaller, J., Baysinger, M. R., Lück, M., Hoffmann, M., Windirsch, T., Ellenbrock, R. H., Strauss, J., and Treat, C. C.: Enhanced CO2 Emissions Driven by Flooding in a simulation of Palsa Degradation, EGU General Assembly 2025, Vienna, Austria, 27 Apr–2 May 2025, EGU25-8852, https://doi.org/10.5194/egusphere-egu25-8852, 2025.

EGU25-8907 | ECS | Orals | BG3.18

First extensive manual N₂O flux measurements reveal a light-dependent N₂O sink in a thawing permafrost peatland 

Nathalie Ylenia Triches, Maija E. Marushchak, Jan Engel, Anna-Maria Virkkala, Wasi Hashmi, Mirkka Rovamo, Timo Vesala, Richard Lamprecht, Martin Heimann, and Mathias Göckede

Nitrous oxide (N₂O) is one of the most important greenhouse gases (GHG) with a global warming potential about 298 times stronger than carbon dioxide (CO₂) over a period of 100 years. While most N₂O emissions are released from natural ecosystems (60%), research has focussed largely on nutrient-rich agricultural soils, leading to a lack of understanding of nutrient-poor (sub-) Arctic ecosystems. Recent findings indicated significant N₂O emissions from organic-rich Arctic soils, resulting in a bias towards high emitting sites and particularly poor knowledge on N₂O consumption. As a result, the contribution of N₂O fluxes from the (sub-) Arctic regions to the global budget remains highly uncertain. Recent advances in portable gas analysers have improved our ability to measure low in-situ N₂O fluxes. To study the impact of environmental drivers (e.g. soil moisture, temperature, and photosynthetically active radiation) on N₂O fluxes using a portable N₂O analyser, we conducted chamber-based field measurements across a thaw gradient (palsa to bog to fen) in a sub-Arctic permafrost peatland in northern Sweden (Stordalen mire, Abisko), covering May to September. Conducting light (transparent) and dark (opaque) measurements, we found that soils in the Stordalen mire show a light-dependency, emitting N₂O in light conditions with a median of 0.56 µg m-2 h-1 (n = 480), and consuming N₂O in dark conditions with a median of -1.36 µg m-2 h-1 (n = 478). Since these changes can happen very rapidly, potential drivers of this dependency could be different active microbial communities, or vegetation impacts through photosynthesis. These results suggest that measurements with both transparent and opaque chambers are crucial for future N₂O flux studies to accurately estimate the N₂O budget. Generally, we measured low N₂O fluxes with a median flux of 0.02 µg m-2 h-1, of which all flux rates were above the minimal detectable flux. However, we also found one hot spot which continuously emitted high N₂O fluxes, with a maximum of 159.43 µg m-2 h-1 compared to 4.38 µg m-2 h-1 for all other plots. These are novel findings, suggesting that complex N₂O dynamics occur in nutrient-poor sites and further investigations are needed to understand the processes underlying the N₂O fluxes.

How to cite: Triches, N. Y., Marushchak, M. E., Engel, J., Virkkala, A.-M., Hashmi, W., Rovamo, M., Vesala, T., Lamprecht, R., Heimann, M., and Göckede, M.: First extensive manual N₂O flux measurements reveal a light-dependent N₂O sink in a thawing permafrost peatland, EGU General Assembly 2025, Vienna, Austria, 27 Apr–2 May 2025, EGU25-8907, https://doi.org/10.5194/egusphere-egu25-8907, 2025.

EGU25-12246 | Orals | BG3.18 | Highlight

Unraveling the microbial mechanism responsible for diurnal patterns in N2O fluxes in a subarctic permafrost peatland 

Dhiraj Paul, Wasi Hashmi, Nathalie Ylenia Triches, Matej Znaminko, Henri M.P. Siljanen, Christina Biasi, Mathias Göckede, Ivan Mammarella, and Maija E. Marushchak

Nitrous oxide (N₂O) is a critical greenhouse gas, ranking third in prevalence and serving as the leading contributor to ozone depletion in the twenty-first century. Its global warming potential is 298 times higher than that of carbon dioxide (CO₂) over a 100-year timeframe. Current estimates suggest that global N₂O emissions range from 8.1 to 30.7 teragrams (Tg) per year. Alarmingly, about two-thirds of these emissions stem from natural terrestrial sources, mainly related to microbial processes in soils. While significant research has focused on microbial mechanisms driving N₂O emissions in nutrient-rich ecosystems, there is an urgent need to address the limited knowladge on N₂O fluxes and underlying microbial mechanism in low-nutrient regions, such as Arctic ecosystems.

Many Arctic soils hold very low amounts of available nitrogen, leading to the assumption that they do not produce N2O in measurable quantities. However, recent advances with portable gas analyzers have made it possible to successfully capture low fluxes, which are important for the nitrous oxide budget of areas covering vast tundra landscapes, challenging this perception. Additionally, diurnal variations of nitrous oxide fluxes are rarely taken into account. In our study site, the Stordalen palsa mire (Abisko, Sweden), a diurnal variation in N2O emissions has been observed with chamber methods, with notably higher net emissions during the daytime and atmospheric N2O consumption in the night. This study aims to delve deeper into the geochemical and microbial mechanisms behind this intriguing phenomenon.

We conducted round-the-clock microbiological and geochemical sampling, along with N2O flux measurements, in the Stordalen Mire, Abisko, Sweden. Our research reveals significant insights into the availability of soluble nutrients, which were markedly higher during the daytime than at night. In our exploration of N2O consumption and production, we meticulously quantified the activity of N2O exchange-related genes responsible for N2O flux at the transcript level—specifically the denitrification genes (nirK and nirS) and N2O consumption genes (nosZ)—and analyzed their association with the day-night N2O flux phenomenon, followed by RNA sequencing. Remarkably, we found that microbial gene expression patterns closely correlate with the flux data and geochemical trends. Consequently, our day-night flux measurements, paired with thorough geochemical and microbiological analyses, provide critical undestanding into the diurnal variations in N2O fluxes within Arctic ecosystems. Our findings provide new insights into how microbes mediate complex N2O flux dynamics in nutrient-poor Arctic ecosystems during day and night, underscoring their significance in the global nitrogen cycle.

How to cite: Paul, D., Hashmi, W., Triches, N. Y., Znaminko, M., Siljanen, H. M. P., Biasi, C., Göckede, M., Mammarella, I., and Marushchak, M. E.: Unraveling the microbial mechanism responsible for diurnal patterns in N2O fluxes in a subarctic permafrost peatland, EGU General Assembly 2025, Vienna, Austria, 27 Apr–2 May 2025, EGU25-12246, https://doi.org/10.5194/egusphere-egu25-12246, 2025.

EGU25-12854 | ECS | Orals | BG3.18

Rhizosphere oxygenation decreases greenhouse gas emissions from thawed permafrost soil 

Marie Mollenkopf, Lena Haas, Andreas Kappler, and E. Marie Muehe

With thawing, permafrost soils can shift from dry, oxic conditions to wetlands, driving significant changes in soil biogeochemistry and plant community composition, ultimately altering climate-relevant greenhouse gas (GHG) dynamics. Graminoid species, such as Carex spp. and Eriophorum spp., thrive in anoxic soils, exhibit high primary productivity, release substantial amounts of organic root exudates fueling CO2 and CH4 emissions, and possess adaptive traits for anoxia. Among these traits is the formation of aerenchyma tissues, which enable oxygen release into the rhizosphere. Rhizosphere oxygenation promotes aerobic metabolisms increasing CO2 emissions, yet the effect on CH4 can be variable: it may enhance soil organic matter breakdown into small molecules such as acetate - potentially fueling CH₄ production - or suppressing methanogenesis. Currently, it is uncertain whether the combination of rhizosphere oxygenation and organic exudation in anoxic soils contributes to more production of climate-relevant GHGs or whether it has a suppressing effect.

To tease apart the individual and combined effects of rhizosphere oxygenation and organic exudation on thawed permafrost soil biogeochemistry and GHG fluxes, we incubated soil obtained from a fully thawed site in Stordalen mire, Sweden, under anoxic conditions. The soil was subjected to one of four treatments via an artificial root: a non-spiked control; organic exudate-mix alone (added three times a week); continuous ambient air addition; and a combination of both organic exudate mix and air. Concentrations were chosen to mimic plant release amounts under field conditions. Porewater geochemistry analysis is combined with extractions of organic carbon and iron precipitated on the artificial root and discussed along headspace GHG data and microbial functional gene profiling.

Organic exudate-mix alone strongly increased both CO₂ and CH₄ emissions, accompanied by substantial mobilization of iron and organic carbon. In contrast, the addition of air - either alone or combined with organic exudation - decreased CH₄ and CO₂ emissions. Decreased CH4 may potentially be caused by thermodynamic suppression of methanogenesis by less reducing soil conditions as indicated by less mobilized and more oxidized iron. Based on the used amounts of organic carbon and air inputs and the chosen lab incubation parameters, the combination of organic exudation and oxygenation could lead to less stimulation of GHG production as anticipated from classic priming studies.

How to cite: Mollenkopf, M., Haas, L., Kappler, A., and Muehe, E. M.: Rhizosphere oxygenation decreases greenhouse gas emissions from thawed permafrost soil, EGU General Assembly 2025, Vienna, Austria, 27 Apr–2 May 2025, EGU25-12854, https://doi.org/10.5194/egusphere-egu25-12854, 2025.

EGU25-12881 | ECS | Orals | BG3.18

Holocene development and recent vegetation and carbon storage dynamics in polygonal permafrost peatlands of the Hudson Bay Lowlands, Canada 

Tiina H. M. Kolari, Frédéric Bouchard, Alison Cassidy, Adam Collingwood, Lucile Cosyn Wexsteen, Jason Duffe, Sylvain Ferrant, Laure Gandois, Nicole K. Sanderson, and Michelle Garneau

The Hudson Bay Lowlands peatland complex in Canada, the world’s second-largest peatland complex, is experiencing the impacts of climate change, potentially threatening its carbon sink capacity; however, the direction and magnitude of recent changes are uncertain, particularly in response to ongoing permafrost thaw, climate change, and isostatic rebound. In this project, we aim to document the vegetation changes and carbon (C) storage dynamics, in both the long- (millennial) and short-term (decadal to centennial), of polygonal permafrost peatlands in Wapusk National Park (WNP), located on the northwestern coast of Hudson Bay.

First, we aim to estimate the total C stored in peatlands in WNP and study the Holocene development history of polygonal permafrost peatlands. During 2023–2024, we collected twenty complete peat cores across the different land cover types and ecoregions within WNP. The twenty peat cores will be dated with radiocarbon (14C) and analyzed for total organic C. The peat cores collected from permafrost peat plateaus will also be examined for paleoecological and palaeoclimatological reconstructions, providing insights into major shifts in plant communities, climate, and permafrost dynamics during the Holocene. Preliminary results show that in WNP, peatland initiation and C accumulation connect to undergoing isostatic rebound. Peat accumulation began ca. 5705 cal. BP in the forest-tundra region and 2390 cal. BP in the coastal fen ecoregion. Permafrost peat plateaus store approximately 80.7 kg C m-2, with an average long-term apparent rate of carbon accumulation (LORCA) of 26.1 g C m-2 yr-1. At several sites, spruce and larch forests preceded contemporary, lichen-dominated peat plateaus.

Second, we will explore why the numerous ponds within the permafrost peatlands are now being infilled by Sphagnum mosses, the most important genus for storing C as peat, and whether this is linked to recent permafrost thaw. Twenty surface peat monoliths were collected along transects at the edges of seven ponds and will be dated with coupled 14C and lead-210 (210Pb) age-depth modeling and analyzed for total organic C, plant macrofossils, and diatom communities. Preliminary results from plant macrofossil analyses indicate infilling and a subsequent increase in Sphagnum cover over fen vegetation rather than thawing-induced subsidence of permafrost peat plateaus. However, this may differ between ecoregions (forest-tundra vs. subarctic peat plateau region), and the timing of the transitions from moss-sedge to Sphagnum peat will be verified with age-depth modeling and remote sensing techniques. These early results show that vegetation changes along the pond edges can significantly affect peatland C accumulation.

How to cite: Kolari, T. H. M., Bouchard, F., Cassidy, A., Collingwood, A., Cosyn Wexsteen, L., Duffe, J., Ferrant, S., Gandois, L., Sanderson, N. K., and Garneau, M.: Holocene development and recent vegetation and carbon storage dynamics in polygonal permafrost peatlands of the Hudson Bay Lowlands, Canada, EGU General Assembly 2025, Vienna, Austria, 27 Apr–2 May 2025, EGU25-12881, https://doi.org/10.5194/egusphere-egu25-12881, 2025.

EGU25-14970 | ECS | Orals | BG3.18

Origin and transformation of soil organic matter in permafrost soils 

Tino Peplau, Patrick Liebmann, Luisa Laes, Carolina Voigt, Christian Knoblauch, Susanne Liebner, Claudia Bruhn, and Georg Guggenberger

Soil organic matter (SOM) is a highly heterogeneous component of soils and its composition differs strongly between sites, depending on the specific environmental conditions. Thawing of permafrost leads to the exposure of large amounts of SOM to decomposition, resulting in the release of greenhouse gases. Moreover, SOM might be mobilized as dissolved organic matter (DOM), possibly contributing to losses of carbon from soils. Detailed knowledge of SOM composition is key for understanding mineralisation processes and for the quantification of greenhouse gas emissions from thawing permafrost soils of different moisture, thaw depth, parent material and slope position.

We sampled permafrost soils along two transects on Disko Island, West Greenland, to characterize SOM from soils with different characteristics. Installation of suction cups allowed pore water sampling to determine the amount and composition of DOM. We measured emissions of CO2 and CH4 with a manual chamber system to quantify greenhouse gas fluxes at the different sites. To determine the degree of SOM decomposition and the potential impact of site characteristics on greenhouse gas emissions and SOM leaching, we fractionated SOM and subsequently analysed lignin components, amino sugars, and stable isotopes (δ13C and δ15N). Molecular microbial analyses were carried out to understand the underlying biological processes that control SOM cycling and greenhouse gas production.

Lignin components and derived molecular ratios matched with the recent vegetation. Sites are characterized by woody angiosperms in the well aerated and drained soils at the top of the slopes and by herbaceous plants in the wetland area at the lower end of the transects. The data indicated weak decomposition at the wet sites and stronger decomposition at the dry sites, which correlated with the proportion of particulate OM within the total SOM. Stable isotopes showed according patterns, becoming more positive with depth within the soil profile but becoming more negative along the transects. Leaching of DOM showed a more complex pattern with the lowest C contents in the wettest areas and the highest C contents in the intermediate slope positions but increasing C contents within the soil profiles. Only the wettest sites emitted CH4, while the drier locations were neutral in terms of CH4 or acted as CH4 sinks. We observed decreasing CO2 emissions along the transects during the day, with the driest sites being sources of CO2. The observations of CH4 fluxes were supported by higher abundances of methanogenic microorganisms in the wetter areas.

The results underline the susceptibility of SOM to decomposition in thawing permafrost. While topsoils and litter layers contain larger amounts of SOM than subsoils, results suggest that C is transported downwards along the soil profile with infiltrating water, possibly buffering decomposition. DOM appears to be transported down the hillslopes until it is either drained into waterbodies or emitted as CH4. Concerning scenarios of soil moisture changes, and daily and seasonal variations in CO2 uptake, the observed soils might therefore turn from C sinks to sources. However, the extend of this C-relocation by lateral DOM transport has not yet been quantified and needs further observation.

How to cite: Peplau, T., Liebmann, P., Laes, L., Voigt, C., Knoblauch, C., Liebner, S., Bruhn, C., and Guggenberger, G.: Origin and transformation of soil organic matter in permafrost soils, EGU General Assembly 2025, Vienna, Austria, 27 Apr–2 May 2025, EGU25-14970, https://doi.org/10.5194/egusphere-egu25-14970, 2025.

EGU25-15836 | Orals | BG3.18

Following the water.: The thawing and erosion of permafrost increase input of reactive nitrogen and carbon to the coastal water at the Baldwin Peninsula, Alaska 

Tina Sanders, Hanno Meyer, Bryce van Dam, Maija Marushchak, Wasi Hashmi, and Claire Treat

Permafrost affected soils and especially Yedoma deposits contain a huge amount of carbon and nitrogen, which can be released and become available after thawing. Coastal and thermal erosion, e.g. in drain lake basins, are important processes for the release and transport of reactive nitrogen and carbon from soils to the aquatic environment and consequently to the coastal waters and the Ocean. The faster warming of the Arctic in relation to the rest of the world will amplify the rate of release of nitrogen and carbon.

To understand the hydrological conditions and release pathways of the thawing nitrogen and carbon, we investigated a drained lake basin (Schaeffers Lake) and a Yedoma Cliff (Cape Blossom) at the Baldwin Peninsula, Alaska. Samples from rain, snow, ice wedges, outflow water, basin water, pore water and soil were taken. By measuring biogeochemical properties (dissolved inorganic (DIN)and organic nitrogen (DON) plus 15N stable isotopes, DI13C/TA, 18OH2O, dissolved gases (CO2, methane and N2O) et al.), we want to unravel the path of the water and how carbon and nitrogen are enriched and transported.

First results show that the out-flowing water contained a considerable amount of DIN and DON, the 15N stable isotopes of nitrate were significantly enriched and the water was oversaturated with methane and N2O. This indicates that not only reactive nitrogen is released by the thawing and erosion, but also quickly processed by microbial activity that is stimulated by the nutrient input.

How to cite: Sanders, T., Meyer, H., van Dam, B., Marushchak, M., Hashmi, W., and Treat, C.: Following the water.: The thawing and erosion of permafrost increase input of reactive nitrogen and carbon to the coastal water at the Baldwin Peninsula, Alaska, EGU General Assembly 2025, Vienna, Austria, 27 Apr–2 May 2025, EGU25-15836, https://doi.org/10.5194/egusphere-egu25-15836, 2025.

EGU25-18164 | Posters on site | BG3.18

Changes in vegetation properties in permafrost affected peatland ecosystem in northern Norway undergoing rapid permafrost degradation 

Hanna Lee, Inge Althuizen, Casper Christiansen, and Sebastian Westermann

Permafrost degradation is expected to release large amounts of greenhouse gasses to the atmosphere, creating positive feedback to climate warming. The greenhouse balance is largely dominated by microbial decomposition of soil organic matter, however, as permafrost thaws the vegetation composition and growth rate changes and increases the potential to fix carbon in the ecosystem. The aspect of vegetation change, therefore, is worth noting independent of greenhouse emissions from soils under permafrost thawing and climate warming. We investigate how vegetation properties change with permafrost thawing and artificial warming at a natural gradient of permafrost thawing and natural succession and using open top chambers following the International Tundra Experiment (ITEX) protocol at a permafrost affected peatland palsa-mire ecosystem in northern Norway undergoing rapid permafrost degradation followed by natural succession knowns as the Iškoras site. The permafrost affected peat plateau called ‘palsa’ is dominated by evergreen dwarf shrubs such as Empetrum nigrum. As permafrost thaws and palsa collapses, the wet soil conditions promote vegetation shift from E. nigrum to more hydrophilic deciduous shrubs such as Rubus chamaemorus. Eventually, the waterlogged mires will undergo natural succession dominated by non-vascular vegetation such as mosses and lichen as well as sedges. This vegetation transition corresponds to a shift in functional traits from conservative to resource acquisitive. Warming primarily led to an increase in size related traits. Furthermore, vegetation greenness (NDVI) showed a different development over the growing season in response to permafrost thaw and warming. The total biomass and composition have high implications for understanding ecosystem carbon balance as well as CH4 emissions in this ecosystem under rapid permafrost degradation.

How to cite: Lee, H., Althuizen, I., Christiansen, C., and Westermann, S.: Changes in vegetation properties in permafrost affected peatland ecosystem in northern Norway undergoing rapid permafrost degradation, EGU General Assembly 2025, Vienna, Austria, 27 Apr–2 May 2025, EGU25-18164, https://doi.org/10.5194/egusphere-egu25-18164, 2025.

EGU25-18338 | ECS | Posters on site | BG3.18

Effects of permafrost thaw on N-cycle processes in a thermokarst system 

Martina Mayer, Victoria Martin, Lucia Fuchslueger, Andreas Richter, and Nicolas Valiente

Northern peatlands store large amounts of carbon (C) as well as nitrogen (N) which amounts to ∼80 % of global C and N peatland stocks, making them important C and N reservoirs. With Arctic amplification warming the Arctic nearly four times faster than the global average, an increased permafrost thaw was observed even in very cold polar regions such as the Canadian High Arctic, where thaw depths already exceeded scenarios projected to occur by 2090, altering hydrology, geomorphology as well as nutrient cycling in the landscape, caused by but not limited to increased thermokarst formation. Thermokarst describes a landscape occurring when ice-rich permafrost, which is highly vulnerable to climate change due to lack of sufficient thermal buffering, thaws altering microbial decomposition of soil organic matter (SOM), including N pathways. Considering the effects of global warming on permafrost-affected peatlands in the Arctic, it is likely that the active layer will continue to deepen and thaw more and more permafrost and therefore, expose more formally frozen SOM to microbial decomposition, priming the N-cycling and increasing the N availability.


Our work explores the changes in N-cycling in thermokarst landscapes, by incubation of soils with 15N stable isotope tracing to assess organic N depolymerization, N-mineralization and nitrification rates over time. Permafrost soils from the continuous permafrost zone on the uplands east of the Mackenzie Delta (Northwest Territories, Canada) from 3 different depths in the active layer and the upper permafrost, in two phases of thermokarst development were investigated. We performed a 15N tracing experiment, by incubating soils with a 15N-protein for 9 days and estimated 15N in dissolved organic N, microbial N and nitrate as well as ammonium.


Our results show changing N-cycle processes with depth, as well as with progress of thermokarst stages. Generally microbial N uptake in active layers was favoured over N mineralization, while the contrary was the case in permafrost layers. This pattern might be connected to a microbial N-limitation in the upper soil layers leading to increased microbial N demand. In permafrost layers microbes show higher rates of N mineralization (ammonification), i.e., they excrete inorganic N, most likely because of a carbon limitation. With progressing thermokarst development a shift form microbial uptake focused processes to mineralization pathways was observed in the active layer. This trend might be due to increased N availability as ground collapses as a result of thawing and mixes the soil layers, leading to decomposition of previously frozen SOM. Permafrost layers favoured ammonification, however, samples from secondary thermokarst sites showed signs of N limitation at the end of incubation, most likely because of the long-term exposure of microbes to available SOM leading to depletion of the N stocks.


With this work we contribute to unravelling the changes in N-cycle pathways in the thawing Arctic, shining a light on the consequences of climate change on these remote ecosystems.


This study was funded by the Marie Skłodowska-Curie Actions H2020-MSCA-IF-2020 within “NITROKARST” project (Grant agreement 101024321)

How to cite: Mayer, M., Martin, V., Fuchslueger, L., Richter, A., and Valiente, N.: Effects of permafrost thaw on N-cycle processes in a thermokarst system, EGU General Assembly 2025, Vienna, Austria, 27 Apr–2 May 2025, EGU25-18338, https://doi.org/10.5194/egusphere-egu25-18338, 2025.

EGU25-18446 | ECS | Posters on site | BG3.18

Quantifying Changes to the Arctic N Budget following Permafrost Thaw 

Lara Oxley, Fabrice Lacroix, Benjamin Stocker, and Sönke Zaehle

Permafrost soils in the Arctic region contain vast amounts of frozen dead biomass, composed of twice the amount of carbon (C) as in the atmosphere and a great quantity of nutrients. Due to climate change, these soils are thawing at greater depths each summer and will continue to do so in the future, rendering this frozen organic material accessible to decomposition. Most research thus far has focused on the amount of C that could potentially be released as CO2 and CH4 gases through the decomposition. However, the release of nitrogen (N) is estimated to have a significant impact on the region's ecosystems and global greenhouse gas budgets, as this excess N may boost vegetation growth, potentially enhancing its CO2 uptake. However, it could also lead to increased N losses in the form of N2O emissions and lateral export to water bodies. This research aims at synthesizing the historical and future changes of the terrestrial N budget in the Arctic following permafrost thaw.

Here, we provide estimates of past and future changes to the pan-Arctic N budget and how it is affected by permafrost thaw. We combine soil nitrogen data from Palmtag et al (2022) and CMIP6 model projections of active layer depth. The amount of N released through permafrost thaw is compared to estimates of changes in N deposition and biological fixation. Furthermore, we quantify the biologically available fraction of the N released from the permafrost and provide a first-order estimate on the consequences of this altered N cycling for Arctic vegetation biomass growth and CO2 uptake based on published results from N fertilization field experiments.

Based on CMIP6 model output, we estimate that the mean active layer depth over the whole Arctic permafrost region will increase from an averaged depth of 1.3 m for the present day to 2.3 m depth following SSP 126, to 3.6 m depth following SSP 370, and to 3.9 m depth following SSP 585 scenarios for the time period 2080 - 2100. The additional N mobilized through this permafrost thawing translates to increases of 95 %, 167 % and 186 % of nitrogen in the active layer compared to present day. By 2100, with N inputs from permafrost thaw and assuming that 5 - 15 % of this becomes available as plant nutrition, vegetation biomass could increase by 16 – 50 g C m-2 yr-1, 31 – 96 g C m-2 yr-1, or a 35 – 106 g C m-2 yr-1 for the SSPs 126, 370 and 585, respectively, assuming a linear increase in vegetation biomass growth until 2100. These numbers would reflect a significant additional drawdown of CO2 by the pan-Arctic vegetation, with relevance for global assessments.


Figure 1: Timeseries showing the amount of additional N in kg N / m2 in the active layer, anomaly to 1880-1900. The dotted line indicates the change from observation-based models to future projection based on the SSP scenarios.

How to cite: Oxley, L., Lacroix, F., Stocker, B., and Zaehle, S.: Quantifying Changes to the Arctic N Budget following Permafrost Thaw, EGU General Assembly 2025, Vienna, Austria, 27 Apr–2 May 2025, EGU25-18446, https://doi.org/10.5194/egusphere-egu25-18446, 2025.

EGU25-19897 | ECS | Posters on site | BG3.18

Peatland hydrology: From tropical to subarctic latitudes 

Markus Köhli, Jonas Marach, Rong Liu, Xin Wang, and Zuliang Wang

Soil moisture is one of the key variables controlling the exchanges of water and energy at the land surface. One particularly interesting climate zone is the Eastern Tibetean Plateau with its dry cold winters and wet monsoon summers at high altitudes. To better understand hydrological processes and the response of the hydrological cycle to climate change the novel method of Cosmic-Ray Neutron sensing had been tested in the northeast of the Qinghai-Tibet Plateau  with a highly hetereogeneous organic soil profile. Using this technique one can relate the flux density of albedo neutrons generated in cosmic-ray induced air showers to the amount of water in the environment on the scale of several hectares. Instrumented with in-situ sensors and cosmic ray probes we discuss the effective measurement depth of CRNS retrieval and vertical weights of different layers up to 50 cm depth in this semi-humid alpine meadow. During the non-frozen period we analyzed and validated the representativeness of CRNS in an extensive comparison of in-situ data, two soil moisture retrieval algorithms and full-scale neutron Monte Carlo simulations using the transport model URANOS. As the CRNS method gains traction and evolves towards large-scale applications, the findings from this study are pivotal for the understanding of the technology and its limitations. 

How to cite: Köhli, M., Marach, J., Liu, R., Wang, X., and Wang, Z.: Peatland hydrology: From tropical to subarctic latitudes, EGU General Assembly 2025, Vienna, Austria, 27 Apr–2 May 2025, EGU25-19897, https://doi.org/10.5194/egusphere-egu25-19897, 2025.

EGU25-20717 | Posters on site | BG3.18

Microbial community dynamics following riverbank erosion across permafrost floodplains in the Yukon River basin 

Woodward Fischer, Katie Huy, John Magyar, Philippa Richter, Avi Flamholz, Yinon Bar-On, Joshua Anadu, Yutian Ke, Emily Geyman, Michael Lamb, Edda Mutter, Isabel Smith, and Josh West

Much of the organic-rich permafrost deposits in the Arctic lie in riverine floodplains where thaw due to polar amplification of climate change has accelerated bank erosion, leaving permafrost carbon deposits vulnerable to degradation by microorganisms. As sediments harbored in the riverbank erode, they are subjected to sediment transport processes, interact with the water column, and are eventually re-deposited in barforms on an opposing riverbank and incorporated to build new land with ensuing forest succession.  Using a space-for-time substitution across these deposits and a suite of culture-independent amplicon and shotgun metagenomic sequencing of samples with ages from modern to several thousand years old collected from the Yukon River and its major tributary the Koyukuk River, we set out to understand microbial community succession associated with this process, and connect this with rates of carbon cycling in the subsurface.  Because dioxygen is a special molecule concerning the fate of organic carbon in soils and sediments, we also developed a useful ’sequencing-as-sensing’ approach that leverages recent developments in protein language models to assess the time-integrated fraction of the microbial community capable of aerobic biology and oxidative attack of extracellular organic matter.  Results revealed that permafrost deposits operate as a ‘seed bank’ that generates a pattern of succession toward an aerobic community capable of rapid carbon degradation during erosion and transport—a pattern that may help explain why carbon burial in river floodplains is so efficacious. 

How to cite: Fischer, W., Huy, K., Magyar, J., Richter, P., Flamholz, A., Bar-On, Y., Anadu, J., Ke, Y., Geyman, E., Lamb, M., Mutter, E., Smith, I., and West, J.: Microbial community dynamics following riverbank erosion across permafrost floodplains in the Yukon River basin, EGU General Assembly 2025, Vienna, Austria, 27 Apr–2 May 2025, EGU25-20717, https://doi.org/10.5194/egusphere-egu25-20717, 2025.

EGU25-21721 | Posters on site | BG3.18

Dynamic Methanogens – Persistent Methanotrophs: Shedding Light on Microbial Communities of the Methane Cycle Across Seasons in Permafrost-Affected Soils in West Greenland 

Claudia Bruhn, Parvina Gasimova, Carolina Voigt, Christian Knoblauch, Tino Peplau, Patrick Liebmann, Georg Guggenberger, Jan Olaf Melchert, and Susanne Liebner

About 15 % of the northern hemisphere is covered by permafrost, which is subjected to climate change and therefore drastically changing conditions for soil microorganisms. Progressing permafrost thaw could enable formerly inactive microorganisms to (re)gain activity and metabolize carbon. Methane (CH4) is a biogenic greenhouse gas (GHG) that is approximately 28 times more potent than carbon dioxide (CO2) on a 100-year time horizon. It is currently not well understood how the emissions of this potent GHG from permafrost-affected soils will be changing under the effects of climate change.

It was suggested that during freeze-thaw-cycles and even during winter, Arctic tundra soils emit substantial amounts of methane but since sampling in permafrost regions is logistically intricate, there is a low study coverage. Here, we present molecular data of four distinct field campaigns on Disko Island, West Greenland. The studies encompass three years (2022 to 2024) and three different seasons: September – time of maximum active layer depth, July – initial annual thawing period, and April – completely frozen soil with snow cover. We sampled two moisture transects in permafrost-affected soils, each from higher elevation with dry soil towards lower elevation, with soil almost completely water saturated. The soil moisture gradients were chosen, because they are potentially important drivers of the ratio between CH4 oxidation vs. production throughout the seasons. Each plot was sampled in triplicates to varying depths of 10 cm to up to 90 cm. The samples were taken from identified soil horizons and DNA for metagenome analysis was extracted. The resulting total of 235 samples over all four sampling seasons were used for 16S rRNA gene metabarcoding (Illumina) to investigate the microbial community diversity over the different sampling seasons.

Methane oxidizers (methanotrophs) were constantly abundant but accounted for less than 1 % of the relative abundance across the samples. The abundance of methane producers (methanogens), mostly Methanobacterium spp., substantially changed throughout the different time points, locations and depths, and accounted at times for over 20 % of relative abundance of all prokaryotes while being completely absent in other samples.

Additional quantitative PCR (qPCR) analyses have revealed distinct distributions of both pmoA (gene for a membrane-bound enzyme for oxidizing methane) and mcrA (gene for the final step of biological methane production) for September 2022, with a higher methanogenic gene abundance in deep and wet samples. This was confirmed through incubation experiments and subsequent gas analyses in the laboratory. Further qPCR will reveal the CH4-oxidation and -production potential for the other time points. Accompanying to this, other environmental parameters (H2O content, season, pH) will allow to assess potential key factors for methanogenesis vs. methanotrophy in a final correlation approach.

Our results show that permafrost-affected soils harbor a surprisingly large spatiotemporal variability in community composition and abundance of methanogens while the methanotroph community seems to be comparably stable. These findings have implications for future GHG budget calculations of the Earth, as this suggests that methanotrophs and methanogens would react very differently to Earth’s changing climate and resulting environmental changes, such as water saturation of soils.

How to cite: Bruhn, C., Gasimova, P., Voigt, C., Knoblauch, C., Peplau, T., Liebmann, P., Guggenberger, G., Melchert, J. O., and Liebner, S.: Dynamic Methanogens – Persistent Methanotrophs: Shedding Light on Microbial Communities of the Methane Cycle Across Seasons in Permafrost-Affected Soils in West Greenland, EGU General Assembly 2025, Vienna, Austria, 27 Apr–2 May 2025, EGU25-21721, https://doi.org/10.5194/egusphere-egu25-21721, 2025.

Variations in snow depth are significantly altering the soil environment in the permafrost regions of the Tibetan Plateau, which in turn affects vegetation growth. However, how plant leaf and root traits and their relationship respond to increased snow depth remains unclear. Thus, the present study aimed to examine the influence of increased snow depth on plant growth and functional traits of leaf and root in the alpine meadow of the Tibet, exploring how plant above-ground and below-ground parts cascading responded to increased snow depth. This study employs snow fences to artificially increase snow depth and measures above-ground biomass, root biomass, specific leaf area (SLA), leaf carbon concentration (C), leaf nitrogen concentration (N), and leaf phosphorus concentration (P), specific root area (SRA), specific root length (SRL), root tissue density (RTD), root diameter (RD), root carbon concentration (C), root N concentration, and root P concentrations. Increased snow depth significantly increased root biomass compared to ambient controls, but didn’t change above-ground biomass. Increased snow depth significantly decreased SLA but increased leaf C, N and P concentrations. For root functional traits, increased snow depth increased SRL and SRA, but decreased RTD and AD. Effect size result showed that plant leaves was less affected by increased snow depth as compared with root. Particularly, leaf traits changed larger in physiological plasicity traits (leaf C, N, P cocentrations) as compared with morphological plasticity traits (AGB, SLA). In converse, root traits changed larger in morphological plasticity traits (BGB, SRL, SRA, RTD, RD) rather than physiological plasicity traits(root C, N, P cocentration). Principal component analysis showed that leaf functional traits are primarily driven by leaf C, N, and P concentrations, while root functional traits are mainly driven by morphological traits such as SRL, SRA, and RTD. The inconsistently respond of plant leaf and root to increased snow depth in the alpine meadow of the Tibetan Plateau suggested that trade-offs between above- and below- functions are necessary for plant to optimize resource use under changing environment. Our results also emphasize the importance of feedback between above- and below-ground plant traits to better understand plant community responses to future climate change.

How to cite: Yang, Y., Tan, X., and Zhang, J.: Inconsistent Responses of Above- and Below-ground to 8 Years Increased Snow Depth at the Alpine Meadow in the Permafrost Region of the Tibetan Plateau, EGU General Assembly 2025, Vienna, Austria, 27 Apr–2 May 2025, EGU25-284, https://doi.org/10.5194/egusphere-egu25-284, 2025.

EGU25-2050 | ECS | Orals | BG3.19

Snow depth shapes aboveground but not belowground phenology during snowmelt, influencing carbon exchange in a northern boreal peatland 

Johannes Cunow, Johan Olofsson, Maria Väisänen, and Gesche Blume-Werry

Snow cover exerts contrasting influences above- and belowground, with shallower snow exposing shoots faster to warmer air temperatures in spring while causing colder soils and deeper soil frost. In contrast, increased snow depth insulates soils, keeping them warmer, but isolates shoots from warm air. Given that temperature is a key driver of phenological progression both above and below, snow cover changes may produce diverging effects on above- and belowground phenology, impacting spring carbon dynamics.

Over two years, we tracked snowmelt and spring green-up in a snow manipulation experiment (i.e., snow reduction, snow addition, control) at the EcoClimate site in a northern boreal rich fen (66°22' N). Our findings revealed that snow reduction advanced snow-free conditions for shoots but caused colder soils and delayed peat soil thawing. Snow reduction accelerated shoot phenology, but net carbon exchange remained similar to the control. In contrast, snow addition did not affect shoot phenology but reduced ecosystem respiration. Root growth was absent across all treatments during the first seven weeks of observation up to mid-summer, but follow-up measurements showed an increase in root density one month later.

These findings demonstrate that substantial shoot growth can occur independently of root growth. While snow reduction and addition did not produce divergent phenological patterns between aboveground and belowground processes—due to the delayed onset of root growth—changes in snow cover influenced carbon dynamics in complex ways. This study highlights the intricate interplay between winter snow cover, spring phenology, and CO2 exchange in high-latitude ecosystems.

How to cite: Cunow, J., Olofsson, J., Väisänen, M., and Blume-Werry, G.: Snow depth shapes aboveground but not belowground phenology during snowmelt, influencing carbon exchange in a northern boreal peatland, EGU General Assembly 2025, Vienna, Austria, 27 Apr–2 May 2025, EGU25-2050, https://doi.org/10.5194/egusphere-egu25-2050, 2025.

EGU25-3611 | ECS | Posters on site | BG3.19

Genomic and Proteomic Analysis of Functional Genes in Phacidium infestans DSM 5139 for Nutrient Acquisition and Ecosystem Functioning 

Chahira Zerouki, Suvi Kuittinen, Ari Pappinen, and Ossi Turunen

Phacidium infestans Karsten DSM 5139 is a significant fungal pathogen that causes snow blight in conifers across Europe and Asia. Thriving under snow cover, P. infestans infects and kills pine needles, which are known for their antifungal properties. The genome of the strain DSM 5139 was sequenced using PacBio II technology, resulting in 44 contigs with a genome size of ~36.8 Mb and a GC content of 46.4%. Genome completeness was assessed at 98.6% using BUSCO analysis, and its annotation revealed 11,357 open reading frames. Functional annotation identified 573 carbohydrate-active enzymes and approximately 400 genes linked to secondary metabolite biosynthesis.

Several mechanisms facilitating P. infestans survival and proliferation on pine needles were identified, including drug-efflux pumps, acyclic terpene synthases, and phytoalexin detoxification enzymes. Two cutinase proteins were detected. Their protein modeling confirmed the presence of functional structures such as signal peptides, catalytic triads, and lid domains. In addition, numerous cold-survival strategies were identified including trehalose synthesis enzymes, desaturases, stress response proteins, and two ice-binding proteins that modulate ice crystal formation at subzero temperatures.

Pathway reconstruction revealed an efficient nutrient acquisition strategy.  First, the fungus breaches the needle waxes using secreted cutinases. Then it degrades the plant cell wall polymers with cellulases, pectinases, lignin-degrading enzymes, and other plant cell wall-degrading enzymes.

This study represents one of the first comprehensive genomic analyses of P. infestans, providing valuable insights into its genomic adaptations for nutrient acquisition and survival in cold environments. The findings enhance our understanding of fungal-plant interactions and highlight the ecosystem functioning of this fungal pathogen in forest ecosystems.

How to cite: Zerouki, C., Kuittinen, S., Pappinen, A., and Turunen, O.: Genomic and Proteomic Analysis of Functional Genes in Phacidium infestans DSM 5139 for Nutrient Acquisition and Ecosystem Functioning, EGU General Assembly 2025, Vienna, Austria, 27 Apr–2 May 2025, EGU25-3611, https://doi.org/10.5194/egusphere-egu25-3611, 2025.

EGU25-3746 | Orals | BG3.19

CO2 and CH4 fluxes and processes in a boreal bog and surroundings: a chilling tale of cold-season greenhouse gas emissions 

Claire C. Treat, Katharina Jentzsch, Lona van Delden, Josh Hashemi, and Mackenzie Baysinger

Cold season processes and emissions can be critical for determining annual budgets of CO2 and methane (CH4) in Arctic and other high-latitude ecosystems but there are relatively few measurements of winter fluxes and corresponding soil processes. In this talk, we will present results from investigating seasonality in greenhouse gas fluxes and processes controlling them, with a special emphasis on CH4 emissions from a boreal peatland. We measured CO2, CH4, and N2O fluxes for more than a year from an upland forest, dry bog, and wet bog at a site in boreal Finland using automated and manual chambers. Net CO2 uptake and CH4 emissions were highest in summer while N2O fluxes were nearly always below detection. Plant transport and oxidation of CH4 played an important role in CH4 fluxes during the summer as well as into the fall. CH4 emissions were enhanced throughout the fall due to plant transport and showed little seasonality in the fall in drier bog microtopographies. Net CO2 and CH4 emissions from the wet bog continued into December until snowpack formation, which led to an icy layer at the top of the peat profile. In the spring as snow melted and soils thawed, we saw an emissions pulse of CH4. Additional measurements showed the highest concentrations of CH4 in the peat porewater in the spring, indicating the accumulation of microbially-produced CH4 in the unfrozen peat under the snowpack during the winter. Furthermore, potential decomposition in Sphagnum peat showed little temperature sensitivity in laboratory experiments, indicating microbial adaptation to cold temperatures not seen in the dry bog or upland forest soils. Sustained biological activity in peat can continue at low temperatures over winter and lead to substantial enhancements in CH4 and CO2 emissions, although the timing of emissions is controlled by interactions in physical environment: snow melt, soil thawing, and plant-mediated transport.

How to cite: Treat, C. C., Jentzsch, K., van Delden, L., Hashemi, J., and Baysinger, M.: CO2 and CH4 fluxes and processes in a boreal bog and surroundings: a chilling tale of cold-season greenhouse gas emissions, EGU General Assembly 2025, Vienna, Austria, 27 Apr–2 May 2025, EGU25-3746, https://doi.org/10.5194/egusphere-egu25-3746, 2025.

EGU25-4188 | ECS | Orals | BG3.19

Snow thermal conductivity controls future winter carbon emissions in shrub-tundra 

Johnny Rutherford, Nick Rutter, Leanne Wake, and Alex Cannon

The Arctic winter is disproportionately vulnerable to climate warming and approximately 1700 Gt of carbon stored in high latitude permafrost ecosystems is at risk of degradation in the future due to enhanced microbial activity. Few studies have been directed at high-latitude cold season land-atmosphere processes and it is suggested that the contribution of winter season greenhouse gas (GHG) fluxes to the annual carbon budget may have been underestimated. Snow, acting as a thermal blanket, influences Arctic soil temperatures during winter and parameters such as snow effective thermal conductivity (Keff) are not well constrained in land surface models which impacts our ability to accurately simulate wintertime soil carbon emissions. A point-model version of the Community Land Model (CLM5.0) forced by an ensemble of NA-CORDEX (North American Coordinated Regional Downscaling Experiment) future climate realisations (RCP 4.5 and 8.5) indicates that median winter CO2 emissions will have more than tripled by the end of the century (2066-2096) under RCP 8.5 and using a Keff parameterisation which is more representative of Arctic snowpack. Implementing this Keff parameterisation increases simulated winter CO2 in the latter half of the century (2066-2096) by 130% and CH4 flux by 50% under RCP 8.5 compared to the widely used default Keff parameterisation. The influence of snow Keff parameterisation within CLM5.0 on future simulated CO­2 and CH4 is at least as significant, if not more so, than climate variability from a range of NA-CORDEX projections to 2100. Furthermore, CLM5.0 simulations show that enhanced future air and soil temperatures increases the duration of the early winter (Sept-Oct) zero-curtain, a crucial period of soil carbon emissions, by up to a month and recent increases in both zero-curtain and winter CO2 emissions appear set to continue to 2100. Modelled winter soil temperatures and carbon emissions demonstrate the importance of climate mitigation in preventing a significant increase in winter carbon emissions from the Arctic in the future.

How to cite: Rutherford, J., Rutter, N., Wake, L., and Cannon, A.: Snow thermal conductivity controls future winter carbon emissions in shrub-tundra, EGU General Assembly 2025, Vienna, Austria, 27 Apr–2 May 2025, EGU25-4188, https://doi.org/10.5194/egusphere-egu25-4188, 2025.

EGU25-4288 | Orals | BG3.19

Warming in the subarctic: Impacts on soil food webs and carbon cycling 

Paul Kardol, Eliška Kuťáková, Kohsuke Tanigawa, Mika Lemoine, Floretta Setia Pradana, Bowen Li, Barryette Oberholzer, and Max Mallen Cooper

Terrestrial ecosystems provide key ecosystem services, yet their stability is increasingly threatened by global warming. There is, however, little consensus on how ecosystem functioning will respond to projected warming scenarios or when thresholds and tipping points may be crossed. This uncertainty arises largely from our limited understanding of the underlying non-linear responses of plants and soil organisms to temperature changes. Since plants and soil organisms often respond differently to warming, it can disrupt or decouple interactions among coexisting and co-evolved species, potentially leading to unforeseen consequences for key ecosystem functions, such as carbon and nutrient cycling.

Our ERC-THRESHOLD project aims to unravel these dynamics by investigating how non-linear temperature responses manifest across levels of ecological organization, including soil micro-organisms and soil fauna. We use forest-tundra and forest-alpine ecotones in seven countries across five continents to assess how plants, soil organisms, and ecosystem carbon cycling respond to increasing temperatures and how these responses may cross critical thresholds.

Preliminary findings show two key patterns. First, the slope of temperature profiles differs between aboveground and belowground measurements, with a steeper decline aboveground. This means that the difference between aboveground and belowground temperature declines with elevation. This has important implications for studying the effects of warming on soil food webs. Second, the shape of carbon flux responses along temperature gradients varies widely across transects and countries, indicating strong regional context dependence. Ongoing analyses of soil microorganisms and soil fauna aim to further elucidate these patterns

We also conduct growth chamber experiments to estimate how warming influences ecosystem carbon fluxes through the reorganization of plant and soil communities. In one experiment, subarctic heath vegetation monoliths were incubated at five warming levels, ranging from ambient to +9°C. While nematode density and community composition at the feeding group level remained relatively stable across warming treatments, individual nematode families exhibited diverse linear and non-linear responses. Soil micro-arthropods, including mites and springtails, showed generally weak responses to (short-term) warming, with patterns influenced by the dominant plant species. In another experiment, using the same temperature treatments, we are examining the warming responses of constructed tundra meadow communities and associated biogeochemical processes, both in absence and presence of soil microfauna. This experiment also tests the responses and effects of ‘encroaching’ ectomycorrhizal tree seedlings, specifically Betula pubescens subsp. czerepanovii.

Our ongoing work focuses on identifying the shapes of temperature "response functions" for plants, soil organisms, their communities, and the ecosystem processes they drive. By distinguishing linear from non-linear responses, we aim to better understand the mechanisms underlying ecosystem resilience and susceptibility to warming. Defining these response functions represents a critical frontier in global change research, offering insights into how terrestrial ecosystems may transition under future climate scenarios.

How to cite: Kardol, P., Kuťáková, E., Tanigawa, K., Lemoine, M., Setia Pradana, F., Li, B., Oberholzer, B., and Mallen Cooper, M.: Warming in the subarctic: Impacts on soil food webs and carbon cycling, EGU General Assembly 2025, Vienna, Austria, 27 Apr–2 May 2025, EGU25-4288, https://doi.org/10.5194/egusphere-egu25-4288, 2025.

With  melting of permafrost many changes of arctic soils can be expected.  Important changes are expected to be associated with invasion of  soil ecosystem  engineers such as earthworms and or other soil macrofauna. The effect of ecosystem engineers if context specific, not only in a way that environmental conditions such as soil texture, pH or litter quality may affect effect of engineers, but also in the way that ecosystem engineers change their environment which then alternate effect of engineers on the system. The latter effect made evaluation of engineer’s effect complex because it basically means that  when we do simple manipulation experiment when we manipulate presence of engineers we can get different response to that manipulation in different stages of invasion of better to say after system has been modified by engineers for some time. This is due to the fact that previous effect of engineers leaves some legacy of long-term effects and this legacy change immediate effects of engineers. Here we focus on earthworm invasion/colonization.  The aim of this contribution is to summarize our knowledge about  changes of earthworm  immediate effects on the soil along gradient of earthworm long term legacy in the system and formulate simple conceptual framework than may help to understood underlying mechanism of this phenomena, which may help in its implication to ongoing to future ecosystem invasions such as earthworm colonization of the arctic.

How to cite: Frouz, J.: The effect of ecosystem engineers invasion is context specific and depends of stage of invasion, EGU General Assembly 2025, Vienna, Austria, 27 Apr–2 May 2025, EGU25-6601, https://doi.org/10.5194/egusphere-egu25-6601, 2025.

EGU25-8722 | ECS | Orals | BG3.19

Distinct Potential Priming under Snow-Covered and Snow-Free Conditions in Subarctic Tundra 

Chenxin Feng, Emil Alexander Sherman Andersen, Stephanie Turner, Dominik Merges, Karina Klemmensen, Sara Hallin, Johan Olofsson, and Ellen Dorrepaal

Sub-arctic tundra ecosystems experience strong seasonality, which could potentially influence the belowground processes, including the soil carbon cycling. Priming effect is a significant component in carbon cycling and describes the change of soil carbon mineralization after fresh carbon input. In this study, we investigated the effect of seasonality on the potential priming and the driving factors of the effect. We collected soils (0-10cm) from two tundra heath ecosystems with different precipitation regimes (Abisko and Vassijaure). We sampled soils every four weeks throughout a year and conducted 60-day incubation experiments at 3°C. To simulate the root exudate input effect, a 13C labelled artificial cocktail was added to assess the potential priming. Cumulative priming was positive throughout the whole year with fluctuations across sampling periods, accounting for significant portions of total respiration. While no significant seasonal variation on priming was observed, we found a significant snow state effect (snow-covered state vs snow-free state) on priming at both sites, with a trend of increasing priming potential during snow-covered periods. Surprisingly, the relationships between the driving factors – soil N availability (mineral N [NH4+ and NO3-], total dissolved N [DON]), dissolved organic carbon (DOC), and microbial biomass carbon (MBC) – and priming remained consistent across snow states. Structural Equation Modeling (SEM) revealed that soil temperature and snow state influenced soil N availability (mineral N and dissolved organic N [DON]), DOC, and abundance of microbial communities (Bacteria and Archaea). DOC and MBC, along with bacterial abundance, positively influenced cumulative cocktail mineralization. Subsequently, cumulative cocktail mineralization strongly enhanced cumulative priming, whereas mineral nitrogen (N) availability had a suppressive effect. These results underscore the critical role of snow state in shaping potential priming, revealing consistent underlying drivers.

How to cite: Feng, C., Andersen, E. A. S., Turner, S., Merges, D., Klemmensen, K., Hallin, S., Olofsson, J., and Dorrepaal, E.: Distinct Potential Priming under Snow-Covered and Snow-Free Conditions in Subarctic Tundra, EGU General Assembly 2025, Vienna, Austria, 27 Apr–2 May 2025, EGU25-8722, https://doi.org/10.5194/egusphere-egu25-8722, 2025.

EGU25-9255 | ECS | Posters on site | BG3.19

Effects of intense freeze-thaw cycles on Arctic biological soil crusts as studied by Raman microspectroscopy  

Rasa Platakyte, Louise Rütting, Mats Björkman, Edith Hammer, and Milda Pucetaite

Soil microbial metabolism is extremely important to large scale processes such as nutrient cycling and climate change. At the same time, the changing climate influences soil structure and function, especially in the Arctic region, which has been experiencing faster and more intense warming compared to anywhere else in the world. To better understand the microscale processes and how they are affected by changing temperatures and extreme weather events, we use soil microchips, mimicking the soil structure and providing visual access to the soil systems, and incubate them with microorganisms from Arctic biological soil crusts. These chips then are subjected to different freezing and thawing cycles (FTCs), and we follow the microbial activity and metabolism by the means of optical microscopy and Raman microspectroscopy.

The samples for this experiment were collected in summer from a dry heath tundra ecosystem in Blæsedalen on Disko Island, West Greenland. The plots where the soil was sampled had been warmed during the previous winter in a winter warming experiment which showed some increased activity of microbes from the warmed plots. During the laboratory experiments, the chips containing soil microbes were placed at +5 °C (control), as well as -5 °C and -18 °C (freezing) temperatures. The frozen chips were thawed at two different frequencies – one daily and one biweekly. During the six weeks of the freezing and thawing cycles, the chips were observed in an optical microscope in order to follow the microbial growth and community changes. After the treatment was finished, the chips were analysed by Raman microspectroscopy.

Raman microspectroscopy can be employed to study the chemical composition and metabolic processes of individual live microorganisms in near real time. The microbial metabolic activity was monitored using SIP (stable isotope probing) Raman microspectroscopy. We injected SIP labelled substrates into the soil microchips and followed the intensity of SIP related spectral bands as microorganisms incorporated the labelled substances. The results show significant differences between control and FTC treatment chips, with microbes from control chips metabolizing injected substances much faster, especially in the case of bacteria. The differences among the treated chips are less pronounced. However, the microbes in the chips that had been thawed daily exhibit stronger fluorescence signal, suggesting their different protective responses to the stronger environmental stressor.

All in all, soil chips allow the visual observation of microbial community changes in response to FTCs, while SIP Raman makes it possible to estimate metabolic activity rates of individual organism groups. Although currently limited in scale, in the future this information could be used to better describe the role of microbial communities in larger scale climate models.

How to cite: Platakyte, R., Rütting, L., Björkman, M., Hammer, E., and Pucetaite, M.: Effects of intense freeze-thaw cycles on Arctic biological soil crusts as studied by Raman microspectroscopy , EGU General Assembly 2025, Vienna, Austria, 27 Apr–2 May 2025, EGU25-9255, https://doi.org/10.5194/egusphere-egu25-9255, 2025.

EGU25-9866 | ECS | Posters on site | BG3.19

Does soil fauna prime microbial respiration in permafrost? 

Sylvain Monteux, Ellen Dorrepaal, and Eveline Krab

Permafrost soils are devoid of fauna while frozen, but little is known about how fauna affects their biogeochemistry upon thawing. Most soil fauna resides in the uppermost layers of the soil, and are therefore unlikely to colonize deep, often anoxic, soils at the bottom of the active layer where newly-thawed permafrost is found. However, abrupt thaw events can result in newly-thawed permafrost being exposed to the surface, and such events are both common throughout the circum-Arctic and an important uncertainty in permafrost biogeochemistry. While the exact faunal dispersal mechanisms remain unexplored, literature suggests that surrounding soil fauna can migrate into newly-thawed permafrost within a year after an abrupt thaw event.

To date, we have no information on whether the introduction of soil fauna alters the biogeochemical functioning of permafrost soils: most mechanistic studies are carried out with permafrost soil thawed in vitro, into which fauna has no chance of dispersing, while plot- or ecosystem-level measurement do not distinguish between faunal and microbial activity. Simple questions, such as whether the presence of soil fauna alters the microbial production of greenhouse gases, remain untested, in part due to a lack of appropriate methodology. Here we introduce isotopic partitioning of faunal (model Collembola Folsomia candida) and microbial CO2 production in permafrost and active layer soil from a sub-arctic palsa peatland. Whole-organism isotopic enrichment coupled with 13C-CO2 measurement allows us to test whether faunal presence primes microbial respiration. This method can be expanded both to other soil organisms and greenhouse gases, and thus represents a promising avenue towards a quantitative understanding of biotic interactions in newly-thawed permafrost soils.

How to cite: Monteux, S., Dorrepaal, E., and Krab, E.: Does soil fauna prime microbial respiration in permafrost?, EGU General Assembly 2025, Vienna, Austria, 27 Apr–2 May 2025, EGU25-9866, https://doi.org/10.5194/egusphere-egu25-9866, 2025.

EGU25-11566 | ECS | Orals | BG3.19

Cascading effects of Arctic tundra herbivory on above- and belowground biomass, soil biogeochemistry, and soil (microbial) food webs 

Andrea Söllinger, Kathrin M. Bender, Victoria Martin, Yngvild Bjørdal, Mathilde Borg Dahl, Andreas Richter, Maarten Loonen, Mette M. Svenning, and Alexander T. Tveit

Climate change affects herbivore populations and their migration patterns and feeding grounds in High-Arctic tundra ecosystems. Knowledge about the ecosystem-scaled impacts of environmental changes in the High-Arctic, including changes in herbivore grazing pressure, requires long-term perspectives and the integration of above- and belowground components.

Here we investigated the effects of grazing geese and reindeer on high-Arctic tundra, by studying the effects of short- (4 years) and long-term (14 y) exclusion of herbivores in situ. Within the Thiisbukta peatland, next to Ny-Ålesund (78.93°N, 11.92°E), Svalbard, 5 replicated high-Arctic wet tundra sampling sectors have been established. Each, at the time of sampling, included 4- and 14-year exclosure plots (Ex-4 and Ex-14), as well as control plots (Hr), where herbivory was not prevented.

Preventing herbivory altered a moss-dominated vegetation (Hr) to a mix of mosses and vascular plants (Ex-4) and a vascular-plant-dominated vegetation (Ex-14). These aboveground changes were reflected belowground and included a significant increase in root biomass and significantly higher contents of lignin derivates in the soil organic matter after the long-term exclusion of herbivores. Additionally, concentrations of inorganic phosphorous and monosaccharides (namely glucose and N-acetyl-glucosamine) were also increased after the long-term exclusion, while soil pH and moisture decreased. To study the effects of these alterations on soil organisms and their complex communities we employed metatranscriptomics, allowing us the simultaneous investigation of soil organisms across domains and kingdoms, ranging from Bacteria, Archaea, and viruses, to protists, Fungi, and other microbial Eukaryotes, to soil meso- and macrofauna community members, including Collembola, Nematoda, Arachnida, Insecta, and other small Metazoa. We observed a substantial, often gradual, re-structuring of the soil communities in the exclosure plots on multiple tropical and functional levels. For example, within the microbial food web, we observed decreased relative abundances of eukaryotic predators (e.g., ciliates) and bacterivorous bacteria (e.g., Myxococcota) after the long-term exclusion of herbivores, while relative abundances of viruses targeting Bacteria increased. Prominent changes in relative abundances of meso- and macrofauna community members after the long-term exclusion of herbivores were decreased relative abundances of Rhabditophora (Platyhelminthes), Monogononta (Rotifera), and Maxillopoda (Arthropoda) and increased relative abundance of Insecta and Arachnida (both Arthropoda). However, among eukaryotic kingdoms, Fungi showed the strongest positive response to the exclusion of herbivores and the subsequent increase of vascular plants. Especially the abundances of mycorrhizal fungi and plant pathogens were increased, coinciding with increased relative abundances of viruses targeting Fungi. Furthermore, with increasing coverage of vascular plants, soil respiration rates increased. At the same time, total microbial biomass did not differ significantly, but the turnover time of microbial biomass was significantly shorter 14 years after the exclusion of herbivores.

Taken together our results suggest that High-Arctic tundra ecosystems with a vascular-plant-dominated vegetation, here caused by changes in herbivore grazing pressure, are characterized by an altered soil food web, facilitating a faster microbial loop and an accelerated decomposition of soil organic matter. Thus, we demonstrated how aboveground changes substantially altered belowground communities and the trophic interactions that control carbon cycling in High-Arctic tundra ecosystems.

How to cite: Söllinger, A., Bender, K. M., Martin, V., Bjørdal, Y., Dahl, M. B., Richter, A., Loonen, M., Svenning, M. M., and Tveit, A. T.: Cascading effects of Arctic tundra herbivory on above- and belowground biomass, soil biogeochemistry, and soil (microbial) food webs, EGU General Assembly 2025, Vienna, Austria, 27 Apr–2 May 2025, EGU25-11566, https://doi.org/10.5194/egusphere-egu25-11566, 2025.

EGU25-11869 | ECS | Orals | BG3.19

Will invasive burrowing earthworms affect soil food web and carbon stability in arctic tundra? 

Camille D'Hervilly, Gesche Blume-Werry, Eveline Krab, Hanna Jonsson, and Péter Garamszegi

The fate of the soil organic matter stored in arctic ecosystems in a future warmer climate is highly debated but remains quite uncertain, especially as most studies do not take into account the combined effect of climate change and simultaneous invasion by non-native fauna. For example, while the impact of climate change on carbon losses from the arctic might be limited due to the strong nutrient limitations restricting microbial activity and decomposition speed in these ecosystems, the current invasion by burrowing earthworms as a result of human activity might alleviate the nutrient limitations and modify the soil food web, which could significantly increase carbon losses. We investigated the effect of burrowing earthworm addition on soil mesofauna and microbial community composition and on associated carbon stability of the arctic tundra by the end of a 4-year-long mesocosm experiment in northern Sweden. The abundance of collembola and oribatid mites was positively affected by earthworm addition in a heath-type tundra ecosystem, while no changes were detectable in a meadow-type tundra. This is surprising as the meadow-type tundra was strongly affected by earthworms in terms of soil structure with a decrease in total carbon stock. We tested the stability of the residual carbon by measuring CO2 emissions during an incubation of the organic and mineral soil horizons at current and increased temperatures. We found that while carbon stability is not clearly affected by earthworm addition in the heath-type tundra, the stability of the leftover carbon is increased in the presence of earthworms in the meadow-type tundra in the first 10 soil centimeters in both incubation temperatures. This suggests that the ultimate effect on carbon dynamics of earthworm invasion cannot be simply estimated from the immediate carbon loss from the organic layer, as the changes in carbon forms and quality could modify the future organic matter availability to decomposers. 

How to cite: D'Hervilly, C., Blume-Werry, G., Krab, E., Jonsson, H., and Garamszegi, P.: Will invasive burrowing earthworms affect soil food web and carbon stability in arctic tundra?, EGU General Assembly 2025, Vienna, Austria, 27 Apr–2 May 2025, EGU25-11869, https://doi.org/10.5194/egusphere-egu25-11869, 2025.

EGU25-12132 | Posters on site | BG3.19

Identifying Spatial Patterns in Greenhouse Gas Fluxes through an Arctic Tundra Snowpack  

Nick Rutter, Gabriel Hould Gosselin, Paul Mann, Oliver Sonnentag, and Philip Marsh

Cold season greenhouse gas (GHG) emissions have been found to make non-negligible contributions to annual carbon budgets in Arctic-boreal regions. The Arctic is warming three to four times faster than the global average, changing the magnitude and phase (snow/rain) of precipitation, and the thermal regimes of snow-covered ground.

Future projections of winter GHG emissions require accurate simulations of the insulative properties of Arctic snowpacks and improved parameterisations of soil heterotrophic respiration as a function of soil thermal and moisture regimes. To improve these parameterisations in terrestrial biospheric models, we measured carbon dioxide and methane fluxes through the late-winter snowpack of a mineral upland tundra site in the western Canadian Arctic. Fluxes were calculated using highly resolved GHG snow concentration gradients and vertical snowpack microstructure (n = 119), over a range of microtopographic and vegetation types.

GHG emission rates were statistically independent of vertical snow microstructures, suggesting high snow gas porosity relative to soil emission. Carbon dioxide emissions were measured across a wide range of tundra landscape types, and were closely linked to soil temperatures, vegetation type and snow depths. Importantly, persistent net methane sinks were also found across landcover types in warmer soils (-6 to -2 oC), showing active methane oxidation during winter periods. Methane emissions were not always consistent within surface cover types, suggesting available liquid soil moisture and carbon availability as important controls.

How to cite: Rutter, N., Hould Gosselin, G., Mann, P., Sonnentag, O., and Marsh, P.: Identifying Spatial Patterns in Greenhouse Gas Fluxes through an Arctic Tundra Snowpack , EGU General Assembly 2025, Vienna, Austria, 27 Apr–2 May 2025, EGU25-12132, https://doi.org/10.5194/egusphere-egu25-12132, 2025.

EGU25-12968 | Posters on site | BG3.19

Microbial nitrogen uptake in winter warming manipulation experiments in Arctic tundra (Disko Island; Greenland) 

Louise Rütting, Sofia Rodas, Fredrik Klinghammer, Elias Ranjbari, Massimo Micaroni, Laura H. Rasmussen, Bo Elberling, Birgitte K. Danielsen, Aurora Patchett, Tobias Rütting, Geerte Fälthammar de Jong, Michael Dannenmann, Elisabeth Ramm, Rasa Platakyte, Mats Björkman, Hanbang Zou, Carlos Arellano, Milda Pucetaite, and Edith C. Hammer

Due to the above global average warming, the winter climate in West Greenland is increasingly characterized by warm spells causing snow melt and soil exposure. These events might activate soil microbes and associated nutrient cycles, with consequences for the tundra ecosystem, even in the following summer.

Here we studied effects of winter warming in a dry heath tundra ecosystem in Blæsedalen on Disko Island, West Greenland near Arctic Station, characterized by low shrub vegetation (Betula nana, Salix glauca, Vaccinium uliginosum, Empetrum nigrum, Cassiope tetragona). We established replicate 0.5 m2 plots equipped with custom-made heating probes that were pre-installed in the growing season aiming to warm up the surrounding soil in the following winter campaign to a depth of 15 cm during a week. Nitrogen (N) transformation pathways from organic N (proteins and amino acids) to ammonium (inorganic N) and microbial N uptake were quantified in the tundra soil using 15N labelling techniques, accompanied by greenhouse gas flux measurements.

In situ warming resulted in soil CO2 loss, and activated microbial CH4 uptake. Under laboratory conditions, we could also detect several freeze-thaw induced emission peaks of N2O and N2. For the first time nanoSIMS analysis revealed rapid soil microbial uptake of amino acid alanine into microbial cells in winter soils. Furthermore, optical microscopy and Raman spectroscopy analysis of microbial communities provided insights into both their immediate response to the warming and into memory effects in the following growing season, with increased microbial activity in the samples taken from plots that have been warmed.

In sum, we highlight a fast activation of microbial N turnover due to Arctic winter warming events, which results in changes in nutrient cycling that persist in the following growing season.

How to cite: Rütting, L., Rodas, S., Klinghammer, F., Ranjbari, E., Micaroni, M., Rasmussen, L. H., Elberling, B., Danielsen, B. K., Patchett, A., Rütting, T., de Jong, G. F., Dannenmann, M., Ramm, E., Platakyte, R., Björkman, M., Zou, H., Arellano, C., Pucetaite, M., and Hammer, E. C.: Microbial nitrogen uptake in winter warming manipulation experiments in Arctic tundra (Disko Island; Greenland), EGU General Assembly 2025, Vienna, Austria, 27 Apr–2 May 2025, EGU25-12968, https://doi.org/10.5194/egusphere-egu25-12968, 2025.

EGU25-15164 | ECS | Posters on site | BG3.19 | Highlight

Arctic tundra soil microbiology retained effects from controlled in situ fire after 3 years 

Sofia Rodas, Carlos Arellano, Edith C. Hammer, Hangbang Zou, Fredrik Klingammer, Per Ambus, and Louise Rütting

Arctic wildfires disrupt biogeochemical cycles of carbon (C), nitrogen (N), and phosphorus (P), which challenges exposed tundra ecosystems. In this study, we investigated the legacy of variable fire intensity on soil microbial nutrient cycling in field experiments on Disko Island, West Greenland, three years post-fire. Despite finding no significant differences in gross N mineralization and consumption rates, high-intensity fire-treated soil microbes exhibited reduced degradation of a protein substrate in soil chips, suggesting altered microbial activity in organic N cycling pathways. These results highlight the return of some biogeochemical processes over time, and also reveal potential vulnerabilities in microbial communities and their functionality in legacy after high-intensity fire. As fire frequency in the Arctic is expected to increase due to climate change, long-term consequences for ecosystems may include shifts in microbial composition and nutrient cycling, and slow ecosystem recovery. The feedback could alter greenhouse gas emissions, accelerate permafrost thaw and cause ecosystem transformation. Understanding these processes is critical for predicting the wider ecological effects of more frequent and intense fires. Future research should focus on multi-temporal sampling and microbial dynamics to better capture fire-induced alterations and their cascading effects on Arctic ecosystems and global climate regulation.

How to cite: Rodas, S., Arellano, C., Hammer, E. C., Zou, H., Klingammer, F., Ambus, P., and Rütting, L.: Arctic tundra soil microbiology retained effects from controlled in situ fire after 3 years, EGU General Assembly 2025, Vienna, Austria, 27 Apr–2 May 2025, EGU25-15164, https://doi.org/10.5194/egusphere-egu25-15164, 2025.

EGU25-16291 | ECS | Posters on site | BG3.19

Does Reindeer Grazing Dictate Understory CO2 Exchange Responses to Snow Depth Changes in Boreal Forests? 

Noora Kantola, Maria Väisänen, A. Joshua Leffler, and Jeffrey M. Welker

Northern boreal forests are globally crucial sinks for atmospheric carbon dioxide (CO2) but, due to climate change, these sinks are at risk of switching to CO2 sources. Climate change affects winters for example by altering snow depth, with regional increases or decreases in snowfall. Since snow cover regulates key ecosystem processes in boreal forests, such changes may affect ecosystem functioning with possible consequences for CO2 exchange year-round. Climate change does not act alone but together with other factors such as herbivory. In boreal forests, reindeer (Rangifer tarandus L.; caribou in North America) is a key herbivore that affects understory vegetation — particularly lichen cover — which may, in turn, affect understory CO2 exchange. Yet, it remains largely unknown how the changing snow depth together with divergent reindeer grazing conditions affects CO2 exchange in the boreal forests.

To study these snow-grazer interactions on understory CO2 exchange, we conducted CO2 flux measurements during the snow-free season over four years in two Scots pine (Pinus sylvestris L.) forests in northern Fennoscandia. Using a manual chamber method, we measured CO2 exchange across snow depth manipulation treatments (i.e., ambient, reduced and increased snow depth) in areas of active reindeer grazing and adjacent areas where grazing had been excluded for 25 and 55 years.

We found that reduced and increased snow depths had opposing impacts on understory CO2 exchange, but only if reindeer had been excluded. Specifically, reduced snow depth increased the understory CO2 source strength while increased snow depth decreased it when reindeer had been excluded. In contrast, snow depth did not affect CO2 exchange in the presence of continuous reindeer grazing. These findings suggest that, in northern pine forests, changes in snow depth may unbalance the understory CO2 exchange with long-term reindeer absence. On the contrary, the presence of continuous reindeer grazing may enhance ecosystem resistance to changes in snow depth. We propose considering these snow-grazer interactions for accurate global C budget estimates in a changing winter climate in boreal forests.

How to cite: Kantola, N., Väisänen, M., Leffler, A. J., and Welker, J. M.: Does Reindeer Grazing Dictate Understory CO2 Exchange Responses to Snow Depth Changes in Boreal Forests?, EGU General Assembly 2025, Vienna, Austria, 27 Apr–2 May 2025, EGU25-16291, https://doi.org/10.5194/egusphere-egu25-16291, 2025.

EGU25-16730 | Orals | BG3.19

Contrasting shifts in snow depth as a driver of vegetation damage and soil carbon loss across the Arctic-Boreal region 

Frans-Jan W. Parmentier, Alexandra Pongracz, Marius Lambert, Rosie A. Fisher, Adrian Gustafson, Paul A. Miller, Sam S. Rabin, Ane Vollsnes, and David Wårlind

Climate change has a strong impact on the duration and thickness of snow cover across the Arctic-Boreal region – possibly with negative consequences for both vegetation productivity and permafrost carbon loss. For example, a loss of snow cover combined with strong frost can lead to frost drought, damaging vegetation through desiccation. In other cases, increases in atmospheric moisture content can cause more mid-winter snowfall. Thicker snow cover in permafrost areas deepens the active layer, possibly amplifying the loss of soil carbon. However, the potential for shifts in snow cover to damage vegetation and to enhance permafrost carbon loss remains poorly quantified.

We used the dynamic global vegetation model LPJ-GUESS to show that mid-winter snow depths will increase by the end of the century in the coldest, northernmost regions of the permafrost region. This insulates the soil, raising soil temperatures, increasing heterotrophic respiration and reducing relative carbon residence times. In addition, we reveal the mechanisms underlying plant damage from frost droughts with the demographic vegetation model CLM-FATES, by showing how this affects cold hardening and plant hydraulics. These results suggest that the changing winter climate may be an important driver of carbon loss across the Arctic-Boreal region.

How to cite: Parmentier, F.-J. W., Pongracz, A., Lambert, M., Fisher, R. A., Gustafson, A., Miller, P. A., Rabin, S. S., Vollsnes, A., and Wårlind, D.: Contrasting shifts in snow depth as a driver of vegetation damage and soil carbon loss across the Arctic-Boreal region, EGU General Assembly 2025, Vienna, Austria, 27 Apr–2 May 2025, EGU25-16730, https://doi.org/10.5194/egusphere-egu25-16730, 2025.

Organic and inorganic materials from atmospheric, aeolian, and subglacial origins on glacier surfaces are colonized by microorganisms, which produce extracellular polymeric substances to bind them into cohesive aggregates known as cryoconite. Dispersed across the glacier surface, these biologically active particulates may form cylindrical cryoconite holes through localized melting driven by their dark coloration, which strongly reduces surface albedo. Dispersed cryoconite serves as both a precursor and a transitional stage in the lifecycle of cryoconite holes, which can collapse and reform multiple times during the melting season. While cryoconite holes provide a stable environment that shields microbial communities from environmental extremes, dispersed cryoconite is exposed to intense solar irradiance, freezing temperatures, and desiccation. This contrast in environmental conditions experienced by the same material is hypothesized to significantly impact the microbial dynamics and ecological functioning of cryoconite.


In this study, we investigated the cryoconite microbiome from both cryoconite holes and dispersed cryoconite collected approximately 1 km from the margin of the Greenland Ice Sheet. By comparing the microbial communities in these two environments, we aimed to understand differences in their composition and diversity. Amplicon sequencing targeting the V3–V4 region of the 16S rRNA gene was applied to capture bacterial diversity directly from raw samples and cultured communities grown under various conditions, providing insights into both the overall bacterial composition and the subset of microbes that can be cultured.


We found that species diversity and evenness were significantly higher in dispersed cryoconite than in cryoconite holes, whereas species richness remained unaffected. The microbial composition also differed, with cryoconite holes exhibiting higher relative abundances of Proteobacteria and Actinobacteria, and a lower abundance of Cyanobacteria compared to dispersed cryoconite. Differential abundance analysis revealed significant enrichment of certain taxa in each environment, including several Cyanobacteria-associated taxa that were nearly absent in cryoconite holes but abundant in dispersed cryoconite. This contrast suggests that these Cyanobacteria may have developed advanced stress-adaptation strategies that may give them an advantage over other microorganisms in dispersed cryoconite, whereas their near absence in cryoconite holes could be driven by higher predation or other ecological pressures.


In summary, these findings underscore differences in microbial diversity between cryoconite holes and dispersed cryoconite, indicating that distinct environmental pressures may shape their microbial communities. By highlighting key differences in community composition, this work lays a foundation for future research into the broader microbial dynamics and ecological functions of cryoconite in polar environments. Further research is needed to elucidate the specific roles and succession dynamics of key taxa, such as Cyanobacteria.

How to cite: van Dijk, L.: Microbial Diversity in Cryoconite Holes and Dispersed Cryoconite Revealed Through Culture-Dependent and Culture-Independent Approaches, EGU General Assembly 2025, Vienna, Austria, 27 Apr–2 May 2025, EGU25-17205, https://doi.org/10.5194/egusphere-egu25-17205, 2025.

EGU25-18311 | ECS | Posters on site | BG3.19

Stress-Induced Shifts in Endometabolome Composition Reveal Microbial Adaptations on Glacier Surfaces 

Annika Morische, Marie Bolander Jensen, Yrsa Larsson, Kai Bester, Liane G. Benning, Martyn Tranter, and Alexandre M. Anesio

Surface microbial communities on the Greenland Ice Sheet play a vital role in modulating glacier surface melt by altering surface albedo through extensive algal blooms. The potential for extended melt season through a changing climate bears the fuel for microbial bloom expansion. However, the mechanisms governing bloom density and distribution, including the roles of microbially produced signalling and defensive compounds, remain poorly understood. This study investigates intracellular metabolic changes in supraglacial microbial communities under environmental stress to uncover factors regulating bloom dynamics and cell-to-cell communication. We employed high-resolution mass spectrometry (HRMS) to identify intracellular microbial secondary metabolites with ecological functions. The endometabolome composition was analysed to assess its response to abiotic stressors such as different light, pH, salinity and temperature conditions and its role in modulating bloom dynamics. Results indicate that light intensity strongly impacts supraglacial microbial communities' metabolic profiles, highlighting light conditions as a key driver of their ecological fitness. Our findings contribute to an expanding database of microbial metabolites and offer insights into the chemical diversity of glacier ecosystems in oligotrophic extreme environments.

How to cite: Morische, A., Bolander Jensen, M., Larsson, Y., Bester, K., Benning, L. G., Tranter, M., and Anesio, A. M.: Stress-Induced Shifts in Endometabolome Composition Reveal Microbial Adaptations on Glacier Surfaces, EGU General Assembly 2025, Vienna, Austria, 27 Apr–2 May 2025, EGU25-18311, https://doi.org/10.5194/egusphere-egu25-18311, 2025.

EGU25-19895 | Orals | BG3.19

Seasonal Dynamics of Microbial Communities in Tundra Ecosystems Across a Climatic Gradient 

Juanjo Rodríguez, Emily Pickering Pedersen, Chenxin Feng, Rebekka Gullvåg, Niki Leblans, Ellen Dorrepaal, Johan Olofsson, Karina Clemmensen, and Sara Hallin

The Arctic winter, which lasts for more than half the year, is not a simple, dormant phase as traditionally perceived. Instead, it involves active microbial processes under the snow cover, driven by soil temperature and moisture dynamics. These processes highlight the ongoing microbial activity and its potential interactions with the environment, challenging the notion of winter as a period of ecological dormancy. Variation in temperature, light, and snowfall  throughout the winter can influence these processes, and therefore it is essential to study how climate-induced changes affect the synchronization, or phenological matches, between plant and microbial activities. Disruptions in this synchrony could lead to

In this study, we focus on bacterial and fungal communities, and their diversity and functional dynamics during winter and summer in heath and meadow vegetation across a climatic gradient ranging from the oceanic climate of western Norway to the continental climate near the Swedish-Finnish border. By integrating microbial community data, based on 16S rRNA gene, ITS amplicon sequencing, and metatranscriptomics (total RNA sequencing), with environmental and plant activity measurements, this study seeks to unravel the interactions between microbes and their environment, and particularly how they adapt to and function during the cold season. This research will provide critical insights into how winter conditions shape microbial community structure and function, ultimately enhancing our ability to predict the impacts of climate change across different Arctic ecosystems.

How to cite: Rodríguez, J., Pickering Pedersen, E., Feng, C., Gullvåg, R., Leblans, N., Dorrepaal, E., Olofsson, J., Clemmensen, K., and Hallin, S.: Seasonal Dynamics of Microbial Communities in Tundra Ecosystems Across a Climatic Gradient, EGU General Assembly 2025, Vienna, Austria, 27 Apr–2 May 2025, EGU25-19895, https://doi.org/10.5194/egusphere-egu25-19895, 2025.

EGU25-1224 | ECS | Posters on site | BG3.21

14C and GHG dynamics in bog pools of a rewetted peatland 

Laura Baugh, Michael Peacock, Joshua Dean, Mark Garnett, Richard Chiverrell, Rachel Harvey, and Jennifer Williamson

Rewetted peatlands can have higher methane (CH4) emissions compared to undrained peatlands. However, the majority of studies have focussed on terrestrial emissions and have overlooked waterbodies such as pools and remnant ditches, and consequently, emissions from peatland waterbodies remain largely unknown. This study is primarily focusing on greenhouse gas (GHG) emissions from peatland waterbodies from two contrasting UK bogs: A lowland raised bog in north-west England (Risley Moss) and an upland blanket bog in north Wales (Migneint). Seasonal sampling of dissolved and ebullitive greenhouse gases (GHGs) is ongoing. In October 2024, sampling for radiocarbon (14C) analysis of aquatic CH4 and carbon dioxide (CO2) was completed at the Migneint site. Both diffusive and ebullitive pathways were sampled at 3 locations (a newer restoration pool, an older restoration pool and a natural pool). We will use the results of these analyses to answer the following questions:

1) Does the 14C age of CH4 and CO2 vary between ebullitive and diffusive fluxes?

2) Does the 14C age of CH4 and CO2 vary between natural and restored pools, and with time since restoration?

To date there is very limited data for the difference of ages between ebullitive and diffusive fluxes of different GHGs with no research previously asking this question. The use of ¹⁴C will help to determine the pathways of C between the different pool types and determine if the age of pathways varies between timescales of restoration and natural pools. ¹⁴C will also help determine if in fact older rewetted sites have become more stable in relation to age of C emissions and show if the pathways have shifted towards more modern C. Preliminary data for these questions will be presented during this session. It is hoped that the answers to these questions will help fill data gaps from these poorly understood waterbodies and improve our understanding of the GHG impacts of peatland restoration strategies. In future work we will expand the radiocarbon analysis to Risley Moss and other peatlands.

How to cite: Baugh, L., Peacock, M., Dean, J., Garnett, M., Chiverrell, R., Harvey, R., and Williamson, J.: 14C and GHG dynamics in bog pools of a rewetted peatland, EGU General Assembly 2025, Vienna, Austria, 27 Apr–2 May 2025, EGU25-1224, https://doi.org/10.5194/egusphere-egu25-1224, 2025.

EGU25-1309 | ECS | Orals | BG3.21 | Highlight

Wildfire, Degradation and Climate Change: A Triple Threat for the Northern Peatland Carbon Sink 

Sophie Wilkinson, Roxane Andersen, Paul Moore, Scott Davidson, Gustaf Granath, and Mike Waddington

The northern peatland carbon sink is critical for the regulation of the Earth’s climate, however, it is experiencing increasing stressors due to both anthropogenic and climate-mediated disturbances. This talk will discuss the impact of compounding disturbances on northern peatlands and present a large-scale modelling effort to quantify the effect on medium-term (100-yr) carbon dynamics. Direct, anthropogenic disturbance such as peatland drainage for horticultural, agricultural, forestry or development purposes, disrupts the ecohydrological feedbacks that promote the resilience of peatlands to other disturbances. Climate change stressors such as long-term drying and increased severity of drought can have similar or compounding effects. When degraded ecosystems are impacted by wildfire they tend to burn much more severely than their pristine counterparts, releasing around ten times more carbon into the atmosphere. There is considerable spatial variability in carbon losses due to variation in peat properties and ecohydrological conditions. Further, there is limited understanding of the post-fire carbon fluxes in degraded systems and the potential to exacerbate or dampen the initial carbon losses. To better understand the impact of these disturbance interactions on the globally-important northern peatland carbon stock, we collated empirical datasets from natural, degraded and restored peatlands in non-permafrost regions to model net ecosystem exchange and methane fluxes, integrating peatland degradation status, wildfire combustion severity and post-fire dynamics. Here, I present the results of our study including the likely impacts of climate change over the remainder of the century.

How to cite: Wilkinson, S., Andersen, R., Moore, P., Davidson, S., Granath, G., and Waddington, M.: Wildfire, Degradation and Climate Change: A Triple Threat for the Northern Peatland Carbon Sink, EGU General Assembly 2025, Vienna, Austria, 27 Apr–2 May 2025, EGU25-1309, https://doi.org/10.5194/egusphere-egu25-1309, 2025.

EGU25-1394 | ECS | Orals | BG3.21

Predicting fire risk for Scotland’s peatlands using statistical models based on weather conditions 

Praveen Rao Teleti and Roxane Andersen

Peatlands are globally important carbon-rich ecosystems but are increasingly vulnerable to fire risk due to climate change and human activity. Predictive modeling of peatland fire risk is essential for effective management and mitigation, particularly in regions like Scotland, where extensive peatlands face unique climatic and ecological pressures. This study aims to develop a weather-driven predictive framework for peatland fire risk, focusing on the weather data (e.g., temperature, precipitation, relative humidity) with drought and climate indices (e.g., SPEI, NAO) to enhance prediction accuracy for Scotland’s peatlands. Statistical models including machine learning (ML) techniques are utilized to capture seasonality, spatial variability and fine-scale hydrological dynamics in the fire risk. The study also evaluates the predictive skill of linear Log-Reg and ML-based models, proposing the best model to use to predict peatland fire risk probability. We highlight the gaps in peatland-specific fire modeling, and suggest future research priorities to effectively address and to improve fire risk predictions and inform peatland management strategies in Scotland and similar ecosystems.

How to cite: Teleti, P. R. and Andersen, R.: Predicting fire risk for Scotland’s peatlands using statistical models based on weather conditions, EGU General Assembly 2025, Vienna, Austria, 27 Apr–2 May 2025, EGU25-1394, https://doi.org/10.5194/egusphere-egu25-1394, 2025.

EGU25-1797 | ECS | Orals | BG3.21

Legacy Carbon Awakens: Permafrost and Grassland Responses to Himalayan Warming 

Sarwar Nizam, Sanjeev Kumar, Mohammad Atif Khan, Kai Mangelsdorf, Christian Hallmann, Stefanie Pötz, Susanne Liebner, Siddhartha Sarkar, Amzad Hussain Laskar, Rahul Kumar Agrawal, and Dirk Sachse

Climate change threatens the Himalayas and the billions of people dependent on its resources and water. Warming temperatures lead to melting glaciers, extended growing seasons, and the degradation of permafrost and peatlands, releasing significant amounts of carbon stored for millennia. This process alters ecosystems and triggers cascading effects on soil and vegetation. How permafrost thaw alters carbon cycling within different landscapes is an open question in many ecosystems. Here, we investigate soil organic carbon dynamics in a permafrost and two wetland sites located at different elevation in the western Himalayas also characterized by cold arid climate, glacial and riverine resources, and geothermal activity in one wetalnd. Gas chambers were deployed to quantify CO2 and CH4 fluxes and revealed that the permafrost (Tsoltak) and wetland sites (Ganglass and Puga) are substantial sources of CH4 during the post monsoon season in 2023. While Ganglass and Puga (water–logged sites at lower elevations) act as CO2 sinks, Tsoltak, a more arid site at higher elevation, predominantly exhibits CO2 emissions indicating different microbial decomposition. High methane fluxes observed at wetter locations exhibited by relatively lower stable carbon isotope ratio (δ¹³C) indicating predominance of hydrogenotrophic methanogenesis. In contrast, relatively lower CH4 fluxes with enriched δ¹³C–CH4 signature at Tsoltak point towards acetoclastic methanogenesis coupled with limited CH4 oxidation. Upscaling the median permafrost carbon flux measurements from our study sites to the estimated permafrost area in the entire western Himalaya suggests a potential annual CO2–equivalent carbon emission of up to 1.2 Tg (1 Tg = 1012 g). The bulk soil organic matter analyzed near each chamber revealed 8.5–9.5 kg C m-2 in permafrost soil, nearly three times the amount observed in marshy grassland. Organic matter source proxies, including bulk soil δ¹³C and biomarker (n–alkanes) characteristics such as average chain length, carbon preference index, odd–over–even preference index, and n–alkane ratio, exhibited consistent signatures across the sites. This indicates similar organic matter sources, primarily C3–type grasses, macrophytes, aquatic plants and possibly microbes. The subsurface soil-respired δ¹³C–CO₂ values were higher compared to bulk organic matter but significantly lower than the local ambient air. The ¹⁴C–CO₂ ages indicated a mixture of modern and ancient carbon sources, suggesting the release of legacy carbon from the permafrost. Our findings offer initial insights into the organic carbon cycling in degrading Himalayan permafrost and peatlands under increasing stress of global warming. This will enhance understanding and predictions of soil carbon dynamics in the warmer and wetter Himalayas projected for the late 21st century.

How to cite: Nizam, S., Kumar, S., Khan, M. A., Mangelsdorf, K., Hallmann, C., Pötz, S., Liebner, S., Sarkar, S., Laskar, A. H., Agrawal, R. K., and Sachse, D.: Legacy Carbon Awakens: Permafrost and Grassland Responses to Himalayan Warming, EGU General Assembly 2025, Vienna, Austria, 27 Apr–2 May 2025, EGU25-1797, https://doi.org/10.5194/egusphere-egu25-1797, 2025.

EGU25-2282 | ECS | Orals | BG3.21

Plant-microbe interactions underpin the contrasting enzymatic responses to wetland drainage 

Yunpeng Zhao, Chengzhu Liu, Enze Kang, and Xiaojuan Feng

The tremendous carbon storage of wetlands is closely related to the inhibited enzyme (especially phenol oxidase) activity under oxygen-deprived conditions, which is a rate-limiting step in carbon decomposition. However, phenol oxidase response to field drainage is highly uncertain, constraining our ability to predict wetland carbon-climate feedbacks. Here, using literature data, laboratory simulations, and a pair-wise survey of 30 diverse wetlands experiencing long-term (15–55 years) drainage across China, we show that in contrast to short-term drainage where oxygen exposure generally increases phenol oxidative activity, its response to long-term drainage diverges in Sphagnum vs. non-Sphagnum wetlands. By employing soil metagenomic and plant metabolic analyses, we further demonstrate that long-term drainage increases plant secondary metabolites in non-Sphagnum wetlands, thereby decreasing phenol oxidase-producing microbes and phenol oxidative activity. In contrast, phenol oxidative activity increases in drained Sphagnum wetlands due to replacement of Sphagnum rich in phenolic, antimicrobial metabolites by vascular plants. Therefore, plant-microbe interactions underpin the divergent responses of phenol oxidase to field drainage in Sphagnum vs. non-Sphagnum wetlands, with cascading effects on hydrolytic enzyme activity and decomposition processes. Our findings highlight that trait-based plant dynamics are pivotal to decipher wetland carbon dynamics and feedback to climate change under shifting hydrological regimes. 

How to cite: Zhao, Y., Liu, C., Kang, E., and Feng, X.: Plant-microbe interactions underpin the contrasting enzymatic responses to wetland drainage, EGU General Assembly 2025, Vienna, Austria, 27 Apr–2 May 2025, EGU25-2282, https://doi.org/10.5194/egusphere-egu25-2282, 2025.

EGU25-3812 | Posters on site | BG3.21

Peatlands and Climate Change: Survival of the Deepest 

James Michael Waddington, Alex Furukawa, Owen Sutton, Kyra Simone, Greg Verkaik, Rosanne Broyd, Paul Moore, Brandon Van Huizen, Maia Moore, and Alex Clark

Northern peatlands provide important ecosystem services and while these ecosystems are facing large increases in the frequency and severity of climate-mediated disturbances (e.g., wildfire, drought), they are generally resilient to these disturbances. Numerous autogenic feedbacks operate within peatlands that regulate their response to changes in seasonal water deficit. However, our recent research has determined that shallow peatlands have greater water table variability and drawdown rates, moisture stress and depths of burn than deeper peatlands. Moreover, we found that peatland carbon sequestration was significantly lower during periods when the water table became hydrologically disconnected from near-surface peat, which occurs more often in shallow peatlands. This suggests that shallow peatlands are less resilient to disturbance due to the limited capacity of their autogenic ecohydrological feedback mechanisms to mitigate disturbance, when compared to deeper peatlands.

We explore how several autogenic feedbacks change in sign and strength with increasing peatland depth and argue that shallow peatlands represent sentinels for climate change; acting as a bellwether for deeper peatlands in a future with more frequent, prolonged, and intense water deficits. We suggest that an explicit quantification of peatland feedback mechanisms across a gradient of hydroclimatic settings, and the thresholds and constraints they operate under, will help identify systems at greatest risk for loss of function or catastrophic degradation under climate change. Furthermore, this work provides insight into peatland restoration and peatland evolution as all deep peatlands were, at one point, shallow and perhaps at the height of their vulnerability.

How to cite: Waddington, J. M., Furukawa, A., Sutton, O., Simone, K., Verkaik, G., Broyd, R., Moore, P., Van Huizen, B., Moore, M., and Clark, A.: Peatlands and Climate Change: Survival of the Deepest, EGU General Assembly 2025, Vienna, Austria, 27 Apr–2 May 2025, EGU25-3812, https://doi.org/10.5194/egusphere-egu25-3812, 2025.

EGU25-4836 | Orals | BG3.21

Percolation through peat profiles controls organic matter transformation in different mire types 

Stephan Glatzel, Fred Worrall, and Gareth Clay

We hypothesize that organic matter transformation in peatlands will be constrained where there is limited percolation of water through the soil profile. For mire types with more restricted percolation we hypothesize that thermodynamic closure of the pore space will occur deeper in the soil profile and there will be a greater extent of organic matter transformation. In this study 13 peat cores from 8 different peatlands were collected and analysed for their Gibbs free energy of formation, carbon oxidation state, degree of unsaturation, and protein fraction as determined by thermogravimetric analysis. The sites were chosen so that it was possible to examine the difference in peat profile between fens and bogs, and between natural and degraded sites. The study showed that fens and degraded sites showed significantly greater extent of organic matter transformation than observed for either bogs or natural sites. There was a consistent increase in the degree of unsaturation with depth that marked an evolution away from cellulose dominated composition and toward lignin-dominated compositions at depth.

These results support our study hypothesis that greater percolation through sites results in greater transformation and shows that peatlands can be distinguished between the stable and unstable; and the vulnerable and invulnerable. Therefore, stagnant as well as high water tables promote organic matter storage.

How to cite: Glatzel, S., Worrall, F., and Clay, G.: Percolation through peat profiles controls organic matter transformation in different mire types, EGU General Assembly 2025, Vienna, Austria, 27 Apr–2 May 2025, EGU25-4836, https://doi.org/10.5194/egusphere-egu25-4836, 2025.

EGU25-5712 | ECS | Orals | BG3.21

Establishment of sulfate-driven anaerobic methanotrophs in a rewetted coastal peatland 

Sara E. Anthony, Cordula Gukekunst, Klaus-Holger Knorr, Dominik H. Zak, Gerald Jurasinski, and Susanne Liebner

Coastal peatlands are believed to exert a substantial influence in mitigating climate change and many of these valuable ecosystems have been drained for agriculture, becoming significant carbon sources. The impact of draining and re-wetting a peatland on the microbial community is of great importance for our comprehension of carbon cycling. The balance between methane producing (methanogenic) and methane oxidizing (methanotrophic) microbial communities, and the interaction with other nutrient cycling microbes is especially important. Multiple recent studies have found methanotroph abundance to be smaller than methanogen abundance post rewetting, potentially leading to prolonged high methane emissions. Anaerobic methanotrophs (ANME) are especially known to be slow growing and it remains unknown if they can establish in rewetted coastal fens at all. The former coastal peat-forming brackish marsh Drammendorf, located in NE Germany, was drained in the 1970s to be used as grassland. In 2019 it was rewetted with brackish water from the adjacent Kubitzer lagoon system. To track how the microbial community adapted to new conditions, samples for 16S rRNA and metagenomic sequencing were collected at three timepoints: in 2019 before the rewetting; in 2020 6-9 months after rewetting; and again in 2022, approximately 2.5 years post rewetting. The first results reveal an increase in methanogen abundance and diversity that outpaces that of methanotrophs, as well as a strong sulfur and iron cycling community. In addition, sulfate-driven anaerobic methanotrophs (ANME-2a/2b) appear to be establishing a presence in the subsurface 2.5 years after rewetting, which has never before been observed in a rewetted peatland. The establishment of these specialized methanotrophs has potential implications for coastal methane emissions, especially as global climate change induces progressive sea level rise. Understanding the reasons why they establish in certain new peatland habitats may lead to the ability to support establishment in other environments.

How to cite: Anthony, S. E., Gukekunst, C., Knorr, K.-H., Zak, D. H., Jurasinski, G., and Liebner, S.: Establishment of sulfate-driven anaerobic methanotrophs in a rewetted coastal peatland, EGU General Assembly 2025, Vienna, Austria, 27 Apr–2 May 2025, EGU25-5712, https://doi.org/10.5194/egusphere-egu25-5712, 2025.

EGU25-6070 | ECS | Posters on site | BG3.21

The role of earthworms and water infiltration in clay mixing in peat meadows 

Lyanne van den Berg and Maaike van Agtmaal

Peat meadows in the Netherlands emit around 3% of the country’s total CO2 emissions. Measures to reduce the CO2 emissions in agricultural peat areas are mostly based on water management, the clay-in-peat project researches a soil based measure: the addition of 1-2 cm of clay on top of a peat meadow. In lab experiments, where the peat and clay are completely mixed, some combinations of clay and peat show a reduction of CO2. It is still unclear what the working mechanisms of clay in peat are. These could vary from clay-peat-complex formation to the binding of enzymes or changes in the pore structure.

In field applications we see large differences between fields as to how the clay is spreading through the peat profile. This variation could influence the effectiveness of the measure depending on the working mechanism.

Clay can be transported and transformed by various processes such as biological activity or infiltration into the soil with water. It is not yet known how the clay could infiltrate into a peat meadow, and which processes are most important.

We want to understand how clay spreads through the profile in a peat meadow. The way the clay is spread determines how it is present and in what way it could influence the emission of greenhouse gasses. A better understanding of the way the clay moves could help explain CO2 measurement and the effects of various clay types.

We have set up an experiment using columns (30 cm height, 9 cm diameter) both hand-filled with peat and intact cores of a peat meadow. To all columns a layer of 1 cm clay was applied. To half of these columns three earthworms were added. And half of the columns received a ‘rain’ treatment. After 2 and 4 months the columns were harvested to find out how the clay had spread.

The worm treatment had most effect on the spreading of the clay. The water treatment did displace the clay, however, the total amount of displaced clay was lower than in the worm treatment. It was clearly visible that clay transported by worms settles in clumps and the water caused settling layers. There was no clear difference between the worm and the worm+water treatment.

In this experiment the role of soil fauna is most important in spreading the clay. Understanding the mechanisms that spread clay through the peat profile can help assess the suitability of a certain field or clay type for emission reduction using the clay-in-peat method. Furthermore an understanding of the clay mixing could help explain the results of CO2-measurements in clay in peat sites.

How to cite: van den Berg, L. and van Agtmaal, M.: The role of earthworms and water infiltration in clay mixing in peat meadows, EGU General Assembly 2025, Vienna, Austria, 27 Apr–2 May 2025, EGU25-6070, https://doi.org/10.5194/egusphere-egu25-6070, 2025.

EGU25-7613 | ECS | Orals | BG3.21

Shallow Peatlands as Sentinels of Climate Change 

Owen Sutton, Paul Moore, Alex Furukawa, Paul Morris, and James Waddington

The ecosystem services provided by northern peatlands has motivated the profusion of research into their carbon and water storage functions and the processes that maintain these functions. Yet typically this research has been conducted in deep, laterally extensive peatlands. These systems exhibit numerous regulatory mechanisms that enhance resilience to disturbances like wildfire and stressors like climate. In contrast, shallow peatlands have demonstrated greater vulnerability to external environmental pressures, exhibiting higher moss moisture stress, lower net carbon sequestration, and higher burn severity.

Given that climate change is anticipated to enhance drying in northern peatlands, and increase the frequency, severity, and areal extent of wildfire, we suggest that the contemporary biogeochemical and hydrological behaviour of shallow peatlands presages the future behaviour of deep peatlands. The limited capacity of autogenic feedback mechanisms operating in shallow peatlands to regulate their environment offers a valuable opportunity to study the boundaries of peatland resilience – an opportunity only available with ecosystems that are operating on the margins of survivability. We advocate for the study of shallow peatlands to understand: 1) their spatial distribution and hydroclimatic envelope; 2) the strength of their regulatory mechanisms; 3) tipping points that manifest in these regulatory mechanisms; and 4) identification of metrics that indicate when thresholds have been exceeded. This will not only further our process-based understanding of peatland regulatory feedbacks, but also aid in peatland restoration, and contribute to our conceptualization of peatland development.

How to cite: Sutton, O., Moore, P., Furukawa, A., Morris, P., and Waddington, J.: Shallow Peatlands as Sentinels of Climate Change, EGU General Assembly 2025, Vienna, Austria, 27 Apr–2 May 2025, EGU25-7613, https://doi.org/10.5194/egusphere-egu25-7613, 2025.

EGU25-9841 | ECS | Orals | BG3.21

Impact of Climate Change on Carbon Accumulation Rates in Irish Blanket Bogs Over the Last Millennium 

Nannan Li, Helen Shaw, Cathal Ryan, Sean Pyne-O'Donnell, and Lisa Orme

Peatlands store the most carbon per unit area than any other terrestrial ecosystem and play a crucial role in mitigating greenhouse gas emissions. Gaining a better understanding of how peatlands have responded to past climate changes could be key to predicting how these ecosystems will react to future climate change. While the sensitivity of boreal peatland carbon pools to climate change has been studied extensively, there is limited understanding of how the carbon accumulation rates of blanket bogs may change under future global warming. The fate of blanket bogs, particularly changes in their carbon sequestration capacity, is a concern for the entire peatland community, given their unique ecosystems, narrow ecological niches, and cultural significance.

Funded by Science Foundation Ireland, the PCARB project (Past CARbon accumulation by Irish Blanket bogs) aims to investigate the influence of past climate on the carbon accumulation rates of Irish blanket bogs, based on 30 blanket bog records developed under varying climate and geomorphological conditions. Here, we present the preliminary results of carbon accumulation rates (CAR) over the last millennium from four of these 30 blanket bogs in Ireland. Our preliminary findings indicate that the Medieval Warm Period was associated with relatively lower CAR compared to the Little Ice Age, during which CAR was higher, despite some centennial-scale variability. Although these results may change as new datasets are incorporated, our initial findings suggest that ongoing warming could slow the carbon accumulation capacity of Irish blanket bogs. It is important to note that, within the last millennium, in the absence of significant human disturbance, natural climate variability did not cause the blanket bogs to shift to a ‘carbon source’, despite their sensitive response to short-term climate fluctuations. Therefore, careful protection and management in the future will be crucial to maintaining blanket bogs as active ‘carbon sinks’.

How to cite: Li, N., Shaw, H., Ryan, C., Pyne-O'Donnell, S., and Orme, L.: Impact of Climate Change on Carbon Accumulation Rates in Irish Blanket Bogs Over the Last Millennium, EGU General Assembly 2025, Vienna, Austria, 27 Apr–2 May 2025, EGU25-9841, https://doi.org/10.5194/egusphere-egu25-9841, 2025.

EGU25-10109 | ECS | Orals | BG3.21

Assessing Plant-Microbial Interactions and Organic Matter Composition in European Peatlands 

Carrie L. Thomas, Janna M. Barel, Yvet Telgenkamp, Klaus-Holger Knorr, and Bjorn J. M. Robroek

Peatlands are among the most carbon-dense terrestrial ecosystems, holding approximately one-third of the global soil carbon despite covering only a small percentage of Earth's land area. However, their ability to act as carbon sinks is under threat from widespread warming and associated climate changes, which may disrupt the intricate ecological processes underpinning their functioning as carbon sinks.

Plant and microbial community interactions are central to peatland functioning, driving both primary production and decomposition, the key processes influencing carbon sequestration. Environmental and climate fluctuations often alter these community assemblages, potentially reshaping plant-microbial networks and their complexity. Despite their significance, the responses of these networks to enviro-climatic changes remain poorly understood.

To address this gap, we evaluated plant-microbial networks in fifteen European peatlands spanning a climatic and enviro-climatic gradient (incl. temperature, precipitation, nutrient deposition). Using vegetation and microbial composition data, we assessed changes in diversity within plant and microbial communities, plant-microbe networks structure, and network complexity along this gradient. Additionally, we link plant-microbe network topological characteristics to organic matter – detailed by Fourier-transform infrared (FTIR) spectroscopy – to assess the role of plant-microbe interaction on carbon cycling processes.

Preliminary analyses reveal that vegetation composition exhibits limited variation across the climate gradient, whereas microbial communities show pronounced differences. Our findings underscore the potential role of microbial communities as key drivers of ecosystem responses to environmental change, suggesting that shifts in microbial composition could have significant implications for the peatland carbon sink function under future climate scenarios.

How to cite: Thomas, C. L., Barel, J. M., Telgenkamp, Y., Knorr, K.-H., and Robroek, B. J. M.: Assessing Plant-Microbial Interactions and Organic Matter Composition in European Peatlands, EGU General Assembly 2025, Vienna, Austria, 27 Apr–2 May 2025, EGU25-10109, https://doi.org/10.5194/egusphere-egu25-10109, 2025.

EGU25-10510 | Orals | BG3.21

Modelling Carbon Dynamics and Restoration Strategies across Peatlands in Scotland 

Bhaskar Mitra, Betsy Cowdery, Mhairi Coyle, Gillian Donaldson-Selby, Rebekka R.E. Artz, and Jagadeesh Yeluripati

Peatlands, covering just 3% of Earth’s surface, hold 15–30% of global soil carbon stocks. However, land use and drainage contribute 5–10% of human-driven CO₂ emissions, depleting long-stored carbon. In the UK, peatlands span 12% of land, emitting 23,100 kt CO₂e annually. Scotland, where peatlands cover 20–25%, has a net-zero by 2045 targets, and aims to counter current estimated peatland emissions of 8.8–9.7 Mt CO₂ annually via restoration efforts. Peatland carbon dynamics under varying drainage and rewetting conditions as well as under different future climate change scenarios (Representative Concentration Pathway (RCP) scenarios—RCP 2.6 and RCP 8.5) were therefore explored using the ecosystem model Wetland-DNDC across two contrasting sites. 

One site, located at Cross Lochs in Forsinard (UK-CLS), represents a near-natural blanket bog that currently serves as a robust carbon sink, whereas the other, an eroding oceanic blanket bog in the Cairngorms (UK-BAM), acts as a net source of carbon dioxide emissions. Prior to hydrological simulation, Wetland-DNDC runs across each of the two sites were validated against eddy covariance derived net ecosystem exchange (NEE), gross primary productivity (GPP), ecosystem respiration (ER) and evapotranspiration data (ET).

Compared to baseline scenario of no drainage, continuous drainage at 5 cm from 1861 till 2020 and then rewetting to 5 cm from 2020 to 2100 induced different rates of recovery for the three dominant vectors of carbon exchange. For example, increase in the sequestration capacity (NEE) by 84% across UK-BAL compared to 21% across UK-CLS at the end of simulation period was triggered by corresponding increase in GPP.  However, neither the undrained baseline scenario at Balmoral nor the drained state at CrossLochs can be validated, which introduces a degree of uncertainty in interpreting these simulated outcomes.

Ongoing efforts aim to evaluate the combined effects of peatland management practices (e.g., drainage at varying depths) and climate change (including extreme events) on GHG flux dynamics. Using Wetland-DNDC and its simplified stochastic (random forest) meta-model framework, these analyses will improve the reliability of carbon audit tools in assessing the benefits of peatland restoration under future climate scenarios. This approach will also enable spatial modelling of CO₂ emissions across Scotland's peatlands and support the development of more accurate Tier 2 emission factors for the UK, aligning with national and global climate mitigation goals.

How to cite: Mitra, B., Cowdery, B., Coyle, M., Donaldson-Selby, G., Artz, R. R. E., and Yeluripati, J.: Modelling Carbon Dynamics and Restoration Strategies across Peatlands in Scotland, EGU General Assembly 2025, Vienna, Austria, 27 Apr–2 May 2025, EGU25-10510, https://doi.org/10.5194/egusphere-egu25-10510, 2025.

The future of northern peatlands as long-term sinks for atmospheric carbon (C) has traditionally been thought to hinge on understanding the response to changing abiotic factors, while the complex biological interactions that underpin ecosystem processes – including C dynamics – have been overlooked.  While biodiversity research in other ecosystems suggests that species-rich communities are more stable against environmental pressures – the backbone mechanism being asynchronous responses of species to changes in enviro-climatic conditions – this relationship remains poorly understood in peatlands. Hence, in peatland science, we lack fundamental research that addresses the role of biodiversity in safeguarding the apparent C sink function.

Our research challenges two fundamental assumptions in peatland ecology: first, that species diversity invariably enhances ecosystem stability, and second, that abiotic drivers predominantly control carbon dynamics. Through replacement series experiments with Sphagnum mosses, we show that co-occurring peat moss assemblages offer surprisingly limited insurance against functional collapse under severe drought. These findings strikingly parallel earlier work from a cross-continental study and experimental field work where we show a negligible effect of plant species diversity on ecosystem functioning. Instead, our work highlights fast changes in plant-microbe interactions, which we link to shifts in peatland C cycling. Hence, we propose a paradigm shift in peatland ecosystems: rather than focusing solely on abiotic conditions or plant diversity, we must explicitly consider plant-microbe interactions to understand the response of the peatland C sink to future climate.

How to cite: Robroek, B., Telgenkamp, Y., Thomas, C., and Jassey, V.: The biodiversity-ecosystem function paradox: why peatland plant diversity fails to protect the peatland carbon sink function under climate change, EGU General Assembly 2025, Vienna, Austria, 27 Apr–2 May 2025, EGU25-10758, https://doi.org/10.5194/egusphere-egu25-10758, 2025.

EGU25-10847 | ECS | Posters on site | BG3.21

Modelling the effects of rewetting on peatland CH4 dynamics 

Frederikke Krogh Corydon, Klaus Steenberg Larsen, Jesper Riis Christiansen, Michael Bekken, and Guy Schurgers

Undisturbed peatlands accumulate vast amounts of carbon in peat over long timescales. This is enabled by the presence of a high water table creating unfavourable conditions for organic matter decomposition, causing carbon uptake by vegetation to exceed carbon release. Drainage for agriculture and forestry purposes greatly influences the greenhouse gas (GHG) balance of peatlands by accelerating peat decomposition due to enhanced aeration. Although drained peatlands are associated with lower methane (CH4) emissions than their pristine counterparts, it is estimated that drained peatlands contribute 5% of global anthropogenic CO2 emissions.

Rewetting by ditch blocking is currently being widely proposed as an instrument to revert the GHG balance of drained peatlands to pre-drained conditions. However, complex process interactions at the ecosystem scale, along with a trade-off between CO2 and CH4 emissions, make it difficult to determine the optimal management of the water table from a climate change mitigation perspective. Most importantly, we lack both observational data and understanding of rewetting trajectories at timescales relevant to climate forcing effects (decadal, centennial), to properly assess the climate impact and timeframe of rewetting as a management strategy.

We address this lack of longer-term observational timeseries from rewetted sites by developing a new process-based peatland model, building on data from different sites at varying stages post-rewetting. Combining modelling with a space-for-time substitution we can investigate how the CO2 and CH4 dynamics of a drained peatland respond to rewetting on decadal timescales and improve our mechanistic understanding of the interactions between peatland hydrology, vegetation and biogeochemistry. Ultimately, we aim to provide an estimate of how long it takes for a rewetted peatland to become climate neutral.

We build the model as a combination of empirical and mechanistic relations featuring the main plant and soil microbial processes necessary to simulate CO2 and CH4 exchange, while aiming for a simpler design than the complex ecosystem models that are often hard to constrain and parameterise.

Here, we present the overall conceptual model design and the first modelling results where we have used in situ CH4 fluxes in high temporal and spatial resolution from drained and rewetted peatland sites in Trysil, Norway, to parameterise and evaluate our model. The CH4 module simulates the main production, oxidation and transport processes controlling net CH4 fluxes and serves as a first model iteration to be incorporated in the full model simulating both CO2 and CH4 dynamics in rewetted peatlands over time.

How to cite: Corydon, F. K., Steenberg Larsen, K., Riis Christiansen, J., Bekken, M., and Schurgers, G.: Modelling the effects of rewetting on peatland CH4 dynamics, EGU General Assembly 2025, Vienna, Austria, 27 Apr–2 May 2025, EGU25-10847, https://doi.org/10.5194/egusphere-egu25-10847, 2025.

EGU25-10856 | Orals | BG3.21

Groundwater level management in peat pastures: trade-offs between yield, N2O and CO2 emissions 

Jan Willem Van Groenigen, Jordy Van 't Hull, Erne Blondeau, Mart Ros, and Gerard Velthof

Draining peatlands for agricultural use is associated with large emissions of CO2 to the atmosphere because of peat decomposition. In countries with significant amounts of agricultural peatlands, such as the Netherlands, raising the groundwater level (GWL) using a variety of techniques is explored as a measure to mitigate CO2 emissions. However, these measures risk trade-offs with yield as well as with N2O emissions. Here, in two experiments we quantify the effects of GWL management on these trade-offs in pastures on peat soil in the Netherlands. First, in a five year field experiment on an experimental farm N2O and CO2 emissions as well as grass yield were measured on four fields differing in ditch water level (DWL; on average -20 cm vs -50 cm) as well as active vs passive groundwater infiltration. Subsequently, we studied GHG emissions in more detail in a one year lab experiment with large (1 m height, 24 cm diameter) undisturbed and unfertilized bare peat columns from the same site as well as from two additional locations. The column experiment also allowed us to explore more constant and more extreme GWLs, ranging from 0 to -150 cm. Under unfertilized conditions, increasing the DWL did not affect CO2 emissions in the field. However, N2O emissions decreased from approx. 4.5 to 2.2 kg N2O-N ha-1 yr-1 and yield from 10.3 to 8.8 Mg ha-1 yr-1, both probably reflecting a reduction in N mineralization. At high DWL (-20 cm), active groundwater infiltration resulted in lower CO2 emissions than either passive infiltration or the control without infiltration. After fertilization, emission factors ranged from 2.5% of applied N for cattle slurry to 5.2% for calcium ammonium nitrate. No significant relations between N2O emissions and infiltration type or DWL level were detected. In the column experiment, effects of GWL on CO2 emissions were more pronounced, with highest emissions at a GWL of -80 and a large emission reduction at GWLs close to 0. However, N2O emissions of the unfertilized columns were strongly increased when GWLs varied between 0 and -20 cm, resulting in higher GHG emissions in terms of CO2-equivalents than at drier conditions. Our results show complex relations between water management and CO2, N2O and yield in peat soils, with no obvious strategy to find an optimum. The results from our column experiment suggest that total inundation without fertilization would result in minimal GHG emissions, but this could obviously not be combined with any traditional forms of farming and may result in methane emissions. Our field experiment suggests that the combination of high DWL with active infiltration systems results in lower CO2 emissions at a relatively small yield penalty. However, for large-scale implementation of such a system, the costs of the technical setup have to be considered, as well as the relatively small reduction in CO2 emissions.   

How to cite: Van Groenigen, J. W., Van 't Hull, J., Blondeau, E., Ros, M., and Velthof, G.: Groundwater level management in peat pastures: trade-offs between yield, N2O and CO2 emissions, EGU General Assembly 2025, Vienna, Austria, 27 Apr–2 May 2025, EGU25-10856, https://doi.org/10.5194/egusphere-egu25-10856, 2025.

EGU25-11132 | Posters on site | BG3.21

The resilience and recovery of two globally important Sphagnum species to drought 

James Benjamin Keane, Gareth D. Clay, Emma L. Shuttleworth, Martin G. Evans, Jonathan P. Ritson, Adam Johnston, Danielle M. Alderson, and Angela Harris

Sphagnum mosses are key to peatland functioning and C cycling. They may cover 80- 100% of peatland land area and make up the vast majority of the peat itself. Sphagnum chemistry slows decomposition, enabling organic material accumulation which forms peat; it holds many times its own weight in water, maintaining the wet conditions vital to sustain peatlands. However, projected climate scenarios suggest that drought will increase in both severity and frequency, particularly at latitudes where most peatlands occur. To manage peatlands sustainably, we must understand how Sphagnum responds to and recovers from drought.

We subjected Sphagnum to increasing drought and rewetting periods to determine the limits of recovery as part of a microcosm experiment. We used two co-occurring, globally relevant Sphagnum species, with different microhabitat preferences: S. palustre and S. squarrosum, hypothesising that hummock-forming S. palustre would withstand longer drought periods due to being adapted to growing further from the water table than lawn-forming S. squarrosum. We measured Sphagnum moisture content and net ecosystem exchange (NEE) of CO2 and methane (CH4) over manipulated drought periods increasing from one to nine weeks, followed by recovery after rewetting. We also collected hyperspectral data to calculate key vegetation indices from all droughted and rewetted treatments and compared them to controls.

Undroughted S. palustre held more water than S. squarrosum (p< 0.0001): 37.2 ± 2.5 g g-1 compared to 28.0 ± 2.5 g g-1. Once droughted, moisture content declined slower in S. palustre, but both species’ moisture content recovered to that of controls within one week of rewetting.

S. palustre (-6.27 nmol g-1 s-1) took up 22% more CO2 than S. squarrosum (-5.13 nmol g-1 s-1) across all treatments (p< 0.02). After one week of drought, fluxes between the controls and drought treatments were the same in both species, but after rewetting fluxes in S. squarrosum declined and only recovered to ca. 50% of predrought levels even after 10 weeks of recovery. After two weeks of drought, the S. palustre fluxes did not recover to predrought levels either. In all treatments Sphagnum became net sources of CO2 after the first week of rewetting, after which they reverted to being net sinks once more.

Hysteresis between Sphagnum moisture content and NEE was delineated by pre-drought and rewetting. During drought, there was a significant asymmetrical relationship between moisture content and NEE around an optimum level of moisture. Optimum moisture was higher in S. squarrosum (18 g g-1) than in S. palustre (12 g g-1). After rewetting the relationship between moisture and NEE broke down completely, suggesting permanent damage to photosynthetic apparatus. This is supported by the failure of key vegetation indices to recover after rewetting.

This paper determines species-specific C sink-source thresholds in Sphagnum which have vital implications for future peatland C cycling.

How to cite: Keane, J. B., Clay, G. D., Shuttleworth, E. L., Evans, M. G., Ritson, J. P., Johnston, A., Alderson, D. M., and Harris, A.: The resilience and recovery of two globally important Sphagnum species to drought, EGU General Assembly 2025, Vienna, Austria, 27 Apr–2 May 2025, EGU25-11132, https://doi.org/10.5194/egusphere-egu25-11132, 2025.

EGU25-11381 | Orals | BG3.21

Rhizosphere control on peat carbon stability 

Peter Mueller, Klaus-Holger Knorr, Namid Krüger, and J. Patrick Megonigal

Living plant roots interact with soil microbial communities in the rhizosphere, influencing the decomposition rate of soil organic carbon (SOC). These interactions, known as rhizosphere priming effects, can either stabilize or destabilize SOC pools, representing a critical feedback mechanism in the soil–climate system. Despite the disproportionate role of peatlands in the global carbon cycle, rhizosphere priming in these ecosystems remains understudied.

We present findings from primary research on rhizosphere priming in coastal and inland peat soils, complemented by a meta-analysis. Our results show that both positive and negative rhizosphere priming effects can be much stronger in peat and other wetland soils compared to upland soils.

We attribute these differences to contrasting redox conditions and carbon preservation mechanisms in peats compared to upland soils. Building on this, we propose a conceptual framework in which wetland vascular plants act as dual regulators of soil redox status. Through root exudation and oxygen loss, they provide both electron donors and acceptors, influencing the stability of peat carbon stocks in opposite directions. Finally, we discuss how these root-driven processes may determine the response of peatland carbon dynamics to climate change.

How to cite: Mueller, P., Knorr, K.-H., Krüger, N., and Megonigal, J. P.: Rhizosphere control on peat carbon stability, EGU General Assembly 2025, Vienna, Austria, 27 Apr–2 May 2025, EGU25-11381, https://doi.org/10.5194/egusphere-egu25-11381, 2025.

EGU25-12534 | Posters on site | BG3.21

Rewetting for the ages – methane and carbon dioxide emissions decades after peatland restoration 

Jesper Christiansen, Ida Drastrup Achton, and Rachel Eleanor Burns

To ensure that rewetting of northern peatlands serves as an effective climate buffer within the timeframes relevant to current emission scenarios and projected climate change by 2100 and beyond, these restored peatlands must not only immediately reduce net emissions compared to previous intensive land uses but also eventually revert to being net sinks of greenhouse gases. In natural wetlands, this balance hinges on the net uptake of carbon dioxide (CO2) and peat formation, which in natural system exceed the combined net emissions of methane (CH4) and lateral carbon export in runoff.

Although the climate mitigation benefits of rewetting have been recognized for decades, empirical evidence on the long-term impacts of rewetting on the net exchange of greenhouse gases, particularly CH4, is lacking. Furthermore, rewetting is not a one-size-fits-all solution and results in diverse post-rewetting ecosystems depending on hydrological management, such as pond/lake formation and vegetation encroachment, each with distinct physico-chemical dynamics affecting CO2 and CH4 emissions differently.

To address this knowledge gap, we present data on the net surface exchange of CH4 and CO2 over two growing seasons in chronosequences of two rewetting trajectories: pond formation and vegetation encroachment on formerly drained peatlands. We included a clearcut, former Norway spruce plantation, and a near-natural peatland as end members of these chronosequences, with the latter representing the baseline for the peatlands we wish to restore and ultimately recreate.

Our field investigations aimed to capture spatiotemporal variability in CH4 and CO2 fluxes from characteristic surface types in the studied locations, including sedges, sphagnum moss, bare decomposed peat, and water surfaces in ponds and ditches. We estimated both diffusive and ebullition fluxes. Preliminary findings indicate that combined ecosystem respiration (CO2) and CH4 emissions in encroached rewetted systems are higher than in drained and baseline sites. For sites with ponding, net CO2 emissions occur throughout the season but at lower rates compared to both drained and near-natural sites, while diffusive CH4 emissions are comparable to those in encroached areas. In both rewetting trajectories, CO2 and CH4 emissions decrease over time, but elevated fluxes persist for at least two decades post-restoration. Including ebullitions, net CH4 emissions in ponded system are highest and show only a weak trend towards lower fluxes over time. We also investigated whether the elevated fluxes were due to more reactive peat substrate, as proposed in a series of incubation experiments.  

Whilst our findings shed light on one little-known aspect of rewetting, there remain critical knowledge gaps regarding ecosystem net carbon balances, particularly net ecosystem productivity, including woody vegetation in encroached rewetted peatlands, net deposition of autochthonous and allochthonous carbon in ponds, and how carbon decomposition in formerly drained peat relates to biogeochemical indicators such as nitrogen (N) and phosphorus (P). We also wish to discuss our findings within a broader northern peatland context and how future studies can be designed to investigate the long-term climate impacts of rewetting.

How to cite: Christiansen, J., Drastrup Achton, I., and Burns, R. E.: Rewetting for the ages – methane and carbon dioxide emissions decades after peatland restoration, EGU General Assembly 2025, Vienna, Austria, 27 Apr–2 May 2025, EGU25-12534, https://doi.org/10.5194/egusphere-egu25-12534, 2025.

EGU25-13007 | Posters on site | BG3.21

How does ecosystem rehabilitation and inter-annual climatic variability impact the carbon dynamics of raised bogs in Ireland? 

Matthew Saunders, Ruchita Ingle, Mark McCorry, Hannah Mealy, and Shane Regan

In Ireland, peatland ecosystems cover ~20% of the land area and hold up to 75% of the soil organic carbon stock, however over 90% of these systems have been degraded due to drainage for agriculture, forestry and extraction for horticulture or energy. Due to their climate mitigation potential the conservation and rehabilitation of peatlands through rewetting forms an integral part of the national climate mitigation strategy in Ireland. The hydrological integrity of these sites is key to the success of both conservation and rehabilitation activities, both of which are susceptible to inter-annual variation in climate, such as changes in precipitation and temperature.

This study utilised eddy covariance techniques to assess Net Ecosystem Exchange (NEE) of carbon dioxide (CO2) at two sites, a near-natural remnant raised bog ecosystem with six site years of data that captured two exceptionally dry climatic years (2018 and 2021), and two years of site data from a former industrial cutaway site where the drains were blocked, and the water table raised in 2015. The study area at the remnant bog acted as both a net C source and sink over the study period, with NEE ranging from 53.5 to -135.9 g C m-2 yr-1, respectively.  Net C losses were observed in 2018 and were driven by a 16% increase in ecosystem respiration due to a prolonged reduction in water table height, highlighting the vulnerability of raised bog systems to inter-annual climatic variability. The rehabilitation site was effectively C neutral over the study period with NEE ranging from 18.3 to -0.34 g C m-2 yr-1 and provides further insight into the time dependent impacts and potential emissions savings of peatland rehabilitation as the former cutaway sites undergo both hydrological and ecological transitions.

How to cite: Saunders, M., Ingle, R., McCorry, M., Mealy, H., and Regan, S.: How does ecosystem rehabilitation and inter-annual climatic variability impact the carbon dynamics of raised bogs in Ireland?, EGU General Assembly 2025, Vienna, Austria, 27 Apr–2 May 2025, EGU25-13007, https://doi.org/10.5194/egusphere-egu25-13007, 2025.

EGU25-13093 | Posters on site | BG3.21

The contribution of aerobic and anaerobic decomposition processes to greenhouse gas emissions of peatland dairy meadows. 

Ype van der Velde, Jim Boonman, Liam Heffernan, Alex Buzacott, Sarah Faye Harpenslager, Gijs Van Dijk, Joost Keuskamp, Duygu Tolunay, and Mariet Hefting

Peatlands cause ~2% of anthropogenic greenhouse gas (GHG) emissions due to drainage. In study, we aimed to assess (1) if laboratory aerobic and anaerobic heterotrophic respiration rates of peat layers accurately represent observed CO2 and CH4 (chamber and eddy-covariance respectively) emissions, and to assess (2) the contribution of aerobic and anaerobic processes to surface GHG emission fluxes. Furthermore, we hypothesized (1) that the redox potential is more suitable than the water table depth to capture metabolic soil processes and associated soil respiration rates, and (2) that anaerobic respiration processes are crucial when estimating soil GHG production fluxes. To test these hypotheses, we assigned laboratory incubation rates, measured under both oxic and anoxic conditions, to oxic and anoxic soil layers determined through in-situ measurements of redox potential  at 12 field sites over multiple years. This resulting calculated soil GHG emissions were in close agreement with the measured CO2 and CH4 emissions at all sites. We  showed that using water table depth instead of redox conditions, leads to an overestimation of the prevalence of oxic conditions and greenhouse gas fluxes. Anaerobic respiration processes contributed more (68%) to total CO2 production than aerobic processes (32%). However, the majority of anaerobic respiration originated from biological and chemical legacy effects in recently oxic soil layers.

How to cite: van der Velde, Y., Boonman, J., Heffernan, L., Buzacott, A., Harpenslager, S. F., Van Dijk, G., Keuskamp, J., Tolunay, D., and Hefting, M.: The contribution of aerobic and anaerobic decomposition processes to greenhouse gas emissions of peatland dairy meadows., EGU General Assembly 2025, Vienna, Austria, 27 Apr–2 May 2025, EGU25-13093, https://doi.org/10.5194/egusphere-egu25-13093, 2025.

EGU25-13438 | Posters on site | BG3.21

Bridging Scales in Peat Carbon Dynamics: Leveraging FTIR Spectroscopy for Ecosystem Modeling 

Petra Straková, Tomáš Hájek, Tuula Larmola, Raija Laiho, Annamari Laurén, Kari Minkkinen, Paavo Ojanen, Jaan Pärn, Tomáš Picek, and Zuzana Urbanová

Peatlands play a pivotal role in the global carbon cycle, acting as significant reservoirs of organic carbon while simultaneously influencing greenhouse gas (GHG) dynamics. However, our ability to predict carbon turnover across scales remains constrained by the challenges of integrating microscale biochemical processes with ecosystem-scale phenomena.

This project, at its initial stages, aims to integrate Fourier-Transform Infrared (FTIR) spectroscopy into peatland carbon models to address these challenges. By identifying FTIR spectral markers of organic matter decomposition, we plan to investigate the long-term effects of climate and land-use changes on peat carbon quality and GHG emissions. Leveraging preliminary field experiments, we will explore litter and peat decomposition dynamics under varied hydrological conditions and peatland types, linking microscale chemical transformations with large-scale carbon fluxes.

A key goal of this project is to establish a global FTIR spectral database to refine ecosystem models such as Yasso and SUSI. To achieve this, we welcome collaboration and invite researchers to share their FTIR, biochemical, and GHG data to broaden the scope and enhance the precision of these efforts. Together, we aim to develop efficient modelling tools for predicting GHG fluxes and advancing our understanding of peatland carbon dynamics.

Join us to explore how FTIR spectroscopy can advance peatland research, bridge critical gaps between scales, and foster collective progress toward climate change mitigation!

How to cite: Straková, P., Hájek, T., Larmola, T., Laiho, R., Laurén, A., Minkkinen, K., Ojanen, P., Pärn, J., Picek, T., and Urbanová, Z.: Bridging Scales in Peat Carbon Dynamics: Leveraging FTIR Spectroscopy for Ecosystem Modeling, EGU General Assembly 2025, Vienna, Austria, 27 Apr–2 May 2025, EGU25-13438, https://doi.org/10.5194/egusphere-egu25-13438, 2025.

EGU25-14199 | Posters on site | BG3.21

Multi-model intercomparison of northern peatland carbon cycle  

Xiaoying Shi, Dan Ricciuto, Yaoping Wang, Paul Hanson, Jiafu Mao, Yiqi Luo, Xiaofeng Xu, Dafeng Hui, Hongxing He, Siya Shao, Ayesha Hussain, Qing Sun, Chunjing Qiu, Akihiko Ito, Joe Melton, Eleanor Burke, Fortunat Joos, Qianlai Zhuang, Yongjiu Dai, and Xingji Lu

Peatlands cover only 3% of Earth’s land surface but contain about 30% of the global soil carbon pool. Derived predominantly from plant litter and moss accretions, peat deposits are critically sensitive to environmental dynamics such as soil temperature and moisture levels. This vulnerability has raised concerns about potential positive feedback mechanisms in relation to global climate change. However, current global models present disparities in projected emissions, and sensitivities of peatland carbon stocks to changing environments are a major uncertainty in global carbon projections. The Spruce and Peatland Responses Under Changing Environments (SPRUCE) experiment is a large‐scale climate change manipulation that focuses on the combined response of multiple levels of warming at both ambient and elevated CO2 concentration (aCO2 and eCO2), which makes it is a valuable testbed for the broader modeling community to improve the diagnosis and attribution of C fluxes in peatland ecosystems. The SPRUCE Multi-model Intercomparison Project (SPRUCE-MIP) aims to evaluate the projections of peatland carbon cycle dynamics and their warming responses of various models by comparing the model outputs to empirical data from SPRUCE. We assessed 12 different models, focusing on their predictions for net ecosystem carbon exchange (NEE) and its components – net primary productivity (NPP), heterotrophic respiration (HR) and methane (CH4) fluxes. These predictions were compared to an extensive on-site carbon cycle dataset across five distinct temperature warming levels and two CO2 concentration scenarios. Our findings revealed significant variability in the model projections, with substantial scatter in the absolute values, warming sensitivities and eCO2 effects. For example, the models’ prediction of carbon take up between 10 and 732 gC m-2 year-1 forthe baseline warming with aCO2 condition, and the warming sensitivity response is about 1 to 126 gC m-2 year-1-1. In addition, notable increases productivity under eCO2 condition are observed in the ORCHIDEE (138.9%), VISIT (105.2%) and ELM-Microbe (64.4%) models while there is no eCO2 effects for model CoupModel. Experimental measurements showed carbon source even for the baseline warming chamber while most of the model predicted carbon sink, except for model CoupModel, MWM, and PTEM. Furthermore, both the observations and these three models show a significant in C release to atmosphere, making stronger C sources at the extreme +9°C warming level for both aCO2 and eCO2 conditions, and models such as CoLM, ELM-SPRUCE and JULES transition from a C sink to a C source under these conditions. Meanwhile, the DNDC, ORCHIDEE and VIST models switch from a C sink to a C source under aCO2conditions but remain C sinks under eCO2 conditions. In contrast, models like ELM-Microbe, LPX-Bern and TECO predict that the SPRUCE peatland ecosystem continues to function as a C sink even at the +9°C warming level under both CO2 conditions. Integrating models with experimental design will allow targeting of these uncertainties and help to reconcile divergence among models to produce more confident projections of peatland ecosystem responses to global changes.

How to cite: Shi, X., Ricciuto, D., Wang, Y., Hanson, P., Mao, J., Luo, Y., Xu, X., Hui, D., He, H., Shao, S., Hussain, A., Sun, Q., Qiu, C., Ito, A., Melton, J., Burke, E., Joos, F., Zhuang, Q., Dai, Y., and Lu, X.: Multi-model intercomparison of northern peatland carbon cycle , EGU General Assembly 2025, Vienna, Austria, 27 Apr–2 May 2025, EGU25-14199, https://doi.org/10.5194/egusphere-egu25-14199, 2025.

EGU25-14489 | Orals | BG3.21

Refining Simulations of Northern Peatlands via Parameter Optimization and Mechanistic Improvements in the E3SM land Model 

Daniel Ricciuto, Xiaoying Shi, Yaoping Wang, and Xiaojuan Yang

Peatlands are vital components of the global carbon cycle, yet their responses to changing environmental conditions remain uncertain. To improve predictions of peatland dynamics, we extended the Energy Exascale Earth System (E3SM) land model (ELM) to simulate peatland ecosystems. This model, ELM-Peatlands, was initially developed for site-level simulations of the SPRUCE (Spruce and Peatland Responses Under Changing Environments) experiment, incorporating detailed representations of peatland hydrology, carbon cycling, and plant functional types (PFTs) specific to these ecosystems. ELM-Peatlands is now calibrated and applied to simulate 12 northern peatland sites using site-specific information and ERA5 reanalysis meteorological data.

With the eventual goal of regional-scale simulation, ELM-Peatlands is being enhanced with calibrated PFT parameters, enabling accurate representation of diverse peatland systems. We evaluate the sensitivity of model outputs to parameters at different sites, enabling selection of the most important parameters to calibrate. Model calibration utilizes site-specific observations to optimize parameters related to vegetation, soil hydrology, and carbon dynamics, ensuring robust performance across varying climatic and ecological conditions. The ERA5 meteorology provides high-resolution, physically consistent forcing data to drive these simulations. Preliminary results demonstrate the model’s capacity to capture site-level variability in carbon and water fluxes while highlighting sensitivities to hydrological and climatic drivers. This work is the first step in the application of ELM-Peatlands at regional and global scales, improving our understanding of peatland feedbacks under future climate scenarios.

How to cite: Ricciuto, D., Shi, X., Wang, Y., and Yang, X.: Refining Simulations of Northern Peatlands via Parameter Optimization and Mechanistic Improvements in the E3SM land Model, EGU General Assembly 2025, Vienna, Austria, 27 Apr–2 May 2025, EGU25-14489, https://doi.org/10.5194/egusphere-egu25-14489, 2025.

EGU25-15421 | ECS | Orals | BG3.21

The separate roles of vascular plants and Sphagnum mosses in regulating the net CO2 exchange in a boreal peatland 

Antonia Hartmann, Kyohsuke Hikino, Gillian Simpson, Järvi Järveoja, Mats B. Nilsson, and Matthias Peichl

Boreal peatlands are an important sink for carbon. Carbon uptake and emission are controlled by abiotic factors as well as vegetation composition and plant phenology. Plant functional types (PFT) have distinct phenological trajectories and respond differently to environmental controls which results in seasonal variations in their relative contribution to peatland net CO2 ecosystem exchange (NEE). However, detailed knowledge on the separate responses of PFT-specific production and respiration fluxes to abiotic factors on daily to sub-seasonal scales are currently missing. In this study, we used high resolution flux data from an automated chamber system established across experimental vegetation removal plots to separate the production and respiration fluxes of vascular plants and Sphagnum mosses over three growing seasons at the oligotrophic minerogenic mire Degerö Stormyr in northern Sweden. We found that Sphagnum mosses dominate ecosystem gross primary production (GPP) during green-up and senescence, whereas vascular plants primarily regulate GPP during the peak growing season. Further, we observed shifts in the relative importance of environmental variables in controlling autotrophic respiration of Sphagnum mosses and vascular plants across different phenophases. A better understanding of how vascular plants and Sphagnum mosses contribute to regulating NEE under varying environmental conditions is essential to improve predictions of the seasonal dynamics in process-based models, and to give insight on the potential climate change feedbacks on the carbon cycle of boreal peatlands.

How to cite: Hartmann, A., Hikino, K., Simpson, G., Järveoja, J., Nilsson, M. B., and Peichl, M.: The separate roles of vascular plants and Sphagnum mosses in regulating the net CO2 exchange in a boreal peatland, EGU General Assembly 2025, Vienna, Austria, 27 Apr–2 May 2025, EGU25-15421, https://doi.org/10.5194/egusphere-egu25-15421, 2025.

EGU25-15852 | ECS | Orals | BG3.21

Modelling methane fluxes along the thawing gradient of Boreal-Arctic peatland ecosystems with CoupModel 

Wenzhuo Duan, Mousong Wu, Hongxing He, and Per-Erik Jansson

Northern peatlands are key carbon reservoirs and natural sources of methane. The northern peatland soils have various mechanisms controlling water, energy and carbon cycles (soil freeze-thaw) which further make modeling the emissions a challenge. In this study, we developed the CoupModel with respect to more comprehensive representation of gas processes in soil and plants, and used it to simulate O2, CO2, CH4 as well as energy and water fluxes in three pristine northern peatlands across the thawing gradient (seasonal frost – degraded permafrost – continuous permafrost). These sites have 10-15 years of CO2 flux and CH4 flux measurement data. CoupModel reproduced the measured hourly CH4 fluxes with R2 (coefficient of determination) values of 0.60±0.02, 0.32±0.02 and 0.18±0.005 in Degerö Stormyr, Stordalen and Zackenberg, respectively. Our model simulation showed CH4 emissions from three sites along the Boreal-Arctic gradient have diverse sensitivities to temperature and WTD. Higher temperature sensitivity of CH4 was found in continuous permafrost zone (Zackenberg), and a turning point for WTD (-0.15~-0.1 m) found over three sites. Hysteresis exists in CH4 fluxes responding to water table, temperature and freezing-thawing cycles. We conclude that the newly developed CoupModel can adequately simulate the CH4 emission and its controls for northern peatlands. Our study revealed the response trajectories of peatland ecosystems across the permafrost region to environmental controls and highlighted the need for future peatland models to better simulate and predict the future CH4 dynamics in a changing climate.

How to cite: Duan, W., Wu, M., He, H., and Jansson, P.-E.: Modelling methane fluxes along the thawing gradient of Boreal-Arctic peatland ecosystems with CoupModel, EGU General Assembly 2025, Vienna, Austria, 27 Apr–2 May 2025, EGU25-15852, https://doi.org/10.5194/egusphere-egu25-15852, 2025.

EGU25-16702 | Orals | BG3.21

Improving peat decomposition in a peatland greenhouse gas emissions model: Peatland-VU v3.0 

Taan (Tanya) Lippmann, Jacobus (Ko) van Huissteden, Ype van der Velde, and Merit van den Berg

Accurate modelling of peatland carbon dynamics is critical for understanding their role in the global carbon cycle and predicting future greenhouse gas (GHG) fluxes. In this study, we present an updated version of the Peatland-VU model, Peatland-VU v3.0, designed to enhance the simulation of peat decomposition processes and below-ground soil organic matter (SOM) dynamics.

A key focus of this development is the improved representation of SOM decomposition sensitivity to temperature, which we evaluate using both the Arrhenius equation and Q10 relationships. The model allows the specification of distinct Q10 values for eight different SOM pools and simulates decomposition in both anaerobic and aerobic soil layers. To capture seasonal and vegetation-specific dynamics, we also refined representations of harvest effects, leaf area index, phenology, and leaf senescence.

We evaluate the model at two contrasting peatland sites in the Netherlands: the natural bog complex of the Weerribben and the drained peat pasture of Assendelft. These sites differ significantly in soil profiles, hydrology, and land-use history, offering insights into how these factors influence decomposition rates and net carbon dioxide and methane emissions.

We highlight the benefits and limitations of the Q10 and Arrhenius approaches in modelling the temperature sensitivity of SOM decomposition, with implications for accurately representing peatland GHG fluxes under varying climatic and management scenarios. Additionally, we discuss potential model limitations, including missing processes that may be critical for simulating peatland responses to environmental change.

This work provides new insights into peat decomposition dynamics and contributes to the development of more reliable tools for simulating peatland GHG emissions in both natural and managed ecosystems.

How to cite: Lippmann, T. (., van Huissteden, J. (., van der Velde, Y., and van den Berg, M.: Improving peat decomposition in a peatland greenhouse gas emissions model: Peatland-VU v3.0, EGU General Assembly 2025, Vienna, Austria, 27 Apr–2 May 2025, EGU25-16702, https://doi.org/10.5194/egusphere-egu25-16702, 2025.

EGU25-18061 | ECS | Posters on site | BG3.21

Drivers of CO2 emission from Danish agricultural peat soils 

Deividas Mikštas, Lis Wollesen de Jonge, Peter Lystbæk Weber, Per Møldrup, Lars Elsgaard, Mogens Humlekrog Greve, and Charles Pesch

Peatlands store a significant proportion of global carbon, but their drainage and conversion to agricultural land have resulted in substantial CO2 emissions, intensifying climate change. This study investigates the relationship between CO2 emissions and soil bio-physical-chemical properties. The work is a step toward identifying priority areas of organic-rich soils most suitable for rewetting to support Denmark’s goal to cut agricultural GHG emissions by 2030. By understanding the driving factors for high CO2 emissions, the study aims to support the development of targeted and efficient rewetting strategies.

A systematic soil sampling campaign was conducted across Denmark, where a total of 120 soil samples were collected from agricultural peatlands. The samples were analyzed for e.g., soil organic carbon content, pH, electrical conductivity, soil water retention, air diffusivity, eDNA, water repellency, and soil organic matter quality (temperature-controlled pyrolysis, Rock-EVAL). Relative CO2 emissions were assessed through laboratory incubation experiments using undisturbed soil cores (100 cm³) equilibrated to -100 cm H2O of soil-water matric potential (pF2).

Machine learning regression analysis, coupled with interpretation of feature importance via Shapley values, highlighted that organic matter quality (Rock-Eval indices), total nitrogen content, pH, and depth to the groundwater table at sampling were the primary drivers of CO2 emission rates, while vegetation and microbial alpha diversity had little predictive value.

These findings advance the understanding of the key drivers of CO2 emissions from peatlands. Modelling approaches will further explore these relationships and provide insights for developing more effective rewetting strategies to improve carbon sequestration and mitigate climate change.

Keywords: peatlands, CO2 emissions, soil properties, rewetting, climate change mitigation

How to cite: Mikštas, D., de Jonge, L. W., Weber, P. L., Møldrup, P., Elsgaard, L., Greve, M. H., and Pesch, C.: Drivers of CO2 emission from Danish agricultural peat soils, EGU General Assembly 2025, Vienna, Austria, 27 Apr–2 May 2025, EGU25-18061, https://doi.org/10.5194/egusphere-egu25-18061, 2025.

EGU25-18118 | ECS | Orals | BG3.21

Spatial variation in the seasonality of methane emissions from a patterned boreal bog 

Katharina Jentzsch, Elisa Männistö, Maija E. Marushchak, Tabea Rettelbach, Lion Golde, Aino Korrensalo, Joshua Hashemi, Lona van Delden, Eeva-Stiina Tuittila, Christian Knoblauch, and Claire C. Treat

Wetlands are the largest natural source of atmospheric methane but substantial uncertainties remain in the methane budget, particularly due to the gap in spatial scales between detailed in-situ flux measurements and low-resolution land surface models. Our aim was to evaluate the importance of capturing the small-scale spatial heterogeneity of a patterned bog to accurately estimate methane emissions on the ecosystem scale throughout the year.

We used chamber measurements and pore water sampling on vegetation removal experiments at the microtopographical scale of Siikaneva bog, Southern Finland, during seasonal field campaigns in 2022. Seasonal and spatial patterns in the methane fluxes were identified alongside their environmental and ecological controls. Using high-resolution (0.06 m ground sampling distance) drone-based land cover mapping, we extrapolated the microtopographical-scale flux measurements to the ecosystem scale. Comparisons were made between methane emissions extrapolated for the whole bog area versus the footprint of a former eddy covariance system.

Spatial patterns in methane emissions differed between the seasons, as methane emissions from the wetter mud bottoms and hollows followed the seasonal cycles of peat temperature and green leaf area of aerenchymatous plants, while emissions from the drier high lawns and hummocks remained constant throughout the year. These spatial patterns of methane emissions and their seasonal variations made the magnitude and seasonal cycle of ecosystem-scale emissions highly sensitive to the distribution of microtopography types and their representation in landcover classifications. Seasonal and spatial variations in environmental drivers highlight the need for year-round methane flux measurements at the microtopography scale to improve process-based models and accurately estimate annual ecosystem-scale methane emissions. Capturing the high spatial and temporal variability of peatland methane emissions and their controls is essential for using small-scale in-situ measurements to validate low-resolution models. This approach is crucial for accurate extrapolation of small-scale data to broader spatial and temporal scales.

How to cite: Jentzsch, K., Männistö, E., Marushchak, M. E., Rettelbach, T., Golde, L., Korrensalo, A., Hashemi, J., van Delden, L., Tuittila, E.-S., Knoblauch, C., and Treat, C. C.: Spatial variation in the seasonality of methane emissions from a patterned boreal bog, EGU General Assembly 2025, Vienna, Austria, 27 Apr–2 May 2025, EGU25-18118, https://doi.org/10.5194/egusphere-egu25-18118, 2025.

REACTIVE NITROGENOUS GAS (NITROUS ACID) EMISSIONS ALONG THE FEN-BOG GRADIENT FROM SOUTHERN BOREAL IN FINLAND TO SUBARCTIC PEATLAND IN THE CONTEXT OF CHANGING CLIMATIC CONDITIONS.

KHALING ELIEZER, TALLBACKA SAARA, ROVAMO MIRKKA, GIL LUGO JENIE, and MALJANEN MARJA.
Department of Environmental and Biological Sciences, University of Eastern Finland, Kuopio Campus, Yliopistonranta 1, 70210 Kuopio, Finland.
Keywords: Biogeochemical, changing climate, edaphic factors, HONO, Northern peatlands, Reactive nitrogen gas.


Peatlands are integral ecosystems within the global nitrogen cycle, and understanding their role in reactive nitrogen gas emissions, particularly nitrous acid (HONO) gas, is crucial for assessing their impact on atmospheric chemistry and climate change (Bhattarai et al., 2022 and Wang et al.,2023). Allocating HONO emissions from high latitude regions amidst evolving environmental conditions can mitigate current uncertainties in regional and global nitrogen budgets.
This study investigates potential HONO emissions across the fen-bog gradient in peatlands, ranging from southern boreal in Finland to the arctic and permafrost zone in northern Sweden. The study combines in-situ sampling of pristine soil cores with controlled laboratory analyses. HONO emissions were quantified using a dynamic chamber system integrated with a long path absorption photometer (LOPAP) analyzer. In addition, an analysis of the physicochemical properties of the soil was conducted to elucidate the potential factors influencing HONO emissions in peatland soils.
Preliminary findings suggest HONO emissions are subject to an intricate interplay of biogeochemical factors leading to significant variations in emission rates. Notably, the research result highlights the importance of moisture content and temperature variation, and vegetation composition in controlling HONO production and release. This ongoing research effort underscores the need for region-specific approaches in addressing the impact of peatlands on atmospheric chemistry.

Acknowledgement:
This work was supported by grant from Academy of Finland (decision nos. 348571)

References:
Bhattarai et al., (2022) Emissions of atmospherically reactive gases nitrous acid and nitric oxide from Arctic permafrost peatlands. Environ. Res. Lett. 17, 024034. doi: 10.1088/1748-9326/ac4f8e.
Wang et al., (2023). Large contribution of nitrous acid to soil-emitted reactive oxidized nitrogen and its effect on air quality. Environ. Sci. & Technol. 57 (9), 3516-3526. doi: 10.1021/acs.est.2c07793

How to cite: Khaling Khaling, E.: Reactive Nitrogenous Gas (Nitrous Acid) Emissions Along the Fen-Bog Gradient From Southern Boreal in Finland to Subarctic Peatland in the Context of Changing Climatic Conditions., EGU General Assembly 2025, Vienna, Austria, 27 Apr–2 May 2025, EGU25-18352, https://doi.org/10.5194/egusphere-egu25-18352, 2025.

EGU25-18913 | ECS | Posters on site | BG3.21

Carbon stocks and properties of a drained and undrained peatland in West Iceland 

Kayla Brianne Streeper, Susanne Claudia Möckel, Hlynur Óskarsson, and Bjarni Diðrik Sigurðsson

Peatlands in Iceland have been affected by anthropogenic activity since early settlement times. The transformation of peatlands into agricultural land increased rapidly in the 1940s when the government subsidized peatland drainage for grazing and farming. According to the Environmental Agency of Iceland drained peatlands are the most significant source of GHG emissions in Iceland. Peatland restoration efforts have gradually begun in recent years, yet there is still limited research on the effects of drainage on carbon stocks in Icelandic peatlands. Soils of Icelandic peatlands receive frequent mineral deposits from volcanic activity as well as windborne material from eroding volcaniclastic deserts and Andosols; creating organic soils with andic and vitric properties which are rare elsewhere. Therefore, it is critical to enhance our understanding of carbon trajectories upon drainage of Icelandic peatlands. Here, we introduce an ongoing study comparing carbon stocks and carbon characteristics of a drained and undrained peatland. We conducted our study at the Lækur farm in West Iceland, where a portion of peatlands were drained in 1961 while other nearby peatlands have remained undisturbed. At each site, we work with three soil cores of 0.5 – 1 m depth. We use carbon structure derived by 13C nuclear magnetic resonance spectroscopy (NMR), C:N ratios and values of δ13C and δ15N to determine the decomposition state and quality of the soil organic material. Also, we compare carbon stocks between sites based on total carbon contents and dry bulk densities. The results from this study will increase our understanding of the influence of drainage on carbon stocks and carbon structure in Icelandic peatlands, and peatlands of volcanic regions elsewhere. This is particularly important when evaluating the effect of potential peatland restoration efforts.

How to cite: Streeper, K. B., Möckel, S. C., Óskarsson, H., and Sigurðsson, B. D.: Carbon stocks and properties of a drained and undrained peatland in West Iceland, EGU General Assembly 2025, Vienna, Austria, 27 Apr–2 May 2025, EGU25-18913, https://doi.org/10.5194/egusphere-egu25-18913, 2025.

EGU25-19038 | ECS | Posters on site | BG3.21

Stable carbon sequestration in temperate mountain peatland despite shifting plant species composition 

Simon Drollinger, Stephen Boahen Asabere, Kathrin Baumann, and Daniela Sauer

Peatlands are the largest and most efficient terrestrial carbon (C) storage ecosystems, with the potential to amplify climate warming by releasing large amounts of C into the atmosphere. Mountain peatlands are underexplored and particularly vulnerable to climate change. Their reduced resilience arises from strong water-carbon coupling, high sensitivity to environmental conditions, and the greater vulnerability of mountain regions. While undisturbed peatlands have remained C sinks over millennia, disturbances reduce C uptake often reflected in changing plant composition, indicating irreversible ecosystem changes. Indeed, peatland plant communities are expected to undergo substantial changes under future climate scenarios, and thus quantifying peat vegetation changes and their effects on the C cycle is a critical research priority.

Here, we examined vegetation changes of a well-preserved mountain peatland for over 15 years and assessed its current state using carbon dioxide (CO2) and methane (CH4) flux data from the past three years. Vegetation was monitored through biennial surveys at 27 permanent plots and annual aerial photographs. C fluxes were calculated using the eddy covariance method. The study was conducted in the Sonnenberger Moor peatland in the Harz mountains, Germany, which spans ~110 ha at 758–830 m a.s.l.

We observed a shift in plant composition towards woody species and declining Sphagnum moss coverage. Noticeable increases of woody species such as Calluna vulgaris, Andromeda polifolia, and Vaccinium oxycoccos were observed. Calluna coverage increased from 2.4% in 2009 to 15.4% in 2023, while Andromeda expanded from 7.5% to 16.8%. Small-scale vegetation changes, particularly the spread of Calluna, were inferred from aerial photographs. Summer CO2 exchange comparisons over three years revealed that the peatland remained a stable C sink despite vegetation shifts and low summer precipitation. August data showed that ecosystem respiration (Reco) increased with reduced precipitation (2023: 132 g C m-2 month-1 at 207 mm precipitation; 2022: 143 g C m-2 at 31 mm). Gross primary production (GPP) increased under drier conditions but only marginally beyond certain thresholds. Accordingly, the driest August recorded the lowest net CO2 uptake (2022: 23 g C month-1), whereas the wettest August showed lower C uptake (2023: 37 g C month-1) than the following drier August of 2024 (45 g C at 54 mm). CH4 emissions decreased strongly during drought periods, but could not offset CO2 uptake, so the peatland continued to act as a net C sink. This notwithstanding, CH4 emissions amplified the effect that the peatland could not store maximum C under optimal wet conditions.

The observed shift from graminoids and mosses to woody species suggests reduced stability in waterlogging. Rising regional and global temperatures, reduced summer precipitation, and increased nitrogen deposition are the likely drivers of these observed changes. Increased woody species typically correlate with lower water levels, increased Reco and reduced C uptake. The GPP rises even under drought conditions suggest that the investigated peatland ecosystem is shifting to a new stable level. Given the critical role mountain peatlands play in global C storage and climate regulation, our findings can support predicting C dynamics and developing effective management strategies.

How to cite: Drollinger, S., Asabere, S. B., Baumann, K., and Sauer, D.: Stable carbon sequestration in temperate mountain peatland despite shifting plant species composition, EGU General Assembly 2025, Vienna, Austria, 27 Apr–2 May 2025, EGU25-19038, https://doi.org/10.5194/egusphere-egu25-19038, 2025.

EGU25-19848 | Posters on site | BG3.21

Peat enrichment with clay minerals to reduce CO2 emissions: a proof of principle study 

Maaike van Agtmaal, Joost Keuskamp, and Mariet Hefting

Over 80 % of the Dutch peatland is permanent grassland for agricultural use. To maintain these peat meadows the land is drained, resulting in carbon decomposition and greenhouse gas emissions. Currently most measures to reduce emissions from drained peatland are hydrological, limiting the exposure of peat to oxygen. In our research we aim to study whether a non-hydrological measure -the enrichment of peat with clay minerals- can reduce CO2 emissions.

Previous research in peat meadows indicate that clay content might be linked to peat degradation. Several studies show correlations between higher clay contents and lower organic matter decomposition rates, subsidence rates or higher SOC densities. Clay minerals can be highly reactive, due to their size, shape and charge. and it is known that clay minerals are important determinants in organic matter dynamics. From studies in mineral soils it is known that clay minerals affect the carbon accessibility for the microbial community. Mechanisms by which accessibility is affected are physical protection, adsorption, aggregate inclusion, organo-mineral complexation. Clay can directly affect the heterotrophic activity, by adsorption and immobilization of exoenzymes or by a shift in microbial community composition. Mineral amendments can also have an indirect effect on microbial activity by changing the environment: clay can induce changes in aeration, water retention, pH and nutrient availability.

We hypothesized that the introduction of clay minerals in a peat matrix can result in interaction with organic components in several ways resulting in reduced peat oxidation. As a first step to test whether clay enrichment can reduce the CO2 emissions from peat we set up long term incubation study in the lab. We mixed peat with 7 different naturally occurring clay types and incubated these together with control samples without clay for >1000 days in which we periodically measured CO2 respiration.

The results from this experiment show that peat enrichment with clay can slow down CO2 emissions-rates.  The emission reduction varied widely between clay types. A number of clays induced a clear reduction in CO2 emissions which started after approximately 100 days of incubation. For these samples the cumulative emission reduction of up to a 33% was observed over the 3-year incubation period, compared to the control samples without clay. Also, the inhibitory effect of clay varied over time, being strongest after ca 100 days. Remarkably some of the tested clay types did not show any effect, whereas other types of clay reduced the emission rate.

Currently we are in the process of verifying the results. The next steps in this research include zooming in on different clay types, their effect on microbial community composition and activity and testing clay amendments in the field.

How to cite: van Agtmaal, M., Keuskamp, J., and Hefting, M.: Peat enrichment with clay minerals to reduce CO2 emissions: a proof of principle study, EGU General Assembly 2025, Vienna, Austria, 27 Apr–2 May 2025, EGU25-19848, https://doi.org/10.5194/egusphere-egu25-19848, 2025.

EGU25-19894 | ECS | Orals | BG3.21

Comparison of the ecosystem carbon balance of two contrasting drained peatland forests in boreal Sweden 

Lei Gao, Matthias Peichl, and Järvi Järveoja

Northern peatlands act as an important global reservoir of carbon. Extensive areas of natural peatlands have been drained during the past century to increase timber production, which has largely affected the ecosystem biogeochemistry and the associated climate impacts. However, the ecosystem carbon balance of drained peatlands are still not well understood, especially the difference between low- and high-productive drained peatland forests in the boreal region. In this study, we estimated the carbon balance from a nutrient-poor and a nutrient-rich drained peatland forest in boreal Sweden based on eddy covariance measurements over four years (2021–2024) and one year and a half (2023–2024), respectively. We found that the annual net ecosystem CO2 exchange (NEE) of the lower productive drained peatland forest showed a high interannual variability which varied from a carbon sink to carbon neutral over the 4 years (-82 to 0.18 g C m-2 y-1). In 2024, the high-productive drained peatland forest showed the tendency to serve as a carbon sink (-72 g C m-2 y-1) whereas the lower productive drained peatland forest was carbon neutral (0.18 g C m-2 y-1). Compared with the low drained peatland forest, the nutrient-rich drained peatland forest featured higher gross primary productivity (GPP) as well as higher ecosystem respiration (ER). Our study suggests the different carbon sink capacities of low- and high-productive drained peatland forests as well as their potential of distinct responses to future climate change.

How to cite: Gao, L., Peichl, M., and Järveoja, J.: Comparison of the ecosystem carbon balance of two contrasting drained peatland forests in boreal Sweden, EGU General Assembly 2025, Vienna, Austria, 27 Apr–2 May 2025, EGU25-19894, https://doi.org/10.5194/egusphere-egu25-19894, 2025.

EGU25-20232 | Posters on site | BG3.21

Tephra deposits and carbon accumulation in drained Icelandic peatlands 

Theresa Bonatotzky, Susanne C. Möckel, Róbert Í. Arnarsson, Egill Erlendsson, and Guðrún Gísladóttir

The co-occurrence of active volcanism and severe soil erosion sets Icelandic peatlands apart from peatlands of volcanic regions elsewhere. Located in an active volcanic environment and often in close vicinity to glacial outwash plains and eroded drylands, they display a wide range in mineral and organic content. Mineral material of volcanic nature as distinct tephra layers deposited during volcanic eruptions, but also in the form of recurring fluxes of windborne dust from aeolian source areas are often well preserved in Icelandic peatland soils. Carbon rich subsoil layers are frequently found below more mineral surface soil layers, reflecting destabilization of the environment owing to the onset of anthropogenic influence after the human settlement of Iceland c. 870 AD, which led to widespread vegetation destruction, soil degradation and erosion.

Despite extensive areas of peatlands worldwide being located within active volcanic regions, the interactions between tephra deposits from volcanic eruptions and peatland carbon (C) dynamics are still poorly understood. Various previous studies have shown that tephra deposits may induce shifts in vegetation and the hydrology of peatlands. By that, they may also affect C accumulation. However,  questions remain as to how mineral deposits within these soils, in the form of distinct tephra or aeolian material from eroded dryland soils, impact the C accumulation. Thus, Icelandic peatlands offer a unique opportunity to investigate the effect of tephra deposits and anthropogenic impact on C dynamics in peatlands.

We present a study on C accumulation and C decomposition of disturbed peatlands in Iceland over time. To determine how distinct tephra deposits impact C dynamics of peatland soils, we focus on C accumulation in soil layers right above and below tephra layers.

How to cite: Bonatotzky, T., Möckel, S. C., Arnarsson, R. Í., Erlendsson, E., and Gísladóttir, G.: Tephra deposits and carbon accumulation in drained Icelandic peatlands, EGU General Assembly 2025, Vienna, Austria, 27 Apr–2 May 2025, EGU25-20232, https://doi.org/10.5194/egusphere-egu25-20232, 2025.

EGU25-20275 | Orals | BG3.21

 Carbon stocks in sight: high-resolution vertical depth profiles to quantify carbon reservoirs  

Mariet Hefting, Sanneke van Asselen, Joost Keuskamp, Sarah Faye Harpenslager, and Gilles Erkens

Peatlands are significant terrestrial carbon reservoirs which play a key role in the global carbon cycle, both as major sinks and significant emitters of carbon dioxide. When studying carbon accumulation and carbon emissions from peatlands it is essential to scale the observed fluxes (net emissions) to the available soil carbon (C) stocks. For many peatland areas in the Netherlands, the average thickness of the peat deposit is known, however, important parameters on peat carbon density and peat substrate quality are poorly documented.

In this study we present high resolution carbon profile data for a wide range of Dutch research locations to quantify their total carbon stock. The locations are part of the NOBV emission monitoring network. We determined the botanical composition, measured the bulk density, organic matter content and composition and the degree of degradation using extraction techniques and stable isotopes of N and C. Based on these data we gained insight in the total carbon pool sizes, the variance in chemical composition of the peat layers and the peat degradation stage along the depth profiles. We combined these C stock data with the site-specific groundwater dynamics and divided the carbon stocks into different risk classes for aerobic decomposition, depending on the number of days that they were above the actual groundwater level.

Average carbon stocks were 87 kg/ m2 based on a usual soil profile depth of 120cm. Strikingly, carbon stocks in a peaty soil were similar to a relative undisturbed peat due to the higher density of the organic matter in degraded soils. C:N ratios are strongly driven by botanical origin of the peat. Degradation proxies largely followed the hydrological gradient with a clear decrease in δ15N with depth and shifts in ratios between acid soluble to acid insoluble organic fractions indicating a specific preservation of lignin type of substrates in anoxic peat layers. This study highlights the variability in peat carbon stocks in the Dutch coastal peatlands and underlines the need to extend the emission control measures to include the peaty soils as they still contain significant amounts of carbon.

How to cite: Hefting, M., van Asselen, S., Keuskamp, J., Harpenslager, S. F., and Erkens, G.:  Carbon stocks in sight: high-resolution vertical depth profiles to quantify carbon reservoirs , EGU General Assembly 2025, Vienna, Austria, 27 Apr–2 May 2025, EGU25-20275, https://doi.org/10.5194/egusphere-egu25-20275, 2025.

EGU25-296 | ECS | Posters on site | BG3.23

Global stocks and release pathways of pollutants in peatlands 

Richard Fewster, Graeme Swindles, Gareth Clay, Emma Shuttleworth, Jennifer Galloway, Angela Gallego-Sala, Thomas Kelly, Colin McCarter, Ellie Purdy, and Jim Sloan and the PIPES research group

Peatlands have been widely recognised as important carbon stores, ecological habitats and natural hydrological buffers. However, comparatively less attention has been given to the role of peatlands as long-term stores of pollutants, particularly toxic metals and metalloids (TMMs). Furthermore, the potential for their release is poorly understood. An improved understanding of TMM distribution and release in peatlands is critical, because climate warming risks increasing their mobilisation, through enhanced decomposition and changes to hydrological processes, with potentially significant implications for natural ecosystems and human health. The PIPES project (Pollutants In Peatlands: from sink to Source) aims to identify global “hot spots” of peatland pollutants and establish likely release mechanisms of currently inert TMMs. We use a unique combination of observational and controlled-experimental approaches to address two research questions: (1) What is the content and distribution of pollutants in global peatlands? and (2) Under what conditions, and through which pathways, are these pollutants most likely to be released? In this presentation, we share early findings from both components of the PIPES project. Firstly, we present our ongoing analysis of the distribution of TMMs in global peatlands, with a primarily focus on spatial patterns identified across our comprehensive network of sites in the UK and Ireland. We quantify the total content of TMMs using Inductively Coupled Plasma Optical Emission Spectroscopy (ICP-OES) in peat cores compiled by a network of > 90 international collaborators. Secondly, we present preliminary results from controlled environmental simulations of TMM release in peat monoliths from subarctic Sweden. We explore both pore-water and atmospheric release under scenarios of drought, climate warming and a shallow burn. Our findings provide crucial new insights into the potential fate of pollutants in global peatlands and their implications for human health and natural ecosystems.

How to cite: Fewster, R., Swindles, G., Clay, G., Shuttleworth, E., Galloway, J., Gallego-Sala, A., Kelly, T., McCarter, C., Purdy, E., and Sloan, J. and the PIPES research group: Global stocks and release pathways of pollutants in peatlands, EGU General Assembly 2025, Vienna, Austria, 27 Apr–2 May 2025, EGU25-296, https://doi.org/10.5194/egusphere-egu25-296, 2025.

EGU25-825 | Posters on site | BG3.23

The role of terminal electron acceptors in peatland restoration. 

Emily Fearns-Nicol, Catherine Hirst, Julia Knapp, and Fred Worrall

The role of alternative terminal electron acceptors in peatland restoration.

Emily Fearns-Nicol, Catherine Hirst, Julia Knapp, Fred Worrall

Department of Earth Sciences, Durham University, Science Laboratories, South Road, Durham, DH1 3LE, UK. 


The existence of peatlands relies on the balance of primary productivity and oxidation of organic matter. Oxidation requires a terminal electron acceptor (TEA). The most energetically favourable TEA is O2 followed, in order of reducing energy return, by NO3, Mn, Fe, and SO4. Organic matter itself can become a TEA with the production of methane (CH4). Organic matter will degrade faster the better access to the more energetically favourable TEAs. Therefore, the fate of the organic matter turnover in peatlands is related to the supply of TEAs. We hypothesize that if the supply of TEAs can be limited, then more organic matter could be preserved, and so enhance carbon sinks. Typically, water tables are raised to limit the access of TEAs into the peat porewater, however, it is not only high water tables that are required but also stagnant water tables otherwise fresh TEAs are brought into the porewater.

Bunds are used in peatlands to manipulate the water table to create environments for peat-forming species such as sphagnum mosses. However, bunds may also create areas of high and stable water table, and therefore allowing us to test our hypothesis. To test the hypothesis that stagnant water tables control organic matter storage, this study considered a peat covered hillslope where bunds had been installed. Monthly monitoring of these bunds, started in January 2024 and is being undertaken for soil water chemistry (pH, conductivity, absorbance, DOC, cations, anions), CO2 gas fluxes and water table depth. The site enables us to consider 9 bunded plots, alongside 9 control plots, with each plot having monitoring upslope, within and downslope of the bund.

There was a significant difference in ecosystem exchange down the hillslope, but no difference within individual bunds. Ecosystem respiration showed no signifncnat difference down the hillslope or relative to the individual bunds. There was a significant difference in absorbance and DOC down the hillslope, but no difference relative to the individual bunds. Equally, there was no significant difference in iron or sulphate concentration down the hillslope or relative to the individual bunds. Water tables were not significantly changed by the presence of the bunds nor was conductivity. In this blanket bog we are seeing that high water tables and swift transport pathways persist despite the presence of multiple bunds.

How to cite: Fearns-Nicol, E., Hirst, C., Knapp, J., and Worrall, F.: The role of terminal electron acceptors in peatland restoration., EGU General Assembly 2025, Vienna, Austria, 27 Apr–2 May 2025, EGU25-825, https://doi.org/10.5194/egusphere-egu25-825, 2025.

EGU25-966 | ECS | Orals | BG3.23

Science chasing industry: Is this novel technique as good as it seems? 

Anna McWilliam, Paul Gaffney, Nadeem Shah, and Mark Taggart

Water quality can be negatively impacted by tree felling operations and peatland restoration. This research considers how different and innovative brash (a by-product of felling trees - their tops and branches) management techniques might impact water quality following forest felling and subsequent peatland restoration.

The research design consisted of a Before-After Control-Impact experiment, wherein three different management techniques on three paired sites were compared. Two of these techniques are standard for the industry: conventional felling of trees, and the mulching of trees in-situ followed by ground smoothing. The third technique (felling multiple drifts of trees into one followed by ground smoothing) is novel and endorsed by the Scottish Government but it has not been studied previously.

Every four weeks (for 32 months) water samples and water table depths have been taken in and around treated sites. Water samples are tested for a range of water quality parameters in the laboratory. These quality indicators included: phosphate, ammonium, nitrate + nitrite, dissolved organic carbon, heavy metals, suspended solids, pH, conductivity, turbidity, etc.

Findings show that the novel technique resulted in little water quality impact (i.e., on suspended solids and nitrate + nitrite) in impacted watercourses. A spike (4.0 - 8.7 fold, mean 35.1) in ammonium occurred around one year after works were completed, and phosphate and potassium showed an elevated pulse soon after the works. Dissolved organic carbon showed strong seasonality which mirrored the control sites.

The novel technique considered here is an understudied method that is being recommended by Scottish Government agencies, and as such, science is chasing industry practice. This research aimed to sense check the impact of this technique on water quality and consider how it may impact the effectiveness of peatland restoration.

How to cite: McWilliam, A., Gaffney, P., Shah, N., and Taggart, M.: Science chasing industry: Is this novel technique as good as it seems?, EGU General Assembly 2025, Vienna, Austria, 27 Apr–2 May 2025, EGU25-966, https://doi.org/10.5194/egusphere-egu25-966, 2025.

Wet fen meadows are a traditional form of land use that is nowadays mainly preserved through nature conservation measures. Recent discussions suggest that this land use may also be considered as a form of paludiculture (that is, wet peatland use with the preservation of the peat body). However, the climate effect of this land use type is largely unknown. My presentation shows a complete two-year greenhouse gas (GHG) balance of two previously unexplored, long-term rewetted fens under a nature conservation management regime resulting from biweekly chamber measurements of GHG fluxes at two north-east German sites with acute sedge and at one site with creeping bentgrass from 2014 to 2016. Including harvest and dissolved carbon export, the three sites emitted between 10.4 and 16.3 t CO2-eq ha-1 yr-1, with mean annual water levels between -10 and -19 cm. Emissions consisted mainly of CO2 uptake and release and were influenced by harvest time and frequency as well as inundation periods during vegetation growth. In addition, CH4 emissions contributed to the net GHG balance at two sites due to inundation in late summer 2014. N2O emissions were of minor importance at all three sites. The presentation demonstrates that, depending on proper water management, nature conservation-managed fen meadows can have a similar climate effect as other fen paludicultures, with a GHG mitigation potential of between 15 and 20 t CO2-eq ha- 1 yr-1 compared to drainage-based grassland use on fens. 

How to cite: Wolf, R.: Managing wet fen meadows for nature conservation leads to a moderate warming effect, EGU General Assembly 2025, Vienna, Austria, 27 Apr–2 May 2025, EGU25-1354, https://doi.org/10.5194/egusphere-egu25-1354, 2025.

EGU25-1487 | ECS | Orals | BG3.23

From landscapes to freshwater invertebrates: understanding the effects of peatland restoraiton on Atlantic Salmon (Salmo salar) habitat in the Flow Country. 

Liam John Godwin, Roxane Andersen, Paul Gaffney, Mark Hancock, Alan Youngson, and Josie Geris

The Flow Country in the Scottish Highlands spans 400,000 hectares of actively accumulating peat bog, providing critical habitat and serving as a vital source of rivers essential for Atlantic salmon (Salmo salar) recruitment. Recognized for its outstanding ecological value, it recently achieved UNESCO World Heritage Site status. However, historical land-use changes, including drainage and forestry plantations, have degraded large areas, transforming them into sources of carbon emissions and compromising water quality. Restoration efforts, particularly forest-to-bog restoration, aim to reverse these impacts, yet their effects on freshwater quality and ecosystem health remain underexplored, especially concerning Atlantic salmon in upland peatland catchments. This study assesses the effects of forest-to-bog restoration on water quality (nutrients, dissolved metals, suspended sediments, dissolved organic carbon, and colour) and evaluates the implications for freshwater ecosystems, with a focus on macroinvertebrates and salmon populations. Short-term changes in water quality were observed in smaller streams draining restoration areas, particularly during the first three years, but these differences diminished over a decade. Importantly, no significant ecological impacts on macroinvertebrates or salmon populations were detected. Moreover, downstream dilution ensured that larger rivers maintained high water quality standards throughout the study. Our findings suggest that well-managed peatland restoration poses no lasting harm to freshwater ecosystems, even when short-term water quality challenges occur. However, high-water temperatures recorded during the study highlight climate change as a critical threat to cold-adapted species like salmon. This research underscores the importance of adaptive management, long-term monitoring, and large-scale restoration efforts that incorporate climate change mitigation strategies to safeguard the ecological integrity of peatland-dominated landscapes.

How to cite: Godwin, L. J., Andersen, R., Gaffney, P., Hancock, M., Youngson, A., and Geris, J.: From landscapes to freshwater invertebrates: understanding the effects of peatland restoraiton on Atlantic Salmon (Salmo salar) habitat in the Flow Country., EGU General Assembly 2025, Vienna, Austria, 27 Apr–2 May 2025, EGU25-1487, https://doi.org/10.5194/egusphere-egu25-1487, 2025.

Globally, millions of hectares of peatlands have been drained for agriculture and forestry by the digging of ditches, amounting to millions of kilometres of drainage ditches. It has been known for three decades that these ditches can be landscape-scale hotspots of the potent greenhouse gas (GHG) methane (CH4), as well as acting as sources of carbon dioxide (CO2) and nitrous oxide (N2O). Rewetted peatlands also feature remnant ditch networks that may be partially infilled or blocked, or still used for water management, and these waterbodies can continue to emit large amounts of GHGs.

Although a growing number of studies have measured and reported peatland ditch emissions, substantial knowledge gaps remain. Here, I will draw on my own research and that from the literature to give an overview of the importance that ditch emissions play in the GHG budgets of peatlands. This will include peatlands drained for forestry, grassland, and cropland, as well as rewetted peatlands. I will also highlight knowledge gaps and questions that remain to be answered about the role peatland ditches play in the carbon and GHG cycles.

How to cite: Peacock, M.: The importance of ditches in the greenhouse gas balances of managed and rewetted peatlands, EGU General Assembly 2025, Vienna, Austria, 27 Apr–2 May 2025, EGU25-3205, https://doi.org/10.5194/egusphere-egu25-3205, 2025.

EGU25-4016 | ECS | Posters on site | BG3.23

The impacts of water table dynamics on greenhouse gas emissions and phosphorus leaching in managed boreal peatlands 

Iida Höyhtyä, Maarit Liimatainen, Anne Tolvanen, Anna-Kaisa Ronkanen, Tung Pham, Milla Niiranen, Katharina Kujala, Miika Läpikivi, Maarit Hyvärinen, Bjørn Kløve, and Hannu Marttila

Pristine boreal peatlands store vast reserves of terrestrial carbon and have a net cooling impact on climate in the long term. Peatland drainage increases CO2 and N2O emissions and decreases CH4 emissions, leading to a net warming impact on climate. For example, cultivated peatlands can have high greenhouse gas (GHG) emissions per area and are therefore attractive targets for national aims to reduce GHG emissions. Raising water table depth (WTD) level can decrease the climate-warming impact. However, as drainage changes peat properties, the WTD elevation may lead to additional leaching of e.g. redox-sensitive phosphorus (P), which often restricts primary production in freshwaters. To support environmentally sound climate actions, we aimed to study the simultaneous impacts of different WTD conditions on GHG emissions and P leaching in variably managed peatlands.

Our study sites include cultivated peatland plots with different peat thicknesses, peatland forest, abandoned peat field, and pristine peatland. The chemical potential for P retention in different soil depths was studied using chemical extractions of soil. The GHG emissions in field conditions were studied with year-round GHG emission inventories, which were conducted with chamber methods in snow-free conditions and otherwise with the snow-gradient method. Besides the effect of WTD, also the effects of vegetation and several environmental variables were considered. The simultaneous effects of different WTD conditions (saturation, slowly lowering WTD, quick fluctuations) on GHG emissions and P leaching were studied using intact soil profiles with a column experiment in controlled conditions.

Our results help to find the best water management solutions considering both GHG emissions and P leaching. This knowledge is especially important in countries with large areas of drained peatlands and attempts to lower both GHG emissions and nutrient leaching. Sometimes land use changes may be unavoidable, and our studies with different land use options also support decision-making in these situations.

How to cite: Höyhtyä, I., Liimatainen, M., Tolvanen, A., Ronkanen, A.-K., Pham, T., Niiranen, M., Kujala, K., Läpikivi, M., Hyvärinen, M., Kløve, B., and Marttila, H.: The impacts of water table dynamics on greenhouse gas emissions and phosphorus leaching in managed boreal peatlands, EGU General Assembly 2025, Vienna, Austria, 27 Apr–2 May 2025, EGU25-4016, https://doi.org/10.5194/egusphere-egu25-4016, 2025.

EGU25-4542 | ECS | Orals | BG3.23

Fuel loads and peat smouldering carbon loss increase following peatland drainage 

Gregory Verkaik, Micah Eckert, Sophie Wilkinson, Paul Moore, and Mike Waddington

Northern peatlands store ~500 Pg C and are important ecosystems for global climate regulation. Wildfire is the largest natural disturbance to peatlands within the Boreal Plains of western Canada. Historically, low-severity fires in this region release less carbon than accumulates over a fire return interval (~120 years), allowing peatlands to maintain their carbon sink function. While peat combustion (measured as the depth of burn; DOB) is typically low, ranging from 5-10 cm (representing carbon emissions of ~1 kg C m-2), during prolonged drought, or in drained peatlands, peat burn severity can reach depths >1 m (~100 kg C m-2), threatening the carbon sink function of boreal peatlands. We aimed to assess how peatland drainage altered the spatiotemporal variability in forest cover, aboveground biomass, and tree productivity and how these changes related to the spatial variability in peat burn severity from a fire 24 years post-drainage. Using remote sensing techniques, forest cover and biomass were estimated through time and with distance from the nearest ditch. Field surveys and a LiDAR-based analysis were conducted to measure the spatial variability in peat burn severity. Peatland drainage increased forest cover and aboveground biomass. Drained peatland margins had the greatest peat burn severity with a mean depth of burn of 26.9 ± 12.6 cm (34.0 ± 10.1 kg C m-2) and some locations experienced DOB >90 cm (>87 kg C m-2), where peat burn severity increased with proximity to drainage ditches and greater aboveground biomass. Peatland drainage increases both aboveground and peat fuel loads through the triggering of positive peatland drying feedbacks which increase peatland vulnerability to deep smouldering, with peatland margins experiencing the greatest peat burn severity. Drained peatlands represent a severe fire risk that can be challenging for communities and fire management agencies. Peatland restoration should be integrated into fuel management strategies to reduce the fire risk that drained peatlands pose.

How to cite: Verkaik, G., Eckert, M., Wilkinson, S., Moore, P., and Waddington, M.: Fuel loads and peat smouldering carbon loss increase following peatland drainage, EGU General Assembly 2025, Vienna, Austria, 27 Apr–2 May 2025, EGU25-4542, https://doi.org/10.5194/egusphere-egu25-4542, 2025.

EGU25-8601 | ECS | Orals | BG3.23

Land management effects on ditch greenhouse gas dynamics in UK lowland peatlands  

Teresa Silverthorn, Luke Andrews, Francesca Baker, Laura Baugh, Chris Bell, Richard Chiverrell, Alexander Cumming, Chris D Evans, Stephanie Evers, Liz Flint, Ian Holman, Jonay Jovani, Rebecca McKenzie, Elya Monsen-Elvik, Francesca Southon, Humbelani Thenga, and Mike Peacock

The UK’s lowland peatlands occupy ~465,000 ha and are distributed across much of the country. The large majority (90%) of this lowland peat has been drained for agriculture, creating productive, fertile soils, but also exposing previously waterlogged organic matter to decomposition. Peatland drainage can alter aquatic biogeochemistry by increasing dissolved organic carbon fluxes to surface waters and promoting greenhouse gas (GHG) emissions from drainage ditches. Peatland rewetting has been demonstrated as an efficient mitigation technique for peatland GHG emissions. It is critical to understand how peatland drainage and subsequent rewetting may influence GHG emissions, as drainage may have allowed long-term accumulation of substances of agricultural or industrial origins, such as macronutrients (e.g. carbon, nitrogen, phosphorous) and heavy metals, which are released upon rewetting. Here, we present the results of an on-going, national-scale field study (part of the LowlandPeat3 project, https://lowlandpeat.ceh.ac.uk/lowlandpeat3) examining the spatio-temporal dynamics of GHG emissions in ditches draining arable lands (including conventional and regenerative agriculture) at paired “business as usual” and rewetted sites, during the baseline period prior to rewetting. We have measured carbon dioxide, methane, and nitrous oxide concentrations (and modelled fluxes) approximately monthly from sites across England. The results of this research will help us understand the risks and benefits of peatland rewetting on water quality, drinking water, aquatic ecology, and climate, to help inform lowland peat management and policy.  

How to cite: Silverthorn, T., Andrews, L., Baker, F., Baugh, L., Bell, C., Chiverrell, R., Cumming, A., Evans, C. D., Evers, S., Flint, L., Holman, I., Jovani, J., McKenzie, R., Monsen-Elvik, E., Southon, F., Thenga, H., and Peacock, M.: Land management effects on ditch greenhouse gas dynamics in UK lowland peatlands , EGU General Assembly 2025, Vienna, Austria, 27 Apr–2 May 2025, EGU25-8601, https://doi.org/10.5194/egusphere-egu25-8601, 2025.

EGU25-9025 | Orals | BG3.23

Can peatlands be used sustainably for agriculture in the Arctic Norway? 

Junbin Zhao, Mikhail Mastepanov, Cornelya Klutsch, Hanna Silvennoinen, David Kniha, Svein Wara, and Runar Kjær

Large areas of peatlands have been drained for agricultural and forestry purposes due to human activities. This drainage disrupts the natural hydrology of peatlands, leading to increased peat decomposition and turning these ecosystems into significant sources of greenhouse gas (GHG) emissions. Since the 1930s, extensive peatland areas in northern Norway have been drained and converted to agricultural land. To mitigate GHG emissions while maintaining biomass production, various management practices, including rewetting, are being promoted for these peatlands. Nevertheless, the impact of these mitigation measures on the peatland GHG balance remains largely unexplored.

We investigated grass productivity and the GHG balance in response to peatland cultivation under varying fertilization and hydrological treatments at a site in northern Norway. GHG fluxes (CO₂, CH₄, and N₂O) were measured using 30 automatic chambers at sub-daily intervals during the growing seasons of 2022-2024.

High water levels inhibited CO₂ emissions by suppressing ecosystem respiration, converting the ecosystem from a substantial CO₂ source to a sink or neutral state. Conversely, high water levels enhanced CH₄ emissions, while low water level plots remained CH₄ neutral. Sporadic N₂O emissions were observed to be higher under the more intensive fertilization regimen. Our results further highlight the critical role of harvest in determining the overall GHG and carbon balance in the ecosystem. This study has significant implications for guiding sustainable peatland management in Arctic regions.

How to cite: Zhao, J., Mastepanov, M., Klutsch, C., Silvennoinen, H., Kniha, D., Wara, S., and Kjær, R.: Can peatlands be used sustainably for agriculture in the Arctic Norway?, EGU General Assembly 2025, Vienna, Austria, 27 Apr–2 May 2025, EGU25-9025, https://doi.org/10.5194/egusphere-egu25-9025, 2025.

EGU25-9657 | ECS | Orals | BG3.23

CO2, CH4 and N2O balances of restored forestry-drained and natural peatlands in Estonia  

Salla Tenhovirta, Thomas Schindler, Ülo Mander, Mikk Espenberg, Joosep Truupõld, Muhammad Kamil-Sardar, and Kaido Soosaar

Natural peatlands are significant reservoirs and sequesters of carbon, important modifiers of local hydrology through their high water retention capacity, and unique habitats of rich biodiversity. The exploitation of peatlands by drainage for land-use purposes, such as peat mining or forestry, disrupts the original peatland ecosystem and leads to the degradation of the peat carbon storage, turning the soil from a sink into a source of greenhouse gases. Restoring drained peatlands aims to improve the water regime and carbon sink functions by re-establishing pre-disturbance conditions, ultimately restoring the ecosystem to a state where peat accumulation resumes. How fast and to what extent restoration goals are reached depend e.g. on the properties of the pristine peatland before drainage as well as the level of disturbance by the post-drainage land-use. Quantifying the greenhouse gas balances of restored peatlands is crucial for assessing the effectiveness of restoration as a climate change mitigation strategy, but it necessitates long-term monitoring of greenhouse gas exchanges. However, due to their vast diversity, there is limited research coverage on the various types of peatlands undergoing restoration, as well as a lack of data from the from periods beyond the first five years after rewetting. 

This study presents and compares the annual balances of CO2, CH4 and N2O for two forestry-drained bogs restored five years ago and two natural bogs, located in Estonia. For this we apply a field measurement-based modelling approach, utilising data from manual soil surface measurements of greenhouse gas fluxes conducted bi-weekly from November 2023 to October 2024, accompanied by continuous measurements of soil water content, soil water table level, soil and air temperatures and photosynthetically active radiation. The year-round CH₄ and N₂O fluxes, as well as the non-growing season net ecosystem exchange (NEE), were determined from series of gas samples collected from static, opaque chambers and analysed by gas chromatography. During the growing season, NEE was derived from gas flux measurements using a transparent dynamic chamber connected to a portable CO2 gas analyser. To account for spatial heterogeneity, the gas flux measurements were conducted across different microtopographical features and vegetation: hummocks, hollows, and spots dominated by cotton grass (Eriophorum vaginatum). The annual greenhouse gas balances are compiled from daily-level fluxes, which are modelled based on their dependencies with the environmental parameters. 

How to cite: Tenhovirta, S., Schindler, T., Mander, Ü., Espenberg, M., Truupõld, J., Kamil-Sardar, M., and Soosaar, K.: CO2, CH4 and N2O balances of restored forestry-drained and natural peatlands in Estonia , EGU General Assembly 2025, Vienna, Austria, 27 Apr–2 May 2025, EGU25-9657, https://doi.org/10.5194/egusphere-egu25-9657, 2025.

EGU25-9706 | ECS | Orals | BG3.23

Afforestation turns cutaway peatland into a carbon sink 

Alexander Buzacott, Kari Laasasenaho, Risto Lauhanen, Kari Minkkinen, Paavo Ojanen, and Annalea Lohila

Rates of peat extraction have rapidly declined in Finland, leaving thousands of hectares of formerly cutaway peatlands in need of management. Unlike in some other regions, in Finland there is no obligation to restore former peat extraction sites to wetlands. Afforestation is the most popular after use option of cutaway peatlands by landholders in Finland, however it is unclear how the ecosystem will respond to afforestation and whether the system can become a carbon sink quickly. In this study, we present a 3-year record of eddy covariance measurements from an afforested cutaway peatland site in Finland. We examined the carbon dioxide (CO2)exchange dynamics of the site as it was afforested and calculated annual totals to determine whether it is a carbon source or sink.

The study site, Naarasneva, is in Southern Ostrobothnia, Finland. Peat extraction ceased in 2020 and there is an average of 1 m depth of peat remaining. The eddy covariance system was installed in August 2021. Wood ash fertilisation was applied in January 2022, followed by the planting of 2-year old Pinus sylvestris (Scots pine) saplings in June 2022. Sentinel-2 derived leaf area index (LAI) observations were used to investigate the revegetation of the site during afforestation.

The timeseries of NEE shows the exchange (uptake and emission) of CO2 increasing over time. There was a clear effect of fertilisation, with a steady increase in the amount of CO2 uptake in the months following fertilisation. After fertilisation, the most dominant vegetation species growing were Calamagrostis spp. (reedgrass), Epilobium spp. (willow herb) and Betula pubescens (downy birch). The increase in CO2 uptake corresponded well with the LAI observations, which also showed a year on year increase. Annual totals of NEE show the site was a net source of 5.30 ± 0.46 t CO2 ha-1 yr-1 (mean ± 95% CI) in 2022, followed by two years where it was a net sink of -1.36 ± 0.42 t CO2 ha-1yr-1 in 2023 and -0.75 ± 0.56 t CO2 ha-1 yr-1 in 2024.

Our results show that afforestation of a cutaway peatland can quickly turn the site into a carbon sink. While it is positive that the carbon sink functionality of former peat extraction sites may be restored quickly, the long-term climate impact of afforestation is unclear due to the continued drainage of the peat and the uncertain fate of the carbon stored in wood.

How to cite: Buzacott, A., Laasasenaho, K., Lauhanen, R., Minkkinen, K., Ojanen, P., and Lohila, A.: Afforestation turns cutaway peatland into a carbon sink, EGU General Assembly 2025, Vienna, Austria, 27 Apr–2 May 2025, EGU25-9706, https://doi.org/10.5194/egusphere-egu25-9706, 2025.

EGU25-9974 | Posters on site | BG3.23

The influence of local variations in soil hydro-physical properties on ammonium release during flooding events in a coastal peatland 

Miaorun Wang, Tina Liesirova, Haojie Liu, Maren Voss, and Bernd Lennartz

Coastal peatlands are vulnerable to environmental changes, including salinity fluctuations caused by storm surge-induced seawater intrusion. This study investigates ammonium (NH₄⁺) release patterns during simulated sea flooding event in two locations of a coastal peatland in Northeast Germany (Hütelmoor): a near-natural location and a historically drained and rewetted location. Undisturbed soil samples (N=18) were collected from two depths (0–10 cm and 30–40 cm) at each location. A leaching experiment was conducted using three salinity treatments (N=3): groundwater (control, <1 ppt), Baltic Sea water (10 ppt), and mean seawater salinity (35ppt). Soil hydro-physical properties were determined following leaching experiment.

Results showed that NH₄⁺ release varied with salinity, soil depth, and land management. In the topsoil (0–10 cm), both locations exhibited high NH₄⁺ release at <1 ppt initially; however, higher salinity treatments (10 ppt and 35 ppt) continued to release elevated NH₄⁺ over time. In the subsoil (30–40 cm), rewetted samples under 10 ppt salinity released the most NH₄⁺, highlighting them as hotspots for nutrient mobilization during Baltic Sea flooding events.

Soil hydro-physical properties varied significantly across locations and depths, with a notable negative correlation between NH₄⁺ release and both saturated hydraulic conductivity (Ks) and macroporosity. This correlation was primarily driven by subsoil samples. While differences in hydro-physical properties were evident between near-natural and rewetted topsoils, they did not significantly influence NH₄⁺ release, suggesting that other factors, like soil organic matter (SOM), may play a more critical role in topsoil NH₄⁺ dynamics. In the subsoil, near-natural peat, characterized by higher Ks and macroporosity, retained less NH₄⁺ and released smaller amounts. Conversely, the rewetted subsoil, with lower Ks and macroporosity, accumulated and released more NH₄⁺, identifying it as a hotspot for nutrient mobilization.

Overall, by examining how local variations in soil hydro-physical properties across different locations within a single site influence NH₄⁺ release, this research identifies key hotspots for nutrient mobilization in a rewetted peatland. The findings highlight the necessity of accounting for both spatial and vertical soil property variations in coastal peatland restoration and management, especially regarding the prediction of environmental risks associated with nutrient release. Future research should examine how biogeochemical processes and microbial activity interact with soil hydro-physical properties to influence nutrient dynamics, especially under changing climate scenarios.

*Note: The first and second authors contributed equally to this work and share first co-authorship.

How to cite: Wang, M., Liesirova, T., Liu, H., Voss, M., and Lennartz, B.: The influence of local variations in soil hydro-physical properties on ammonium release during flooding events in a coastal peatland, EGU General Assembly 2025, Vienna, Austria, 27 Apr–2 May 2025, EGU25-9974, https://doi.org/10.5194/egusphere-egu25-9974, 2025.

EGU25-10318 | ECS | Orals | BG3.23

Impact of water levels on Typha spp. in a mesocosm experiment 

Meline Brendel, Silviya Joshi, and Jürgen Kreyling

Paludiculture is the productive use of wet or rewetted peatlands. Typha spp. is a promising paludiculture crop with usage options, including as building or insulation material. As part of the Paludi-PROGRESS project (Putting paludiculture into practice – optimization of cattail and reed cultures, project period 2022-2025) a mesocosm experiment was conducted to assess the above- and belowground biomass production and decomposition of Typha latifolia and Typha angustifolia to different water level treatments.

Using non-destructive sampling methods, we examined the annual biomass production of T. latifolia and T. angustifolia from April 2023 to April 2024 in response to either a water level gradient of -20 to +6 cm or to a drought gradient of 2 to 11 weeks. Phenospex PlantEye was used to assess the aboveground biomass production with a multi-spectral scanner. Belowground biomass production was examined with minirhizotrons and decomposition was assessed using litter bags.

At higher water levels, T. angustifolia showed higher aboveground biomass production whereas T. latifolia had higher aboveground biomass production at lower water levels. The latter also expressed higher belowground biomass production at lower water levels, whereas T. angustifolia’s belowground biomass response shifted during the vegetation period, benefitting from higher water levels until June 2023, afterwards showing higher belowground biomass production at lower water levels. Whereas both species benefit from short drought periods (2-4 weeks) with increasing belowground biomass production, longer drought periods negatively affected both species above- as well as belowground biomass production. T. angustifolia seemed to be more resilient against drought than T. latifolia. Information about the optimal water level and drought resistance of potential paludiculture crops are important information for a successful cultivation of Typha spp.

How to cite: Brendel, M., Joshi, S., and Kreyling, J.: Impact of water levels on Typha spp. in a mesocosm experiment, EGU General Assembly 2025, Vienna, Austria, 27 Apr–2 May 2025, EGU25-10318, https://doi.org/10.5194/egusphere-egu25-10318, 2025.

EGU25-10338 | Posters on site | BG3.23

Does returning Sphagnum moss to toxic metal polluted peatlands increase aqueous metal mobility? 

Colin McCarter, Kyle Pawson, Campbell Mclean, and Erik Emilson

Sphagnum moss plays an important role in regulating toxic metal and metalloid mobility by influencing peatland pH, dissolved organic matter composition, and ecohydrology. However, historical toxic metal and metalloid pollution has led to the absence of Sphagnum moss peatlands in many landscapes globally. Other often co-occurring pollutants, like sulphate, alter peatland biogeochemistry, leading to enhanced peat decomposition and altering peatland pH, dissolved organic matter composition, and ecohydrology. Furthermore, in these polluted landscapes, toxic metals and metalloids are preferentially stored in organic soils relative to mineral soil ecosystems and peatlands are thought of as landscape sinks for these pollutants. As Sphagnum moss returns to these polluted peatlands, whether naturally or from peatland restoration activities, it is unknown whether these landscape stores of toxic metals and metalloids is at risk of mobilizing to sensitive downstream ecosystems.

During historical smelting operations in Sudbury, Ontario, Canada an estimated 12,000 t of copper and nickel were released to the atmosphere, most of which was deposited within 100 km of the smelters where peat concentrations can exceed 1000 mg kg-1. Here, we used a spatial gradient of peatlands at varying levels of impact (high, moderate, low, none) in the region surrounding Sudbury as a model for recovery over time to understand the potential mobilization of toxic metals and metalloids due to the return of Sphagnum moss. In peatlands with no Sphagnum recolonization, both copper and nickel (along with other toxic metals and metalloids like methylmercury and arsenic) pore water concentrations were elevated (> 10 µg L-1) relative to peatlands with higher Sphagnum moss cover and lower initial impacts. These conditions coincided with higher dissolved organic matter (DOM) concentrations and humification levels but divergent relationships between DOM humification and copper/nickel concentrations were observed. There was no clear trend in apparent partitioning coefficient with Sphagnum recovery, while pH was the highest in the most impacted peatlands (no Sphagnum recovery, pH ~4 - 5). In the surficial peat (i.e., the surface of moss recolonization, 0-10 cm), a decrease in pH was not correlated (p > 0.1) with either water extractable copper or nickel and the apparent partitioning coefficients of either metal. While, in deeper, lower hydraulic conductivity peat, (10-20 cm) only the copper apparent partitioning coefficient significantly (p < 0.0001) declined with decreasing pH, suggesting increased geochemical mobility but decreased ecohydrological mobility.

The combined results suggest that the return of Sphagnum moss does not necessarily increase the risk of historical toxic metal release due to the numerous hydrobiogeochemical feedbacks that operate in peat and peatlands. As such, promptly returning Sphagnum moss to these polluted peatlands is critical to mitigating the potential for catastrophic metal release due to wildfires and droughts.

How to cite: McCarter, C., Pawson, K., Mclean, C., and Emilson, E.: Does returning Sphagnum moss to toxic metal polluted peatlands increase aqueous metal mobility?, EGU General Assembly 2025, Vienna, Austria, 27 Apr–2 May 2025, EGU25-10338, https://doi.org/10.5194/egusphere-egu25-10338, 2025.

EGU25-10373 | ECS | Orals | BG3.23

Biodiversity Potential in Solar Parks on Rewetted Peatlands 

Hanna Rae Martens, Jürgen Kreying, and Franziska Tanneberger

To meet climate targets, drained peatlands will need to be rewetted, thereby reducing greenhouse gas emissions from agricultural landscapes. However, possibilities for continued productive use of these landscapes are also necessary. A novel concept that has emerged in recent years is peatland photovoltaics (PV) in combination with peatland rewetting. Until now, there is almost no practical experience with peatland PV on rewetted peat soils; our project explores the biodiversity of a ‘wet’ peatland PV site.

For a comprehensive understanding of the biological implications of rewetting and solar power generation, a multi-taxon study is being conducted on vegetation, spiders, carabid beetles, birds, amphibians and bats. Paired with traditional field survey techniques, methods from the rapidly evolving field of bioacoustics including passive acoustic monitoring and machine learning are being used to gather data from the entire growing season. This presentation will provide initial results on plant and bird biodiversity at a 30-hectare rewetted peatland PV site in Northern Germany. A space-for-time approach was used to assess biodiversity in a drained, intensively used peatland site compared to the rewetted solar park. Initial results indicate that while species diversity is not significantly different, the plant community is. The plant community within the rewetted solar park has more species adapted to wet conditions, while the species within the drained peatland site are largely typical agricultural species.

Given the need to rewet peatlands and the rapid growth of the solar power industry, it is necessary to understand the biological implications of such a land use, as well as any possibilities for synergies between climate protection and renewable energy production. 

How to cite: Martens, H. R., Kreying, J., and Tanneberger, F.: Biodiversity Potential in Solar Parks on Rewetted Peatlands, EGU General Assembly 2025, Vienna, Austria, 27 Apr–2 May 2025, EGU25-10373, https://doi.org/10.5194/egusphere-egu25-10373, 2025.

EGU25-10490 | ECS | Orals | BG3.23

Productivity and biomass quality of cattail (Typha spp.) on a 10 ha paludiculture pilot site in northeast Germany 

Nora Köhn, Meline Brendel, Josephine Neubert, Sabine Wichmann, and Jürgen Kreyling

The Paludi-PROGRESS project (Paludiculture in practice: Optimisation of cattail and reed cultures, project period 2022-2025) aims to test and further develop the cultivation of cattail (Typha spp.) as a new permanent crop on wet peatlands. One of the main tasks is to evaluate the productivity and biomass quality of cattail on a 10 ha rewetted peatland, established in September 2019.

In the time period of 2021 until 2024 biomass samples were collected twice a year, in summer (July) and winter (November/December). Prior to the first sampling in 2021, four different density categories were identified based on the visual impression of the cattail vegetation (dense to rare cattail plant occurrence). Sampling plots were randomly distributed within these sub-areas of the pilot site (10 per density category). Since a partial harvest took place on a small area in December 2021 and 2023, the influence of cutting on the biomass could also be observed in the following years. Furthermore, the site was fully harvested at the beginning of 2023. To monitor the cattail vegetation, several parameters were recorded for each plot: e.g. number of cattail plants and spadices, plant height and diameter, dry weight, water content and chemical composition (carbon, nitrogen, phosphorous, potassium, lignin, cellulose and hemicellulose).

From winter 2021 to winter 2024, cattail biomass productivity has more than tripled from 1.8 to 6.8 t dm/ha when considering the total pilot site. In the areas with dense cattail vegetation, the biomass increased from 4.1 to 8.2 t dm/ha. Different stand densities showed an influence on morphological parameters, but had a minor effect on the chemical composition of the biomass. The harvest trial in 2021 did not have a significant impact on the parameters considered. In winter 2023, the biomass productivity declined to 3.6 (total site) and 4.9 t dm/ha (dense areas). Next to other environmental factors, harvesting the total site could have shown a negative effect on the regrowth of cattail in 2023.

The collected data show unique results about the development of cattails on a large-scale pilot site and therefore provide important information for future use of cattail from commercial-scale cultivation. Additionally, it is important to evaluate whether the given growing conditions lead to appropriate biomass quality for various utilization options.

How to cite: Köhn, N., Brendel, M., Neubert, J., Wichmann, S., and Kreyling, J.: Productivity and biomass quality of cattail (Typha spp.) on a 10 ha paludiculture pilot site in northeast Germany, EGU General Assembly 2025, Vienna, Austria, 27 Apr–2 May 2025, EGU25-10490, https://doi.org/10.5194/egusphere-egu25-10490, 2025.

EGU25-10958 | ECS | Orals | BG3.23

Seasonal conditions and flux footprints control the contribution of N2O and CH4 to the full GHG balance at grassland on peat soil 

Thi Tra My Lang, Bärbel Tiemeyer, Pascal Wintjen, Dominik Düvel, Jeremy J. Rüffer, Liv Offermanns, Ullrich Dettmann, and Christian Brümmer

Drained peatlands under intensive agricultural land use are hotspots of greenhouse gas (GHG) emissions. While management intensity and soil water status have been identified as major controlling factors, only few studies focussed on temporal dynamics and the contribution of nitrous oxide (N2O) and methane (CH4) to full annual GHG balances, mainly due to the lack of continuous observations in high temporal resolution. We present four years of parallel eddy-covariance (EC) and chamber GHG measurements at an intensively managed grassland site on bog peat soil. The site (DE-Okd) is part of the Integrated Carbon Observation System (ICOS) and represents common agricultural practice in Northwest Germany.

Average N2O fluxes measured by EC were consistently higher than those obtained by chambers. Following a grassland renewal, vegetation development in chamber frames was found to be more favourable than the average growth on the entire field that is seen by the EC tower. Poor grass development was identified by vegetation indices from remote sensing data and probably led to nitrogen surplus in the soil as observed by high ammonium and nitrate concentrations in drainage ditches. These conditions likely favoured both high N2O emissions and simultaneously high rates of nitrogen leaching. While N2O emissions made up considerable fractions of full annual GHG balances (~5 to 31%), the contribution of CH4 was negligible with hardly any significant fluxes detected by chambers and both seasonally varying emissions and uptake measured by EC cancelling out to non-significant shares to the overall budget.

N2O and CH4 emissions were strongly influenced by biometeorological factors and land management. Highest N2O peaks were observed two days after fertilizer application coinciding with about one week after grass cutting and highlighting a well-chosen chamber sampling scheme after management events. Further, N2O emissions were elevated during daytime under medium soil moisture and high soil temperature regimes, while CH4 emissions were strongly correlated with soil moisture dropping to nearly zero exchange under dry conditions.

Based on chamber measurements, the overall GHG balance of the site including harvest and carbon input through organic fertilization was in the range of 20 to 25 t CO2-equivalents ha-1 yr-1 in the period from 2020 to 2023 with generally higher emissions in dryer years. Replacing chamber N2O and CH4 by EC data for the full budget, individual annual values increased between 0.8 and 10.1 t CO2-equivalents ha-1 yr-1.

We conclude that the combination of EC and chamber measurements helped identifying temporal dynamics of GHG exchange for a better understanding of ecosystem functioning and quantifying method-based uncertainties. Conventionally managed grassland on drained peat soils with high fertilizer input and 4 to 5 grass cuts per year proved to be a significant net GHG emission source. Accounting for footprint heterogeneity – for example through adequate positioning of chamber frames – is of utmost importance for robust determination of total GHG balances at site-level scale.

How to cite: Lang, T. T. M., Tiemeyer, B., Wintjen, P., Düvel, D., Rüffer, J. J., Offermanns, L., Dettmann, U., and Brümmer, C.: Seasonal conditions and flux footprints control the contribution of N2O and CH4 to the full GHG balance at grassland on peat soil, EGU General Assembly 2025, Vienna, Austria, 27 Apr–2 May 2025, EGU25-10958, https://doi.org/10.5194/egusphere-egu25-10958, 2025.

EGU25-11079 | ECS | Orals | BG3.23

Influence of water management on GHG-balances along a land use intensity gradient in fen peatlands  

Daniel Lenz, Martina Schlaipfer, Heta Meyer, Sarah Gutermuth, Lena Jörg, Ralf Ludwig, and Matthias Drösler

This study examined the impact of different water management (WM) strategies and farming practices on greenhouse gas (GHG) emissions from organic soils at two sites in Southern Germany—the Altbayerisches Donaumoos and the Freisinger Moos. The aim was to assess whether specific WM and land-use measures could stabilize water tables and reduce CO2, CH4, and N2O emissions, while maintaining agricultural productivity.

In our test site in the Altbayerisches Donaumoos (arable land growing grain maize under conventional and organic management), four field treatments were established: two with controlled WM via subsurface irrigation and two reference sites without active WM. Results from 2022 showed reduced total GHG emissions—mainly driven by lower CO2 and N2O fluxes—on the WM plots compared to references, especially under organic management. CH4 fluxes were negligible, indicating a minor effect on the overall budget.

In the test site Freisinger Moos (grassland with three cuts per year), four treatments (two with subsurface irrigation at 30 and 50 cm depth, one with a simple raised water table through a weir, and one “pipe-less” subsurface system) were monitored during 2022 and 2023. Despite generally higher water tables in the irrigated plots, both CO2 and N2O emissions remained substantial. The 50 cm subsurface irrigation consistently showed the highest GHG fluxes, partly due to more intensive management and greater biomass exports. Notably, all treatments displayed increased emissions in 2023 compared to 2022—a rise attributed to possible changes in water availability, climatic factors, and residual effects of organic fertilization.

These findings highlight the complexity of balancing water management, agriculture, and climate protection in peatland regions. While raising the water table can reduce peat decomposition, achieving significant mitigation requires careful consideration of fertilizer inputs, crop type, and long-term soil conditions. While water management did have an effect on reducing CO2 emissions, this is not yet sufficient to be seen as a climate friendly practice. Future research should address long-term impacts and refine water-level targets to further optimize land use on organic soils and mitigate associated greenhouse gas emissions.

How to cite: Lenz, D., Schlaipfer, M., Meyer, H., Gutermuth, S., Jörg, L., Ludwig, R., and Drösler, M.: Influence of water management on GHG-balances along a land use intensity gradient in fen peatlands , EGU General Assembly 2025, Vienna, Austria, 27 Apr–2 May 2025, EGU25-11079, https://doi.org/10.5194/egusphere-egu25-11079, 2025.

EGU25-11328 | Orals | BG3.23

Two years of GHG emissions from reed canary grass under different harvest management intensities in a rewetting fen peatland 

Poul Erik Lærke, Johannes W.M. Pullens, Jesper R. Christiansen, Klaus S. Larsen, and Andres F. Rodriguez

Drained agricultural peatlands are a large source of greenhouse gasses (GHGs) due to peat oxidation. Paludiculture, where flood-tolerant grasses are grown on rewetted peatlands, might be a potential strategy for climate change mitigation by reducing GHG emissions while maintaining biomass production. This study assessed the impact of different harvest and fertilization treatments of reed canary grass (Phalaris arundinacea, cv. Lipaula; RCG) on GHG exchange dynamics and global warming potential (GWP) in two measurement periods (5 May 2020 to 4 May 2021, and 18 May 2021 to 17 May 2022) at a fen with shallow water tables depths (annual mean WTD of -10 cm and -8 cm, respectively) and ca. 2 m deep peat. RCG was established in 2018 and in the following years management strategies with 2 or 5 cuts per year were compared with a non-harvested scenario (0-cut). Treatments involving 2 and 5 annual cuts were fertilized with 200 kg N ha-1 yr-1 in equal split doses for each cut while the 0-cut scenario remained unfertilized. Fluxes of CO2, CH4, and N2O (only 2020-21) were measured with fortnightly intervals using the manual chamber technique and cumulative fluxes were derived by empirical models.

Yields of RCG decreased slightly over the years with 15.6, 11.5 and 8.9 t DM ha-1 yr-1 for the 2-cut system and 14.5, 9.4 and 8.6 for the 5-cut system in 2019, 2020 and 2021, respectively. Mean annual WTD of -13 cm in 2019 was slightly lower than the following years. In general, photosynthetic CO2 uptake was higher in treatments with active biomass management, but carbon export in the harvested biomass offset this benefit, resulting in a near-equal net ecosystem carbon balance (NECB) across all treatments ranging from 36.0 to 43.6 and 17.1 to 28.2 t CO2 ha-1 yr-1 in 2020-21 and 2021-22, respectively. The mean NECB of 22.5 t CO2 ha-1 yr-1 in 2021-22 across treatments was significantly lower than the mean of 38.7 t CO2 ha-1 yr-1 in 2020-21. This might be partly explained by the slightly increasing WTD due to lack of ditch maintenance and more precipitation, but the flux effect of increasing WTD on decreased peat oxidation may also be delayed by a few years. Emissions of CH4 remained low during 2020-21 (1.1–1.9 t CO2e ha-1 yr-1), while N2O emissions were relatively high (4.0-5.7 t CO2e ha-1 yr-1) without any treatment effects. In 2021-22, CH4 emissions increased to 2.6-3.7 t CO2e ha-1 yr-1 equivalent to 11.3 % of the total carbon emission in CO2 equivalents. Although the peat field seemed uniform, large variation within treatments was seen across the experimental blocks which could be linked to differences in soil nutrient concentrations and water chemistry. Overall, it can be concluded that paludiculture and the non-managed restoration scenario exhibited comparable climate outcomes thereby offering flexibility in land-use options for peatland restoration. However, results also suggested that biomass harvest can reduce GHG emissions in the more productive area, while leaving the biomass unmanaged was advantageous in the less productive area of the field.

How to cite: Lærke, P. E., Pullens, J. W. M., Christiansen, J. R., Larsen, K. S., and Rodriguez, A. F.: Two years of GHG emissions from reed canary grass under different harvest management intensities in a rewetting fen peatland, EGU General Assembly 2025, Vienna, Austria, 27 Apr–2 May 2025, EGU25-11328, https://doi.org/10.5194/egusphere-egu25-11328, 2025.

EGU25-11779 | Orals | BG3.23

Greenhouse gas balance for peat bogs in Northern-Ireland: moving towards Tier 2 emission factors using distributed eddy covariance measurements 

Merit van den Berg, Terhi Riutta, Eimear Reeve, Hannah Thompson, Alexander Cumming, Jonay Jovani, Simon Oakley, Hollie Cooper, Christopher Evans, Phil Jordan, Brenda D'Acunha, Alanna Bodo, and Ross Morrison

The UK Climate Change Committee (CCC) has set a target to increase the area of peatlands in good condition to 55% by 2050 through restoration and improved management. However, due to limited data, it remains uncertain how much greenhouse gas a restored peatland emits or sequesters over time, making these interventions difficult to assess.

Northern Ireland has a peat soil coverage of about 242,600 ha, representing approximately 18% of its land area. Around two-thirds consists of semi-natural peatlands, defined as areas that have experienced some human intervention (like grazing and drainage) while retaining natural peatland characteristics. The total greenhouse gas emission from peatlands in Northern Ireland were previously estimated at around 2,232 kt CO2e (Evans et al., 2017), representing 10% of Northern Ireland's total emission. However, some emissions were estimated using the IPCC’s emission factors (Wetlands Supplement, 2013), which may not represent the specific character of peatland in Northern Ireland.

To develop better estimates for Northern Ireland and reduce uncertainty, we measured CO2 and CH4 fluxes to create carbon and greenhouse gas budgets for four semi-natural peat bogs using the eddy covariance method between 2022 and 2024. These sites represent different degrees of human intervention, including a grazed blanket bog, two relatively natural raised bogs with some hydrological intervention, and a recently restored raised bog. Our results show that the IPCC Tier 1 emission factors tend to overestimate the emissions from peatlands in Northern Ireland. In fact, on average, these sites appear to function as net carbon and greenhouse gas  sinks, with the grazed blanket bog showing the highest uptake. Here, we present results from these sites, and a discussion on the temporal and spatial dynamics of peatland carbon fluxes.

How to cite: van den Berg, M., Riutta, T., Reeve, E., Thompson, H., Cumming, A., Jovani, J., Oakley, S., Cooper, H., Evans, C., Jordan, P., D'Acunha, B., Bodo, A., and Morrison, R.: Greenhouse gas balance for peat bogs in Northern-Ireland: moving towards Tier 2 emission factors using distributed eddy covariance measurements, EGU General Assembly 2025, Vienna, Austria, 27 Apr–2 May 2025, EGU25-11779, https://doi.org/10.5194/egusphere-egu25-11779, 2025.

Peatland ecosystems, while covering only ~3% of the land surface area, are globally-important sinks of atmospheric carbon dioxide and regionally-important sinks of pollutants such as toxic metals and metalloids. While metal concentrations in peatlands are generally low, concentrations can be far higher near current and historic industrial centres, particularly in the upper few decimetres of the peat profile. Under normal conditions these metals remain safely sequestered in the peat. However, there is concern that, in addition to direct carbon emissions, peatland wildfires could represent a major pathway for metal mobilization and transport. Moreover, peat fires are dominated by smouldering, which is a low temperature combustion that leads to high concentrations of particulate matter within the smoke, representing a major health risk for communities impacted by wildfire smoke plumes.


With projected future climate change, annual area burned and subsequent carbon emissions are expected to rise, with drastic increases associated with high climate-forcing scenarios. In addition to greater area burned, higher evaporative losses associated with warming conditions may lead to increased peat smouldering vulnerability during wildfire. However, differences in local climate, projected changes in precipitation, and peatland type may have strong regionally-dependent mitigating effects.


Using the MODIS burned area product, we first develop an empirical relationship between current average area burned and regional climate. Using the climate-driven relationship, we estimate future changes in area burned from multiple climate models (CMIP6 GCMs) and across several climate-forcing scenarios (SSP 2-4.5, 3-7.0,and 5-8.5). In addition to changes in area burned, peat smouldering carbon loss is evaluated by simulating peat moisture profiles using HYDRUS-1D within a phase-space defined by evaporative demand and water table (WT) position. Under contemporary conditions, peat smouldering loss is concordant with the depth of peat that exceeds a critical soil water tension threshold under steady state conditions using the mean WT position. The impacts of climate change on smouldering carbon loss is then estimated based on the change in position within the evaporative demand–WT phase space. Peatland WT sensitivity to temperature and precipitation are taken from the literature and used to estimate changes in WT based on GCM projections across SSPs. Combined with published data on peatland type and location, we produce some of the first ever hemisphere-wide estimates of northern peatland carbon loss from smouldering due to climate change. 


These spatially explicit results are used to highlight regions of overlap between increased burn area and severity with areas of high peat metal contamination. Taken together with estimates of particulate emissions from smouldering combustion, we provide an estimate of how climate change may increase global particulate matter emissions from northern peatlands. Moreover, uncertainty in the empirical relation and inter-model variability are used to quantify the confidence intervals for both projected area burned, peat burn severity, and thus particulate matter emissions, in order to highlight where future efforts are best focused for improving robustness of future projections.

How to cite: Moore, P., McCarter, C. P. R., Sutton, O., and Waddington, J.: Northern peatlands under fire: Projecting smouldering combustion loss in an uncertain future with implications for atmospheric metal emissions, EGU General Assembly 2025, Vienna, Austria, 27 Apr–2 May 2025, EGU25-11827, https://doi.org/10.5194/egusphere-egu25-11827, 2025.

EGU25-12079 | ECS | Posters on site | BG3.23

Groundwater level control as GHG emission reduction option tested using eddy covariance for peatland in the Netherlands 

Pascal Wintjen, Arnoud Frumau, Pim van den Bulk, Harmen van Mansom, and Arjan Hensen

In this work, the annual CO2 and N2O balance and analysis of the drivers for fertilized grassland on peat for a dairy farm under three groundwater level control options will be presented. This experiment is conducted in the context of the Dutch NOBV project (National Research program on GHG for peatland areas) as part of the Dutch Climate Agreement which has a chapter to reduce GHG emissions from peatland areas by 1 MtCO2-eq annually.

The groundwater level control options applied are the conventional ditch water level control system, nowadays often being replaced by drainage and ditch level control, and finally drainage and pressure control. Several fields of the Zegveld experimental farm are divided in three segments, each which a control option applied and a such allow study under comparable conditions.

Two years of GHG fluxes are reported and measured using one closed-path Aerodyne system switching inlet line each half hour using three small towers equipped with a Gill sonic anemometer at 1.75 m height in the middle of the largest elongated farm field. The eddy-covariance method was used to calculate half-hourly fluxes. The location and low measurement height maximize the representation of the field in the flux measured from all wind directions. CO2 fluxes showed uptake during the day and respiration during nighttime. After harvesting and grazing, emission fluxes prevailed. N2O peaks coincided well with agricultural management, e.g. grazing and fertilization, but also biometeorological factors like water temperature and ground water table influenced N2O emissions. From October 2023 to March 2024, N2O emissions were close to zero due to prolonged precipitation resulting in a shallow water level across all fields inhibiting production of N2O in the subsurface layer. Due to the high contribution of the field to the footprint compared to surrounding ditches, CH4 fluxes didn’t correlate with any in-field measured parameters driving the hypothesis that ditches appear to be the main source of CH4.

Flux loss corrections based on an empirical approach using measured ogives. Gap-filling of the N2O and CO2 fluxes was done using the gradient boosted regression trees XGBoost. The gap-filling process utilized a comprehensive set of predictors to enhance the accuracy and reliability of flux measurements. A comparison with an open-path CO2 system installed at one location showed a reasonable agreement with CO2 fluxes of the closed-path measurement system.

How to cite: Wintjen, P., Frumau, A., van den Bulk, P., van Mansom, H., and Hensen, A.: Groundwater level control as GHG emission reduction option tested using eddy covariance for peatland in the Netherlands, EGU General Assembly 2025, Vienna, Austria, 27 Apr–2 May 2025, EGU25-12079, https://doi.org/10.5194/egusphere-egu25-12079, 2025.

EGU25-12506 | Posters on site | BG3.23

Labile phosphorus in peat and other organic soils: baseline data and sampling protocols for paludiculture  

Sebastian Heller, Bärbel Tiemeyer, Ullrich Dettmann, Philipp-Fernando Köwitsch, Arne Heidkamp, Malina Kuwert, Sharon Laqua, Arndt Piayda, Bernd Schemschat, and Stefan Frank

Plant-available phosphorus (P) is the quantity of labile P that can be utilised by soil biota. This P pool is a major driver of plant growth, affecting the mineralisation of soil organic matter and the risk of P leaching. A common agronomic soil test (calcium-lactate extraction, PCAL) is regularly used to assess the status of plant-available nutrients in cultivated soils, while extraction with a bicarbonate-buffered dithionite solution (PDT) is suggested as a proxy for redox-sensitive P that might be released upon rewetting. However, systematic P studies on peat and other organic soils are scarce. The few studies that are available mostly describe P stocks over large depth increments or focus on leaching risks only. Organic soils are characterised by a high heterogeneity of the accumulated substrates and by a complex differentiation of the soil horizons. In addition, peatland management practices vary considerably from region to region, strongly influencing the level of water and nutrient management. Therefore, assessment of P status requires a specific soil sampling approach that reflects the genuine characteristic of organic soils and consider specific differences in peatland management. This is particularly relevant for paludiculture sites, where information is needed on both the beneficial and potentially harmful aspects of labile P (i.e. plant nutrition and risk of eutrophication). However, there are no agreed sampling and analysis methods especially for wet organic soils.

Here, we analyse data on the labile P pool (PCAL and PDT) from about 100 sites comprising more than 500 horizons of the German Peatland Monitoring Programme, covering a wide range of organic soils and land use types. In addition, data from a fen paludiculture project are used to elucidate spatial and temporal variability. These results will allow us to derive a baseline data set of the labile P pools in different organic soils depending on land use type, land use intensity and water management. Furthermore, appropriate sampling schemes will be derived specifically for paludiculture sites. Thus, the results can be used to contextualise specific (future) paludiculture site conditions with respect to biomass production and P leaching risks.

How to cite: Heller, S., Tiemeyer, B., Dettmann, U., Köwitsch, P.-F., Heidkamp, A., Kuwert, M., Laqua, S., Piayda, A., Schemschat, B., and Frank, S.: Labile phosphorus in peat and other organic soils: baseline data and sampling protocols for paludiculture , EGU General Assembly 2025, Vienna, Austria, 27 Apr–2 May 2025, EGU25-12506, https://doi.org/10.5194/egusphere-egu25-12506, 2025.

EGU25-12529 | ECS | Orals | BG3.23

The effect of water table depth on GHG emissions in an agricultural peatland with varying peat depth 

Henri Kajasilta, Milla Niiranen, Miika Läpikivi, Maarit Liimatainen, Stephanie Gerin, David Kraus, Liisa Kulmala, Jari Liski, and Julius Vira

Peatlands store around 30% of the world's soil organic carbon and therefore play a significant part in mitigating greenhouse gas (GHG) emissions. Some peatlands have been converted to agricultural use through artificial drainage and farming practices,leading to the accelerated release of carbon from the land to the atmosphere. However, the combination of soil characteristics, hydraulic properties and field management operations all play an important role in determining how much GHGs are emitted from the agricultural sites. The aim of this study is to 1) evaluate the applicability of the LandscapeDNDC model to cultivated peatlands by comparing the simulation outputs with the corresponding observations in the study site, and 2) assess the effects of the water table changes on GHG emissions. The LandscapeDNDC is a process-based model that can handle carbon and nitrogen cycling. The model can incorporate various input data, such as management, meteorological and water table data, and therefore provides a well-rounded framework for studying the effect of manipulating these input data on GHG emissions.

We performed the study at Luke Ruukki Research Station on the NorPeat platform, divided into 6 separate drainage blocks with varying peat depths (20 - 80 cm). Continuous flux measurements (June 2019 onwards) were collected at the site as well as block-specific dark chamber measurements of CO2 and N2O emissions. Each of the blocks had groundwater pipes equipped with pressure sensors to continuously measure the water table level. In addition, intensive measurements of soil properties and yield were carried out on the site during the study years 2019 - 2022, allowing us to establish a realistic site profile for our simulation runs.

The simulations were first validated with two meters: the satellite measurements of leaf area index and measurements of soil moisture. The model reproduced the observed variability in all blocks for both meters (R2 > 0.5) and was sufficiently able to simulate the observed CO2 and N2O fluxes. After analysing and ensuring that the model was able to reproduce the biochemical and hydraulic dynamics observed in the study site, we studied the three different water table scenarios and their effects on the GHG fluxes. In the scenarios the water table was raised on average to 15, 30, and 50 cm below the soil surface. These water table changes altered the soil respiration and nitrogen cycling, and provided insight into how peat thickness affects emissions. In addition, the study helped to quantify the mitigation effect of the raised water table, relieving the potential that water management could have on controlling GHG emissions.

How to cite: Kajasilta, H., Niiranen, M., Läpikivi, M., Liimatainen, M., Gerin, S., Kraus, D., Kulmala, L., Liski, J., and Vira, J.: The effect of water table depth on GHG emissions in an agricultural peatland with varying peat depth, EGU General Assembly 2025, Vienna, Austria, 27 Apr–2 May 2025, EGU25-12529, https://doi.org/10.5194/egusphere-egu25-12529, 2025.

EGU25-13008 | ECS | Orals | BG3.23

Carbon Under Threat: Insights from Grazing Exclusion and Climate Impacts in Pyrenean high mountain peatlands 

Sílvia Poblador, Laura Escarmena, Blanca Bautista-Medina, Annika Grundeus, Violeta Martinez-Amigo, Isabel Anaya, Josep M. Ninot, Aaron Pérez-Haase, and Francesc Sabater

Peatlands are globally significant ecosystems with high organic carbon storage capacity due to slow litter decomposition in water-saturated soils promoting anoxic conditions. However, these ecosystems are increasingly threatened by climate change and land-use pressures. In the Pyrenees, mountain peatlands have become relict ecosystems, reduced to small isolated areas of just over one hectare. There, hydrological conditions and vegetation cover are severely impacted by rising temperatures, reduced water availability, and intense livestock activity from large animals (i.e. horses and cows). Effective management strategies to mitigate potential large greenhouse gas (GHG) emissions from these ecosystems are urgently needed.

The ALFAwetlands and Pyrepeat projects investigate the effects of grazing exclusion (i.e. enclosures installed in 2016) and hydrological variation (i.e. strong seasonality) on GHG fluxes in two Pyrenean peatlands, Rubió (42.41º N, 1.24º E) and Estanyeres (42.61º N, 1.05º E). Both peatlands are characterized by contrasting pH (5.97 ± 0.08 and 7.78 ± 0.21, respectively) and water saturation levels. Over two years, monthly measurements of carbon dioxide (CO2), methane (CH4), and nitrous oxide (N2O) emissions were conducted across three plot types outside and within grazing exclusion zones: (1) low livestock trampling and soil disturbance, with barely vegetation gaps (mosses and sedges species); (2) pugged soils with wide exposed peat areas increasing CO2 oxidation potential, and large vegetation gaps; (3) peatland margin areas with the driest condition, rarely flooded, and continuous vegetation cover of grass-like plants. Within the enclosure, these three types of plot were identified before fences were installed and nowadays they are partially recovered.

Preliminary results highlight the vulnerability of these ecosystems to climatic changes. CO2 emissions were highest in dry plots of both peatlands, where reduced water content accelerated organic carbon oxidation. In the drier peatland, emissions were further amplified outside exclusion zones. CH4 emissions were higher in the wetter peatland, consistent with anaerobic conditions that promote methanogenesis, while N2O emissions remained consistently low across both sites due to nitrogen limitation.

These findings emphasize that climate-driven drying poses a significant threat to peatlands by increasing CO2 emissions, a risk that is exacerbated by livestock disturbances. Management actions such as grazing exclusion are critical to maintain peatlands’ carbon storage capacity and mitigate GHG emissions from these vulnerable ecosystems. This research contributes to the growing body of knowledge needed to align peatland conservation and restoration with climate change adaptation.

How to cite: Poblador, S., Escarmena, L., Bautista-Medina, B., Grundeus, A., Martinez-Amigo, V., Anaya, I., Ninot, J. M., Pérez-Haase, A., and Sabater, F.: Carbon Under Threat: Insights from Grazing Exclusion and Climate Impacts in Pyrenean high mountain peatlands, EGU General Assembly 2025, Vienna, Austria, 27 Apr–2 May 2025, EGU25-13008, https://doi.org/10.5194/egusphere-egu25-13008, 2025.

EGU25-13231 | ECS | Posters on site | BG3.23

Effect of solar panels on greenhouse gas emissions in a rewetted peatland 

Cordula Gutekunst, Monika Hohlbein, Hanna Rae Martens, Carl Pump, and Gerald Jurasinski

Drained peatlands are a strong source of greenhouse gas emissions. Peatland rewetting projects that aim to return sites to their near-natural state may collide with the need for land use in an agricultural or alternative way. The installation of ground-mounted photovoltaic systems might be an economically attractive use option for rewetted peatlands, beside the utilisation with paludiculture - i.e. agriculture and forestry on wet peatlands. In the project Moor-PV we investigate the impact of photovoltaic systems (solar panels) in rewetted peatlands on biodiversity, peat conservation as well as the water and climate balances. For the latter we measure fluxes of the three most important greenhouse gases (carbon dioxide, methane and nitrous oxide) under and outside the rows of bifacial solar panels to estimate annual balances at two different solar parks east and west of a railway line. Once preliminary gas flux data are analyzed, the impact of solar panels on the microclimate and their shading effect as a driver for potentially altered vegetation growth will be investigated. Our results will help to foster our understanding of the greenhouse gas exchange in this specific environment and to inform solar park operators and farmers about climate friendly use options on rewetted peatlands. 

How to cite: Gutekunst, C., Hohlbein, M., Martens, H. R., Pump, C., and Jurasinski, G.: Effect of solar panels on greenhouse gas emissions in a rewetted peatland, EGU General Assembly 2025, Vienna, Austria, 27 Apr–2 May 2025, EGU25-13231, https://doi.org/10.5194/egusphere-egu25-13231, 2025.

EGU25-13237 | Posters on site | BG3.23

Pore Water Quality in Northern Peatlands: Impacts of Drainage and Rewetting 

Haojie Liu, Dominik Zak, Rasmus Jes Petersen, Fereidoun Rezanezhad, Nathalie Fenner, and Bernd Lennartz

The primary objectives of peatland restoration are to reduce greenhouse gas emissions and maintain water quality. However, the effects of human activities, such as drainage and rewetting, on pore water quality remain insufficiently understood. In this study, we synthesized pore water quality data from 197 northern peatlands, encompassing natural, drained, and rewetted systems. Our analysis revealed that drainage significantly increases the concentrations of dissolved organic carbon (DOC), ammonium, and phosphate in pore water compared to natural peatlands. While rewetting reduced these concentrations, they remained elevated relative to natural systems. Notably, pore water concentrations in rewetted peatlands were closely linked to water table levels, with peak concentrations observed under inundated conditions, particularly in fen peatlands. Over an approximately 30-year observation period, no consistent temporal trends in pore water quality following rewetting were identified. These findings highlight the complexity of pore water quality responses to rewetting and the importance of long-term monitoring for optimizing peatland restoration practices.

How to cite: Liu, H., Zak, D., Petersen, R. J., Rezanezhad, F., Fenner, N., and Lennartz, B.: Pore Water Quality in Northern Peatlands: Impacts of Drainage and Rewetting, EGU General Assembly 2025, Vienna, Austria, 27 Apr–2 May 2025, EGU25-13237, https://doi.org/10.5194/egusphere-egu25-13237, 2025.

EGU25-13474 | ECS | Posters on site | BG3.23

Impact of Pore-Size-Class on Carbon Turnover in Peat Soils 

Rosa Cambinda, Bernd Lennartz, Haojie Liu, and Fereidoun Rezanezhad

The loss of carbon from peatlands occurs through gaseous emissions and a substantial fraction from aquatic fluxes, specifically dissolved organic carbon (DOC), during mineralisation and degradation processes. Our study hypothesises that DOC production is dependent on pore size, with higher concentrations occurring in finer pores. To investigate this, pore water was extracted at specific pressure heads (-60 and -600 hPa), representing macro- and mid-size pore domains, from degraded peat samples. Soil organic matter content was measured at 34 wt% in the topsoil and 57 wt% in the subsoil. Notably, the more degraded topsoil exhibited significantly higher average DOC concentrations than the subsoil, with levels 1.5 times greater at -60 hPa and 2.4 times higher at -600 hPa. These trends indicate that degraded peat soils are prone to release greater amounts of DOC. Additionally, DOC concentrations in topsoil samples were consistently higher at -600 hPa compared to -60 hPa.
The negative correlation between soil organic matter (SOM) and DOC at -600 hPa (r = - 0.53; p < 0.0001) aligns with degradation-driven reductions in SOM and porosity. Degraded topsoil exhibited high DOC variability for SOM < 40 wt%, stabilising below 50 mg/L for SOM ≥ 40 wt%. Through a graphical illustration, we infer that the elevated DOC export is likely due to the higher surface-to-volume ratio observed in mid-sized pores (-60 to -600 hPa), further enhanced by the dual-porosity structure of the degraded topsoil. This structural variation contributes to differences in carbon turnover rates. Additionally, microbial communities and their abundance differ across pore size classes, causing pore size-dependent reactions that influence DOC export.

How to cite: Cambinda, R., Lennartz, B., Liu, H., and Rezanezhad, F.: Impact of Pore-Size-Class on Carbon Turnover in Peat Soils, EGU General Assembly 2025, Vienna, Austria, 27 Apr–2 May 2025, EGU25-13474, https://doi.org/10.5194/egusphere-egu25-13474, 2025.

EGU25-13582 | Orals | BG3.23

Understanding the potential for disturbance-induced contaminant release from degraded peatlands: a global review of heavy metals in peatlands 

Emma Shuttleworth, Adam Johnston, Gareth Clay, Thomas Mair, Mike Waddington, Colin McCarter, Nathan Basiliko, John Gunn, Peter Beckett, Ken Byrne, Graeme Swindles, and Richard Fewster

Human industry has contaminated peatlands through the atmospheric deposition of pollutants released by industrial processes over many centuries. Relative to other ecosystems, peatlands sequester a far greater proportion of toxic metals than their areal extent. This is especially true in industry-impacted landscapes, where toxic metals in surficial peat can be elevated well above natural concentrations. Despite peatlands acting as contaminant sinks that can maintain their carbon storage functionality under low metal concentrations, high rates of metal pollution can lead to the degradation of peatland processes that sustain carbon sequestration. For example, the loss of keystone peatland species, such as Sphagnum mosses, limits peat accumulation and long-term carbon accumulation. Therefore, in these degraded peatlands, peat forming processes are often suppressed even decades after the source of contamination has reduced or ceased.

Once degraded, peatlands become susceptible to additional disturbances such as fire or erosion, which can release their toxic legacy into the environment and drinking water. Predicted future warmer and drier conditions are expected to increase wildfire prevalence on the landscape and may be further compounded by land use change.  The release of previously sequestered metals arguably represents one of the largest contemporary global environmental disasters and greatest future global environmental challenge.

In this paper, we present an in-depth review of existing literature on ombrotrophic peatland metal contamination from a range of disciplines. After a detailed search and screening process, data were extracted from 97 studies. 500 individual points covering 26 countries were extracted from these studies, which were published between 1973 to 2022. For each study, the depth at which maximum heavy metal concentration (Cmax) occurred was recorded, along with surface concentration and concentration at depth. Using Kernel Density Estimates, the distribution of Cmax was typically within the top 0.2m of the peat surface across all studies, though with variation in the mean depth profiles between different metals. For example, Cmax for Cd and Zn typically peaked at 0.1m below the surface with few studies showing Cmax below 0.2m. As, Cu and Pb also had mean Cmax values <0.2m depth but showed a tail of Cmax values extending to at least 0.5m depth.

The review provides much needed understanding of the spatial extent of peatland contamination as an essential first step in tackling contaminant release from peatland fires. By quantifying the extent of heavy metals at depth in the peat profile, this work can link with peat fire modellers, ecohydrologists and climate scientists to better predict the impact of severe fires under future climate and land use change.

How to cite: Shuttleworth, E., Johnston, A., Clay, G., Mair, T., Waddington, M., McCarter, C., Basiliko, N., Gunn, J., Beckett, P., Byrne, K., Swindles, G., and Fewster, R.: Understanding the potential for disturbance-induced contaminant release from degraded peatlands: a global review of heavy metals in peatlands, EGU General Assembly 2025, Vienna, Austria, 27 Apr–2 May 2025, EGU25-13582, https://doi.org/10.5194/egusphere-egu25-13582, 2025.

Most peatlands and other carbon-rich soils in Germany are drained and responsible for 7% of national greenhouse gas (GHG) emissions. Peatlands used for agriculture account for 43 million tonnes of CO2 equivalents per year, or 80% of these emissions. Rewetting such areas would be an effective strategy to reduce their GHG emissions. This does not mean that productive land use has to be abandoned, as plants grown on rewetted peatlands can be used for many purposes, e.g. as horticultural substrates, building materials and bioplastics. However, the implementation of so-called paludiculture is still limited to small-scale projects as it poses many challenges for farmers, including complex authorisation procedures, high installation and maintenance costs, limited management expertise and the lack of established value chains for the biomass produced.

To support the transition to paludiculture, the German government is funding ten large-scale, long-term projects across different peatland regions of the country. The shared goal of these projects is to implement on a practical scale all steps from the planning of rewetting to the establishment and management of paludiculture up to the processing and marketing of the products. The projects include scientific monitoring to assess the impact of paludiculture on GHG emissions, nutrient fluxes, biodiversity and other ecological parameters as well as on economic and socio-economic conditions. In order to obtain nationwide representative results, the studies accompanying the projects need to be carried out using comparable methods and the data must be analysed comprehensively. Therefore, these projects work together in a networked called “PaludiNetz”, established and coordinated by the project “PaludiZentrale”. A key element of the PaludiNetz are the thematic working groups which consist of members that are responsible for the respective topics in their projects. In the working groups methods are tested and defined, results discussed and syntheses planned and carried out. Here, we will present the project’s approach and describe the cooperation within the PaludiNetz and with other paludiculture initiatives.

How to cite: Minke, M., Tiemeyer, B., and Tanneberger, F.: PaludiZentrale - Coordination and networking of large projects to jointly answer key questions to paludiculture and develop recommendations for action, EGU General Assembly 2025, Vienna, Austria, 27 Apr–2 May 2025, EGU25-13716, https://doi.org/10.5194/egusphere-egu25-13716, 2025.

EGU25-15022 | ECS | Posters on site | BG3.23

The effect of biochar in the growth of Sphagnum papillosum 

Amanda Laatikainen, Helmi Lehikoinen, and Teemu Tahvanainen

The cultivation of Sphagnum mosses is being developed both as a commercial product and for the restoration of peatlands, for example, in peat extraction areas that have been removed from production. Understanding the factors influencing the growth of Sphagnum mosses, and especially those that promote it, plays a key role in intensive farming. It is also crucial that grown mosses are healthy and robust when transferred to sowing areas.


We planted Sphagnum papillosum capitula in small plastic mugs on top of peat collected from old peat extraction area. On top of the peat, we spread willow and birch biochar. Straw was spread on top of the mosses to even out the moisture conditions. The irrigation water came through holes in the bottom of the mugs and there were three different types of water: from a raised bog, spring and a mixture of these. The mugs were in a growth chamber under standard conditions for three months. Subsequently, the mosses were imaged using Pulse-Amplitude-Modulation (PAM) to detect photosynthetic activity. For mosses, length, number of capitulum and fresh and dry weight were measured separately from capitula and stems. The aim of the study was to investigate the effect of different biochars and irrigation water on the growth of S. papillosum.


The best growth results were achieved in mugs with added willow biochar (232 ± 30.1 g m -2). The growth of mosses was almost half that of mugs without added char (126 ± 27.9 g m -2). Birch biochar also promoted moss growth in length, weight and number of capitula. Different irrigation waters did not have a statistically significant effect on moss growth (paired t-test, t = -0.400, p = 0.697, df = 11). The PAM measurement results were interpreted using "healthy" pixels identified in the image. When comparing the number of pixels, willow char, birch char and control treatments differed significantly, and the control mugs had lower photosynthesis activity.


The experiment gave promising results on the development of Sphagnum farming and possible guidelines for what can be studied next in field experiments.

How to cite: Laatikainen, A., Lehikoinen, H., and Tahvanainen, T.: The effect of biochar in the growth of Sphagnum papillosum, EGU General Assembly 2025, Vienna, Austria, 27 Apr–2 May 2025, EGU25-15022, https://doi.org/10.5194/egusphere-egu25-15022, 2025.

EGU25-15398 | ECS | Orals | BG3.23

Carbon dioxide, methane and nitrous oxide fluxes from former peat extraction fields currently used for cranberry (Vaccinium macrocarpon) and highbush blueberry (Vaccinium corymbosum) plantations 

Arta Bārdule, Raitis Normunds Meļņiks, Zaiga Anna Zvaigzne, Dana Purviņa, Ilona Skranda, Oleg Prysiazhniuk, Oksana Maliarenko, and Andis Lazdiņš

Under the umbrella of international and European Union climate policies and agreements aimed at achieving climate neutrality and thus reducing greenhouse gas (GHG) emissions from drained organic soils (including the Paris agreement, the European Green Deal and the Nature Restoration Law), it is urgently necessary to estimate GHG fluxes from former peat extraction fields to provide measurement-based recommendations for further management of these areas. In addition, there is lack of quantitative estimates of contribution of peatland plant cultivation, including berries, to total GHG emissions and climate change mitigation. Here, we compared carbon dioxide (CO2), methane (CH4), and nitrous oxide (N2O) fluxes from nutrient-poor organic soils (Histosols) in former peat extraction fields currently used for cranberry (Vaccinium macrocarpon) and highbush blueberry (Vaccinium corymbosum) plantations, active peat extraction fields and pristine raised bogs. GHG flux measurements were conducted over two years using a manual chamber technique at 16 study sites (at least three sites of each land-use type) across 11 different raised bogs in the hemiboreal vegetation region of Europe (in Latvia). Across the studied land-use types, mean annual net CO2 fluxes, calculated as the difference between the annual soil heterotrophic respiration and the annual C input into soil with plant litter, ranged from near zero (-0.07 ± 0.68 t CO2-C ha-1 y-1) in the pristine raised bogs to 1.56 ± 0.19 t CO2-C ha-1 y-1 in active peat extraction fields. Furthermore, net CO2 fluxes had the largest contribution to total GHG emissions in both active peat extraction fields and berry plantations. The lowest annual CH4 fluxes were observed in cranberry plantations (6.65 ± 1.77 kg CH4-C ha-1 yr-1), while the highest were in pristine raised bogs (128.0 ± 27.5 kg CH4-C ha-1 yr-1), where CH4 fluxes accounted for the largest share of total GHG emissions. Annual N2O fluxes did not exceed 0.65 ± 0.33 kg N2O-N ha-1 yr-1 (in highbush blueberry plantations) and made a relatively low contribution to total GHG emissions compared to net CO2 and CH4 fluxes. Across the studied land-use types, the highest total GHG fluxes (the sum of annual net CO2, CH4 and N2O fluxes considering global warming potential values for a 100-year time horizon) were observed in active peat extraction fields (6.23 t CO2 eq. ha-1 yr-1), while the lowest were in cranberry plantations (1.50 t CO2 eq. ha-1 yr-1).

Acknowledgments: The research was conducted within the scope of the European Commission LIFE Climate Action Programme Project “Peatland restoration for greenhouse gas emission reduction and carbon sequestration in the Baltic Sea region” (LIFE21 - CCM - LV - LIFE PeatCarbon, Project number: 101074396).

How to cite: Bārdule, A., Meļņiks, R. N., Zvaigzne, Z. A., Purviņa, D., Skranda, I., Prysiazhniuk, O., Maliarenko, O., and Lazdiņš, A.: Carbon dioxide, methane and nitrous oxide fluxes from former peat extraction fields currently used for cranberry (Vaccinium macrocarpon) and highbush blueberry (Vaccinium corymbosum) plantations, EGU General Assembly 2025, Vienna, Austria, 27 Apr–2 May 2025, EGU25-15398, https://doi.org/10.5194/egusphere-egu25-15398, 2025.

EGU25-15973 | Posters on site | BG3.23

Establishment of a German peatland monitoring programme for climate protection - Open land (MoMoK) 

Bärbel Tiemeyer and the MoMoK-Team

Peat and other organic soils store large amounts of soil organic matter, which is highly vulnerable to drainage. Thus, drained organic soils contribute around 7% to the total German greenhouse gas (GHG) emissions and around 44% to the emissions from agriculture and agriculturally used soils, despite covering less than 7% of agricultural area in Germany. With approx. 90% of the total emissions, carbon dioxide (CO2) is the most important GHG with regards to drained organic soils. To evaluate possible GHG mitigation measures such as classical re-wetting, paludiculture or adjusted water management compared to the still widespread status quo of drainage-based peatland agriculture, an improved data set on GHG emissions, in particular CO2, and their drivers is needed. Furthermore, spatial data and upscaling methods need to be improved.

To meet these needs, a long-term monitoring programme for organic soils is currently (2020-2025) being set up for open land at the Thünen Institute of Climate-Smart Agriculture. A consistent long-term monitoring of soil surface motions, representatively covering a broad range of organic soil and land use types is combined with the repeated measurement of soil organic carbon (SOC) stocks to assess CO2 emissions using standardized and peat-specific methods. Land use types comprise grassland, arable land, paludiculture as well as unutilized re-wetted, degraded and semi-natural peatlands. At each of the envisaged approx. 130 monitoring sites important parameters such as groundwater table, vegetation and soil properties are monitored. Together with the updated map of organic soils and a revised machine learning model for water levels, all collected data form the basis for improving regionalisation approaches for drivers – particularly water levels and SOC stocks – and CO2 emissions from organic soils in Germany. Here, we will present the current status of site establishment with a focus on exemplary sites with water management.

How to cite: Tiemeyer, B. and the MoMoK-Team: Establishment of a German peatland monitoring programme for climate protection - Open land (MoMoK), EGU General Assembly 2025, Vienna, Austria, 27 Apr–2 May 2025, EGU25-15973, https://doi.org/10.5194/egusphere-egu25-15973, 2025.

EGU25-16249 | ECS | Posters on site | BG3.23

Modeling of greenhouse gas emissions from peatlands in Germany: merging empirical and process-based model approaches 

Florian Braumann, Sergey Blagodatskiy, Janina Klatt, Sebastian Friedrich, Clemens Scheer, Ralf Kiese, and Matthias Drösler

The ITMS (Integriertes Treibhausgas-Monitoring System) Sources and Sinks module of the long-term project funded by the German Federal Ministry of Education and Research develops modeling techniques to simulate greenhouse gas fluxes with high spatial and temporal resolution for Germany. The integration of existing experimental data from national and Bavarian projects with new measurements from natural, drained and rewetted peat soils in the MODELPEAT project enables the modification and improvement of the process-based model LandscapeDNDC to allow also the simulation of peatland GHG exchange. At the same time, empirical modeling approaches are optimized for detailed peatland GHG characterization. Comparative analyses of both approaches will highlight their respective strengths, weaknesses and uncertainties and will help to find the optimal strategy for GHG exchange modeling at regional and national scales. This work is crucial for the identification of emission hotspots and the development of effective mitigation strategies. The poster will provide an overview of the project and preliminary modeling results for several peatland sites in Bavaria, where detailed experimental observations spanning decades are available. It will facilitate an evaluation of the model´s performance in representing undisturbed, drained, and restored peatlands. These estimates will be compared with regional estimates derived using statistical approaches.

How to cite: Braumann, F., Blagodatskiy, S., Klatt, J., Friedrich, S., Scheer, C., Kiese, R., and Drösler, M.: Modeling of greenhouse gas emissions from peatlands in Germany: merging empirical and process-based model approaches, EGU General Assembly 2025, Vienna, Austria, 27 Apr–2 May 2025, EGU25-16249, https://doi.org/10.5194/egusphere-egu25-16249, 2025.

EGU25-16729 | Orals | BG3.23

Long-term biogeochemical consequences of rewetting iron and sulphur-rich peatlands 

Casey Bryce, Anne Eberle, Fin Ring-Hrubesh, Jagannath Biswakarma, Elise Dehaen, Richard Pancost, and Angela Gallego-Sala

Peatlands host the largest store of terrestrial carbon on Earth and it is widely accepted that reversal of their widespread degradation is required to meet emissions targets. Thus, significant action is underway globally to encourage their rewetting and restoration. However, restoration success can be complicated by geological factors in the local environment. Peatlands in regions with iron sulphide-rich rocks and sediments experience drastic drops in pH following drainage and release high concentrations of iron and toxic metals. Accumulation of iron and sulphur in the peat during this time will fundamentally alter biogeochemical cycling, yet we have little understanding of the extent to which these effects can be reversed following the raising of water tables. Furthermore, the long-term impacts on resident microbial communities responsible for dictating the nature and scale of green-house gas emissions from such sites is unknown.

We have compared two neighbouring fens in southern England underlain by glauconite- and pyrite-rich sandstone which are within the same hydrological regime but have experienced differing degrees of historical drainage and degradation. Both fens were designated for conservation and rewetted in the 1970s. Porewater nutrient and greenhouse gas profiles, peat geochemistry, mineralogy and microbial community analyses collectively suggest lasting differences in redox state and element cycling between the two areas. Wolferton Fen, which experienced less historical land disturbance, had returned to a near-natural state in 2022. However, Dersingham Fen, which was historically deeply drained and experienced significant peat loss, had a low pH, thick crusts of iron (oxyhydr)oxides remaining on the surface, and very high porewater iron and sulphate concentrations. High abundances of these alternative terminal electron acceptors inhibit methanogens in Dersingham Fen, which continues to be a source of CO2 despite anoxia.

These results suggest that iron and sulphur-rich peatlands can tolerate some degree of degradation, but extensive drainage and peat loss will likely lead to permanent contamination which remains following rewetting. However, there may be a lot to gain from restoration of such sites as rewetting can protect remaining peat and reduce CO2 emissions whilst methane production would remain low.

How to cite: Bryce, C., Eberle, A., Ring-Hrubesh, F., Biswakarma, J., Dehaen, E., Pancost, R., and Gallego-Sala, A.: Long-term biogeochemical consequences of rewetting iron and sulphur-rich peatlands, EGU General Assembly 2025, Vienna, Austria, 27 Apr–2 May 2025, EGU25-16729, https://doi.org/10.5194/egusphere-egu25-16729, 2025.

EGU25-17220 | ECS | Posters on site | BG3.23

Carbon Balance in Drained Hemiboreal Peatland Forests  

Muhammad Kamil-Sardar, Reti Ranniku, Joosep Truupõld, Ivika Ostonen, Gristin Rohula-Okunev, Veiko Uri, Kristina Aun, Ülo Mander, and Kaido Soosaar

Understanding the carbon (C) balance of forestry-drained peatlands is crucial for addressing climate change. Natural peatlands are significant C sinks; however, soil carbon is released back into the atmosphere after the drainage of these ecosystems. Existing studies often face spatial and temporal variability, as many studies have focused on specific management practices, localized conditions, or short time frames. This narrow scope hinders the generalization of findings across diverse regions and peatland ecosystems. 

This study examines the C balance of hemiboreal drained peatland forests by analyzing C pools and fluxes across various ecosystem components, including soil, vegetation, litter and leaching. Four sites in Estonia were selected, representing two distinct forest types: a drained bog forest (DBF), dominated by Scots pine (Pinus sylvestris), and three transitional fen forest (DTFF) sites, dominated by downy birch (Betula pubescens), Norway spruce (Picea abies), and Scots pine (Pinus Sylvestris), respectively.

The field measurements were conducted over two years (July 2022 to June 2024). Soil heterotrophic respiration (Rhet) during the vegetation period was measured biweekly in trenched plots using an opaque dynamic chamber connected to a portable CO2 gas analyzer EGM-5. Gas samples of non-vegetation period Rhet and year-round soil methane (CH4) were collected biweekly using manual static chambers and analyzed with gas chromatography. Soil physical and environmental were continuously measured and recorded at 30-minute intervals using CR1000 data loggers. Soil chemistry was evaluated once during the study period. The leaching of dissolved organic carbon (DOC) was estimated using plate lysimeters installed in the soil at a depth of 40 cm in all the studied stands. Furthermore, above- and belowground biomass and annual production were estimated through field-based measurements and empirical modelling approaches to calculate each site’s C balance.

Preliminary results indicate that Rhet was, on average, significantly higher in DTFF sites than in DBF sites, with levels approximately twice as high and reaching their highest emissions in spruce- and birch-dominated stands. The soil of the DBF site was a net CH4 source, while the DTFF sites were net CH4 sinks. Rhet and CH4 fluxes were primarily influenced by water table depth and soil temperature, with the highest fluxes observed during the peak of snow-free seasons. Carbon accumulation in aboveground vegetation (trees and understory) and inputs through litter were highest in spruce- and pine-dominated DTFF sites and lowest in the DBF site. Carbon losses as DOC in water were highest in DTFF-spruce and DBF sites. Belowground biomass contributed to ecosystem productivity through C inputs from root exudates and production.

In this study, annual net ecosystem production (NEP) and soil carbon balance were estimated using the biometric method. Further investigations of soil C fluxes and their relationships with soil and environmental parameters will be investigated to identify variability across different ecosystem pools and determine the overall C sink or source strength of hemiboreal drained peatland forests.

How to cite: Kamil-Sardar, M., Ranniku, R., Truupõld, J., Ostonen, I., Rohula-Okunev, G., Uri, V., Aun, K., Mander, Ü., and Soosaar, K.: Carbon Balance in Drained Hemiboreal Peatland Forests , EGU General Assembly 2025, Vienna, Austria, 27 Apr–2 May 2025, EGU25-17220, https://doi.org/10.5194/egusphere-egu25-17220, 2025.

EGU25-17851 | ECS | Posters on site | BG3.23

Harnessing spontaneous colonization processes for raised-bog restoration: Case studies from the OptiMuM project 

Maria Kunle, Katharina Wieseler, Vytas Huth, Marvin Beckert, Gerald Jurasinski, Anke Günther, and Florian Jansen

Raised bogs in Northern Germany face severe threats from drainage and land use, with more than half having been converted to grasslands and contributing significantly to greenhouse gas emissions. Restoring these ecosystems is crucial for achieving climate goals, such as those set by the Paris Agreement. While bog restoration following peat extraction is well-studied, efforts to restore nutrient-enriched agricultural areas into low-maintenance, self-regulating bog ecosystems are still in their infancy.

As a first step in raised bog restoration projects, topsoil is removed to prepare water-retaining polders. Due to previous agricultural use that did not involve peat extraction, substantial layers of weakly decomposed peat often remain intact. Their water-holding capacity can effectively buffer water table fluctuations, favoring peat moss (Sphagnum) establishment after rewetting. Meanwhile, nutrient legacies from agricultural use and competition from grassland and herb species may prevent the rapid re-establishment of peat mosses.

We found that when restoration areas are located near peat moss refugia, rapid and spontaneous colonization of polders with Sphagna can occur within two years of restoration, while other polders remain free of Sphagnum. This variability presents both opportunities, such as allowing rapid natural and low-effort restoration, and challenges, particularly in planning additional restoration measures (e.g. active introduction of bog species) to account for less favorable initial conditions within a site. In the OptiMuM project, we aim to understand these initial conditions better and focus on developing the best approaches for restoring raised bog habitats on former drained bog grasslands. We investigated the site-specific biotic and abiotic factors that influence spontaneous Sphagnum propagation in former grasslands and aim to identify optimal conditions for moss establishment. Additionally, we examine the emerging composition of Sphagna, their ecological value for raised-bog restoration, and the long-term benefits of these emerging ecosystems.

How to cite: Kunle, M., Wieseler, K., Huth, V., Beckert, M., Jurasinski, G., Günther, A., and Jansen, F.: Harnessing spontaneous colonization processes for raised-bog restoration: Case studies from the OptiMuM project, EGU General Assembly 2025, Vienna, Austria, 27 Apr–2 May 2025, EGU25-17851, https://doi.org/10.5194/egusphere-egu25-17851, 2025.

EGU25-18256 | ECS | Posters on site | BG3.23

Balancing Emissions, Productivity and Soil Health: Rewetting and Soil Amendments in a Cultivated Lowland Peatland in NW England 

Luke Andrews, Maria Nolan, Ross Morrison, Chris Bell, Chris Evans, Elya Monsen-Elvik, Terhi Riutta, and Stephanie Evers

In the UK, ~420,000 hectares of agricultural land is situated upon lowland peat, representing around 2.5 % of the total agricultural land area. These sites disproportionately contribute towards greenhouse gas emissions, accounting for ~3% of the UK’s annual reported CO₂-equivalent emissions. These emissions, in addition to rapid soil erosion in some lowland peatlands, highlight the need to implement sustainable land management practices that promote soil stability, enhance carbon retention, and reduce greenhouse gas emissions whilst supporting agricultural productivity in agriculturally managed lowland peatland. Few studies have explored the trade-offs between the environmental benefits of sustainable land practices and their potential effects upon farm businesses, and few studies have explored how such practices influence the biogeochemical processes driving greenhouse gas emissions, nutrient cycling, and soil carbon stability in these systems. To address these uncertainties, we are conducting a field-scale study at a farm in Tarleton, UK, formed of two adjacent fields: one managed under a ‘business-as-usual’ regime and the other undergoing rewetting. Here, we present an overview of our study and some preliminary results. Within each field, we will test the viability of various commercially available soil amendments within experimental plots. Over two growing seasons, we will monitor greenhouse gas fluxes (CO₂, CH₄, N₂O), soil and pore-water biogeochemistry and crop yields across the treatment plots. This will allow us to compare the environmental and economic outcomes of each treatment and to identify the biogeochemical processes underlying any observed changes. Our findings will inform UK land-use policy, offering evidence-based recommendations for reducing emissions from agricultural lowland peat whilst upholding soil integrity and food security. Our findings will also enhance our understanding of how different management changes affect biogeochemical processes within peatland soils. This study forms part of the Lowland Peat 3 Project, which will assess the environmental, economic, and social trade-offs of agricultural practices on lowland peatlands across the UK.

How to cite: Andrews, L., Nolan, M., Morrison, R., Bell, C., Evans, C., Monsen-Elvik, E., Riutta, T., and Evers, S.: Balancing Emissions, Productivity and Soil Health: Rewetting and Soil Amendments in a Cultivated Lowland Peatland in NW England, EGU General Assembly 2025, Vienna, Austria, 27 Apr–2 May 2025, EGU25-18256, https://doi.org/10.5194/egusphere-egu25-18256, 2025.

EGU25-18465 | ECS | Orals | BG3.23

Food on Peat: The impact of wetter farming practices on greenhouse gas emissions from food crops on agricultural lowland peat bogs in the Northwest of England. 

Maria Nolan, Mike Longden, Ryan Hoskins, Luke Andrews, Andrew Adams, Sophie Checkland, and Stephanie Evers

Up to 40% of U.K. grown vegetables are produced on lowland peat. This land use type is the highest emitter of carbon per unit area in the U.K., with drained agriculture on peatlands representing 3% of reported national greenhouse gas (GHG) emissions. This land use type impacts many other ecosystems service including the loss of topsoil and compaction, increased flood risk and biodiversity. However, total agricultural production from lowland peat equates to £1.23 billion in U.K. revenue providing income to farmers and jobs in the local area. Paludiculture and wetter farming are increasingly being considered as more sustainable alternatives to conventional farming to enable the continued productive use of peatlands whilst mitigating the impacts of peatland cultivation. Whilst there are several trials considering various paludiculture crops, there is a gap in the research which focuses on food crops in the U.K. We present the preliminary findings of a three-year wetter farming experiment focused on food crops in which carbon dioxide (CO2) and methane (CH4) emissions were measured from three agricultural lowland peat bog (ALPB) sites in the Northwest of England. The wetter farming experimental site in Greater Manchester was rewetted in March 2022. Celery (2022, 2023 and 2024) and lettuce (2024) crops were grown at a higher water table with annual averages of between 30.5 cm and 38.8 cm below the soil surface. The other two sites represented business as usual (BaU) drainage agriculture on ALPB with annual average water table depths between 69.1 cm and 96.2 cm below the soil surface. Both BaU sites are situated in Lancashire; one is a vegetable farm at which celery (2022, 2023 and 2024) and lettuce (2024) crops were monitored, the other farm is cereal farm where wheat fields were monitored (2022 and 2023). CO2 and CH4 emissions factors for the cultivation of these crops at various water table depths will be presented. In addition, we will discuss the impacts of specific farming activities (ploughing/cultivation, planting, fertilizer application and harvest) on CO2 and CH4 emission at all three sites. These emissions will be linked to both soil chemistry and physical attributes.

How to cite: Nolan, M., Longden, M., Hoskins, R., Andrews, L., Adams, A., Checkland, S., and Evers, S.: Food on Peat: The impact of wetter farming practices on greenhouse gas emissions from food crops on agricultural lowland peat bogs in the Northwest of England., EGU General Assembly 2025, Vienna, Austria, 27 Apr–2 May 2025, EGU25-18465, https://doi.org/10.5194/egusphere-egu25-18465, 2025.

EGU25-18864 | Orals | BG3.23

Understanding Carbon Emissions in a Drained Peatland Undergoing Restoration: Insights from Chamber-Based Measurements 

Owen Naughton, Md Shamsuzzaman, Shane Regan, Mark O'Connor, Imelda Casey, and Ultan McCarthy

Peatlands are the largest terrestrial carbon stores on earth and play a significant role in the global carbon cycle. They become major sources of carbon when drained and degraded through unsustainable management like peat extraction, drainage, and conversion to agriculture and forestry. Restoration through rewetting—such as ditch blocking and bund construction—has been identified as one of the most efficient methods to accelerate biodiversity recovery while lowering carbon emissions and increasing carbon uptake. Since 2021, restoration efforts constructing contoured peat embankments (bunds) have been underway at a raised bog previously drained for horticulture extraction in Ireland. We investigated the net ecosystem exchange (NEE) and methane (CH4) emissions using an Eddy Covariance (EC) system to assess the impacts of restoration on carbon dynamics, with results over a four-year period  indicating the site is still emitting carbon after restoration efforts. However, the restored bog comprises a mosaic of land cover types including bare and vegetated peat, open water and bunds and the spatial variation in soil respiration (Rs) across the site remained unknown. To address this, a chamber-based spatial Rs measurement campaign was carried out over a 10-month period. Unmanned Aerial Vehicle (UAV) surveys were also carried out to quantify land cover at the site. Initial findings revealed that the mean CO2 efflux from bare peat and bund were 33.45 ± 2.73 (±SEM), and 60.43 ± 5.61 µmol CO₂ m² h⁻¹, respectively, 1-2 years post-restoration work. The study investigated the relationship of Rs with the explanatory factors such as soil temperature (Ts), soil moisture (Ms), and water-table height (Wt). The correlation analysis showed that in the bund areas, Ts exhibited a positive moderate influence on the Rs, while Wt significantly influence Rs in the bare peat areas. This chamber measurements approach spatially will help us to gain the deeper understanding of carbon dynamics in the restored peatland. It will allow us to capture the variations in carbon flux across the site’s various microtopographic features, which provide valuable insights for refining peatland restoration strategies and design methods to mitigate climate change mitigation effectively.

How to cite: Naughton, O., Shamsuzzaman, M., Regan, S., O'Connor, M., Casey, I., and McCarthy, U.: Understanding Carbon Emissions in a Drained Peatland Undergoing Restoration: Insights from Chamber-Based Measurements, EGU General Assembly 2025, Vienna, Austria, 27 Apr–2 May 2025, EGU25-18864, https://doi.org/10.5194/egusphere-egu25-18864, 2025.

EGU25-18895 | ECS | Posters on site | BG3.23

The influence of paludiculture intensity on peat microbial community composition and resulting greenhouse gas emissions from fen peatlands  

Kyle Boodoo, Willem-Jan Emsens, Erik Verbruggen, and Stephan Glatzel

Microbial communities play a critical role in peatland ecosystems, and in determining whether they act as net sinks or sources of greenhouse gas (GHG) emissions to the atmosphere. Furthermore, microbial community composition responds to changes in water table and physicochemical conditions, which are also determinants of GHG emissions from peatlands. Land management practices can significantly impact the water table and soil physicochemical conditions, influencing soil microbial community composition and activity, and site specific GHG emissions. Our study aimed to elucidate the role of paludiculture (peat conserving land use) intensity and nitrogen concentration on microbial community composition and function, and in turn, the potential role of changing microbial communities on seasonal GHG emission dynamics. We investigated GHG emissions, as well as a range of site physicochemical parameters, from 14 different EU fen peatlands, located in Germany (6), Netherlands (4) and Poland (4), on a monthly basis over the course of two years. Additionally, seasonal peat samples over two depths (living surface or 0cm, and at ~ 15cm depth below surface) were analysed for microbial community composition and function. Sample sites were separated into two different categories: Typha sp. dominated sites (7 sites, assumed to be highly nitrogen contaminated) and Carex sp. dominated (7 sites, assumed to be moderately Nitrogen contaminated) sites, with each further separated into three different paludiculture intensities: Wet wilderness (6 sites), Low intensity Paludiculture (6 sites) and High intensity paludiculture (2 sites). Initial results suggest a close relationship between microbial community composition and the sample country, as well as hydrological and nutrient status of the site, with a potentially significant relationship between microbial community composition, their main functions, and specific GHG emissions. The findings of our study would help to better understand how different paludiculture practices may impact microbial communities and influence GHG emissions from differently managed paludiculture sites.

How to cite: Boodoo, K., Emsens, W.-J., Verbruggen, E., and Glatzel, S.: The influence of paludiculture intensity on peat microbial community composition and resulting greenhouse gas emissions from fen peatlands , EGU General Assembly 2025, Vienna, Austria, 27 Apr–2 May 2025, EGU25-18895, https://doi.org/10.5194/egusphere-egu25-18895, 2025.

EGU25-18923 | ECS | Orals | BG3.23

Legacy of peatland erosion continues to shape microbial communities during recovery.  

Fin Ring-Hrubesh, Anne Eberle, Angela Gallego-Sala, Bradley Welch, Rich Pancost, Robert Griffiths, and Casey Bryce

Peatland de-vegetation and surface erosion are common facets of peatland degradation in the uplands. These processes impact peatland function by limiting plant-derived carbon input, exposing previously deep peat to near-surface conditions, and disrupting peatland hydrology. Restoration of eroded peatlands typically aims both to re-establish vegetation cover and raise water tables. Here we present the impacts of physico-chemical alterations resulting from severe erosion and subsequent peatland recovery on microbial communities in a temperate upland bog.  Due to the central role of microbes in peatland organic matter decomposition, understanding their response to restoration measures is key to determining the success of these interventions. 

We determine key physico-chemical variables which control the composition of microbial communities and shape their function. By coupling detailed characterisation of geochemistry and the microbiome, the consequences of microbial community shifts for the peatland carbon store are considered. In upland ombrotrophic peat, where recovery has proceeded on formerly eroded surfaces, organic matter quality as investigated by pyrolysis-GCMS is presented and is determined to be a stronger predictor of community composition than water table position. Using amplicon sequencing we identify distinct microbial communities under degraded and re-vegetated surfaces, with significant depth relationships only present in peat which was actively accumulating. Re-vegetated areas support higher microbial biomass, with elevated dissolved organic carbon and CO2 concentrations evidencing altered carbon cycling following recovery. Functional profiling with shotgun metagenomics further reveals contrasting life-strategies which reflect the availability of organic substrates. Whilst water table position is often the primary control on peatland microbial function, we found this relationship to be obscured by the stronger role of organic substrate limitation in this eroded context. We discuss the consequences for restoration of eroded temperate peatlands where deep peat has been exposed.  

How to cite: Ring-Hrubesh, F., Eberle, A., Gallego-Sala, A., Welch, B., Pancost, R., Griffiths, R., and Bryce, C.: Legacy of peatland erosion continues to shape microbial communities during recovery. , EGU General Assembly 2025, Vienna, Austria, 27 Apr–2 May 2025, EGU25-18923, https://doi.org/10.5194/egusphere-egu25-18923, 2025.

EGU25-19601 | Orals | BG3.23

Setting and reaching restoration targets for GHG exchange, ecosystem services and biodiversity of peatlands require a landscape ecological approach 

Gert-Jan van Duinen, Remco Versluijs, Dion van Staveren, Bjorn Robroek, and Christian Fritz

Setting realistic targets for peatland restoration in specific areas, requires understanding of the key processes and functional relations in that specific type of peatland. Proper understanding of key processes and feed-back mechanisms, the landscape ecological setting and the limits to ecosystem restoration due to degradation, former and current land use and climate change are crucial in the process of drafting effective restoration strategies for peatlands.
For several examples of European fens and bogs, in a different state of degradation, we present landscape ecological analyses of the system, using geological and hydrological information, peat stratigraphy and former use of the peatland, as well as the actual conditions of the soil and peat layer, vegetation, microbiota and (in)vertebrate fauna. In this framework, we show how GHG exchange and recovery of the vegetation and biodiversity, including key species, is determined by key processes and conditions on different spatial and temporal scales. From this perspective, opportunities and requirements are considered for buffer zones between nature reserves and agricultural or urban environments, as well as the perspectives that paludiculture offers for recovery on a landscape scale. Given the acquired understanding of the actual and potential situation of the different peatland ecosystems, specific restoration goals are set and restoration strategies are developed accordingly.

How to cite: van Duinen, G.-J., Versluijs, R., van Staveren, D., Robroek, B., and Fritz, C.: Setting and reaching restoration targets for GHG exchange, ecosystem services and biodiversity of peatlands require a landscape ecological approach, EGU General Assembly 2025, Vienna, Austria, 27 Apr–2 May 2025, EGU25-19601, https://doi.org/10.5194/egusphere-egu25-19601, 2025.

The majority of NW European peatlands are degraded due to management associated with conventional livestock farming (i.e. increased drainage, high nutrient inputs and frequent mowing). This leads to increased CO2 emissions, eutrophication, land subsidence, and biodiversity loss. Creating regenerative ditch borders along the drainage ditches that surround agricultural fields could locally ameliorate some of these negative effects. We investigated the impacts of implementing regenerative ditch borders on carabid beetle and plant diversity, soil characteristics, litter decomposition (Tea Bag Index (TBI) and leaf and root litter bags), and CO2 emissions in a Dutch fen agroecosystem throughout one year. On average we found lower numbers of carabid beetles in regenerative ditch borders, but a higher presence of specialist species. Species diversity remained unaffected by ditch border type. Plant diversity was higher in regenerative ditch borders. We also measured a clear shift in the dominant plant species between ditch border types, shifting from Lolium perenne in conventional borders to Phragmites australis in regenerative borders. Regenerative ditch borders were associated with higher values of soil moisture, soil organic matter content and carbon-to-nitrogen ratio and lower bulk density and soil compaction in comparison to conventional borders. The decomposition rate of standardized litter (TBI) was unaffected by ditch border type, but local leaf litter collected from regenerative borders (P. australis leaves) decomposed 75% slower than leaf litter from conventional borders (L. perenne leaves). Thus, litter decomposition between ditch border management types was driven by lower litter quality of aboveground litter produced at regenerative borders, and not by changes in soil characteristics (e.g. higher moisture levels). Nevertheless, projections from a locally-calibrated soil respiration model estimates that soil moisture effects significantly reduced CO2 emissions from regenerative borders compared to conventionally managed sites. Changes in vegetation composition and microenvironmental conditions resulting from regenerative management can therefore be expected to increase carbon storage and reduced peat respiration rates in ditch borders. This study highlights the importance of combining vegetation shifts with emission mitigation measures from peat agroecosystems and identifies possible trade-offs between biodiversity conservation and ecosystem services.

How to cite: Bethe, S., Berg, M., Hefting, M., and Weedon, J.: Biodiversity, decomposition, and CO2 emissions effects after the implementation of regenerative ditch borders in a Dutch peat agroecosystem, EGU General Assembly 2025, Vienna, Austria, 27 Apr–2 May 2025, EGU25-19664, https://doi.org/10.5194/egusphere-egu25-19664, 2025.

EGU25-20039 | ECS | Posters on site | BG3.23

Restoring metal contaminated peatlands in Sudbury, Ontario 

Ellie Goud, Colin McCarter, Pete Whittington, Nate Basiliko, Peter Beckett, Florin Pendea, and John Gunn

Industrial contamination has profoundly impacted peatland ecosystems, degrading their biodiversity and essential functions such as carbon sequestration. The Sudbury region in Ontario, Canada is one of the world's largest metal mining centres and historically the largest global point source of sulfur and metal pollution and serves as a critical case study for understanding and addressing these impacts. Peatlands closest to pollution sources have suffered extensive degradation, with keystone vegetation, including Sphagnum mosses, locally extinct and peat layers showing significant carbon losses. Developing innovative restoration techniques is crucial before undertaking regional-scale restoration of metal-impacted peatlands, ensuring chemical stressors are overcome effectively while minimizing sequestered metal release. In collaboration with regional stakeholders and academic institutions, our interdisciplinary team is pioneering innovative restoration techniques to reinstate peatland functionality in this toxic metal and metalloid-polluted landscape. Building on established practices, such as the moss-layer transfer technique, our modified approaches incorporate surface tilling, mulching, fertilization, and the reintroduction of donor peatland material. These interventions aim to overcome chemical stressors like persistent high concentrations of water-extractable metals (e.g., copper and nickel), which inhibit Sphagnum recovery. A restoration field trial began in fall 2023 with surface mulching, and in spring 2024 we applied restoration treatments of mulch, fertilizer, and planting. Here, we present results from the first growing season for peat chemistry, hydrology, greenhouse gas fluxes, and vegetation.

How to cite: Goud, E., McCarter, C., Whittington, P., Basiliko, N., Beckett, P., Pendea, F., and Gunn, J.: Restoring metal contaminated peatlands in Sudbury, Ontario, EGU General Assembly 2025, Vienna, Austria, 27 Apr–2 May 2025, EGU25-20039, https://doi.org/10.5194/egusphere-egu25-20039, 2025.

EGU25-20075 | Orals | BG3.23

Effects of alternative harvesting managements on spatio-temporal variability of soil CO2, CH4, and N2O fluxes in boreal drained forested peatland 

Boris Tupek, Aleksi Lehtonen, Jani Anttila, Qian Li, Eduardo Martinez Garcia, Tijana Martinovic, Petr Baldrian, and Raisa Mäkipää

This study evaluates the impact of different forest management practices on soil greenhouse gas (GHG) fluxes in the Ränskälänkorpi boreal drained forested peatland, in Southern Finland. The study site is part of the HoliSoils project (Holistic management practices, modelling, and monitoring for European forest soils; https://holisoils.eu/). The study is designed for a comparative analysis of non-harvested control, traditional clear-cut harvesting, and harvesting by continuous cover forestry (57% of basal area removed), carried out in spring 2021. The aim is to quantify mean differences in soil CO2, CH4, and N2O emissions and improve the annual budget estimates.

Measurements of soil CO2, CH4, and N2O fluxes, soil temperature, moisture, water table depth, and air temperature were conducted post-harvest every two weeks during the growing season (May to November). Soil chemistry, understory vegetation, and microbial populations were also surveyed and evaluated for relations to observed spatial patterns of the GHG fluxes. Machine learning and Bayesian data assimilation techniques were employed (i) to identify relationships between GHG fluxes and environmental variables, and (ii) to model spatio-temporal dynamics.

Clear-cutting (CUT) resulted in an immediate and sustained rise in the water table, with mean levels significantly higher than the control (CTR) and selection harvesting (COV) sites. In all CUT, COV, and CTR sites differences in mean values of soil CO2, CH4, and N2O fluxes were significant.

Our findings underscore the significance of spatio-temporal variability in GHG fluxes across different management practices, highlight the management role in variation of dynamic environmental controls on CO2, CH4, and N2O fluxes, and reduce the knowledge gap on the effects of harvesting methods on GHG fluxes in boreal drained forested peatlands.

How to cite: Tupek, B., Lehtonen, A., Anttila, J., Li, Q., Martinez Garcia, E., Martinovic, T., Baldrian, P., and Mäkipää, R.: Effects of alternative harvesting managements on spatio-temporal variability of soil CO2, CH4, and N2O fluxes in boreal drained forested peatland, EGU General Assembly 2025, Vienna, Austria, 27 Apr–2 May 2025, EGU25-20075, https://doi.org/10.5194/egusphere-egu25-20075, 2025.

EGU25-20993 | Orals | BG3.23

14C dating of peat surface - emitted dissolved fluvial CO2 carbon to support management and decision-making for UK Lowland peatlands 

Mike Longden, Maria Nolan, Mark Garnett, Sue Page, and Stephanie Evers

Measurable restoration targets, and indicators of success for restoration are critically required for restoration programmes to successfully measure and appraisal of interventions. 

Traditionally this has been done by a combination of hydrology monitoring, vegetation surveys and GHG emissions monitoring. These methods can be both costly in terms of time and money and are not always included as part of traditional UK-based conservation and restoration funding criteria written by the funding providers, such as landfill tax and government funding.

They also require trained practitioners or partnership working (e.g. with academia or specialist consultancies) to do effectively, especially at the scale needed to meet the target of 282 thousand Ha of peat being actively under restoration by 2050, as set by the British government as part of the Peat Action Plan (PAP) in 2021. 

One of the major challenges of assessing restoration efficacy is the lengthy period needed to reach any restoration targets and the therefore associated long-term monitoring needed to measure this. The processes at work can take decades to reach completion, resulting in costly and far-sighted monitoring programmes.  

This research aims to develop a tracer for peatland status based on elucidating the extent to which old C stored within degraded and rehabilitated peatland sites is being emitted. It will do this by delineating the relationships between the age of respired soil carbon (C) being lost from peatlands and current, historical, and restorative land management of sites. 

This research applied highly novel application of 14CO2 and dissolved 14CO2 (D14CO2) Carbon dating of the soil and fluvial emissions across the time chrono-sequence of a lowland-raised bog restoration programme and combine with data on CO2 soil emissions (NER) and primary productivity data (GPP) to aid in the characterisation of emissions for each site. This approach aims to provide an insight into the stability of the peat horizon, the role of modern and older carbon mobility plays across restoration strategies and the estimated depth at which emissions originate. Emissions were captured using molecular sieves connected from closed chambers, with flux passively sampled over a 1-month period. This was combined with fluvial D14CO2 samplers deployed in parallel in adjacent ditches to compare the difference in ages between soil respiration and fluvial emissions.

 This simple tracer could revolutionise peatland conservation science through providing an accessible, quantitative approach to assessing the extent to which C lost is either dominated by modern C gained from recent plant grown or C respiration of older, deeper organic matter stores (representing a net loss of stored C to the atmosphere). As reinstatement of stable, long-term C storage is one of the key aims of conservation bodies, government, and landowners, assessing this directly would seem an obvious and important measure especially with funding shortfalls identified leading to a more blended funding approach to peatland restoration. 

How to cite: Longden, M., Nolan, M., Garnett, M., Page, S., and Evers, S.: 14C dating of peat surface - emitted dissolved fluvial CO2 carbon to support management and decision-making for UK Lowland peatlands, EGU General Assembly 2025, Vienna, Austria, 27 Apr–2 May 2025, EGU25-20993, https://doi.org/10.5194/egusphere-egu25-20993, 2025.

EGU25-613 | ECS | Orals | BG3.26

The Fen that Vanished: The Untold Story of Drainage and Peat Extraction in Bagno Chlebowo Peatland - Implications for Nature Conservation 

Daria Wochal, Katarzyna Marcisz, Jan Barabach, Mariusz Bąk, and Mariusz Lamentowicz

Peatlands are among the most rapidly disappearing ecosystems worldwide, particularly over the past two centuries as an effect of intensifying human activities. Peatlands have often been drained to facilitate agriculture, forestry, and peat extraction. One of the most heavily degraded peatlands in western Poland is the Bagno Chlebowo peatland, only a small portion of which holds legal protection as a raised bog. Despite its designation as a protected area since 1959, drainage and peat extraction—ongoing since the 19th century—continue to undermine the ecological integrity of the site. This study aims to reconstruct the effects of human activity on the peatland's condition over the past 600 years. Using palaeoecological methods, we traced historical changes in water table levels, trophic conditions (pH), and local plant communities. Historical maps were also analyzed to document changes in land use and land cover. Our results highlight that drainage and peat mining have significantly altered the peatland's pH, favouring the proliferation of Sphagnum. These shifts in vegetation and increased acidity complicate the classification of the peatland, raising doubts about its current designation as a raised bog. Instead, the palaeoecological evidence suggests that the site functioned as a fen for much of its history. This research underscores the importance of long-term reconstructions in peatland conservation efforts to (1) accurately assess ecosystem status, (2) identify historical baselines, and (3) design appropriate restoration and management strategies for highly disturbed sites.

The study was supported by National Science Centre, Poland (grants 2020/39/D/ST10/00641, 2023/07/X/ST10/00536) and Research University-Excellence Initiative AMU (grant 034/34/UAM/0027).

How to cite: Wochal, D., Marcisz, K., Barabach, J., Bąk, M., and Lamentowicz, M.: The Fen that Vanished: The Untold Story of Drainage and Peat Extraction in Bagno Chlebowo Peatland - Implications for Nature Conservation, EGU General Assembly 2025, Vienna, Austria, 27 Apr–2 May 2025, EGU25-613, https://doi.org/10.5194/egusphere-egu25-613, 2025.

EGU25-985 | ECS | Posters on site | BG3.26

20th-century ecological disasters led to peatland critical transitions in central European pine monoculture forest 

Mariusz Bąk, Mariusz Lamentowicz, Piotr Kołaczek, Daria Wochal, Michał Jakubowicz, and Katarzyna Marcisz

The frequency of extreme events worldwide is steadily increasing. Therefore, it is crucial to recognise the accompanying response of different ecosystems. Monoculture forests with simplified ecosystem linkages are particularly vulnerable to catastrophic events. Fires or infestations threaten forests and other associated ecosystems, including peatlands, which are extremely important in regulating the global carbon cycle and thus mitigating the effects of a warming climate. Peatlands, due to their acidic and anaerobic conditions, are a good source of valuable information about past ecological disasters. Here, we examine how a peatland located in one of Poland's largest forest monoculture complexes responded to some of the largest environmental disasters in Central Europe in the 20th century – the 1922–1924 insect infestation and the 1992 fire. We analyse a peat core from Miały peatland surrounded by a Scots pine (Pinus sylvestris) plantation – the Noteć Forest (NE Poland). Our reconstruction is based on high-resolution multiproxy palaeoecological analyses, including pollen, plant macrofossils, charcoal and testate amoebae supported by neodymium isotopes as a disturbance proxy.

We show several critical transitions in the peatland associated with the extreme events manifested by a change in the hydrological and trophic conditions in the peatland. We highlight the interpretative value of fungi, often disregarded in paleo-records, as bioindicators of rapid environmental changes. We also emphasize the importance of the historical background to understanding subsequent environmental changes. The study results are essential for forest ecology and forest management in the temperate climate of Central and Eastern Europe. Furthermore, we want to underline the significance and importance of wetlands ecosystem services for forest ecosystems and sustainable forestry.

The study is financed by the National Science Centre, Poland, grant no. 2020/39/D/ST10/00641.

How to cite: Bąk, M., Lamentowicz, M., Kołaczek, P., Wochal, D., Jakubowicz, M., and Marcisz, K.: 20th-century ecological disasters led to peatland critical transitions in central European pine monoculture forest, EGU General Assembly 2025, Vienna, Austria, 27 Apr–2 May 2025, EGU25-985, https://doi.org/10.5194/egusphere-egu25-985, 2025.

EGU25-1088 | ECS | Posters on site | BG3.26

Late Holocene paleoclimate in the central Andes of Peru based on peatland record 

Yizet Eufemia Huaman Navarro, Bruno Turcq, and Patricia Turcq

The high central Andes have experienced significant hydroclimatic changes in recent decades, impacting ecosystems through glacier retreat, temperature variations, and altered precipitation seasonality. Andean peatlands are crucial to water and biogeochemical cycles and are sensitive to climate change. To infer past climatic and environmental conditions, we analyzed X-ray fluorescence (XRF) core scanning data, principal component analysis (PCA) with clr-transformation, and total organic carbon (TOC) on the APA01 peat core (basal age ~2500 years). PCA-clr explained 88.8% of variance, revealing interactions between organic matter (OM) content, accumulation dynamics, and climatic influences. The correlation between Log [S/Ti] and PC1-clr highlighted the interplay of OM concentration and erosion intensity. Environmental proxies such as Ln [Si/S] and Ln [Zr/Ti] ratios provided insights into accumulation processes and climatic impacts. Analysis of carbon accumulation rates (CAR) and mineral accumulation rates (MAR) from 507 BCE to 1565 CE indicated distinct phases of organic and mineral accumulation, reflecting climatic changes.

Comparative analysis with regional climate records (Quelccaya and Illimani ice cores, Pumacocha Lake sediments) during the Medieval Climate Anomaly (MCA) and Little Ice Age (LIA) demonstrated broader climatic influences on peatland dynamics. Decreased OM accumulation during the MCA was linked to drier conditions, while increased accumulation during the LIA corresponded to wetter climates. Warming phases such as the MCA, post-LIA, and recent decades showed high clastic mineral input without necessarily wetter conditions, likely due to glacier and permafrost melting and increased snow-to-rain proportion. Our data indicate a decline in peatland growth and OM accumulation since 2010, emphasizing the need for careful monitoring and future restoration efforts.

How to cite: Huaman Navarro, Y. E., Turcq, B., and Turcq, P.: Late Holocene paleoclimate in the central Andes of Peru based on peatland record, EGU General Assembly 2025, Vienna, Austria, 27 Apr–2 May 2025, EGU25-1088, https://doi.org/10.5194/egusphere-egu25-1088, 2025.

The Great Fen (GF) is one of the largest peatland areas in the UK and is home to some of the region’s rarest wildlife. However, approximately 99% of the peatland has been drained for peat farming over recent centuries. The amount of carbon stored in the fen and the influence of human activity on its development remain poorly understood. The Wildlife Trust for Bedfordshire, Cambridgeshire, and Northamptonshire (WT-BCN) is currently working to restore and transform the GF by creating wetland habitats that support biodiversity. In collaboration with the WT-BCN, this study applies multi-proxy palaeoecological evidence to investigate long-term changes in vegetation, peat carbon, fire history, and land use in recently acquired drained and farmed fenland sites, as well as links between these ecological facets to inform ongoing restoration efforts in the area.

How to cite: Adeleye, M.: Understanding long-term spatio-temporal ecological changes in degraded peatlands to inform restoration in The Great Fen, East Anglia, EGU General Assembly 2025, Vienna, Austria, 27 Apr–2 May 2025, EGU25-1351, https://doi.org/10.5194/egusphere-egu25-1351, 2025.

EGU25-2153 | Posters on site | BG3.26

The Peat Emit Project: Providing Enhanced Support to Countries in Efforts to Assess and Report Peatland GHG Emissions 

Susan Page, Ben Freeman, Jonay Jovani Sancho, Chris Evans, Matthew Warren, and Maria Nuutinen

The IPCC Wetlands Supplement (2014) incorporates the only internationally agreed global guidelines to report on greenhouse gas emissions from and removals by peatlands. It has been 10 years since its publication and the Wetlands Supplement no longer reflects the latest data or approaches adopted by countries for calculating emissions, presenting a constraint on their efforts to measure and report emissions from the land use sector. The Peat Emit project (part of the Aim4Forests programme managed by FAO) has collected, assessed and updated greenhouse gas emission factors for peatlands in low- and middle-income countries. Specifically, compared to the Wetlands Supplement, it has (i) developed more accurate emission factor estimates for a wider range of land-management options and land use/cover categories than reported in the Wetlands Supplement; (ii) refined approaches to greenhouse gas emissions reporting; and (iii) produced robust criteria for evaluation of data quality.  This poster outlines our approach with examples of updated emission factors for a range of land use/cover categories.

How to cite: Page, S., Freeman, B., Jovani Sancho, J., Evans, C., Warren, M., and Nuutinen, M.: The Peat Emit Project: Providing Enhanced Support to Countries in Efforts to Assess and Report Peatland GHG Emissions, EGU General Assembly 2025, Vienna, Austria, 27 Apr–2 May 2025, EGU25-2153, https://doi.org/10.5194/egusphere-egu25-2153, 2025.

EGU25-3089 | ECS | Orals | BG3.26

Potential hidden impact of sea level rise on Indonesian coastal peatland 

Anggi Hapsari and Tim Jennerjahn

Inescapable and swift, climate-change-induced sea level rise (SLR) poses risks to low-lying tropical coastal ecosystems globally. At present, research still heavily focusses on the saline-side of the coasts, such as mangrove forests, seagrass beds and saltmarshes. Meanwhile, potential dire impacts of SLR to similarly valuable freshwater carbon-dense coastal ecosystems, like the Indonesian coastal peatlands, are less well known and severely understudied. Coastal peatlands in Indonesia are freshwater forested wetlands that play an important role in tackling the triple planetary crisis: climate change, biodiversity loss and pollution. Mainly located in low-lying coastal plains, these ecosystems are highly vulnerable to the impacts of SLR.

Due to the slow nature of SLR, its impacts on coastal ecosystems can be assessed only through long-term or historical records. Sea level changes in the Holocene are extensively studied and widely used as analogue for future SLR. Especially in western Indonesia, where large areas of coastal peatlands are located, the sea level was five meters above the present level in the mid-Holocene. Palaeoecological records obtained from coastal peatlands that cover SLR changes throughout the Holocene therefore provide an opportunity to assess their ecosystem response to SLR. However, as most coastal peatlands in Indonesia formed after sea level stabilization in the late Holocene, documentation of an SLR impact on “fully established” coastal peatlands is almost nonexistent. For that, we conducted a long-term ecological study on a coastal peatland in southern Borneo known to form around 17,000 years Before Present (yr BP), which thus likely experienced the Holocene-SLR.

The results show evidence of large fire occurrences in the mid-Holocene (9,000 to 4,000 yr BP), when sea level was higher than the present level and El Niño Southern Oscillation (ENSO) was moderately active. ENSO is known to cause severe drought leading to peat swamp forest mortality and higher frequency of natural combustion source (lightning). However, the mid-Holocene fires were much larger or more severe than during the past 3,000 years, when ENSO was more frequent and stronger. It is possible that the impact of ENSO-related drought in the mid-Holocene was exacerbated by SLR. SLR-induced peatland salinization, as evident by mangrove encroachment into the study area, likely resulted in widespread peat swamp forest mortality, thus promoted high fuel availability during that period. This study warns that future SLR, in combination with projected stronger ENSO, could exacerbate the impact of current large-scale peatland degradation and drainage in Indonesia, and potentially lead to more devastating peat fire events, haze seasons and enormous carbon release.

How to cite: Hapsari, A. and Jennerjahn, T.: Potential hidden impact of sea level rise on Indonesian coastal peatland, EGU General Assembly 2025, Vienna, Austria, 27 Apr–2 May 2025, EGU25-3089, https://doi.org/10.5194/egusphere-egu25-3089, 2025.

EGU25-3393 | Orals | BG3.26 | Highlight

Peat mounds of southwest Tasmania: palaeoecological insights into their origins, age and significance for biological conservation 

Simon Haberle, Feli Hopf, Tom Jamieson, and David Bowman

Peat mounds have been shown to play a critical role in climate regulation, biodiversity conservation, and water management in the Northern Hemisphere, though little is known about the role of similar features in the Southern Hemisphere. In Tasmania between 41o-43.5o south latitude, the growth of blanket bogs occurs as a result of a combination of cool, wet climate and fire, extending from sea-level up to the regional tree line at 700–900 m and covering some 10 000 km2 of hilly to mountainous terrain. These blanket bogs are among the most extensive in the southern hemisphere and are considered to be of major international conservation significance. A rare but significant feature of the blanket bog system is the appearance of circular peat mounds which rise up to 3m above the blanket peats and are confined to elevations within 100 m of sea level in flat valley floors of southwest Tasmania. These peat mounds are rare in the Australian landscape and are considered to play a significant role in the long-term sustainability of local endangered flora and fauna, particularly the Orange-bellied Parrot, of which there are less than 100 individuals remaining in the wild today relying on the food sources provided by vegetation growing on the peat mounds.

We describe the origin, age and palaeoecology of peat mounds on the Melaleuca Plains, adjacent to Bathurst Harbour, in the Tasmanian Wilderness World Heritage Area. Using pollen and charcoal analysis alongside radiocarbon dating of a set of cores taken from two peat mounds and one local lagoon, we reconstruct regional to local vegetation change and fire history to determine the extent and veracity of landscape degradation imposed by the removal of long-term Indigenous land management around 200 years ago after the onset of British colonisation. Our results map out the pace and nature of ecosystem change during the Holocene and show that recent increases in fire activity and ecosystem degradation poses serious environmental risks to the long-term survival of the Orange-bellied Parrot, and the peat mound landscape as a whole. A better understanding of decadal to centennial scale environmental dynamics of peat mounds has the potential to assist in preserving these critical ecosystems worldwide.

How to cite: Haberle, S., Hopf, F., Jamieson, T., and Bowman, D.: Peat mounds of southwest Tasmania: palaeoecological insights into their origins, age and significance for biological conservation, EGU General Assembly 2025, Vienna, Austria, 27 Apr–2 May 2025, EGU25-3393, https://doi.org/10.5194/egusphere-egu25-3393, 2025.

EGU25-3584 | Posters on site | BG3.26

Drastic Peatland Regime Shift and Landscape Disturbances Connected to Warm and Cold Climate Events Over the Past Centuries in Subarctic Finland   

Minna Väliranta, Sanna Piilo, Mari Kuoppamaa, Teemu Tahvanainen, Timo Kumpula, Niina Kuosmanen, and Marc Macias-Fauria

Palaeoecological studies reporting long-term development history of subarctic fens are scarce and overall permafrost-free peatlands located at the immediate vicinity of permafrost zone have deserved little attention in Fennoscandia. We use a multiproxy approach to study millennial-scale dynamics of two peatlands located in Finnish Lapland (Katsapuli and Maader). In addition to study autogenic succession and external forcing, we aimed in resolving the impact of surrounding landscape changes, potentially related to reindeer herding. The pollen data does not indicate major regional-scale vegetation changes but suggest an increase in the proportion of sedges towards modern times and decrease in tree pollen. These, together with an increase in regional fire events based on micro-charcoal and erosion rates measured as sediment mineral component coincide with both colder temperatures (Little Ice Age) and the emergence of reindeer-based pastoralism. The peat macrofossil data of the two profiles suggest a clear and relatively simultaneous local regime shift from sedge-dominated local habitat conditions to a Sphagnum community, where S. lindbergii becomes increasingly dominant towards the present day, suggesting prevalence of relatively moist conditions. In both sites, the regime shift is coeval with the onset of Medieval Climate Anomaly (MCA) climate conditions. Newly- established communities are sustained thereafter. Vegetation changes to Sphagnum mosses resulted in high peat growth rates, thus most of the peat stock is relatively new. Based on these data, we suggest that Sphagnum moss communities are resilient to climate fluctuations and might continue to act as effective carbon accumulation systems under warmer climates.

How to cite: Väliranta, M., Piilo, S., Kuoppamaa, M., Tahvanainen, T., Kumpula, T., Kuosmanen, N., and Macias-Fauria, M.: Drastic Peatland Regime Shift and Landscape Disturbances Connected to Warm and Cold Climate Events Over the Past Centuries in Subarctic Finland  , EGU General Assembly 2025, Vienna, Austria, 27 Apr–2 May 2025, EGU25-3584, https://doi.org/10.5194/egusphere-egu25-3584, 2025.

EGU25-3600 | ECS | Posters on site | BG3.26

Testate Amoeba Community dynamics in Forestry-Drained and Restored Peatlands 

Elmiina Pilkama, Sanna Piilo, Kari Minkkinen, Roosa Hautala, Miisa Pikkarainen, and Minna Väliranta

Peatlands are critically important ecosystems, yet they are facing significant risks due to anthropogenic pressures. In Europe, drying of pristine peat ecosystems during the recent decades have been observed due to both direct and indirect anthropogenic impacts. Historically, peatlands have also been extensively drained by human activity, but efforts to restore them to their natural state have recently increased. The combined effects of climate change and human activities are expected to influence the carbon dynamics of peatlands in the future. Changes in peatland microbial communities can be used to assess past changes of peatlands as well as the current soil health.

Microscopical testate amoebae play a crucial role in peatland carbon cycling as important members of microbial communities, acting as predators and decomposers. Testate amoebae are sensitive to changes in moisture conditions and, therefore, they have traditionally been used to model past moisture conditions in peatlands. However, the response of peatland microbial communities to restoration needs further investigation, as it is essential for improving our understanding of the underlying processes affecting carbon cycling in these ecosystems.

This study aims to examine changes in testate amoeba communities in forestry-drained peatlands in the boreal zone over time including time before, during, and after peatland drainage and restoration. The study seeks to expand the understanding of the community structure of testate amoebae in peatlands, particularly in forested peatlands/swamps, as there is a lack of research on testate amoeba community structure in these habitats.

In this study, testate amoeba analyses have been conducted on three peatlands located in southern Finland: one serves as a natural reference site, while the other two have been drained and subsequently restored. Preliminary results suggest that the structure of testate amoeba communities varies significantly across different peat layers in the reference site. In the drained and restored sites, testate amoeba communities in some peat cores indicate the presence of species typical of moister habitats at shallower peat depths (restored sections), whereas the signal in other cores remains more unclear.

How to cite: Pilkama, E., Piilo, S., Minkkinen, K., Hautala, R., Pikkarainen, M., and Väliranta, M.: Testate Amoeba Community dynamics in Forestry-Drained and Restored Peatlands, EGU General Assembly 2025, Vienna, Austria, 27 Apr–2 May 2025, EGU25-3600, https://doi.org/10.5194/egusphere-egu25-3600, 2025.

EGU25-4838 | ECS | Posters on site | BG3.26

Carbon measurement of peat soils: Significant differences between two grinding methods 

Cathal Ryan, Nannan Li, Clara De Castro Amaral Siqueira, Hilde Hoch, Michael Stock, Michelle Curran, Helen Shaw, and Lisa Orme

Peat soils are estimated to store over 500 Gt of carbon (Yu, 2012), and their ongoing sequestration plays a pivotal role in mitigating climate change. However, improved measurements of peat carbon content are necessary due to inherent differences between peat soil environments. Emphasis has been placed on accurately measuring carbon content in peat samples to understand carbon dynamics and estimate their stores. A protocol developed by Chambers et al., (2011) requires the mechanical grinding of peat samples before elemental analysis. Yet, there has been a lack of investigations into how different grinding methods may directly affect carbon measurements in peat soils.

Previous studies (Abulikemu, 2023; Markert, 1995; Pulleman et al., 2021; Siang, 2010) have investigated the influence of grinding on organic materials. Results indicate differences in the extent of carbon alteration and release depending on the grinding method employed. The shock and abrasive forces of ball mill grinding generate mechanochemical alterations in organic matter (Abulikemu, 2023), whilst pestle and mortar grinding relies on friction and pressure (Markert, 1995). Energy generated during ball mill grinding has been linked to higher oxidation and pyrolytic reactions (Abulikemu, 2023; Siang, 2010).

Given these findings, the choice of grinding method may artificially alter the carbon in peat soils, providing misleading measurements of carbon content and accumulation rates. This research examines the influence of two commonly utilised grinding methods, ball mill and pestle and mortar. Four peat samples were ground using both methods and measured using an elemental analyser. Seven subsamples from each ground sample were measured separately (Total = 56). The uppermost sample, from acrotelmic peat, showed no significant differences (p > 0.05), whereas the three lower, more decomposed, catotelmic peat, suggest high significance (p < 0.001). In all cases, pestle and mortar ground samples displayed higher carbon values than their ball mill counterparts.

These findings align with previous studies, suggesting that the choice of grinding method may influence the carbon content of organic material (Abulikemu, 2023; Pulleman et al., 2021; Siang, 2010). Thus, concerns are raised here regarding the influence of grinding and the comparability of results.


Abulikemu, G., 2023. Role of grinding method on granular activated carbon characteristics.

Chambers, F.M., Beilman, D.W., Yu, Z., 2011. Methods for determining peat humification and for quantifying peat bulk density, organic matter and carbon content for palaeostudies of climate and peatland carbon dynamics. Mires Peat 7, 1–10.

Markert, B., 1995. Sample preparation (cleaning, drying, homogenization) for trace element analysis in plant matrices. Sci. Total Environ., State of the Art of Trace Element Determinations in Plant Matrices 176, 45–61. https://doi.org/10.1016/0048-9697(95)04829-4

Pulleman, M., Wills, S., Creamer, R., Dick, R., Ferguson, R., Hooper, D., Williams, C., Margenot, A.J., 2021. Soil mass and grind size used for sample homogenization strongly affect permanganate-oxidizable carbon (POXC) values, with implications for its use as a national soil health indicator. Geoderma 383, 114742. https://doi.org/10.1016/j.geoderma.2020.114742

Siang, K.S.Q., 2010. The rates of formation of carbon and gases from high energy ball milling of organic compounds.

Yu, Z.C., 2012. Northern peatland carbon stocks and dynamics: a review. Biogeosciences 9, 4071–4085.

How to cite: Ryan, C., Li, N., De Castro Amaral Siqueira, C., Hoch, H., Stock, M., Curran, M., Shaw, H., and Orme, L.: Carbon measurement of peat soils: Significant differences between two grinding methods, EGU General Assembly 2025, Vienna, Austria, 27 Apr–2 May 2025, EGU25-4838, https://doi.org/10.5194/egusphere-egu25-4838, 2025.

EGU25-5014 | ECS | Posters on site | BG3.26

Evaluating changes in Holocene and Anthropocene biodiversity and healthiness of Peatlands in England (UK) 

Robert Hindson, Nicholas Branch, Steve Robinson, and Barbara Silva

The research aims to discover over what timescales current environmental conditions were emplaced, and is there evidence for a significant change in biodiversity? Do the peatlands (bog and fen) represent healthy ecosystems or indicate a trend towards biogeochemical degradation? Are the predicted future changes in precipitation and temperature because of global warming likely to initiate significant changes in peatland hydrology, biogeochemistry, and biodiversity, and what mitigation options might be explored to manage the problem?


The research will utilise various biotic and abiotic proxies to answer these questions. Testate amoebae will provide information on water table depth and can be used in reconstructing past hydrological conditions. Vegetation changes will be investigated using pollen and plant macrofossils. These can assist in distinguishing wet and dry phases in peatland history. The degree of humification will be assessed through analysing the biogeochemistry of the peat horizons extracted. Carbon/Nitrogen Ratios reflect decomposition and organic matter quality and stable Isotopes (e.g., δ¹³C, δ¹⁵N) indicate changes in vegetation type, hydrology, and decomposition processes. X-ray Fluorescence will be used to determine elemental composition (e.g., Ca, Fe, Ti) to infer environmental changes such as nutrient influx or atmospheric deposition. Analysis of carbonaceous particulate matter will allow us to investigate pollution events through time as well as fire history. Detailed dating of deposits over approximately the past 1000 years will be achieved using radiocarbon and Pb210 dating. The evidence of changing hydrological and biogeochemical conditions gained through using these various proxies will be compared to present day surface data (vegetation, pH, Eh, Dissolved Organics).


To consider the likely effects of future climate change scenarios, we will evaluate the above findings within the context of Natural England’s Long-Term Monitoring Network (LTMN) datasets to increase understanding around the likely effects of climate change based on the latest climate models and explore potential beneficial mitigation options for each key site.


Recent field work has yielded the first set of cores from the Fenn’s, Whixall and Bettisfield lowland raised bog on the border of the English county of Shropshire and north Wales. We will present the findings from the preliminary palaeoenvironmental analyses of these cores. Further core samples will be taken from this site and other LTMN sites during 2025. Applications are being made to access protected Natural England peatland sites at Malham Tarn Moss and Featherbed Moss in northern England.


The findings from the research will inform Natural England on the historical development of LTMN sites including lowland raised bogs and fens as well as upland blanket bogs. Ongoing data collection on several nature reserves across England has been carried out since 2009, including vegetation, soil chemistry, air quality, mesofauna and microbes. A major challenge identified by the project, however, is a poor understanding of the historical context and likely future development of the environment at each reserve, particularly the response of peatland habitats to future climatic change.


How to cite: Hindson, R., Branch, N., Robinson, S., and Silva, B.: Evaluating changes in Holocene and Anthropocene biodiversity and healthiness of Peatlands in England (UK), EGU General Assembly 2025, Vienna, Austria, 27 Apr–2 May 2025, EGU25-5014, https://doi.org/10.5194/egusphere-egu25-5014, 2025.

EGU25-5496 | ECS | Orals | BG3.26

Peatland type influences the response of testate amoeba taxonomic composition and functional traits to decadal-scale drying  

Olivia Kuuri-Riutta, Brunella Palacios Ganoza, Henni Ylänne, Edward A.D. Mitchell, Minna Väliranta, and Eeva-Stiina Tuittila

Testate amoeba community analysis is a widely used proxy for inferring past water table fluctuations in peatlands, while their functional traits offer a novel complement to the traditional taxonomy-based approach. Changes in peatland hydrology is a crucial factor, as widespread drying has been documented overs the last ca. 150yrs and further drying due to increasing evapotranspiration has been projected for northern regions. Peatland drying stimulates the growth of shrubs and trees, causing changes in abiotic conditions and possibly turning peatlands into net C sources. However, the responses of testate amoeba taxa and associated functional traits to the interaction of decadal-scale drying per se and the associated secondary changes are still empirically poorly constrained.  

In this study, we aim to deepen the understanding of testate amoeba autecology and enhance their use as a palaeoecological tool. We use a 20-year-long field experiment to assess the effects of decadal-scale water level drawdown (WLD) and associated changes in habitat characteristics on testate amoeba community composition and functional traits. The experiment includes three peatland types: a rich fen, a poor fen, and a bog. Notably, WLD has caused significant vegetation changes in the fen sites.

Our results revealed that both taxonomic composition and functional traits were most strongly affected by WLD in the rich fen and least affected in the bog. This pattern aligns with previous observations in vegetation changes, and it is likely related to the establishment of woody vegetation in the fen sites. For example, the mixotrophic species Archerella flavum did not respond to WLD in the bog, while in the fen sites it almost completely disappeared due to increased shading. Despite this drastic vegetation shift in the fen sites, several previously known indicator species maintained their significance. In the two fen sites, WLD resulted in smaller test and aperture sizes, a reduced proportion of mixotrophic taxa, and fewer taxa with axial apertures or proteinaceous/xenosomic tests. However, in the bog, individual traits did not significantly respond to WLD, suggesting that the value of functional traits as bioindicators is stronger in minerotrophic conditions.

Overall, our findings suggest that the establishment of tree stands in the fen sites and the associated abiotic changes, in addition to the water level drawdown itself, have significantly influenced testate amoeba communities.

How to cite: Kuuri-Riutta, O., Palacios Ganoza, B., Ylänne, H., Mitchell, E. A. D., Väliranta, M., and Tuittila, E.-S.: Peatland type influences the response of testate amoeba taxonomic composition and functional traits to decadal-scale drying , EGU General Assembly 2025, Vienna, Austria, 27 Apr–2 May 2025, EGU25-5496, https://doi.org/10.5194/egusphere-egu25-5496, 2025.

EGU25-5933 | Orals | BG3.26

Substantial methane emissions from central Congo’s wetlands  

Sofie Sjogersten, Nicholas Girkin, Jonay Jovani Sancho, Matti Barthel, Emmanuel Wenina Mampouya, Mackline Mbemba, Joseph Kanyama, Ovide Emba, Yannick Boko, Greta Dargie, Bart Creeze, Jessica Carilli, Selena Georgiou, Antoine de Clippele, Suspense Ifo, Cornille Ewango, Simon Lewis, Johan Six, Clement Ikene Botefa, and Jean Lousie Doucet and the CongoPeat team

The Congo Basin is home to the world’s largest tropical peatland complex storing 29 PgC across 16.7 million ha, which poses a major unconstrained source of global wetland CH4. Key controls over their spatio-temporal variability remain unclear, limiting our ability to assess responses to future environmental change. Here, we present the first time series of in situ measurements from four intensive locations covering peat, seasonally flooded and terra firma forest ecosystems. Measurements were done every month for two years and additional widespread in situ CH4 flux measurements from the peat surface and from tree stems, across 12 transects distributed across the region. The intensive sites show a substantial CH4 source from hardwood and palm dominated peat swamp forest respectively, representing the most substantial emissions from peat swamp forests globally. These emissions were accompanied by substantial emissions from non-peat forming seasonally flooded forests while emissions were close to zero from the terra firme sites. Temporal variation in emissions were coincident with seasonal variation in the water levels with greater emissions during the wet seasons and little during the dry season. We demonstrate large spatial variation in net CH4 emissions across the region and that net emissions are dominated by peat emissions with only a small overall contribution of tree emissions. The emissions followed an exponential relationship with water levels and higher CH4 emissions occurred in areas closer to the nearest river and in areas with greater river water rather than rainwater inputs. Taken together, our findings demonstrates that the Congo wetlands have the capacity to produce large amounts of CH4 with distinct differences between dominant vegetation communities, and water levels and sources representing a key control over dynamics. 

How to cite: Sjogersten, S., Girkin, N., Jovani Sancho, J., Barthel, M., Mampouya, E. W., Mbemba, M., Kanyama, J., Emba, O., Boko, Y., Dargie, G., Creeze, B., Carilli, J., Georgiou, S., de Clippele, A., Ifo, S., Ewango, C., Lewis, S., Six, J., Botefa, C. I., and Doucet, J. L. and the CongoPeat team: Substantial methane emissions from central Congo’s wetlands , EGU General Assembly 2025, Vienna, Austria, 27 Apr–2 May 2025, EGU25-5933, https://doi.org/10.5194/egusphere-egu25-5933, 2025.

EGU25-6079 | ECS | Posters on site | BG3.26

Forest fire susceptibility and risk mapping assessment in Sumatra, Indonesia by remotely sensing data 

Agustiyara Agustiyara and Balázs Székely

In tropical countries like Indonesia, forest fires are common natural or human-induced disasters that occur throughout the Southeast Asian region all year around. It’s also known for its rich biodiversity and extensive peatlands, which are particularly vulnerable due to circumstances and risk factors. Thus, the research aims to shed light on forest fire susceptibility mapping and assessing high-risk zones based on land use, vegetation type, and climatic factors. This study utilized remote sensing through Google Earth Engine (GEE) and Geographic Information Systems (GIS) to evaluate forest fire risk in Sumatra, Indonesia, a region facing challenges such as rapid palm oil plantation development, timber concessions, and active peatland fires. Tropical rainforests, peatlands, and diverse ecosystems characterize Sumatra. The region is often affected by natural forest fires (e.g., El Niño events) and human-induced activities (e.g., illegal land clearing for plantation purposes). Forest fire locations in the study area were identified using historical hotspot data from 2014 to 2022. Fire risk assessments are typically generated using spectral indices to classify the spatial distribution of damage caused by fires; first, forest fire susceptibility through a combined index calculated by adding classified fire risk, forest loss index, normalized slope, aspect, temperature, and relative humidity. This index indicates potential fire risk and demonstrates how to integrate various geospatial datasets, such as vegetation indices, topography, and climate data, within GEE to assess forest fire risk. Then, we evaluated the feasibility of using remote sensing data to identify fire causes by validating forest fire occurrence factors. This study demonstrates how detailed risk assessment provides an effective method of managing forest fires in Riau Province, Sumatra, Indonesia, which can contribute to reducing the frequency and severity of fires, and improve sustainable forest management and governance.

How to cite: Agustiyara, A. and Székely, B.: Forest fire susceptibility and risk mapping assessment in Sumatra, Indonesia by remotely sensing data, EGU General Assembly 2025, Vienna, Austria, 27 Apr–2 May 2025, EGU25-6079, https://doi.org/10.5194/egusphere-egu25-6079, 2025.

EGU25-6424 | ECS | Orals | BG3.26

Methane fluxes mediated by plants: Magnitude and drivers 

Caroline Signori-Müller, Deisy Paola Alarcon, Estefania Ramírez Peña, Alejandro Delgado Guerrero, Juan Carlos Benavides Duque, Michel Mbasi, Charles Jjuuko, David Were, Frank Kansiime, Jenny Farmer, and Angela Gallego-Sala

Methane (CH4) emissions from tropical wetlands remain the largest uncertainty in the global CH4 cycle, and due to the high global warming potential of CH4 (84 times that of CO2 over a 20-year timescale), changes inemissions can disproportionately influence the climate over the coming decades. Methane has a short atmospheric life span, therefore reducing CH4 emissions could be key to meeting the Paris agreement temperature targets. To achieve this, it is essential to improve our understanding of regional CH4 emissions, especially from tropical areas, the largest natural sources but where field observations remain scarce. Although plant CH4 emissions can be regionally important in the tropics, in some cases contributing up to 81 % of total ecosystem level fluxes, they are neglected in global methane budgets. Peatlands, a type of wetland where waterlogged conditions result in accumulation of organic matter and anoxic conditions in the soil, most likely play an important but uncertain role in CH4 release (40 to 80% of tropical CH4 emissions). The large uncertainties in plant mediated CH4 emissions in tropical peatlands occur due to insufficient long-term field experiments to capture seasonal and interannual variability in CH4 fluxes and lack of information about plant species-specific emissions patterns and their drivers. To fill this gap, we are measuring plant trunk/stem CH4 fluxes across seasons in four tropical peatlands in Africa and South America with contrasting vegetation types: 1) a papyrus swamp (herbaceous, Mpologoma, Uganda) 2) a hardwood swamp forest (Bomboma, Democratic Republic of Congo) 3) a Montrichardia swamp (herbaceous, Leticia, Colombia) and 4) a hardwood swamp forest (Inirida, Colombia). We hypothesize that the magnitude and temporal dynamics of CH4 is intimately linked to environmental variables (e.g., water table level, temperature, etc) and plant growth cycles. By identifying the magnitude and main drivers behind CH4 emissions through plants it will be possible to reduce uncertainties in modelling future emissions and hence future climate projections.

How to cite: Signori-Müller, C., Alarcon, D. P., Ramírez Peña, E., Delgado Guerrero, A., Benavides Duque, J. C., Mbasi, M., Jjuuko, C., Were, D., Kansiime, F., Farmer, J., and Gallego-Sala, A.: Methane fluxes mediated by plants: Magnitude and drivers, EGU General Assembly 2025, Vienna, Austria, 27 Apr–2 May 2025, EGU25-6424, https://doi.org/10.5194/egusphere-egu25-6424, 2025.

EGU25-7308 | ECS | Posters on site | BG3.26

Greenhouse gas fluxes and microbiome in a peatland forest and peaty savanna in Epena, Republic of the Congo 

Ülo Mander, Jaan Pärn, Mikk Espenberg, Kaido Soosaar, Sydney Ndolo Ebika, Gaël Bouka Dipelet, Laura Kuusemets, Sten Mander, Ramita Khanongnuch, Kärt Kanger, David Brugière, and Joël Loumeto

The carbon and nitrogen budgets, as well as greenhouse gas (GHG) fluxes, in peatlands of the Congo Basin – most likely the largest tropical peatland area – remain almost unexplored. In March 2024 (dry season) and November 2024 (wet season), we conducted measurements of carbon dioxide (CO2), methane (CH4) and nitrous oxide (N2O) fluxes, along with peat chemistry, in a hardwood peat swamp forest and peaty savanna in Epena, Republic of the Congo. Manual soil and tree stem chambers were used to collect gas for further analysis using a Shimadzu gas chromatographer. Soil temperature, pH, O2, water content, and groundwater table (GWT) levels were measured using portable analysers. Additionally, soil, trunk wood and tree leaves were sampled for subsequent physico-chemical and microbiome analysis. All the laboratory analyses were carried out at the University of Tartu. Four sampling sessions were conducted during both the dry and wet season, providing data across typical seasonal variation for the Congolese peat swamp ecosystem.
In the dry season (GWT −0.5 to −2.0 m), respiration of CO2 from peat was relatively high (160–280 mg C m–2 h–1 as site averages) while the peat consumed 0.045…0.055 mg CH4-C m–2 h–1 as site averages. N2O fluxes were very low while only the forest peat showed a significant N2O emission of 96 μg N m–2 h–1. We explain the pattern with severe heat (up to 42oC in topsoil) and dryness (down to 0.36 m3 water m–3 topsoil). CH4 was consumed in the peat while low CH4 emissions were observed from Raphia sp. palm stems. Soil abundances of control genes associated with the N2O and CH4 cycles were low, likely due to the heat and dryness. In the dry season, preliminary gene analysis showed presence of archaeal nitrifiers and denitrifiers in the forest peat, with absence of bacterial nitrifiers. Fungal denitrifiers were also present in the peat of both ecosystems.
In the wet season (GWT –0.3 to +1.5 m), respiration of CO2 from peat was expectedly low (54–81 mg C m–2 h–1 as site averages). Both the forest and savanna emitted CH4 (0.12…1.0 and 0.033…0.18 mg C m–2 h–1, respectively, as site averages) and no significant amount of N2O, as expected from a waterlogged ecosystem. The modest CH4 emissions were explained by variability of O2 with the uneven ground surface, the mobile groundwater and the flow connection to Likouala riverwater.

How to cite: Mander, Ü., Pärn, J., Espenberg, M., Soosaar, K., Ndolo Ebika, S., Bouka Dipelet, G., Kuusemets, L., Mander, S., Khanongnuch, R., Kanger, K., Brugière, D., and Loumeto, J.: Greenhouse gas fluxes and microbiome in a peatland forest and peaty savanna in Epena, Republic of the Congo, EGU General Assembly 2025, Vienna, Austria, 27 Apr–2 May 2025, EGU25-7308, https://doi.org/10.5194/egusphere-egu25-7308, 2025.

EGU25-7578 | ECS | Posters on site | BG3.26

Identifying wetland types of ice-free intervals prior to the Last Glacial Maximum: first insights into pre-LGM carbon dynamics from the Hudson Bay Lowlands, Canada 

Julia Hathaway, Tyler Hodder, Michelle Gauthier, Minna Väliranta, April S. Dalton, and Sarah A. Finkelstein

The Hudson Bay Lowlands (HBL) of central Canada are characterized by expansive complexes of patterned forested and open bog, rich and poor fen, swamp, and marsh ecosystems. These systems have accumulated thick Holocene peat deposits, making them globally significant carbon (C) stocks. However, the magnitude of peatland C sinks, and their potential to be C sources through methane release, are sensitive to variability in temperature and moisture balance, creating uncertainties around responses to projected climate change. Periods of significant ice retreat pre-dating the Last Glacial Maximum (LGM), including interglacials and interstadials, provide opportunities to investigate wetland C dynamics under different boundary conditions including warmer and/or drier climatic conditions. Despite palynological and paleontological evidence that wetlands existed in the HBL region during Late Pleistocene periods of ice retreat, their C dynamics are poorly understood. This is in part because the available non-glacial records are mainly preserved in fluvial contexts, are often overlain by massive glacial deposits, contain both organic and mineral fractions, and are thus not readily comparable to in situ peatland records of Holocene age that are used to measure and model apparent rates of net C accumulation. Nevertheless, these non-glacial intervals preserve fossil pollen and macrofossil assemblages, and thus, have potential to contribute new insights into peatland C dynamics during ice-free intervals pre-dating the LGM. In this study, we compare fossil pollen assemblages and quantitative paleoclimate reconstructions from pre-LGM sections in the HBL, situated in the heart of glaciated North America to reconstruct paleoenvironments. We then present an approach to extract peatland C information from these deposits by identifying the presence of specific peatland types using combined modern and fossil pollen assemblages and a random forest algorithm. Using the modern analogs, assigned peatland types can then be linked to C accumulation and methane flux regimes. Ordinations of available samples indicate the presence of several distinct wetland types including Sphagnum-dominated bogs, wet fen environments in both open and forested contexts, riparian or stream bank environments with relatively better drainage, thicket swamps and marshes with Typha. These wetland types can then be used to make initial inferences on potential peat C dynamics during ice-free intervals pre-dating the LGM. 

How to cite: Hathaway, J., Hodder, T., Gauthier, M., Väliranta, M., Dalton, A. S., and Finkelstein, S. A.: Identifying wetland types of ice-free intervals prior to the Last Glacial Maximum: first insights into pre-LGM carbon dynamics from the Hudson Bay Lowlands, Canada, EGU General Assembly 2025, Vienna, Austria, 27 Apr–2 May 2025, EGU25-7578, https://doi.org/10.5194/egusphere-egu25-7578, 2025.

EGU25-7815 | Orals | BG3.26

Basin bathymetry controls the long-term carbon accumulation in northern boreal sloping fen  

Niina Kuosmanen, Seija Kultti, Suvi Erhovaara, Kirsti Korkka-Niemi, Annika Åberg, and Olli Nurmilaukas

Boreal peatlands play a crucial role in global carbon dynamics as sinks and sources. Groundwater dependent nutrient rich sloping fen ecosystem is a typical morphological peatland type for northeastern Finland. To increase the understanding of the carbon dynamics of these ecosystems we investigate the long-term carbon accumulation pattern in sloping fen in the carbonate bedrock area in northern boreal zone. 

The study site Puukkosuo is a sloping fen situated in Oulanka in northern boreal zone in NE Finland. Four peat cores were obtained across the study site. All cores were radiocarbon dated for chronological control to calculate the peat accumulation rate. Peat characteristics (peat composition, humification degree, bulk density) and carbon content was analysed to investigate the development of the peatland and long-term carbon storage during the Holocene. The peat accumulation rate, based on radiocarbon dates, bulk density and carbon content were used to calculate the long-term carbon accumulation. To assess the role of basin bathymetry to peatland development and carbon storage, the 3D structure of the Puukkosuo basin was modelled with Leapfrog Geo (Seequent) program based on network of ground penetrating radar (GPR) profiles (5.5 km) across the peatland and reference peat stratigraphy. 

The records cover the last 9 000 cal yr BP of peatland development and carbon accumulation. The results suggests that the carbon accumulation rate in the basal part of the basin exceeds the average rate in the northern boreal zone, whereas the surface layer demonstrates typical carbon accumulation values. The changes in the accumulation rate are divergent between cores but occur at the same altitudinal level of the basin. Therefore, we conclude that here the bathymetry rather than the accumulation period controls the major carbon accumulation patterns. These results will be further discussed in the presentation. 

How to cite: Kuosmanen, N., Kultti, S., Erhovaara, S., Korkka-Niemi, K., Åberg, A., and Nurmilaukas, O.: Basin bathymetry controls the long-term carbon accumulation in northern boreal sloping fen , EGU General Assembly 2025, Vienna, Austria, 27 Apr–2 May 2025, EGU25-7815, https://doi.org/10.5194/egusphere-egu25-7815, 2025.

EGU25-7838 | ECS | Posters on site | BG3.26

Possible influence of low latitude wetland area changes on the Holocene global atmospheric methane concentration trend 

Yunping Song, Hai Xu, and Kevin M. Yeager

Methane is an important greenhouse gas with a strong infrared radiation absorbing effect approximately 25 times higher than that of CO2. The global atmospheric methane concentration (GAMC) has increased from ~715 ppb to ~1853 ppb since the Industrial Revolution, which may have led to an ~18% increase in the global total solar radiation absorption. Therefore, understanding the causes of variations in GAMC is a crucial issue in global climatic change research. The long-term trend of atmospheric methane concentration recorded in ice cores roughly followed the orbital cycles in the northern hemisphere solar insolation. However, since the mid-Holocene, these two have become ‘decoupled’. Currently, there is still considerable controversy regarding the explanation for this ‘decoupling’. Previous studies believed that the temperature increase during the Holocene led to the expansion of wetland areas in high latitudes of the Northern Hemisphere, emitting substantial amounts of methane, which played a dominant role in the increase in global methane concentration. However, as research progresses, the impact of hydrological cycles in low-latitude regions has gradually gained attention, with the dry conditions in the mid-Holocene likely resulting in reduced methane emissions from wetlands in low-latitude regions. In addition to the influence of these natural factors, numerous studies have also focused on methane emissions from early agricultural practices (rice cultivation), with the expansion of rice paddies in the late Holocene emitting large amounts of methane.

To discuss the impact of natural and anthropogenic factors on the trends in atmospheric methane concentration, we collect methane emission flux data from global wetlands and rice paddies (a total of 377 sites) for analysis and comparison. We believe that during the mid-Holocene, with primitive agricultural production techniques and a smaller population, methane emissions from rice paddies were insufficient to reverse the trend in global methane concentration, which was likely more influenced by natural factors. Additionally, we find that the Holocene GAMC trend closely follows the long-term trend in global low latitude wetland extent, as inferred from our lake-level reconstruction and from other existing hydroclimate records, implying that changes in tropical-subtropical wetland areas could play a major role in the natural global methane cycle. The reduction in the area of low latitude wetlands during the mid-Holocene, caused by increased submersion from sea level rise and by reduced subtropical water availability inferred from decreased lake levels, could have led to the observed mid-Holocene GAMC fall. 

How to cite: Song, Y., Xu, H., and Yeager, K. M.: Possible influence of low latitude wetland area changes on the Holocene global atmospheric methane concentration trend, EGU General Assembly 2025, Vienna, Austria, 27 Apr–2 May 2025, EGU25-7838, https://doi.org/10.5194/egusphere-egu25-7838, 2025.

EGU25-8505 | ECS | Posters on site | BG3.26

Validating L-Band InSAR for Tropical Peat Motion Monitoring: A Transformative Approach for Peat Measurement, Reporting, and Verification 

Cheryl Tay, A. Jonay Jovani-Sancho, Lisna Yulianti, Chris Evans, Nathan Callaghan, Adi Jaya, Rino Salman, Yujie Zheng, Susilo Susilo, Salampak Dohong, and Sang-Ho Yun

Peatlands are vital carbon stores but risk turning into carbon sources due to anthropogenic disturbance. In Southeast Asia, an estimated 65% of tropical peatlands have been drained, primarily for agriculture and plantation development. This drainage results in drying, subsidence, and oxidation of the peat, leading to substantial CO₂ emissions stemming from the belowground biomass. Quantifying carbon emissions from peatlands in this region is therefore crucial and growing in importance for peat Measurement, Reporting, and Verification (MRV). However, measurements remain sparse due to the vast, swampy, densely vegetated, and often inaccessible nature of these tropical landscapes. By measuring peat motion, which is a proxy for peat CO₂ emissions, L-band Interferometric Synthetic Aperture Radar (InSAR) offers a cost-effective monitoring solution with the ability to penetrate vegetation and cover large areas at millimeter-scale precision. Despite its potential, the accuracy of L-band InSAR has not been rigorously validated in Southeast Asia and results can vary significantly depending on the InSAR processing strategies taken.

Here, we address this gap by using a unique combination of L-band ALOS-2 InSAR and high-accuracy, high-rate ground truth data from peat cameras to assess the InSAR accuracy for measuring peat motion. We use 5-year long ground measurements from 8 peat cameras distributed across oil palm plantations, croplands, scrublands, and forests in Central Kalimantan, Indonesia, to provide unprecedented evaluation of the accuracy of InSAR both temporally and spatially. We also mitigate major noise sources in ALOS-2 InSAR time series of ground motion stemming from the ionosphere, troposphere, and closure phase bias to improve the InSAR accuracy.

Our results demonstrate consistency of InSAR with the long-term velocities of peat motion from ground truth data across all sites with a mean RMSE of < 5 mm/year. We also show high accuracy of InSAR (RMSE ~1.6 cm and Pearson’s correlation coefficient ~0.7) in detecting sub-annual fluctuations of peat displacements over plantations and croplands, and poorer performance over some scrublands and forests but that can be identified based on the InSAR coherence. The 5-year span of the InSAR and peat camera datasets also reveal subsidence trends driven by drainage and accelerated during El Niño events. These results show the suitability of L-band for both multi-annual and sub-annual monitoring of peat motion in the tropics. In addition, these findings demonstrate that L-band InSAR can be scaled up to provide regional to global coverage, especially with the advent of new and upcoming L-band satellites (e.g. ALOS-4 and NISAR). Frequent data acquisitions and accurate data processing and analysis are essential for MRV of peat carbon. Without reliable data, verifying carbon credits and restoration efforts becomes impossible, undermining market credibility and effective mitigation of climate change impact. This study thus validates InSAR as a cost-effective and scalable tool and contributes to the robust assessment of ongoing climate action.

How to cite: Tay, C., Jovani-Sancho, A. J., Yulianti, L., Evans, C., Callaghan, N., Jaya, A., Salman, R., Zheng, Y., Susilo, S., Dohong, S., and Yun, S.-H.: Validating L-Band InSAR for Tropical Peat Motion Monitoring: A Transformative Approach for Peat Measurement, Reporting, and Verification, EGU General Assembly 2025, Vienna, Austria, 27 Apr–2 May 2025, EGU25-8505, https://doi.org/10.5194/egusphere-egu25-8505, 2025.

EGU25-8575 | Posters on site | BG3.26

How can peatland palaeoecology support nature conservation? Two examples from the Tuchola Forest, Poland 

Katarzyna Marcisz, Mariusz Bąk, Jay Tipton, Piotr Kołaczek, Daria Wochal, Paweł Matulewski, Dominika Jaster, Dominik Kopeć, Martyna Wietecha, Dominika Łuców, Milena Obremska, and Mariusz Lamentowicz

Peatlands are important carbon stocks, yet they are also highly susceptible to ongoing climate change and other direct anthropogenic impacts. Many peatlands across Europe have been either destroyed or partly damaged, and anthropogenic disturbance intensified over the last 300 years. Conservation of these ecosystems is, therefore, necessary to protect various ecosystem services provided by peatlands, e.g., water retention, carbon sequestration, and biodiversity protection. This contribution aims to present two palaeoecological case studies that supported the creation of two new nature reserves in the Tuchola Forest in Northern Poland in 2024 – “Torfowisko Jezierzba” (Jezierzba Peatland) and “Torfowisko Okoniny” (Okoniny Peatland). Both peatlands are located within a large Pinus sylvestris monoculture forest complex managed by the State Forests. In both cases, palaeoecological investigations involved high-resolution analyses of various palaeoecological proxies and the studies of historical materials and maps, while at the Jezierzba peatland, remote sensing analyses were additionally carried out to assess the current ecosystem state (Bąk et al. 2024; Tipton et al. in review). Moreover, dendrochronological data helped to assess the state of forest stands and the response of pine trees to climate change. Invaluable was a close cooperation with local foresters from Woziwoda and Tuchola Forestry Districts who supported our investigations.

Research funded by National Science Centre, Poland (2020/39/D/ST10/00641) and EEA Grants/Norway Grants (MFEOG.07.02.01-50-0028/21-00).

Bąk, M., Lamentowicz, M., Kołaczek, P., Wochal, D., Matulewski, P., Kopeć, D., Wietecha, M., Jaster, D. & Marcisz, K. (2024) Assessing the impact of forest management and climate on a peatland under Scots pine monoculture using a multidisciplinary approach. Biogeosciences, 21, 5143-5172.

Tipton, J., Marcisz, K., Łuców, D., Obremska, M. & Lamentowicz, M. (in review) Utilizing testate amoebae as key indicators of critical transitions in historical forest management: a case study of Scots pine monoculture.

How to cite: Marcisz, K., Bąk, M., Tipton, J., Kołaczek, P., Wochal, D., Matulewski, P., Jaster, D., Kopeć, D., Wietecha, M., Łuców, D., Obremska, M., and Lamentowicz, M.: How can peatland palaeoecology support nature conservation? Two examples from the Tuchola Forest, Poland, EGU General Assembly 2025, Vienna, Austria, 27 Apr–2 May 2025, EGU25-8575, https://doi.org/10.5194/egusphere-egu25-8575, 2025.

EGU25-10082 | Posters on site | BG3.26

Ecological characteristics and spatial distribution of Urarina peatland and wetland ecosystems in Peruvian Amazonia 

Euridice Honorio Coronado and Katherine Roucoux and the collaborators of RAINFOR and the Tropical Wetlands Consortium

Wetlands and peatlands in Peruvian Amazonia are important for their unique biodiversity, carbon storage, and flood regulation. They also underpin the livelihoods, cultural traditions, and spiritual beliefs of indigenous communities, including the Urarina in the Loreto region, who hold extensive traditional knowledge of these ecosystems. However, this knowledge and the ecosystems themselves face threats from extractive industries and infrastructure development, which disrupt indigenous territories and degrade the environment.

This study integrates Urarina traditional knowledge with scientific methods to explore wetland and peatland ecosystems. Fieldwork was conducted in four Urarina communities along the Chambira River basin, combining social and ecological data collection. We conducted 62 semi-structured interviews to refine the known socio-cultural values of these ecosystems, established 36 forest plots to characterize forest structure and floristic composition, and collected substrate data to assess water table depth, peat thickness, and chemical properties. Remote sensing techniques, including supervised classification of Sentinel-2 and Landsat-8 imagery, were used to map the distribution of Urarina ecosystem types.

The Urarina recognize eight distinct wetland ecosystems, each characterized by unique ecological features, traditional uses, and cultural significance. The study confirms the peat-forming nature of several ecosystems, such as alaka, jiiri and enüüa lauinaa, noting the nutrient-poor, rain-fed substrates of jiiri and enüüa lauinaa. Spatial analysis reveals that jiiri and leuuaku are the most extensive, emphasizing their ecological and cultural importance.

By integrating traditional knowledge with scientific research, this study advances our understanding of these ecosystems and supports conservation and sustainable management policies in Peruvian Amazonia.

How to cite: Honorio Coronado, E. and Roucoux, K. and the collaborators of RAINFOR and the Tropical Wetlands Consortium: Ecological characteristics and spatial distribution of Urarina peatland and wetland ecosystems in Peruvian Amazonia, EGU General Assembly 2025, Vienna, Austria, 27 Apr–2 May 2025, EGU25-10082, https://doi.org/10.5194/egusphere-egu25-10082, 2025.

EGU25-10625 | ECS | Posters on site | BG3.26

Mapping a large fossil alluvial peatland and modelling peat and C volume: first results from the Somme basin (northern France) 

Chloé Garcia, Emmanuel Kramarczyk, Pierre Antoine, Jean-Louis Grimaud, and Boris Brasseur

Peatlands represent a significant global carbon (C) stock, constituting 25% of soil carbon despite occupying 3% of the continental surface. Sometimes buried below the soil surface, peat is mainly composed of fossil plant debris and thus has considerable potential for paleoenvironmental reconstruction (e.g. pollens, macrofossils) and storing organic C. In the context of global change, peatlands face a range of anthropogenic and climate forcing that can disrupt their functioning and capacity to store C at the surface and at depth. Examples of such changes include drainage and peat extraction, which can encourage the decomposition of organic matter and the release of C into the atmosphere. Mapping the extent of (past-) peatland is essential for peat volume estimation and to protect and restore peatland functions. However, mapping large areas of fossil alluvial peatlands, using current remote sensing methods is not always straightforward. As is often observed in northwestern Europe, peatlands are frequently covered (fossilised) by loamy colluvium and alluvium resulting from soil erosion, especially in the upstream sections of small valleys.

This is the case of the Somme basin (northern France), which contains an extensive alluvial peatland, mostly fossil, where a large amount of peat accumulated during the Holocene (up to 11 m). The research, initiated in 2020, provides a precise reconstruction of the variations in the dynamics of peat accumulation in the Somme river basin over 15 ka (Garcia et al., 2024)i. The challenge for the current research is to quantify the volume of peat and C stocks based on morphostratigraphic and geochemical data.

Firstly, stratigraphic and geochemical data from three valley transects (Long, Morcourt, Tirancourt) were used to estimate current and past (pre-extraction) C stocks from peat, peaty silt, organic silt per site, locally representing a 38% loss such as in Long. Secondly, 750 punctual peat cores were digitalised through the basin (peat thickness GIS database) to define the potential fossil peat envelope (33,315 ha). Peat volume was modelled at the scale of the main valleys in the catchment using an interpolation method. The average C content per cubic meter of peat stratigraphic units (45.4%) was applied to the total volume per site and for the basin to estimate the C stocks. The preliminary results give a potential of 1,2 cubic kilometres of peat for 6,4 million tonnes of C. Thirdly, the volumes extracted in the modern period are calculated based on the current surface area of the valley ponds (former extraction pits, about 1/3 of the wetland area). The results will be available to environmental managers and institutions to raise awareness of carbon storage issues in fossil peat.

i Garcia C., Brasseur B., Bacon J., Saulnier-Copard S., Gauthier C., Mathieu L.-A., Gauthier A., Michaelis D., Mokadem F. & Antoine P. 2024. Lateglacial and Holocene palaeoenvironmental evolution of alkaline peatlands in the Somme valley (France): between climate and anthropogenic forcing. Boreas. 10.1111/bor.12676

How to cite: Garcia, C., Kramarczyk, E., Antoine, P., Grimaud, J.-L., and Brasseur, B.: Mapping a large fossil alluvial peatland and modelling peat and C volume: first results from the Somme basin (northern France), EGU General Assembly 2025, Vienna, Austria, 27 Apr–2 May 2025, EGU25-10625, https://doi.org/10.5194/egusphere-egu25-10625, 2025.

EGU25-11044 | ECS | Orals | BG3.26

Global peatland evolution since the last deglaciation and its role in atmospheric methane 

Yiming Zhang, B. David A. Naafs, Mike Vreeken, Panteleimon Prokopiou, Rebecca H. Peel, Toby A. Halamka, Megan N. Jenkins, Casey Bryce, Angela V. Gallego-Sala, and Richard D. Pancost

Peatlands play a critical role in global carbon storage and methane cycling. Despite much investigation of widespread peatland initiation since the last deglaciation, the subsequent global pattern of peatland evolution and its impacts on atmospheric methane remain poorly understood. Here, we integrated palaeoecological records from >120 peatlands worldwide to develop a global synthesis of peatland evolution. Our synthesis documents peatland initiation and (fen-to-bog) transitions based on vegetation community changes, stratigraphy, and reconstructed pH variations.

Our dataset reveals that peatland evolution has been continuous since ~15 ka BP (before present), with a maximum in the number of peatlands transitioning from fens to bogs during the early Holocene (10-7 ka BP). More than 50 % of peatlands completed this transition within 3,000 years of initiation, and ~75 % within 5,000 years, independent of climate state. This highlights the dominant role of autogenous peat accumulation processes in driving long-term peatland evolution. The peak in fen-bog transition coincided with a ~100 ppb decline in atmospheric methane concentrations and a ~2 ‰ depletion in methane carbon isotopes as recorded by the ice cores, possibly partly reflecting reduced methane emissions and a large-scale shift from acetoclastic to hydrogenotrophic methanogenesis due to the global fen-to-bog transitions. Supporting this, modern flux data from >130 fen and bog sites indicate that fen-bog transitions reduce methane emissions by ~50 %.

In tropical peatlands, limited palaeoecological data from key regions such as the Congo Basin, Southeast Asia, and the Amazon suggest that tropical peatland evolution occurred later than that of northern peatlands, primarily during 6-2 ka BP. Unlike the herbaceous fen to Sphagnum bog transitions typical for northern peatlands, these tropical transitions were characterized by a shift from herbaceous vegetation to tree-dominated swamps, or by changes in the dominant tree species within forested swamps. Consequently, these transitions may have enhanced or at least maintained methane emissions considering that tree-mediated methane transport can be as important as sedge-mediated transport. This later tropical shift may be one of the reasons why atmospheric methane did not continue to decline during the mid-to-late Holocene.

How to cite: Zhang, Y., Naafs, B. D. A., Vreeken, M., Prokopiou, P., Peel, R. H., Halamka, T. A., Jenkins, M. N., Bryce, C., Gallego-Sala, A. V., and Pancost, R. D.: Global peatland evolution since the last deglaciation and its role in atmospheric methane, EGU General Assembly 2025, Vienna, Austria, 27 Apr–2 May 2025, EGU25-11044, https://doi.org/10.5194/egusphere-egu25-11044, 2025.

Nature-based climate solutions are now central to discussions at international forums such as the United Nations Conference of the Parties, aimed at limiting global warming to below 1.5°C. Tropical peatlands in Southeast Asia represent significant sources of greenhouse gas (GHG) emissions within the regional land sector and are crucial to achieving national emissions reduction targets under Nationally Determined Contributions (NDCs). However, current estimates of GHG emissions from these peatlands vary widely and remain a topic of debate. Accurate assessments of contemporary GHG balances and their driving factors are therefore essential to understanding the global climate implications of these ecosystems. Since 2016, we have been measuring GHG fluxes over intact forests, degraded forests, and Acacia crassicarpa fiberwood plantations, within the same peat landscape in Sumatra, Indonesia. Using the eddy-covariance technique, we have quantified net exchanges of CO2 and methane, complemented by flux chamber measurements for soil nitrous oxide emissions. This comprehensive approach aims to refine emission factors and develop high-resolution (Tier 3) estimates while exploring their links to environmental variables. Surprisingly, we find that net CO2 fluxes at different groundwater levels from eddy-covariance studies are substantially lower than those derived from previous flux chamber and subsidence studies. Contemporary emissions from Acacia plantation on peat are lower than what the IPCC and Indonesian's FREL report. Acacia plantations have lower GHG emissions than degraded sites with similar average groundwater levels. Thus, establishing plantation forests on degraded sites reduces long-term GHG emissions; further, using tree biomass for bioenergy avoids fossil fuel burning. Finally, our results confirm that the net avoidance of GHG emissions through the conservation of remaining intact peat swamp forests makes a significant contribution to Indonesia’s NDC.

How to cite: Deshmukh, C. S.: Nature-based Climate Solutions and Tropical Peatlands: A Pathway to Achieving NDCs, EGU General Assembly 2025, Vienna, Austria, 27 Apr–2 May 2025, EGU25-11147, https://doi.org/10.5194/egusphere-egu25-11147, 2025.

EGU25-11299 | ECS | Orals | BG3.26

How can Norwegian mountain peatbogs represent useful archives to understand the effect of climate on peatlands carbon budget? 

Christian Quintana, Anne Bjune, Alistair Seddon, and Hanna Lee

There is extensive literature on temporal carbon accumulation changes in arctic and boreal peatlands in northern peatlands, but little has been achieved in comparing mountain peatlands carbon sinks capacities in wet regions such as Norway. Projections in Norway show a rise in temperature and annual rainfall with more intense seasonal events in western, eastern, and northern parts. In this context, this study hypothesizes that temporal variability of temperature and precipitation during the Holocene led to weaker and stronger evapotranspiration and moisture signals affecting local and regional vegetation in peatland ecosystems, water-table changes, and carbon accumulation capacity. This study aims in disentangling the responses of the carbon budget at different hydrological gradients during the Holocene and compare temporal carbon sink capacity of peatlands in two of the most important plateaus not only in Norway, but in Europe. Methods involve a multiproxy approach to reconstruct carbon accumulation rate, local vegetation changes, %C and % N to investigate the relationship between the proxies and Holocene carbon changes. Results for Carbon accumulation rates, show very specific trends in early, mid and late Holocene and correlation with Temperature and Precipitation reconstructed values at different stages of the Holocene.

How to cite: Quintana, C., Bjune, A., Seddon, A., and Lee, H.: How can Norwegian mountain peatbogs represent useful archives to understand the effect of climate on peatlands carbon budget?, EGU General Assembly 2025, Vienna, Austria, 27 Apr–2 May 2025, EGU25-11299, https://doi.org/10.5194/egusphere-egu25-11299, 2025.

EGU25-11721 | Posters on site | BG3.26

Palaeoecological peatland study highlights human impact on the environment of Western Siberia's taiga 

Mariusz Lamentowicz, Michał Słowiński, Katarzyna Marcisz, Sambor Czerwiński, and Dominika Łuców

Taiga is one of the world’s largest boreal forest areas that, together with peatlands, span extensive regions of Siberia. Over the past, it has been subject to changes influenced by natural factors and human activity, which utilized available timber and raw materials for their needs. However, Western Siberia's coupled taiga and peatlands history remains insufficiently studied. We lack a comprehensive understanding of the extent to which indigenous people, including the Khanty, influenced taiga through logging, grazing, or controlled fires before the intensive forest exploitation that commenced in the 20th century. Therefore, our research focuses on the palaeoecological reconstruction of environmental changes over the past 1600 years in the Khanty-Mansiysk region (Western Siberia). We employed pollen, testate amoebae, and charcoal from Shapsha bog to reconstruct past dynamics of taiga vegetation and associated changes in the peatland. Our results demonstrate that indigenous communities probably had minimal impact on the natural environment. We also recorded a forest fire at the turn of the 14th and 15th centuries. It may have transformed the ecosystem by raising water levels, enhancing peat accumulation, and fostering peatland growth. Our records indicate that human activities began significantly impacting the environment from the 16th century. The Russian colonization of Siberia is likely responsible for these changes, as it involved organized action of taiga deforestation for purposes such as building settlements, creating trade routes, and developing agriculture.  In connection with colonization, Russian settlers took over local areas near the peat bog from the indigenous population and created the town of Shapsha.

This research was funded in the framework of the National Science Centre grant No. 2021/41/B/ST10/00060 and INTERACT No. 730938 - PeatHOT project, and within the frame of the IDUB (Excellence Initiative—Research University) programme (003/13/UAM/0007 and 003/13/UAM/0008).

How to cite: Lamentowicz, M., Słowiński, M., Marcisz, K., Czerwiński, S., and Łuców, D.: Palaeoecological peatland study highlights human impact on the environment of Western Siberia's taiga, EGU General Assembly 2025, Vienna, Austria, 27 Apr–2 May 2025, EGU25-11721, https://doi.org/10.5194/egusphere-egu25-11721, 2025.

EGU25-12679 | ECS | Orals | BG3.26

Peat forest disturbances in tropical regions: direct drivers and GHG emissions 

Karimon Nesha, Martin Herold, Johannes Reiche, Kristell Hergoualc'h, and Erin Swails

We estimated and compared driver-specific GHG (CO₂, CH₄, and N₂O) emissions from biomass and peat soil carbon loss caused by peat forest disturbances in Indonesia, Peru, and DRC over 2020 - 2021. We randomly sampled 1,000 disturbance events in each country to identify direct drivers, utilizing visual interpretation of 4.77 m Planet and 10 m Sentinel-2A satellite imagery. We estimated CO₂ emissions from AGB loss by utilizing pre-disturbance carbon stocks derived from the 2019 ESA CCI Biomass product for forest areas disturbed in 2020 and 2021. To estimate CH₄ and N₂O emissions from AGB burning, we employed a multiplication approach combining pre-disturbance biomass data, combustion factors, and emission factors (EF) data. GHG emissions from peat decomposition and peat burning were estimated using driver-specific EF and the corresponding disturbance area. Large-scale agriculture was the primary contributor to GHG emissions in Indonesia, accounting for 48% of emissions, followed by smallholder agriculture at 26%. While, smallholder agriculture emerged as the dominant driver in Peru and DRC, contributing over half of emissions in Peru and 94% in DRC. Fire-related emissions accounted for half of emissions and were predominantly linked to agriculture, comprising 80% in Indonesia, 75% in Peru, and 95% in DRC. CO₂ was the dominant GHG, accounting for 72% of emissions across the countries, followed by CH₄ at 20% and N₂O at 8%. CH₄ and N₂O emissions from AGB loss are minimal (10%) and are linked to biomass burning.  However, these emissions from peat soils accounted for nearly half of soil emissions. Approximately 90% of soil emissions originated from peat burning. In Indonesia, Peru, and DRC, emissions from AGB, peat decomposition, and peat burning combined in the year of disturbance (2020) were 19–20 times higher than those in 2020 post-disturbance emissions from peat decomposition. This implies that cumulative post-disturbance emissions from peat decomposition will take nearly two decades to reach the emissions released in the year of disturbance from all three sources combined.  Our findings provide valuable insights for designing policy measures to manage emissions from various drivers and sources in these countries. These insights are also useful for supporting country commitments to inform driver-specific emissions from peat forests to international platforms such as the Paris Agreement.     

How to cite: Nesha, K., Herold, M., Reiche, J., Hergoualc'h, K., and Swails, E.: Peat forest disturbances in tropical regions: direct drivers and GHG emissions, EGU General Assembly 2025, Vienna, Austria, 27 Apr–2 May 2025, EGU25-12679, https://doi.org/10.5194/egusphere-egu25-12679, 2025.

Peatlands are globally significant carbon reservoirs, with the potential to either mitigate or exacerbate climate change. However, compared to high-latitude peatlands, low-latitude peatlands have received relatively little attention and remain poorly understood. In this study, we investigated peatlands from various regions of China, classifying peat types and analyzing bulk density, carbon and nitrogen content, organic carbon fractions, microbial community composition, and other parameters across different peat depths. Several proxies exhibited clear patterns along the depth gradient. Using the AMS 14C dating method, we observed substantial spatial variations in the long-term carbon accumulation rates of these peatlands. In future analyses, the measured peat properties will be integrated with carbon accumulation data to further elucidate these dynamics.

How to cite: Zhang, H.: Peat properties and long-term carbon accumulation rates in regional peatlands of China, EGU General Assembly 2025, Vienna, Austria, 27 Apr–2 May 2025, EGU25-14103, https://doi.org/10.5194/egusphere-egu25-14103, 2025.

Climate warming may increase the water table depth (WTD) and alter ecosystem functions like carbon sequestration and greenhouse-gas fluxes in northern peatlands. There are two fundamentally different trajectories towards increase of WTD, however, that can have contrasting impacts: 1) a regressive process resulting from lowering of water level, and 2) a progressive process of increased growth above water level of mosses, both of which can result in the increase of WTD. The common expectation stated in peatland studies of drying of peatlands in response to climatic warming, and of the consequent threat to peatlands’ carbon sink, manifests the regressive drying scenario. In contrast, the general succession pattern of the historical development of contemporary raised bogs represents the progressive drying scenario of the ‘hydrosere’. The fact that both wet and dry peatland types and microforms are found over a wide range of climate conditions across the distribution range of peatlands underlines that peatland wetness is not strictly dictated by climate. Instead, vegetation dynamics, catchment and basin conditions, historical legacy of the peat formations, and climate interact to form different peatland states with their characteristic hydrological cycle and WTD. It is important to recognize the differences of regressive and progressive drying trajectories and events, as the implications to ecosystem functions are markedly different and partly opposite. At present, these contrasting scenarios are not recognized in the use of palaeoecological proxies, which limits our understanding of past climate responses of peatlands. Furthermore, most experimental treatments of ‘drying’ impacts on peatlands represent the regressive drying scenario and, hence, fail to indicate responses of potentially progressive development. I present alternative models of regressive and progressive ‘drying’ and demonstrate their different implications to ecosystem functions and assess verified example cases of both scenarios. Examples of progressive drying include the increase of WTD following the fen-bog transition in boreal aapa mires and in effect of moss growth with Sphagnum cultivation and peatland restoration.

How to cite: Tahvanainen, T.: Regressive and progressive scenarios of ’drying’ have opposite implications to ecosystem functions in northern peatlands, EGU General Assembly 2025, Vienna, Austria, 27 Apr–2 May 2025, EGU25-14909, https://doi.org/10.5194/egusphere-egu25-14909, 2025.

EGU25-14921 | Posters on site | BG3.26

The combined effect of drainage density, land cover, and ENSO status on fire occurrence in tropical peatlands 

Resti Salmayenti, Andrew Baird, Joseph Holden, and Dominick Spracklen

Forested area has decreased while agricultural area and degraded lands have expanded in the Indonesian peatlands of Sumatra and Kalimantan over the past few decades. The expansion of agricultural lands followed by construction of drainage (canal) infrastructure affects peatland hydrology and fire risk. This study examined how drainage density affects fire occurrence (hotspot density) using the Visible Infrared Imaging Radiometer Suite dataset in the Indonesian peatlands of Sumatra and Kalimantan across a range of climatic conditions and land cover types. During 2013-2017, our study shows a greater hotspot density in peatlands with canals compared to undrained peatlands. Largest differences are found in forest by a factor of 13.3, followed by degraded land (7.6), cropland (5) and plantation (2.6) during the ENSO-neutral year of 2013. Hotspot density in low to moderately drained peatlands increases with drainage density with high correlation (r value 0.97, 0.96, 0.94, and 0.67 in forests, degraded lands, croplands and plantations respectively) in 2013. However, as El Niño commenced, the impact of drainage density on hotspot density weakened. Fires were widespread in undrained peatlands especially in the prolonged drought of the strong El Niño in 2015. In highly drained peatlands where plantations dominated, fewer fires occurred than on moderately drained peatlands, which could be explained by various factors including management practices and peat loss. A multiple regression model, incorporating factors of ENSO status, land cover types and drainage density explains 67% of the variability in hotspot density. Our results support the strategy of fire control and peat restoration, especially in unmanaged degraded peatlands.

How to cite: Salmayenti, R., Baird, A., Holden, J., and Spracklen, D.: The combined effect of drainage density, land cover, and ENSO status on fire occurrence in tropical peatlands, EGU General Assembly 2025, Vienna, Austria, 27 Apr–2 May 2025, EGU25-14921, https://doi.org/10.5194/egusphere-egu25-14921, 2025.

EGU25-16312 | Orals | BG3.26

Carbon Storage and Accumulation in Pyrenean Peatlands: Assessing Their Potential as Climate Mitigators 

Carolina Olid, Marta Escuer-Arregui, Aaron Pérez-Haase, Violeta Martinez-Amigo, Josep Maria Ninot, Olga Margalef, Sara Marañón, and Xavi Domene

Peatlands are critical ecosystems for climate change mitigation due to their substantial soil organic carbon (C) stocks, which have accumulated over millennia. Although they cover only 3% of the Earth's land surface, peatlands store a third of the world's soil C, exceeding the C stored in forests and the atmosphere combined. However, these ecosystems are highly sensitive to climate change and human activities, which threaten their ability to function as net C sinks.

The Pyrenean peatlands, located at the intersection of Euro-Siberian and Mediterranean bioclimatic zones, are particularly vulnerable. Over the last 50 years, the Pyrenees have experienced a 1.2°C increase in average temperature and a significant reduction in snow cover, both of which are likely to affect plant community composition and accelerate peat decomposition, with uncertain consequences for C dynamics. Despite their ecological importance, Pyrenean peatlands remain understudied, with critical gaps in our knowledge of their extent, C content, and response to climate pressures, particularly in terms of C accumulation.

To fill these gaps, we quantified C stocks and the net C balance (net ecosystem production) in three peatlands located in the Catalan Central Pyrenees. By combining peat depth measurements, kriging interpolation, C content analysis, and 210Pb-age modelling, we estimated C stocks, C inputs, decomposition rates, and C accumulation rates over the past century in these systems. To provide new insights into the influence of vegetation in C accumulation, we accounted for plant community heterogeneity by differentiating between peatland habitats when estimating C fluxes. Results showed that short-term C accumulation rates ranged from 0.56 to 2.7 g C m-2 yr-1, with an average of 1.1 g C m-2 yr-1. The C stored in these peatlands over the past 40 years varied from 4.8 to 7.0 kg C m-2, highlighting a strong dependence on plant community composition.

Our results improved our understanding of how vegetation variability influences C accumulation in peatlaands, allowing for more precise scaling of C stocks and net C balance. This contributes to a broader understanding of C dynamics in alpine peatlands, highlighting their current and future role in climate change mitigation. These insights provide a scientific basis for the development of conservation and management policies aimed to protect these unique ecosystems, ensuring their continued contribution to both climate change adaptation and mitigation efforts.

How to cite: Olid, C., Escuer-Arregui, M., Pérez-Haase, A., Martinez-Amigo, V., Ninot, J. M., Margalef, O., Marañón, S., and Domene, X.: Carbon Storage and Accumulation in Pyrenean Peatlands: Assessing Their Potential as Climate Mitigators, EGU General Assembly 2025, Vienna, Austria, 27 Apr–2 May 2025, EGU25-16312, https://doi.org/10.5194/egusphere-egu25-16312, 2025.

EGU25-17129 | ECS | Orals | BG3.26

Geomorphic control of peat age and extent in temperate floodplains 

Alexander James

The preservation and restoration of peatlands has not only ecological goals but is also seen as an important climate mitigation tool. Peat stored in temperate floodplains are key soil organic carbon (SOC) storage hotspots but the factors controlling alluvial peat distribution, and its evolution remain poorly understood. Nevertheless, in order to properly assess the carbon storage potential of restored alluvial peatlands, forecasting alluvial peat dynamics requires robust modelling tools which in turn require a sufficient understanding of the long-term evolution that present-day peatlands have undergone. This includes detailed info on its spatial pattern, age and factors controlling its preservation.  

Here, we present recently derived field and laboratory analysis data on two alluvial sites in contrasting environmental settings in Belgium. The valleys vary in geomorphic setting, plant ecology and past trajectories of human disturbance. In terms of fluvial energy, these sites vary between high-energy systems in the upland Ardennes to low-energy systems in lowland Flanders.  

The upland floodplain site carbon storage totals 548.1 Mg C/ha, of which 43% is in the form of peat soils. The lowland floodplain site carbon storage is 1425 Mg C/ha with peat providing 80% of the SOC stock. In comparison, non-floodplain soils in Belgian have an average carbon content of only 40 to 90 Mg C/ha for agricultural and forested areas, respectively, whereas for ombrotophic peat bogs on the nearby Hautes Fagnes plateau values between 176 and 856 Mg C/ha were reported [Li et al. 2024 https://doi.org/10.1016/j.geoderma.2024.117009]. Temperate floodplain environments thus store significant amounts of carbon rivalling extensive peat bogs in non-alluvial settings.

There is a striking variation in the age of the peat and carbon between both sites. The average age of carbon in the upland site is limited to only 300 years. This is due to recent re-wetting and rapid peat reformation, combined with its relatively recent initiation (1400–3800 cal. BP): higher energy conditions lead to more lateral channel activity removing previously formed peats. SOC was concentrated in the upper horizons and decreased with depth. In contrast, in the lowland site, the average age of stored carbon is 7500 years and SOC concentration decreases towards the surface due to recent drainage (last 100-200 years). Peat development here already started in the pre-Holocene (Bølling–Allerød 14690 – 12850 cal. BP, responsible for 11% of total carbon storage), temporarily stopped in the Younger Dryas, and resumed in the Preboreal. Lateral channel activity is limited in these low energetic environments preserving older peats.

The differences between these sites have significant implications for carbon stock accounting and management. In areas storing ancient (pre-Holocene) carbon, environmental changes can release large carbon reserves which cannot be replaced, unlike agricultural or forested areas that maintain a more dynamic equilibrium. In contrast, the recently re-wetted site demonstrated the rapid carbon-capturing capability of reviving an acrotelm layer.  These detailed data will be complemented with data from nine additional sites and used to calibrate long-term alluvial peatland models required to identify management and governance options for SOC-rich floodplains.

How to cite: James, A.: Geomorphic control of peat age and extent in temperate floodplains, EGU General Assembly 2025, Vienna, Austria, 27 Apr–2 May 2025, EGU25-17129, https://doi.org/10.5194/egusphere-egu25-17129, 2025.

EGU25-17600 | ECS | Orals | BG3.26

Holocene geoecohydrological floodplain dynamics in NE Belgium: regional drivers of local change 

Renske Hoevers, Nils Broothaerts, and Gert Verstraeten

During the Late Holocene, many lowland river systems in temperate Europe transformed from multichannel rivers in densely vegetated peatlands to single-channel, meandering rivers with overbank deposits in more open floodplains. While this transformation in floodplain geomorphology, ecology, and hydrology (i.e. geoecohydrology) is well recognized, its timing varies significantly both within and between different river catchments. To unravel whether the observed differences in floodplain response are due to differences in the timing and nature of the driving forces or to differences in sensitivity to them, we compare long-term and large-scale reconstructions of geoecohydrological floodplain dynamics and of (climatic and anthropogenic driven) land cover change for two contrasting regions: the central Belgian loess belt and the sandy Campine region.

Using a combination of cluster analysis, ordination and Ellenberg indicator scores on a large multi-proxy and multi-site dataset, we identified key trends in the past geoecohydrological evolution of northeastern Belgian floodplains. These trends are largely determined by changes in floodplain wetness, which can in turn be linked to fluctuations in upland forest cover. The Early and Late Holocene floodplain transformations correspond with the respective increases and decreases in upland forest cover in the vicinity of the sites, largely determining the water availability in the river catchments and thereby their local geoecohydrological conditions. Initially, these evolutions were driven by climate, but during the Middle- and especially Late Holocene, they became increasingly influenced by anthropogenic impact, causing the evolutions in the two studied regions to diverge. While floodplains with active peat growth are still found in the sandy Campine region at present, they have become rare in the central Belgian loess belt due to the combination of a higher degree of human impact and a higher soil erodibility in this area. Despite the considerable spatiotemporal variability of the floodplain transformations, we observe a trend toward faster floodplain responses to upland land cover changes over time, likely related to the growing hillslope-floodplain connectivity.

How to cite: Hoevers, R., Broothaerts, N., and Verstraeten, G.: Holocene geoecohydrological floodplain dynamics in NE Belgium: regional drivers of local change, EGU General Assembly 2025, Vienna, Austria, 27 Apr–2 May 2025, EGU25-17600, https://doi.org/10.5194/egusphere-egu25-17600, 2025.

EGU25-18106 | ECS | Posters on site | BG3.26

Fire History in Guyanese Peatlands: Insights from Charcoal and Radiocarbon Data 

Audra Swan, Yarin Tatiana Puerta Quintana, Petr Kuneš, Kaslyn Holder-Collins, Seon Hamer, Amanda Mateo Beneito, Ian Lawson, Katherine Roucoux, and Adam Hastie

Tropical peatlands are one of the most carbon-dense ecosystems on Earth. However, their long-term resilience to climate and environmental changes, including fire events, remains poorly understood and is understudied compared to boreal and temperate peatlands. This study represents the first palaeoenvironmental research conducted on the peatlands of Guyana, addressing a critical knowledge gap in understanding the long-term dynamics of tropical peatland ecosystems in this region. Further knowledge of these dynamics is essential for understanding the vulnerability of these ecosystems in the face of climate change and increasing anthropogenic disturbances.

This study investigates the fire history of peatlands in Guyana by analysing charcoal and radiocarbon data from two peat cores. Fieldwork involved the collection of cores from various sites in Guyana, representing different hydrological and vegetation conditions. Charcoal analysis is being conducted to quantify fire events, identifying both their frequency and intensity over time. Radiocarbon dating has been used to establish basal dates of peat accumulation in the two cores, of 970 and 6450 years. Higher resolution radiocarbon dating is being used to establish a chronological framework for fire episodes, enabling the reconstruction of long-term fire history. Complementary analyses, including organic matter characterisation through thermogravimetric analysis, provide additional context on how fire events may have influenced peat composition and carbon storage. 

Preliminary observations suggest the presence of charcoal-rich layers within the peat cores, indicating continued fire activity over time with varying intensity. These layers vary between the two sites, suggesting localised differences in fire history. These are potentially driven by differing vegetation types, hydrological conditions, or human influence. By the time of conference, we anticipate presenting a timeline of fire episodes, linked to rates of peat accumulation and potential environmental drivers such as shifts in climate or human land use.

This research provides critical insights into the role of fire in tropical peatland development, offering a unique perspective on the interactions between fire, carbon accumulation, and ecosystem dynamics in this under-researched region. The findings have significant implications for the conservation and management of tropical peatlands, emphasising the need to consider historical fire regimes when predicting future ecosystem resilience/vulnerability. Overall, this study contributes to the broader understanding of tropical peatlands as dynamic carbon reservoirs that are increasingly threatened by global environmental change.

How to cite: Swan, A., Puerta Quintana, Y. T., Kuneš, P., Holder-Collins, K., Hamer, S., Mateo Beneito, A., Lawson, I., Roucoux, K., and Hastie, A.: Fire History in Guyanese Peatlands: Insights from Charcoal and Radiocarbon Data, EGU General Assembly 2025, Vienna, Austria, 27 Apr–2 May 2025, EGU25-18106, https://doi.org/10.5194/egusphere-egu25-18106, 2025.

EGU25-18610 | ECS | Posters on site | BG3.26

Socio-economic benefits of starch crops for biobased plastics: comparison between cassava and sago in Indonesia 

Ida Bagus Gede Sutawijaya, Aritta Suwarno, and Lars Hein

Starch remains a popular raw material for biobased plastics. However, the rising demand for biobased plastics raises concerns about its supply and environmental sustainability due to the land required for starch production. In Indonesia, cassava starch is the primary raw material used in biobased plastic production. Sago, an underutilized paludiculture crop, is proposed as a sustainable alternative to cassava starch. In this study, we evaluated the socio-economic benefits of cassava and sago cultivation by examining their financial (farm-level and value-added) and societal impacts. Furthermore, we compared the competitiveness of sago and cassava to maize on mineral soils and oil palms on peatlands.
Our study results show that sago is financially less profitable than cassava per hectare for farmers. The net present value of sago cultivation on peatland is less than one-third of cassava farming on mineral soil. This lower profitability is primarily due to sago's low productivity and the long period required before the first harvest. However, when integrating societal benefits and environmental impacts, starch sourcing from sago is more socially beneficial than cassava, as it generates significantly lower CO2 emissions. Additionally, long-term sago cultivation can be substantially more profitable than cassava, considering no replanting is needed and optimal yield is achieved. Furthermore, sago offers broader advantages related to peatland restoration programs that support local economic activities, as it does not emit CO2 during cultivation nor require peat drainage.
This study concludes that as a paludiculture crop, sago can provide a viable feedstock for biomaterials while effectively supporting peatland restoration.

How to cite: Sutawijaya, I. B. G., Suwarno, A., and Hein, L.: Socio-economic benefits of starch crops for biobased plastics: comparison between cassava and sago in Indonesia, EGU General Assembly 2025, Vienna, Austria, 27 Apr–2 May 2025, EGU25-18610, https://doi.org/10.5194/egusphere-egu25-18610, 2025.

EGU25-19060 | Orals | BG3.26

GHG emissions (CO2, CH4 and N2O) from tropical peatland cropland drainage ditches  

Stephanie Evers, Thomas Smith, Michael Longden, Maria Nolan, Luke Andrews, Ryan Hoskin, Andrew Adams, and Sophie Checkland

Drainage of tropical agricultural peat has a significant impact on enhancing GHG emissions from oxidised soils. Across Malaysia and Indonesia for example, an estimated 16.6–27.9% of emissions come from peat soils with the conversion of peat swamp forest to oil palm plantation. While there is now a significant body of evidence demonstrating emissions from tropical peat soils under differing drainage regimes (especially for oil palm and acacia plantations), very little attention has been given to the emissions from the drainage networks associated with these complexes. Of these soil-based emissions, the majority of work has focused on CO2 and CH4 with minimal focus on N2O emissions. For drainage ditches there is an even greater knowledge gap. There are, to our knowledge, no studies exploring all three GHGs from agricultural drainage ditches in the tropics. Therefore, here we present data showing the first combined emission factors for all three GHGs derived from surveys over the dry season within smallholder agricultural systems (vegetable and oil palm) in Malaysia. These will be linked to water chemistry, flow rate and aquatic DOC variability. This work demonstrates the importance of inclusion of these emission factors in overall land use emissions reporting and in the management of the drainage ditches for emissions reduction.

How to cite: Evers, S., Smith, T., Longden, M., Nolan, M., Andrews, L., Hoskin, R., Adams, A., and Checkland, S.: GHG emissions (CO2, CH4 and N2O) from tropical peatland cropland drainage ditches , EGU General Assembly 2025, Vienna, Austria, 27 Apr–2 May 2025, EGU25-19060, https://doi.org/10.5194/egusphere-egu25-19060, 2025.

EGU25-19376 | ECS | Orals | BG3.26

Distinct recalcitrant and labile pools of organic matter in tropical peatlands: The effects of vegetation input and downcore degradation in the peat profile 

Mike Vreeken, Rebecca H. Peel, Yiming Zhang, Toby A. Halamka, Paola Alarcon-Prado, Megan N. Jenkins, Panteleimon Prokopiou, Juan C. Benavides, Angela V. Gallego-Sala, B. David A. Naafs, and Richard D. Pancost

Tropical peatlands contain 65-105 Gt of carbon and are one of the most vulnerable carbon stocks, currently under threat from anthropogenic exploitation and climate change. The stability and accumulation of the organic carbon stored in tropical peat systems, and its sensitivity to changing temperature and/or hydrology, is intrinsically linked to the organic matter (OM) character. Large surveys of OM composition suggest that it is more recalcitrant in tropical peatlands than temperate ones, because of the former’s relatively high aromatic content. However, the precursor aromatic-bearing macromolecules, such as lignin, are produced in different proportions by diverse plant communities, and are often not equally recalcitrant (i.e. syringyl vs guaiacyl-rich lignin); nor are they the only recalcitrant compounds. To predict tropical peat organic matter stability in the 21st century, both on a global scale and in individual peatlands, we need to properly characterise the complexity of the ‘recalcitrant’ carbon pool and how it varies across diverse peatland types.

In this study, we characterise bulk organic matter in plants, leaf litter, and peat depth profiles from a range of tropical (n = 7) and temperate (n = 1) peatland ecosystems. This characterisation is achieved primarily via Pyrolysis Gas Chromatography Mass Spectrometry (Py-GC-MS), complemented by Fourier-Transform Infrared Spectroscopy (FTIR). Our results show that each site exhibits distinct pools of putatively labile and recalcitrant (plant) organic matter, with both shared and distinct downcore degradation features. For example, all tropical sites exhibit a downcore enrichment in lignin, but that is not evident in the temperate site which exhibits little downcore change in composition – a difference that likely is driven by the intense degradation in the tropics at high temperatures. Some sites show a shift with depth from the preferential degradation of hemicellulose and cellulose to primarily cellulose degradation. This regime may promote carbon stability at depth, although notably a putatively “labile” pool of carbohydrate-rich OM persists at depth in all sites. The diversity in the chemical properties of these carbon pools between peatland ecosystems could explain the variability in peat accumulation and stability.

How to cite: Vreeken, M., Peel, R. H., Zhang, Y., Halamka, T. A., Alarcon-Prado, P., Jenkins, M. N., Prokopiou, P., Benavides, J. C., Gallego-Sala, A. V., Naafs, B. D. A., and Pancost, R. D.: Distinct recalcitrant and labile pools of organic matter in tropical peatlands: The effects of vegetation input and downcore degradation in the peat profile, EGU General Assembly 2025, Vienna, Austria, 27 Apr–2 May 2025, EGU25-19376, https://doi.org/10.5194/egusphere-egu25-19376, 2025.

EGU25-19667 | ECS | Posters on site | BG3.26

Simulation of peat accumulation dynamics: Insights from a Pole Forest and Palm Swamp in Amazonia 

Yarin Tatiana Puerta Quintana, Ian Lawson, Stephen Frolking, Greta Dargie, Euridice Honorio, and Adam Hastie

Tropical peatlands are among the most carbon-dense terrestrial ecosystems, but we lack an understanding of their sensitivity to environmental change. Dynamic peat models provide a way to understand the tipping points in peatland formation, and can be constrained using a palaeoecological approach, namely the peatlands' successional stages of development identified through peat core (pollen) analysis. 

Using the 1D-HPMtrop dynamic peat model we simulate the peat accumulation process in two ecosystems of the Peruvian Amazon: a Pole Forest (PF) (7809-cal yr BP) and Palm Swamp (PS) (1215-cal yr BP), parameterized using net primary productivity (NPP) and decomposition rate (kexp) data from field plots. We incorporate a novel concept of palaeoecological period within the existing model code (derived from pollen diagrams at the two sites). Period-specific parameters were derived based on the assumption that current ecosystem parameters could represent similar conditions in the past and the calibration of sensitive variables to reflect these conditions accurately.  

This implementation enhances the HPMtrop structure, making it a more flexible model capable of generating age-depth curves based on period-specific parametrization. The curves can be compared with the reference age-depth curve derived from radiocarbon dating. Therefore, it is important to understand the nature of the ecosystem in each period or stage, including the parameters associated with each ecosystem type and the driving conditions. A reliable simulation of the peat-depth curve enables sensitivity analysis, allowing us to develop hypotheses about changes in peat accumulation under changes in key parameters.  

We vary key drivers and parameters including anoxia rate, NPP, kexp, and precipitation to understand the vulnerability of these two tropical peatlands to environmental change. We find highly variable sensitivity to different parameters with NPP being the most influential variable. The impact also varies in magnitude between PS and PF ecosystems. These ecosystems face a variety of threats, and our results could potentially be used to inform conservation and management strategies in some of the most carbon-dense ecosystems on Earth.

How to cite: Puerta Quintana, Y. T., Lawson, I., Frolking, S., Dargie, G., Honorio, E., and Hastie, A.: Simulation of peat accumulation dynamics: Insights from a Pole Forest and Palm Swamp in Amazonia, EGU General Assembly 2025, Vienna, Austria, 27 Apr–2 May 2025, EGU25-19667, https://doi.org/10.5194/egusphere-egu25-19667, 2025.

EGU25-20952 | Orals | BG3.26

Holocene peatland palaeoclimate archives and aeolian dust deposition 

Paul Hughes, Dmitri Mauquoy, Tim Daley, Helen Mackay, Gunnar Mallon, and Alistair Monteath

The reconstruction of past water table levels in ombrotrophic peatlands is a long-established method for studying past regional hydroclimatic conditions. Peat strata are typically investigated for biological (e.g. plant macrofossils, testate amoebae, pollen) and geochemical (e.g. peat decomposition products and water isotopes) evidence to reconstruct bog surface wetness (BSW) at individual sites or to reconstruct the isotopic qualities of the precipitation that mire plant species used to synthesise plant tissues. Integration of BSW records across regions is then used to understand the temporal and spatial patterns of regional hydroclimatic variability. However, in recent years there has been increasing recognition that internal processes in the peatlands themselves and allogenic factors, such as mineral dust deposition and other forms of aerial pollution, could confound attempts to produce a clear picture of past hydroclimatic variability from peatlands. This study explores the impact of wind-blown mineral deposition on bog functioning in both high deposition environments (Japan and UK) and in a low deposition region (Northern Newfoundland) to understand how these inputs might impact possible climate signals preserved in raised peat strata. The examination of this ‘dust gradient’ shows that there may be multiple climate-driven signals in peat and that the contribution of long distance aeolian transport can be discerned when local inputs are minimal.

How to cite: Hughes, P., Mauquoy, D., Daley, T., Mackay, H., Mallon, G., and Monteath, A.: Holocene peatland palaeoclimate archives and aeolian dust deposition, EGU General Assembly 2025, Vienna, Austria, 27 Apr–2 May 2025, EGU25-20952, https://doi.org/10.5194/egusphere-egu25-20952, 2025.

EGU25-21417 | ECS | Orals | BG3.26

Multiproxy Records of Holocene Peatland Dynamics in Finland and European Russia 

Daniel Coathup, Dmitri Mauquoy, Maarten Blaauw, and David Muirhead

Northern (mid to high latitude) peatlands contain 90% of the global peatland carbon stock, yet the persistence of their carbon sequestration is uncertain in the face of a rapidly changing climate. Rising atmospheric temperatures and shifting precipitation patterns threaten to deepen peatland water tables, exposing peatland organic matter to prolonged oxygenation, increased microbial decomposition, and greater fire risk. Yet, alleviations of limitations on ecosystem productivity may increase peatland accumulation in the colder high latitudes and propel the northwards expansion of Sphagnum. In boreal northeastern Europe, Finland and European Russia contain vast peatland expanses, but questions remain concerning their long-term dynamics in response to climate. This is particularly true for European Russia, which remains severely understudied for multiproxy, palaeoecological investigations. However, gaps in our knowledge still remain for peatlands in Finland, particularly concerning their sensitivity to past climates and their long-term fire dynamics.

 This study aims to rectify these knowledge gaps through a multiproxy, palaeoecological approach that investigates three representative mire types for the boreal region; a high latitude fen (Apatity) on the Kola peninsula, a continental raised bog (Koporskiy Mokh) in European Russia, and a southern boreal bog (Kaurastensuo) in southern Finland. To achieve this, a suite of established (plant macrofossils, testate amoebae, pollen, Cladocera, charcoal, decomposition indices) and emergent (Raman spectroscopy, testate amoebae functional traits) palaeoecological techniques were combined with well-resolved, 14C-derived Bayesian age-depth models.

The high-latitude fen record from Apatity showed greatly reduced carbon sequestration in colder regional climate periods, with a transition to Sphagnum dominance over recent centuries promoting rapid peat accumulation. Novel applications of Raman spectroscopy in tandem with multiproxy records revealed the severe impact of fire on continental bogs at Koporskiy Mokh, resulting in greatly reduced carbon stocks over an 8000-year period through persistence of a bog pool. Hydrological reconstructions at Kaurastensuo displayed clear identification of a solar forcing-induced prolonged and pronounced wet shift at 2.8 cal. yr. BP, mirroring records from northwestern Europe. In this true raised bog, any deviations to surface-level water tables, or towards slight drying, both appear to exhibit clear reductions in rates of carbon sequestration. These results suggest support for an increased high-latitude carbon sink with warming, but provide concern for the impact of deepening water tables on southern boreal bogs, and for heightened fire risk in the more continental peatlands of European Russia.

How to cite: Coathup, D., Mauquoy, D., Blaauw, M., and Muirhead, D.: Multiproxy Records of Holocene Peatland Dynamics in Finland and European Russia, EGU General Assembly 2025, Vienna, Austria, 27 Apr–2 May 2025, EGU25-21417, https://doi.org/10.5194/egusphere-egu25-21417, 2025.

Grasslands are sink for 34% of global terrestrial carbon (C), which is crucial for many ecosystem functions such as herbivory and climate regulation. Almost 89% of this C is deposited in the soil under the influence of different management activities. However, the soil C content undergoes changes owing to organic or inorganic fertilizer supplementation. In the last 50 years, the use of synthetic fertilizers has increased ~300% to meet global food requirements. The application of manganese (Mn) can remove carbon from soil, due to its oxidizing ability and decomposition of plant litter in grasslands. Magnesium (Mg) on the other hand adds C to the soil in the form of plant biomass production. However, the supplementation of nutrients can also result in greenhouse gas (GHG) emissions. Globally, 20-29% of GHG emissions are contributed by food systems, and ~85% of the total food system emissions are due to agricultural practices. In China, the northwestern part is mainly grasslands supporting the livelihoods of many people through grazing. The region, however, is mostly dryland. Drylands are typically considered sinks of methane (CH4) due to the oxidation of atmospheric CH4 by methanogens in dry soils. Conversely, nitrogen dioxide (N2O) emission from inorganic fertilizers can contribute to an increase in its emission. Similarly, soil respiration, plant respiration, soil moisture, temperature, and grazing can lead to increased CO2 emissions. Hence, to answer the changes in soil C:N ratio, specifically under inorganic fertilizer applications, we designed an experiment in the typical steppe of China. The experiment includes two factors i.e., grazing and inorganic fertilizer application with three Mn (2, 4 & 6 Kg Ha-1) and two Mg (10 & 20 kg Ha-1) application levels. The study was conducted from 2023-2024 at the Huanxian Grassland Agriculture Trial Station of Lanzhou University in Huan County, Eastern Gansu Province, China (37.12°N, 106.84°E; 1650 m), and important plants, soil and GHG parameters were recorded throughout the growth season (May to mid-September) in both years in a natural grassland ecosystem. The initial findings of the community aboveground biomass (AGB) depict mostly a 5-8% increment in the case of a mixture of Mn and Mg under grazed paddocks with 22-28% more litter quantity at 6 Kg Ha-1 of Mn application in the mixture; however, in fenced paddocks with no grazing treatments, standalone applications of Mn produced ~22% more AGB with 40-45% more litter at 2 Kg Ha-1 dose of manganese while 30% less litter at 6 Kg Ha-1 of Mn applications. It suggests that grazed paddocks under low and medium dosages of Mn in a mixture can effectively reduce litter from the previous year. However, in ungrazed paddocks, only the Mn application is suitable for the effective reduction of litter at higher doses while maintaining higher productivity. 

How to cite: Ahmad, G., Arshad, A., and Fujiang, H.: Effects of grazing and mineral fertilizer use on plant productivity, soil C:N ratio and GHG emissions in a typical Steppe, China, EGU General Assembly 2025, Vienna, Austria, 27 Apr–2 May 2025, EGU25-900, https://doi.org/10.5194/egusphere-egu25-900, 2025.

Plant mediated fluxes of trace gases, such as methane and nitrous oxide, are potentially important components of the greenhouse gas budget in many ecosystems. Measurement of these fluxes is possible through a variety of methods that operate over a range of spatial scales. For measurements constrained to the canopy scale, use of large (one to a few cubic meters in volume) closed-transient chambers has been common. Lack of a single source manufacture for all components necessary for this measurement, however, has meant that historically canopy scale trace gas flux measurements have required engineering effort on the part of the researcher to achieve. This has ranged from researcher-built measurement systems where some to all components, beyond the gas analyzer(s), were custom designed and built by the researcher. While this has spurred innovation advancing this area of research, the lack of standardized tools and a data processing platform has been a key source of uncertainty in these measurements. It has also meant that these measurements have been limited to only research programs with adequate engineering resources to construct and operate such a measurement system. Here we describe integration of two different commercially available systems to provide a complete off-the-shelf solution for canopy scale trace gas flux measurement. The combined system integrates a large canopy chamber (Eosense, eosAC-LT) with a gas sampling/analysis/data processing system (LI-COR, LI-8250, LI-78xx and SoilFluxPro). We demonstrate both hardware and software integration, including data processing, and performance of the combined measurement system.

How to cite: Hupp, J., Nickerson, N., Creelman, C., and Vath, R.: Moving towards commonality: An integrated chamber, gas sampling and data processing system for canopy scale measurements of trace gas fluxes using only commercially available components., EGU General Assembly 2025, Vienna, Austria, 27 Apr–2 May 2025, EGU25-2177, https://doi.org/10.5194/egusphere-egu25-2177, 2025.

Measurements of soil trace gas fluxes are crucial for understanding their atmospheric budgets and assessing the impacts of land use and management practices on these budgets. Automatic chambers coupled with sensitive gas analyzers offer valuable insights into the temporal and spatial variability of trace gas fluxes, advancing our understanding of the mechanisms governing these emissions.

Recent developments in “plug-and-play” automatic chambers, equipped with built-in programs for flux calculation, have simplified soil flux measurements. However, before these new instruments can be effectively utilized for flux analysis, it is essential to fully understand the data they produce.

In this study, we used an array of seven automatic chambers coupled to two infrared gas analyzers (IRGA) to measure soil fluxes of three major greenhouse gases: carbon dioxide (CO₂), methane (CH₄), and nitrous oxide (N₂O) in a Negev Desert of Israel. Measuring soil fluxes in this environment poses significant challenges, including extreme temperatures (reaching ~60 °C during dry summers and freezing during winters), dust and rainstorms, and very low fluxes approaching the detection limits of state-of-the-art instruments.

To calculate fluxes, we developed an in-house program for flux analysis capable of handling data from multiple sensors connected to automatic static chambers. We compared this program's performance with the manufacturer-supplied software. Additionally, we created an empirical method to assess the limit of detection (LOD) for measured fluxes and compared these empirical LODs with calculated values.

We found that the measured LOD was ~1000 times larger than the calculated LOD, with the discrepancy primarily stemming from minor pressure fluctuations near the soil surface. After applying appropriate corrections for LOD, we observed the temporal variability of CH₄, N₂O, and CO₂ fluxes from desert soils with varying carbon (C) content.

Surprisingly, while N₂O fluxes were effectively zero and CO₂ emissions exhibited a diurnal cycle peaking around noon, CH₄ fluxes were consistently positive (indicating net emissions to the atmosphere). These CH₄ emissions correlated with soil C content but not with soil moisture. Furthermore, emissions were notably higher during the dry summer compared to the wetter winter season. We attribute these unexpected CH₄ emissions to the photodegradation of soil C, driven by high soil temperatures and intense solar radiation during summer months.

How to cite: Gelfand, I. and Grabovsky, V. I.: Understanding Soil Trace Gas Flux Measurements with Automatic Chambers: System Design, Analyzers, Detection Limits, and Automated Data Analysis, EGU General Assembly 2025, Vienna, Austria, 27 Apr–2 May 2025, EGU25-2796, https://doi.org/10.5194/egusphere-egu25-2796, 2025.

EGU25-3204 | Posters on site | BG3.35

Drivers of volatile reactive soil emissions in the boreal forest 

Arnaud P. Praplan, Päivi Soronen, Enni-Liisa Pyysalo, Toni Tykkä, Steven J. Thomas, Isabel Díez-Palet, Miska Luoto, Heidi Hellén, and Aino Smolander

To study the drivers of volatile organic compound (VOC) emissions from boreal forest soil emissions, a study was conducted at two long-term and well-documented experiments in Finland. The first experiment, located in Karkkila (60.577°N, 24.261°E), is a spruce dominated stand with a nitrogen (N) fertilization experiment. The second experiment is in Taivalkoski (65.316°N, 28.161°E), where a tree species experiment is taking place with individual plots on which either silver birch, Scots pine, or Norway spruce were grown on originally similar soil.

Between May and October 2023, we collected soil VOC emissions on multi-bed adsorbent tubes at three locations in each plot (control and N-fertilized in Karkkila, and different tree species in Taivalkoski) about once a month, using an enclosure put on metallic frames placed at each sampling location at least one month before the first sampling. The collected emission samples were analysed with a thermal desorption gas chromatograph coupled to mass spectrometry (TD-GC-MS). The conditions both inside and outside the enclosure were recorded during sampling. Furthermore, the soil moisture was measured, and vegetation was visually assessed after each sampling. In addition, 15 to 20 soil cores were taken by a soil auger around 1-2m of each VOC sampling location during the early growing season, and the organic layer separated. Organic layer samples were combined to make one composite sample for each sampling location. Pretreatments and analysis were performed as described in Soronen et al. (2024) to derive soil parameters, including microbial properties. We also used a microdialysis sampling technique to determine induced diffusive fluxes of plant-available N compounds in the organic layer (Soronen et al., 2024). Fluxes were measured twice during the growing season at each site (early and late season).

For a given plot, emissions collected on the same day show similar composition with varying quantities. However, seasonal variations influenced the emissions’ composition, reflecting various direct and indirect underlying processes. Monoterpenes usually dominated the emissions, but chloroform was also emitted, especially from the N-fertilized plot. The relationships between stand properties, soil properties, environmental conditions, and VOC emissions were explored using multiple linear regression. We found that individual compounds are affected differently, emphasizing the importance of speciation. In general, the dominant tree species, moss cover, and shrub cover appear to be the vegetation factors most influencing VOC emissions. From soil properties, increasing dissolved organic carbon, organic matter, and the microbial biomass C-to-N ratio increased BVOC emissions.

Rising global temperatures lead to increased biomass in boreal areas (including litter and organic soil matter), an extended growing season, and heat stress. These alterations can affect vegetation, soil microbes, and forest floor plants, potentially causing changes in VOC emissions. The analysis presented here could be used in models of biogenic VOC emissions from boreal forest soils to investigate future scenarios.

Reference:

Soronen, P., Henttonen, H.M. and Smolander, A. (2024). Grey alder at the regeneration stage: Long-term effects on soil nitrogen and carbon pools and Norway spruce growth. Forest Ecology and Management, 554, 121686. doi:10.1016/j.foreco.2023.121686.

How to cite: Praplan, A. P., Soronen, P., Pyysalo, E.-L., Tykkä, T., Thomas, S. J., Díez-Palet, I., Luoto, M., Hellén, H., and Smolander, A.: Drivers of volatile reactive soil emissions in the boreal forest, EGU General Assembly 2025, Vienna, Austria, 27 Apr–2 May 2025, EGU25-3204, https://doi.org/10.5194/egusphere-egu25-3204, 2025.

EGU25-3658 | ECS | Orals | BG3.35

goFlux: A user-friendly tool for calculating GHG fluxes regardless of experience 

Karelle Rheault, Jesper Riis Christiansen, and Klaus Steenberg Larsen

Non-steady state chambers are widely used for measuring soil and ecosystem greenhouse gas (GHG) fluxes, but causes non-steady state diffusion between the soil air and headspace, leading to non-linear behavior of gas accumulation over time during enclosure. In turn, linear regression (LM), commonly used to estimate GHG fluxes, may underestimate the pre-deployment flux (f0). Many alternatives to LM have been developed to provide a more accurate estimation of f0, for instance the method of Hutchinson and Mosier (HM), which accounts for non-linearity in gas accumulation during enclosure. However, non-linear models may overestimate f0, due to exaggerated curvature at time zero. Users therefore need to make subjective choices between LM and HM, often based on visual inspection or unsuited statistical metrics, such as R2, which can have profound impacts on end results. High-precision greenhouse gas analyzers, often combined with automatic chamber systems, promise to broaden our understanding of soil-atmosphere feedback in time and space. On the other hand, such systems produce enormous amounts of data that need to be processed automatically and consistently for reliable outputs: for example, by automatically selecting the best flux estimate based on either linear or non-linear models. At the same time, the number of researchers measuring soil-atmosphere fluxes from chambers is increasing and there is a need to develop GHG flux analysis tools that transcends prior user experience and produce the highest-quality data.

We here present the goFlux R package designed as an all-inclusive flux calculation tool to calculate chamber GHG fluxes. goFlux allows for an easy import of raw data directly into R from a variety of instruments (LI-COR, LGR, GAIA2TECH, Gasmet, Picarro, Aeris and PP-Systems); simplifies identification of start and end times of individual flux measurements; quality checks the results based on objective criteria that goes beyond simply using R2; and provides the user with a recommendation for the best flux estimate. In summary, goFlux is meant to be “student proof”, meaning that no extensive knowledge or experience is needed for data import and pre-processing in R, and selecting the best flux estimate (LM or HM).

In goFlux, a central element is to constrain the maximal curvature allowed due to non-linearity, by using the parameter of kappa-max (k), first introduced in Hüppi et al. (2018). The advantage of the k parameter is that it is based on objective metrics of instrument precision and chamber specific dimensions and applying k essentially avoids excessive flux overestimation, especially for noisy or small fluxes which often appears in chamber-based applications. Furthermore, following flux calculation, the best flux estimate is selected based on a user selection of multiple statistical criteria, such as the g-factor (ratio between LM and HM flux estimates) and indices of model fit (e.g. MAE, RMSE, AICc). In addition, poor quality measurements may be flagged based on minimal detectable flux (MDF), an intercept out of bounds, or due to insufficient number of observations.

For more information, visit our webpage: https://qepanna.quarto.pub/goflux/

How to cite: Rheault, K., Riis Christiansen, J., and Steenberg Larsen, K.: goFlux: A user-friendly tool for calculating GHG fluxes regardless of experience, EGU General Assembly 2025, Vienna, Austria, 27 Apr–2 May 2025, EGU25-3658, https://doi.org/10.5194/egusphere-egu25-3658, 2025.

EGU25-4318 | ECS | Orals | BG3.35

Effect of soil water content on soil respiration sensitivity to temperature (Q10) in a temperate beech forest: overview of data processing from four years of observation with automatic chambers 

Julianne Capelle, Clément Bonnefoy-Claudet, Elodie Cognard, Jean Lévêque, Mathieu Thevenot, Julien Crétat, Philippe Amiotte-Suchet, and Olivier Mathieu

Soil respiration (RS) is the primary source of atmospheric carbon dioxide from terrestrial ecosystems. RS has been shown to respond exponentially to temperature, a relationship summarized by the Q10 parameter, which quantifies the increase in RS with a 10°C rise in temperature. Q10 depends on both temperature and soil water content, but the latter’s effect on RS and Q10 remains unclear, especially in temperate forests. Unlike soil temperature, whose influence on RS is widely accepted, soil water content’s effect is more site-due to multiple factors such as land use, soil and climate characteristics. Continuous, high-frequency field data are needed to improve understanding, but such data are challenging to collect in forest environments.

Here, we question the effect of soil water content on Q10 along the annual cycle in a temperate deciduous beech forest. Do soil water content levels have an impact on Q10 values? Is the relationship between soil water content and Q10 the same throughout the annual cycle? The experimental site is located in the Châtillonnais National Forest Park in the North-Eastern part of France. There, RS and environmental parameters are measured hourly using 4 automated chambers (LI-8100, LI-COR) since 2020 (4-year dataset). The forest has been protected from harvesting for over 30 years and is classified as an integral biological reserve.

The dataset includes over 145,000 RS measurements with about 6.1% missing data. After quality control and outlier removal, 92.7% of the data are used for analysis. For each hour, the mean RS is calculated by fitting exponential and linear models, with the best model selected based on AIC (ResChamberProc package in R developed by Wutzler T.). RS values are considered reliable when the coefficient of determination exceeds 0.9. Soil water content, measured near each chamber, shows high temporal consistency but high magnitude spread due to heterogenous soil conditions. To standardize, values are normalized by dividing each by the maximum recorded value, creating bins from 0 (dry) to 1 (wet).

We found that Q10 can only be calculated for spring and autumn (2.71 and 3.12 respectively) in our study site. During winter, low temperatures prevent meaningful Q10 calculation, while in summer, dry soil conditions limit results. A threshold analysis revealed that soil water content positively affects Q10 when it exceeds 40% of the maximum value. This indicates that RS is much more temperature-sensitive in wet than dry soils.

How to cite: Capelle, J., Bonnefoy-Claudet, C., Cognard, E., Lévêque, J., Thevenot, M., Crétat, J., Amiotte-Suchet, P., and Mathieu, O.: Effect of soil water content on soil respiration sensitivity to temperature (Q10) in a temperate beech forest: overview of data processing from four years of observation with automatic chambers, EGU General Assembly 2025, Vienna, Austria, 27 Apr–2 May 2025, EGU25-4318, https://doi.org/10.5194/egusphere-egu25-4318, 2025.

EGU25-5232 | Posters on site | BG3.35

How and how accurately can we measure soil O2-CO2 fluxes? 

Martin Maier, Ferdinand Schirrmeister, and Elad Levintal

Soil gas fluxes are an important signal for ecosystems and various soil functions, as soils can be both sources and sinks of greenhouse gases (GHG). Because of  this critical role, soil gas research has focused mainly on GHGs, while other important gas species have received much less attention. Soil O2 concentration is key to many soil processes, such as ammonification, nitrification and denitrification, and root growth. Studying the relationship between of CO2 and O2 exchange at the soil-atmosphere interface or within the soil profile would be key to better understanding these processes. Gas fluxes between terrestrial ecosystems or the soil surface and the atmosphere are typically measured using the eddy covariance approach (or related micrometeorological approaches), chamber-based measurements, or the flux gradient method. Knowing the precision of the individual sensors used in the methods, but even more so the overall uncertainty of a measurement method, including all steps from sensor to calculation is essential (e.g. the minimum detectable flux). Yet, it is a requirement that is rarely adequately assessed. While there are a variety of suitable CO2 sensors and setups commonly used for measuring CO2 fluxes in soil, the measurement of O2 fluxes in soil is still in its beginning.  

Our aim was 1) to develop a chamber method for online CO2 and O2 measurements and 2) to improve a soil gas profile probe for online CO2 and O2 measurements (Maier et al. 2024) to calculate the apparent respiratory coefficient (CO2 efflux divided by O2 influx). We used a multilevel O2-CO2profile probe with built-in online sensors based on the previously published design of an online CO2 sampler (Osterholt et al., 2023). For the chamber measurements, we used an automatic LI-COR chamber equipped with the same sensors and an additional AAB CO2 laser spectrometer. Extensive laboratory tests with a large sand column and controlled injections of CO2 and O2 were performed to test the effects of temperature and air pressure on the chamber system and the soil profile sampler. We present the results of these laboratory experiments, focusing on the technical performance of the measurement system and its impact on the uncertainty of the estimates of CO2 and O2 fluxes and the respiration coefficient.

Acknowledgements

This research was supported by the German Research Foundation (DFG, MA 5826/4-1 project number: 535470615)

Maier, M.; Osterholt, L.; Levintal: Development of an online O2-CO2 soil profile probe for flux estimations, EGU General Assembly 2024, EGU24-6777; https://doi.org/10.5194/egusphere-egu24-6777,  2024.

Osterholt, L.; Kolbe, S.; Maier, M. (2022): A differential CO2 profile probe approach for field measurements of soil gas transport and soil respiration #. In J. Plant Nutr. Soil Sci. 185 (2), pp. 282–296. DOI: 10.1002/jpln.202100155.

How to cite: Maier, M., Schirrmeister, F., and Levintal, E.: How and how accurately can we measure soil O2-CO2 fluxes?, EGU General Assembly 2025, Vienna, Austria, 27 Apr–2 May 2025, EGU25-5232, https://doi.org/10.5194/egusphere-egu25-5232, 2025.

EGU25-6082 | Posters on site | BG3.35

Measuring Gas Exchanges of Soil and Vegetation with Large, Transparent Gas Accumulation Chambers 

Nicholas Nickerson, Mara Taylor, Michelle Coleman, Chance Creelman, and Leah McCormick

Direct measurements of greenhouse gas exchange between the land surface and the atmosphere are critical in developing our understanding of the underlying biogeochemical processes and in parameterizing global climate models. Gas accumulation chambers are regularly used to make localized soil gas flux measurements and there are a variety of chamber implementations with a range of operational characteristics. One developing niche of applications is the use of tall transparent chambers with large surface areas, which enclose vegetation while allowing natural light in, facilitating the measurement of soil and vegetation net gas flux (i.e. NEE) in a way that many chamber designs don't allow. This direct measurement can be valuable in characterizing the flow of gases in an ecosystem without needing to resort to indirect measurements.

Despite the benefits of these types of measurements, chambers with a large volume require additional considerations to ensure high quality data is produced. The volume creates difficulties with adequately mixing gas within the chamber headspace to draw an accurate sample. Chamber transparency allows light in but acts as a greenhouse while the chamber is closed thereby increasing the internal temperature. Depending on the implementation, tall soil collars or chamber bases can additionally alter the natural turbulence and heat exchange in the boundary layer causing a buildup of gases and excess heat, which can lead to high humidity and condensation in the chamber headspace. In order to ensure accurate chamber-based measurements, these impacts must be considered and mitigated where appropriate.

Here, we use a variety of commercially available chamber configurations in addition to peripheral environmental measurements in order to understand their impact on flux measurements. We deployed three large footprint (52 cm diameter) chambers, with overall heights of 45 cm, 75cm, and 115cm, each on identical terrain. We present accumulation curves and flux data from these chambers, contextualized with soil and meteorological measurements, including an in-chamber temperature profile within the tallest chamber. Finally, we discuss how prominent the preceding factors are, the effect they have on chamber measurements, and how they can be accounted for to produce high quality data.

How to cite: Nickerson, N., Taylor, M., Coleman, M., Creelman, C., and McCormick, L.: Measuring Gas Exchanges of Soil and Vegetation with Large, Transparent Gas Accumulation Chambers, EGU General Assembly 2025, Vienna, Austria, 27 Apr–2 May 2025, EGU25-6082, https://doi.org/10.5194/egusphere-egu25-6082, 2025.

EGU25-6566 | ECS | Posters on site | BG3.35

Seasonal dynamics of Volatile Organic Compound Fluxes from Soil in the Amazon rainforest  

Johanna Schüttler, Giovanni Pugliese, Joseph Byron, Cléo Quaresma Dias-Júnior, and Jonathan Williams

Volatile organic compounds (VOCs) are important to atmospheric chemistry as they readily react with ambient oxidants, such as ozone (O3) and hydroxy radicals (OH) to produce particles, thereby influencing air quality, trace gas lifetimes and climate. The Amazon rainforest is the largest natural source of VOCs in the atmosphere, with net emissions resulting from a complex balance between sources and sinks across the different ecosystem compartments, such as the canopy and soil. The aim of this study was to characterize the seasonal dynamics of VOC fluxes from Amazon rainforest soil. The experiments were conducted at the Amazon Tall Tower Observatory research facility during four seasons: the dry-to-wet transition and dry season of 2023 ( with the latter being influenced by El Niño) and the wet and dry seasons of 2024.

Soil VOC samples were collected on sorption tubes from three manual steady-state soil chambers. The samples were analysed using thermal desorption-gas chromatography - time of flight mass spectrometry with a chiral column to further separate chiral terpenoids into their separate mirror image forms known as enantiomers. We focused on terpenoid species including isoprene, monoterpenes and sesquiterpenes.

Results showed that in all seasons the Amazon rainforest soil was a net sink for both isoprene (average flux of -12 nmol m-2 h-1) and its oxidation products methacrolein (average fluxes of -4 nmol m-2 h-1) and methyl vinyl ketone (-5 nmol m-2 h-1). In contrast, the Amazon rainforest soil was a source of sesquiterpenes with an average flux of 2 nmol m-2 h-1. The most abundant sesquiterpenes were β-Caryophyllene and α-Copaene. Monoterpene behaviour varied among species, time of day, season and rainfall events.

The highest VOC emissions from soil were observed during the El Niño-influenced dry season of 2023, likely driven by intense heat and drought stress, which significantly reduced soil microbial VOC uptake and increased VOC emissions from abiotic degradation processes. During the wet season and dry-to-wet transition season, the magnitude of the observed soil fluxes was smaller, indicating a more balanced state between uptake and emission processes, likely attributed to the restoration of the microbial uptake in the more humid soil.

How to cite: Schüttler, J., Pugliese, G., Byron, J., Quaresma Dias-Júnior, C., and Williams, J.: Seasonal dynamics of Volatile Organic Compound Fluxes from Soil in the Amazon rainforest , EGU General Assembly 2025, Vienna, Austria, 27 Apr–2 May 2025, EGU25-6566, https://doi.org/10.5194/egusphere-egu25-6566, 2025.

EGU25-6839 | ECS | Orals | BG3.35

Abiotic/biotic partitioning of soil CO2 flux in arid and hyper-arid soils 

Thi Thuc Nguyen, Nadav Bekin, Nurit Agam, and Elad Levintal

Resolving the role of arid and hyper-arid regions in the global carbon cycle and their influence on atmospheric CO2 concentrations remains a significant challenge, both theoretically and practically. Theoretical challenges stem from the widespread underestimation of these seemingly lifeless regions, while practical barriers arise from the logistical and financial limitations of conducting studies in hyper-arid soils. Although a few studies have quantified surface flux and net carbon sink in these areas, most lack continuous, long-term monitoring of soil CO2 concentrations and flux. As a result, our understanding of these regions is largely based on "snapshot" assessments, which may fail to capture their true role. Furthermore, even with knowledge of total flux, it remains a "black box" unless the contributions of biotic and abiotic mechanisms to CO2 fluxes are disentangled. In our study, CO2 sensors and automated flux chambers installed at subsurface and surface respectively, have been used to continuously monitor soil CO2 concentration and flux at arid and hyper-arid sites in the Negev Desert. Based on this data, we will conduct a CO2 source-sink assessment for each site. Biotic-abiotic partitioning analyses, utilizing modeling and isotopic tools will be used to further elucidate the sources driving CO2 fluxes in arid and hyper-arid environments. By identifying the distinct contributions of biotic and abiotic processes to CO2 flux, we can refine our understanding of the role arid and hyper-arid ecosystems play in the global carbon cycle and improve our predictions of how these ecosystems may respond to future climate change.

How to cite: Nguyen, T. T., Bekin, N., Agam, N., and Levintal, E.: Abiotic/biotic partitioning of soil CO2 flux in arid and hyper-arid soils, EGU General Assembly 2025, Vienna, Austria, 27 Apr–2 May 2025, EGU25-6839, https://doi.org/10.5194/egusphere-egu25-6839, 2025.

Climate change is expected to impact the methane budget of boreal peatlands, highlighting the need to understand the factors that influence methane cycling, including plant community structure. In northern peatlands, the majority of methane is transported through plants, and the magnitude of this process is strongly linked to plant community composition. This presentation explores the causes of spatial variability in plot-scale methane fluxes in a northern boreal rich fen. Methane fluxes were measured using the manual chamber technique in a context of fine-scale biomass variations in plant community compositions from 36 study plots over 232 days throughout a full year. We found a significant correlation between methane fluxes and a vascular plant cluster statistically dominated by the sedge Carex rostrata in year-round, snow-free and snow season. The biomass of vascular plants, as well as the ratio of vascular plant to bryophyte biomass, also significantly correlated with methane fluxes in year-round and snow-free season. By identifying vegetation-driven emission hotspots, these results can enhance efforts to upscale emission predictions and improve ecosystem-scale methane modelling initiatives. Thus, our findings provide valuable insights for predicting realistic future changes in peatland methane emissions throughout the year.

How to cite: Järvi-Laturi, E.: Plant community composition controls spatial variation in year-round methane fluxes in a boreal rich fen, EGU General Assembly 2025, Vienna, Austria, 27 Apr–2 May 2025, EGU25-8186, https://doi.org/10.5194/egusphere-egu25-8186, 2025.

EGU25-8726 | Posters on site | BG3.35

Expert survey shows needs for standardized data processing and process-level understanding of chamber flux data 

Claire C. Treat, Katharina Jentzsch, Lona van Delden, and Matthias Fuchs

Quantifying spatial heterogeneity is important for the accurate measurement of broader scale greenhouse gas fluxes and can be done with relatively low construction costs using manual chambers. Existing guidelines on chamber measurements promote more standardized measurement and processing techniques but the extent to which they are implemented within the flux community is unknown. We aimed to identify major differences between the approaches for chamber methane fluxes used by different researchers. We conducted an expert survey to collect information on chamber-based methane flux measurements, including field sites, research questions, measurement setups and routines as well as data processing and quality control of data. We received 36 responses from researchers in North America, Europe, and Asia which indicated that most, but not all, of the respondents use recommended chamber designs, such as airtight sealing, fans, and a pressure vent. In addition, we asked about data processing and quality control of chamber flux data, presented a standardized set of methane concentrations from observed flux measurements and used this information for flux calculations. The responses showed broad disagreement among the experts on the processes resulting in nonlinear methane concentration increases and how to treat many non-linear and low fluxes. Based on the expert responses, we estimated an uncertainty of 17 to 28% across flux measurements due to researcher-based differences: different researchers deciding differently on discarding vs. accepting a measurement and choosing different time periods within the same measurement for flux calculation. This highlights the need to understand drivers of the concentration patterns visible from high-resolution analyzers and to develop standardized procedures and guidelines for future chamber methane flux measurements.

How to cite: Treat, C. C., Jentzsch, K., van Delden, L., and Fuchs, M.: Expert survey shows needs for standardized data processing and process-level understanding of chamber flux data, EGU General Assembly 2025, Vienna, Austria, 27 Apr–2 May 2025, EGU25-8726, https://doi.org/10.5194/egusphere-egu25-8726, 2025.

EGU25-9268 | Posters on site | BG3.35

Using a Bayesian inference approach to assess the uncertainty in flux-gradient derived soil CO2 flux estimates 

Ferdinand Schirrmeister, Martin Maier, and Thomas Kneib

Gas fluxes between soil and atmosphere play a significant role as global greenhouse gas sinks or sources. Accurate estimation of these gas fluxes is challenging due to the heterogeneous nature of soil properties, dynamic environmental factors, and the complexity of measurement in soil systems. The flux-gradient method is a reliable approach for estimating CO2 gas fluxes. This method utilises Fick's first law of diffusion to calculate gas fluxes by analysing gas concentration profiles. The gas concentration gradient is multiplied with the apparent gas diffusion coefficient of the gas species in the soil. The estimation of the apparent gas diffusion coefficient is dependent on numerous parameters, including soil pore space and soil water content, which must be carefully measured or derived. These parameters typically cannot be measured at the exactly same location as not to interfere with the gas measurements. All these factors are subject to different uncertainties depending on the parameters and the measured soil location.

In order to address and comprehend the extent of these uncertainties, Bayesian inference was employed, as this methodology enables uncertainty to be measured through probability distributions with credible intervals as opposed to point estimates. Furthermore, Bayesian inference functions effectively with small datasets and permits the incorporation of prior knowledge, a factor which also benefits soil gas modelling.

We used a previously published dataset (Wordell-Dietrich et al. 2020) to estimate CO2 fluxes by using the flux-gradient method. The gas diffusion coefficient was derived through the use of a Bayesian inference model. The resulting data were then compared with chamber measurements and other modelling approaches.

Acknowledgment

Wordell-Dietrich, P.; Wotte, A.; Rethemeyer, J.; Bachmann, J.; Helfrich, M.; Kirfel, K.; Leuschner, C.; Don, A. (2020): Vertical partitioning of CO2 production in a forest soil. Biogeosciences, 17, 6341-6356. https://doi.org/10.5194/bg-17-6341-2020

How to cite: Schirrmeister, F., Maier, M., and Kneib, T.: Using a Bayesian inference approach to assess the uncertainty in flux-gradient derived soil CO2 flux estimates, EGU General Assembly 2025, Vienna, Austria, 27 Apr–2 May 2025, EGU25-9268, https://doi.org/10.5194/egusphere-egu25-9268, 2025.

EGU25-9854 | ECS | Posters on site | BG3.35

Continuous monitoring of greenhouse gas emissions from rice paddies using automatic flux chambers 

Hans Frederik Engvej Hansen, Klaus Steenberg Larsen, Allan Olesen, Henrik Christensen, Lara Melissa Frietzsche, Vu Duong Quynh, Mai Van Trinh, and Bo Elberling

Rice paddies are among the most important cultivated areas globally both in terms of food security and greenhouse gas (GHG) emissions. Rice paddies are estimated to contribute approximately 10% of anthropogenic CH4 emissions and are also potential hot spots for N2O emissions. However, emission estimates are highly uncertain as observational data consist primarily of manual, static closed chamber measurements combined with gas chromatography. This methodology is highly time consuming and sets limitations on the number of observations over time, which is problematic due to the highly variable temporal nature of both CH4 and N2O fluxes with respect to water table fluctuations and fertilisation. The temporal dynamics of CH4 and N2O emissions from rice paddies are therefore not well understood.

Here we present the methodology and initial results from a novel automatic chamber setup with continuous GHG measurements on rice paddies under varying agricultural practices, including water regimes. The concentrations of all three major GHGs, i.e. CO2, CH4 and N2O, are continuously measured using state-of-the-art automatic chambers operated in both light and dark mode. The automatic chamber setup is designed to accommodate changes in both water table, plant height and crop types. GHG fluxes are estimated using both linear and non-linear (Hutchinson and Mosier model) regression.

This setup will provide the most detailed GHG measurements on rice paddies to date and improve our understanding of the GHG dynamics on rice paddies under varying agricultural practices and water regimes.

How to cite: Hansen, H. F. E., Larsen, K. S., Olesen, A., Christensen, H., Frietzsche, L. M., Quynh, V. D., Trinh, M. V., and Elberling, B.: Continuous monitoring of greenhouse gas emissions from rice paddies using automatic flux chambers, EGU General Assembly 2025, Vienna, Austria, 27 Apr–2 May 2025, EGU25-9854, https://doi.org/10.5194/egusphere-egu25-9854, 2025.

EGU25-11759 | ECS | Posters on site | BG3.35

Aerobic methanotrophs in anoxic soils: comparing peatland, rice paddy and thawing permafrost methanotrophs and their respective metabolisms 

Sigrid van Grinsven, Andreas Kappler, and Eva Voggenreiter

Soil microbial communities often get sequenced using general primers that allow the detection of a wide range of microbial species. This sometimes leads to unexpected finds in sequencing data. We noticed the presence of sequences attributed to aerobic methanotrophs in multiple field sites. These were all carbon rich, water saturated, anoxic soils that were known for their high methane emission potential. Using qPCR, we found pmoA to be abundant deep in the anoxic layer of these soils. Although aerobic methanotrophs have been found in anoxic locations before, they are often dismissed as inactive or as purely a remnant of past oxic conditions. We aimed to discover whether these methane oxidizing bacteria could play a significant role in in situ methane oxidation and in mediating methane emissions.

Using samples from these locations, we created oxic enrichment cultures that rapidly became dominated by methanotrophic bacteria, the same that were detected in the initial anoxic soil sample sequencing results. These enrichment cultures were dominated by methanotrophs of the genera Methylobacter (thawed permafrost soil), Methylotetracoccus (rice paddy) and Methylovulum (alpine peatland). Although some species of these genera have been detected in anoxic locations before, and certain species are known to have the genetic capability to perform fermentation, it is unknown which electron acceptor these methanotrophs rely on in anoxic or hypoxic conditions. We perform culture experiments with iron, nitrate and organic compounds as electron acceptors, to elucidate the pathways used by these methanotrophs. We also added enriched methanotrophs to natural soil samples of the same locations, to test whether these methanotrophs were able to enhance methane removal from the original sampling locations.

How to cite: van Grinsven, S., Kappler, A., and Voggenreiter, E.: Aerobic methanotrophs in anoxic soils: comparing peatland, rice paddy and thawing permafrost methanotrophs and their respective metabolisms, EGU General Assembly 2025, Vienna, Austria, 27 Apr–2 May 2025, EGU25-11759, https://doi.org/10.5194/egusphere-egu25-11759, 2025.

EGU25-12003 | Orals | BG3.35

An automated time-integrating chamber system with offline gas analysis to monitor N2O fluxes and isotopic composition in agricultural ecosystems 

Christof Ammann, Lena Barczyk, Markus Jocher, Julius Havsteen, Joachim Mohn, and Yuqiao Wang

Static chambers are the predominating method for measuring N2O emissions from agricultural ecosystems and thus provide the basis for deriving corresponding emission factors. In order to obtain representative N2O emission values, long-term measurements (one to several years) are necessary that cover relevant short-term variations including pulse-like emissions after fertilizer application or rainfalls. This is often a problem for the widely used manual chamber measurements that are typically applied in weekly or fortnightly intervals. Fully automated chamber systems, on the other hand, can provide continuous measurements over longer time periods, but are cost-extensive as they require online (on-site) gas analysis.

To overcome this problem, we constructed an (non-steady-state) automated time integrating chamber system (ATIC) that can sample at intervals of a few hours but accumulates the flux signal over many chamber closure cycles. During each 15-min chamber closure phase, small air samples are collected every 3.5 min and accumulated in four different gas bags. After typically one week the gas bags are brought to the lab for analysis. The accumulated samples in the four bags represent a time-averaged concentration increase that is used to calculate weekly time-integrated gas emission fluxes. In addition, the system can be used for analyzing the isotopic composition of the emitted N2O in order to determine the underlying source process.

The ATIC systems, that can run on battery power, were successfully applied in two long-term field experiments (> 2 years) for N2O emission monitoring on grassland, as well as studying changes in emission fluxes and isotopic composition of urine patches over a few months. We will show the setup of the system, the quality control of the data and discuss the resulting N2O emission data and major contributing processes.

How to cite: Ammann, C., Barczyk, L., Jocher, M., Havsteen, J., Mohn, J., and Wang, Y.: An automated time-integrating chamber system with offline gas analysis to monitor N2O fluxes and isotopic composition in agricultural ecosystems, EGU General Assembly 2025, Vienna, Austria, 27 Apr–2 May 2025, EGU25-12003, https://doi.org/10.5194/egusphere-egu25-12003, 2025.

EGU25-12409 | ECS | Orals | BG3.35

Fluxible: an R package to calculate ecosystem gas fluxes from closed loop chamber systems in a reproducible and automated workflow 

Joseph Gaudard, Jonas Trepel, Hilary Rose Dawson, Brian Enquist, Aud H Halbritter, Michael Mustri, Pekka Niittynen, Paul Efren Santos-Andrade, Joachim P Topper, Vigdis Vandvik, and Richard J Telford

Gas fluxes measurements are widely used when assessing the impact of global change drivers on key aspects of ecosystem dynamics. In particular, gas fluxes help estimate the carbon balance of an ecosystem and the impacts of global changes. Ecosystem gas fluxes are typically calculated from field-measured gas concentrations over time using a linear, quadratic or exponential model and manually selecting good quality data. This approach is time consuming and prone to bias that can be amplified in further analyses, as well as presenting major reproducibility issues. The lack of a reproducible and bias-free approach creates challenges when combining global change studies to make biome and landscape scale comparisons.

The Fluxible R package aims to fill this critical gap with a workflow that removes individual evaluation of each flux, reduces risk of bias, and makes the process reproducible. Users set data quality standards and selection parameters as function arguments that are applied to the entire dataset. The current version of Fluxible provides flux calculation for a closed loop chamber system using linear, quadratic or exponential models. The latest update also includes an automated segmentation tool to process data from a leaky setup such as with flux tents, where leakage cannot be assumed negligible. This automated and fully reproducible segmentation tool is a major upgrade as it allows the use of the Fluxible workflow in setups that are prone to leaks or other disturbances that previously had to be taken care of manually.

The package runs the calculations automatically without prompting the user to make decisions, and provides plots for visual check and a quality summary of the dataset at the end of the process. These outputs make it easier to process large flux datasets and to integrate the package into a reproducible workflow. Using the Fluxible R package makes the workflow reproducible, increases compatibility across studies, and is more time efficient.

How to cite: Gaudard, J., Trepel, J., Dawson, H. R., Enquist, B., Halbritter, A. H., Mustri, M., Niittynen, P., Santos-Andrade, P. E., Topper, J. P., Vandvik, V., and Telford, R. J.: Fluxible: an R package to calculate ecosystem gas fluxes from closed loop chamber systems in a reproducible and automated workflow, EGU General Assembly 2025, Vienna, Austria, 27 Apr–2 May 2025, EGU25-12409, https://doi.org/10.5194/egusphere-egu25-12409, 2025.

EGU25-12472 | Posters on site | BG3.35

A Computational Tool for High-Frequency GHG Flux Analysis: Instantaneous and Diel Estimates from Automated Non-Steady-State Soil Chambers 

Michalis Omirou, George Themistokleous, Andreas Savvides, and Katerina Philippou

Non-steady-state chambers are commonly used to measure soil and manure emissions of CO2, CH4, and N2O. When paired with online gas analyzers, automated non-steady-state (a-NSS) chambers enable high-frequency monitoring of greenhouse gas (GHG) fluxes. Despite their advantages in capturing detailed emission patterns, these systems pose challenges in handling large datasets, performing complex flux calculations, and scaling results over time. This study introduces a computationally efficient algorithm designed to process continuous, high-resolution data from a-NSS chambers, providing instantaneous flux calculations and diel emission estimates. The algorithm was validated using field dataset, capturing simultaneous flux measurements for CO2, CH4, and N2O. High-frequency data collection allowed for the identification of episodic flux events. By employing shape-constrained additive models, the algorithm achieved median percentage deviations (bias) of -1.03% for CO2 and -4.34 % for N2O. Temporal upscaling from instantaneous to diel fluxes was performed using Simpson’s rule, ensuring accurate integration over time. This tool offers a rapid, reliable method for real-time flux computation, significantly improving GHG flux measurement accuracy and enhancing insights into the temporal variability of soil emissions.

How to cite: Omirou, M., Themistokleous, G., Savvides, A., and Philippou, K.: A Computational Tool for High-Frequency GHG Flux Analysis: Instantaneous and Diel Estimates from Automated Non-Steady-State Soil Chambers, EGU General Assembly 2025, Vienna, Austria, 27 Apr–2 May 2025, EGU25-12472, https://doi.org/10.5194/egusphere-egu25-12472, 2025.

EGU25-13457 | Posters on site | BG3.35

Recent advancements in empirical and model-based approaches for optimizing fit windows for closed-transient chamber-based soil trace gas flux and δ13C data 

Siqin He, Jason Hupp, Cara Lauria, Tessa Lingol, Sasha Reed, and Richard Vath

Soil trace gas flux rates derived from closed-transient chamber-based techniques rely on estimating the rate of change in gas concentrations prior to disturbance by the chamber. Several regression methods are available for estimating this rate of change, all of which require selecting a fitting window over which to apply the regression. Window selection has historically been subjective and reliant on expert knowledge, using information from only small subset of measurements to fit to a larger dataset. This somewhat arbitrary approach overlooks the influence of individual chamber and sampling location properties on the development of turbulence, as well as the unique transport characteristics of different trace gases. Here, we describe an empirical method for selecting the fitting window for an exponential regression model, based upon iterative analysis of within-chamber gas mixing dynamics. The method operates at a batch scale, incorporating data from every observation to determine the appropriate start and stop times for the fitting window of the larger dataset, using SoilFluxPro 5.2’s JavaScript console.

Chamber-based estimates of the stable carbon isotope ratio (δ13C) of soil-respired CO2, which utilize the Keeling mixing model, are also sensitive to the chosen fitting window; however no clear empirical approach for window optimization has been proposed. We also present a potential model-based approach to reduce uncertainty in Keeling model-derived δ13C estimates, offering a comprehensive analysis using low-magnitude soil gas flux data from a desert ecosystem. Together these fitting window optimization strategies enhance the robustness of soil gas flux and δ13C estimates. 

How to cite: He, S., Hupp, J., Lauria, C., Lingol, T., Reed, S., and Vath, R.: Recent advancements in empirical and model-based approaches for optimizing fit windows for closed-transient chamber-based soil trace gas flux and δ13C data, EGU General Assembly 2025, Vienna, Austria, 27 Apr–2 May 2025, EGU25-13457, https://doi.org/10.5194/egusphere-egu25-13457, 2025.

EGU25-15438 | Posters on site | BG3.35

MOBMESTA – Automated GHG chamber measurements without electrical grid  

Janne Korhonen, Tatu Polvinen, Markku Koskinen, Mari Pihlatie, Annalea Lohila, Jaana Bäck, and Sami Haapanala

Chamber measurements are a common method for assessing greenhouse gas (GHG) exchange between ecosystems and the atmosphere. They are particularly useful for measurements at homogeneous sites and for partitioning fluxes and processes. Automated chamber measurements provide significantly improved temporal coverage compared to manual chambers. This factor is especially important for temporally variable soil N2O emissions. Although automated chambers are less labor-intensive, they typically rely on an electric grid. In contrast, manual chambers are relatively simple to operate and can function using batteries. 

The test-operational MOBile MEasurement STAtion (MOBMESTA) offers a solution for automated chamber measurements without access to an electric grid. This is achieved by: 1) minimizing power use and implementing power-saving features, 2) utilizing compressed air to operate (open and close) the chambers, 3) employing bifacial solar panels to provide power, and 4) incorporating large interchangeable lithium iron phosphate (LiFePO4) batteries. 

The system is designed for year-round operation, even in snowy, cold, and dark conditions. The system is designed for a maintenance cycle of few weeks. The design stems from decades of experience at both the Hyytiälä Forest Station and the INAR Ecosystems Research Group at the University of Helsinki. 

While the primary focus of MOBMESTA is on soil GHG exchange measurements, it is also capable of operating shoot or stem chambers. Although the initial design is based on pneumatic operation of the chambers, electric motors are also supported. The system features 16 sample channels capable of both closed-loop and flow-through operation. The station will provide meteorological and environmental background measurements, along with optional site-specific ecological measurements. 

The system is compact enough to fit in a van. Each individual component has a maximum weight of 22 kg, allowing for transport by a single person. The system itself is constructed on a two-wheeled trolley with a flat loading surface (load area 1 x 0.6 m, maximum load 400 kg). As of spring 2025, the system is undergoing field testing. 

How to cite: Korhonen, J., Polvinen, T., Koskinen, M., Pihlatie, M., Lohila, A., Bäck, J., and Haapanala, S.: MOBMESTA – Automated GHG chamber measurements without electrical grid , EGU General Assembly 2025, Vienna, Austria, 27 Apr–2 May 2025, EGU25-15438, https://doi.org/10.5194/egusphere-egu25-15438, 2025.

EGU25-15472 | ECS | Orals | BG3.35

Data quality and flux calculation of low-cost soil gas flux systems: insights from laboratory experiments and novel raw data processing schema 

Alex Naoki Asato Kobayashi, Clément Roques, Daniel Hunkeler, and Philip Brunner

Monitoring soil gas fluxes, particularly greenhouse gases like CO2 and CH4, often relies on a portable chamber-based approach that integrates data from multiple sensors and an accumulation chamber. While increasing the spatiotemporal resolution of soil gas flux measurements for a given study site is critical to disentangling coupled hydro-bio-geochemical processes, budget constraints and complex data processing can pose significant challenges. Automated, low-cost soil gas flux systems offer promising alternatives, enabling scalability and site-specific customization. However, these continuous low-cost systems generate large volumes of data that require automated quality-check routines and adapted flux calculation schema.

Here, we present the developments of an open-source, low-cost CO2 soil gas flux system complemented by a laboratory advection-based soil gas flux experiment that allowed us to assess the performance of the sensor and chamber design. Furthermore, we propose a novel flux calculation schema that avoids arbitrary assumptions, such as a fixed measuring time for calculating the flux. Instead, our approach employs an expanding time window to estimate the soil gas flux and some metrics, such as the Akaike information criterion, to identify the optimal interval considered to calculate the soil gas flux and estimate uncertainties.

Considering that data quality can only be assured given an adequately designed chamber, our laboratory methodology addressed the low-cost sensor’s accuracy and the low-cost system’s capacity to accumulate and determine the rate of change of CO2. Additionally, the proposed approach for calculating the soil gas flux provides users with a flexible and objective framework that adapts the total measurement time used for the calculations, enhancing the reliability of the soil gas flux estimates independently of the field conditions. This works highlights the potential of low-cost soil gas flux systems for enabling high spatiotemporal greenhouse gas monitoring capabilities while maintaining data quality standards.


How to cite: Asato Kobayashi, A. N., Roques, C., Hunkeler, D., and Brunner, P.: Data quality and flux calculation of low-cost soil gas flux systems: insights from laboratory experiments and novel raw data processing schema, EGU General Assembly 2025, Vienna, Austria, 27 Apr–2 May 2025, EGU25-15472, https://doi.org/10.5194/egusphere-egu25-15472, 2025.

EGU25-15885 | ECS | Posters on site | BG3.35

Using Automatic Chambers to Disentangle the Role of Vegetation in CO2 and CH4 Emissions From a Rewetted Fen Peatland  

Andres F. Rodriguez Grisales, Johannes W.M. Pullens, Jesper R. Christiansen, Klaus S. Larsen, Lars Elsgaard, and Poul E. Lærke

Peatland rewetting can reduce CO2 emissions but unintendedly increase CH4 emissions from drained peatlands. The magnitude of these emissions depends on factors such as time since rewetting, nutrient availability, vegetation type and water table fluctuations. In this study, we used automatic chambers to measure CO2 and CH4 emissions in a rewetted fen peatland under (a) grass-dominated and (b) Juncus sp. dominated vegetation plots. Our objectives were to (1) quantify CO2 and CH4 emissions, (2) identify how emissions were affected by vegetation type, and (3) relate emissions to changes in water table.

The study was conducted in the Nørreå valley in central Denmark. Autochambers (ECOFlux; DMR A/S) measuring gas fluxes first in transparent and then in dark mode in the same plot, were placed in a small area with mixed vegetation and connected to a multiplexer system which allowed simultaneous CO2 and CH4 flux measurements. We used a LGR-ICOSTM GLA131-GGA microportable gas analyzer (ABB Ltd.), and a LI-7810 trace gas analyzer (LI-COR, Inc.). Three autochambers were placed in grass-dominated plots, while three others were placed in Juncus sp. dominated plots. Axillary data on soil temperature, soil moisture, water table depth (WTD), and photosynthetic active radiation (PAR) were obtained within each chamber. Gas flux measurements were performed five to six times per day per chamber from 1st of May to 10th of November 2024. Biomass development was estimated with biweekly light reflectance measurements and the RVI vegetation index was calculated using a RapidSCAN CS-45 (Holland Scientific Inc., Lincoln, NE, USA). At the end of the study period, the aboveground vegetation was harvested and analyzed for dry matter content, total C (TC) and total N (TN). Additionally, peat cores were collected at six depth increments (0-10, 10-20, 20-40, 40-60, 60-80, and 80-100 cm), and the soil samples were analyzed for TC, TN, field bulk density, pH, Fe, and microbial composition. Preliminary findings suggest that CH4 emissions is higher from the Juncus than from the grass-dominated vegetation, but the effect of vegetation type on both CO2 and CH4 emissions depends on WTD, soil temperature, peat physicochemical characteristics and microbial composition. Findings from this study will provide valuable information on how high frequency WTD along with automatic chamber measurements can contribute to the understanding of peatland rewetting and management strategies in order to minimize greenhouse gas emissions during the rewetting process.

How to cite: Rodriguez Grisales, A. F., Pullens, J. W. M., Christiansen, J. R., Larsen, K. S., Elsgaard, L., and Lærke, P. E.: Using Automatic Chambers to Disentangle the Role of Vegetation in CO2 and CH4 Emissions From a Rewetted Fen Peatland , EGU General Assembly 2025, Vienna, Austria, 27 Apr–2 May 2025, EGU25-15885, https://doi.org/10.5194/egusphere-egu25-15885, 2025.

The physical parameters of soils strongly influence the gas exchange between the soil and the atmosphere. Soil texture may control greenhouse gas (GHG) emission or absorption through different mechanisms. On the one hand, soils with different textures create various conditions for soil microorganisms activity and growth. Higher content of clay in soils improves nutrients storage due to larger cation exchange capacity often resulting in higher microbial biomass and enhanced enzymatic activity. In addition, through the distribution of micropores, soil texture regulates water storage capacity, gases diffusion and their availability for microorganisms. In consequence, silty soils often are richer in nutrients, while sandy soil are better aerated and with gas diffusion occurring more easily, controlling soil processes differently. By regulating gases diffusion, including O2 availability, and creating anaerobic parts, texture strongly determines the soil processes responsible for GHG emissions or uptake.

Field studies on GHG exchange were carried out in agricultural soils of different textures under grasslands and under different crops cultivation. The widely accepted chamber method was used to assess GHG emissions or consumption over two growing seasons. The results showed that among the three key GHGs (CO2, CH4, N2O), soil texture particularly controlled the uptake of atmospheric CH4. Seasonally, sandy soils consumed several times more CH4 than silty soils due to higher gases diffusion, which was also regulated by soil moisture. The studies carried out provide valuable quantitative results on key GHG emissions, allowing their balance to be estimated in soils of different textures.

Funding

This work was funded by the ReLive project (CIRCULARITY/61/ReLive/2022) financed by the Polish National Centre for Research and Development within the Joint Call of the Co-fund ERA-Net Programme.

References:

Hamarashid, N.H. et al., 2010. Effect of soil texture on chemical compositions, microbial populations and carbon mineralization in soil. Egypt. J. Exp. Biol. 6, 59–64; Costa, K.H., Groffman, P.M., 2013. Factors regulating net methane flux by soils in urban forests and grasslands. Soil Sci. Soc. Am. J. 77 (3), 850–855


How to cite: Walkiewicz, A.: Soil texture as a strong regulator of greenhouse gas emissions from agricultural soils , EGU General Assembly 2025, Vienna, Austria, 27 Apr–2 May 2025, EGU25-16065, https://doi.org/10.5194/egusphere-egu25-16065, 2025.

EGU25-17377 | ECS | Posters on site | BG3.35

The Challenge: Estimating Greenhouse Gas Budgets from Heterogeneous Forest Soils 

Armin Malli, Maximilian Behringer, Karl Gartner, Günther Gollobich, Klaus Katzensteiner, and Barbara Kitzler

Forests soils are characterized by a pronounced spatial variability of chemical, biological and physical soil parameters, and therefore pose a great challenge for the monitoring of greenhouse gas fluxes (GHG). Disturbances such as compaction caused by forest machinery, affecting up to 40% of the area of an actively managed forest stand, additionally contribute to the variation of soil conditions over short distances and lead to large spatial differences in GHG fluxes.

To address spatial variability, current approaches often rely on spatially distributed manual measurements, which provide good spatial coverage but typically miss episodic extreme events, leading to an underestimation of GHG fluxes. In contrast, automated measurements provide high temporal resolution but are usually limited to small areas and, due to a lack of spatial replication, cannot capture the forest stand heterogeneity properly. Resolving this trade-off is crucial for improving the accuracy of GHG budgets. Therefore, our study aims not only to provide high-resolution temporal data on soil GHG fluxes, but also to combine automatic and manual measurements through means of modeling to overcome these limitations.

The long-term monitoring site Klausen-Leopoldsdorf, Austria, established in 1990 as part of the Austrian ICP Forests Program, offers the opportunity to address this challenge. The beech forest on Stagnic Cambisol developed from Flysch sediments, is representative for the highly productive, forested parts of the Wienerwald. In 2016, part of the forest stand was thinned using a fully mechanized harvesting system (single-grip harvester, forwarder), creating a plot of a thinned beech stand (BS) with skid trails (ST). Within this area, an automated GHG measurement system was installed to measure CO2 soil fluxes at 5-minute intervals at 2 subplots with 6 chambers each (LI-840A, LI-COR Inc., USA). In 2022, the measurement equipment system was replaced by 2 LI-COR trace gas analyzers (LI-7810 and LI-7820) to facilitate the detection of CH4 and N2O soil fluxes. This setup allows for high-resolution measurements of GHG fluxes from disturbed and undisturbed soils. From 2022 to 2024, supplemental manual measurements were carried out at 3-week intervals on collars (n = 24) along a transect within the 19-ha forest stand using a soil respiration chamber (8200-01S LI-COR Smart Chamber). Stratified regression modeling of the automated and manual measurements is used to calculate GHG fluxes at the forest stand scale.

Preliminary results highlight substantial differences in GHG flux rates between control (BS) and compacted (ST) areas. Disturbed areas exhibit elevated and prolonged emission peaks following precipitation events. These findings underscore the huge impact of soil compaction on heavy clayey soils and altered soil structure on GHG dynamics.

By combining high-frequency soil flux measurements with comprehensive environmental monitoring, this study improves the understanding of factors driving GHG flux variability. These findings contribute to more accurate stand-scale GHG budgets for managed temperate beech forests and provide a robust dataset for upscaling to national GHG budgets and improving biogeochemical models.

How to cite: Malli, A., Behringer, M., Gartner, K., Gollobich, G., Katzensteiner, K., and Kitzler, B.: The Challenge: Estimating Greenhouse Gas Budgets from Heterogeneous Forest Soils, EGU General Assembly 2025, Vienna, Austria, 27 Apr–2 May 2025, EGU25-17377, https://doi.org/10.5194/egusphere-egu25-17377, 2025.

EGU25-17613 | ECS | Orals | BG3.35

Surprising minimisation of CO2 emissions from a sandy loam soil over a rye growing period achieved by liming (CaCO3) 

Camille Rousset, Henri Bréfort, Rafael Frederico Fonseca, Guillaume Guyerdet, Florian Bizouard, Mustapha Arkoun, and Catherine Hénault

Liming is a common agricultural practice used to enhance soil productivity by correcting soil acidity and this change of soil chemical properties is often considered a potential strategy to mitigate nitrous oxide (N2O) emissions from soils. However, its overall impact on greenhouse gas (GHG) dynamics remains uncertain due to the dual influence of liming product on carbon dioxide (CO2) emissions: direct release from calcium carbonate (CaCO3) and potential changes in soil organic carbon (SOC) dynamics. Existing studies, based on limited field data, report contrasting effects of liming on both inorganic and organic CO2 emissions, raising concerns about whether reductions in N2O emissions are counterbalanced by increased CO2 fluxes.

This study investigated the impact of liming on soil GHG emissions by monitoring in situ N2O and CO2 fluxes following the application of two liming products: synthetic CaCO3 (SC) and marine CaCO3₃ (MC), in an acidic soil cultivated with winter rye. Using the static chamber method, we measured soil gas fluxes throughout the growing season alongside key variables, including soil pH, mineral nitrogen concentrations, moisture, and temperature. Biomass yield and SOC (stocks and composition) were also assessed at harvest.

Liming application increased soil pH from 5.7 to around 7.0 and enhanced kernel yield from 320 to over 400 g m-2. Notably, both liming treatments reduced soil CO2 emissions by about 40%, contrary to IPCC predictions of increased CO2 from lime-derived carbon. While N2O emissions rose slightly, they remained very low during the study period and did not impact the overall GHG budget of the crop. SOC stocks showed no significant change at harvest, though dissolved organic and inorganic carbon concentrations increased.

Our results suggest that current IPCC guidelines for estimating CO2 emissions from liming may require revision, as liming could offer dual benefits for soil pH management and CO2 emission mitigation under certain conditions. This session will be an excellent opportunity to discuss the hypothesis regarding pH influence on the CO2 and N2O emissions balance, to discuss underlying mechanisms of observed mitigation and explore potential pathways for optimising liming practices to enhance climate-smart soil management.

How to cite: Rousset, C., Bréfort, H., Fonseca, R. F., Guyerdet, G., Bizouard, F., Arkoun, M., and Hénault, C.: Surprising minimisation of CO2 emissions from a sandy loam soil over a rye growing period achieved by liming (CaCO3), EGU General Assembly 2025, Vienna, Austria, 27 Apr–2 May 2025, EGU25-17613, https://doi.org/10.5194/egusphere-egu25-17613, 2025.

An estimated 80% of terrestrial carbon is stored below-ground but a large proportion of our soils are carbon depleted. There are broadly two ways to increase organic carbon stored below-ground, either protect and expand carbon-rich ecosystems or manage ecosystems to enhance carbon sequestration. Identifying carbon-rich ecosystems and understanding the key drivers of carbon losses is essential to design ecosystem management. However, the key processes which drive carbon losses are multifactorial and can vary between ecosystems and locations. We present a two-year study of four contrasting ecosystems situated in proximity. Our focal ecosystems were (a) an unimproved species-rich grassland, (b) managed hazel coppice woodland, (c) broadleaved woodland, and (d) coniferous woodland. We monitored temporal variability in soil respiration (SR) and net ecosystem exchange (NEE) using automated chambers and we measured spatial variability in SR and NEE across the ecosystems on a quarterly basis using survey chambers, also measuring a suite of biogeochemical, and plant and soil biodiversity metrics. We found that mean soil carbon was greatest in the broadleaved woodland, then the coniferous woodland, followed by the hazel coppice and finally the grassland site. Interestingly, soil carbon and many of the other biogeochemical parameters varied throughout the year and across the ecosystems. Soil moisture and soil temperature were important drivers of changes in SR and NEE, but the magnitude of these effects varied between the ecosystems and over time. Spatial variability in SR and NEE was also substantial with many of the biogeochemical and biodiversity metrics each explaining some of the variation in our data. Overall, high-resolution temporal datasets from automated chambers combined with spatial data using survey chambers in different ecosystems located closely together gives us a greater understanding of the key drivers of changes in SR and NEE. Using these data could inform land management decisions aimed at increased soil carbon sequestration. This could make an important contribution to achieving net zero.  

How to cite: Lee, M. and Egan, G.: Combining automated chambers with surveys to measure spatial and temporal variation in soil carbon, soil respiration and net ecosystem exchange in four contrasting ecosystems, EGU General Assembly 2025, Vienna, Austria, 27 Apr–2 May 2025, EGU25-20183, https://doi.org/10.5194/egusphere-egu25-20183, 2025.

EGU25-20499 | Orals | BG3.35

Rapid soil CO2 release following wetting governed by physical desorption not biology  

Dani Or, Peter Lehmann, and Stanislaus Schymanski

Evidence shows large CO2 efflux from rewetted dry soil surfaces peaking within seconds since wetting, too fast to be attributed to the biological “Birch effect”. We conducted experiments with long-term archived soils with different textures and soil organic carbon (SOC) to quantify CO2 release rates during controlled water imbibition. Total soil CO2 efflux varied considerably across textures (that also affected water imbibition rates) with cumulative efflux ranging from 5 (loamy sand) to 35 (loam) mmol/m2 during water imbibition times of 400 s (loamy sand) to 800s (loam). The measured CO2-efflux was reproduced using a physically based model for wetting front displacement, gas diffusion, and wetting-induced CO2 desorption. Repeated rewetting following oven drying of the soil samples resulted in different CO2 release behavior, suggesting kinetic effects of CO2 re-adsorption rates (especially for SOC) and potential bypassing of CO2 bearing surfaces during imbibition. In other words, surface accessibility to water, wettability and nano-porosity play a role in CO2 adsorption and desorption rates. While the measurements suggest only a minor role of this temporary carbon sink in the global carbon balance, there is a potential for a persistent measurement bias by eddy covariance flux towers (missing CO2 release during rainfall) that may lead to a bias in carbon balance of the order of 0.1-0.5 Gton/year globally. Additionally, it highlights a potential role of physical CO2 efflux, which operates at a much faster time scale than biological fluxes.

How to cite: Or, D., Lehmann, P., and Schymanski, S.: Rapid soil CO2 release following wetting governed by physical desorption not biology , EGU General Assembly 2025, Vienna, Austria, 27 Apr–2 May 2025, EGU25-20499, https://doi.org/10.5194/egusphere-egu25-20499, 2025.

EGU25-21695 | Orals | BG3.35

A software package for the analysis of Skyline data: an automated flux chamber system 

Peter E. Levy and Elisabeth Appleton

We present a software package for the analysis of data from automated flux chamber systems. It was developed for the Skyline chamber system, in which a chamber is moved robotically to close on a series of chamber bases along a transect. The system generates 1-Hz data over several months, so requires software to automate the processing of the multiple data streams. We describe the software system here, which is extensible to other automated chamber systems. The software merges data from the different data streams, including greenhouse gas mole fractions and chamber position data, environmental variables, and meta-data on experimental treatments. Algorithms performs identification of deadbands/chamber enclosure time, quality control based on the CO2 response, and calculation of fluxes with linear and non-linear equations. With appropriate internet connectivity, the software can be scheduled to update on a near-real-time basis. Graphical output and hierarchical statistical analysis of treatment effects is included. We illustrate applications with examining diurnal patterns in greenhouse gas fluxes and experiments on agricultural emission factors for N2O.

How to cite: Levy, P. E. and Appleton, E.: A software package for the analysis of Skyline data: an automated flux chamber system, EGU General Assembly 2025, Vienna, Austria, 27 Apr–2 May 2025, EGU25-21695, https://doi.org/10.5194/egusphere-egu25-21695, 2025.

EGU25-21702 | Posters on site | BG3.35

Optimizing the closure period for improved accuracy of chamber-based greenhouse gas flux estimates 

Klaus Steenberg Larsen, Carl-Fredrik Johannesson, Jenni Nordén, Holger Lange, and Hanna Silvennoinen

Non-steady-state chambers are widely used for measuring the exchange of greenhouse gases (GHGs) between soils or ecosystems and the atmosphere. It is known that non-steady-state chambers induce a non-linear concentration development inside the chamber after closure, even across short chamber closure periods, and that both linear and non-linear flux estimates are impacted by the chamber closure period itself. However, despite the existence of recommendations on how long to keep the chamber closed, it has been little explored to what extent the length of the chamber closure period affects the estimated flux rates, and which closure periods may provide the most accurate linear and non-linear flux estimates.

In the current study, we analyzed how linear regression and Hutchinson and Mosier (1981) modeled flux estimates were affected by the length of the chamber closure period by increasing it in increments of 30 s, with a minimum and maximum chamber closure period of 60 and 300 s, respectively. Across 3,159 individual soil CO2 and CH4 flux measurements, the effect of chamber closure period length varied between 1.4–8.0% for linear regression estimates and between 0.4–17.8% for Hutchinson–Mosier estimates and the largest effect sizes were observed when the measured fluxes were high.

Both linear regression and Hutchinson–Mosier based flux estimates decreased as the chamber closure period increased. This effect has been observed previously when using linear regression models, but the observed effect on Hutchinson-Mosier modeled estimates is a novel finding. We observed a clear convergence between the short-period linear regression estimates and the long-period Hutchinson–Mosier estimates, showing that closure periods as short as possible should be used for linear regression flux estimation, while ensuring long-enough closure periods to observe a stabilization of flux estimates over time when using the Hutchinson-Mosier model. Our analysis was based on soil flux measurements, but because the perturbation of the concentration gradient is related to the non-steady-state chamber technique rather than the measured ecosystem component, our results have implications for all flux measurements conducted with non-steady-state chambers. However, optimal chamber closure times may depend on individual chamber designs and analyzer setups, which suggests testing individual chamber/system designs for optimal measurement periods prior to field application

How to cite: Larsen, K. S., Johannesson, C.-F., Nordén, J., Lange, H., and Silvennoinen, H.: Optimizing the closure period for improved accuracy of chamber-based greenhouse gas flux estimates, EGU General Assembly 2025, Vienna, Austria, 27 Apr–2 May 2025, EGU25-21702, https://doi.org/10.5194/egusphere-egu25-21702, 2025.

EGU25-38 | ECS | Orals | BG3.36

Effects of Bedding Preparations on Potato Yield and Greenhouse Gas Emissions in Southern Alberta, Canada 

Matt Ball, Guillermo Hernandez-Ramirez, Rezvan Karimi Dehkordi, Willemijn Appels, and Jonathan Neilson

Fall bedding, a prevalent practice for potato (Solanum tuberosum) production in southern Alberta, entails fall-season soil preparations including irrigation, fertilization, plowing, and bed formation. This approach, while economically advantageous - owing to reduced labor and fertilizer costs and a decrease in other necessary preparations during fall - raises environmental concerns. Specifically, the lag between fertilizer application and crop nutrient uptake may lead to elevated emissions of carbon dioxide (CO₂) and nitrous oxide (N₂O), potent greenhouse gases.

To investigate these potential environmental impacts and assess potato yield outcomes, a field study was conducted in Lethbridge, Alberta. This experiment utilized 36 plots with different combinations of bedding approaches (fall bedding, spring bedding, and spring bedding following a winter cover crop), two irrigation levels (80% and 120% of AIMM recommended rates), and both fertilized and unfertilized conditions. Each combination was replicated three times.

Findings show that N₂O emissions are strongly influenced by fertilizer application (P < 0.005), the timing of bedding (P < 0.05) and field position (hill or furrow) (P < 0.05), with the highest emissions observed in fall-bedded plots under high irrigation and fertilization. In contrast, CO₂ emissions were less variable, although highly significant differences were observed primarily between hill and furrow positions (P < 0.0005). Furthermore, variations in bedding practices and fertilization both significantly affected tuber yields (P < 0.05), underscoring the need to balance production practices with environmental considerations in potato cultivation.

How to cite: Ball, M., Hernandez-Ramirez, G., Karimi Dehkordi, R., Appels, W., and Neilson, J.: Effects of Bedding Preparations on Potato Yield and Greenhouse Gas Emissions in Southern Alberta, Canada, EGU General Assembly 2025, Vienna, Austria, 27 Apr–2 May 2025, EGU25-38, https://doi.org/10.5194/egusphere-egu25-38, 2025.

Semi-arid savanna grasslands in Kenya are vital for food production and rural livelihoods, with livestock grazing accounting for more than 90% of household incomes in arid and semi-arid areas.  However grassland soils have become degraded in many areas due to vegetation loss and soil erosion, often caused by overgrazing.  Soil degradation (depletion of organic matter and nutrient levels, disrupted soil biological process, and poor structure) reduces plant productivity and resilience to extreme weather conditions such as drought. Given that drought has been increasing in severity, duration and frequency over recent decades, this has severe implications for food security across sub Saharan Africa. 

Grassland restoration often focusses on re-seeding grasses with high grazing value, but poor soil conditions may hinder successful re-vegetation. Soil processes therefore need to be restored to ensure the long-term sustainability of grazing lands. Legumes, found alongside grasses in natural grasslands, may play a key role in soil processes, particularly nutrient cycling which is likely to be important for semi-arid grassland soils as they are often highly nitrogen limited. However, while there is a significant body of research on legume-soil interactions in temperate grasslands and the tropical grasslands of Asia and Latin America, there has been little research on how the highly weathered soils and semi-arid grasslands of sub Saharan Africa function and may respond to restoration interventions.

In this mesocosm experiment, grasses were grown in native soil with and without legumes, under both droughted and well-watered conditions. This aimed to assess the impact of legumes on grassland productivity via their influence on soil processes, and whether this can mediate the effects of drought stress.

Grass biomass was higher when grasses were grown alongside native legumes than in a grass-only mix although the impact varied between grass species. This was accompanied by higher root growth and nitrogen content of plant tissue. These trends were observed in both well-watered and droughted conditions.  These findings suggest that legumes play an important role in the productivity and drought resilience of grasslands, likely by helping to mitigate nitrogen limitation. Further work is needed to test these findings on a wider range of grass and legume species and improve our understanding of the mechanisms involved.

How to cite: Pearce, F.: Can legumes improve the productivity and resilience of semi-arid Kenyan grasslands via influence on soil processes?, EGU General Assembly 2025, Vienna, Austria, 27 Apr–2 May 2025, EGU25-257, https://doi.org/10.5194/egusphere-egu25-257, 2025.

EGU25-467 | ECS | Posters on site | BG3.36

Effects of Wheat Root Morphologies on Agricultural Soil Gas Fluxes 

Megan L. Purchase, Deying Wang, Alex J. Thorpe, and Ryan M. Mushinski

Agricultural lands comprise ~40% of European land and significantly contribute to continental greenhouse and trace gas emissions1, particularly nitrous oxide (N2O), and reactive nitrogen species including ammonia (NH3) and nitrogen oxides (NOx, NOz). Within the EU's commitment to reduce agricultural greenhouse gas emissions by 30% by 2030, understanding crop variety influences on these emissions is crucial. While the release of nitrogenous gases following synthetic nitrogen (N) fertiliser application is well-documented, the impact of crop traits on emission patterns through their effects on soil properties and microbial communities remains poorly understood. Wheat, as Europe's dominant cereal crop and a global food security cornerstone, has undergone extensive breeding resulting in distinct heritage and modern semi-dwarf varieties.2 These varieties differ primarily in their expression of reduced height genes, which were introduced to support higher grain yields but consequently altered root system biomass allocation and morphology.3 Here, we present the first comprehensive assessment of how these root architectural differences influence soil N-cycling and subsequent gas emissions. Our field trials, conducted in central England, compared two heritage varieties (Red Lammas and Chidham Red) with two semi-dwarf varieties (Crusoe and Skyfall) under different N fertiliser treatments (0, 60, and 120 kg-N ha-1). Continuous gas flux measurements using multiplexed chambers coupled with FTIR spectroscopy and chemiluminescence detectors revealed >600% higher nitric oxide (NO) emissions from modern varieties during spring. Molecular analyses of rhizosphere soil showed distinct N-cycling microbial communities between variety types (Fig. 1). Seasonal dynamics indicated strongest variety effects during summer fertiliser application and early spring moisture stress periods. This research directly informs European agricultural policy by demonstrating how historical breeding decisions influence greenhouse gas emissions, while providing evidence-based strategies for variety selection and fertiliser management that could reduce agricultural nitrogen losses without compromising yield targets.

Figure 1. Predicted gene counts of microbes associated with denitrification and nitrification from rhizosphere soil of higher specific root length (SRL) taller cultivars and lower SRL semi-dwarf cultivars of wheat, quantified using shotgun DNA sequencing.


(1)        Tubiello, F. N.; Salvatore, M.; Rossi, S.; Ferrara, A.; Fitton, N.; Smith, P. The FAOSTAT Database of Greenhouse Gas Emissions from Agriculture. Environ. Res. Lett. 2013, 8 (1), 015009. https://doi.org/10.1088/1748-9326/8/1/015009.

(2)        Shewry, P. R. Wheat. Journal of Experimental Botany 2009, 60 (6), 1537–1553. https://doi.org/10.1093/jxb/erp058.

(3)        Vergauwen, D.; De Smet, I. From Early Farmers to Norman Borlaug — the Making of Modern Wheat. Current Biology 2017, 27 (17), R858–R862. https://doi.org/10.1016/j.cub.2017.06.061.

How to cite: Purchase, M. L., Wang, D., Thorpe, A. J., and Mushinski, R. M.: Effects of Wheat Root Morphologies on Agricultural Soil Gas Fluxes, EGU General Assembly 2025, Vienna, Austria, 27 Apr–2 May 2025, EGU25-467, https://doi.org/10.5194/egusphere-egu25-467, 2025.

EGU25-717 | ECS | Posters on site | BG3.36

Potential of different Urochloa grass hybrids to enhance soil organic carbon stocks in a Mollisol of Valle del Cauca, Colombia  

Leonardo Rodriguez, Mike Bastidas, Daniel Villegas, Vanessa Prado, Marta Benito, Guntur Subbarao, Ciniro Costa Junior, Idupulapati Rao, and Jacobo Arango

Increasing soil organic carbon (SOC) stocks in grasslands is a promising strategy for offsetting greenhouse gas (GHG) emissions from cattle ranching. Previous studies have shown that certain Urochloa grasses develop an extensive deep rooting system that contributes to higher SOC accumulation in acidic soils with low fertility and aluminum toxicity. At the Alliance Bioversity and CIAT, genetically diverse a Urochloa grasses are utilized in breeding programs aimed at developing hybrids with improved adaptation to biotic (e.g., spittlebug) and abiotic (acidic soils, aluminum toxicity, drought, and waterlogging) stresses, enhanced nutritional quality, and reduced nitrous oxide from soil and methane from cattle. However, the capacity for SOC accumulation from their deep rooting ability has not yet been considered as a target trait within these breeding programs. Since these improved grasses are pivotal for sustainable livestock intensification, this study aims to evaluate the differences in the contribution of nine Urochloa genotypes to increase SOC stocks in a Mollisol of Valle del Cauca, Colombia. The field trial was established in 2016 with the planting of nine Urochloa genotypes: four cultivars/accessions (U. brizantha  cv. Marandu,  U. humidicola  cv. Tully,  U. humidicola  CIAT 26146, and U. humidicola  CIAT 16888), and five hybrids (cv. Mulato II, Uh08 675, Uh08 1149, Uh 72, and Uh 91) as well as a control treatment with bare soil. Each genotype was planted in 20 x 20 m plots with three replicates, and three control plots were maintained as bare soil. Six years after establishment (early 2023), soil samples were collected from each plot at four depths (0-10, 10-20, 20-60, 60-100 cm) to estimate SOC stocks using the values of SOC concentration and bulk density. We observed that SOC concentrations decreased with depth. In grass-covered plots, the average SOC concentration was 2.17% in the surface layer (0–10 cm) and 0.25% in the deeper layer (60–100 cm). In contrast, in bare soil plots, the average SOC concentration was 1.7% in the surface layer and 0.11% in the deeper layer. Results on the stocks of SOC (0-100 cm soil depth), based on equivalent soil mass, indicated that after 6 years of establishment, plots planted with Urochloa grasses showed an average value of 127.4 Mg C ha⁻¹, which is 47% more compared to 86.4 Mg C ha⁻¹ found in bare soil. We observed a clear trend with Urochloa hybrids showing a greater ability to increase SOC stocks, in the following order: Uh 91 > Uh 72 > Uh08 675 > cv. Marandu > Uh08 1149 > cv. Mulato > CIAT 26146 > CIAT 16888 > cv. Tully. For example, the Urochloa hybrid of Uh 91 had a SOC stock of 155.66 Mg C ha⁻¹, while cv. Tully had 97.17 Mg C ha⁻¹. These results highlight the potential of Urochloa grass hybrids to contribute towards mitigation of climate change. On-going Urochloa grass breeding programs should consider incorporating the trait of SOC accumulation ability together with other desirable traits of stress resistance, improved nutritional quality, and reduced GHG emissions.  

How to cite: Rodriguez, L., Bastidas, M., Villegas, D., Prado, V., Benito, M., Subbarao, G., Costa Junior, C., Rao, I., and Arango, J.: Potential of different Urochloa grass hybrids to enhance soil organic carbon stocks in a Mollisol of Valle del Cauca, Colombia , EGU General Assembly 2025, Vienna, Austria, 27 Apr–2 May 2025, EGU25-717, https://doi.org/10.5194/egusphere-egu25-717, 2025.

EGU25-1387 | ECS | Orals | BG3.36

Summer Irrigation increases organic carbon turnover in managed pastures 

Carmen Rosa Carmona, Timothy Clough, Michael Beare, Samuel McNally, and Weiwen Qiu

Summer irrigation in temperate managed pastures enhances aboveground productivity during soil water-limited periods, but its effects on soil organic carbon (SOC) dynamics remain insufficiently understood, with reported effects often contradictory. Our objective was to quantify the effects of summer irrigation on the short-term fate of photo-assimilated carbon (C) in the entire pasture and soil system.

Using mesocosms containing ryegrass (Lolium perenne L.) and white clover (Trifolium repens L.) that were maintained to simulate spring conditions in New Zealand, a 13CO₂ labelling experiment was conducted. After the labelling, mesocosms underwent an irrigation period during summer, followed by a post-irrigation period. The 13C-labelled mesocosms (n = 48) were sampled in sets over five sampling times: 1, 15, 140, 225 and 334 days after the last labelling event.

Over the irrigation period (15 and 140 days after the last labelling event), irrigation increased carbon losses through leaf harvest (threefold higher than non-irrigated systems) and reduced root biomass by 2000 kg dry matter ha⁻¹. At the end of both, the irrigation and post-irrigation periods, the quantity of 13C remaining in roots in the irrigated treatment was lower by 70% and 60%, respectively, compared to non-irrigated conditions. Non-irrigated conditions favoured the retention of photo-assimilated 13C in roots and in the mineral-associated organic matter size fraction (<5 µm), while irrigation promoted fine particulate organic matter formation (53-250 µm).

These findings highlight that summer irrigation accelerates carbon turnover in roots and mineral-associated fractions, potentially reducing long-term SOC storage under intensified pastoral systems.

How to cite: Carmona, C. R., Clough, T., Beare, M., McNally, S., and Qiu, W.: Summer Irrigation increases organic carbon turnover in managed pastures, EGU General Assembly 2025, Vienna, Austria, 27 Apr–2 May 2025, EGU25-1387, https://doi.org/10.5194/egusphere-egu25-1387, 2025.

EGU25-1468 | ECS | Posters on site | BG3.36

Let That Sink In- Carbon Uptake of Perennial Intermediate Wheatgrass in Southern Sweden 

Veronika Widengren, Jonas Ardö, Jutta Holst, Tobias Biermann, and Patrik Vestin

Agriculture is one of the major sources of global greenhouse gas emissions, and faces challenges such as erosion, nutrient leakage, and reliance on external inputs like seeds and fertilizers. These issues are largely driven by the cultivation of annual crops with shallow roots and intensive soil disturbance. Perennial crops, such as intermediate wheatgrass (IWG), could offer a sustainable alternative by reducing emissions, erosion, and input dependency through deep and extensive roots and no-till requirements. This study focuses on IWG, producing the grain Kernza, a novel crop for food production, and investigates the climate mitigation potential of this perennial crop for a more sustainable agricultural system.

Outside Lund in southern Sweden, a 10-ha field of IWG has been established adjacent an equivalent-sized field with conventional annual crop rotation. Carbon dioxide exchange was measured continuously at both of the fields separately using the eddy covariance (EC) technique to account for the first-year’s carbon budget for each field. The cumulative net ecosystem exchange during the first crop cycle (spanning the period between the first and second sowing of annual crops at the control site), has been evaluated. Preliminary findings show that IWG has more than twice the net carbon uptake compared to the conventional annual crop after one crop cycle. Further analyses of the EC data will be undertaken, as well as incorporation of measured above ground biomass (AGB) and fossil fuel use (e.g. machinery) in the carbon budget. The results will be synthesised and presented at the conference.

How to cite: Widengren, V., Ardö, J., Holst, J., Biermann, T., and Vestin, P.: Let That Sink In- Carbon Uptake of Perennial Intermediate Wheatgrass in Southern Sweden, EGU General Assembly 2025, Vienna, Austria, 27 Apr–2 May 2025, EGU25-1468, https://doi.org/10.5194/egusphere-egu25-1468, 2025.

EGU25-1721 | Orals | BG3.36

Improved nitrogen fertilizer management practices that reduce growing season nitrous oxide emissions may increase non-growing season emissions 

David Pelster, Vera Sokolov, Stuart Admiral, Haben Asgedom-Tedla, and Elizabeth Pattey

Field cropping practices in Canada include routine use of nitrogen (N) fertilizer, which produces substantial amounts of nitrous oxide (N2O) emissions. Adoption of improved N management practices may reduce both the amount of N applied and these N2O emissions. Using flux-tower field measurements, we investigated how dual inhibitors (urease and nitrification inhibitors with urea) reduced N fertilizer-induced N2O emissions, compared with urea only, in eastern Canada across 7 years. We also used meta-analysis (of static chamber studies) to examine how inhibitors and other enhanced efficiency fertilizers (EEFs), along with other improved N management techniques, affected fertilizer-induced N2O emissions from Canadian agricultural cropping systems. From the field study, the dual inhibitors reduced growing season N2O emissions by 22% and annual N2O emissions by 10% for high N application rates to corn (Zea mays), while N2O emissions from lower N applications to wheat (Triticum aestivum) showed no differences between the EEF and urea. Crop yields for both the corn and wheat were similar between the different N fertilizer treatments. Across Canada, the meta-analysis showed that EEFs (which include coated slow-release fertilizers and both nitrification and urease inhibitors combined and on their own), on average, reduced N2O emissions by 11%. Nitrification inhibitors (alone or in combination with urease inhibitors) averaged a 19% reduction in N2O emissions. Most of the studies used in the meta-analysis had minimal sampling through the non-growing season though, so the total annual N2O emission reductions were not evaluated and may actually be lower. The meta-analysis indicated that the most effective N management techniques for reducing N2O emissions were the use of EEFs, split application of N fertilizers and the use of organic fertilizers, with the effectiveness of these practices all strongly influenced by soil and weather conditions. The meta-analysis also found that reductions with EEFs from studies that included year-round measurements, tended to be less than studies that included only the growing season. This suggests that when improved N management practices use the same N application rates as the regular practice, more residual N may be available for non-growing season losses. As a result, when no yield benefit is noted, these improved practices should be combined with N rate reductions.

How to cite: Pelster, D., Sokolov, V., Admiral, S., Asgedom-Tedla, H., and Pattey, E.: Improved nitrogen fertilizer management practices that reduce growing season nitrous oxide emissions may increase non-growing season emissions, EGU General Assembly 2025, Vienna, Austria, 27 Apr–2 May 2025, EGU25-1721, https://doi.org/10.5194/egusphere-egu25-1721, 2025.

EGU25-2688 | ECS | Orals | BG3.36

Synergies of reducing greenhouse gases and atmospheric nitrogen pollutants in China 

Xin Xu, Xiuming Zhang, Shaohui Zhang, Wilfried Winiwarter, Lin Zhang, and Baojing Gu

Climate change and environmental degradation driven by greenhouse gases (GHGs) and reactive nitrogen (Nr) emissions are escalating globally. As a major emitter of both, China faces dual challenges in mitigating GHGs and Nr to achieve carbon neutrality and sustainability. This study evaluates the potential and synergies of GHG (CO2, CH4, and N2O) and atmospheric Nr pollutant (NOx and NH3) mitigation based on a multi-model framework. Our findings indicate that with a co-control solution, China could reduce GHG emissions by up to 75% and atmospheric Nr pollutants by 60% in 2050, delivering societal benefits of US$959 billion—five times the implementation costs. When both GHG and Nr control strategies are fully deployed, industry-driven emission reductions will be dominant until around 2030, coinciding with China’s carbon peak target. However, after the carbon peak, agriculture-led reductions will enhance synergies in abatement potential and cost-effectiveness. This underscores the need to shift the priority of GHG and atmospheric Nr pollution control during post-peak, to boost zero carbon and clean air in China.

How to cite: Xu, X., Zhang, X., Zhang, S., Winiwarter, W., Zhang, L., and Gu, B.: Synergies of reducing greenhouse gases and atmospheric nitrogen pollutants in China, EGU General Assembly 2025, Vienna, Austria, 27 Apr–2 May 2025, EGU25-2688, https://doi.org/10.5194/egusphere-egu25-2688, 2025.

EGU25-3921 | Posters on site | BG3.36

Detection Limit of a Low Power Open-Path Nitrous Oxide Laser Analyzer based Eddy Covariance Flux Experiment in Northern China 

Ruisheng Jiang, Weihao Shen, Kai Wang, Songtao Hu, Daniel Wilson, and Yin Wang

As a significant greenhouse gas, nitrous oxide (N₂O) is primarily emitted through anthropogenic activities, with agriculture being the predominant source. These emissions often occur across large spatial scales. The Eddy Covariance (EC) technique stands out as one of the most advanced methods for quantifying N₂O fluxes. However, most commercially available N₂O analyzers are designed for close-path measurements. To achieve the high-frequency gas concentration data required for EC applications, these analyzers typically rely on high-flow pumps, which necessitate substantial power consumption. Consequently, the selection of monitoring sites is frequently constrained by the availability of power.


This work introduces an open-path N2O laser analyzer (Model: HT8500, HealthyPhoton Co., Ltd.) designed for future applications in EC N₂O flux measurements. The HT8500 utilizes an quantum cascade laser (QCL) to probe the mid-infrared transition of N2O at 4.54 μm. The specific absorption peak has the advantage that the density and spectroscopic effects compensate for each other, resulting in low temperature-related corrections in EC flux measurements. Laboratory experiments revealed that the HT8500 has a noise level of 0.4 ppbv at a 10-Hz sampling rate with a typical power consumption ~ 50 Watts.


A long-term field experiment based on the HT8500 over a bare agricultural field in Jinan, Shandong was conducted to test “zero-flux” measurements and computations under different meteorological conditions. Averaged hourly fluxes ranged from near zero at night to less than 0.18 mg m-2·h-1 at midday in December, which were not significantly different from zero. Compared to the laboratory detection limit of 19.29 ug N m-2·h-1, the field experiment demonstrated a detection limit of approximately 49 ug N m-2·h-1, indicating that the HT8500 analyzer maintains its low flux detection limit similar with commercial available chamber-based N2O flux measurement scenarios.

How to cite: Jiang, R., Shen, W., Wang, K., Hu, S., Wilson, D., and Wang, Y.: Detection Limit of a Low Power Open-Path Nitrous Oxide Laser Analyzer based Eddy Covariance Flux Experiment in Northern China, EGU General Assembly 2025, Vienna, Austria, 27 Apr–2 May 2025, EGU25-3921, https://doi.org/10.5194/egusphere-egu25-3921, 2025.

EGU25-4034 | Orals | BG3.36

Nitrous oxide emissions and nitrogen budgets for German agricultural soils via process-based modelling 

Andrew Smerald, Hannes Imhof, Clemens Scheer, and Ralf Kiese

Agricultural soils are the dominant source of nitrous oxide (N2O) emissions in most countries, but the spatial and temporal heterogeneity of the emission fluxes makes their quantification challenging. Here we develop a framework for estimating national N2O emissions at high spatial resolution, based on the biogeochemical-model LandscapeDNDC. We apply this framework to Germany, making use of high resolution datasets for soil type, agricultural management practices, climate and nitrogen (N) deposition. Compared to the current emission-factor (Tier-2) approach for compiling an N2O inventory, our method results in similar but slightly lower total N2O emissions at the national scale, but higher fertiliser-driven emissions, which are critical for UNFCCC reporting. It is also able to capture the effect of yearly climate variation. Spatial disaggregation of the emissions into approximately 400 districts reveals large differences at the sub-national scale, where the process-based model accounts better for local variations in soil, climate and agricultural management. We also go beyond the focus on N2O emissions and determine a full N budget for Germany, which includes the quantification of environmentally important N fluxes such as ammonia volatilisation, nitrate leaching and NO emissions.

How to cite: Smerald, A., Imhof, H., Scheer, C., and Kiese, R.: Nitrous oxide emissions and nitrogen budgets for German agricultural soils via process-based modelling, EGU General Assembly 2025, Vienna, Austria, 27 Apr–2 May 2025, EGU25-4034, https://doi.org/10.5194/egusphere-egu25-4034, 2025.

Grain production plays a critical role in ensuring national food security in China but is also a significant source of greenhouse gas (GHG) emissions, nitrogen (N) pollution, and water resource depletion. The shift in grain production centers from southern to northern China over the past four decades, driven by inter-provincial grain trade, has substantially altered the spatial distribution of carbon and nitrogen cycling processes, with important implications for agricultural ecosystems and climate mitigation strategies.

Using over 40 years of data, we show that inter-provincial grain trade in China (wheat, maize, and rice) increased more than fivefold between 1980 and 2020, from 22 to 128 million tonnes. This shift resulted in a 213% increase in N pollution and a 253% rise in GHG emissions associated with agricultural trade, alongside a 606% increase in blue water use and worsening water scarcity in northern regions. Our findings highlight that trade-driven shifts in regional production patterns, influenced by factors such as increased mechanization, population density, and urbanization, have intensified environmental challenges, particularly by increasing ammonia (NH3) and nitrogen oxide (NOx) emissions, which contribute to both GHG fluxes and air quality degradation.

To mitigate these impacts and balance food security with environmental sustainability, we propose a targeted policy intervention-a national subsidy mechanism-to compensate northern provinces for their disproportionate environmental burdens. An annual transfer of approximately US$30 million from southern to northern provinces could incentivize sustainable practices, reduce reactive nitrogen emissions, and enhance overall environmental quality while supporting agricultural productivity. Our study provides evidence-based recommendations for policymakers to develop integrated approaches that consider both GHG mitigation and nitrogen management in managed agricultural ecosystems.

How to cite: Wang, C.: Managing Domestic Trade for Sustainable Food Systems in China: Implications for GHG Fluxes and Nitrogen Emissions, EGU General Assembly 2025, Vienna, Austria, 27 Apr–2 May 2025, EGU25-4058, https://doi.org/10.5194/egusphere-egu25-4058, 2025.

EGU25-4407 | ECS | Orals | BG3.36

Effect of perennial forage species on soil microbial nutrient cycling in Ethiopian leys 

Niklas Wickander, Marit Jørgensen, and Peter Dörsch

Ethiopian agriculture is under severe pressure due to erosion and degradation of arable soils. These problems are exacerbated by high livestock numbers in small-holder farming, leading to intense grazing on limited communal pastures and on crop residues. Introducing leys of perennial forage species (grasses and legumes) into soils predominately used for cereal cropping could help restore degraded soils while simultaneously providing high quality feed for livestock. To optimize perennial species selection for different soils, we studied microbial nutrient cycling responses to perennial plant inputs in six contrasting soils in Ethiopia. Two grasses, Urochloa hybrid Cayman and Megathyrsus maximus, and two legumes, Desmodium intortum and Stylosanthes guianensis, were sown in varying mixtures at three field sites in two different regions. To assess how soil microbial nutrient stoichiometry and nutrient demand changed with plant cover, we measured soil exoenzyme activity, soil microbial biomass, C, N and P stoichiometry and nitrification potentials before and after the 1.5-year field experiments. Changes in microbial nutrient limitation in response to species ratios were estimated by a combined Vector and Threshold Element Ratio model. We found variable responses for the different soils, with the largest differences between the two regions. Across all fields we saw that P-limitation of microbes decreased with increasing ratios of legumes in the perennial mixtures. We conclude that increased legume incorporation reduces P-limitation and positively affects nutrient cycling in Ethiopian soils.

How to cite: Wickander, N., Jørgensen, M., and Dörsch, P.: Effect of perennial forage species on soil microbial nutrient cycling in Ethiopian leys, EGU General Assembly 2025, Vienna, Austria, 27 Apr–2 May 2025, EGU25-4407, https://doi.org/10.5194/egusphere-egu25-4407, 2025.

EGU25-5205 | ECS | Posters on site | BG3.36

From Linear Assumptions to Complex Reality: Dissolved NO3- and N2O Flux Dynamics in Aquacultural Ponds 

Maite Colina and Sarian Kosten

Nitrous oxide (N₂O) is an ozone-depleting substance with a global warming potential of 273 times greater than carbon dioxide (CO₂) for a 100-year timescale. The atmospheric concentration of N₂O has increased significantly, rising from approximately 270 ppb during the preindustrial era to over 330 ppb today. This alarming trend underscores global concerns about accurately quantifying anthropogenic N₂O sources and developing effective mitigation strategies. More than 50% of anthropogenic N₂O emissions is estimated to originate from direct agricultural activities, including land-use changes, fertilization, and manure management. In addition, agriculture may also indirectly contribute to N₂O emissions through its impact on freshwater eutrophication, which provides substrates (such as nitrate – NO₃⁻) for nitrification and denitrification processes in aquatic environments, potentially leading to N₂O production. The Intergovernmental Panel on Climate Change (IPCC) has proposed a linear correlation between NO₃⁻ concentrations and N₂O emissions to estimate global freshwater contributions to N₂O budgets. In this context, freshwater ecosystems, such as small agricultural ponds, are often considered as net sources of N₂O. However, direct measurements of N₂O dissolved concentrations and N₂O fluxes from agricultural ponds are limited. Actually, some studies have found N₂Odissolved concentration under saturation levels, leading to assume N₂O uptake from agricultural ponds. To better understand the role of agricultural ponds as sinks or sources of N₂O, we conducted a systematic literature review. Based on data from over 200 ponds associated with agricultural production we found that: there is a strong geographical bias, with most studies focusing on ponds in the northern hemisphere, and that there is non-linear relationship between dissolved NO₃⁻ concentrations and N₂O fluxes. These preliminary findings suggest that a re-evaluation of the IPCC's guidelines on N₂O emissions from inland waters is needed as local conditions strongly drive the fate of NO3- underscoring the need for further research into the driving factors behind water-atmosphere N₂O fluxes in agricultural ponds.

How to cite: Colina, M. and Kosten, S.: From Linear Assumptions to Complex Reality: Dissolved NO3- and N2O Flux Dynamics in Aquacultural Ponds, EGU General Assembly 2025, Vienna, Austria, 27 Apr–2 May 2025, EGU25-5205, https://doi.org/10.5194/egusphere-egu25-5205, 2025.

EGU25-5367 | Orals | BG3.36

Long-Term Effects of Lime and NPK Fertilization on Soil pH, Nitrogen Cycling, and Carbon Depletion: Benefits and Risks 

Sihyun Park, Jeong-Gu Lee, Na- Hyun Kwon, Chang-dong Lee, Taehyeon Kim, and Jaeeun Jung

The nutritional use efficiency (NUE) of crops is influenced by changes in soil pH caused by lime fertilizer, which also affects the nitrogen cycle. Lime application shifts soil pH from acidic to neutral, reducing nitrous oxide (N2O) emissions through the activity of nitrous oxide reductases in microorganisms, while also increasing nitrification rates due to enhanced activity of ammonia-oxidizing archaea (AOA) and bacteria (AOB). Accelerated nitrification leads to higher nitrate (NO3-) levels, which, when exceeding crop absorption capacity, pose a significant risk of leaching. This study investigated the effects of long-term NPK and lime fertilizer application on the soil nitrogen cycle using metagenomic analysis. Soil samples from plots treated with NPK alone and NPK with lime for 48 years were analyzed for metagenomic N2O gas flux, potential nitric oxide rates (PNR), and NUE. Results showed that long-term lime application significantly increased soil pH and reduced N2O emissions by 27% over 480 hours, with the most notable reduction in the first 24 hours compared to NPK-only treatment. However, NUE did not significantly improve, while PNR increased dramatically, reaching 1442% higher than in NPK-treated soils, indicating a potential risk of nitrate leaching. Metagenomic analysis revealed that nitrogen cycling pathways, including nitrification, were more active in lime-treated soils. Enhanced microbial nitrogen metabolism also increased carbon metabolism associated with degradation, suggesting a risk of soil carbon depletion via the priming effect, as evidenced by reduced total soil carbon and organic matter in lime-treated plots. The findings highlight both the benefits and drawbacks of long-term lime application. While lime improves soil pH and reduces N2O emissions, it may also increase nitrate leaching and soil carbon depletion. Further research is needed to optimize lime application for sustainable soil management.

How to cite: Park, S., Lee, J.-G., Kwon, N.-H., Lee, C., Kim, T., and Jung, J.: Long-Term Effects of Lime and NPK Fertilization on Soil pH, Nitrogen Cycling, and Carbon Depletion: Benefits and Risks, EGU General Assembly 2025, Vienna, Austria, 27 Apr–2 May 2025, EGU25-5367, https://doi.org/10.5194/egusphere-egu25-5367, 2025.

EGU25-5833 | ECS | Posters on site | BG3.36

Effect of bio-acidification and leonardite addition to slurry on ammonia and GHG emissions in soil-plant systems 

Fawad Khan, Samuel Franco Luesma, Baldur Janz, Michael Dannenmann, Rainer Gasche, Andreas Gattinger, Waqas Qasim, Ralf Kiese, and Benjamin Wolf

Agricultural ecosystems are significant sources of reactive trace gases, such as ammonia and nitric oxide, as well as greenhouse gases (GHGs), including carbon dioxide, methane, and nitrous oxide. These emissions contribute to global warming, air pollution, and ecosystem eutrophication. Traditional mitigation strategies, such as sulfuric acid slurry acidification in slurry storage, reduce ammonia and methane emissions effectively but face high costs, safety concerns, and restrictions in organic farming. This study explores alternative amendments for slurry, including organic acids waste i.e. cheese whey (a dairy byproduct), sauerkraut juice (a fermentation byproduct), and leonardite (a humic-rich natural material), to assess their potential for emission mitigation.

Using a controlled soil-plant mesocosm system to simulate field-like conditions under a laboratory setting, emissions of ammonia, methane, nitrous oxide, nitric oxide, and carbon dioxide were continuously monitored over nine days. Flux rates were determined using the dynamic chamber method at a temperature of 18°C and a water-filled pore space of 50%. The mesocosms were treated with either untreated slurry, slurry amended with cheese whey, sauerkraut juice, or leonardite, or left unfertilized as a control.

Results highlighted the potential of cheese whey and sauerkraut juice to substantially lower ammonia emissions by as much as 91%, with cheese whey also reducing combined GHG emissions significantly. While sauerkraut juice showed promise in reducing methane emissions, nitrous oxide emissions were elevated due to a higher ammonium content in the slurry-amendment mixture. Leonardite, though not effective in mitigating ammonia emissions, demonstrated its utility in lowering GHG emissions overall.

The findings suggest cheese whey and sauerkraut juice as promising amendments for ammonia reduction, with leonardite offering potential for GHG mitigation. However, the trade-offs observed with nitrous oxide emissions emphasize the need for further optimization to achieve a balanced mitigation strategy. These results contribute to the understanding of gas exchanges in agricultural ecosystems and promote sustainable practices by repurposing agricultural byproducts in a circular economy.

How to cite: Khan, F., Luesma, S. F., Janz, B., Dannenmann, M., Gasche, R., Gattinger, A., Qasim, W., Kiese, R., and Wolf, B.: Effect of bio-acidification and leonardite addition to slurry on ammonia and GHG emissions in soil-plant systems, EGU General Assembly 2025, Vienna, Austria, 27 Apr–2 May 2025, EGU25-5833, https://doi.org/10.5194/egusphere-egu25-5833, 2025.

EGU25-6346 | ECS | Orals | BG3.36

Increased harvested carbon of cropland in China 

Peiyang Ren, Daju Wang, Xiaosheng Xia, Xiuzhi Chen, Zhangcai Qin, Jing Wei, and Wenping Yuan

Crop harvested carbon is one of the most important components of the carbon cycle in cropland ecosystems, with a significant impact on the carbon budget of croplands. China is one of the most important crop producers, however, it is still unknown on the spatial and temporal variations of harvested carbon. This study collected statistical data on crop production at the province and county levels in China for all 10 crop types from 1981 to 2020 and analyzed the magnitude and long-term trend of harvested crop carbon. Our results found a substantial increase of harvested carbon in cropland from 0.185 Gt C yr-1 in 1981 to 0.423 Gt C yr-1 in 2020 at a rate of 0.006 Gt C yr-1. The results also highlighted that the average annual carbon sink removal from crop harvesting in China from 1981 to 2020 was 0.32 Gt C yr-1, which was comparable to the net carbon sink of the entire terrestrial ecosystems in China. This study further generated a gridded dataset of harvested carbon from 2001 to 2019 in China by using jointly the statistical crop production and distribution maps of cropland. In addition, a model-data comparison was carried out using the dataset and results from seven state-of-the-art terrestrial ecosystem models, revealing substantial disparities in harvested carbon simulations in China compared to the dataset generated in the study. This study emphasized the increased importance of harvested carbon for estimating cropland carbon budget, and the produced dataset is expected to contribute to carbon budget estimation for cropland ecosystems and the entire China.

How to cite: Ren, P., Wang, D., Xia, X., Chen, X., Qin, Z., Wei, J., and Yuan, W.: Increased harvested carbon of cropland in China, EGU General Assembly 2025, Vienna, Austria, 27 Apr–2 May 2025, EGU25-6346, https://doi.org/10.5194/egusphere-egu25-6346, 2025.

EGU25-6469 | ECS | Orals | BG3.36

Impact of management on CO2 fluxes and drivers of regrowth rates in a temperate grassland during 20 years of measurements 

Yi Wang, Iris Feigenwinter, Lukas Hörtnagl, and Nina Buchmann

Grasslands serve a unique role in the global carbon (C) cycle and cover about 30% of the European and about 70% of the Swiss area used for agriculture. The CO2 fluxes of managed grasslands are substantially influenced by climate conditions and land management practices. The eddy covariance (EC) technique is the only approach to directly measure the net ecosystem exchange (NEE) of CO2. NEE represents the balance between two large ecosystem processes: gross primary production (GPP; amount of CO2 fixation through photosynthesis), and ecosystem respiration (Reco; amount of CO2 released via plant and soil respiration). Our study aimed to (1) investigate intra- and inter-annual changes in grassland NEE as well as regrowth after mowing/grazing events, (2) understand key drivers of GPP regrowth rates, and (3) examine grassland responses to sward renewal.


In our study, we measured EC fluxes and meteorological variables at the temperate grassland site Chamau (CH-Cha as part of FLUXNET) in Switzerland. This grassland is intensively managed, with 4-6 mowing/grazing events per year, accompanied by organic fertilization (on average 271 kg N ha-1 yr-1) and sward renewal every 7-10 years. We applied machine learning approaches such as Extreme Gradient Boosting (XGBoost) and Shapley Additive exPlenations (SHAP) analysis to address our aims, using 20 years (2005-2024) of EC flux, meteorological, and detailed management data.


Over the 20 years, a pronounced intra-seasonal course of NEE was found due to mowing and grazing, with the maximum CO2 uptake in early spring (March-April) and the largest CO2 loss in early winter (December-January). During the main growing season (April-September), the average GPP regrowth rate was 10 g C m-2 day-1. We did not find a significant trend for GPP regrowth rates over the 20 years. The most important drivers of GPP regrowth rates were air temperature and light, while water-related drivers dominated regrowth rates during summer droughts (e.g., 2015 and 2018). Nitrogen fertilization did not play a key role in GPP regrowth rates. Moreover, sward renewal years resulted in either very large CO2 losses (in 2012) or in reduced CO2 uptake rates (in 2021), most likely caused by the different timing of the renewal, i.e., February vs. August, respectively. Thus, our study provides novel insights into climate-smart management options and helps to develop mitigation strategies for current and future climate risks.

How to cite: Wang, Y., Feigenwinter, I., Hörtnagl, L., and Buchmann, N.: Impact of management on CO2 fluxes and drivers of regrowth rates in a temperate grassland during 20 years of measurements, EGU General Assembly 2025, Vienna, Austria, 27 Apr–2 May 2025, EGU25-6469, https://doi.org/10.5194/egusphere-egu25-6469, 2025.

EGU25-6472 | Orals | BG3.36

Protected meadows more diverse meadows store more carbon in soil than neighboring commercially used meadows. 

Jaroslava Frouzova, Ondřej Mudrak, Yves Murindangabo, Martin Bartuška, and Jan Frouz

In this study, we have explored effect of long-term nature protection on soil carbon storage in meadows. We have selected 30 pairs of meadows, each pair consisted from nature reserve, and neighboring commercially used meadow. In both Meadows we sample soil to 30 cm depth, and established song carbon stock. At the same time, we started plant diversity and community composition in both meadows. 

Comparing carbon stock cross all pairs of meadows, natural reserve store significantly more carbon, which account for about 20 to 30% increase compare to commercially managed meadows. In general carbon stock decrease which increasing depth, but this increase was similar in both commercial as well as protected meadows. The highest carbon stock was found in dry meadows, which were followed by wet meadows, while mesic meadow stores less C and also difference between commercial and protected meadows was less pronounced. There was no difference in aboveground plant biomass between protected and cultural meadows.  Protected meadows we are significantly more diverse than their commercially used counterpart, however there were no direct correlation between plan diversity and carbon stock. Based on that we assume that we assume that beside plant diversity also continuity of undisturbed soils in protected meadows, play role in  soil carbon storage.

How to cite: Frouzova, J., Mudrak, O., Murindangabo, Y., Bartuška, M., and Frouz, J.: Protected meadows more diverse meadows store more carbon in soil than neighboring commercially used meadows., EGU General Assembly 2025, Vienna, Austria, 27 Apr–2 May 2025, EGU25-6472, https://doi.org/10.5194/egusphere-egu25-6472, 2025.

EGU25-7080 | Orals | BG3.36

Unveiling the greenhouse gas mitigation potential for Danish farmers: the SmartField project 

Christian Dold, Ann Britt Værge, Pernille Lund Kasper, Michael Erling-Nielsen, Sander Bruun, Triven Koganti, Anders Bjørn Møller, Dhimas Sigit Bimantara, and Klaus Butterbach-Bahl

The successful implementation of greenhouse gas mitigation measures requires the accurate quantification of emission fluxes in space and time. The SmartfField project comprises a unique infrastructure to measure complete N and C balances in combination with year-round measurements of N2O and other environmentally important GHG and trace gases (NH3, NO/NO2, O3, CO2, CH4). The measurement infrastructure comprises chamber and micrometeorological measurements on two experimental sites (Supersite A and B) on plot and field scale for typical Danish crop rotations, and a mobile eddy-flux and chamber system to deploy elsewhere. The overall aim is to identify greenhouse gas mitigation options which (1) can be easily integrated into existing crop rotations (2) avoid pollution swapping (nitrate leaching and ammonia emissions), (3) do not compromise crop yields, and (4) can be scaled from plot to field. In this framework, the emission factors for different amendments will be calculated, including synthetic and biological nitrification inhibitors, biochar, and rock flour, and their combined effects. The experiments will commence in 2025, and baseline measurements started in March 2024. This included soil mapping using electromagnetic induction (DUALEM-21H) and gamma ray (Medusa 2000) sensors, sensor-guided soil sampling, and soil profile descriptions. The N2O flux was measured using the LI-7820 trace gas analyser and survey chamber on field scale, and continuously with automated chambers inside and outside tractor tracks (n=5). The crop was spring barley (Hordeum vulgare), undersown with grass-clover (Lollium perenne, Trifolium pratense, Trifolium repens). These initial measurements revealed large spatial and temporal variations of soil parameters and greenhouse gas emissions. The ECa varied from 1.8-14.8 mS m-1, indicating substantial soil textural changes. The depth of the A-horizon varied between 22-30 cm, and average topsoil bulk density was higher in the tractor tracks (1.51 vs. 1.36 g cm-3). The N2O flux varied substantially within the field with a daily CV of 51%-138%. The mean daily N2O flux outside the tractor tracks was 64.3 µg N2O-N m-2 d-1, while it was 157.3 µg N2O-N m-2 d-1 inside the tracks. There is a need to account for the observed spatiotemporal variation to correctly assess mitigation measures.

How to cite: Dold, C., Værge, A. B., Lund Kasper, P., Erling-Nielsen, M., Bruun, S., Koganti, T., Bjørn Møller, A., Bimantara, D. S., and Butterbach-Bahl, K.: Unveiling the greenhouse gas mitigation potential for Danish farmers: the SmartField project, EGU General Assembly 2025, Vienna, Austria, 27 Apr–2 May 2025, EGU25-7080, https://doi.org/10.5194/egusphere-egu25-7080, 2025.

EGU25-8163 | Orals | BG3.36

The emission factor paradox: N2O emissions from organic fertilizer exceed those from synthetic N fertilizers on Danish agricultural soils 

Franziska Eller, Nanna Schröder Baggesen, Esben Høegholm Lykke, Leanne Peixoto, Søren O. Petersen, and Cecilie Skov Nielsen

N2O is currently the single most damaging of all ozone-depleting greenhouse gases (GHG) associated with climate change, and agriculture is the primary source of this extremely potent GHG. Direct N2O emissions from agricultural fields constitute about 21 % of all greenhouse gases emitted by agriculture in Denmark. Serious efforts for N2O mitigation must be taken to limit global warming, and rigorous monitoring and correct documentation of national greenhouse gas emissions are at the forefront of this endeavor. The Danish National Inventory Report for greenhouse gases uses the Tier 1 default emission factor (EF) of 1% for mineral soils, assuming 1% of N input as fertilizer is emitted as N2O. A refinement provided by the IPCC in 2019 suggests using specific land-use categories: 1.6% for synthetic fertilizers and 0.6% for organic fertilizers in wet climates like Denmark. However, studies have shown that this distinction is unsuitable for Danish agricultural conditions, and that especially emissions from synthetic fertilizer are overestimated with both approaches.

We conducted 28 individual field trials under common Danish agricultural management throughout the country from 2022 to 2024, measuring N2O emissions in spring barley and winter wheat during their growing seasons. We were specifically interested in comparing N2O emissions from synthetic vs. organic fertilizers. The average cumulative N2O emissions of synthetic fertilizers ranged from 0.12 to 1.05 kg N2O-N ha-1 in spring barley, and from 0.08 to 1.17 kg N2O-N ha-1 in winter wheat. Average cumulative N2O emissions of organic fertilizers ranged from 0.95 to 1.41 kg N2O-N ha-1 in spring barley, and from 0.19 to 1.30 kg N2O-N ha-1 in winter wheat. All emissions were comparably low throughout trials, treatments and years. Average EF (± S.E.) for synthetic fertilizers were 0.10 ± 0.04 % (spring barley) and 0.16 ± 0.05 % (winter wheat), and for organic fertilizers 0.38 ± 0.03 % (spring barley, cattle slurry), 0.38 ± 0.06 % (winter wheat, pig slurry), and 0.37 ± 0.06 % (winter wheat, digestate) during the growing season. Our results contradict both the default and refined Tier 1 EF provided by the IPCC. In agreement with other studies, we found that N2O EF for synthetic fertilizers were lower than EF for organic fertilizers. Possible explanations for, and implications of this paradox will be discussed. 

How to cite: Eller, F., Schröder Baggesen, N., Høegholm Lykke, E., Peixoto, L., O. Petersen, S., and Skov Nielsen, C.: The emission factor paradox: N2O emissions from organic fertilizer exceed those from synthetic N fertilizers on Danish agricultural soils, EGU General Assembly 2025, Vienna, Austria, 27 Apr–2 May 2025, EGU25-8163, https://doi.org/10.5194/egusphere-egu25-8163, 2025.

EGU25-8413 | ECS | Orals | BG3.36

Drivers of nitrous oxide fluxes in winter wheat 

Fabio Turco, Iris Feigenwinter, Lorenz Allemann, and Nina Buchmann

Nitrous oxide (N2O) is an important greenhouse gas (GHG) and ozone-depleting substance. The agricultural sector is the predominant anthropogenic source of N2O, primarily due to the use of nitrogen (N) fertilizers. Thus, policies are being discussed to reduce N2O emissions across Europe. However, the scarcity of high-resolution N₂O flux data hinders our understanding of the mechanisms driving N2O emissions, and the development of effective mitigation strategies.

In this study, we measured high-resolution (10 Hz) N2O concentration over the duration of a winter wheat cropping season and calculated half-hourly N2O fluxes using eddy covariance. Our objective was to disentangle the roles of management practices, abiotic conditions, and biotic factors affecting N₂O fluxes and to track how their respective contributions change over time. Using a random forest model trained with management, environmental, and vegetation data, we applied SHAP (SHapley Additive exPlanations) analyses to investigate the drivers of N₂O fluxes.

As expected, N fertilization and soil moisture emerged as the main drivers with the largest contributions to the N2O fluxes. Moreover, the net ecosystem exchange of CO2 (NEE) was the third most important driver, highlighting the critical role of plant-microbe competition for soil N. N₂O fluxes indeed peaked during periods of low crop growth, when plant N uptake was limited, leaving available soil N accessible to N₂O-producing microorganisms. This study suggests that applying N fertilizers during periods of high crop N demand, rather than at the onset of the growing season, could significantly reduce N₂O emissions and the GHG footprint of crop production.

How to cite: Turco, F., Feigenwinter, I., Allemann, L., and Buchmann, N.: Drivers of nitrous oxide fluxes in winter wheat, EGU General Assembly 2025, Vienna, Austria, 27 Apr–2 May 2025, EGU25-8413, https://doi.org/10.5194/egusphere-egu25-8413, 2025.

Abstract Both climate warming and increasing nitrogen deposition promote the availability of nitrogen (N) and phosphorus (P) to plants in soil, which may affect ecosystem structure and function. However, studies on the effects of nutrient enrichment on ecosystems have mostly focused on N rather than P, especially in high-altitude areas where N limits plant growth, which hinders the prediction of ecosystem changes under future climate conditions. Using a five-year experiment at an alpine meadow, we quantified the aboveground net primary production (ANPP) stability under three N levels and four P levels, including the interaction of different N and P levels. We also tested possible drivers of the ANPP stability, including plant species richness, asynchrony, dominance, and plant functional group stability. Finally, we used structural equation models to explore how different drivers affect ANPP stability. Results showed: (1) Plant growth in the alpine meadow was limited by soil available-N but not -P, and N enrichment induced P limitation on plant growth. (2) P enrichment promoted species richness, asynchrony and dominant species stability, and consequently increased the ANPP stability. (3) Species asynchrony and dominant species stability were the key mechanisms driving the variation of ANPP stability. These findings highlight the importance of understanding the balance of N and P effects on ecosystem structure and function in order to better predict the impacts of global change on ecosystem stability.

How to cite: jiang, L. and zhao, W.: Phosphorus enrichment increased community stability by increasing asynchrony and dominant species stability in alpine meadow of Qinghai-Tibet Plateau , EGU General Assembly 2025, Vienna, Austria, 27 Apr–2 May 2025, EGU25-9977, https://doi.org/10.5194/egusphere-egu25-9977, 2025.

EGU25-10086 | ECS | Orals | BG3.36

Assessing grassland soil degradation through key soil physical and chemical properties in smallholder farms of Western Kenya 

Habtamu Sibilu, John Quinton, Sonja Leitner, and Mariana Rufino

In humid Africa, grassland degradation is widespread, with overgrazing as a major factor, affecting soil health and structure, and vegetation composition. Understanding this degradation is vital for targeted restoration. We assessed grassland degradation and its effects on soil properties and plant diversity in western Kenya at two contrasting sites —Kuresoi and Nyando—classified as degraded or non-degraded based on grazing intensity and land-use history. We analysed soil carbon (SOC), nutrient concentrations (TN, available P) and aggregate stability. Field measurements included soil resistance and hydraulic conductivity, alongside vegetation inventory.

The results show higher SOC and total nitrogen (TN) in non-degraded topsoil (SOC: 6.66 ± 2.21% in Kuresoi, 2.41 ± 0.51% in Nyando; TN: 0.56 ± 0.188% in Kuresoi, 0.149 ± 0.027% in Nyando) compared to degraded soils (SOC: 4.38 ± 1.37% in Kuresoi, 1.93 ± 1.22% in Nyando; TN: 0.351 ± 0.123% in Kuresoi, 0.172 ± 0.082% in Nyando); low and variable phosphorus content (Kuresoi: 3.17 ± 5.80 µg/g in degraded, 4.13 ± 8.52 µg/g in non-degraded; Nyando: 2.33 ± 2.76 µg/g in non-degraded and 3.96 ± 6.52 µg/g in degraded) across sites. We observed high aggregate stability, ranging from 61.3%–92.6%, across sites. Infiltration rates were higher in non-degraded Kuresoi (463 ± 913 mm/hr) than degraded (40.3 ± 45.6 mm/hr), with similar rates ((76.9 ± 82.1 mm/hr in non-degraded and 69.6 ±99.3 mm/hr in degraded) in Nyando. The soils were generally compacted (1.07–6.7 MPa in Kuresoi; 1.82–10.1 MPa in Nyando), with no significant differences between degraded and non-degraded soils. Species diversity indices, Shannon (H’= 2.69 ±0.39 in non-degraded Kuresoi, and 2.54 ±0.18 in degraded Kuresoi; H’ = 2.85 ± 0.32 in non-degraded Nyando, and 2.75 ± 0.21) and Simpson (D = 0.92 ± 0.03 in non-degraded Kuresoi, and 0.91 ±0.01; D = 0.93 ±0.01 in non-degraded Nyando and 0.92 ± 0.015), indicated high diversity across sites.

The findings indicate that while overgrazing driven degradation affects key soil properties such as phosphorus, compaction, and infiltration rates, some soil characteristics like aggregate stability and species diversity remain resilient. Proper grazing management, coupled with soil organic matter amendments, could improve nutrient availability, restore soil structure, and strengthen grassland resilience.

How to cite: Sibilu, H., Quinton, J., Leitner, S., and Rufino, M.: Assessing grassland soil degradation through key soil physical and chemical properties in smallholder farms of Western Kenya, EGU General Assembly 2025, Vienna, Austria, 27 Apr–2 May 2025, EGU25-10086, https://doi.org/10.5194/egusphere-egu25-10086, 2025.

EGU25-12203 | Orals | BG3.36

Greenhouse gas fluxes from established and emergent grasslands and the implications for nature-based solutions in England.  

Jodie Hartill, Melanie Spiers, Becky Davess, Nicholas Izard, Melanie Stone, Jess Elias, Tamsin Lockwood, and Mike Morecroft


Greenhouse gas flux studies are fundamental to understanding the net emission and removal of greenhouse gases by terrestrial ecosystems. Evidence from UK grasslands is sparse and tends to be from intensive agricultural plots.  

Emerging results from a novel, 24-month study are presented. Carbon dioxide measurements were collected from grasslands across the UK, using the static chamber method. More than 20 parcels were surveyed, with habitats from a range of soil types, sward diversity and management processes, enabling a broader analysis of the variety of grasslands in England.  

Carbon dioxide emissions were detected all year round, thus allowing further analysis of seasonal dynamics. The influence of wider environmental variables, such as moisture and temperature are also explored, with fluxes detected at lower soil moistures than similar studies. These studies will help us to understand the carbon sequestering potential of grassland creation for nature-based solutions as part of the Nature Returns programme.  

How to cite: Hartill, J., Spiers, M., Davess, B., Izard, N., Stone, M., Elias, J., Lockwood, T., and Morecroft, M.: Greenhouse gas fluxes from established and emergent grasslands and the implications for nature-based solutions in England. , EGU General Assembly 2025, Vienna, Austria, 27 Apr–2 May 2025, EGU25-12203, https://doi.org/10.5194/egusphere-egu25-12203, 2025.

The application of nitrogen (N) fertilizers is intrinsically linked to the emissions of nitrous oxide (N2O) and ammonia (NH₃), making their mitigation a critical global concern. One effective strategy involves the use of urease and nitrification inhibitors. Over the past three years, we have conducted multiple field and pot experiments to evaluate the impact of urea combined with urease and nitrification inhibitors on N2O emissions and NH3 volatilization. These studies were performed on calcareous Mediterranean soils (pH ≥ 7.3). Our findings indicate that urease inhibitors reduced NH₃-N volatilization by 25-50%. Nitrification inhibitors significantly decreased N2O emissions. The combined application of urease and nitrification inhibitors reduced N2O emissions by up to 67% within the first two days post-application, with emissions returning to near ambient levels within four days. In contrast, N2O-N fluxes following urea application alone took approximately seven days to return to baseline levels. N2O-N emissions from the double-inhibited urea were highest following irrigation or precipitation in the weeks following N applications, yet with low values (<0.03 mg-N m⁻² d⁻¹). These results highlight the effectiveness of urease and nitrification inhibitors in mitigating N2O and NH3 emissions, contributing to more sustainable agricultural practices.

How to cite: Baram, S.: Effect of urease and nitrification inhibitors on N2O emissions in Mediterranean soils, EGU General Assembly 2025, Vienna, Austria, 27 Apr–2 May 2025, EGU25-12742, https://doi.org/10.5194/egusphere-egu25-12742, 2025.

EGU25-13613 | ECS | Orals | BG3.36

Mapping nitrous oxide emissions across soil water gradients in agricultural fields 

Azeem Tariq, Line Vinther Hansen, Andreas Brændholt, Sander Bruun, and Finn Plauborg

Nitrous oxide (N2O) emissions in agricultural fields exhibit substantial spatial and temporal variability, driven by complex interactions between soil water dynamics and landscape features. We conducted field experiments at two agricultural field sites (Tokkerup and Taastrup) in Eastern Denmark to quantify N2O emissions across soil water gradients. At the Tokkerup site, we quantified the effects of soil water drainage by comparing well-drained and poorly-drained areas. We installed manual and automated chambers to capture the spatial and temporal dynamics of N2O emissions, complemented by continuous monitoring of soil water tables and moisture contents with water wells and soil moisture sensors. At the Taastrup site, we investigated N2O emissions across a soil-water gradient. Twelve spatial spots were selected along a transect across the water gradient to measure N2O fluxes using an Aeris MIRA Ultra analyzer equipped with a manual chamber. Soil water wells and sensors were installed across the gradient to capture the dynamics of water table depths and soil moisture across the field gradient throughout the year. Preliminary results reveal that significantly higher N2O emissions occurred along the periphery of depressions in the field, so these transition areas acted as hot spots of N2O emissions during the crop-growing period. These findings highlight the critical role of soil water dynamics in shaping the temporal and spatial N2O emission patterns and emphasize the potential for soil water management as an important part of strategies to mitigate emissions of N2O.

How to cite: Tariq, A., Hansen, L. V., Brændholt, A., Bruun, S., and Plauborg, F.: Mapping nitrous oxide emissions across soil water gradients in agricultural fields, EGU General Assembly 2025, Vienna, Austria, 27 Apr–2 May 2025, EGU25-13613, https://doi.org/10.5194/egusphere-egu25-13613, 2025.

Nitrous oxide emission from agricultural soils contribute significantly to global greenhouse gas emissions. Fertilizer deep placement (FDP) and reduced application rate of nitrogen fertilizer are considered as a promising strategy to mitigate nitrous oxide emissions from arable soil and increase nitrogen use efficiency of crops. This study was conducted to determine effects of FDP and, FDP with 20% reduced application rate of nitrogen fertilizer (FDP-rf) on nitrous oxide (N2O) emissions, rice yield, and soil properties in paddy soil. The study included three treatments: conventional (C), FDP, and FDP-rf. Rice (Oryza sativa L.) was transplanted on June 7, 2024 and harvested on October 15, 2024. Nitrous oxide flux for each treatment during the cultivation period showed similar patterns affected by the submerged period and fertilizer application. Emissions remained low across all treatments before the mid-term drainage period, and this trend continued during the mid-term drainage period (two weeks). Peaks of N2O flux were observed in FDP-rf and C treatments right after the mid-term drainage period, while FDP maintained consistently low emissions. Subsequently, all treatments returned to low N₂O flux levels. Following the pre-harvest drainage, N₂O flux increased across all treatments, likely due to the availability of residual nitrogen. Among the treatments, FDP exhibited the most stable and minimal N₂O emissions, indicating effective nitrogen retention and consistent control of fluxes. There was a statistically significant difference in cumulative N₂O emissions depending on the fertilization method. Conventional (C) showed the highest emissions (0.8351 ± 0.0408 kg/ha), followed by FDP (0.6259 ± 0.0562 kg/ha) and FDP-rf (0.4140 ± 0.1063 kg/ha). The total and inorganic nitrogen content in the soil varied greatly depending on the fertilization method. For total nitrogen, the highest levels were observed in the conventional (C) treatment (2.11 g/kg) on harvest time, followed by FDP-rf (1.91 g/kg) and FDP (1.23 g/kg). Nitrate levels were significantly reduced in FDP (17.7 mg/kg) and FDP-rf (26.8 mg/kg) compared to C (42.2 mg/kg). Although there was no statistical difference in ammonium levels, the highest value was observed in C (56.7 mg/kg), followed by FDP-rf (54.5 mg/kg) and FDP (43.1 mg/kg). Depending on the fertilization method, the grain yield, rice straw, root, and total biomass weight varied. For grain yield, the highest was observed in FDP (6.69 Mg/ha), followed by C (5.96 Mg/ha) and FDP-rf (5.42 Mg/ha). Fertilizer deep placement reduced N₂O emissions and improved rice yields compared to C. Fertilizer deep placement with reduced nitrogen application further decreased N₂O emissions but resulted in lower yields compared to FDP. These findings suggest that FDP could be a sustainable agricultural practice that mitigates greenhouse gas emissions while maintaining crop yields.

How to cite: Hong, C. O., Kim, S. U., and Chung, S. U.: Deep placement and reduced application rate of nitrogen fertilizer mitigates nitrous oxide emission from rice paddy soil in South Korea, EGU General Assembly 2025, Vienna, Austria, 27 Apr–2 May 2025, EGU25-14196, https://doi.org/10.5194/egusphere-egu25-14196, 2025.

The denitrification process is the main process by which nitrous oxide (N2O) is generated under anaerobic conditions in rice cultivation soil. The denitrification process under anaerobic conditions is carried out by microorganisms. The denitrification process is influenced by the type and availability of carbon sources in the soil. Among the components of rice root exudate, sugars and organic acids provide essential carbon sources for soil microorganisms, and microorganisms help the physiology and growth of rice. The incubation experiment was conducted to determine the effect of sugars and organic acids contained in rice root exudates on N2O emissions from paddy soil. The soil was placed in a plastic bottle (capacity 824 cm3) mixed with glucose and acetic acid at the rates of 0.0, 0.1, 0.2, and 0.4% (wt/wt), and saturated with water to maintain anaerobic condition. Then, 0.15g of urea was added as a nitrogen source. The plastic bottles containing mixed soils were placed in the incubation under dark conditions at 25℃ for 30 days. Gas samples were collected daily during the experiment time, and daily N2O flux and cumulative N2O emissions were measured. Cumulative N2O emissions significantly decreased with increasing addition rate of glucose. Cumulative N2O emissions were 200, 8.51, 4.04, and 2.77 mg/m2/day at the glucose addition rates of 0.0, 0.1, 0.2, and 0.4%, respectively. Cumulative N2O emissions decreased more rapidly with increasing addition rate of acetic acid than that of glucose. Cumulative N2O emissions were 225, 3.02, 2.35, and 1.85 mg/m2/day at the acetic acid addition rates of 0.0, 0.1, 0.2, and 0.4%, respectively. These results suggest that acetic acid was rapidly decomposed and provided and available carbon source to microorganisms involved in denitrification, thereby promoting the process of converting nitrate (NO3-) into nitrogen gas (N2) and minimizing N2O production. In the case of the glucose treatment group, the NO3-/ N2O ratio was 1.18, 33.0, 32.6, and 31.2 and the NH4+/ NO3- ratio was 0.16, 0.13, 0.16, and 0.25 at the rates of 0.0, 0.1, 0.2, and 0.4%, respectively. In the case of the acetic acid treatment, the NO3-/ N2O ratio was 1.13, 97.9, 123, and 151 and the NH4+/ NO3- ratio was 0.15, 0.40, 0.40, and 0.75 at the rates of 0.0, 0.1, 0.2, and 0.4%, respectively. These results showed that the main emission process of N2O during the experiment period was the denitrification process rather than the nitrification process. In addition, the higher NO3-/ N2O ratio in the acetic acid treatment group compared to the glucose treatment group indicates that NO3- was converted to N2 more effectively, reducing N2O emissions.

How to cite: Chung, S. U. and Hong, C. O.: Effects of Acetic Acid and Glucose as a Carbon Source for Denitrification on Nitrous Oxide Emissions from Anaerobic Soil Condition, EGU General Assembly 2025, Vienna, Austria, 27 Apr–2 May 2025, EGU25-14265, https://doi.org/10.5194/egusphere-egu25-14265, 2025.

Rice production feeds > 50% of the world population with 250 million tonnes consumed in 2022 and is expected to continue to rise by a further ~6% by 2030. Favourable climate and soil conditions for growing temperate rice, together with low disease pressure and advanced irrigation systems enables Australia to achieve some of the highest rice yields in the world with low resource inputs. However, currently there remains a lack of complete season baseline datasets for greenhouse gas emissions from Australian rice crops. National and regionally specific greenhouse gas accounting and the global warming potential and mitigation strategies for these cropping systems remain unclear.  Furthermore, recent innovative irrigation and water management practices utilizing low-cost, technology driven irrigation automation in Australia now indicates the potential to further significantly change how rice is grown. Practical implementation of alternate rice growing irrigation techniques, in which the soil is kept between 0 to -20 kPa, without water being permanently ponded during the growing season have been enabled, producing commercial crops of > 13 Mg ha-1. However, these conditions may lead to ‘tradeoff’ emissions of nitrous oxide (N2O), an even more potent greenhouse gas than the more ubiquitous methane (CH4) emissions commonly associated with rice crops. Two rice water management techniques have been compared in the 2023-2024 Austral Summer: i) Conventional drill sown (DIR) in which planted seeds are flushed with water 3-4 times until the crop has developed to the 4th leaf stage (up to 50 days after the first irrigation) followed by continuous flooding until drainage pre-harvest. ii) Water saving practise, locally known as aerobic (AER) in which the crop is flushed intermittently throughout the entire season with standing water being avoided. Methane and N2O emissions have been monitored in commercial fields using non-steady state closed chambers followed by gas chromatography (GC) and a newer laser-based method, optical feedback-cavity enhanced absorption spectroscopy (OF-CEAS). The AER system reduced seasonal CH4 emissions to 1.3 kg CH4-C ha-1 from 32 kg CH4-C ha-1 that were determined in the DIR system. Although, high N2O-N emission peaks of up to 1043 µg m-2 h-1 were recorded, associated with rainfall and fertilizer application events, total seasonal fluxes suggest that the adoption of this alternative irrigation practise can reduce the global warming potential of rice crops by 51% compared with conventional management. Because both crops were managed for yield potential, when gas emissions were related to rice productivity, yield scaled emissions were 97 kg CO2eq Mg-1 season-1 (DIR) and 47 kg CO2eq Mg-1 season-1 (AER), the lowest that have ever been recorded globally.

How to cite: Quayle, W., Marston, E., Taylor, S., and Hornbuckle, J.: Measurement of methane and nitrous oxide emissions from Australian rice grown under conventional and water saving irrigation practises., EGU General Assembly 2025, Vienna, Austria, 27 Apr–2 May 2025, EGU25-14692, https://doi.org/10.5194/egusphere-egu25-14692, 2025.

EGU25-14766 | ECS | Orals | BG3.36

Estimating soil organic carbon stocks in dehesa ecosystems (Toledo, Spain) 

Joaquín Cámara, Sara Sánchez, Luís André Mendes, Melanie Estrella, and Marta Benito

Dehesa ecosystems, traditional silvopastoral systems in the Iberian Peninsula, are characterized by scattered trees and pastures extensively grazed by livestock. These systems provide critical ecosystem services, including soil organic carbon (SOC) storage, which helps mitigate the negative impacts of livestock production and might support farm economic sustainability through potential carbon (C) credits. However, accurately estimating SOC in dehesa soils is challenging due to their high spatial variability caused by scattered trees and grazing patterns, which create SOC “fertility islands” under tree canopies.

This study evaluates how different grassland management practices affect SOC storage in dehesa soils and determines optimal methodologies for estimating SOC stocks despite soil heterogeneity. Research was conducted on an organically managed farm in Alcañizo (Toledo, Spain), comparing fields with rotational and semi-continuous grazing systems, which differ in grazing frequency and resting periods. SOC and bulk density were measured in soil samples collected from 0–10, 10–20, and 20–30 cm depths on a 20 × 20 m grid. Four geospatial methods were used to estimate SOC stocks: IDW (Inverse Distance Weighting), Ordinary Kriging (OK) with 6- and 12-point radio, and soil units zonation.

Results revealed that SOC stored between 10–30 cm depth (1,724 ± 825 g C m-2) was comparable to that in the top 10 cm (1,876 ± 641g C m-2), underscoring the need to sample at least 30 cm for comprehensive SOC estimation. Trees significantly increased SOC storage by 56% and 34% in soils under the trees compared to open grassland soils in the rotational and semi-continuous management systems, respectively. Regarding management practices, the arithmetic mean of SOC stocks (0-30 cm) was slightly higher under semi-continuous management (3,861 ± 1,286 g C m²) compared to rotational management (3,339 ± 1,334 g C m²).

While SOC estimates were similar across geospatial methods and arithmetic means due to the large number of sampling points, IDW best represented SOC accumulation under trees, and soil unit-based methods identified SOC accumulation due to topography. Conversely, OK with a 12-point radius poorly captured SOC heterogeneity. The choice of geospatial estimation method significantly influences SOC stock estimates.

In conclusion, future SOC assessments in dehesa ecosystems should account for their high spatial variability by increasing sampling density and applying diverse estimation methods. This approach will improve the reliability of SOC stock estimates, aiding both ecological studies and C credit calculations.

How to cite: Cámara, J., Sánchez, S., Mendes, L. A., Estrella, M., and Benito, M.: Estimating soil organic carbon stocks in dehesa ecosystems (Toledo, Spain), EGU General Assembly 2025, Vienna, Austria, 27 Apr–2 May 2025, EGU25-14766, https://doi.org/10.5194/egusphere-egu25-14766, 2025.

EGU25-16064 | ECS | Posters on site | BG3.36 | Highlight

What evidence exists relating the impact of different grassland management practices to soil carbon in livestock systems? A systematic map in progress 

Eduardo Vázquez, Camille Rousset, Carmen Segura, Anina Gilgen, Marta Alfaro, Luis André Mendes, Mike Dodd, Batnyambuu Dashpurev, Mike Bastidas, Julián Rivera, Lutz Merbold, Markus van der Meer, Jacobo Arango, Laura Cárdenas, Marta Benito, and Julián Chará

Grasslands play a crucial role in supplying essential resources for the livestock industry and in supporting other ecosystem services such as biodiversity preservation and soil carbon (C) storage. However, the ability of these ecosystems to maintain these services is increasingly at risk due to over-exploitation, environmental degradation, and climate change, particularly weakening their ability to effectively store C in soils. Restoring degraded grasslands is a practical and cost-effective approach to mitigating climate change by increasing soil C storage while enhancing productivity and improving ecosystem resilience. The potential for C sequestration in these ecosystems is highly variable, influenced by factors such as climate, biome type, soil depth, and management. Better management requires addressing the existing gaps in research and resources.

Using a systematic mapping approach, this project aims to build a comprehensive global inventory of studies examining the effects of different management practices on soil C. The outcomes of this approach will be used to identify well-researched areas suitable for systematic reviews, as well as knowledge gaps for further research, ultimately enhancing our understanding of the evidence in this field.

We formulated the research question to guide the systematic map protocol using the PICO framework, in line with established standards for systematic evidence synthesis. A preliminary search string was developed by integrating search terms corresponding to the Population (permanent grasslands), Intervention (varied management practices), and Outcome (soil C and related terms) categories, along with an additional category for study types (focused on farm and field experiments). A comprehensive search of both peer-reviewed and grey literature was performed across several databases, including Web of Science, Scopus, CABI, Google Scholar, and specialised platforms such as Agrotrop. Searches were conducted in English, Spanish, Portuguese, French, German, and Mongolian (the language skills of the team). Data extraction was structured into four key sections (article information, PICO categories, study characteristics, and measurable parameters), which will be used to generate tables, figures, and evidence maps to form the systematic map. The entire process of literature screening and data extraction was performed using the software Covidence.

The literature search resulted in the identification of over 30,000 references, of which approximately 3,000 were selected for further analysis following a thorough full-text eligibility criteria screening. In this presentation, we will walk through the flow diagram that captures each step of the literature search and screening process, share the data extraction table to provide insights into the outcomes, and offer a preliminary assessment at the global distribution map of studies involved. This includes an overview of the primary grassland management practices assessed. In addition, critical questions will be discussed: i) is there underrepresentation of developing countries in the literature, where vast grassland areas often suffer from intense degradation? ii) Is our knowledge influenced by a potential overrepresentation of specific forage species, management practices or climatic conditions? These findings will enhance our understanding of the existing evidence on the impact of grassland management on soil C, paving the way for a more effective allocation of future efforts and resources in this field.

How to cite: Vázquez, E., Rousset, C., Segura, C., Gilgen, A., Alfaro, M., Mendes, L. A., Dodd, M., Dashpurev, B., Bastidas, M., Rivera, J., Merbold, L., van der Meer, M., Arango, J., Cárdenas, L., Benito, M., and Chará, J.: What evidence exists relating the impact of different grassland management practices to soil carbon in livestock systems? A systematic map in progress, EGU General Assembly 2025, Vienna, Austria, 27 Apr–2 May 2025, EGU25-16064, https://doi.org/10.5194/egusphere-egu25-16064, 2025.

EGU25-16123 | ECS | Orals | BG3.36

Evidence synthesis of soil carbon dynamics: A multi-scale meta-analysis integrating land-use change, conservation practices, and environmental stressors 

Yuan Li, Narasinha Shurpali, Yangzhou Xiang, Qingping Zhang, Zhou Li, Song Cui, and Scott Chang

Systematic evidence synthesis in soil science is crucial for developing effective climate mitigation strategies and sustainable land management practices. This study presents an integrated meta-analytical framework synthesizing three interconnected domains of soil carbon dynamics: land-use transitions, conservation management, and emerging environmental stressors. Through quantitative analysis of peer-reviewed studies, we evaluated the multifaceted responses of soil organic carbon (SOC) and associated biogeochemical processes to management interventions and environmental changes. Land-use conversion analysis suggested that grassland restoration from croplands significantly enhances SOC (16%) and total nitrogen (12%), while inducing substantial shifts in microbial stoichiometry (C:P ratio +57.9%). Conservation management practices, particularly no-tillage with residue retention, increased SOC stocks (13%) relative to conventional tillage, accompanied by enhanced microbial biomass carbon (33%) and nitrogen (64%). The implementation of grass coverage in orchards further augments these benefits, increasing microbial abundance (52.6%) and diversifying enzyme activities (15-71%). Environmental factors, including mean annual temperature, precipitation, and soil texture, emerged as critical drivers of these responses across all management interventions. Analysis of emerging stressors found that drying-rewetting cycles significantly increased soil carbon dioxide emissions (35.7%), while microplastic contamination enhanced nitrogen-cycling enzyme activities (7.6-8.0%) and SOC dynamics in polymer-specific patterns. Meta-regression analyses identified key thresholds and optimal conditions for maximizing soil carbon sequestration potential across different environmental contexts. This comprehensive evidence synthesis indicates the interconnected nature of soil carbon responses to management and environmental change, while establishing quantitative parameters for context-specific interventions. The findings provide support for policy frameworks promoting integrated approaches to soil conservation and climate-smart management strategies, particularly in vulnerable agricultural systems facing multiple environmental stressors.

How to cite: Li, Y., Shurpali, N., Xiang, Y., Zhang, Q., Li, Z., Cui, S., and Chang, S.: Evidence synthesis of soil carbon dynamics: A multi-scale meta-analysis integrating land-use change, conservation practices, and environmental stressors, EGU General Assembly 2025, Vienna, Austria, 27 Apr–2 May 2025, EGU25-16123, https://doi.org/10.5194/egusphere-egu25-16123, 2025.

EGU25-16319 | ECS | Orals | BG3.36

Organic Fertilizers Application: Impacts on VOCs and Air Quality Implications 

Yang Liu, Florence Lafouge, Anaïs Feron, Céline Decuq, Florent Levavasseur, Benjamin Loubet, and Raluca Ciuraru

Organic fertilization has been gaining increasing attention in recent years due to its significant soil health benefits and its alignment with European environmental and agricultural strategies. A considerable percentage (10.4% in 2022) of agricultural fields across Europe currently incorporate organic fertilizers into their management practices one or two times/year, and this proportion is projected to increase by 25% by 2030. Consequently, the environmental impacts associated with organic fertilization, particularly volatile organic compounds (VOCs) emissions, which tightly connected with air quality and health risk through their contribution to secondary pollutants, have become a critical area of study but remain poorly understood. To address these concerns, the SOFORA project was established to quantify agricultural gas emissions, including VOCs, nitrogen oxides (NOx), ammonia (NH₃), ozone (O₃) and particle matters through laboratory measurements and field campaigns. The project also aims to develop robust models to estimate emission levels resulting from the application of various types of organic fertilizers under different agricultural conditions.

During the laboratory measurements conducted as part of the SOFORA project, the dominant VOC profiles and their magnitudes were found to be highly dependent on the specific type of organic fertilizer applied. To investigate these emissions under real-world conditions, eddy covariance techniques and proton transfer reaction mass spectrometry (PTR-MS) were utilized. Field experiments were carried out in the spring and autumn of 2023 at two agricultural sites in France: a wheat field and a white mustard cover crop field. Both experiments ensured consistent crop field footprints within the measurement zones, enabling reliable data collection and an accurate representation of emission dynamics in agricultural environments.

Field measurements confirmed the short-term but significant release of gases and their potential impact on air quality following organic fertilization. VOC emissions were observed to persist for over seven days post-application for both fertilization types. Approximately 2% of the total applied carbon was estimated to be emitted as VOCs from green waste and digestates, respectively. Peak emission fluxes were approximately 85,000 μg m⁻² h⁻¹ and 53,000 μg m⁻² h⁻¹ for total VOC emissions at noon on the first day after application of green waste and digestates, respectively. VOC emissions were dominated by acetic acid, methanol, and acetaldehyde for green waste applications, and by methanol, isoprene, and acetone for digestates. These compounds are estimated to have a high potential contribution to ground-level ozone and/or aerosol formation.

Volatilisation of organic fertilizers may contribute much more significantly than expected to atmospheric burden, leading to broader environmental impacts such as air quality deterioration and nitrogen deposition. Further high-resolution measurements are needed to refine our understanding of these processes and develop strategies to mitigate potential trade-offs between sustainable soil management and environmental protection.

How to cite: Liu, Y., Lafouge, F., Feron, A., Decuq, C., Levavasseur, F., Loubet, B., and Ciuraru, R.: Organic Fertilizers Application: Impacts on VOCs and Air Quality Implications, EGU General Assembly 2025, Vienna, Austria, 27 Apr–2 May 2025, EGU25-16319, https://doi.org/10.5194/egusphere-egu25-16319, 2025.

EGU25-16508 | ECS | Orals | BG3.36

From Fertilizer to Flux: Investigating N2O Emissions in Compacted Cultivation Systems 

Elysia Lewis, Matteo Longo, Sebastiano Rocco, Nicola Dal Ferro, Miguel Cabrera, Barbara Lazzaro, and Francesco Morari

Agricultural soils are a significant source of nitrous oxide (N2O) emissions, primarily driven by denitrification and nitrification pathways. Recently, emissions appeared to be strictly related to soil structure characteristics, which may also play a substantial role in the emission pathways. Among these characteristics, the extent to which soil compaction impacts N2O emissions is still debated. To investigate this, a three-year lysimeter experiment was conducted to assess N2O emissions under five cultivation systems with four replicates each: bare soil (BS), conventional (CV), conventional + cover crop (CC), conservation with shallow soil compaction (0-25 cm, CA1), and conservation with deep soil compaction (25-45 cm, CA2). Maize and grain sorghum were grown as main crops, fertilized using solid digestate (300 kg N ha-1). Continuous automatic measurements of N2O emissions were collected using a non-steady state through-flow chamber system and an FTIR gas analyzer, capturing up to seven flux measurements for each chamber per day. Daily emissions were split into four periods per year. The relative importance of nitrification and denitrification to the flux of N2O was hinted at by concurrently measuring NOx emissions and the water-filled pore space (WFPS) and soil temperature measured in the 0-30 cm profile. Additionally, 280 soil samples per year were collected in the 30-days post-fertilization from 0-5 cm and 5-15 cm depths for pH analysis and monitoring ammonia and nitrate pool dynamics. A mixed-effects model was used to test sub-daily emissions. The most pronounced N2O emissions were observed during the initial two weeks following fertilization, with maximum observed emissions highest in CC (208 g ha-1 d-1) and lowest in CA2 (53 g ha-1 d-1) for 2023. Notably, CA2 consistently exhibited lower cumulative N2O emissions, suggesting a complex interaction between management practices and soil conditions. These findings highlight the importance of soil structure and cultivation system in managing N2O emissions.

How to cite: Lewis, E., Longo, M., Rocco, S., Dal Ferro, N., Cabrera, M., Lazzaro, B., and Morari, F.: From Fertilizer to Flux: Investigating N2O Emissions in Compacted Cultivation Systems, EGU General Assembly 2025, Vienna, Austria, 27 Apr–2 May 2025, EGU25-16508, https://doi.org/10.5194/egusphere-egu25-16508, 2025.

EGU25-17689 | ECS | Orals | BG3.36

The effect of crop establishment system on soil heterotrophic respiration pre- and post-establishment: initial results. 

Keskes Mohamed Islam, Forristal D. Patrick, Lanigan Gary, Schmidt Olaf, and Magdalena Necpalova

Soil heterotrophic respiration is the process by which carbon stored in soil is released into the atmosphere as CO₂ through microbial breakdown of organic matter. This process influences the balance between carbon storage and release, impacting soil carbon levels. Factors such as soil temperature, soil moisture, and the availability of organic material determine CO₂ emissions. Tillage practices alter this soil respiration process by changing soil structure, impacting on airflow, and microbial activity, which influence decomposition rates and CO₂ fluxes. Understanding these interactions is critical for sustainable farming and reducing greenhouse gas emissions from soils. This study explored the effects of different wheat establishment systems: plough (P), minimum tillage (MT), and direct drilling (DD), on the heterotrophic respiration in a long-term plot-scale experiment at Teagasc Oak Park, Ireland. Treatments were replicated four times in a randomized block design on a site where P and MT treatments were in place since 2001, with DD practiced since 2021. Measurements were taken in situ using closed chambers and a portable FTIR gas analyser (Gasmet GT5000 Terra) from September 2024 to the end of December 2024, with plans for continued monitoring beyond this timeframe. For analysis, the experimental timeline was divided into two phases: Period 1 (P1), starting from the 9th of September (following the MT event) and ending on the 10th of October (the ploughing day), and Period 2 (P2), continuing from this point to the last measurement taken in December 2024. Results demonstrated that tillage treatments significantly influenced soil respiration. During P1, MT consistently displayed higher daily CO2 emissions due to soil disturbance and incorporation of crop residues, DD and P did not differ significantly from each other. With lower temperatures in P2, MT sustained a significant greater flux compared to the other treatments, supported by its great soil moisture retention and moderate sensitivity to temperature variations (r = 0.569).  While ploughing at the start of P2 P resulted in a temporary spike in CO₂ fluxes on the P plots, this diminished rapidly. With emissions strongly influenced by temperature variations (r = 0.603), this decline was further driven by a significant drop in air temperature and P's limited soil moisture retention, which may have suppressed microbial activity. This resulted in lower overall soil respiration fluxes from P compared to MT but not significantly different from those of DD in the reported time frame. Cumulative fluxes further emphasized these differences: MT recorded the highest emissions (577.39 kg CO₂-C ha⁻¹), followed by P (470.89 kg CO₂-C ha⁻¹) and DD (394.74 kg CO₂-C ha⁻¹). These findings highlight the varying impacts of tillage practices on soil carbon dynamics driven by an interaction with environmental factors such as soil moisture and temperature.

Keywords: Soil heterotrophic respiration, Tillage practices, Carbon dynamics, Greenhouse gas emissions

How to cite: Mohamed Islam, K., D. Patrick, F., Gary, L., Olaf, S., and Necpalova, M.: The effect of crop establishment system on soil heterotrophic respiration pre- and post-establishment: initial results., EGU General Assembly 2025, Vienna, Austria, 27 Apr–2 May 2025, EGU25-17689, https://doi.org/10.5194/egusphere-egu25-17689, 2025.

EGU25-18698 | ECS | Orals | BG3.36

Comparison of miniature mid-infrared absorption spectroscopy analyzers with gas chromatography for the quantification of soil greenhouse gas fluxes using the closed chamber method 

Morten Möller, Wolfgang Aumer, Christian Eckhardt, Carolyn-Monika Görres, Christian Bruns, and Claudia Kammann

Closed chamber measurements are still the most common approach for measuring the exchange of greenhouse gases (GHG) between soils and the atmosphere in terrestrial ecosystems. Closed chambers can either be employed as static (discrete gas sampling with syringes and subsequent gas chromatographic analysis) or as dynamic chambers (in-field connection to a portable gas analyzer for real-time gas concentration measurements). Two well-known advantages of real-time continuous gas measurements at high frequencies (seconds to Hertz) are the reduction of chamber closure periods as well as the substantially lower minimum detectable flux (MDF). During the past two decades, the technological development of portable fast response analyzers has seen tremendous leaps and new manufacturers are emerging on the scene. In our pilot study, we compared the performance of two new mid-infrared absorption spectroscopy analyzers (a MIRA Ultra N2O/CO2 and a MIRA Ultra Mobile LDS: CH4/C2H6 analyzer, Aeris Technologies, USA) with the performance of a gas chromatograph (Bruker Model 450, Bruker Corp., USA) for the quantification of CO2, CH4, and N2O fluxes under field conditions in a cropland. For the closed chamber measurements, both analyzers were connected to a single chamber, running in parallel, while simultaneously discrete gas samples were taken with a syringe at six discrete time points throughout the chamber closure times for the subsequent gas chromatographic analysis. Measurements took place at two separate days covering lower and higher soil gas fluxes. Regarding CO₂ fluxes, the results demonstrated a strong agreement between the methods, with minimal deviations for both higher and relatively smaller fluxes (normalized root mean square error, nRMSE < 12.5%). A high level of agreement between the methods was also observed for N₂O fluxes on the first measurement day, when a N₂O pulse occurred (nRMSE < 9.5 %). However, on the second measurement day, the agreement was considerably lower for very small negative fluxes. For CH₄, the agreement between methods was very low (nRMSE < 213.6%). Due to the higher analytical precision of the MIRAs, the MDFs for the closed dynamic chamber measurements were considerably lower compared to the closed static chamber measurements. This enabled the detection of significant fluxes even at very low flux rates which could not be distinguished from the background measurement noise of the closed static chamber method using GC analysis. The discrepancies between the two approaches were foremost restricted to fluxes which were below the closed static chamber MDFs. The presented results will support an informed selection of suitable gas analytical methods for measuring GHG fluxes in the field and help the soil flux research community to keep up with the rapidly developing market of portable fast-response analyzers.


(Wolfgang Aumer and Morten Möller contributed equally to this study and abstract and are considered co-first authors.)

How to cite: Möller, M., Aumer, W., Eckhardt, C., Görres, C.-M., Bruns, C., and Kammann, C.: Comparison of miniature mid-infrared absorption spectroscopy analyzers with gas chromatography for the quantification of soil greenhouse gas fluxes using the closed chamber method, EGU General Assembly 2025, Vienna, Austria, 27 Apr–2 May 2025, EGU25-18698, https://doi.org/10.5194/egusphere-egu25-18698, 2025.

EGU25-18962 | ECS | Posters on site | BG3.36

A 2.5-Year Eddy Covariance Study of Nitrous Oxide Fluxes in Winter Barley, Sugar Beet and Winter Wheat: Responses to Environmental and Management Factors 

Paulina Englert, Christian Markwitz, Mubaraq Olarewaju Abdulwahab, Nicholas Cowan, Nina Buchmann, Alexander Knohl, Stefan Siebert, and Ana Meijide

Nitrous oxide (N2O) fluxes exhibit a high temporal and spatial variability, making their accurate quantification challenging. Recently, the eddy covariance (EC) technique has become available for N2O measurements, providing non-intrusive spatially integrated flux data at high temporal resolution (half-hourly fluxes from 10 Hz raw data), which can give valuable insights in the underlying drivers when combined with ancillary measurements.

Since April 2022, we measure N2O fluxes by EC using a fast response closed-path N2O analyzer (Los Gatos Research, San Jose, USA) in an agricultural field in central Germany (51.49° N, 9.93° E; Reinshof, DE-Rns). The crop sequence during the study period was winter barley - white mustard (as cover crop) - sugar beet - winter wheat. Additionally, net ecosystem exchange (NEE) of carbon dioxide, ancillary meteorological and soil variables as well as plant performance were measured at the EC tower and crop management was recorded.

The N2O flux measurements over the 2.5 years showed a large temporal variability across seasonal conditions and management activities. Ten particularly large N2O emission peaks with fluxes higher than 120 and up to 950 μg N2O-N m-2 h-1 that last around three days were detected. Those peaks were induced by nitrogen (N) fertilization, rainfall, freeze-thawing or tillage events in the field. From April 2022 to September 2024, we observed cumulative N2O emissions of 3.57 kg N2O-N ha-1 and calculated an emission factor of 0.89% of applied N. We estimated that 23.4% of the cumulative N2O emissions were induced by three rainfall events and one freeze-thawing event, and were thus not directly associated with fertilizer application, while 32.2% occurred within three weeks after N fertilizations. Beside the N2O emission peaks, we observed periods with N2O uptake in 2023 and 2024 when plants showed their highest leaf area index.

This data set, providing several years of N2O fluxes at half-hourly resolution, can help us to better constraint N2O budgets of crop cultivation. Improving our understanding about the interactions of management practices and environmental conditions that lead to higher N2O emissions can help developing strategies for mitigation of N2O emissions.

How to cite: Englert, P., Markwitz, C., Abdulwahab, M. O., Cowan, N., Buchmann, N., Knohl, A., Siebert, S., and Meijide, A.: A 2.5-Year Eddy Covariance Study of Nitrous Oxide Fluxes in Winter Barley, Sugar Beet and Winter Wheat: Responses to Environmental and Management Factors, EGU General Assembly 2025, Vienna, Austria, 27 Apr–2 May 2025, EGU25-18962, https://doi.org/10.5194/egusphere-egu25-18962, 2025.

EGU25-19451 | ECS | Posters on site | BG3.36

Improving the temporal variability of agricultural greenhouse gas emissions for Germany 

Matteo Urzí, Sabine Banzhaf, Richard Kranenburg, Xinrui Ge, Ilona Jäkel, Markus Thürkow, Hannah Jonas, and Martijn Schaap

Greenhouse gas (GHG) emissions, particularly carbon dioxide (CO₂) and methane (CH₄) from human activities, are the primary drivers of global warming. Additionally, methane contributes to ozone formation and therefore contributes to air pollution, posing risk to human health. Agriculture is a significant contributor to the global GHG emissions, with methane primarily emitted through enteric fermentation in livestock and manure management practices, while carbon dioxide largely arises from the use of machinery in various land management operations. Hence, to better understand and represent the intra - annual variability of GHG emissions within the agricultural sector, it is crucial to obtain spatial and temporal information about all contributing activities.

Within the ARTEMIS project we are further developing and refining a dynamic emission model to capture the spatio-temporal variability of anthropogenic GHG and air pollutant emissions in Germany and its surroundings. Inside the emission model the spatial allocator estimates the total yearly emissions with the gridded GHG emission inventory of TNO - CAMS for Europe and UBA - GRETA for Germany.

To account for temporal variability, different agricultural emission activities are parameterized individually. The temporal emission distribution for machinery use during land management operations gets estimated by deriving the emission timings from phenology observation data from the German Weather Service as well as using remote sensed phenology data from the COPERNICUS project. Additionally we incorporate an agricultural timer (Ge et al. 2020, 2022) developed to estimate the start of the growing season, which allows us to derive key dates such as sowing and manure application. The temporal variability of methane emissions from enteric fermentation are parameterized using literature-based emission factors linked to livestock feed intake and animal population data from national statistical agencies.

These emission datasets were integrated into a LOTOS-EUROS model simulation to demonstrate their added value. The comparison using the new dynamic emission model indicated an improved representation of intra-annual GHG concentration variability. Furthermore also the depiction of the diurnal concentration cycle showed a better alignment with measured concentrations. Additionally, evaluation against ICOS tall tower measurements revealed improvements in correlation (up to 0.06) and reductions in root mean squared error (up to 15%) between modeled and observed concentrations at nearly all stations. These findings highlight the importance of disentangling the agricultural GHG emissions into seperate subsectors, enabling a more accurate depiction of temporal variability in anthropogenic emissions. We conclude that further improving the spatio-temporal emission information should be extended on other sectors such as the industry and energy, the road traffic or the landfills as well.

How to cite: Urzí, M., Banzhaf, S., Kranenburg, R., Ge, X., Jäkel, I., Thürkow, M., Jonas, H., and Schaap, M.: Improving the temporal variability of agricultural greenhouse gas emissions for Germany, EGU General Assembly 2025, Vienna, Austria, 27 Apr–2 May 2025, EGU25-19451, https://doi.org/10.5194/egusphere-egu25-19451, 2025.

EGU25-20008 | ECS | Orals | BG3.36

Global Grassland Productivity Over Two Decades: 30m Bimonthly and Annual Gross Primary Productivity through Light Use Efficiency Modeling 

Mustafa Serkan Isik, Leandro Parente, Davide Consoli, Lindsey Sloat, Vinicius Mesquita, Laerte Guimaraes Ferreira, Radost Stanimirova, Nathália Teles, and Tomislav Hengl

This study presents a high-resolution mapping framework for estimating GPP in grasslands over the period 2000-2022 at a spatial resolution of 30 meters. The GPP values are derived utilizing a Light Use Efficiency (LUE) model using 30-m Landsat reconstructed images coupled with 1-km MOD11A1 temperature data and 1-degree CERES Photosynthetically Active Radiation (PAR). To implement the LUE model, we used the biome-specific productivity factor (maximum LUE parameter) as a global constant. This resulted in a productivity map that did not require specific land cover maps as inputs, allowing data users to calibrate GPP values accordingly to specific biomes/regions of interest. We then derived GPP maps for global grassland ecosystems based on maps produced by the Global Pasture Watch research consortium and calibrated the GPP values using the maximum LUE factor of 0.86 gCm−2d−1 MJ-1. Nearly 500 eddy covariance flux towers were used for validating the GPP estimates, resulting in R2 between 0.48-0.71 and RMSE below 2.3 gCm−2d−1 considering all land cover classes. The final time-series of maps (uncalibrated and grassland GPP) will be available as bimonthly and annual periods in Cloud-Optimized GeoTIFF (23 TB in size) as open data (CC-BY license). Users will be able to access the maps using the SpatioTemporal Asset Catalog (http://stac.openlandmap.org) and Google Earth Engine upon publication. In the meantime, beta versions of the product can be accessed through the Global Pasture Watch Early Access data program (https://survey.alchemer.com/s3/7859804/Pasture-Early-Adopters). This dataset is the first global GPP time-series map with a spatial resolution of 30 m covering a 23 year period to our knowledge.

How to cite: Isik, M. S., Parente, L., Consoli, D., Sloat, L., Mesquita, V., Ferreira, L. G., Stanimirova, R., Teles, N., and Hengl, T.: Global Grassland Productivity Over Two Decades: 30m Bimonthly and Annual Gross Primary Productivity through Light Use Efficiency Modeling, EGU General Assembly 2025, Vienna, Austria, 27 Apr–2 May 2025, EGU25-20008, https://doi.org/10.5194/egusphere-egu25-20008, 2025.

EGU25-20546 | Orals | BG3.36

Multi-year GHG flux measurements from grasslands on boreal mineral and drained organic soils 

Narasinha Shurpali, Olli Peltola, Yuan Li, Janne Rinne, and Perttu Virkajärvi

Managed grasslands are valuable from the viewpoint of the various ecosystem services they provide. They not only provide nutritious feed for the dairy cows and benefit a fertile soil but are also considered to have the potential to play a key role in greenhouse gas mitigation, particularly in terms of carbon sequestration. While grasslands on mineral soils vary anywhere from being a small sink to a source of GHGs, drained organic soils used for agriculture are a huge source of GHG emissions with net positive feedback to climate change. Continuous, year-round GHG flux measurements are therefore, necessary to assess the sustainability of dairy and beef sector under different agroclimatic conditions and soil types. These continuous fluxes represent all management practices such as fertilizer application, biomass harvesting, water table manipulation on organic soils and tillage operations and prevailing climatic conditions. We aim to present eddy covariance measured complete GHG balance of legume and nonlegume grasslands on mineral and drained organic soils under boreal conditions.

How to cite: Shurpali, N., Peltola, O., Li, Y., Rinne, J., and Virkajärvi, P.: Multi-year GHG flux measurements from grasslands on boreal mineral and drained organic soils, EGU General Assembly 2025, Vienna, Austria, 27 Apr–2 May 2025, EGU25-20546, https://doi.org/10.5194/egusphere-egu25-20546, 2025.

EGU25-4646 | Orals | BG3.37 | Highlight

What shapes the environments favorable to methane production in the trunks of living trees 

Daniel Epron, Takumi Mochidome, Nathan Cousteur, Caroline Plain, Takeshi Watanabe, Ryogo Nakada, and Susumu Asakawa

Tree CH4 emissions are high in forested wetland and floodplain forests where tree trunks are viewed simply as pipes transferring CH4 produced in the soil and emitting it into the atmosphere. Trees in upland forests are also able to transfer CH4 from deep soil layers where anaerobic conditions prevail. In addition, CH4 that accumulates in living tree trunks can also be produced by methanogenic archaea in the wood if favourable environmental conditions for CH4 production prevail.

Inconsistent vertical patterns of trunk CH4 emission and internal CH4 concentrations are observed between species or between trees of the same species when CH4 is produced internally. Large radial variations in CH4 emissions is also observed, with for example hotspots located on one side of the tree. Furthermore, large variations in CH4 emissions and internal concentrations from year to year suggest temporal dynamics of methanogenic activity within hotspots. CH4 is the ultimate waste product of the energy metabolism of methanogens, which requires available substrates provided by a cascade of catabolic reactions breaking down macromolecules present in the wood. The inclusion of a biochemical module of CH4 production in physical models of CH4 transport within the trunk requires characterizing what shapes the environments favorable to CH4 production within the trunk, the biochemical processes producing upstream the substrates necessary for methanogenesis and the microbial communities involved in these processes.

The aim of this presentation is to review current knowledge on internal CH4 production and highlight challenges to build a comprehensive biogeochemistry of the trunk of living trees. Wetwood in living tree trunks is for example an ideal anoxic environment for methanogens, and this is where they were first found in the 1970s, but neither a necessary nor a sufficient condition. Methanogenic microbes in the trunk of living trees was recently found ubiquitous. However, the starting point of complex biogeochemical processes, supplying substrates and energy, but also inhibitors, to a unique microbiome in a unique ecological niche, is still not well understood.

How to cite: Epron, D., Mochidome, T., Cousteur, N., Plain, C., Watanabe, T., Nakada, R., and Asakawa, S.: What shapes the environments favorable to methane production in the trunks of living trees, EGU General Assembly 2025, Vienna, Austria, 27 Apr–2 May 2025, EGU25-4646, https://doi.org/10.5194/egusphere-egu25-4646, 2025.

EGU25-5621 | Posters on site | BG3.37

Ecosystem-scale floodplain forest methane exchange  

Natalia Kowalska, Georg Jocher, Adam Bednařík, Hannes Warlo, Kaido Soosaar, and Kateřina Macháčová

Floodplain forests play an important role in the exchange of methane (CH4) with the atmosphere. However, due to climate change and anthropogenic activities, main factors driving this exchange, such as ground water table and soil temperature, are constantly changing. The studied floodplain forest in Lanžhot, Czech Republic, represents nowadays relatively dry conditions.

The main aims of our study were to quantify the CH4 emission on the floodplain forest ecosystem level using the eddy covariance (EC) method, with special emphasis on environmental conditions, turbulence development and footprint, as well as to probe all potential CH4 sinks and sources within the studied ecosystem for arriving at a complete CH4 budget. The ecosystem-scale CH4 fluxes were analysed with regards to the CH4 emissions of water bodies within the EC footprint. For this purpose, 17 chamber measurements were conducted on the waterbodies every two weeks for two weeks periods and EC data were divided into such subperiods accordingly. CH4 fluxes from a stream located within the footprint of the EC tower were measured using floating chambers and bubble traps. Studies were complemented by the analysis of the contribution of trees to the CH4 exchange. For this purpose, stem chambers measured CH4 fluxes on hornbeam trees, one of the main tree species at the study site and in Central Europe. Additionally, CH4 fluxes from the soil were included in the analysis to capture all potential CH4 sources and sinks within the studied ecosystem.

We initially hypothesized that ecosystem-scale CH4 exchange will be negligible. Our results showed, however, that the whole ecosystem is a small but constant CH4 source as we observed an average emission flux of 11.7 mg CH4 m-2 day-1 over the period May 2022 – May 2023. In addition, we observed variability of the CH4 fluxes in relation to the wind direction and to u* (friction velocity, indicator for turbulence development). Further analysis shall answer on the question if more water bodies within a particular wind sector means higher fluxes above the canopy and if higher turbulence is correlated with higher CH4 fluxes above canopy as hotspot emissions are better mixed up. The probed stream was a substantial source of CH4 with median total CH4 flux = 156 mg CH4 m-2 day-1 from April 2022 to May 2023. Ebullition was the dominant pathway of CH4 release throughout the whole monitored period. The relation of water area/footprint area (%) of 17 floating chamber measurements ranged from 3 to 6% and fluxes coming from water bodies contributed to the EC fluxes significantly. From 17 subperiods, 15 of them were characterised by higher EC fluxes than fluxes coming from the water bodies. Two periods showed opposite result, which might indicate on additional sources of methane.

Finally, two models were applied to compare gapfilled data and answer on the question how the methane budget changes if we use different models.

The overall aim of this project is to arrive at a complete picture of all measured sinks and sources of CH4 in the studied ecosystem.

How to cite: Kowalska, N., Jocher, G., Bednařík, A., Warlo, H., Soosaar, K., and Macháčová, K.: Ecosystem-scale floodplain forest methane exchange , EGU General Assembly 2025, Vienna, Austria, 27 Apr–2 May 2025, EGU25-5621, https://doi.org/10.5194/egusphere-egu25-5621, 2025.

EGU25-6032 | Posters on site | BG3.37

Hot spots and hot moments drive (shape) spatiotemporal variations of greenhouse gas fluxes from montane forests  

Junzhu Pang, Guiyao Zhou, Changhui Peng, and Baquerizo Manuel Delgado

   Temperate forest soils are considered as significant sources or sinks for carbon dioxide, methane and nitrous oxide. There are relatively few studies which specifically deal with soil greenhouse gas (GHG) fluxes across slope positions in upland temperate forest. We used static chambers to monitor soil GHG fluxes at three slope position sites (top, middle and bottom) in the Pinus tabulaeformis forest in the Qinling Mountains, China from July 2012 to June 2015. The cumulative soil CO2 and N2O emissions and the CH4 uptake from the three sites ranged between 13.85 to 14.49 t CO2 ha-1 yr-1, 1.04 to 6.48 kg N2O ha-1 yr-1, and 4.78 to 9.01kg CH4 ha-1 year-1, respectively. There were large pulses of CO2 emissions during spring and summer after heavy rainfall or during freezing and thawing cycles. The proportion of the annual flux of CO2 during the 2014 summer could achieve 45.6%, 49.6% and 43.5% at the three sites and during 2013 summer were more than 36% at the bottom and middle positions. At the bottom and middle positions, the proportions of the annual flux of CO2 were more than 33% during the majority of the summer periods. Soil microenvironment (soil moisture, soil temperature and the interaction of these two factors) explained 84.96% variations of CO2 emissions. The emission summits of 10547.1 ug CH4 m-2 h-1, 6256.5 ug CH4 m-2 h-1 and 701.5 ug CH4 m-2 h-1 were observed after the first heavy rainfall in the spring of 2013 at the three sites. The soil of the middle slope position even acted as a year round net weak source of CH4 due to continuous rainfall and mixed with heavy rainfall during the 2014 summer. Soil microenvironment and accumulated rainfall in seven anteceding days (rain_7) explained 31.38% variations of CH4 fluxes. The proportion of the annual flux of N2O that is derived from the 2015 and 2014 freeze-thaw cycles could achieve 38% and 30.6 % at the bottom and top slope positions. Soil microenvironment and rain_7 explained 56.67% variations of N2O fluxes. Due to hot moments and hot spots effects, the contribution of N2O emission to the total global warming potential was much higher than the cutting down effects of CH4 consumption during 2012-2013 or at the middle position site. Our study demonstrated that the middle and bottom position sites were hot spots and the rainfall events during the growing season were triggers of hot moments for all three greenhouse gases. The hot moments and hot spots of the three greenhouse gases are a significant fraction of their total budgets.


How to cite: Pang, J., Zhou, G., Peng, C., and Manuel Delgado, B.: Hot spots and hot moments drive (shape) spatiotemporal variations of greenhouse gas fluxes from montane forests , EGU General Assembly 2025, Vienna, Austria, 27 Apr–2 May 2025, EGU25-6032, https://doi.org/10.5194/egusphere-egu25-6032, 2025.

EGU25-6606 | ECS | Posters on site | BG3.37

Distinct microbial communities drive the CH4 cycles in below and above-ground compartments of tropical peatland cloud forests  

Fahad Ali Kazmi, Ülo Mander, Ramita Khanongnuch, Maarja Öpik, Reti Ranniku, Kaido Soosaar, Mohit Masta, Salla Tenhovirta, Kuno Kasak, Claudine Ah-Peng, and Mikk Espenberg

Peatland cloud forests represent one of the least studied ecosystems regarding methane (CH4) exchange despite their significance in carbon storage and the highly variable soil moisture that results from the presence of clouds in these environments. We aimed to investigate the CH4 exchange in the peat soil and tree stems of two selected tropical cloud forests on Réunion Island (one featuring Erica reunionensis and a second mix of E. reunionensis and Alsophila glaucifolia). Additionally, we explored the soil microbiology in various below- and above-ground forest compartments (soil, canopy soil, leaves, and stems) by exploring gene abundances and the microbial community structure.

In this study, we measured CH4 fluxes from peat soil and tree stems using GC-ECD and LI-COR LI-7810 analyzers, respectively. Additionally, we performed metagenomics and qPCR on selected genes involved in methanogenesis and methanotrophy in the soil and above-ground samples. Soil’s physical and chemical properties were also determined.

The peat soil found in both forests functioned as a net sink for CH4 and a source of CO2, with increased CH4 uptake occurring in soils dominated by endemic tree species E. reunionensis. Additionally, the stems of trees in the mixed forest sites acted as a weak sink for CH4. In these soils, a high abundance of NC10 bacteria (involved in n-DAMO - nitrite/nitrate-dependent anaerobic methane oxidation) was associated with the high soil nitrate (NO3-) levels, CH4 sink values, and CO2 emissions, indicating a high potential for nitrate-dependent oxidation of CH4. The ratio of mcrA (methanogenesis) to pmoA and n-DAMO (methanotrophy) genes was consistently less than 1 in the soil of both forests, whereas it exceeded 1 in the above-ground samples, including cryptogamic canopy soils and tree leaves. Metagenomic analyses revealed that soil had a high prevalence of the xoxF gene, which is associated with n-DAMO, while the above-ground compartments of both forests exhibited a high abundance of methanogenic genes (mcrA and mtr).

The peat soil of tropical cloud forests exhibited a high potential for methanotrophy, with significant CH4 consumption by n-DAMO microbes. In contrast, the above-ground components of these forests may play a notable role in methanogenesis, occurring within cryptogams and leaves, as suggested by the high abundance of mcrA and mtr genes in the leaves and canopy soil.

How to cite: Kazmi, F. A., Mander, Ü., Khanongnuch, R., Öpik, M., Ranniku, R., Soosaar, K., Masta, M., Tenhovirta, S., Kasak, K., Ah-Peng, C., and Espenberg, M.: Distinct microbial communities drive the CH4 cycles in below and above-ground compartments of tropical peatland cloud forests , EGU General Assembly 2025, Vienna, Austria, 27 Apr–2 May 2025, EGU25-6606, https://doi.org/10.5194/egusphere-egu25-6606, 2025.

EGU25-7346 | Posters on site | BG3.37

Methane emissions and production from tree stems of Quercus suber in a Mediterranean forest 

Josep Barba, Roger Fíguls, Josep Maria Trullols, Lluís Bañeras, Vincent Gauci, Laura Llorens, Arturo Pacheco, and Dolors Verdaguer

Upland trees can exchange CH4 with the atmosphere through the stems. Stem emissions could be produced in the soils and transported through the roots, or could be produced in the hardwood by methanogenic archaea inhabiting the trees. However, there is still limited information on how the different origins depend on different species or environmental conditions. There is the general understanding that stem CH4 emissions are controlled by soil moisture conditions, and therefore, trees from water-limited ecosystems might present little (if any) emissions. However, this hypothesis has not been tested yet in water-limited ecosystems, such as Mediterranean ones. Here we present a study on stem CH4 emissions from cork oak (Quercus suber), a drought-adapted species from the Mediterranean basin. The bark of this species (cork) is commonly extracted for business, since it has insulation characteristics. We assessed the effect of cork removal (peeling) on stem emissions, since cork may act as a physical barrier for methane diffusion from the stem to the atmosphere.

We measured CH4 stem emissions from peeled and unpeeled trees at two stem heights, one on the cork extraction zone (bottom part of the stem) and the other above it (unpeeled zone). Additionally, we performed wood anaerobic incubations to assess the CH4 production capacity, and analysed the microbial community composition in the hardwood, sapwood and cork tissues.

Our results showed that cork oaks emitted high CH4 rates (59.83 μmol m-2h-1 on average), which were positively correlated with DBH. Surprisingly, we did not see any effect of cork peeling in CH4 emissions, not even in the measurements performed immediately after the cork removal. We observed, however, a strong vertical pattern for all trees and campaigns, with emissions being higher on the base of the trees. Despite this vertical pattern, usually associated with soil CH4 origin, significant CH4 production in the tree cores, and a positive correlation between stem CH4 fluxes and the abundance of methanogenic-related genes suggest an internal stem origin of CH4. These results suggest that stem internal conditions might be more important controlling stem CH4 emissions than soil or atmospheric environmental conditions.

How to cite: Barba, J., Fíguls, R., Trullols, J. M., Bañeras, L., Gauci, V., Llorens, L., Pacheco, A., and Verdaguer, D.: Methane emissions and production from tree stems of Quercus suber in a Mediterranean forest, EGU General Assembly 2025, Vienna, Austria, 27 Apr–2 May 2025, EGU25-7346, https://doi.org/10.5194/egusphere-egu25-7346, 2025.

EGU25-9586 | Posters on site | BG3.37

Does stem wood methanogenic and methanotrophic activity drive spatial patterns in methane emissions of mature European beech? 

Katerina Machacova, Vojtěch Tláskal, Tomáš Medňanský, Hannes Warlo, and Karel Klem

Trees are known to be methane (CH4) sources and sinks. However, frequently observed large spatial variability in stem CH4 fluxes makes the estimation of net forest ecosystem CH4 exchange difficult. This variability refers not only to large intraspecies variability, but also to variability across vertical stem profiles.

European beech (Fagus sylvatica) is a native and widely grown tree species in upland forests of Central and Southeast Europe. Our previous study detected high spatial variability in stem CH4 emissions among twenty beech trees, which could not be explained by soil CH4 turnover.

We aimed to investigate whether the high variability in beech stem CH4 emissions can be explained by CH4 production and consumption in the studied trees’ stem wood. In August-September 2024, we measured CH4 exchange of eleven mature beech individuals (0.4 m above ground) and of adjacent soil in a temperate montane forest of White Carpathians, Czech Republic, using static chamber systems and spectroscopic gas analysis (FTIR technology). By five trees, stem CH4 fluxes were additionally measured along vertical stem profiles up to 2 m above ground (i.e. in three heights). The measurements were followed by wood core sampling in these profiles for further investigation of potential for CH4 production through methanogenesis and consumption through methanotrophy using incubation of wood samples.

The stem CH4 exchange showed large variation, ranging from CH4 uptake to CH4 emission (from -14.0 to +279 μg CH4 m-2 h-1), whereas the soil was a net CH4 sink with less variation (-41.4 ± 3.5 μg CH4 m-2 h-1). Fourteen days of incubation showed CH4 production in 34% of total tested wood cores. These cores originated from individuals and stem heights with increased CH4 emissions. The net incubation bottle headspace increase of CH4 was linear (R² > 0.7) with values of 0.1 ± 0.02 μg CH4 cm-3 h-1. During 25 days of incubation under anoxic conditions with labelled ¹³C-CH4 in the headspace, the increase in 45CO2/44CO2 ratio was used to monitor oxidation of labelled CH4. Significant net increase in this ratio was detected in several bottles. Interestingly, wood cores with the highest methanogenesis rates showed also faster increase in 45CO2/44CO2 ratio (p<0.001). This suggests that high CH4 production rates in these cores positively influence the community of methanotrophs which are either more abundant and/or more active in these cores. Whether methanotrophic community is represented by anaerobic methanotrophic archaea or by aerobic methanotrophs adapted to hypoxic conditions will be assessed by DNA analysis. Statistical analysis will investigate the relationships between CH4 fluxes, production and consumption to determine the fate of tree-derived CH4, a significant greenhouse gas.


Acknowledgement

This research was supported by the Ministry of Education, Youth and Sports of CR within the programs LU - INTER-EXCELLENCE II [LUC23162] and CzeCOS [LM2023048], and project AdAgriF -Advanced methods of greenhouse gases emission reduction and sequestration in agriculture and forest landscape for climate change mitigation [CZ.02.01.01/00/22_008/0004635]. VT was supported by the Czech Science Foundation (23-07434O).

How to cite: Machacova, K., Tláskal, V., Medňanský, T., Warlo, H., and Klem, K.: Does stem wood methanogenic and methanotrophic activity drive spatial patterns in methane emissions of mature European beech?, EGU General Assembly 2025, Vienna, Austria, 27 Apr–2 May 2025, EGU25-9586, https://doi.org/10.5194/egusphere-egu25-9586, 2025.

EGU25-10193 | ECS | Orals | BG3.37

Flooding and Water Chemistry Drive Soil Biogeochemistry and GHG fluxes in a Coastal Forest  

Rosmery Cruz, Ben Bond-Lamberty, Ashleigh Montgomery, Stephanie Pennington, Angelia Seyfferth, Stephanie Wilson, and Rodrigo Vargas

Coastal ecosystems are highly vulnerable to climate change due to sea level rise, increased storm frequency and intensity, and changes in precipitation patterns. These hydrological disturbances affect soil biogeochemical processes in coastal forests, potentially transforming these upland habitats into wetlands and changing ecological functions. However, the initial impacts on belowground processes and the mechanisms driving GHG fluxes during this transition remain poorly understood. This study investigates how flooding events with different water chemistries influence the production and consumption of GHGs in coastal forest soils under controlled laboratory conditions. Intact soil cores were collected from a temperate deciduous coastal forest in Maryland, USA. Freshwater (FW) and brackish water (BW) pulses were applied to simulate intense rainfall and storm surge events, respectively. Continuous CO2, CH4, and N2O emissions were measured and coupled with air isotopic sampling (δ13C-CO2, δ13C-CH4) and porewater chemistry analyses (DOC, S2-, Fe2+, Fe3+, Mn2+, NH3, NO3-+NO2-, ORP, pH) to identify potential changes in metabolic pathways and characterize the biogeochemical responses. The results underscore the impact of water chemistry on biogeochemical processes, particularly in the BW treatment, which exhibited strong reducing conditions and active microbial metabolism. The elevated salinity and sulfate concentrations were associated with increased emissions of CH4 and N2O. The δ13C-CH4 signature and elevated S2- in porewater indicated the co-occurrence of methylotrophic methanogenesis and sulfate reduction. Elevated NH3 concentrations and NO3-+NO2- production suggested the potential occurrence of dissimilatory nitrate reduction to ammonium (DNRA) and incomplete denitrification. These findings highlight the potential vulnerability of upland coastal forest soils to hydrologic disturbances and the complex interactions involved in the response of these ecosystems to inundation stressors. 

How to cite: Cruz, R., Bond-Lamberty, B., Montgomery, A., Pennington, S., Seyfferth, A., Wilson, S., and Vargas, R.: Flooding and Water Chemistry Drive Soil Biogeochemistry and GHG fluxes in a Coastal Forest , EGU General Assembly 2025, Vienna, Austria, 27 Apr–2 May 2025, EGU25-10193, https://doi.org/10.5194/egusphere-egu25-10193, 2025.

EGU25-11389 | ECS | Orals | BG3.37

The bark side of mangrove methane fluxes: Anatomical insights of the root of emissions in Rhizophora forests 

Julio A. Salas Rabaza, Frédéric Thalasso, Laura Yáñez Espinosa, Eduardo Cejudo, Sunitha R. Pangala, Gabriela Cerón Aguilera, Roberth Us Santamaría, and José Luis Andrade

Tropical wetlands are the largest natural source of methane (CH4) globally. While soils are the primary CH4 emitters, recent studies reveal that trees mediate soil-produced methane, highlighting potential underestimations in current methane and carbon budgets. In mangrove forests, the contribution of trees to local, regional, and global CH4 emissions remains uncertain, despite their significant role as blue carbon reservoirs. Mangrove species exhibit unique physiological and morpho-anatomical adaptations—such as extensive aerenchyma tissues and lenticels—that facilitate gas exchange through their bark and roots. In this study, we assessed the spatiotemporal variation of CH4 emissions from tree stems and stilt roots of three mangrove species (Rhizophora mangle, Avicennia germinans, and Laguncularia racemosa) across distinct ecological types (i.e., scrub, basin and hammock) during the rainy and dry seasons in the Ría Celestún Biosphere Reserve (Mexico). We also investigated the relationship between bark anatomical traits, aerenchyma development, and CH4 fluxes. Our findings revealed that CH4 emissions varied by species, tissue type, and season. Scrub R. mangle showed the highest CH4 emission rates from both tree stems and stilt roots, particularly in near-ground tissues like third-order stilt roots with abundant bark aerenchyma, whereas basin mangrove forests had the lowest emissions, particularly in A. germinans and L. racemosa. Methane emissions increased during the rainy season and were positively correlated with bark (aerenchyma) proportion, lenticel density but negatively with wood density. To date, tree stem CH4 emissions have been documented in eleven mangrove species globally. Our results underscore the need to refine local-to-global carbon models by integrating bark anatomy and tree-mediated CH4 emissions. Moreover, mangrove trees can act as either CH4 sources or sinks, depending on physicochemical and microenvironmental conditions. Understanding these dynamics requires a comprehensive approach rooted in plant physiology and anatomy.

How to cite: Salas Rabaza, J. A., Thalasso, F., Yáñez Espinosa, L., Cejudo, E., Pangala, S. R., Cerón Aguilera, G., Us Santamaría, R., and Andrade, J. L.: The bark side of mangrove methane fluxes: Anatomical insights of the root of emissions in Rhizophora forests, EGU General Assembly 2025, Vienna, Austria, 27 Apr–2 May 2025, EGU25-11389, https://doi.org/10.5194/egusphere-egu25-11389, 2025.

EGU25-12762 | Posters on site | BG3.37

Long-term nitrogen and phosphorus additions alter soil and tree stem methane and nitrous oxide fluxes under contrasting soil water conditions in a tropical forest 

Laëtitia Bréchet, Kateřina Macháčová, Karel Klem, and Tomáš Medňanský

Globally, tropical forests are thought to be an important source of atmospheric nitrous oxide (N2O) and a sink for methane (CH4), with small biome-wide changes in the structure, dynamics and environment of these forests either mitigating or exacerbating increases in atmospheric concentrations of these major greenhouse gases (GHGs). Anthropogenic activities have dramatically increased nitrogen (N) and phosphorus (P) inputs to the biosphere, potentially altering soil biogeochemical cycles. However, the effects of N and P addition on soil CH4 and N2O fluxes in tropical forest ecosystems are not yet understood. Besides soils, tree-mediated transport can also contribute significantly to GHG exchange in forests. In the soil, CH4 and N2O produced can be absorbed by roots and transported into aboveground tree tissues. In addition, these gases can be produced in trees by microorganisms living in the tissues or by physiological and photochemical processes. Yet observations of CH4 and N2O fluxes in tropical forests, particularly in tree stems, are still limited and have not been described in the context of long-term nutrient addition experiments.

Here we report data derived from measurements of soil and stem fluxes and environmental variables in N (+N) and P (+P) addition plots over seven years in a tropical forest of the north-eastern Amazon, French Guiana. In each plot (+N, +P, +NP and controls), CH4 and N2O fluxes, soil water content (SWC), soil and air temperature, total N and carbon content and available P were measured at five different locations combining a tree stem (> 30 cm diameter) and its surrounding soil. These measurements were made in plots located in three contrasting habitats, a well-drained, nutrient-poor soil at the top of the hill (upland area) and two waterlogged, nutrient-rich soils at the bottom of the hill (seasonally and permanently flooded areas).

We found that soil and stem CH4 and N2O fluxes were highly spatially variable in situ. In the control plots, soil CH4 uptake and N2O emissions decreased with increasing SWC (i.e. from the hill-top to the wettest hill-bottom). Regardless of the forest habitat, N additions (+N and +NP) resulted in substantially higher soil N2O fluxes, whereas P additions (+P) resulted almost exclusively in soil CH4 uptake. This suggests that N addition increases soil N beyond microbial immobilisation and plant nutritional requirements, with the excess being nitrified or denitrified, while P addition stimulates soil methanotrophic activity. In the control plots, stems growing in the waterlogged soils of the permanently flooded area were moderate and strong emitters of N2O and CH4, respectively. For both gases, CH4 and N2O, higher stem fluxes resulted from P addition (+P and +NP) in hill-bottom plots.

Our results highlight (i) the key role of N and P in CH4 and N2O cycling in tropical forest soils and (ii) the substantial CH4 and N2O source potential of tree stems in highly waterlogged areas. This underlines the importance of including processes related to water, N and P availability in GHG flux modelling in tropical forests.

How to cite: Bréchet, L., Macháčová, K., Klem, K., and Medňanský, T.: Long-term nitrogen and phosphorus additions alter soil and tree stem methane and nitrous oxide fluxes under contrasting soil water conditions in a tropical forest, EGU General Assembly 2025, Vienna, Austria, 27 Apr–2 May 2025, EGU25-12762, https://doi.org/10.5194/egusphere-egu25-12762, 2025.

EGU25-13883 | ECS | Posters on site | BG3.37

Scaling soil methane fluxes across a topographically complex landscape in a cold temperate mountain forest 

Sumonta Kumar Paul, Daniel Epron, Keisuke Yuasa, and Masako Dannoura

Forest soils play a critical role in the global methane (CH4) budget, but the magnitude of CH4 fluxes varies significantly across a landscape, spatially and temporally. In complex landscapes, soil hydrology is strongly influenced by variations in topography and vegetation, which affect soil CH4 fluxes (FCH4). Consequently, accurately scaling FCH4 to the landscape level is a significant challenge. This study aimed to develop a methodology for scaling seasonal FCH4 across a topographically complex landscape in a cold temperate mountain forest.

This study was conducted in the upper watershed of the Yura River in the Ashiu Experimental Forest (area 40 ha and elevation 600-850 m). The landscape was classified into upland, wetland, and river, comprising approximately 94%, 1%, and 5% of the total study area, respectively. 52 collars were installed in upland areas covering different topographic positions and vegetation types, and FCH4 were measured nine times from April to November. Additionally, 11 collars were installed in small riparian wetlands and measured twice during the wet-to-dry summer transition. Then, we used measured FCH4 together with topographic attributes i.e., slope, aspect, profile curvature (PRC), vertical distance to the channel network (VDCN), topographic position index (TPI), and topographic wetness index (TWI) from remotely sensed data (digital elevation model) and vegetation type (broadleaf, coniferous, and mixed) to develop a machine-learning model (quantile regression forest) for predicting upland seasonal FCH4 at 5 m resolution with uncertainty across the landscape level. A simple average was used to estimate the wetland fluxes.

Seven predictor variables were used to model upland FCH4 for each season; the selected predictors and model accuracy varied with seasons. The model accuracy was high in early autumn (R2 = 0.67) and low in early wet summer (R2 = 0.28). TPI was consistently selected in all seasons, while TWI was chosen for most seasons except two, where VDCN was selected instead. VDCN and PRC were occasionally selected with TWI and TPI. Vegetation type was not selected for any of the seasons. Across the landscape, predicted upland median seasonal FCH4 ranged from -0.35 to -0.60 g CH4 hr-1 ha-1 in spring, -0.41 to -1.25 g CH4 hr-1 ha-1 in summer, and -0.50 to -0.89 g CH4 hr-1 ha-1 in autumn. This seasonal variation in upland predicted median FCH4 was well explained by the antecedent precipitation index (R2 = 0.71, p < 0.01) calculated over 20 days. When scaled at the landscape level, the average CH4 uptake by upland soils was -25.1 (uncertainty -35.8 to -16.2) g CH4 hr-1. In the wet summer, small wetland patches offset 8% of the upland CH4 uptake (-15.6 g CH4 hr-1 upland, 1.2 g CH4 hr-1 wetland), and the following dry summer, they offset only 2% because both the upland CH4 uptake increased and the wetland emission decreased (-32.6 g CH4 hr⁻¹ upland, 0.5 g CH4 hr⁻¹ wetland). This study highlighted the efficiency of remote sensing and machine learning approaches to extrapolate field measurements to the landscape level and allowed us to visualize spatial patterns of fluxes over time.

How to cite: Paul, S. K., Epron, D., Yuasa, K., and Dannoura, M.: Scaling soil methane fluxes across a topographically complex landscape in a cold temperate mountain forest, EGU General Assembly 2025, Vienna, Austria, 27 Apr–2 May 2025, EGU25-13883, https://doi.org/10.5194/egusphere-egu25-13883, 2025.

EGU25-14176 | Posters on site | BG3.37

Effect of tidal cycles on greenhouse gas emissions from mangroves 

Masako Dannoura, Sumonta Kumar Paul, Rifat Rahaman Hredoy, Rempei Suwa, Minori Tokito, and Daniel Epron

Mangrove forest is one of the most carbon storing tropical forests. Thus, understanding the dynamics of greenhouse gas such as CO2 and CH4 are important to predict the future. CO2 is produced by plant respiration, dissolved in water and transported upwards with transpiration. Active respiration in mangrove roots occurs because salt from seawater must be excluded before water enters the xylem. Therefore, tidal fluctuation can affect the exchange of CO2 between tree surface and the atmosphere. CH4 is produced in anaerobic conditions in the sediment and is not readily soluble in water. However, it can diffuse through aerenchyma and pores in root and stem tissues, particularly during the day when the water potential becomes low and tissue air porosity increases. Because CH4 has a global warming potential that is 25 times more powerful than CO2 over 100 years, CH4 emissions have the potential to offset a part of the CO2 initially removed from the atmosphere by photosynthesis and buried as blue carbon in the sediment. Thus, both CO2 and CH4 fluxes should be considered in the carbon budget of mangrove ecosystems. The aim of this study was to determine how tidal and diurnal cycles affect CO2 and CH4 emissions from mangrove roots and stems, both physiologically and physically, for a more accurate understanding of gas exchange processes in mangrove forests.
The research was conducted on Bruguiera gymnorrhiza and Rhizophora stylosa on the bank of the Miyara River in Ishigaki island. Chambers were placed at three heights along the stems (approximately 0.2, 1.0, and 1.5 m above the sediment) and on different root types to measure CO2 and CH4 fluxes during day and night and low and high tide in June, August and November 2024.
CO2 efflux from the trunk showed no difference with height. In contrast, CH4 efflux was highest at the base of the trunks. At low tide, CH4 emissions from the roots were much higher than those from the trunk. Both CO2 and CH4 efflux from the trunk surface was lower at night than during the day, and there was no difference between high and low tide. Large variations in CH4 efflux was observed from the same position at different times. Continuous measurements are needed to better characterize these temporal variations. Characterizing the spatial distribution of roots is also a future challenge.

How to cite: Dannoura, M., Paul, S. K., Hredoy, R. R., Suwa, R., Tokito, M., and Epron, D.: Effect of tidal cycles on greenhouse gas emissions from mangroves, EGU General Assembly 2025, Vienna, Austria, 27 Apr–2 May 2025, EGU25-14176, https://doi.org/10.5194/egusphere-egu25-14176, 2025.

EGU25-14261 | ECS | Posters on site | BG3.37

Bridging the Gap: Integrating Top-Down and Bottom-Up Measurement Approaches to close the Amazon CH4 emissions budget  

Akshay Nataraj, Frederic Despagne, Kyle Owen, Julio Lobo Neto, and Doug Baer

This study is part of an international mission in the Amazon rainforest, involving researchers from the Federal University of Rio de Janeiro, Universities of Leeds, Linköping, British Columbia, and coordinated by Prof. Vincent Gauci and Dr. Sunitha Pangala. The primary objective is to reconcile top-down methane (CH₄) emission estimates, derived from remote sensing data over Amazon floodplains, with bottom-up measurements obtained from field studies. Previous satellite observations indicated a discrepancy of 20 million tons of CH₄ emitted annually, a significant gap that could not be fully explained by ground-based sources. This project aimed to resolve this difference by integrating both remote sensing satellites and field data using ABB’s Off-Axis Integrated Cavity Output Spectroscopy (OA-ICOS) to understand and bring to light the different dynamics involved in methane emissions in the Amazon rainforest.

Reconciling top-down and bottom-up carbon budgets can be particularly challenging in specific ecosystems where topography complicates site access and sampling. Under such conditions, the availability of compact and rugged cavity-enhanced laser-based analyzers offering sub-ppb precision is invaluable for environmental scientists. ABB’s portable greenhouse gas ultraportable analyser, GLA132-GGA (47 cm × 35.56 cm × 17.78 cm) is capable of monitoring CH4 with a 1 s precision of 1.4 ppb, which can be improved to 0.2 ppb with 100 s averaging time. The analyser is based on OA-ICOS technology that combines high precision capabilities through enhanced cavity path length and robustness to mechanical vibrations, which is crucial to field applications. Scientists used semi-rigid custom chambers wrapped around the trunk of floodplain trees and connected them to the GLA132-GGA to measure individual CH4 emissions from 2357 trees in 13 floodplain sites.

The findings provide a crucial link to reconcile the 20-million-ton discrepancy in Amazon's methane budget. Scaled estimates of methane flux emitted from floodplain trees align closely with the missing methane observed in previous satellite data. During the rainy season, when Amazon tree roots become submerged, trees have evolved specialized adaptations to enhance oxygen supply to their roots by enlarging pores in their stems. This adaptation inadvertently facilitates the release of methane, produced by microorganisms in the waterlogged soil, through the same pore openings. Floodplain trees thus function as natural chimneys, venting substantial quantities of methane into the atmosphere. These large emissions from floodplain trees play a pivotal role in closing the Amazon methane budget.

Furthermore, a second campaign revealed that methane produced deep within the soil column can also escape to the atmosphere via tree roots, even when the water table is below the surface. Regression analysis demonstrated that, while methane emissions show negligible response to increased flood levels above the soil surface, there is a clear dependence of whole-tree methane emissions on the presence of submerged roots. This highlights the importance of floodplain trees in regulating methane fluxes across varying hydrological conditions, underscoring their significant role in the global methane cycle.


How to cite: Nataraj, A., Despagne, F., Owen, K., Lobo Neto, J., and Baer, D.: Bridging the Gap: Integrating Top-Down and Bottom-Up Measurement Approaches to close the Amazon CH4 emissions budget , EGU General Assembly 2025, Vienna, Austria, 27 Apr–2 May 2025, EGU25-14261, https://doi.org/10.5194/egusphere-egu25-14261, 2025.

EGU25-14314 | ECS | Orals | BG3.37

Significant CH4 production and emission in the upper part of the tree trunk 

Takumi Mochidome, Teemu Hölttä, Masako Dannoura, and Daniel Epron

Trees, typically large trees in upland forests, emit CH4 produced in their trunk by methanogenic archaea. In this case, spatial variability of emission can be more complicated than when tree trunks act as a passive conduit for CH4 produced in the soil. However, due to poor accessibility, CH4 emissions from the trunk above 3 m, where a researcher cannot reach without a ladder, scaffold or crane, have not been well studied. The vertical emission patterns from trunks, including the upper part, and the processes driving them, i.e., CH4 production and transport, remain unexplored.

Using a crane truck, we investigated vertical patterns of CH4 emissions, internal CH4 concentration and production up to 12 m above ground in six trees of three species in a cool-temperate upland forest. We also conducted a modelling study of CH4 transport within trunks to know whether CH4 emitted from the upper part of the trunk, if present, is produced locally at the same height of the trunk or is produced elsewhere and transported to that height.

CH4 was actively emitted from the trunk at a height greater than 3 m, with peak emissions at 4 to 6 m above ground in some trees. CH4 production was observed consistently up to the highest sampling point at 12 m height. CH4 production hotspots in Japanese beech and horse-chestnut trees were characterized as decaying wood due to their low density and high moisture content. In Japanese cedar, production hotspots were surrounded by wet sapwood, suggesting that limited oxygen diffusion to the tree centre stimulated CH4 production. According to CH4 transport modelling, axial CH4 transport from the production hotspot upwards is more likely in trees with low radial diffusion. However, within a realistic parameter range, such long-distance axial CH4 transport could not be realized.

The results highlighted the complexity of endogenously produced CH4 emissions in the trunk. Oxygen level and wood decay, as suggested by our results, could be key factors to explain the heterogeneity of CH4 production inside the trunk, which can efficiently predict the spatial variability of the emission along the trunk height.

How to cite: Mochidome, T., Hölttä, T., Dannoura, M., and Epron, D.: Significant CH4 production and emission in the upper part of the tree trunk, EGU General Assembly 2025, Vienna, Austria, 27 Apr–2 May 2025, EGU25-14314, https://doi.org/10.5194/egusphere-egu25-14314, 2025.

EGU25-14365 | Orals | BG3.37

Species and Tissue-Specific Microbiomes Drive Methane Fluxes from Trees 

Jonathan Gewirtzman, Wyatt Arnold, Peter Raymond, Jordan Peccia, and Mark Bradford

Trees contribute to methane (CH₄) cycling through internal microbial processes and transport, with tree-mediated CH₄ emissions documented across various forest types, including upland ecosystems where soils typically act as CH₄ sinks. To investigate the microbial drivers of these emissions, we measured CH₄ fluxes from tree stems and surrounding soils across upland, intermediate, and wetland sites at Yale-Myers Forest, Connecticut, USA. While upland soils consistently consumed CH₄, tree stems emitted CH₄ at all landscape positions. Fluxes from upland tree stems showed no height-dependent decline, indicating internal methane production rather than soil-to-stem transport. Using droplet digital PCR (ddPCR) to quantify the mcrA gene, methanogen abundance in heartwood was over two orders of magnitude higher than in surrounding soils, with copy numbers ranging from 10⁴ to 10⁵ g⁻¹ in tree tissues compared to 10¹ to 10² g⁻¹ in soils.

Microbial sequencing revealed distinct methanogenic communities, including Methanobacterium and Methanomassiliicoccus, indicating primarily hydrogenotrophic pathways of methane production. Functional inference showed that methanogenesis pathways strongly correlated with fermentation pathways, including those producing hydrogen and acetate, suggesting syntrophic interactions between fermentative bacteria and methanogens. In contrast, methanogenesis pathways were anticorrelated with aerobic respiration and sulfur metabolism, indicating redox conditions suppress methane production in outer tissues. These findings emphasize that heartwood serves as a niche for anaerobic processes driving CH₄ production.

The internal tree microbiome was highly partitioned between tissues. Heartwood and sapwood microbiomes showed distinct microbial compositions and minimal similarity to surrounding soil communities. Heartwood was dominated by anaerobic bacteria and archaea, while sapwood and bark harbored methanotroph-related genes (pmoA, mmoX), indicating potential internal methane oxidation.

Internal gas sampling confirmed elevated CH₄ concentrations within stems, particularly at mid-stem heights, corresponding with visible heartwood decay. Methanotroph-related genes detected in sapwood and bark suggest some gross methane oxidation, but methanogenesis pathways dominated, resulting in net positive fluxes from tree stem to atmosphere. These findings underscore tree microbiomes' importance in methane cycling, with heartwood providing an anaerobic niche for microbial methane metabolism in upland forests.

How to cite: Gewirtzman, J., Arnold, W., Raymond, P., Peccia, J., and Bradford, M.: Species and Tissue-Specific Microbiomes Drive Methane Fluxes from Trees, EGU General Assembly 2025, Vienna, Austria, 27 Apr–2 May 2025, EGU25-14365, https://doi.org/10.5194/egusphere-egu25-14365, 2025.

EGU25-16159 | ECS | Posters on site | BG3.37

Post-fire methane fluxes from boreal forest soils depend on burn severity 

Nicola Kokkonen, Mathilde Rebiffé, and Kajar Köster

Forest fires are arguably one of the most destructive natural disturbances in the boreal forest biome and can cause significant changes to the carbon balance in these ecosystems. Although the area of forests burned annually in Fennoscandia is currently small (<1000 ha), this area may increase both due to biodiversity directives to increase habitat diversity using prescribed burning and due to climate change intensifying wildfire regimes. Fire severity impacts the biological, chemical, and physical properties of soils which underlie greenhouse gas (GHG) fluxes, which can interact to cause complex dynamics in GHG emissions for decades after fire. Therefore, it is essential to understand the impact of fire on forest soil GHG fluxes. Currently, upland forest soils in the boreal biome act as a weak methane (CH4) sink, but there are conflicting estimates about how these fluxes are impacted by forest fire. To better understand these dynamics and what the future may hold, we must quantify CH4 fluxes after fire and identify the factors that impact this, namely soil, vegetation, and fire characteristics.

We aimed to measure CH4 fluxes following prescribed restoration burning. Our research sites were thinned dry Scots pine (Pinus sylvestris) forest with sandy soils and sparse understorey vegetation at four locations in central Finland. We established permanent sample plots in each research site and installed collars for static chamber measurements. Plots were located in unburned, low-severity burn, and high-severity burn areas. Prescribed burning was conducted under suitable weather conditions, usually in the first half of June. Burning resulted in ground vegetation and logging debris were consumed across the site, but standing tree mortality varied between 0 and 100%. To measure CH4 fluxes from the soils, we used a dark static chamber and a portable trace gas analyzer (Licor LI-7810). CH4 fluxes were measured daily immediately after fire, then bi-monthly up to two growing seasons after prescribed burning.

Results indicate that CH4 uptake increased following fire, but this was not equal on all sites and varied over time. In terms of burn severity, we found that plots with low-severity burning had greater increases in CH4 uptake. Immediately following fire (i.e. when some active smoldering still present), we found that CH4 fluxes were highly variable and included very high CH4 emissions. We found no significant differences in soil CH4 fluxes between control and treated plots prior to burning, despite different forest management histories in some cases. Increased CH4 uptake in low severity plots is likely also linked to low microbe mortality, potential increases in microbe diversity, and soil temperature (Köster et al. 2011). However, a more complete understanding of the mechanisms and conditions that drive increases in CH4 uptake in low-severity burns requires further research.

How to cite: Kokkonen, N., Rebiffé, M., and Köster, K.: Post-fire methane fluxes from boreal forest soils depend on burn severity, EGU General Assembly 2025, Vienna, Austria, 27 Apr–2 May 2025, EGU25-16159, https://doi.org/10.5194/egusphere-egu25-16159, 2025.

EGU25-19642 | Orals | BG3.37

Targeted metagenomics using probe capture detects a larger diversity of nitrogen and methane cycling genes than traditional metagenomics – can microbes cause an ecosystem services in the plant tissues? 

Henri M.P. Siljanen, Lokesh Manoharan, Angus Hilts, Alexandre Bagnoud, Ricardo J.E. Alves, Christopher M. Jones, Melina Kerou, Johanna Kerttula, Krishnapriya Thiyagarasaiyar, Vincenzo Abagnale, Kaido Soosaar, Ülo Mander, Katerina Machácová, Jukka Pumpanen, Carlos Palacin-Lizarbe, Dhiraj Paul, Filipa L. Sousa, Sara Hallin, Christina Biasi, and Christa Schleper

Microbes are the key players in the global cycling of nitrogen (N) and carbon (C), controlling the availability and fluxes of C and N in ecosystems, as well as being responsible for losses through the emissions of the powerful greenhouse gasses nitrous oxide (N2O) and methane (CH4). Thus, characterization of microbial functional guilds involved in these processes is high on the scientific agenda. Yet, standard sequence-based characterization methods often reveal only a minor fraction of their diversity in nature due to their frequent low relative abundance, insufficient sequencing depth of traditional metagenomes of complex communities, and limitations in coverage and efficiency of PCR-based assays.

Here, we developed and tested a targeted metagenomic approach based on probe capture and hybridization to simultaneously characterize the diversity of multiple key metabolic genes involved in inorganic N and CH4 cycling. We designed comprehensive probe libraries for each of 14 target marker genes, comprising 264,000 unique probes in total. These probes were used to selectively enrich the target genes in shotgun metagenomic libraries.

In validation experiments with mock communities of cultured microorganisms, the target gene profiles were similar to those of the original community when sequenced with targeted metagenomics. Furthermore, relative abundances of the marker genes obtained by targeted and shotgun metagenomics from agricultural and wetland soils correlated positively, indicating that the targeted approach did not introduce a significant quantitative bias. However, targeted metagenomics generated substantially higher diversity in terms of taxonomic coverage, and a larger number of sequence reads per sample, which allowed 28 or 1.24 times higher diversity estimates than when using shotgun metagenomics or targeted PCR amplification, respectively.

The targeted metagenomics tool has been used to study the nitrogen and methane cycling microbes successfully in tropical corals for N cyclers (Glaze et al. 2022) and boreal spruce phyllosphere tissues for methane cyclers (Putkinen et al. 2021). However, the role of the CH4 and N2O cycling microbes within the plant and lichen tissues are still relatively unknow. The results of gas dynamics, isotopic labelling and targeted metagenomic results in the plant tissues will be discussed. In summary, targeted metagenomics complements current approaches by enabling a targeted, more detailed characterization of the diversity (Siljanen et al. 2024) of key functional genes involved in N and CH4 cycling within and between ecosystems.


REFERENCES

Glaze T.D., Erler D.V., Siljanen H. (2022). Microbially facilitated nitrogen cycling processes in tropical corals. ISME Journal. 16:68-77. https://doi.org/10.1038/s41396-021-01038-1

Putkinen A., Siljanen H.M.P., Laihonen A., Paasisalo I., Porkka K., Tiirola M., Pihlatie M. (2021). New insight to the role of microbes in the methane exchange in trees: evidence from metagenomic sequencing. New Phytol. 231: 524-536


Siljanen H.M.P, Manoharan L., Hilts A.S., Bagnoud A., Alves R.J.E., Jones C.M., Kerous M., Sousa F.L., Hallin S., Biasi C., Schleper C. (2024). Targeted metagenomics using probe capture detects a larger diversity of nitrogen and methane cycling genes in complex microbial communities than traditional metagenomics bioRxiv, https://doi.org/10.1101/2022.11.04.515048


How to cite: Siljanen, H. M. P., Manoharan, L., Hilts, A., Bagnoud, A., Alves, R. J. E., Jones, C. M., Kerou, M., Kerttula, J., Thiyagarasaiyar, K., Abagnale, V., Soosaar, K., Mander, Ü., Machácová, K., Pumpanen, J., Palacin-Lizarbe, C., Paul, D., Sousa, F. L., Hallin, S., Biasi, C., and Schleper, C.: Targeted metagenomics using probe capture detects a larger diversity of nitrogen and methane cycling genes than traditional metagenomics – can microbes cause an ecosystem services in the plant tissues?, EGU General Assembly 2025, Vienna, Austria, 27 Apr–2 May 2025, EGU25-19642, https://doi.org/10.5194/egusphere-egu25-19642, 2025.

Methane (CH4) is the second most significant anthropogenic greenhouse gas after CO2, contributing to 20% of global warming. Low CH4 emission by stems in well-aerated forest soils can influence global carbon cycles, mainly by reducing the CH4 sink capacity of forests. Methane could be produced in anoxic soil zones, mainly when soil water is high, from late autumn to early spring. Methanogenesis occurs not only in soil since methanogenic archaea have been identified in the heartwood of trees where high concentrations of CH4 were recorded. However, these concentrations do not lead directly to high emissions, as the CH4 can be oxidised by the communities of methanotrophs also present in the tree and/or transported elsewhere.

To explore seasonal variations in methane fluxes (FCH4) and the factors involved, methane fluxes were manually recorded 13 times at four heights (0.5, 1.3, 2 and 4 m) on the stems of three common temperate tree species (Carpinus betulus, Fagus sylvatica, and Quercus robur) in the Hesse forest (ICOS site, NE of France) from April 2023 to March 2024, using a trace gas analyser. The three species at this site have different root depth profiles, with the root system of Q. robur being deeper.

Over the sampling period, tree were low methane emitters for all species (mean ± SE, 0.71 ± 0.34 µg CH₄ h⁻¹), with notable variability, particularly for Q. robur, ranging from - 12.47 to 15.64 µg CH₄ h⁻¹. Methane fluxes especially below 1.5 meters varied along the year in relation to the 3 levels in soil moisture defined according to the water table level (wet: water table above 0.55 m, dry: water table below 1 m and moderate: intermediate and the two above). Methane emitted by the three species differed with soil moisture. Q. robur exhibited lower emissions only during driest soil conditions, as its deep root system allows access to methane production zones deeper in the soil. In contrast, F. sylvatica showed reduced emissions at both drier (moderate and dry) levels, likely due to its shallower root system's limiting access to methane-rich soil layers.But methane emissions did not decrease with height or with decreasing soil water content in all trees, indicating that methane could be produced inside the wood. In fact, in one third of the wood cores sampled, potential methanogenic production was recorded.

Our study confirmed that methane emissions from trees are influenced both by soil methane and by internal production processes. Our work has shown that the differences in emissions between species could be explained by the root profile.

How to cite: Cousteur, N., Courtois, P., Joetzjer, E., and Plain, C.: In a well-aerated temperate forest soil, the response of stem methane emissions to variations in soil water content depends on the tree species and stem height measured, EGU General Assembly 2025, Vienna, Austria, 27 Apr–2 May 2025, EGU25-19813, https://doi.org/10.5194/egusphere-egu25-19813, 2025.

EGU25-20015 | Posters on site | BG3.37

Influence of sampling depth and stand species on the potential methane uptake of forest soil samples. 

Caroline Plain, Nicolas Bras, and Daniel Epron

Methane (CH4) is one the most important greenhouse gas and is responsible for approximatively 20% of the global warming (IPCC, 2022). Soils and mainly upland forest soils where aerobic environment prevails, are one of the main global sink of methane (Dutaur et Verchot 2013). At the soil-atmosphere interface, the net methane efflux consists in a net balance between the production of CH4 by methanogenic bacteria mainly in deep anaerobic soil layers and the consumption by methanotrophic bacteria in the aerobic soil horizons of the methane produced in the soil or diffusing from the atmosphere into the soil.

Presence of trees could influence soil edaphic features (mainly carbon content, pH, nitrogen, soil structure and texture, water content, …) which can have an impact on the abundance of methanotrophic and methanogenic communities in the soil profile and thus on methane uptake. In the upper part of the well aerated mineral soil, the abundance of methanotrophs is highest, but the depth of this level depends on the thickness of the organic layer and then on the rate of litter mineralisation. Depending on the season and the tree species in the plot, the intensity of methane uptake and the pattern of methane consumption may change.

The objective of this project was to study the influence of the temporal dynamics of methane consumption in a soil profile of different forest stand types. For this purpose, we developed a method to sample intact soil cores. We took 5 soil cores of 3 different thicknesses (5, 10 and 15 cm) in a forest of spruce, beech, oak and pine at different dates in spring 2022. Methane and CO2 fluxes were measured in the week after sampling on the soil cores incubated at 20°C.

Regardless of season, methane consumption increased with sample thickness. In the upper 5 cm, methane consumption was highest of the beech forest compared to the other stand types. However, when considering the 15 cm of soil, methane consumption no longer differed between stands. This trend seems to be related to the sharp decrease in organic carbon content and the much lower water content in spruce and pine forests. It is also possible that methane consumption at depth in the beech forest is limited by the low availability of methane at depth, which has been consumed at the top of the profile.

How to cite: Plain, C., Bras, N., and Epron, D.: Influence of sampling depth and stand species on the potential methane uptake of forest soil samples., EGU General Assembly 2025, Vienna, Austria, 27 Apr–2 May 2025, EGU25-20015, https://doi.org/10.5194/egusphere-egu25-20015, 2025.

EGU25-21743 | Orals | BG3.37

Stable isotopic characterization of CH4 emissions from tree stems in a central Amazon region  

Shujiro Komiya, Santiago Botia, Hella van Asperen, Viviana Horna, Hellen F. V. Cunha, Jochen Schongart, Maria Teresa Fernandez Piedade, Florian Wittmann, Daniel Magnabosco Marra, Carina van der Veen, Thomas Rockmann, Susan Trumbore, and Sam P. Jones

The vegetation and soils of the Amazon contain substantial amounts of carbon, with a portion of this carbon decomposing into methane (CH4) under anaerobic conditions. A significant quantity of the resultant CH4 is released into the atmosphere through tree stems. Given large variations in landscape and vegetation across the Amazon region, there remains a gap in our understanding of the distribution and influence of CH4 cycling processes (e.g., production, oxidation and transport) in the soil/water-trees-atmosphere continuum of Amazonian forest ecosystems. Natural abundance stable isotopes are powerful tracers of these processes but their application in the Amazon has so far been limited.

In this study, we report the results of carbon and hydrogen isotopic compositions of CH4 in gas samples obtained from different sources (e.g., stem chambers, stem boreholes, bubbles, soil gases, etc.) collected during three intensive field campaigns (two dry seasons: August 2022, September 2023, one wet season: March-April 2023). These campaigns were conducted in two different forest ecosystems (Igapo: seasonally flooded blackwater forest, Baixio: upland swamp valley forest) around the Amazon Tall Tower Observatory (ATTO) site, located in the intact central Amazon region. We conducted stem chamber sampling on 6-7 tree species at each forest site and collected stem borehole gas samples from CH4 hotspot trees and palms (Igapo: Macrolobium acaciifolium and Pouteria elegans, Baixio: Mauritia flexuosa). We estimated the source isotopic signatures of stem CH4 emission using the Keeling plot method. In addition, based on the three different campaigns, we investigated seasonal and inter-site variations in stem CH4 isotopic composition and also dual isotope relationships (δ13C-CH4 vs. δ2H-CH4, δ13C-CH4 vs. δ13C-CO2) to trace CH4 cycling processes in the soil/water-tree-atmosphere continuum.

The carbon isotopic signatures (δ13C-CH4) of stem CH4 emissions at the Baixio site ranged from -90 ‰ to -45 ‰, whereas the Igapo site displayed a range between -70 ‰ and -20 ‰. The δ13C-CH4 values of stem CH4 emissions from CH4 hotspot trees at the Igapo site were approximately 5-10 ‰ lighter than those of stem-borehole and bubble samples. This isotopic difference was mostly consistent across three term campaigns, indicating that diffusive isotopic fractionation by stem CH4 emissions of these tree species remains constant across seasons. In contrast, the isotopic differences in δ13C-CH4 between stem CH4 emissions and stem-borehole samples from CH4 hotspot trees at the Baixio site were approximately 20 ‰, which is approximately two times higher than at the Igapo site. The dual isotope relationships indicate that methane of the stem interior is predominantly derived from acetate fermentation in the Baixio site, whereas CH4 oxidation generates stable carbon isotopic signatures of the stem interior in the Igapo site. This study provides valuable insights into CH4 processes within the soil/water-tree-atmosphere continuum in the central Amazon rainforest, which would contribute to improving our process understanding and thus prediction of Amazonian CH4 budgets.


How to cite: Komiya, S., Botia, S., van Asperen, H., Horna, V., Cunha, H. F. V., Schongart, J., Piedade, M. T. F., Wittmann, F., Marra, D. M., van der Veen, C., Rockmann, T., Trumbore, S., and Jones, S. P.: Stable isotopic characterization of CH4 emissions from tree stems in a central Amazon region , EGU General Assembly 2025, Vienna, Austria, 27 Apr–2 May 2025, EGU25-21743, https://doi.org/10.5194/egusphere-egu25-21743, 2025.

EGU25-1535 | Posters on site | BG3.38

Reassessing Denitrification in the drainage zone below agricultural soils 

Julia Westphal, Aspasia-Eva Klußmann, Reinhard Well, David Schoner, Florian Stange, and Caroline Buchen-Tschiskale

Nitrate (NO₃⁻) leaching from the rooting zone of agricultural land generally leads to increased NO₃⁻ concentrations in groundwater, thereby significantly contributing to the eutrophication of aquatic ecosystems. Denitrification—the biogeochemical reduction of NO₃⁻ and nitrite (NO₂⁻) to dinitrogen (N₂) and/or nitrous oxide (N₂O)—can mitigate NO₃⁻ inputs to groundwater. However, most research to date has predominantly focused on the root zone. Consequently, substantial uncertainties remain regarding the quantification of nitrate reduction in the unsaturated percolation zone below the root zone (referred to as the drainage zone). The extent to which this zone can reduce NO₃⁻ inputs into groundwater remains contentious, and its contribution to soil N₂O emissions has been scarcely studied.

To address these gaps, we assessed denitrification potential by determining the maximum denitrification capacity (Dcap) using the acetylene inhibition technique for the upper (1.5–2.0 m depth) and deeper (down to 7 m) drainage zone at multiple agricultural sites with contrasting soil textures. Experiments included the addition of seepage water with varying dissolved organic carbon (DOC) concentrations to evaluate the influence of key factors on denitrification in the drainage zone.

Additionally, a mesoscale laboratory incubation experiment was conducted to measure the denitrification rates under oxic and anoxic conditions. Substrates with differing textures were used, and the measurements were performed using the ¹⁵N gas flow method. Key factors influencing denitrification—such as the availability of NO₃⁻ and oxygen, water content, and DOC concentration—were systematically varied in a full factorial experimental design.

Preliminary results revealed very low denitrification emissions in both experiments; however, emissions were higher in the Dcap experiment. Contrary to expectations, initial results suggest less effect of water-filled pore space, NO₃⁻ concentration, or DOC content on denitrification-related emissions. So far, emissions were significantly higher in clayey sediments compared to sandy sediments, highlighting the role of soil texture in influencing denitrification within the drainage zone. These findings emphasize the importance of further research to better understand how the specific characteristics of the drainage zone regulate denitrification processes.

How to cite: Westphal, J., Klußmann, A.-E., Well, R., Schoner, D., Stange, F., and Buchen-Tschiskale, C.: Reassessing Denitrification in the drainage zone below agricultural soils, EGU General Assembly 2025, Vienna, Austria, 27 Apr–2 May 2025, EGU25-1535, https://doi.org/10.5194/egusphere-egu25-1535, 2025.

EGU25-1594 | ECS | Orals | BG3.38

Quick Freeze-Thaw Cycles enable Rapid Solute Movement in Vertical Soil Columns  

Madhumita Sahoo, Steven Thornton, and Domenico Baú

Quick and frequent freeze-thaw cycles (FTCs) are expected to increase due to climate change-induced warming in mid- and high- latitude regions. Warming trends during winter can impact biogeochemical cycles in land and water bodies. Bioaccumulation of soil nitrogen (N) products (nitrate, ammonium, and total nitrogen) on the soil surface during early spring and elevated N levels of streams hint at N movement within soil during winter. Natural field observations may not capture changes occurring during quick FTCs, and therefore, we developed a laboratory experiment to observe the movement of soil N products and unfrozen soil water during quick FTCs. Active solute transport occurs within a soil column during winter, as not all soil water undergoes freezing. Winter soil warming has been found to influence biogeochemical reactions within the top 100 cm, with high impact on solute movement in the top 30 cm depth. A 100-cm soil column filled uniformly with freely draining sandy loam (3.35 mm or finer grain size) was used for successive freezing and thawing for 4 days. Soil freezing was enabled using a 30-cm long freezing jacket with 10-cm wide detachable layers to adjust freezing depths over each 10-cm depth. Soil freezing for the top 10-cm, 20-cm, and 30-cm depths were enabled for three scenarios to observe the effects of freezing depth on solute movement during a 4-day FTC. An intensity-controlled infrared lamp above the soil column was used to thaw the soil. Soil moisture and temperature were monitored at the surface and at column depths of 15 cm, 30 cm, 45 cm and 60 cm. Soil water samplers collected porewater samples from 5 cm, 15 cm, 25 cm, 55 cm, and 80 cm depth. The depth below 60 cm was considered for the movement of solute towards or away from the freezing front during a FTC. There was an upward N migration observed during the 10-cm freezing depth scenario. N migration was the highest in the 10-cm freezing depth scenario. The observations obtained during FTCs were compared with a control scenario (no soil freezing) for the same duration. This experiment identified the direction of migration of solutes during FTCs. These results can help in soil nutrient management by controlling the availability of excess soil nitrogen, thus mitigating the impact of climate-warming on soil and water resources at a catchment scale.

How to cite: Sahoo, M., Thornton, S., and Baú, D.: Quick Freeze-Thaw Cycles enable Rapid Solute Movement in Vertical Soil Columns , EGU General Assembly 2025, Vienna, Austria, 27 Apr–2 May 2025, EGU25-1594, https://doi.org/10.5194/egusphere-egu25-1594, 2025.

EGU25-2095 | ECS | Orals | BG3.38

Modelling Nitrogen Balances of German Croplands: Advancing the MONICA Model for High-Resolution N Flux Estimates 

Boris Ouattara, Konstantin Aiteew, Mahboube Jarrah, and Rene Dechow

Efficient management of nitrogen (N) in agricultural systems is crucial for mitigating greenhouse gas (GHG) emissions, reducing nutrient losses, and maintaining crop productivity. The aim of this study was to evaluate the N cycle on German cropland using the process-based MONICA model. In particular, the processes of denitrification, nitrification and N leaching, as these have a significant influence on N losses. The study relied on data from the German Agricultural Soil Survey (BZE-LW), which provides detailed crop sequence information, annual fertilization rates, and yields across 1235 sites. These data were supplemented with meteorological information from the German Weather Service (DWD) and environmental variables derived from remote sensing. An algorithm was developed to predict the timing of operations such as fertilization and tillage, to address the challenge of limited temporal resolution in management data, generating daily management information. This enhancement enabled high-temporal-resolution simulations for nine major crops cultivated in Germany between 2001 and 2018. Initial model evaluation applied MONICA to simulate crop yields, N leaching, and N₂O emissions, using large-scale plausibility checks based on emission factors and leaching loss estimates. While the model demonstrated reasonable performance in estimating nitrogen fluxes, challenges were identified in replicating reported yields. These were largely due to uncertainties in input data and unrepresented processes in the current model framework. Planned refinements to MONICA, in collaboration with project partners, aim to improve its representation of denitrification losses (N₂ and N₂O) using experimental data. Preliminary results underline the potential of MONICA for high-resolution simulation of agroecosystem N dynamics, though sensitivity analyses highlight the significant influence of uncertainties in soil properties and management inputs on model outputs. This work advances the MONICA model as a robust tool for simulating high-resolution N fluxes and evaluating mitigation strategies in agricultural systems. The insights gained provide a foundation for improving N management practices at regional scales, contributing to sustainable and climate-resilient agricultural systems in Germany.

How to cite: Ouattara, B., Aiteew, K., Jarrah, M., and Dechow, R.: Modelling Nitrogen Balances of German Croplands: Advancing the MONICA Model for High-Resolution N Flux Estimates, EGU General Assembly 2025, Vienna, Austria, 27 Apr–2 May 2025, EGU25-2095, https://doi.org/10.5194/egusphere-egu25-2095, 2025.

EGU25-3461 | ECS | Posters on site | BG3.38

Modelling freeze-thaw related N2O emissions: recent advances & future perspectives 

Melanie A. Thurner, Sergey Blagodatsky, David Kraus, Clemens Scheer, and Ralf Kiese

Soil freeze-thaw (FT) cycles induce high nitrous oxide (N2O) emissions across all ecosystems, whereby flux rates are highest for agricultural systems, where more than half of the annual N2O emissions may result from FT related fluxes. Globally, neglecting FT related N2O emissions may lead to an underestimation of the annual N2O budget by almost a quarter. However, FT related N2O emissions are hardly implemented in and simulated by state-of-the-art ecosystem models yet, because of a lack of knowledge about the actual mechanisms explaining timing and magnitude of the observed N2O emission peaks.

Here we review recent advances in process understanding, which can be summarized into three approaches: (i) a frozen (top)soil (or snow) layer that acts as physical barrier for gas diffusion, (ii) the production of additional decomposable substrate during freezing-thawing, and (iii) temperature-depending changes in the biochemical balances within the denitrification process. We implemented the different mechanisms in the LandscapeDNDC ecosystem model, which provides an advanced representation of soil nitrogen processes, and validate their effects on site scale, before we evaluate their importance on regional scale and as part of the annual N2O budget. This will enable us to improve national to global estimates of annual N2O emissions and lower the current uncertainty due to the neglect of FT related N2O fluxes.

How to cite: Thurner, M. A., Blagodatsky, S., Kraus, D., Scheer, C., and Kiese, R.: Modelling freeze-thaw related N2O emissions: recent advances & future perspectives, EGU General Assembly 2025, Vienna, Austria, 27 Apr–2 May 2025, EGU25-3461, https://doi.org/10.5194/egusphere-egu25-3461, 2025.

EGU25-3552 | Posters on site | BG3.38

Modeling of the long-term effects of reduced inputs of organic and inorganic fertilizers on SOC and N-balance of agricultural soils 

Balázs Grosz, Jörg Michael Greef, Linda Tendler, Reinhard Well, and Rene Dechow

The world's population growth requires an increase in agricultural productivity. But this must be achieved by reducing the environmental impact of agricultural practices. The European Commission's European Green Deal includes targets for reducing nitrogen (N) application. This could be achieved by reducing fertilizer amounts in regions that are heavily fertilized. A second option to reduce N emissions would be the transport of organic amendments from region with high livestock/ biogas plant density into areas where fertilization of croplands are dominated by mineral fertilization. However, only few studies exist addressing the implications of fertilizer reduction on SOC stocks, N cycling and productivity in the long-term. Biogeochemical models can help to investigate the long-term effects of reduced fertilizer application on these system properties. For model calibration, data from two 2- and 3-year experiments on sandy and clayey soils, consisting of a no-fertilization control, 3 mineral fertilizer treatments with different N levels and 3 biogas digestate treatments with corresponding rates of total N (with 60%, 80% and 100% of maximum N applied) in two cereal/maize rotations were used. The digestate was applied by trailing hoses, and directly incorporated when maize was the subsequent crop. A long-term monitoring site in Lower Saxony was used to improve and validate the SOC sub-module of the model. The dataset consists of 45 field plots with documented soil data, management data and time series of SOC content. SOC content was measured on average every 4-5 years for 20 years in the upper 0-20 cm soil horizon. The management of the sites represents general agricultural practice. The results of the experiments were used to calibrate and improve the DNDCv.Can biogeochemical model. The calibrated model was used to simulate the development of SOC stocks, N budgets and productivity for the period 2020-2060. The model was run with three future climate scenarios. It was hypothesized that (i) the N use efficiency of digestate would be inferior to that of mineral nitrogen, and therefore more N from manure would be needed to achieve the same yield, but causing higher N2O and NH3 emissions, (ii) those discrepancies between mineral fertilization and organic fertilization level off in the long-term, (iii) reducing N fertilizer application rates does decrease N2O and NH3 emissions, (iv) reduced N application decreases carbon inputs, which may lead to a long-term reduction of soil SOC. Based on the calibrated model on experimental results we compare yield, SOC, N2O in long term (40 years) scenarios for Eastern Lower Saxony, Germany with factors a) fertilization type, b) fertilization amount, c) climate, d) soil type.

How to cite: Grosz, B., Greef, J. M., Tendler, L., Well, R., and Dechow, R.: Modeling of the long-term effects of reduced inputs of organic and inorganic fertilizers on SOC and N-balance of agricultural soils, EGU General Assembly 2025, Vienna, Austria, 27 Apr–2 May 2025, EGU25-3552, https://doi.org/10.5194/egusphere-egu25-3552, 2025.

EGU25-5928 | Posters on site | BG3.38

Lysimeter studies combining 15N tracing and natural abundance stable isotopes to determine N2 and N2O fluxes and processes in arable soils  

Reinhard Well, Caroline Buchen-Tschiskale, Martin Freudiger, Dominika Lewicka-Szczebak, and Amanda Matson

Mitigating nitrogen (N)-oxide emissions and optimizing N-use efficiency are important aspects of agricultural soil management. Studies that monitor net production of dinitrogen (N2) and nitrous oxide (N2O), including the spatial/temporal heterogeneity of denitrification in soils, provide much-needed data to inform models that support management decisions. However, to model denitrification in agricultural ecosystems more accurately, we need data-sets at lab to field scale including reliable measurement of processes and regulating factors of N2 and N2O production.

Analysing natural abundance isotopocule values of N2O (d15N, d18O and 15N site preference) in gas samples from  closed chambers with  data evaluation using the FRAME model (Lewicki, 2022) can be used to distinguish N2O production pathways and to quantify N2O reduction to N2. However, this approach usually fails to distinguish between N2O production by heterotrophic bacterial denitrification and nitrifier denitrification. Moreover, the accuracy is limited during periods of low activity due to the small fraction of soil-derived N2O in the samples. This might be overcome by analysing  N2O isotopocule values of soil air were the fraction of soil-derived N2O is always higher compared to closed chamber samples.

While N2 and N2O fluxes from denitrification can be determined using the 15N gas flux method (15NGF), improvement of N2 sensitivity is needed to detect emissions beyond peak events which can be achieved by establishing an N2-depleted atmosphere (15NGF+ method, (Eckei et al., 2024).

Recently, it has been shown that extending the FRAME modelling with results of the 15NGF conducted in parallel is suitable to better distinguish different denitrification pathways of N2O production (Micucci et al., 2025). A further advantage of using both approaches is the fact, that FRAME can be easily used outside the lab and in growing crops, while for 15NGF+, this is very challenging.

We combined three approaches, i.e. (1.) surface fluxes of N2O isotopocules using the closed chamber method, (2.) Experiments were established on lysimeters with two undisturbed soils cropped with barley.

We used results for FRAME modeling of natural abundance plots and combined them  with 15NGF+ results to quantify (i) N2 and N2O fluxes from the 15N-labelled NO3- pool, (ii) the fraction of N2O emitted from other (unlabelled) N sources, and (iii) N2O pathways distinguished by the extended FRAME modelling including heterotrophic bacterial denitrification, nitrifier denitrification, fungal denitrification, nitrification and N2O reduction to N2. The latter will be compared to N2 fluxes obtained by 15NGF+. First results will be shown.

References:

Eckei, J., et al., 2024. Determining N2O and N2 fluxes in relation to winter wheat and sugar beet growth and development using the improved 15N gas flux method on the field scale. Biology and Fertility of Soils. DOI: 10.1007/s00374-024-01806-z

Lewicki, M.P.D.L.-S., Grzegorz Skrzypek, 2022. FRAME—Monte Carlo model for evaluation of the stable isotope mixing and fractionation. Plos One 17, e0277204.

Micucci, G., et al.., 2025. Combining the 15N Gas Flux Method and N2O Isotopocule Data for the Determination of Soil Microbial N2O Sources. Rapid Communications in Mass Spectrometry 39, e9971.


How to cite: Well, R., Buchen-Tschiskale, C., Freudiger, M., Lewicka-Szczebak, D., and Matson, A.: Lysimeter studies combining 15N tracing and natural abundance stable isotopes to determine N2 and N2O fluxes and processes in arable soils , EGU General Assembly 2025, Vienna, Austria, 27 Apr–2 May 2025, EGU25-5928, https://doi.org/10.5194/egusphere-egu25-5928, 2025.

EGU25-6727 | ECS | Posters on site | BG3.38

A novel method for the extraction and measurement of hydroxylamine in soils 

Nathalie Heldwein, Katharina Kitzinger, and Wolfgang Wanek

Hydroxylamine (NH2OH) is an intermediate in nitrification and a direct precursor for nitrous oxide (N2O) in both enzymatic and abiotic reactions. Although its importance for N2O emissions from soils has been recognized, NH2OH has never been measured in soils except for one acidic forest soil. This is mostly due to a lack of an adequate extraction method in the presence of soil minerals. Therefore, we here developed a soil extraction method that stabilizes NH2OH during the extraction by blocking its abiotic reactions by a combination of low pH, reducing agents and chelators. Furthermore, we optimized a colorimetric NH2OH assay for the conditions encountered in such soil extracts. The colorimetric assay reacts NH2OH with quinolin-8-ol under alkaline conditions and has a limit of detection of 0.5 µmol L-1. In a next step, we target to purify the derivatization product with solid phase extraction to measure its concentration and isotopic composition via UPLC-Orbitrap mass spectrometry. The final goal is to provide a workflow for the ultra-sensitive NH2OH measurement in soil 15N-tracer studies.

How to cite: Heldwein, N., Kitzinger, K., and Wanek, W.: A novel method for the extraction and measurement of hydroxylamine in soils, EGU General Assembly 2025, Vienna, Austria, 27 Apr–2 May 2025, EGU25-6727, https://doi.org/10.5194/egusphere-egu25-6727, 2025.

EGU25-7159 | ECS | Posters on site | BG3.38

The Influence of Soil Nematodes on N₂O Emissions Under Chemical and Organic Nitrogen Fertilization 

Junwei Hu, Malaika Mariana Andrade Hernandez, Steven Sluetel, and Stefaan De Neve

Soil nematodes, the most abundant soil fauna, play a pivotal role in nitrogen cycling through their interactions with soil microorganisms, potentially influencing N₂O emissions. While it is well-established that N fertilization can increase N₂O emissions, the role of nematodes in modulating N₂O emissions across different N fertilization strategies remains underexplored. This study investigates the effect of soil nematodes on N₂O emissions under four N fertilization treatments: no nitrogen (CK), chemical fertilizer (CF), pig manure (PM), and green manure (GM). Over a 58-day soil microcosm incubation, we compared N₂O emissions with and without the presence of the entire soil nematode community across two soil textures—loamy sand and sandy loam. Our results revealed that soil texture, N fertilization, and nematode presence significantly influenced N₂O emissions. The most pronounced effect of nematodes was observed in loamy sand soil treated with PM, where nematodes contributed to a marked increase in N₂O emissions during the initial peak (0-5 days). In contrast, nematodes significantly elevated N₂O emissions from 5 to 58 days in sandy loam soil treated with GM. Both pig manure and green manure promoted nematode population growth; however, nematodes only notably enhanced nitrogen mineralization in unfertilized soil. These findings underscore the importance of incorporating soil fauna, particularly nematodes, into N₂O emission prediction and mitigation strategies for agricultural soils.

How to cite: Hu, J., Hernandez, M. M. A., Sluetel, S., and De Neve, S.: The Influence of Soil Nematodes on N₂O Emissions Under Chemical and Organic Nitrogen Fertilization, EGU General Assembly 2025, Vienna, Austria, 27 Apr–2 May 2025, EGU25-7159, https://doi.org/10.5194/egusphere-egu25-7159, 2025.

EGU25-7178 | ECS | Posters on site | BG3.38 | Highlight

Drivers of  N2O Emissions: Implications for Model Development Accounting for the Spatial Variation 

Dhimas Sigit Bimantara, Jørgen Eriksen, Triven Koganti, and Christian Dold

Cultivated soils contribute approximately 60% of global nitrous oxide (N2O) production due to nitrogen inputs, which underscores the urgent need for comprehension of N2O emissions at larger spatial and temporal scales. However, knowledge gaps persist due to the episodic nature of soil N2O emissions, which are driven by non-linear interactions among biophysical, and environmental factors over spatial and temporal domains.

This study aims to identify significant predictors of N2O emissions at the field scale using random forest algorithm. The soil N2O flux and various predictors (CO2, soil moisture content (SWC), temperature, mineral N, pH, bulk density, and air permeability, as well as digital elevation model (DEM), gamma ray count rate, and electrical conductivity data were measured between March and June 2024 in a 1.2 ha winter wheat field located in Foulumgård, Denmark. The N2O flux was measured at 96 locations in weekly to biweekly time intervals using the LiCOR 7820 analyzer.

The N2O flux spatially varied from 0.006 to 0.164 ug m-2 s-1, with the highest average fluxes of 0.148 ug m-2 s-1 approximately 7 to 10 days after fertilizer application. The CO2 flux ranged from 0.11 to 0.54 µg m-2 s-1 with an average of 0.35 µg m-2 s-1, while SWC varied from 0.11 - 0.30 m3 m-3  and soil temperature from 6.0 - 25.7 °C.

The preliminary random forest model identified key predictors for N2O emissions as soil respiration (CO2, 25%), temporal variability (Week, 13%), soil electrical conductivity, here a likely proxy for soil texture (EC, 11%), and SWC, 9%. Furthermore, the model was evaluated with a 90:10 data split, using 90% for training and 10% for validation. The absence of further predictors limited the model's performance, as reflected in the decline in R² from 89% in training to 60% in validation. The out-of-bag (OOB) error also showed the model explained only 29.4% of emission variability, emphasizing the need for additional variables to better capture N2O predictors.

These findings are a first step towards comprehending the importance of recognizing the non-linear underlying forces of N2O emissions and the intricate interplay between soil and environmental factors. Improving the model ability to predict N2O emissions will require comprehensive datasets that capture key biogeochemical drivers and the development of robust, non-linear modeling frameworks. In a next step, additional parameters such as soil nitrate (NO3-), ammonium (NH4+), and soil pH are included in the model to further improve model performance to understand spatial variation and temporal dynamic of N2O. 

How to cite: Bimantara, D. S., Eriksen, J., Koganti, T., and Dold, C.: Drivers of  N2O Emissions: Implications for Model Development Accounting for the Spatial Variation, EGU General Assembly 2025, Vienna, Austria, 27 Apr–2 May 2025, EGU25-7178, https://doi.org/10.5194/egusphere-egu25-7178, 2025.

EGU25-7595 | ECS | Posters on site | BG3.38 | Highlight

How wheat root development can determine denitrification rates in soils of glacial depressions in Eastern Denmark 

Yujia Liu, Björn Kemmann, Per Ambus, Bo Elberling, Michael Dannenmann4, Kristian Thorup-Kristensen, Carsten W. Mueller, and Daniel M.N. Poultney

Nitrous oxide emissions from agricultural land largely contribute to the greenhouse gas budget worldwide. Denmark’s glacial landscape has widespread small scale topographic depressions, typically flooded for 1-3 months per year. These depressions within agricultural land are considered as hotspots of N2O emissions, because of exposure to an increased nitrate availability and labile carbon due to fertilization and deposition of eroded soil material. Temporal waterlogging in these depression areas affects plant development, thus their ability to deplete available nitrogen in soil. Additionally, living plants provide substrates for denitrification through root exudates. However, the effect of living plants and roots on N2O emissions from glacial depressions is not very clear yet.


In this study, we aimed to elucidate how waterlogging influences nitrogen uptake and dissolved organic carbon (DOC) release from plants at different root growth stages, and to quantify how this would affect N2O emissions. We conducted a fully crossed mesocosm experiment with depression soils subjected to saturated or freely-drained water conditions, three different wheat growth stages to mimic possible different root N uptake, and an unplanted control. In order to differentiate how much N2O was produced from newly-added fertilizer, we applied a 15N tracer. For monitoring root development, roots were imaged through the translucent mesocosm walls on a weekly basis.


The growth stage of wheat significantly influenced the fate of mineral nitrogen and the dynamic of DOC in the soil solution, thereby affecting N2O emissions from these soil systems. The interaction between DOC and mineral nitrogen explained 53.9% of the variance in daily N2O fluxes. Therefore, these findings highlight the critical role of root development and soil water conditions in regulating N2O emissions from conditions representative for glacial depressions.

How to cite: Liu, Y., Kemmann, B., Ambus, P., Elberling, B., Dannenmann4, M., Thorup-Kristensen, K., W. Mueller, C., and M.N. Poultney, D.: How wheat root development can determine denitrification rates in soils of glacial depressions in Eastern Denmark, EGU General Assembly 2025, Vienna, Austria, 27 Apr–2 May 2025, EGU25-7595, https://doi.org/10.5194/egusphere-egu25-7595, 2025.

EGU25-8721 | ECS | Orals | BG3.38 | Highlight

Impact of different soil erosion levels on N transformation processes and gaseous N losses: An incubation study 

Julia Schoof, Maire Holz, Tobias Rütting, Reinhard Well, and Caroline Buchen-Tschiskale

Soil erosion is a key driver of soil redistribution, often causing nutrient losses from agricultural fields and contributing to nutrient overload in natural ecosystems. The removal of topsoil leads to truncated soil profiles on shoulder slopes, in which the plough can incorporate deeper soil material. This can change soil properties and, thus, alter biogeochemical cycling. Despite the increased interest in understanding SOM turnover in eroded topsoils, studies on N cycling in this context are rare and often focus only on isolated aspects of the N cycle (Berhe et al., 2018).

We designed a short-term mesocosm experiment, combining different 15N-tracing techniques, to quantify almost all N transformation processes in topsoils mixed with different amounts of subsoil to simulate three erosion levels. Nitrogen transformation pathways were simulated using the numerical model Ntrace (Rütting & Müller, 2007), considering N uptake by maize (Zea mays) at early development stages. The 15N labelling also allows the quantification of N2O and N2 losses, originating either from the soil NO3-N or NH4-N pool. N2O losses were determined automatically by a gas chromatograph and N2 by isotope ratio mass spectrometry by applying the 15N gas flux method in N2-depleted atmosphere (Kemmann et al., 2021).

The incorporation of subsoil material resulted in decreased Corg and Ntot contents with increasing erosion levels, leading to reduced nitrogen turnover and, consequently, lower N₂O and N₂ emissions in both maize-planted and unplanted treatments. Autotrophic nitrification was the dominating process across all erosion levels. Nevertheless, most N2O and N2 emissions originated from coupled nitrification-denitrification, even at water contents <40 % WFPS. Surprisingly, the growth of maize plants increased N2O and N2 emissions more than twice at early growth stages. However, the overall effect of the erosion level was considerably greater than the effect of plant presence. Our study contributes to a more comprehensive understanding of N cycling in agricultural soils of hilly landscapes, which is essential for enhancing nitrogen fertilizer use efficiencies and reducing N pollution.

References

Berhe, A. A., Barnes, R. T., Six, J., & Marín-Spiotta, E. (2018). https://doi.org/10.1146/annurev-earth-082517-010018

Kemmann, B., Wöhl, L., Fuß, R., Schrader, S., Well, R., & Ruf, T. (2021). https://doi.org/10.1111/gcbb.12879

Rütting, T., & Müller, C. (2007). https://doi.org/10.1016/j.soilbio.2007.04.006

How to cite: Schoof, J., Holz, M., Rütting, T., Well, R., and Buchen-Tschiskale, C.: Impact of different soil erosion levels on N transformation processes and gaseous N losses: An incubation study, EGU General Assembly 2025, Vienna, Austria, 27 Apr–2 May 2025, EGU25-8721, https://doi.org/10.5194/egusphere-egu25-8721, 2025.

EGU25-9704 | Posters on site | BG3.38

Impact of field and laboratory techniques on the nitrification rate determined by 15N pool dilution  

Claus Florian Stange and Susanne Stadler

A number of laboratory and field-based sample taking, handling, treatment and tracer application methods exist for the determination of gross nitrification rates in soil by 15N pool dilution. However, a comprehensive evaluation of method-induced effects on nitrification rates remains challenging.

With our study, we systematically investigate if laboratory and field techniques generally produce comparable gross nitrification rates determined by the 15N pool dilution method. Our investigations are conducted on three plots with sandy soil under the different land-uses forest, grassland and arable land in the Fuhrberger Feld region, Lower Saxony, Germany. For this, we conduct on every plot five sub-test series that vary tracer application and subsequent sample handling and/or treatment in the field and in the laboratory, and compare the impact of the different methods. The five sub-tests span over a range from established pure laboratory method for the determination of nitrification rates  to almost pure field work (where soil is incubated and extracted in the field), covering different degrees of handling and treatment impacts. Because there are differences, we will use the experiment to analyze which treatment and/or handling steps change the determined rates the most.

How to cite: Stange, C. F. and Stadler, S.: Impact of field and laboratory techniques on the nitrification rate determined by 15N pool dilution , EGU General Assembly 2025, Vienna, Austria, 27 Apr–2 May 2025, EGU25-9704, https://doi.org/10.5194/egusphere-egu25-9704, 2025.

EGU25-9864 | ECS | Orals | BG3.38

Non-destructive soil nitrate detection via electrochemical reduction 

Liudmila Kachalova and Nicolas Brüggemann

A number of methods are available for the analysis of nitrate in soil, each with its own advantages and limitations. One of the main limitations of existing methods is that they involve destructive soil sampling with subsequent extraction. Therefore, there is a demand for a rapid, sensitive, and accurate procedure for analysis of nitrate levels in the soil. Here, we developed and tested a method for quantitative analysis of nitrate in soils based on electrochemical reduction of the nitrate ion to gaseous nitrogen (N) species and subsequent real-time and online quantification of the emitted N gases. For this purpose, we subjected slurries from different soils to electrolysis with different electrode materials under a range of conditions. The N gases developing in the slurry during electrolysis were continuously purged out of the solution into the headspace of the electrolysis cell by a stream of dry nitrogen gas and directed to an infrared laser absorption analyzer for online analysis.

We found that the emission of N2O, one of the products of the electrolysis of nitrate in the soil slurry, was the most suitable indicator of the nitrate concentration in the sample because it is easy to measure with high sensitivity. To test the linearity of the method, the soil samples were amended with different amounts of nitrate, resulting in nitrate contents of the soils ranging from 20 to 180 mg NO3--N kg-1. Preliminary results showed a linear correlation between nitrate concentrations and N2O production. However, it became evident that the variability in soil structure and pH significantly impacted the electrochemical reduction pathways and efficiency. To address these limitations, a phosphate buffer was introduced to stabilize the soil pH. This adjustment minimized pH fluctuations, thereby reducing their influence on N2O production. This newly developed method offers advantages such as fast analysis time and the ability to measure nitrate directly in situ.

How to cite: Kachalova, L. and Brüggemann, N.: Non-destructive soil nitrate detection via electrochemical reduction, EGU General Assembly 2025, Vienna, Austria, 27 Apr–2 May 2025, EGU25-9864, https://doi.org/10.5194/egusphere-egu25-9864, 2025.

EGU25-12649 | Posters on site | BG3.38 | Highlight

Challenges and Insights for Simulating Nitrous Oxide Emissions in Eastern Canada: Evaluating an Agroecosystem Model Ensemble 

Ward Smith, Brian Grant, Budong Qian, Guillaume Jego, Marianne Crepeau, Stephen del Grosso, Stephen Ogle, and David Pelster

Biogeochemical models continue to be improved in their ability to account for the impacts of agricultural management, soil characteristics, and climate on crop productivity and greenhouse gas emissions. Depending on the model, limitations still exist including the ability to characterize a limited range of management practices, the oversimplifications of crop physiology, and an inadequate simulation of soil microbial environments. This study uses a long-term 22-year field experiment in eastern Canada to calibrate and evaluate several agroecosystem models, including DayCent, DNDC, DSSAT, and STICS, for their ability to simulate crop productivity and nitrous oxide (N2O) emissions. Model performance was assessed against near-continuous N2O measurements using flux towers. Corn, wheat, soybean, and canola were grown over the 22 years for several treatments including manure versus inorganic fertilizer, fertilizer rate, timing of fertilizer applications, early and late planting, and use urease and nitrification inhibitors. Findings suggest that the ensemble of models could accurately predict corn, wheat and soybean yields in contrast to the general overprediction of canola yields. Growing season N2O emissions are generally well-simulated at the Ottawa site with weekly performance statistics showing Wilmot d values of 0.7 for conventional management and 0.75 for BMP management. However, challenges persist in accurately capturing daily emission patterns and estimating emissions during the spring-thaw period. The DSSAT and STICS models, which do not have explicit soil mechanisms related to spring thaw, simulated low N2O emissions and thus it is recommended that these mechanisms be incorporated in the future. Difficulties in modeling the timing of denitrification events highlighted limitations in the representation of microsite-level pedoclimatic conditions, diffusion processes, and the simulation of microbial activity. The model ensemble simulated an acceptable level of annual N2O emissions for most treatments with 5.8% overprediction across 22 years, with the overestimation mainly from the manure and dual inhibitor treatments. Comparing model strengths and weaknesses across different locations provides valuable insights for future model improvements.

How to cite: Smith, W., Grant, B., Qian, B., Jego, G., Crepeau, M., del Grosso, S., Ogle, S., and Pelster, D.: Challenges and Insights for Simulating Nitrous Oxide Emissions in Eastern Canada: Evaluating an Agroecosystem Model Ensemble, EGU General Assembly 2025, Vienna, Austria, 27 Apr–2 May 2025, EGU25-12649, https://doi.org/10.5194/egusphere-egu25-12649, 2025.

EGU25-14700 | ECS | Posters on site | BG3.38

APSIM's Soil N Model Review for Future Development 

Heather Pasley, Kirsten Verburg, Jody Biggs, Iris Vogeler Cronin, Wang Enli, Henrike Mielenz, Val Snow, Christopher Smith, Chiara Pasut, Andrea Basche, Di He, Sotirios Archontoulis, Donald Gaydon, Neil Huth, Dean Holzworth, Joanna Sharp, Rogerio Cichota, Edith Khaembah, Hamish Brown, Mark Farrell, Chelsea Janke, Gupta Vadakattu, and Peter Thorburn

The accurate simulation of soil nitrogen (N) cycling is central to the process-based model Agricultural Production Systems sIMulator (APSIM) and increasingly the focus of modellers globally on account of a growing emphasis on quantifying N losses. Recently, 24 leading APSIM model users and developers from around the world came together to write a comprehensive review of APSIM’s soil N model (https://doi.org/10.1016/j.agsy.2024.104213). The review documents in detail how the model simulates N processes and synthesizes the findings of 131 model-data comparison studies conducted over the last 26 years. Overall, the review found that APSIM’s Soil N model performs well, simulating seasonal/annual soil N uptake and loss (e.g., leaching, denitrification) accurately across a wide range of treatments/environments. A number of studies, however, noted that the model struggled to capture the daily/sub-daily N dynamics and potentially underestimated the rate of mineralisation, especially under fallow conditions. In order to remedy these shortcomings, some researchers adjusted various parameter values, but due to the disjointed manner with which these model ‘improvements’ were proposed and adopted, most have not been tested under a wider scope than the singular target process or environment of the original study. The studies often differed in their approaches to evaluating and, at times, improving model performance, with the threshold for “good” performance differing depending on the focus and scope of the study. We therefore focused on extracting the insight of the studies’ authors and revisiting their model-data evaluations in the context of the other studies, thereby seeking to delve deeper into a more comprehensive understanding of the model’s performance. Such an approach led us to uncover target areas for future model development that were not evident in singular studies. For example, it highlighted the need to revisit how fresh organic matter in the model is initialised rather than increasing the rate of turnover of other soil C pools. The review has informed ongoing work, including testing the proposed parameter changes across a range of applications to identify potential unintended consequences that exist beyond the scope of isolated studies and investigating how to better model the environmental factors that dictate daily/sub-daily N dynamics. The flexibility of APSIM’s coding allows for sensitivity analyses on the processes currently included in APSIM and the development of prototypes for processes that are beyond the current model’s capacity. Future work will look to incorporate findings from new mechanistic and field experiments across different geographic/agroecological regions. Furthermore, there is value of doing similar exercises across other process-based models. Such reviews have the potential to streamline advancements in how models are evaluated and improved, leading to the development of models with more robust predictive capabilities and broader scopes.

How to cite: Pasley, H., Verburg, K., Biggs, J., Vogeler Cronin, I., Enli, W., Mielenz, H., Snow, V., Smith, C., Pasut, C., Basche, A., He, D., Archontoulis, S., Gaydon, D., Huth, N., Holzworth, D., Sharp, J., Cichota, R., Khaembah, E., Brown, H., Farrell, M., Janke, C., Vadakattu, G., and Thorburn, P.: APSIM's Soil N Model Review for Future Development, EGU General Assembly 2025, Vienna, Austria, 27 Apr–2 May 2025, EGU25-14700, https://doi.org/10.5194/egusphere-egu25-14700, 2025.

EGU25-15201 | Orals | BG3.38 | Highlight

Interannual variability and legacy impacts of climate change and nitrogen fertilization on corn yield and soil nitrous oxide emissions: a modeling approach 

Dafeng Hui, Jaekedah Christian, Faisal Hayat, Maazzeera Fatima, and Daniel Ricciuto

Climate change and nitrogen application significantly influence agricultural productivity and soil greenhouse gas emissions. However, the impacts of interannual climate variability and the legacy effects of nitrogen application on corn yield and soil nitrous oxide (N2O) emissions remain poorly understood. In this study, we utilized the DeNitrification-DeComposition (DNDC) model to simulate corn yield and soil N2O emissions over a 40-year period (1981~2020). We designed a series of experiments by shifting climate year data and altering nitrogen application rates to quantify interannual variability in corn yield and soil N2O emissions, as well as to disentangle the contributions of climate variability and nitrogen legacy effects. The results showed large interannual variability in both corn yield and soil N2O emissions. Corn yield was primarily driven by changes in growing season precipitation, while soil N2O emissions were influenced by precipitation, exchangeable NH4+, nitrification-denitrification processes. Severe drought strongly reduced corn yield, while soil N2O emissions exhibited a gradual yet pronounced legacy effect of nitrogen application, increasing from 2 kg N ha-1 to approximately 5 kg N ha-1 over the 40-year period. High nitrogen application rates amplified the interannual variability of both corn yield and soil N2O emission. This study highlights the relatively weak influence of interannual climate variability compared to the stronger legacy effects of nitrogen application on crop yield and soil N2O emissions, providing valuable insights for sustainable agricultural and environmental management.

How to cite: Hui, D., Christian, J., Hayat, F., Fatima, M., and Ricciuto, D.: Interannual variability and legacy impacts of climate change and nitrogen fertilization on corn yield and soil nitrous oxide emissions: a modeling approach, EGU General Assembly 2025, Vienna, Austria, 27 Apr–2 May 2025, EGU25-15201, https://doi.org/10.5194/egusphere-egu25-15201, 2025.

EGU25-16162 | Posters on site | BG3.38

Effects of time-controlled grazing on the magnitude and spatial distribution of N2O emissions from subtropical pastures in Australia 

Verena Rohringer, Luca G. Bernardini, Katharina Keiblinger, David W. Rowlings, and Johannes Friedl

Time-controlled grazing, i.e. short intensive grazing periods followed by a long rest, is promoted as a management form to counteract grassland degradation, increasing soil health, drought resilience and the sustainability and profitability of pastoral farming. Emissions of the potent greenhouse gas nitrous oxide (N2O) are known to respond to N substrate availability. Effects of grazing management on the distribution of N inputs and ensuing N2O emissions remain however largely unknown. This study investigated effects of continuous vs. time-controlled grazing on the magnitude and the spatial distribution of N2O emissions using a paired site approach. Emissions of N2O were measured before and after a simulated rainfall event across two extensively managed pasture sites in subtropical Queensland. Both sites were subdivided into four strata with 31 N2O sampling points per site, based on the distance to the water point. Mean N2O emissions across strata ranged from 23.5 to 22.8 g N2O-N m-2 day-1 and increased to 63.6 and 42.0 g N2O-N m-2 day-1 after the simulated rainfall event, for the continuous and time controlled grazing site, respectively. Emissions differed between strata, with highest emissions exceeding 60 g N2O-N m-2 day-1 within 100 m of the watering point and in shaded/forest areas, decreasing with distance to the water point. The spatial response of N2O emissions was consistent with NO3- concentration in the soil, likely reflecting areas of herd concentration with increased urine and dung deposition providing N substrate for N2O formation. Emissions of N2O were lower in shaded and forested areas, as well as in strata with >500 m distance to the water point under time controlled grazing as compared to continuous grazing management. The lack of treatment effect on NO3- availability and overall N2O emissions however shows no clear benefits of  time controlled grazing on the distribution of N substrate availability under the conditions of this study, demanding further research to evaluate its benefits in regards to N2O mitigation from extensively managed pastures.

How to cite: Rohringer, V., Bernardini, L. G., Keiblinger, K., Rowlings, D. W., and Friedl, J.: Effects of time-controlled grazing on the magnitude and spatial distribution of N2O emissions from subtropical pastures in Australia, EGU General Assembly 2025, Vienna, Austria, 27 Apr–2 May 2025, EGU25-16162, https://doi.org/10.5194/egusphere-egu25-16162, 2025.

Soil nitrogen processes have been investigated in detail at the process and the molecular-microbiological level, mostly using laboratory scale analyses, with recent research efforts focusing on quantifying the overall nitrogen turnover across spatial scales. However, challenges like methodological limitations, large spatial and temporal variability, and complex interacting control factors hinder accurate quantification and understanding of soil nitrogen turnover. While controls of nitrogen cycle processes are well established in the laboratory, applying these insights to field, regional and (cross)continental scales remains difficult and therefore also the validation of these processes and their controls in large-scale biogeochemical models due to the scarcity of in-situ data.

We here propose and demonstrate an isotope fractionation approach which is non-invasive (no addition of 15N labeled compounds in dissolved form) and allows to explore in-situ dynamics of soil  nitrogen cycling from the field scale to continental spatial patterns. The approach allows to determine the flux partitioning between the coupled pools of organic nitrogen in plants, soils and microbes, ammonium, nitrate, and gaseous nitrogen forms. Fluxes estimated include depolymerization, microbial uptake, mineralization, nitrification, and soil nitrogen losses. We present examples across a European climate, bedrock and land use transect on how to quantify (i) microbial nitrogen use efficiency, and (ii) fractions of inorganic nitrogen loss through hydrological or gaseous loss pathways (leaching of nitrate or gaseous losses via nitrification/denitrification in the form of NO, N2O and N2), based on isotope fractionation modeling of natural 15N abundance data of soil nitrogen pools.

How to cite: Wanek, W. and Zhang, S.: Natural 15N abundances in coupled soil ecosystem nitrogen pools allow to determine nitrogen flux partitioning based on isotope fractionation modeling, EGU General Assembly 2025, Vienna, Austria, 27 Apr–2 May 2025, EGU25-16224, https://doi.org/10.5194/egusphere-egu25-16224, 2025.

EGU25-21457 | Posters on site | BG3.38 | Highlight

Investigating shifts in nitrogen transformations in response to soil health oriented management using a new combination of stable isotope approaches 

Rebecca Hood-Nowotny, Jakob Bachmann, Sophie Gallon, Alexandra Breuzeville Calderon, Katharina Keiblinger, and Johannes Friedl

Sustainable crop production as well as climate change mitigation require a better quantitative process understanding for nitrogen (N) transformations and their response to specific land management strategies. Here we investigated shifts in N transformations following the transition from conventional to soil health-oriented farming using a new combination of 15N stable isotope methods. Soil samples were taken from four different farms in two different regions in Lower Austria following a paired site approach, comparing a clay and a sandy textured soil under conventional vs. organic management. Soils were fertilized with single labelled NH415NO3 and incubated in a fully automated incubation system, with continuous monitoring of 15N2O. Changes in 15N enrichment in N pools were investigated by converting the N pools of interest into NO3-, and further to N2O via the Ti (III) reduction method, establishing the 15N enrichment via cavity ringdown spectroscopy (Picarro G5102-i). Changes in 15N in the NO3- pool showed that gross nitrification was higher in the clay as compared to the sandy textured soil, but did not respond to management. Gross NO3- consumption was however higher in organically managed soils, regardless of texture, and 15N enrichment in the soil microbial biomass indicated negligible assimilation of the applied 15N fertilizer under the conditions of the experiment.  Combining classic 15N pool dilution and 15N tracing with Ti (III) reduction and cavity ringdown spectroscopy allowed for a timely determination of N pools and their 15N enrichment, obviating the need for costly and time-consuming analysis via isotope ratio mass spectroscopy. Further tests and analysis are needed to demonstrate the sensitivity of the approach for specific soil N pools, comparing results obtained to isotope ratio mass spectroscopy data. Analysis of the 15N2O data together with the 15N enrichment of the soil N pools will establish the significance of specific pathways of N2O production and their response conventional vs. soil health-oriented farming practices.

How to cite: Hood-Nowotny, R., Bachmann, J., Gallon, S., Breuzeville Calderon, A., Keiblinger, K., and Friedl, J.: Investigating shifts in nitrogen transformations in response to soil health oriented management using a new combination of stable isotope approaches, EGU General Assembly 2025, Vienna, Austria, 27 Apr–2 May 2025, EGU25-21457, https://doi.org/10.5194/egusphere-egu25-21457, 2025.

EGU25-253 | ECS | Orals | BG3.49

Soil microbial biomass and nutrient limitation in high altitude treeline ecotones of central Nepal Himalaya 

Rabindra Adhikari, Jürgen Böhner, Ram Prasad Chaudhary, Corinna Gall, Jan Huber, Amrit Maharjan, Yvonne Oelmann, Madhavi Parajuli, Udo Schickhoff, Steffen Seitz, Chandra Kanta Subedi, and Thomas Scholten

Microbial biomass and nutrient content in soils are crucial indicators of ecosystem health and soil productivity as they reflect intricate relationship among soil organic matter decomposition, nutrient cycling, and resource availability for plants and soil organisms. In the treeline ecotone of Nepal Himalaya regions, there has only been a limited research focus on belowground microbial biomass and how it varies in treeline ecotones of near-natural forest ecosystems, particularly in the context of climate change and dynamic treeline positions. With this research, we tried to fill this research gap by measuring soil microbial biomass carbon (MBC), nitrogen (MBN) and phosphorus (MBP) along transects with elevational vegetational zones to assess the nutrient limitation in the forefront of the forest ecotone region. The main objective of our study is to disentangle the relationship between the soil microbiome and nutrient limitation as a controlling factor of tree growth.

We collected 118 soil samples from two slope sectors (northeast and northwest) each with four elevational vegetational zones (3910 to 4260 meter above mean sea level) upper dwarf shrub heath: UD, lower dwarf shrub heath: LD, upper krummholz: UC, lower krummholz: LC. Each zone consisted of four 20x20 m² plots, from which composite samples representing soil horizons were taken. MBC and MBN were measured using fumigation-extraction methods. For MBP, after fumigation-extraction, we slightly modified the quantifying method using Inductively Coupled Plasma - Optical Emission Spectroscopy (ICP-OES).

Our result showed low microbial biomass content in soils of the treeline ecotone indicating nutrient limitation which might influence the growth patterns of vegetation and ecosystem dynamics in the alpine treeline of  Himalaya. Specifically, there was a significant decline in MBC values with increasing soil depth, (p-value ≈ 0), with the highest mean MBC of 561 µg g-1 dry soil in the O-horizon followed by progressively lower values in the Ah-horizon: 277 µg g-1, E-horizon: 112 µg g-1 and Bh-horizon: 56.9 µg g-1. Similar decreasing trends were observed for mean MBN and MBP. Elevational zone wise variation followed the order of LD > UD> LC> UC for mean MBC and LD>UD>LC>UC for mean MBN. Unlike MBC and MBN, MBP showed significant differences (p-value= 0.011) among four elevational zones and in the decreasing order of LC > UD > LD > UC with mean MBP values of 184 µg g⁻¹, 106 µg g⁻¹, 90 µg g⁻¹ and 86.8 µg g⁻¹ dry soil, respectively. The ratio of MBC and MBN in the UD elevational zone was high, which might be related to the very low MBN content in the soils. MBC and MBN had a strong positive correlation (r = 0.85). Higher microbial biomass values in the higher altitude zones LD and UD than in LC and UC indicate an active microbial pool in open (higher amount of sun radiation) and dwarf  shrub vegetation zone compared to closed canopy in the Rhododendron campanulatum krummholz zone. These findings contribute to a better understanding of nutrient limitations and their role in treeline shift dynamics within the  krummholz dominated upper treeline ecotone in the study area.

How to cite: Adhikari, R., Böhner, J., Chaudhary, R. P., Gall, C., Huber, J., Maharjan, A., Oelmann, Y., Parajuli, M., Schickhoff, U., Seitz, S., Subedi, C. K., and Scholten, T.: Soil microbial biomass and nutrient limitation in high altitude treeline ecotones of central Nepal Himalaya, EGU General Assembly 2025, Vienna, Austria, 27 Apr–2 May 2025, EGU25-253, https://doi.org/10.5194/egusphere-egu25-253, 2025.

EGU25-2321 | Orals | BG3.49 | Highlight

The gradual optimization of microbial traits regulates warming-induced carbon losses in soils 

Albert C. Brangarí, Melissa A. Knorr, Serita D. Frey, and Johannes Rousk

Global warming raises critical concerns about the redistribution of carbon from soil organic matter to the atmosphere, a process governed by mechanisms that remain poorly understood, making it difficult to predict the outcomes of climate change. Traditionally, warming was expected to increase CO₂ emissions from soils. However, a decade ago, this simplistic view was challenged by observations showing that these initially large emissions gradually diminish over time. This phenomenon represents an ecosystem feedback that has yet to be fully explained.

In this study, we combined laboratory experiments and modelling approaches at the Harvard Forest experiment to investigate the impact of a nine-year +5°C warming treatment on microbial functioning and associated soil carbon losses. Our findings reveal a nuanced interplay between direct and indirect effects of temperature, emphasizing the gradual optimization of microbial traits to warming as a key factor explaining the initially large soil carbon losses that are mitigated over time. These results bridge fundamental ecological principles with observed global change impacts, providing an explanation for the warming-induced carbon losses observed in soils worldwide.

How to cite: Brangarí, A. C., Knorr, M. A., Frey, S. D., and Rousk, J.: The gradual optimization of microbial traits regulates warming-induced carbon losses in soils, EGU General Assembly 2025, Vienna, Austria, 27 Apr–2 May 2025, EGU25-2321, https://doi.org/10.5194/egusphere-egu25-2321, 2025.

EGU25-2609 | Posters on site | BG3.49

Increased biocrust cover and activity in the highlands of Iceland after five growing seasons of experimental warming 

Alejandro Salazar, Eyrún Gunnlaugsdóttir, Ingibjörg Jónsdóttir, Ian Klupar, Ruth-Phoebe Wandji, Ólafur Arnalds, and Ólafur Andrésson

One of the most important questions of our time is how ecosystems will be transformed by climate change. Here, we used a five-year field experiment to investigate the effects of climate warming on the cover and function of a sub-Arctic alpine ecosystem in the highlands of Iceland dominated by biological soil crust (biocrust), mosses and vascular plants. We used Open Top Chambers (OTCs) to simulate warming; standard surface and Normalised Difference Vegetation Index (NDVI) analyses to measure plant cover and function; gas analyzers to monitor biocrust respiration; and the Tea Bag Index approach to estimate mass loss, decomposition and soil carbon stabilization rates. Contrary to our initial hypothesis of warming accelerating an ecological succession of plants growing on biocrust, we observed a warming-induced decreased abundance of vascular plants and mosses —possibly caused by high temperature summer peaks that resemble heat waves— and an increase in the cover of biocrust. The functional responses of biocrust to warming, including increased litter mass loss and respiration rates and a lower soil carbon stabilization rates, may suggest climate-driven depletion of soil nutrients in the future. It remains to be studied how the effects of warming on biocrusts from high northern regions could interact with other drivers of ecosystem change, such as grazing; and if in the long-term global change could favor the growth of vascular plants on biocrust in the highlands of Iceland and similar ecosystems. For the moment, our experiment points to a warming-induced increase in the cover and activity of biocrust.

How to cite: Salazar, A., Gunnlaugsdóttir, E., Jónsdóttir, I., Klupar, I., Wandji, R.-P., Arnalds, Ó., and Andrésson, Ó.: Increased biocrust cover and activity in the highlands of Iceland after five growing seasons of experimental warming, EGU General Assembly 2025, Vienna, Austria, 27 Apr–2 May 2025, EGU25-2609, https://doi.org/10.5194/egusphere-egu25-2609, 2025.

Temperature sensitivity (Q10) of soil organic matter (SOM) decomposition is a crucial parameter to predict soil carbon (C) dynamics and its feedback to climate change. Soil management affects aggregate formation and decomposition, where the impact on Q10 of SOM decomposition within aggregates remains unknown. Using a 14-year field experiment, we demonstrate that maize straw-amended soil had lower SOM stability and higher Q10 than biochar-amended soil, with aggregate size playing a central role in response to the management. Biochar-derived stable compounds accumulate in small macroaggregates (SMA) and microaggregates (MA), as indicated by the increased benzene polycarboxylic acids and decreased 14C age and δ13C. Besides, biochar facilitated C sequestration by increasing mineral protection, microbial C use efficiency, and microbial necromass C accumulation in these smaller aggregates, while large macroaggregates (LMA) were less effective to sequester SOM (high Q10) than smaller aggregate sizes. Maize straw primarily sequestered soil C through SMA by raising mineral protection and decreasing microbial C decomposition. However, it was less effective than biochar in soil C sequestration due to the greater susceptibility of maize straw-derived C to decomposition under warming conditions (high Q10). As such, soil management practices mediate the stability and Q10 of SOM through specific aggregate sizes. Our findings contribute to a better understanding of the impact of aggregate sizes on the carbon-climate feedback in agriculture.

How to cite: Chen, Y. and Sun, K.: Aggregate size mediates temperature sensitivity of soil organic matter decomposition in response to soil management, EGU General Assembly 2025, Vienna, Austria, 27 Apr–2 May 2025, EGU25-2684, https://doi.org/10.5194/egusphere-egu25-2684, 2025.

EGU25-3006 | Orals | BG3.49 | Highlight

Dual roles of microbes in mediating soil carbon dynamics in response to warming 

Yuanhe Yang, Shuqi Qin, Dianye Zhang, and Bin Wei

Understanding the alterations in soil microbial communities in response to climate warming and their controls over soil carbon (C) processes is crucial for projecting permafrost C-climate feedback. However, previous studies have mainly focused on microorganism-mediated soil C release, and little is known about whether and how climate warming affects microbial anabolism and the subsequent C input in permafrost regions. Here, based on a more than half-decade of in situ warming experiment, we show that compared with ambient control, warming significantly reduces microbial C use efficiency and enhances microbial network complexity, which promotes soil heterotrophic respiration. Meanwhile, microbial necromass markedly accumulates under warming likely due to preferential microbial decomposition of plant-derived C, further leading to the increase in mineral-associated organic C. Altogether, these results demonstrate dual roles of microbes in affecting soil C release and stabilization, implying that permafrost C-climate feedback would weaken over time with dampened response of microbial respiration and increased proportion of stable C pool.

How to cite: Yang, Y., Qin, S., Zhang, D., and Wei, B.: Dual roles of microbes in mediating soil carbon dynamics in response to warming, EGU General Assembly 2025, Vienna, Austria, 27 Apr–2 May 2025, EGU25-3006, https://doi.org/10.5194/egusphere-egu25-3006, 2025.

The subalpine ecosystems of the Bieszczady Mountains are characterized by a mosaic of blueberry shrubs (Vaccinium myrtillus) and tall-grass vegetation, with significant implications for soil organic matter (SOM) dynamics. This study explores how vegetation type influences the content and spectroscopic properties of water-extractable organic matter (WEOM) in the topsoil horizons (O and A) in this region. WEOM is a crucial, bioavailable component of SOM that plays a significant role in nutrient cycling and carbon sequestration, particularly in sensitive mountain ecosystems.

Samples of topsoil horizons (O and A) were collected from 20 sites dominated by blueberry shrubs or tall-grass vegetation. Water extracts were analyzed to determine WEOC and WETN concentrations using TOC analyzers. The chemical properties of WEOM were characterized via FTIR-ATR spectroscopy and UV-Vis spectrophotometry. Specific ultraviolet absorbance (SUVA254) and absorbance ratios (E2/E4, E2/E6, and E4/E6) were calculated to assess the aromaticity and molecular composition of WEOM.

The O horizons of soils under blueberry shrubs exhibited significantly higher WEOC concentrations compared to those under tall-grass vegetation. However, WETN concentrations were not significantly different between vegetation types. The WEOC/WETN ratio was higher in soils under blueberry shrubs, indicating more carbon-rich WEOM in these areas.

Spectroscopic analyses revealed notable differences in WEOM composition. FTIR spectra showed more pronounced bands associated with aliphatic compounds and carboxylic groups in WEOM from shrub-dominated soils, suggesting a higher proportion of less decomposed organic matter. UV-Vis spectroscopy indicated higher SUVA254 values for WEOM in grass-dominated soils, reflecting greater aromaticity and advanced decomposition. In the A horizons, differences in WEOC and WETN concentrations and WEOM properties were minimal, likely due to microbial homogenization and reduced vegetation influence.

The results highlight how vegetation significantly affects WEOM quantity and quality, especially in the organic-rich O horizons. Soils under blueberry plants exhibit higher WEOC concentrations and carbon-dominated WEOM, which may improve carbon retention and slow decomposition rates. In contrast, tall-grass vegetation helps to produce more aromatic WEOM, indicative of advanced microbial processing. These findings suggest that shrubification, driven by climate change, can influence WEOM composition and stocks, with implications for carbon cycling and nutrient dynamics in subalpine ecosystems.

This study emphasizes the importance of vegetation type as a key determinant of WEOM properties, shaping both the storage and bioavailability of nutrients in mountain soils. These insights are essential for effective vegetation management and the preservation of ecological functions in fragile subalpine zones.

How to cite: Kramarczuk, P.: Influence of vegetation on the quantity and quality of water-extractable organic matter in the subalpine zone of the Bieszczady Mountains (Eastern Carpathians)., EGU General Assembly 2025, Vienna, Austria, 27 Apr–2 May 2025, EGU25-3150, https://doi.org/10.5194/egusphere-egu25-3150, 2025.

EGU25-4047 | ECS | Orals | BG3.49

Shrub and tree encroachment alter plant-soil interactions in low Canadian Arctic 

Ruud Rijkers, Rica Wegner, Lewis Sauerland, Larissa Frey, and Birgit Wild

Rapid expansion of deciduous shrubs and evergreen trees on the Arctic tundra could induce large losses of soil carbon stocks through increased rhizosphere priming. Through the use of isotopic and molecular techniques, we investigated whether the belowground carbon cycling differed between three plant species that are encroaching Canadian tundra. 13CO2 pulse chase labelling showed that dwarf shrubs (Betula glandulosa) had faster turnover of recent 13C-photosynthates belowground than tall shrubs (Alnus viridis) and black spruces (Picea Mariana). Depth-resolved 13C flux estimations and partial 13C source isolation, both from field and lab measurements, elucidated multiple drivers of the differences in belowground carbon cycling. Turnover rates were strongly dependent on relative belowground carbon allocation, source of respiration and soil depth. Carbon cycling data will be compared with microbial community composition in bulk and rhizosphere soil to disentangle the specific interactions between encroaching plants and their soils. Overall, both plant and soil characteristics were key influences on the fate of recently assimilated carbon belowground. Our work suggests that changing plant communities will influence the belowground carbon cycling of the Arctic tundra. Our data pinpoints towards multiple factors influencing the feedback from northern ecosystems to on-going climate change, which further complicates accurate predictions of soil carbon losses in the northern hemisphere.

How to cite: Rijkers, R., Wegner, R., Sauerland, L., Frey, L., and Wild, B.: Shrub and tree encroachment alter plant-soil interactions in low Canadian Arctic, EGU General Assembly 2025, Vienna, Austria, 27 Apr–2 May 2025, EGU25-4047, https://doi.org/10.5194/egusphere-egu25-4047, 2025.

EGU25-6318 | Posters on site | BG3.49

Microbe promotes soil phosphorus bioavailability at the beginning of pedogenesis 

Yanhong Wu, Mingyang Xu, Haijian Bing, He Zhu, Chaoyi Luo, and Junbo He

The quick accumulation of bioavailable phosphorus (bio-P) promoted the ecosystem development at the very beginning of pedogenesis on the Hailuogou Glacier foreland. It is still unclear what role and how microbe played in bio-P accumulation at the very beginning of pedogenesis.  Using the Hailuogou Glacier foreland on Gongga Mountain as a natural laboratory, microbial community assembly, co-occurrence networks, and PCGs were examined across four successional stages (S1-S4) before the pioneer plant emerged. The results indicated that bacteria were the dominant domain in all four stages. At the very beginning of pedogenesis, microorganisms adapted to scare bio-P conditions by regulating the functional expression of key PCGs. Key genes, including pqqE, gcd, phoD, and 3-Phytase, played a crucial role in mineral phosphorus solubilizing and organic phosphorus mineralizing. Community assembly was predominantly driven by deterministic processes under environmental pressures. Tight cooperative network structures within the microbial communities and dominant microbial taxa were the major factors accelerating the bio-P releasing into the soil. It can be concluded that microbepromoted bio-P accumulation at the very beginning of pedogenesis by regulating PCGs and typical microbial community constructing. These findings provided new insights into the mechanisms by which microbial communities regulate phosphorus dynamics during pedogenesis process.

How to cite: Wu, Y., Xu, M., Bing, H., Zhu, H., Luo, C., and He, J.: Microbe promotes soil phosphorus bioavailability at the beginning of pedogenesis, EGU General Assembly 2025, Vienna, Austria, 27 Apr–2 May 2025, EGU25-6318, https://doi.org/10.5194/egusphere-egu25-6318, 2025.

EGU25-6436 | Posters on site | BG3.49

Climate change shifts risk of soil salinity and land degradation in water-scarce regions 

Yair Mau, Isaac Kramer, and Nadav Peleg

Climate change introduces significant uncertainty when assessing the risk of soil salinity in water-scarce regions. We combine a soil–water-salinity–sodicity model (SOTE) and a weather generator model (AWE-GEN) to develop a framework for studying salinity and sodicity dynamics under changing climate definitions. Using California’s San Joaquin Valley as a case study, we perform first-order sensitivity analyses for the effect of changing evapotranspiration (ET) rates, length of the rain season, and magnitude of extreme rainfall events. Higher aridity, through increased ET, shorter rainy seasons, or decreased magnitude of extreme rainfall events, drives higher salinity — with rising ET leading to the highest salinity levels. Increased ET leads to lower levels of soil hydraulic conductivity, while the opposite effect is observed when the rainfall season length is shortened and extreme rainfall events become less intense. Higher ET leads to greater unpredictability in the soil response, with the overall risk of high salinity and soil degradation increasing with ET. While the exact nature of future climate changes remains unknown, the results show a serious increase in salinity hazard for climate changes within the expected range of possibilities. The presented results are relevant for many other salt-affected regions, especially those characterized by intermittent wet–dry seasons. While the San Joaquin Valley is in a comparatively strong position to adapt to heightened salinity, other regions may struggle to maintain high food production levels under hotter and drier conditions.

How to cite: Mau, Y., Kramer, I., and Peleg, N.: Climate change shifts risk of soil salinity and land degradation in water-scarce regions, EGU General Assembly 2025, Vienna, Austria, 27 Apr–2 May 2025, EGU25-6436, https://doi.org/10.5194/egusphere-egu25-6436, 2025.

EGU25-6862 | ECS | Posters on site | BG3.49

Organic matter in density fractions responds to 10 years of experimental field warming in a temperate forest 

Binyan Sun, Mike Rowley, Guido Wiesenberg, Elaine Pegoraro, Margaret Torn, and Michael Schmidt

Global temperatures could increase by approximately 4°C until 2100, according to IPCC climate scenarios, causing surface and subsoil will warm in synchrony with the atmosphere. This warming is predicted to accelerate soil carbon loss and greenhouse gas release, but also change the composition of soil organic matter in ways that affect its cycling and future vulnerability. This is important because despite low carbon concentrations, subsoils store more than half of the total global soil organic carbon. However, it remains largely unknown how this deep soil carbon will respond to warming. In this study we explore how 10 years of experimental field warming affects soil carbon quantity and quality in bulk soil and in functional (density) fractions in whole soil profiles. 

After 10 years of experimental field warming of a temperate forest (Blodgett, Sierra Nevada, CA, USA), we analyzed carbon composition of bulk soil and density fractions using Diffuse Reflectance Infrared Fourier Transform spectroscopy. Soil carbon functional pools included free and occluded particulate organic matter (fPOM, oPOM) as well as mineral associated organic matter (MAOM), at 3 different depths (10-20, 40-50, and 80-90 cm). The results showed that the relative proportion of carbon in fPOM and oPOM decreased with depth and was lower in warmed plots. Soil carbon (C) quality in fPOM and oPOM did not change with warming or depth. However, C quality in MAOM was different, with 11% more aliphatic C in the topsoil (10-20 cm), and 17% more aromatic C in the deep soil (80-90 cm). This indicated an increasing level of SOC decomposition in subsoil >50 cm. With warming, most of the remaining organic matter in the deep soil was protected by mineral association, with relatively more aromatic C present. This raises the possibility that SOC that is mineral-associated in subsoil, especially in the form of aromatic C, might resist future warming more than SOC in other functional fractions.

How to cite: Sun, B., Rowley, M., Wiesenberg, G., Pegoraro, E., Torn, M., and Schmidt, M.: Organic matter in density fractions responds to 10 years of experimental field warming in a temperate forest, EGU General Assembly 2025, Vienna, Austria, 27 Apr–2 May 2025, EGU25-6862, https://doi.org/10.5194/egusphere-egu25-6862, 2025.

Microbial carbon use efficiency (CUE) and nitrogen use efficiency (NUE) are key parameters determining the fate of C in soils. However, the paucity of investigations of microbial CUE and NUE dynamics through the soil profile with warming makes it challenging to evaluate the terrestrial C feedback to climate change. Here, based on soil samples from a whole-soil-profile warming experiment (0–1 m, +4 °C) and stable isotope (18O and 15N) tracing approaches, we examined the vertical variation of microbial CUE and NUE and its response to ~3.3-year experimental warming in an alpine grassland on the Qinghai-Tibetan Plateau. Our findings revealed that microbial CUE and NUE decreased along soil depth, a trend that was primarily controlled by soil C availability. We also observed differential warming effects on microbial CUE and NUE. Microbial CUE showed no significant response to warming in either the topsoil or deep soil. However, microbial NUE in the deep soil decreased by 53% under warming compared to non-warmed controls, suggesting that warming drives soil microbes to incorporate less N into their biomass in the topsoil. The decrease in microbial NUE was likely triggered by a reduction in soil N availability in the topsoil. Collectively, our work emphasizes the regulatory role of substrate availability on microbial CUE and NUE.

How to cite: Zhang, Q.: Effects of whole-profile warming on microbial carbon and nitrogen use efficiency at different soil depths in an alpine meadow, EGU General Assembly 2025, Vienna, Austria, 27 Apr–2 May 2025, EGU25-7534, https://doi.org/10.5194/egusphere-egu25-7534, 2025.

EGU25-7845 | ECS | Posters on site | BG3.49 | Highlight

Consistent soil organic carbon loss rate across depth under warming 

Wenao Wu and Biao Zhu

Soil organic carbon (SOC) stock is the largest terrestrial carbon reservoir, with a substantial portion stored in the subsoil below 20 cm. The near-synchronous warming of the subsurface poses a threat to SOC storage across the whole soil profile. However, whether topsoil or subsoil is more vulnerable to warming still remains highly debated. Here, we utilize 213 matched observations from 60 field experiments to compare the responses of SOC stock to warming across depth. We find that warming causes SOC losses both in topsoil and subsoil. Moreover, multiple lines of evidence indicate no significant difference in SOC responses to warming at different soil depths, suggesting a consistent SOC loss rate throughout the whole soil profile. Despite the consistent loss rate, subsoil below 20 cm is projected to contribute over 60% absolute SOC losses across the 0-100 cm soil profile under the shared socioeconomic pathways 5-8.5 scenario due to its large SOC stock. We show that SOC in subsoil is as susceptible to warming-induced loss as in topsoil. Neglecting subsoil carbon loss will significantly underestimate the positive climate-carbon cycle feedback.

How to cite: Wu, W. and Zhu, B.: Consistent soil organic carbon loss rate across depth under warming, EGU General Assembly 2025, Vienna, Austria, 27 Apr–2 May 2025, EGU25-7845, https://doi.org/10.5194/egusphere-egu25-7845, 2025.

Numerous studies have explored the impacts of nitrogen (N) deposition on soil organic carbon (SOC) dynamics. However, limited research has investigated the modulatory role of N deposition in urban to rural forests and the underlying microbial mechanisms. We carried out a 5-year field study to explore the links between microbial properties (microbial biomass carbon (MBC), microbial diversity, community composition and functions) and the different SOC fractions (particulate organic carbon, POC and mineral-associated organic carbon, MAOC) submitted to three levels of N addition rates (0, 50, and 100 kg N ha-1 yr-1) in urban–rural gradient forests in eastern China.

We discovered that N addition raised the soil ammonium nitrogen concentration in urban and suburban forests. However, it had no effect on soil acidification or POC or SOC accumulation,and in urban forest the stability was due to the 105 % to 110 % increase in the mineral-associated organic carbon (MAOC) through enhancing peroxidase activity and microbial biomass carbon. On the contrary, high nitrogen input significantly reduced SOC stability in the suburban and rural forest stands. High nitrogen input contributed to the loss of MAOC (-33.6 %) in the suburban forest stand due to the enhancement of microbial biomass nitrogen. High nitrogen addition also decreased the ratio of MAOC to SOC in the rural forest stand by 29.8 % through indirect pathways mediated by the soil Ca2+ concentration and polyphenol oxidase activity. We concluded that SOC in the urban forest was stable when subjected to increased nitrogen deposition, primarily due to the enhancement of MAOC driven by microbial function. This finding has contributed to a better understanding  in predicting forest carbon cycling under conditions of global climate change and urban expansion.

How to cite: Tao, X. and Qian, Z.: Diverging patterns at urban-rural forest gradients: soil organic carbon stability responses to nitrogen addition, EGU General Assembly 2025, Vienna, Austria, 27 Apr–2 May 2025, EGU25-7946, https://doi.org/10.5194/egusphere-egu25-7946, 2025.

EGU25-8485 | ECS | Orals | BG3.49

Environmental controls on the temperature and moisture sensitivity of soil respiration during drying and rewetting events  

Xiankun Li, Arjun Chakrawal, Gustaf Hugelius, and Stefano Manzoni

Understanding the moisture and temperature sensitivity of soil respiration is important as climate change brings more variation in soil moisture (e.g., drought, drying, and rewetting events) and soil temperature (e.g., warming). However, soil moisture and soil temperature sensitivity of soil respiration are often assumed fixed, neglecting environmental controls that might modulate them. Moreover, the soil moisture sensitivity is likely different during drying as opposed to rewetting periods due to the different processes involved, and soil temperature sensitivity is often estimated without separating the drying and rewetting periods, during which processes with contrasting temperature sensitivity are dominant. Here, we collected high-frequency field data on soil respiration, soil moisture, and soil temperature from COSORE (27 sites) and NEON (47 sites) and defined the moisture and temperature sensitivity of soil respiration in both the drying and rewetting periods. Using the monthly standardized precipitation evapotranspiration index (SPEI) and monthly temperature over the last 30 years of each site, we characterized the historical climate conditions by drought frequency and temperature amplitude. Then, the moisture and temperature sensitivity of soil respiration in both the drying and rewetting periods were explained by historical climate conditions, vegetation index, soil properties, and their interactions. The results will provide a better understanding of the environmental controls on soil moisture and temperature sensitivity of soil respiration.

How to cite: Li, X., Chakrawal, A., Hugelius, G., and Manzoni, S.: Environmental controls on the temperature and moisture sensitivity of soil respiration during drying and rewetting events , EGU General Assembly 2025, Vienna, Austria, 27 Apr–2 May 2025, EGU25-8485, https://doi.org/10.5194/egusphere-egu25-8485, 2025.

EGU25-8740 | ECS | Posters on site | BG3.49

Abrupt thaw processes linked to enhanced intermediate C cycle steps within palsa soil mesocosms: a metagenomic analysis 

Mackenzie Baysinger, Mélissa Laurent, Susanne Liebner, Alexander Bartholomäus, and Claire Treat

Permafrost underlies 25% of the land surface area of the northern hemisphere and stores approximately a third of the world's organic soil carbon (C). When permafrost thaws, organic C that was frozen in a suspended state of decomposition rejoins the active layer and can be respired by microbial organisms within the soil as CO2 or CH4. As climate warming advances, permafrost thaw is likely to occur more within abrupt (seasons to decades) timelines as opposed to the generally better understood gradual thaw timelines (decades to centuries). Abrupt timelines increase C emissions over a shorter time scale. This increase in C respiration can be further spurred by the reintroduction of nutrients that were frozen in the permafrost, alongside the soil C. In this study, 1m intact soil cores were collected from a palsa in Northern Finland, and incubated in ex-situ mesocosms for 12 weeks with continuous GHG production measurements. In tandem, subsamples of the soil cores were collected pre- and post- simulated abrupt and gradual thaw scenarios for metagenomic analysis. The coupling of these methods revealed a significant increase of GHG production in the abrupt thaw simulation, as measured by the mesocosm incubations. In the permafrost horizon, this was coupled with a shift to an increase of activity of the intermediate C cycle steps leading to respiration. Additionally, a large taxonomic shift was observed in the permafrost microbial community structure when comparing samples before and after the thaw simulations. Gene abundances associated with nitrogen cycling increased in the abrupt thaw simulation, while there was little discernible change in the Fe and S cycling dynamics pre- and post- thaw. This multidisciplinary approach lays groundwork for our evolving understanding of abrupt permafrost thaw and emphasizes the differences in C cycling strategies microbial communities utilize in abrupt and gradual thaw timescales. 


How to cite: Baysinger, M., Laurent, M., Liebner, S., Bartholomäus, A., and Treat, C.: Abrupt thaw processes linked to enhanced intermediate C cycle steps within palsa soil mesocosms: a metagenomic analysis, EGU General Assembly 2025, Vienna, Austria, 27 Apr–2 May 2025, EGU25-8740, https://doi.org/10.5194/egusphere-egu25-8740, 2025.

The availability of phosphorus (P) in soils will ultimately determine forest productivity because of increasing P limitation in terrestrial ecosystems. However, how root exudates affect the availability of soil P in subalpine forests remains unclear. Here, bulk soils (BS) and rhizosphere soils (RS) under Abies fabri and Rhododendron decorum were respectively collected in the early-, mid- and late-growing seasons in a subalpine forest of eastern Tibetan Plateau, and low molecular weight organic acids (LMWOAs), microbial biomass P and P fractions were analyzed to decipher the effects of the plants on soil P availability. The P fractions in both BS and RS showed a distinct difference between A. fabri and R. decorum because of their different P acquisition strategies. The ericoid mycorrhiza-associated R. decorum sequestered soil available P through organic P mineralization, while the ectomycorrhizal mycorrhiza-associated A. fabri directly or indirectly acquired both the organic and inorganic P pools. Seasonal variations in soil available P further revealed that the difference in the P acquisition by the two species was closely associated with their growing stages. The increase in the concentrations of available P in RS of A. fabri was significantly related to the LMWOAs that dominated by citric acid, likely through the desorption or ligand exchange rather than acidification effect because of limited range of soil pH in the mid-growing season, while organic P mineralization contributed to available P for R. decorum in the early-growing season. The results of this study indicate that LMWOAs can significantly promote P availability in RS of A. fabri, mycorrhizal types and plant growing stages drive plant P acquisition, which results in the coexistence patterns of different species in the same habitat.

How to cite: Zhu, H., Wu, Y., and Bing, H.: Species-dependent phosphorus acquisition strategy modulates soil phosphorus cycle in the subalpine forest of eastern Tibetan Plateau, EGU General Assembly 2025, Vienna, Austria, 27 Apr–2 May 2025, EGU25-9014, https://doi.org/10.5194/egusphere-egu25-9014, 2025.

EGU25-9635 | ECS | Posters on site | BG3.49 | Highlight

Global soil organic carbon changes with reforestation/afforestation 

Yijie Wang, Yifan Xu, Yakun Zhu, and Zhangcai Qin

Soil organic carbon (SOC) changes resulting from forestation (including afforestation and reforestation) play a crucial role in evaluating the forest-pathway contribution to global climate change mitigation within the framework of nature-based climate solutions. However, forestation may fail to increase SOC and even lead to SOC decline over certain time periods, potentially offsetting the climate mitigation benefits achieved through biomass carbon sequestration. To address this, we review global studies on forestation, encompassing both plantations and natural regeneration, and analyze the factors driving SOC changes after afforestation and reforestation. Our analysis reveals that higher initial SOC tends to cause regional soil carbon loss, with topography, climate, soil condition, and land use history together determining overall SOC changes after forestation. Furthermore, we utilize random forest models to predict future SOC dynamics following forestation, with significant variability observed across climate zones in first 30 years, and the contribution of SOC to total carbon sequestration appears lower than previously estimated. These findings highlight the need for greater consideration of local conditions when designing forestation strategies to optimize ecosystem carbon sequestration, and to enhance soil’s role in achieving sustainable climate change mitigation goals. 

How to cite: Wang, Y., Xu, Y., Zhu, Y., and Qin, Z.: Global soil organic carbon changes with reforestation/afforestation, EGU General Assembly 2025, Vienna, Austria, 27 Apr–2 May 2025, EGU25-9635, https://doi.org/10.5194/egusphere-egu25-9635, 2025.

Tundra ecosystems are vast reservoirs of organic carbon and sensitive areas to climate change. The plant community and soil properties in tundra are changing significantly due to climate warming, which may further affect the temperature sensitivity of soil organic carbon (SOC) decomposition. However, the microbial mechanism by which plant-derived C input affects the temperature sensitivity of SOC decomposition remains unclear. Here we used quantitative stable isotope probing of DNA to examine how bacterial taxa affect the temperature sensitivity of SOC decomposition in an alpine tundra following the addition of glucose. Our results showed that the glucose addition caused significant changes in microbial community composition, with microorganisms transitioning from the sensitive taxa at lower temperatures (5-15℃) to the sensitive taxa at higher temperatures (15-25℃), which may explain why the Q10 of native SOC decomposition increased in 15-25 ℃, compared with no glucose addition. The study suggests many bacterial taxa change with temperature and plant-derived C input, and community-assembled traits of microbial taxa may better predict SOC dynamics in the alpine tundra.

How to cite: Chang, Q., Guo, Z., He, Y., and Bai, E.: Plant-derived C input regulates the temperature sensitivity of soil organic carbon by changes in bacterial community composition in an alpine tundra, EGU General Assembly 2025, Vienna, Austria, 27 Apr–2 May 2025, EGU25-9675, https://doi.org/10.5194/egusphere-egu25-9675, 2025.

EGU25-10174 | ECS | Posters on site | BG3.49

­­­­­­­­­­­­­­­­The influence of deadwood on the carbon dynamics of a near-natural beech forest - a question of soil moisture? 

Robin Schäfferling, Eric Zeidler, Alina Azekenova, Gabriela Fontenla-Razzetto, Alexandra Koller, Patrick Wordell-Dietrich, Lilli Zeh, Britt Kniesel, Stefan Julich, Kenton Stutz, Karl-Heinz Feger, Karsten Kalbitz, and Goddert von Oheimb

Deadwood is an essential component of intact forest ecosystems. It is a hotspot of biodiversity, can contribute to water retention and has complex effects on various soil functions, such as the quality and quantity of soil organic matter. Whether deadwood makes a positive contribution to carbon storage in forest soils, and how site-specific parameters might contribute, has not been extensively investigated. We therefore ask how the effect of deadwood on the formation and stabilisation of soil organic matter varies with soil moisture.

The study was carried out as part of the BENEATH project in a near-natural beech forest in the Dübener Heide near Leipzig, Germany. Three monitoring sites (wet, intermediate, dry) were established on the slope of an old moraine along a natural soil moisture gradient. At all sites, undisturbed soil samples were taken at three depths (0-10 cm, 10-20 cm, 20-30 cm) directly under deadwood in an advanced stage of decay, as well as reference samples (at a distance of 2 m from the deadwood). Soil solution was collected under deadwood and on reference plots using suction plates and cups at 5 cm and 20 cm depth, respectively. Carbon (C) and nitrogen contents were determined for all samples. For soil samples, the size of differently stabilised C pools was determined by density fractionation. Soil respiration was measured monthly by chamber measurement on deadwood-influenced soil and on reference plots. Volumetric soil water content and soil temperature were continuously recorded using SMT100 sensors.

The highest soil organic carbon (SOC) contents and the greatest changes due to deadwood were found between 0 and 10 cm depth. At the wet and dry sites, deadwood had a positive effect on SOC content, at the intermediate site the effect was negative. SOC stabilisation was not affected. The concentration of dissolved organic carbon (DOC) in the soil solution was higher under highly decomposed deadwood than at the reference sites. Overall, the highest values were measured on the wet site. Soil respiration was increased on both wet and dry site under the influence of deadwood compared to the reference. The results indicate that the effect of deadwood on C dynamics is critically dependent on soil moisture. The influence of the deadwood itself on the soil water balance seems to be of particular importance. It is likely that changes in soil moisture (due to deadwood or soil properties) will lead to changes in microbial activity with effects on the intensity of processes such as microbial decomposition of SOC or release of organic C from deadwood or litter.

Our investigations should contribute to a better understanding of the role of deadwood in the C-cycle of forest soils. They can provide information for a more accurate accounting of C fluxes in forests and for a more climate-smart forest management.

How to cite: Schäfferling, R., Zeidler, E., Azekenova, A., Fontenla-Razzetto, G., Koller, A., Wordell-Dietrich, P., Zeh, L., Kniesel, B., Julich, S., Stutz, K., Feger, K.-H., Kalbitz, K., and von Oheimb, G.: ­­­­­­­­­­­­­­­­The influence of deadwood on the carbon dynamics of a near-natural beech forest - a question of soil moisture?, EGU General Assembly 2025, Vienna, Austria, 27 Apr–2 May 2025, EGU25-10174, https://doi.org/10.5194/egusphere-egu25-10174, 2025.

EGU25-11489 | ECS | Posters on site | BG3.49

Soil organic matter dynamics along a long-term soil warming gradient in a subarctic forested ecosystem 

Jana Kehr, Anne Peter, Damien Finn, Christoph Tebbe, and Christopher Poeplau

Global warming will lead to a temperature rise of the soil, with a stronger effect in high latitude areas as compared to the global average. Soil warming could cause positive carbon-climate feedback, but this is still subject to many uncertainties. To enhance the understanding of how warming impacts underlying biogeochemical processes in top – and subsoils, our study makes use of a century-scale geothermal warming gradient. It is located in an aspen-dominated subarctic forest in the southern Yukon-Territory, Canada. A previous study at the site showed the SOC-stock to be reduced with warming, while the N-stock remained mainly unchanged. Thus, the C:N ratio was reduced, which was particularly pronounced in subsoils. Moreover, N shifted from the particulate-organic matter (POM) pool to the mineral-associated organic matter (MAOM) pool. We hypothesize the shift to be related to a higher microbial contribution to the MAOM fraction. In addition, the contribution of plant-derived OM in the subsoil might have decreased. This might be due to a change of root biomass distribution along the soil profile, as it is assumed that warming enhances N availability and the distribution of soil moisture. Furthermore, we hypothesize the soil structure to be a relevant factor for the distribution and loss of SOC, as the fraction of sand and stable aggregates (S+A) might be reduced with warming.

To understand the coupling- or decoupling of C- and N cycles, we will determine biogeochemical parameters at four warming intensities up to a warming of +10 °C to a depth of 80 cm. This design allows us to identify potential non-linear responses and it includes different warming scenarios. We will measure C- and N stocks of the POM, S+A and MAOM fraction. To moreover address the warming effect on the relative organic matter turnover, δ13C and δ15N values will be analyzed. For soil structural changes, the mean weight diameter of water-stable aggregates is evaluated. Furthermore, the coarse- and fine root biomass is assessed along the soil profiles. This comprehensive study will gain valuable biogeochemical insights and first results of ongoing evaluations will be presented.

How to cite: Kehr, J., Peter, A., Finn, D., Tebbe, C., and Poeplau, C.: Soil organic matter dynamics along a long-term soil warming gradient in a subarctic forested ecosystem, EGU General Assembly 2025, Vienna, Austria, 27 Apr–2 May 2025, EGU25-11489, https://doi.org/10.5194/egusphere-egu25-11489, 2025.

EGU25-12202 | ECS | Orals | BG3.49

Rapid acclimation of topsoil physicochemical and biotic properties to experimental climate change 

Daniel Wasner, Tom W.N. Walker, Billur Bektaş, TransPlant Network, and Jake M. Alexander

Climate change rapidly alters the conditions which govern the differentiation of soils, with implications for the wide range of indispensable ecosystem functions that soils provide. The ability of soils to perform these functions in the future will depend on how quickly soil physicochemical and biotic properties respond to warming. On the one hand, soil development is a process that takes millennia. On the other hand, soil processes are mediated by chemical and microbial reactions that can be very rapid, potentially altering soil functioning over a period of months to years. In addition, soils are highly diverse depending on parent material and environmental conditions. As a result, simple questions about soil-climate responses remain unanswered: How long does it take for soil to acclimate to a changed climate? And do some soil properties acclimate faster than others?


Here, we addressed these questions with a novel approach which combines elevation gradients with soil transplantation experiments. Elevation gradients are used to study the potential long-term effects of climate, because they can control for parent material while allowing soils to acclimate to climate differences between elevations over long periods of time. Transplant experiments across elevation are warming experiments in which the elevational changes in climate across space are used to investigate short-term climatic responses. Based on the assumption of space-for-time, soils at low elevation can represent the expected state of transplanted soils that have fully acclimated to a new climate over longer timescales. Observations across different transplant experiments thereby provide the opportunity to see whether and how quickly short-term changes converge on expected longer-term changes. To this end, we collected topsoils from eleven elevational transplant experiments across the Alps, Scandinavia and the Rocky Mountains which varied in experiment duration between 1-9 years. We analyzed elevational differences and short-term warming-responses of organic matter dynamics (pools and fluxes), organic matter characteristics (e.g. fraction, functional groups, thermal stability), microbial communities (bacteria, fungi) and soil physicochemistry (pH, particle size, weathering products).  


We found that short-term responses of soils to warming were mainly in the same direction as expected changes based on elevational differences between soils. Moreover, different types of soil properties acclimated at comparable and rapid paces: Organic matter dynamics had acclimated to warmer climate by up to 57% of expected change (16% on average across sites). Organic matter characteristics had acclimated by up to 74% (14% average), microbial communities by up to 82% (average 14%) and soil physicochemistry by up to 67% (23% average). Acclimation was significantly related to experiment duration for organic matter dynamics, microbial communities and soil physicochemistry. The observed relationships suggest that, with simplistic assumptions, soils would fully acclimate to the experimental climate change within two decades. Based on climate projections, we estimated that the experiments simulated an average cumulative warming of four to five decades. Taken together, we conclude that topsoil properties can respond rapidly to climate change, implying that many soil functions could keep up with climate change without major time lags.

How to cite: Wasner, D., Walker, T. W. N., Bektaş, B., Network, T., and Alexander, J. M.: Rapid acclimation of topsoil physicochemical and biotic properties to experimental climate change, EGU General Assembly 2025, Vienna, Austria, 27 Apr–2 May 2025, EGU25-12202, https://doi.org/10.5194/egusphere-egu25-12202, 2025.

EGU25-12761 | ECS | Orals | BG3.49

Warming effects on soil microbial community composition in Nordic salt marsh ecosystems 

Johanna Schwarzer, Ella Logemann, Julian Mittmann-Goetsch, Kai Jensen, Peter Mueller, and Susanne Liebner

Plant-microbe interactions control ecosystem functioning. Soil microbial communities regulate nutrient cycling, and by this influence plant productivity and community composition. Wetland plants steer the soil und rhizosphere microbiome through the release of organic compounds and oxygen from roots as well as through the input of litter.

The present study investigates warming effects on soil microbial community composition and activity in two Baltic salt-marsh sites with similar vegetation composition and soil characteristics in relation to plant community composition and soil redox conditions. We hypothesize that soil microbiomes from both sites show a similar response to warming through modulation in taxonomic composition and enzymatic activity.

Soil sods from salt marshes in Sweden and Denmark were transported to the Institute of Plant Science and Microbiology at the University of Hamburg and exposed to a large range of warming treatments in a state-of-the-art experimental facility with automated above and belowground heating (ambient, +3°C, +6°C) over two consecutive growing seasons. We analyzed 16S rDNA and ecoenzymatic activity across different soil depths to investigate the warming response of the microbial community.

In contrast to our hypothesis, a consistent response to warming was missing. Instead, we found that sample origin and soil depth had a strong effect on microbial community composition and ecoenzymatic activity. We observed a stronger warming effect on microbial community composition for samples originating from Denmark, which also showed a stronger differentiation across soil depth. Samples originating from Sweden showed less pronounced depth differentiation, and a weaker response to warming in microbial community composition. However, samples from Sweden had a higher variability of ecoenzymatic activity, suggesting a physiological adaptation to warming rather than an adaptation through changes in taxonomic composition as seen in samples from Denmark. In my presentation, I will further discuss potential effects of vegetation composition and productivity as well as biogeochemical parameters under warming on microbial community composition in salt marsh ecosystems.

How to cite: Schwarzer, J., Logemann, E., Mittmann-Goetsch, J., Jensen, K., Mueller, P., and Liebner, S.: Warming effects on soil microbial community composition in Nordic salt marsh ecosystems, EGU General Assembly 2025, Vienna, Austria, 27 Apr–2 May 2025, EGU25-12761, https://doi.org/10.5194/egusphere-egu25-12761, 2025.

EGU25-14297 | ECS | Orals | BG3.49 | Highlight

Understanding soil pore response to winter freeze-thaw 

Kaizad Patel, Alexandra Contosta, William Petersen, Cristhian Teixeira, Tamas Varga, and Jianqiu Zheng

Freeze-thaw events disrupt soil pore structure, with implications for larger scale greenhouse gas fluxes and nutrient balance in winter and the growing season. Given its strong influence on soil C and N cycling, we need a better understanding of how pore structure is altered by freeze-thaw disturbances. Our objective was to investigate and quantify changes in the physical structure of soil, in response to experimental freeze-thaw disturbance. 

We collected intact soil cores from a northern hardwood forest in New Hampshire, USA. The soils were held at two contrasting water contents (low vs. high moisture) and then subjected to repeated freeze-thaw cycles in the laboratory, alternating between -10 °C and +4 °C. Soil porosity and pore network connectivity were determined during each freeze and thaw event using X-ray computed tomography (XCT) imaging. CO2 fluxes were measured continuously to track changes in microbial respiration following each disturbance. In addition, soil organic carbon was characterized using high resolution FTICR-MS to determine changes in the available C pool. This work links physical changes in soil structure to biogeochemical responses, highlighting the role of microsite scale processes on core-scale fluxes. 

How to cite: Patel, K., Contosta, A., Petersen, W., Teixeira, C., Varga, T., and Zheng, J.: Understanding soil pore response to winter freeze-thaw, EGU General Assembly 2025, Vienna, Austria, 27 Apr–2 May 2025, EGU25-14297, https://doi.org/10.5194/egusphere-egu25-14297, 2025.

EGU25-16954 | Posters on site | BG3.49 | Highlight

Substantial subsoil carbon loss from beech forests since the 1980s 

Mathias Mayer, Klaus Dolschak, Emilia Winter-Artusio, Michael Grabner, Michael Tatzber, Iftekhar Uddin Ahmed, Elisabeth Wächter, Isolde K. Berger, Pétra Berger, Wolfgang Wanek, and Torsten W. Berger

Soils are a major carbon (C) reservoir, with subsoils (>20 cm) storing the majority of this C. Predicting the response of subsoil C to global change remains a critical research priority, yet long-term field observations for forest ecosystems are scarce. In this study, we assess temporal C dynamics in mineral soils to 90 cm depth of 62 temperate European beech (Fagus sylvatica) stands in Austria using data from sampling campaigns in 1984, 2012 and 2022. Our results show a significant increase in C stocks between 0-20 cm and a significant decrease in C stocks between 20-50 cm and 50-90 cm depth, suggesting substantial C losses from the subsoil. These losses outweighed the C gain in topsoils, resulting in an overall soil C loss since the 1980s. Organic-rich calcareous soils appear to be particularly vulnerable to C loss, probably because they are less effective at stabilising C than soils on other substrates. We suggest that changes in climate (i.e. warmer and wetter) and factors such as changes in rooting depth or litter inputs may underlie the observed patterns of depth-dependent soil C changes. The estimated soil C loss accounted for 23% of the C accumulated in aboveground biomass, as determined by dendrochronological analysis, indicating a reduction in the ecosystem's carbon sink capacity. Our results highlight the importance of including subsoil C in forest ecosystem assessments, as it plays a key role in the overall carbon balance.

How to cite: Mayer, M., Dolschak, K., Winter-Artusio, E., Grabner, M., Tatzber, M., Ahmed, I. U., Wächter, E., Berger, I. K., Berger, P., Wanek, W., and Berger, T. W.: Substantial subsoil carbon loss from beech forests since the 1980s, EGU General Assembly 2025, Vienna, Austria, 27 Apr–2 May 2025, EGU25-16954, https://doi.org/10.5194/egusphere-egu25-16954, 2025.

EGU25-21285 | ECS | Orals | BG3.49

A New Model for Synthesis: The Soil Warming Experiment to Depth Data Integration Effort (SWEDDIE) 

Jeffrey Beem-Miller, William Riley, Margaret Torn, Michael Schmidt, and Peter Reich

Ecosystem warming experiments offer key insights into the functioning of plants, microbes, and biogeochemical processes in a warmer world, but are limited by their ecological context, within site heterogeneity, and instrumentation. The Soil Warming Experiment to Depth Data Integration Effort (SWEDDIE) is a joint platform developed by the DeepSoil2100 network (23 warming experiments worldwide) to overcome these limitations through the creation of a network-wide database.

The SWEDDIE database is designed with FAIR principles to accommodate a wide range of data types, with a streamlined data ingestion system and user-friendly query and reporting tools. Comprehensive metadata reporting standards enable SWEDDIE to serve as a repository for past, present, and future datasets. Harmonization of data is facilitated with data dictionary files that accompany and describe variables in each data file and also store sensor and methods information. SWEDDIE consists of both publicly accessible and network-only data tiers, and is hosted on ESS-DIVE to leverage existing data repository infrastructure. Data ingestion, wrangling, and synthesis tools for SWEDDIE are also available in a companion R package.

A key tenet of SWEDDIE is the inclusion of soil measurements below 0.2 m, as the warming response of C stocks in deeper soil layers remains both highly uncertain and consequential for the global C cycle. Accordingly, we welcome new sites and data submissions, provided that > 1 °C warming has been observed below this depth. The first synthesis analysis with SWEDDIE focused on the impact of warming on soil moisture, while also serving to test the SWEDDIE data model and refine the harmonization approach. The results of this analysis provide quantitative evidence that warming leads to decreased soil moisture throughout the soil profile, but with more drying in surficial compared to deeper soil layers. The degree of warming correlates directly with the magnitude of soil drying, but the specific relationship between warming and drying varies by site as well as seasonally.  

SWEDDIE is at its core a community project. The results of the preliminary soil moisture analysis are a key building block of one of the next planned synthesis efforts: using selected experiments to benchmark soil C warming responses with the ecosys model. This demonstrates the positive feedback inherent to this platform, i.e., that active community engagement leads to improved data coverage, which in turn enhances our capacity to generalize warming responses across ecological gradients, inform global models, and quantify potential experimental biases.

How to cite: Beem-Miller, J., Riley, W., Torn, M., Schmidt, M., and Reich, P.: A New Model for Synthesis: The Soil Warming Experiment to Depth Data Integration Effort (SWEDDIE), EGU General Assembly 2025, Vienna, Austria, 27 Apr–2 May 2025, EGU25-21285, https://doi.org/10.5194/egusphere-egu25-21285, 2025.

Empirical assessments are valuable sources of knowledge to evaluate impacts of global change on organisms and ecosystems. Experimental data are especially valuable as they offer controlled conditions for testing hypotheses and establishing process understanding. However, these approaches are also notoriously difficult to upscale to broad geographic extents as they require detailed and often labor-intensive studies in multiple field sites. Meta-analyses based on shared protocols and ‘distributed experiments’, that is, experiments replicated across broad geographic or environmental extents, offer opportunities to overcome these challenges. The International Tundra Experiment (ITEX) is one of the largest and longest-running distributed experiments in plant and ecosystem science. In this talk, we will present a recent ITEX data synthesis project that used experimental data to assess the processes underlying increased ecosystem respiration in the warming tundra.   

Arctic and alpine tundra ecosystems are large reservoirs of organic carbon, and climate warming may stimulate ecosystem respiration and release carbon into the atmosphere. The magnitude and persistence of this stimulation and the environmental mechanisms that drive its variation remain uncertain. To address this knowledge gap, we synthesized 136 datasets from 56 open-top chamber in situ warming experiments located at 28 arctic and alpine tundra ITEX sites that have been running for up to 25 years. We show that a mean rise of 1.4 °C in air and 0.4 °C in soil temperature results in an increase in growing season ecosystem respiration by 30%, due to increases in both plant-related and microbial respiration. There was substantial variation in the warming effects on respiration, however. Such context-dependencies have often frustrated attempts at generalizations in ecology, but we show how the distributed experimental approach allowed us to disentangle the ecological processes underlying these variations. We found that tundra sites with stronger nitrogen limitation, and sites in which warming stimulated plant and microbial nutrient turnover, seemed particularly sensitive in their respiration response to warming. This knowledge may improve the accuracy of global land carbon–climate feedback projections. Our study highlights how empirical approaches that enable process understanding of context-dependent ecological variation may allow generalization and prediction of complex ecological phenomena.

How to cite: Vandvik, V. and Maes, S. and the coauthors: On how a distributed experimental approach informs our understanding of the processes underlying context-dependencies in the ecosystem respiration response to a warming tundra, EGU General Assembly 2025, Vienna, Austria, 27 Apr–2 May 2025, EGU25-21337, https://doi.org/10.5194/egusphere-egu25-21337, 2025.

EGU25-842 | ECS | Orals | SSS4.5

Effect of Warming on Arctic Tundra Microbes 

Jason Bosch, Frances Rose Gilman, Daan Blok, Carsten S Jacobsen, William E Holben, Anders Michelsen, Bo Elberling, Anders Priemé, and Jana Voříšková

One the biggest challenges today is the environmental disruption caused by climate change. Climate change is particularly important in arctic environments which are warming faster than the global average. This can result in a thicker and warmer active layer of the tundra soil and increased microbial activity, resulting in the release of vast quantities of stored carbon and nitrogen in form of greenhouse gases into the atmosphere, depending on mainly water content. Despite its importance, we currently have a limited understanding of how warming can affect arctic microbes and only a few studies that have examined fungi and bacteria at the same time or compared the total and active communities.

We show the effect, after one year, of simulated warming using open-top chambers and snow fences on a soil microbial community in Greenland, using a multifactorial study design that considers bacteria and fungi, the total (DNA-based) and active (RNA-based) community and changes over the course of a growing season. We observed a significant increase in soil temperature at the treated sites as well as changes in the environmental variables of carbon:nitrogen, total organic carbon, microbial carbon, microbial nitrogen, microbial carbon:nitrogen and loss on ignition.

The microbial communities of both bacteria and fungi were highly variable across replicates with sampling site accounting for the majority of variation explained in community composition for both bacteria (16.9%) and fungi (27.5%). While warming had an effect on the communities, it accounted for only a small proportion of variation (2.6% for bacteria, 4.9% for fungi) and few specific taxa were identified as differentially abundant. The bacterial community showed a clear split between the total and active community that accounted for 10.5% of the total variation, however there was no difference in the fungal community. We also observed changes in the community throughout the season but these differences were small and accounted for a similar amount of variation as the treatment (4.2% for bacteria, 3.6% for fungi). The majority of fungi (65%) could not be assigned to a guild, however, we found that the abundance of saprotrophs increased in response to warming.

Our results show only minor changes to the composition of an arctic soil microbial community in response to climate manipulation. This suggests that climate change will primarily influence the activity of microbes rather than the community composition.

How to cite: Bosch, J., Gilman, F. R., Blok, D., Jacobsen, C. S., Holben, W. E., Michelsen, A., Elberling, B., Priemé, A., and Voříšková, J.: Effect of Warming on Arctic Tundra Microbes, EGU General Assembly 2025, Vienna, Austria, 27 Apr–2 May 2025, EGU25-842, https://doi.org/10.5194/egusphere-egu25-842, 2025.

EGU25-843 | ECS | Orals | SSS4.5

Interactive effects of warming and drought on seasonal dynamics of soil microbial communities and functions  

Itzel Lopez Montoya, Nicholas O.E. Ofiti, and Madhav P. Thakur

Soil microbial communities are known to drive key processes such as carbon and nutrient cycling. These microbes have developed physiological and metabolic adaptations to cope with the constraining conditions found in soils. However, their responses to climate change, such as increased temperatures and drought, remain uncertain.  In addition, the physiological adaptations, interactions, and feedback mechanisms within microbial communities during such perturbations, as well as the mechanisms driving the temporal dynamics of microbial responses and recovery remain understudied.

To address these gaps, we assessed soil microbial responses in an outdoor mesocosm experiment, where warming and drought are simultaneously manipulated. We characterized microbial community composition, and we quantified extracellular enzyme activity and microbial biomass, at four time points over the course of a year: before drought (early-growing season), immediately after drought (peak of the growing season), one month after drought (peak of the growing season), and three months after drought (end of the growing season), on 4 different temperature regimes. We further associate both soil biotic (e.g., microbial diversity and composition) and abiotic variables (e.g., organic matter quality) to better understand enzymatic shifts due to warming and drought.

Our results reveal distinct post-drought recovery patterns in fungal and bacterial diversity under various warming scenarios. Fungal diversity seems more resistant to drought and warming than bacterial diversity. The activity of soil microorganisms declined immediately following drought, with recovery varying based on the type of enzymatic substrate. Oxidative enzymes were highly sensitive to the combined effects of warming and drought, and drought hindered their activity in soils exposed to periodic heatwaves 3 months after drought. On the other hand, constant warming enhanced the recovery of hydrolytic enzymes 3 months after drought, but this recovery was obstructed by periodic heatwaves. These findings suggest that hydrolytic enzymes seem to recover after drought likely due to fungal and bacterial diversity recovery.

These results suggest that soil microbial activity may recover after drought in the short term under warming, but repeated periodic heat waves could disrupt this recovery, by changing microbial community composition and potentially leading to shifts in functional capabilities, having detrimental impacts on carbon and nutrient cycling. By examining drivers such as soil organic matter quality, moisture, and nutrient availability, we aim to obtain critical insights into the stability of soil microbial activity under the combined effects of warming and drought, with implications for predicting and mitigating ecosystem changes in a warming world.

How to cite: Lopez Montoya, I., Ofiti, N. O. E., and Thakur, M. P.: Interactive effects of warming and drought on seasonal dynamics of soil microbial communities and functions , EGU General Assembly 2025, Vienna, Austria, 27 Apr–2 May 2025, EGU25-843, https://doi.org/10.5194/egusphere-egu25-843, 2025.

EGU25-1328 | ECS | Posters on site | SSS4.5

Microbial mediation of nepheline-bearing rock weathering releases nutrients for crop growth  

Phattharawadee Wacharapornpinthu

Enhanced rock weathering (ERW) has been considered a new technology to mitigate climate change. Organic acids exuded from plant roots and microbes, e.g., oxalate, gluconate, and citrate, can enhance the rates of rock weathering. Additionally, cations released from rock dust to the soil environment will require ionic neutrality, which is mainly balanced by bicarbonate in soil. This process increases carbon sequestration, and the carbon can be long-term stored either in the form of carbonate minerals or bicarbonate. The first stage of this study is to demonstrate whether microbes (Streptomyces sp.) can enhance rock weathering.

Streptomyces sp. are filamentous bacteria capable of decomposing organic matter and therefore very important in the soil environment. Three Streptomyces strains were isolated from the surfaces of weathered dolerite and screened for their ability to mobilize potassium (K) from rock dusts. All three strains, Mid SCVA3, Mid SCVA1 and MO AIA1, can grow on synthetic minimum medium agar with rock dust as K source. The rock dusts used in this study were nepheline-bearing rocks, Bo Phloi alkaline basalt (ABP), refined nepheline syenite (RNS) and nepheline syenite tailings (NST). Nepheline is a fast-weathering mineral under Earth’s surface conditions. There is 3 to 25% of K substitution in the position of the sodium ion, so nepheline-bearing rocks are a natural and sustainable alternative K source for crop nutrition. An amount of rock dust correlating to 250 ppm K was applied to a weathering experiment. Results show that growth rates of strains using rock dust as a sole source of nutrients were different, referred from glucose consumption. MO AIA1 was the best-growing strain, followed by Mid SCVA1 and Mid SCVA3 for all treatments. NST inoculum showed the highest glucose consumption, followed by RNS and ABP. In contrast, looking at elemental releases, Mid SCVA1 was the best strain mobilizing K from all rock treatments, while MO AIA1 and Mid SCVA3 presented similar rates of K releases. However, K release concentration in all inoculums was distinctively higher than abiotic control, supporting that microbes can increase weathering rates of rock dust. Significantly higher concentrations of K were released from ABP than NST and RNS, respectively. For agronomic purposes, ABP will be the best source of K nutrition, and bioaugmentation of Mid SCVA1 will assist in mobilizing more K from the rock. Next step, we will further investigate carbon removal related to ERW in plant growth experiment, using Streptomyces sp. to enhance rock weathering.


How to cite: Wacharapornpinthu, P.: Microbial mediation of nepheline-bearing rock weathering releases nutrients for crop growth , EGU General Assembly 2025, Vienna, Austria, 27 Apr–2 May 2025, EGU25-1328, https://doi.org/10.5194/egusphere-egu25-1328, 2025.

Urbanization fundamentally reshapes terrestrial environments, leading to significant alterations in soil microbial communities which play crucial roles in ecosystem functioning. This comprehensive study utilizes amplicon sequencing and GeoChip arrays to assess how urbanization and tree functional types impact the composition and functional capacity of soil microbiota across various climatic zones, including boreal (Lahti, Finland), moderate (Baltimore, USA) and tropical regions (Singapore). By comparing urban parks with varying ages and vegetation types to reference forests, the research provides a nuanced understanding of how urban settings influence microbial dynamics.

Our analysis revealed that urban parks host unique microbial communities, distinct from those found in semi-natural forests. Notably, these communities display a surprising functional redundancy with their forest counterparts, suggesting that urban microbiota maintain essential ecosystem processes despite altered environmental conditions. However, the degree of microbial community homogenization differs by microbial type; bacterial communities showed greater homogenization effects than fungal ones. This differential response highlights inherent differences in ecological strategies between bacteria and fungi, with bacteria more readily adapting to the environmental constraints imposed by urban landscapes.

Furthermore, the type of vegetation significantly influences these patterns. Soils under trees producing recalcitrant litter harbored richer fungal communities compared to those with labile litter types. In contrast, lawns—despite their simplicity—supported unexpectedly high diversities of both bacterial and fungal species. These findings emphasize that both the quality of plant-derived organic matter and the structure of plant communities are critical in shaping soil microbial diversity and function in urban environments.

This study underscores the complex interplay between urbanization, vegetation diversity, and microbial community dynamics, highlighting the resilience of soil microbiota to urban stresses. The implications of these findings are significant for urban ecology and biogeochemistry, providing insights into maintaining biodiversity and ecosystem services in rapidly urbanizing regions.

How to cite: Zheng, B.: Functional redundancy and community homogenization: Effects of urbanization and vegetation on soil microbiota across climatic zones, EGU General Assembly 2025, Vienna, Austria, 27 Apr–2 May 2025, EGU25-1891, https://doi.org/10.5194/egusphere-egu25-1891, 2025.

EGU25-3616 | ECS | Orals | SSS4.5

Global patterns of nutrient limitation in soil microorganisms 

Yongxing Cui, Shushi Peng, Matthias C. Rillig, Tessa Camenzind, Manuel Delgado-Baquerizo, César Terrer, Xiaofeng Xu, Maoyuan Feng, Mengjie Wang, Linchuan Fang, Biao Zhu, Enzai Du, Daryl L. Moorhead, Robert L. Sinsabaugh, Josep Peñuelas, and James J. Elser

The nitrogen (N) and phosphorus (P) limitations in soil microorganisms have profound implications for key soil functions such as organic matter decomposition and soil carbon (C) sequestration. However, the extent and magnitude of microbial N and P limitation in soils worldwide remain largely unknown compared to N and P limitation in plants. Moreover, the spatial variability of microbial N and P limitation may lead to disproportionate responses of microbially driven soil processes and functions to global change factors along environmental gradients. Thus, better understanding of global patterns and drivers of microbial N and P limitation is urgently needed for predicting changes in soil functions and their consequences for terrestrial ecosystem functioning. Herein, we evaluated global patterns of microbial N and P limitation by combining profiles of extracellular enzymes (i.e. ecoenzymes; 5,259 observations) with multiple sets of observational and experimental data from natural (i.e. outside of agricultural and urban areas) terrestrial ecosystems. Our analyses reveal widespread indications of microbial P and N limitation (65 and 40% of observations, respectively) in soils worldwide, with unexpectedly frequent N and P co-limitation in the tropics. This co-limitation could be attributable to elevated microbial N demand for the synthesis of P-acquiring enzymes under P limitation, and thus likely as a secondary N limitation resulting from the inherent P deficiency in tropical soils. Upscaling prediction (0.1 × 0.1° spatial resolution) further indicated certain regions such as the Amazon Basin, Tibetan Plateau, and Siberian regions, which harbor substantial soil organic C, showed signs of strong N and P limitation in soil microorganisms, suggesting a high sensitivity of soil C cycling in these regions to nutrient perturbations. As the first global assessment of spatial variation in microbial N and P limitation, these findings provide clues to explain the long-standing “Tropical N Paradox” (i.e. the apparent up-regulation of ecosystem N cycling processes, such as biological N fixation, despite primary P limitation and high soil N levels in tropical ecosystems) and could be useful for understanding and predicting soil biogeochemical cycles in a changing world. [This study is a work that will be published in PNAS (revised stage)].

How to cite: Cui, Y., Peng, S., Rillig, M. C., Camenzind, T., Delgado-Baquerizo, M., Terrer, C., Xu, X., Feng, M., Wang, M., Fang, L., Zhu, B., Du, E., Moorhead, D. L., Sinsabaugh, R. L., Peñuelas, J., and Elser, J. J.: Global patterns of nutrient limitation in soil microorganisms, EGU General Assembly 2025, Vienna, Austria, 27 Apr–2 May 2025, EGU25-3616, https://doi.org/10.5194/egusphere-egu25-3616, 2025.

EGU25-3637 | ECS | Orals | SSS4.5

Modelling nitrogen-limited litter decomposition with fungal dynamics 

Samia Ghersheen, Stefano Manzoni, Marie Spohn, and Björn Lindahl

Nitrogen (N) availability influences aboveground productivity, yet the mechanisms governing the retention and release of soil N remain poorly understood. In high latitude regions, N availability often limits decomposition, though this critical factor is rarely integrated into existing decomposition models, which predominantly focus on carbon quality and accessibility. To address this gap,  we developed a process-based model of litter decomposition to investigate the effect of low N availability on decomposition. Distinct from most decomposition models, our model explicitly features mechanisms of resource reallocation within the fungal mycelium. Fungal biomass is divided into three fractions: 1) cytoplasmic cells active in decomposition, 2) vacuolised cells with a lower N content and without decomposition capacity, and 3) dead cells (necromass). The model can predict mass loss trajectories of a variety of litter types with different N content based on a single parameter set. The fungal mycelium responds to N limitation by increasing the proportion of vacuolised, inactive cells with a low N content, reducing decomposition rates. Under N limitation, N accumulates in the necromass pool. To predict the observed patterns of N immobilization and release, the rate of fungal necromass decomposition has to be slow and close to that of lignin. Moreover, we found that slow mycelial growth facilitates exploitation of low N resources, whereas fast growth intensifies N-limitation. Our model disentangles the interplay between N availability, mycelial dynamics, and decomposition, pointing towards the potentials of more explicit incorporation of fungal traits in models of N-limited ecosystems. 

How to cite: Ghersheen, S., Manzoni, S., Spohn, M., and Lindahl, B.: Modelling nitrogen-limited litter decomposition with fungal dynamics, EGU General Assembly 2025, Vienna, Austria, 27 Apr–2 May 2025, EGU25-3637, https://doi.org/10.5194/egusphere-egu25-3637, 2025.

EGU25-3829 | Orals | SSS4.5

Do microbes regulate CUE or nutrient recycling to cope with nutrient limitation? 

Stefano Manzoni, Maja Siegenthaler, Samia Ghersheen, Björn Lindahl, and Marie Spohn

Nitrogen (N) limitation can have contrasting consequences on carbon (C) and N cycling in soils, depending on how soil microbes regulate their use of C and N. If microbes respond to N limitation by respiring or excreting more C (overflow hypothesis), C losses from the soil increase with decreasing N availability. In contrast, if under N limitation microbes use N more efficiently and rely less on the scarce available N, C and N can remain in the soil and possibly be stabilized. Efficient N use can be achieved by fungi via resorption of N from senescing mycelium, and in general via local recycling of N when cells die. Here we use a minimal model of litter decomposition to assess how microbes use C and N in litter types with contrasting N contents. The model is fitted to about 500 litter decomposition datasets to estimate microbial C use efficiency (CUE, defined as ratio of growth over C uptake) or N resorption efficiency. Model variants assuming that microbes regulate either their CUE or their N resorption can capture N accumulation and release well, but the latter variants have higher overall performance. This indicates that N resorption can be a fundamental mechanism to cope with N limitation. Moreover, N resorption efficiency as estimated from model fitting decreases with increasing initial litter N content or during decomposition as litter becomes enriched in N. This result implies that N resorption regulation can occur both across litter types with contrasting N contents, and during decomposition within a certain litter cohort. We conclude that N resorption is an ecologically more meaningful strategy to grow in N limited conditions compared to C overflow.

How to cite: Manzoni, S., Siegenthaler, M., Ghersheen, S., Lindahl, B., and Spohn, M.: Do microbes regulate CUE or nutrient recycling to cope with nutrient limitation?, EGU General Assembly 2025, Vienna, Austria, 27 Apr–2 May 2025, EGU25-3829, https://doi.org/10.5194/egusphere-egu25-3829, 2025.

EGU25-4301 | ECS | Posters on site | SSS4.5

How is microbial carbon use efficiency distributed throughout the soil pore network? 

Maëlle Maestrali, Naoise Nunan, and Xavier Raynaud

Microbial carbon use efficiency (CUE) is a fundamental metric in understanding carbon (C) dynamics in ecosystems, particularly in soils. CUE quantifies the balance between the carbon microorganisms assimilate into their biomass and the carbon they lose as CO2 through respiration, thus providing insights into the accumulation and loss of soil organic matter (SOM). Despite its importance, traditional measurements of CUE often fail to account for the significant variations in microenvironmental conditions within soils, which are known to strongly influence microbial activity. Soil microbial communities inhabit a complex three-dimensional pore network, where the physical structure of the soil, particularly pore size and connectivity, shapes microhabitats and constrains microbial distribution, resource access, and activity. Aerobic bacteria and fungi dominate larger pores, whereas micropores can host both aerobic and anaerobic microbes. These spatial and functional heterogeneities are further influenced by agricultural practices, such as tillage, which alter pore size distribution and connectivity. We measured CUE across different pore sizes using short incubation times, minimizing the confounding effects of carbon recycling. To overcome the limitations of single-substrate studies and better capture the functional diversity of microbial communities, we employed a mixture of six 13C-labeled substrates. We evaluated the effect of different agricultural management systems and pore sizes on respiration and CUE, providing new insights into the interplay between soil physical structure and microbial carbon dynamics.

Our findings indicate that higher respiration rates in larger pores are linked to their lower CUE, driven by the prevalence of fast-growing copiotrophic communities. These microbes rapidly utilize carbon during periods of resource availability but exhibit lower efficiency in carbon use due to the favorable environmental conditions, such as greater aeration and nutrient mobility. In contrast, smaller pores host oligotrophic microbes adapted to resource-limited environments, which maximize carbon recycling and exhibit higher CUE due to constrained nutrient availability and reduced mineralization. We also demonstrate that agricultural practices significantly influence CUE by shaping nutrient dynamics, microbial community composition, and pore connectivity. For instance, grassland systems have favoured microbial communities adapted to stable resource availability and with higher CUE. These findings underscore the importance of tailoring management practices to optimize soil structure, enhance carbon retention, and mitigate greenhouse gas emissions.

How to cite: Maestrali, M., Nunan, N., and Raynaud, X.: How is microbial carbon use efficiency distributed throughout the soil pore network?, EGU General Assembly 2025, Vienna, Austria, 27 Apr–2 May 2025, EGU25-4301, https://doi.org/10.5194/egusphere-egu25-4301, 2025.

Soil microorganisms are essential to the processes and cycles that sustain terrestrial ecosystems. They mediate the decomposition of fresh organic matter derived from plant material, driving its transformation into a complex array of microbial products that ultimately form stable soil organic matter. Despite their central role, the extent to which microbial community composition and interactions within these communities shape the transformations of organic matter remains poorly understood.

In this study, we analyse the relationship between the structure of microbial communities and the degradation state of organic matter in individual millimeter-sized soil aggregates sampled from a Beech forest. Microbial communities were characterized by sequencing the 16S rRNA gene (bacteria and archaea) and the ITS region (fungi). Using co-occurrence network analysis and relating microbial composition to biogeochemical parameters (such as C, N, δ15N, and δ13C), we were able to determine three groups of bacteria: generalists, whose abundance does not depend on the degradation state of organic matter, and two groups of specialists – one abundant in soils that are rich in fresh organic matter, and the other abundant in soils that are dominated by more recycled organic matter. While generalists are abundant in all aggregates, the relative abundance of specialists alternates in samples across the gradient of carbon availability. This pattern observed for bacteria is less clear for fungi, for them we distinguish generalists that appear in all samples independent on carbon availability from specialists that are abundant in carbon rich samples. Our findings reveal that the structure of microbial communities in millimeter-sized soil aggregates is closely linked to specific states of carbon recycling. Moreover, this pattern remains consistent across different seasons of the year. Our study highlights the interplay of spatial and temporal complexity of microbial dynamics within soil ecosystems, and the utility of co-occurrence analysis.

How to cite: Guseva, K., Simon, E., and Kaiser, C.: Microbial co-occurrence analysis reveals community restructuring during organic matter degradation in millimeter-sized soil aggregates, EGU General Assembly 2025, Vienna, Austria, 27 Apr–2 May 2025, EGU25-5177, https://doi.org/10.5194/egusphere-egu25-5177, 2025.

Soil microbiomes are fundamental to carbon cycling, organic matter decomposition, and greenhouse gas regulation, making them essential for maintaining ecosystem stability. In coastal wetlands, which store large amounts of carbon and act as major sources of methane emissions, these microbial communities play an especially crucial role. This study examines the impacts of elevated CO2 and warming on soil microbial communities over a six-year chronosquence in a C3 plant-dominated salt marsh. Results showed that bacterial community structure was primarily influenced by seasonal variability, with distinct clustering patterns driven by temporal shifts rather than treatment effects. In contrast, bacterial diversity and network characteristics responded strongly to climate factors. Elevated CO2 alone increased bacterial diversity, while warming alone caused a reduction. However, their combined effects led to a synergistic decline in bacterial diversity, reducing it to 80% of ambient conditions by year six. Network analysis further revealed that the combined treatment caused substantial disruptions to microbial networks, including reduced size, connectivity, and clustering, along with increased modularity. These findings highlight the vulnerability of soil microbiomes to the compounded effects of climate change factors, with potential consequences for the stability and functionality of coastal wetland ecosystems. Incorporating these interactive effects into predictive models is essential for accurately forecasting future carbon cycling dynamics and for guiding the effective management of coastal wetland ecosystems under future climate scenarios.

How to cite: Yang, Y.: Combined effects of elevated CO2 and warming threaten soil microbial diversity and network stability over a six-year chronosequence, EGU General Assembly 2025, Vienna, Austria, 27 Apr–2 May 2025, EGU25-5328, https://doi.org/10.5194/egusphere-egu25-5328, 2025.

It is well known that microbes run soil biogeochemistry. Despite a century of progress in microbial ecology, translating microbial ecology into consequences for the atmosphere-soil carbon balance remains elusive. I posit that the solution to this problem is to assume the vantage point of the organisms whose functions we seek to understand: what is it that microbes want to achieve? Organisms ‘want to’ grow. Achieving growth defines both evolutionary fitness and ecological success. Thus, the complex coordination of a physiology matched to the environment, targeting resources that can be tapped, and outmanouvering any other organism that could get in your way, altogether defining growth presents a metric that integrates an organism’s response traits, and thus can be used to predict its performance and response to change. Simultanously, rates of growth capture the metabolism which is the engine that runs global biogeochemistry. As such, we can quantify an organism’s effect trait that can be used to estimate ecosystem fluxes of elements.

Using temperature as a case study, I will show how sensitive estimates of growth can be used to generate microbial community trait distributions that can be used to capture how microbial processes depend on temperature, and will respond to change (response traits). I will show how microbial thermal trait distributions vary along both latitudinal and altitudinal gradients in environmental temperatures, and how they respond to warming in field experiments, and how they respond to reciprocal transplant experiments from warm to cool sites, and vice versa. I will also show how microbial thermal trait distributions dynamically change over the course of a heatwave, revealing that it is the rate of community turnover (defined by several interacting environmental drivers including temperature and moisture) that determines its rate of change.

Finally, I will show how thermal traits determined with sensitive estimates of microbial growth can be accurately modelled with simple mathematical functions which enable integration into representations of the soil carbon cycle in Earth system models. I will demonstrate how this integration of microbial ecology via estimates of growth will allow us to capture long-term ecosystem changes in carbon stocks in warming soils, and can be upscaled to predict the biosphere’s feedback to ongoing climate change.

How to cite: Rousk, J.: Microbial growth is the key to predict biogeochemistry from ecology, EGU General Assembly 2025, Vienna, Austria, 27 Apr–2 May 2025, EGU25-5782, https://doi.org/10.5194/egusphere-egu25-5782, 2025.

EGU25-7158 | Posters on site | SSS4.5

Opportunistic fungi in urban soil and bottom sediments of largest polar city (Murmansk) 

Maria Korneykova and Anastasia Soshina

The relevance of studying Arctic regions is growing rapidly due to the sensitive response of fragile ecosystems under climate change and increasing anthropogenic pressures. Under the urbanization impact, there is a significant transformation of abiotic and biotic properties of ecosystems, which affects the ecosystem services provided and can lead to disservices such as the emergence and accumulation of microbial species hazardous to health, including microfungi. Pathogenic and opportunistic fungal species are becoming increasingly important with the growing recognition of chronic diseases and the number of patients with severe immunodeficiencies. However, studies of opportunistic microfungi in Arctic cities are sporadic. In this case, the opportunistic microfungi of Murmansk, the largest Arctic city in the world, was studied in comparison with a background area of natural forest tundra. Mycological analysis was carried out for different components of urban ecosystems: soil cover, atmospheric air, water and lake bottom sediments.

In urban soil and bottom sediments of urban lakes there was an increase in the diversity and number of opportunistic species of microfungi from 30% in background soil/lake to 50-60% in urban soil and 50-100% in bottom sediments of urban lakes. In the air and water, the content of species harmful to human health did not differ from the background level. This emphasizes the high indicative value of buffer components of ecosystems - soil and bottom sediments, as compared to transit components - air and water, in determining the level of long-term anthropogenic load on ecosystems. The most dangerous identified species were fungi Paecilomyces variotii, Aspergillus flavus and Aspergillus fumigatus, capable of causing pulmonary infections, otitis, sinusitis, endocarditis, osteomyelitis, keratitis, traumatic mycoses, peritonitis, onychomycosis. The fact of Paecilomyces variotii dominance in water and bottom sediments of lakes used for recreational purposes is alarming.

How to cite: Korneykova, M. and Soshina, A.: Opportunistic fungi in urban soil and bottom sediments of largest polar city (Murmansk), EGU General Assembly 2025, Vienna, Austria, 27 Apr–2 May 2025, EGU25-7158, https://doi.org/10.5194/egusphere-egu25-7158, 2025.

EGU25-7800 | Posters on site | SSS4.5

Microbial and Fungal Dynamics in Tropical Urban Environments and Their Impact on Soil Health and Nutrient Cycling 

Shu Harn Te, Kavindra Yohan Kuhatheva Senaratna, Simone Fatichi, and Karina Yew-Hoong Gin

Soil microbial communities, including bacteria and fungi, play a crucial role in nutrient cycling processes such as carbon sequestration, nitrogen transformation, and phosphate mobilization. Despite their importance, the dynamics of microbial communities in tropical soils remain poorly understood. This study investigates the composition, functional potential, and nutrient profiles of microbial communities across various land-use types, including forests, agricultural farms, parks, and golf courses. Soil samples were analyzed to assess microbial abundance, diversity, and nutrient content.

Bacterial abundances were significantly higher than fungal abundances across all soil types, with agricultural soils showing bacterial abundances that were one order of magnitude greater than those in other soil types. Fungal diversity was influenced by land use, with forest soils dominated by decomposers such as Basidiomycota and Ascomycota, which enhance organic matter turnover and contribute to soil carbon dynamics. In contrast, agricultural soils were enriched in Zygomycota, known for their roles in nutrient cycling and plant growth promotion under conditions of elevated nutrient availability.

Distinct clustering of bacterial communities was observed using principal coordinate analysis, with agricultural soils forming unique clusters separate from other soil types. Organic farming practices were found to support bacterial and fungal communities more similar to natural ecosystems compared to conventional farming. Agricultural soils exhibited higher nutrient levels and microbial biomass due to intensive fertilization, while the forest, park and golf course soils displayed variability in microbial diversity and nutrient content driven by vegetation maturity and management practices. Mature forest soils were characterized by signature taxa such as Gaiella (bacteria) and Trichoderma (fungi), indicative of healthy soil ecological conditions, while agricultural soils were dominated by Bacillus and Paenibacillus, associated with nutrient cycling and pathogen suppression.

These findings highlight the influence of land use and management practices on microbial and fungal community composition, functional potentials, and nutrient cycling. The implications are significant for understanding nutrient concentration in runoff and their impacts on water quality, particularly under climate change scenarios involving temperature increases and intensified rainfall and length of dry periods.

How to cite: Te, S. H., Senaratna, K. Y. K., Fatichi, S., and Gin, K. Y.-H.: Microbial and Fungal Dynamics in Tropical Urban Environments and Their Impact on Soil Health and Nutrient Cycling, EGU General Assembly 2025, Vienna, Austria, 27 Apr–2 May 2025, EGU25-7800, https://doi.org/10.5194/egusphere-egu25-7800, 2025.

EGU25-8110 | ECS | Orals | SSS4.5

Can we disentangle climate and microbial diversity effects on soil respiration in managed forests? 

Marleen Pallandt, Daniela Guasconi, Jūratė Aleinikovienė, Dorian Behling, Sara Filipek, Aleksi Lehtonen, Tijana Martinovic, Boris Ťupek, and Stefano Manzoni

Soils store large amounts of carbon (C), and even minor changes in C stocks can have profound impact on climate. Microorganisms play a critical role in regulating C stocks by processing soil organic matter (SOM), which forms and stabilises SOM but also releases greenhouse gases such as CO2 into the atmosphere. Despite their key role, microbial processes are generally not explicitly included in decomposition models to predict respiration rates and soil C turnover times. In these models, decomposition rates are only affected by environmental drivers, such as temperature, soil moisture, plant litter inputs and existing SOM content. In addition—and possibly interacting with the environmental drivers—it is theorized that increased microbial diversity would contribute to accelerating decomposition rates, but this relationship needs to be explored with empirical data.  We use data from the HoliSoils project (Holistic management practices, modelling, and monitoring for European forest soils; https://holisoils.eu/) collected from managed forest sites across Europe. In this dataset, microbial diversity data, micrometeorological data and soil respiration rates from trenched (providing estimates of microbial respiration) and untrenched plots (including autotrophic respiration) were collected following the same experimental design. First, we fit a non-linear model to capture the effects of temperature and soil moisture on respiration at these sites, allowing the fitting parameters to vary across forest management treatments. We then explore differences across sites and managements in the fitted model parameters such as activation energy, base respiration and moisture sensitivity in light of the different management practices and microbial diversity for each site. These results can be particularly useful for the development and parametrization of microbially explicit SOM decomposition models.

How to cite: Pallandt, M., Guasconi, D., Aleinikovienė, J., Behling, D., Filipek, S., Lehtonen, A., Martinovic, T., Ťupek, B., and Manzoni, S.: Can we disentangle climate and microbial diversity effects on soil respiration in managed forests?, EGU General Assembly 2025, Vienna, Austria, 27 Apr–2 May 2025, EGU25-8110, https://doi.org/10.5194/egusphere-egu25-8110, 2025.

EGU25-8692 | ECS | Posters on site | SSS4.5

Impact of Century-Scale Soil Warming on Soil Organic Matter Dynamics and Microbial Communities in a Subarctic Ecosystem 

Anne Peter, Jana Kehr, Damien Finn, Christopher Poeplau, and Christoph C. Tebbe

Soil organic matter (SOM) dynamics under long-term warming are critical to understanding how climate change may impact carbon cycling. This study investigates the effects of century scale soil warming on SOM dynamics and microbial communities in a subarctic deciduous forest near the Takhini Hot Springs in Yukon Territory, Canada. Utilizing a natural geothermal gradient, we examine changes in soil microbial community composition and functional potential as carbon use efficiency. Initial findings indicate that warming increases microbial decomposition of litter and native SOM, with significant substrate preference of plant-derived particulate organic matter to microbially-derived compounds, particularly in deeper soil layers. We hypothesize that warming enhances microbial activity, leading to increased decomposition and altered SOM composition. As a result, microbial communities adapt to relatively oligotrophic conditions, observable as an increase in traits associated with a high carbon use efficiency (CUE), like higher codon use bias, as it enhances translational efficiency and reduces metabolic costs. 


Our methodology incorporates the 18O-CUE method to measure microbial CUE by tracking microbial growth using 18O-labeled water under steady-state conditions. Incubation experiments will quantify CUE across different temperatures, testing the mechanisms of temperature adaptation in the soil microbial communities. Additionally, exoenzyme analysis, of enzymes involved in SOM decomposition, e.g. N-acetyl glucosaminidase, β-glucosidase, along the same temperature gradients will be performed to connect changes in soil properties to soil functions. To decouple the immediate effects of temperature on enzyme activity from the sustained impacts of long-term warming, we will use Arrhenius plots as a framework. 


This research will enhance our understanding of the link between SOM dynamics under climate change and microbial adaptation, providing a framework for predicting long-term ecological responses in subarctic ecosystems. The outcomes will inform broader ecological models and potential mitigation strategies for climate change impacts on soil health and carbon cycling.

How to cite: Peter, A., Kehr, J., Finn, D., Poeplau, C., and Tebbe, C. C.: Impact of Century-Scale Soil Warming on Soil Organic Matter Dynamics and Microbial Communities in a Subarctic Ecosystem, EGU General Assembly 2025, Vienna, Austria, 27 Apr–2 May 2025, EGU25-8692, https://doi.org/10.5194/egusphere-egu25-8692, 2025.

EGU25-8977 | ECS | Orals | SSS4.5

Effects of bioturbation on soil carbon and nutrient stocks: Insights from the American Prairie 

Jeppe Aagaard Kristensen, Katerina Georgiou, and Ellen Welti

Restoring functional ecosystems through rewilding has become a popular nature restoration strategy. The introduced keystone species are often large herbivores or carnivores due to their ability to shape ecosystem processes top-down. Much less focus has been given to restoring soil engineering, despite being a fundamental natural process in most ecosystems, not least in grasslands. I will present initial results from a field study of the role of bioturbation on soil carbon, nitrogen and phosphorous stocks in a large scale prairie restoration programme with bison reintroductions, the American Prairie in Central Montana, US. We show that, on average, the topsoil carbon stocks are almost doubled on prairie dog colonies in grazed prairie sites compared to grazed sites with no active prairie dog colonies. Further, we show that nearby sites without bovids for at least a century have substantially reduced carbon stocks, despite having higher clay content. This is driven by severely decreased soil bulk density, which we suspect may be partly due to high abundances of ground-dwelling spiders known to be sensitive to trampling. We show how important soil-dwelling animals can be for shaping the carbon and nutrient landscapes of the Great Plains. This belowground perspective deepens our understanding of what a fully functional prairie ecosystem looks like and should be considered in future restoration efforts.   

How to cite: Kristensen, J. A., Georgiou, K., and Welti, E.: Effects of bioturbation on soil carbon and nutrient stocks: Insights from the American Prairie, EGU General Assembly 2025, Vienna, Austria, 27 Apr–2 May 2025, EGU25-8977, https://doi.org/10.5194/egusphere-egu25-8977, 2025.

EGU25-9423 | ECS | Orals | SSS4.5

Combined effects of drought and forest thinning on soil microbial community composition and functioning 

Steven de Goede, Emilia Hannula, Daniëlle de Hoog, Wim van der Putten, Frank Sterck, and Ciska Veen

Aim: Summer droughts are increasing in frequency and severity in Europe with detrimental effects on forests. Reducing the number of trees per area through thinning has been found to improve tree performance during and after drought, but little is known about what happens to the soil. Here, we studied the effects of intense summer drought on soil microbial communities and their functioning, and whether thinning can alter their responses to drought. Methods: We simulated a summer drought using rain-out shelters within a replicated block design of different thinning intensities in Dutch Pinus sylvestris stands. Soil samples were collected before, during and after drought to track changes in fungal community composition, total and ectomycorrhizal fungal biomass, and extracellular enzymatic activities. Throughout the growing season, soil respiration was regularly measured and litter bags were sequentially harvested to monitor decomposition rates. Results: Generally, effects of thinning were larger than those of drought, and drought responses did not differ between harvest intensities. Fungal biomass was not affected by drought, but was lower for heavy thinning and clearcutting compared to unharvested control and light thinning. Respiration and decomposition rates were slower for heavy thinning and clearcutting, and drought also lowered process rates overall. Moreover, soil respiration was still affected by drought after a few months of recovery, as was decomposition of litter incubated over the entire growing season. We will further explore how the fungal community composition responded to drought, honing in on differences between ectomycorrhizal and saprotrophic fungi. Conclusions: We found no evidence that light thinning mitigates the short-term impact of summer drought on soil microbial communities in Pinus sylvestris forests. 

How to cite: de Goede, S., Hannula, E., de Hoog, D., van der Putten, W., Sterck, F., and Veen, C.: Combined effects of drought and forest thinning on soil microbial community composition and functioning, EGU General Assembly 2025, Vienna, Austria, 27 Apr–2 May 2025, EGU25-9423, https://doi.org/10.5194/egusphere-egu25-9423, 2025.

EGU25-9458 | ECS | Orals | SSS4.5 | Highlight

Intrinsic and extrinsic controls on the decomposition of fungal necromass 

François Maillard, Briana Beatty, Danny Lopes Ramos, Fredrik Klinghammer, Edith Hammer, Anders Tunlid, and Peter Kennedy

Soil organic matter represents the largest active reservoir of organic carbon in terrestrial ecosystems, playing a critical role in atmospheric carbon capture and climate change mitigation. Recent studies have demonstrated that mycelial residues, also known as fungal necromass, contribute significantly to fungal necromass stocks in soils. While the magnitude and distribution of fungal necromass stocks are increasingly well documented, the processes driving their formation remain poorly understood. Specifically, the transformation of recently senesced mycelial residues into stabilized soil organic matter during the early stages of decomposition is not fully elucidated. These residues form an ephemeral resource patch of energy and nutrients for soil microbial decomposers, with the unique aspect that the microorganisms responsible for producing them also serve as their primary decomposers, contrasting with the decay of plant residues. Thus, new concepts, theories, and approaches are needed to understand fungal necromass decomposition. Here, we assess the intrinsic drivers of necromass decay by evaluating how the physiological status of fungi at the time of death influences decomposition processes, and explore extrinsic drivers by characterizing the biodiversity and functional traits of microbial decomposer communities—including fungi and protists. Our goal is to develop a refined conceptual and research framework for microbial residue decomposition and promote the integration of these processes into soil biogeochemical models.

How to cite: Maillard, F., Beatty, B., Lopes Ramos, D., Klinghammer, F., Hammer, E., Tunlid, A., and Kennedy, P.: Intrinsic and extrinsic controls on the decomposition of fungal necromass, EGU General Assembly 2025, Vienna, Austria, 27 Apr–2 May 2025, EGU25-9458, https://doi.org/10.5194/egusphere-egu25-9458, 2025.

EGU25-10089 | ECS | Orals | SSS4.5

Seasonality drives arbuscular mycorrhizal (AM) fungal community responses while future climate alters AM fungi-mediated phosphorus uptake in plant functional groups 

Meike Katharina Heuck, Thomas Reitz, Christiane Rioscher, Jeff R. Powell, Christina Birnbaum, Jarrod Kath, Lena Philipp, Regina Stoltenburg, Petra Hoffmann, W. Stanley Harpole, and Adam Frew

Arbuscular mycorrhizal (AM) fungi form symbiosis with most terrestrial plants, facilitating nutrient and water uptake while contributing to ecosystem services such as nutrient cycling, soil carbon sequestration, and plant resilience to abiotic stressors. As such, these fungi hold significant potential in advancing climate-change-resilient agriculture. However, their effectiveness in supporting agricultural resilience depends on their own responses to global change, which remain poorly understood due to species-specific and context-dependent variability across agricultural systems and climate scenarios.

To address this knowledge gap, we investigated AM fungal community responses at the Global Change Experimental Facility (GCEF) in Bad Lauchstädt, Germany. Established in 2014, the experiment consists of 5 blocks assigned to ambient climate and 5 to a future climate scenario, simulating the expected climate in Central Germany for 2070-2100, based on the consensus of several climate models. The future climate scenario simulates changes in temperature and precipitation patterns. Within each block, we focused on two distinct land-use types, extensive mowing or grazing, typically used for supporting livestock production. The meadows were mown or grazed one to three times annually, depending on plant biomass production. AM fungal community data from 160 soil samples, collected across eight time points spanning two years (mid-2020 to mid-2022) and differentiated by the two land-use types, were analysed using DNA metabarcoding. Additionally, plant biomass and nutrient concentrations were assessed.

Hierarchical Modelling of Species Communities (HMSC) revealed that, across land-use types and climate scenarios, seasonality was the dominant driver of AM fungal variance in the abundance and occurrence model. Plant growing season spring was the primary influence on AM fungal responses, particularly regarding alpha indices and phylogeny. In addition, Glomeraceae abundance increased in spring (p: 0.043), potentially highlighting its role in providing fast nutrient supply for host plants. However, future climate scenarios dampened these seasonal patterns, particularly in mowed systems, suggesting a shift in the dynamics of AM symbiosis. Additionally, we observed plant functional group-specific effects: under future climate, phosphorus uptake by grasses (p: 0.11) and forbs (p: 0.027) correlated with AM fungal phylogenetic clustering, while legumes exhibited an opposite pattern, with phosphorus uptake correlating with phylogenetic dispersion (p: 0.021). We speculate that this might be due to the dual symbiosis of legumes with AM fungi and nitrogen-fixing bacteria. Thus, these findings contribute to providing insight into the functional roles of AM fungal communities under future climate and suggest that considering plant functional group composition may become more critical for managing these systems in the future.

How to cite: Heuck, M. K., Reitz, T., Rioscher, C., Powell, J. R., Birnbaum, C., Kath, J., Philipp, L., Stoltenburg, R., Hoffmann, P., Harpole, W. S., and Frew, A.: Seasonality drives arbuscular mycorrhizal (AM) fungal community responses while future climate alters AM fungi-mediated phosphorus uptake in plant functional groups, EGU General Assembly 2025, Vienna, Austria, 27 Apr–2 May 2025, EGU25-10089, https://doi.org/10.5194/egusphere-egu25-10089, 2025.

EGU25-12164 | ECS | Posters on site | SSS4.5

Identification and quantification of extracellular polysaccharide biomarkers across soil organisms and plants 

Tao Li, Yuhua Li, Logan H. Hodgskiss, Erika Salas, Ke Shi, and Wolfgang Wanek

Soil extracellular polysaccharides (EPSac) are essential biopolymers in terrestrial ecosystems, playing key roles in soil aggregation, water retention, nutrient cycling, and carbon sequestration. These polysaccharides are produced by a wide range of organisms, including archaea, bacteria, fungi, plants, and soil fauna. However, their complex composition and low yet largely unknown abundance in environmental samples present significant challenges for their identification and quantification. In this study, we will culture and collect EPSac samples from various organisms (archaea, bacteria, fungi, algae, higher plants, and soil fauna) across different phyla. The extraction methods will be tailored to the specific sample types, such as cation exchange resin extraction for microbial cells and water extraction for plant roots and soil fauna. Dissolved extracellular polysaccharides will be separated from soil metabolites by ultrafiltration or precipitation before biochemical analysis. Plant samples will be cultivated hydroponically from seeds to minimize soil and microbial contamination of fine roots. To identify and quantify the monomeric composition of the polymers, we will employ an optimized acid hydrolysis method in combination with 1-phenyl-3-methyl-5-pyrazolone (PMP) derivatization, followed by analysis using ultra-high-performance liquid chromatography with high-resolution Orbitrap mass spectrometry (UPLC-Orbitrap MS). EPSac-specific monomers will be seeked for that do not occur in other known cell wall-based and/or storage polysaccharides of prokaryotes and eukaryotes. Multivariate analysis, such as non-metric multidimensional scaling (NMDS) and partial least squares discriminant analysis (PLS-DA), will be utilized to assess the variability of EPSac compounds across different taxonomic groups. Additionally, Indicator species analysis will be performed to evaluate the biomarker potential of these compounds. Finally, these biomarkers will be applied to various soil types (cropland, grassland, and forest soils) to assess their contributions to microbial metabolic and soil carbon cycling. This study aims to identify EPSac-specific and organism-specific biomarkers and precisely quantify these key EPSac monomers, advancing our understanding of soil biogeochemical processes and their role in ecosystem functioning and nutrient dynamics.

How to cite: Li, T., Li, Y., Hodgskiss, L. H., Salas, E., Shi, K., and Wanek, W.: Identification and quantification of extracellular polysaccharide biomarkers across soil organisms and plants, EGU General Assembly 2025, Vienna, Austria, 27 Apr–2 May 2025, EGU25-12164, https://doi.org/10.5194/egusphere-egu25-12164, 2025.

EGU25-12266 | ECS | Posters on site | SSS4.5

Development of a high-throughput method for investigating carbon allocation in microbial pure cultures 

Yuhua Li, Tao Li, and Wolfgang Wanek

Since the discovery of microbes, microbial carbon metabolism has been a central research focus, with significant progress in understanding their metabolic pathways under different carbon sources. However, most studies have primarily examined metabolic mechanisms and gene regulation, while how microbes allocate absorbed carbon to growth, respiration, and extracellular metabolism has rarely been quantified in its entirety. There is strongly rising interest in understanding and modeling soil microbial carbon use efficiency (CUE), but results are currently only based on data of growth and respiration, not accounting for extracellular product formation and total substrate uptake. This therefore potentially ignores a large fraction of stress- and resource-limited (extra)cellular metabolism. This gap limits a comprehensive understanding of microbial carbon allocation and its environmental adaptability, highlighting the need for innovative approaches to address this critical aspect.

To this end, we are currently developing high throughput methodology to measure growth, respiration, and the excretion of extracellular enzymes (EE), extracellular polysaccharides (EPs) and extracellular metabolites (EM) in Bacillus subtilis, Escherichia coli and Saccharomyces cerevisiae cultures. In response to carbon concentration, carbon: nutrient stoichiometry, temperature, and oxygen stress, we will assess microbial carbon allocation of three representative microbial species. For this regard, substrate uptake, growth, respiration, extracellular protein and extracellular polysaccharide production will be quantified in a microtiter plate format assay. The growth use efficiency of Bacillus subtilis cultured at 28°C with 0.4% glucose was determined to range between 20% and 30% with this assay. This study addresses a major gap in microbial carbon allocation research, revealing how environmental factors influence anabolic and catabolic transitions, and affect intracellular and extracellular metabolism, and providing important insights into microbial adaptation and ecological roles.

How to cite: Li, Y., Li, T., and Wanek, W.: Development of a high-throughput method for investigating carbon allocation in microbial pure cultures, EGU General Assembly 2025, Vienna, Austria, 27 Apr–2 May 2025, EGU25-12266, https://doi.org/10.5194/egusphere-egu25-12266, 2025.

EGU25-12446 | ECS | Orals | SSS4.5

The Interplay of physical and community complexity in soil systems 

Carlos Arellano

Data obtained in pure cultures of the different microbial groups offers a wide range of information of each specific strain, yet how many of those patterns are present in natural environments remains unclear. On the other hand, measurements of soil functions in field or laboratory settings are packed with unhandled parameters that are likely to explain most of the unexplained variation encountered. There is hence the need for approaches that handle at the same time the control and resolution permitted in pure culture settings but with the parameters present in natural microbiomes at the relevant scale. With the use of microfluidics, fluorescence microscopy, and genomic tools, we explored two examples of the implications of soil characteristics on bacterial interactions in pairwise and in community level.

We tested how does the interaction between the two mutually exclusive soil bacterial strains Pseudomonas putida and Bacillus subtilis, holds in microenvironments of various levels of complexity. In low-complexity environments both species showed lower growth than when growing by themselves, which differed from a well-mixed liquid environment where Pseudomonas putida outperformed and inhibited Bacillus subtilis. Fragmented mazes, however, allowed not only the coexistence of both strains, but in the right frequencies permitted them to reach higher yields than when growing separately, thus turning competition into collaboration. Spatial analysis of the space within the mazes indicates that complex mazes allowed colocalization and that the level of such colocalization was linked to the yield of both strains.

Extrapolating patterns from pairwise studies to entire communities can be challenging yet necessary. What we intended in the next set of experiments was to evaluate how does community function depends on its diversity and how these two are linked to spatial characteristics of the microenvironment. A natural soil inoculum was subjected to a series of dilutions to obtain an array of inoculums with decreasing levels of diversity. Each community was then incubated within microenvironments with different levels of complexity where their capacity for substrate enzymatic degradation was measured. We expected variance between replicates of each maze to increase in inoculums of lower levels of diversity, as the founder effect would become more important than in robust entire communities. We found, however, that the enzymatic degradation of the inoculum decreased below detection limits after the third dilution (0.01X). Also, enzymatic degradation of the entire community and the 0.1-fold dilutions depended on the maze type but was consistent in the trend of higher complexity leading to higher degradation. Metagenomic quantification revealed that diluting the initial inoculum effectively reduced the diversity of it and its composition resembled more the one from the last day of incubation experiments. Hence it is apparent that the most abundant bacteria are not the ones responsible for the evaluated function, which complement recent findings which show that high abundant taxa grow slower than low abundant ones by adding that low abundance and fast grower taxa might be the drivers of the entire soil functions.

How to cite: Arellano, C.: The Interplay of physical and community complexity in soil systems, EGU General Assembly 2025, Vienna, Austria, 27 Apr–2 May 2025, EGU25-12446, https://doi.org/10.5194/egusphere-egu25-12446, 2025.

EGU25-14984 | Orals | SSS4.5

Scaling the impact of microbial ecophysiology on ecosystem-level decomposition rates under drought 

Ashish Malik, Brian Chung, Yingyi Fu, Nicholas Bouskill, and Steven Allison

Quantifying the influence of drought on microbial processes in soil and its consequences for carbon cycling is hindered by the lack of underlying mechanistic understanding. Drought affects soil microbes directly by causing physiological stress but also affects indirectly by influencing substrate transport and diffusion. Another indirect effect is through changes in plant litter chemistry which impacts microbial resource acquisition strategies. Here we present a theoretical framework to study the effects of drought as well as the ecosystem feedbacks that are generated due to the complex interactions of above-ground and below-ground processes. We classify microbial life history strategies into high yield (Y), resource acquisition (A) and stress tolerance (S), or Y-A-S along two main axes of environmental variation: resources and abiotic stress. We propose the use of this framework that incorporates trait-based ecology to link drought-impacted microbial processes to rates of soil carbon decomposition and stabilisation. We also present empirical evidence in plant litter microbial communities from a decade-long precipitation manipulation experiment in the field in Mediterranean grass and shrub ecosystems in Southern California. Using metagenome-assembled genomes (MAGs), we demonstrate trade-offs in stress tolerance and resource acquisition traits in bacterial populations in grass litter which arise due to selection of certain taxa by drought as the environmental filter. Through taxonomic and MAGs analyses across four time points over 18 months, we observed the dominance of fungi at the start of the litter decomposition process. These fungal pioneers by secreting extracellular enzymes likely enable the survival of drought tolerating bacteria with reduced decomposition capabilities. The indirect effect of drought on plant litter chemistry was examined by FTIR analysis of litter linked to microbial Carbohydrate-Active Enzyme (CAZyme) gene abundance for different substrates which shows subtle shifts in plant litter chemistry and associated changes in microbial resource acquisition traits that were linked to community succession during the decomposition process. We also observed signatures of recycling of fungal and bacterial necromass. Litter decomposition rates measured as mass loss using litter bags were unaffected by drought in shrub ecosystems but showed trends of reduction in grass ecosystems. The integrated knowledge from these studies demonstrates the various mechanisms by which microbial ecophysiology influences decomposition rates under drought and highlights the need for such scaling up of microbial response to climate change factors from individual soil microbes to collective communities to ecosystems.

How to cite: Malik, A., Chung, B., Fu, Y., Bouskill, N., and Allison, S.: Scaling the impact of microbial ecophysiology on ecosystem-level decomposition rates under drought, EGU General Assembly 2025, Vienna, Austria, 27 Apr–2 May 2025, EGU25-14984, https://doi.org/10.5194/egusphere-egu25-14984, 2025.

EGU25-15244 | ECS | Posters on site | SSS4.5

Impact of experimental soil warming, snow addition, and grazing on soil microbial community diversity and functional potential in Tibetan Kobresia grasslands 

Caro Urbina Malo, Philipp Maurischat, Qing-Fang Bi, Sten Anslan, Julia Klein, Tsechoe Dorji, and Georg Guggenberger

Temperature on the Tibetan Plateau (TP) is rising at a rate higher than the global average, and the frequency of extreme climate events is predicted to increase, making the TP a region of critical importance for understanding the consequences of climate change on ecosystems and its feedbacks. The TP hosts the largest alpine pastoral ecosystem in the world: the Kobresia grasslands, dominated by the sedge species Kobresia pygmaea. These ecosystems store most of the terrestrial carbon (C) on the plateau, primarily in the felty root mat. With continuous warming, the carbon captured by Kobresia grasslands may become increasingly vulnerable to decomposition. Our study, therefore, focuses on the soil microbial community’s response to long-term exposure to warming, grazing, and snow addition in a Tibetan alpine pasture, thus reflecting major environmental changes.

We conducted our study at the Nam Co Observation and Research Station for Multisphere, CAS. The fully factorial experiment includes a combination of treatments: warming using open-top chambers, grazing by yaks three times a year (June, July, and August), and spring snow addition using snow cakes measuring 1 m in diameter and 0.5 m in height. Bulk and rhizosphere soil samples were collected for bacterial (16S rRNA) and fungal (ITS1 rRNA) sequencing. Functional genes involved in the carbon (C), nitrogen (N), phosphorus (P), and sulfur (S) cycles were quantified using the high-throughput quantitative-PCR-based Quantitative Microbial Elemental Cycling chip.

Results showed no significant effects of the treatments on microbial fungal or bacterial diversity, community composition, structure, or functional potential for bulk soils. Rhizosphere soils exhibited higher bacterial diversity from plots with warming + grazing treatment. Furthermore, the abundance of genes related to microbial functional potential for C and P degradation was significantly higher in rhizosphere soil than in the bulk soil. Samples from the plots subjected to both warming and grazing treatments showed a higher relative abundance of predominant genes. These findings suggest that the synergistic effects of warming and grazing significantly enhance rhizosphere microbial diversity and functional potential compared to individual treatments, highlighting the complex interactive effects of environmental factors on soil microbial communities.

How to cite: Urbina Malo, C., Maurischat, P., Bi, Q.-F., Anslan, S., Klein, J., Dorji, T., and Guggenberger, G.: Impact of experimental soil warming, snow addition, and grazing on soil microbial community diversity and functional potential in Tibetan Kobresia grasslands, EGU General Assembly 2025, Vienna, Austria, 27 Apr–2 May 2025, EGU25-15244, https://doi.org/10.5194/egusphere-egu25-15244, 2025.

EGU25-15464 | ECS | Orals | SSS4.5

And yet they move: microbial movement in soil habitats 

Kyle Mason-Jones, Steffen Schluter, Ksenia Guseva, Clementine Chirol, Lionel Dupuy, Amandine Erktan, Jie Hu, Ilonka Engelhardt, Hanbang Zou, Samuel Bickel, Jing-Zhong Lu, Jennifer Pett-Ridge, Wilfred Otten, Hannes Schmidt, Naoise Nunan, Edith Hammer, Philippe Baveye, Tessa Camenzind, and Lukas Y. Wick

Movement of organisms plays a crucial role in microbial ecology, yet little is known about how, when and at what speeds soil microorganisms move. Literature offers conflicting lines of evidence, even regarding whether single-celled organisms can move at all under typical soil conditions. We review the literature on microbial movement in the context of soil physicochemical complexity, to establish its likelihood and its prerequisite conditions. Our focus is on movement at the spatial and temporal scales relevant for microbiota (µm to cm, seconds to days), with particular attention to bacteria and fungi. We synthesize experimental data for bacteria to show that unicellular movement can occur in moderately moist soils, although it is suppressed under dry conditions. By integrating current knowledge of microbial physiology and soil physics, we propose underlying mechanisms that may overcome the challenging conditions of soil, including non-flagellar surface movements (pili, in particular) and the role of biosurfactants. Our energetic analysis also shows that movement is possible, even under moderately oligotrophic conditions. Movement modes are entirely different for filamentous microorganisms like fungi, however, which are not restricted by water connectivity, grow much slower than prokaryotic movement, and must contend with the great tortuosity of the soil habitat. However, once a fungal network is established, cytoplasmic streaming can translocate resources and even the entire fungal cytoplasm at speeds comparable to bacteria (5 µm/s). Fungal hyphae also provide physical connections and favorable conditions to support prokaryotic movement along their surfaces. Hitchhiking, in which one organism is transported by the movement and energy of another, is also likely to be important in soil. A diverse array of movement possibilities emerges from our analysis, suggesting that soil microorganisms may be much more mobile than often appreciated. These also indicate substantial implications of movement for the ecology and ecological functions of soil microbiota. However, many key unknowns remain to be addressed and hypotheses experimentally tested, and we propose an ambitious roadmap to a comprehensive understanding of microbial movement in soil, and its relevance for biogeochemical cycling.

How to cite: Mason-Jones, K., Schluter, S., Guseva, K., Chirol, C., Dupuy, L., Erktan, A., Hu, J., Engelhardt, I., Zou, H., Bickel, S., Lu, J.-Z., Pett-Ridge, J., Otten, W., Schmidt, H., Nunan, N., Hammer, E., Baveye, P., Camenzind, T., and Wick, L. Y.: And yet they move: microbial movement in soil habitats, EGU General Assembly 2025, Vienna, Austria, 27 Apr–2 May 2025, EGU25-15464, https://doi.org/10.5194/egusphere-egu25-15464, 2025.

EGU25-16195 | Posters on site | SSS4.5

MICOL-FUNTRANS: Exploring Fungal Hyphae-Mediated Transport in soil colonization 

Christoph Keuschnig, Ramyani Biswas, Marco Amjar, Helen Feord, Pamela E. Rossel, Chiara Bahl, and Liane G. Benning

Soil is Earth's most biodiverse habitat, harboring unparalleled microbial densities and diversities. These conditions have driven the evolution of diverse microbial interactions, ranging from synergistic to antagonistic. However, studying these interactions is challenging due to the opaque nature of soil and the microscopic scale at which they occur. Understanding these processes is critical for advancing knowledge of ecosystem functions and soil biology.

Fungal hyphae-mediated transport (FHMT) of bacteria is a pivotal yet underexplored mechanism that enables bacterial translocation across nutrient-depleted regions, facilitating microbial movement and interactions within soil. The MICOL-FUNTRANS project investigates the microbial ecology of FHMT as a driving force in soil colonization and structure formation.

To study FHMT-driven belowground soil colonization, specialized soil columns were developed for field use. These columns, designed to either allow fungal hyphae colonization or exclude it, were filled with uncolonized sediment from glacier margins and buried in topsoil along chronosequences in glacier forefields. Field sites include Greenland (Lyngmarksbræen, Disko Island), Iceland (Langjökull), and Austria (Klein Fleiß Kees). After one year, the columns will be harvested to analyze the colonizing microbial communities under field conditions.

In parallel, laboratory microcosms were designed to simulate FHMT processes under controlled conditions. Sterile quartz sand was colonized by source soils from glacier forefields, allowing us to quantify bacterial colonization rates and identify key microbial players involved in targeted translocation processes.

This project provides the first comprehensive insights into FHMT-driven bacterial colonization in field conditions, underscoring its ecological significance and advancing our understanding of soil microbial dynamics.

How to cite: Keuschnig, C., Biswas, R., Amjar, M., Feord, H., Rossel, P. E., Bahl, C., and Benning, L. G.: MICOL-FUNTRANS: Exploring Fungal Hyphae-Mediated Transport in soil colonization, EGU General Assembly 2025, Vienna, Austria, 27 Apr–2 May 2025, EGU25-16195, https://doi.org/10.5194/egusphere-egu25-16195, 2025.

EGU25-17468 | Posters on site | SSS4.5

Growth and metabolism of interacting ectomycorrhizal and saprotrophic fungi: effects on mycelial to hyphal scale 

Milda Pucetaite, Naomi Sara Beckman, Yitsully Geraldine Gonzalez Oliveros, Martí Pla-Ferriol, and Kristin Aleklett Kadish

Functions and productivity of fungal communities in soil are affected by interspecies interactions and competition for resources, which, in turn, affects biogeochemical cycles and fluxes of CO2 from soil. Specifically, saprotrophic and ectomycorrhizal (ECM) fungi compete for limiting nutrients with great effects on overall decomposition rates. Macroscale observations are inconsistent: decomposition can be suppressed (‘Gadgil effect’), typically, in nutrient poor ECM dominated forests, or exacerbated (‘priming’) by ECM fungi foraging for nitrogen in organic matter or introducing labile carbon to soil. Gaining deeper insight into the mechanisms affecting mycelial and hyphal scale processes among the competing fungi could increase understanding of the reasons for these inconsistencies and better predict the direction of overall decomposition rates.

We investigated changes in growth and anabolic metabolism of an ECM fungus (Suillus luteus) interacting with a saprotrophic fungus (Gymnopus confluens) cultured in different concentrations and types of carbon and nitrogen sources on agar plates and inside microfluidic soil chips. The metabolism analysis was performed using stable-isotope labelling (SIP) combined with Raman microspectroscopy in the chips. At the mycelium scale, S. luteus grown in co-culture plates formed denser mycelium and demonstrated increased competitiveness under changing nitrogen concentrations. G. confluens increased its elongation rates and dominated under changing carbon conditions. Supplied with equal amounts of glucose and complex carbon (carboxymethylcellulose, CMC), G. confluens facilitated the growth of S. luteus, which exhibited increased density and elongation rates in co-cultures. Microstructures of the soil chips further affected the growth of S. luteus: while its growth rates in terms of elongation were typically smaller in agar plates, they increased and surpassed those of G. confluens in the chips in all nutrient treatments. This demonstrates the impact of both the nutritional and the physical environment on the outcome of fungal interactions. Furthermore, similar as in the agar plates, C. confluens facilitated growth of S. luteus in chips supplied with both glucose and CMC. To investigate this further, we are setting up an experiment, where deuterium labelled glucose source (glucose-d7) is used and traced as it is incorporated into the fungal hyphae growing in the chips using Raman microspectroscopy. Enrichment of fungal biomass with deuterium is detected via appearance of C-D functional group related spectral bands in the Raman spectra. We expect that this will allow us to determine whether the presence of CMC decreases competitiveness of G. confluens vs S. luetus as it directs its metabolism towards CMC degradation, and whether the carbon released in the process is uptaken by S. luteus as well.

How to cite: Pucetaite, M., Sara Beckman, N., Gonzalez Oliveros, Y. G., Pla-Ferriol, M., and Aleklett Kadish, K.: Growth and metabolism of interacting ectomycorrhizal and saprotrophic fungi: effects on mycelial to hyphal scale, EGU General Assembly 2025, Vienna, Austria, 27 Apr–2 May 2025, EGU25-17468, https://doi.org/10.5194/egusphere-egu25-17468, 2025.

Climate warming can stimulate soil microbial degradation of organic matter, leading to increases in both microbial growth and CO₂ release into the atmosphere. If microbial growth or respiration outpaces the other in response to warming, it can alter the carbon-use efficiency, potentially leading to either increased carbon storage or release. Understanding the temperature-adaptive responses of soil decomposer microbes is thus essential, as they may significantly influence the balance of C between soil and atmosphere. In this study, we used a “space-for-time” substitution to test the impact of environmental temperature change on microbial carbon cycling in soils from a tropical elevation gradient in Chirripó, Costa Rica, using an in situ reciprocal 7-month transplant experiment to low and high elevation. We hypothesized (H1) that the transplantation of samples will shift microbial thermal traits. Specifically, we expected cold transplants to shift the traits of microbes from warm soils toward cool-adapted traits, while warm transplants would shift the traits of microbes from cold soils toward warm-adapted traits. Additionally, warming accelerates microbial use of organic matter (OM), depleting high-quality soil carbon, while cooling slows it, preserving carbon quality. This shift in carbon quality should increase microbial growth in warm soils under cold conditions and decrease growth in cold soils under warm conditions at a standard temperature (H2).  Furthermore, based on the carbon-quality temperature (CQT) hypothesis we expected that the cold transplant will reduce temperature sensitivity (Q10) for microbes from warmer soils, while the warm transplant would increase Q10 for microbes from colder soils (H3).

To estimate microbial thermal traits, microbial growth (bacterial growth and fungal growth) and respiration were estimated at 10 different temperature conditions (0, 5, 10, 15, 20, 25, 30, 35, 40 and 45 °C). We found a significant cool-shift in microbial growth thermal traits after the cold transplant and warm-shifted thermal traits after the warm transplant. These changes led to a marked shift in thermal traits along the elevation gradient, indicating a strong legacy effect of ecosystem differences in temperature and a relatively minor influence of the 7-month transplant experiment. However, the warm transplant had a pronounced influence, driving the microbial growth traits of all samples closer to those of microbes with a warm-ecosystem origin. For respiration thermal traits, the transplant experiment did not alter thermal traits but did affect the respiration rate. The cold transplant reduced microbial respiration in soils with a history of warm temperatures, whereas the warm transplant increased respiration in soils with a history of colder temperatures. We did not find a significant effect of the transplants on bacterial growth and fungal growth rates, but total microbial growth rates tended to increase with MAT.  In support of the CQT hypothesis, we observed a decrease in Q10 for bacterial growth following the cold transplant in soils with a history of warmer temperature, and a strong increase in Q10 for both bacterial growth and respiration.

How to cite: Dumontel, H. and Rousk, J.:  Using tropical heat to investigate adaptive responses of microbial thermal traits and carbon cycling in an in situ translocation experiment  , EGU General Assembly 2025, Vienna, Austria, 27 Apr–2 May 2025, EGU25-19426, https://doi.org/10.5194/egusphere-egu25-19426, 2025.

EGU25-19512 | Orals | SSS4.5

The methane-cycling microbiome in intact and degraded permafrost soils of the pan-Arctic 

Haitao Wang, Erik Lindemann, Patrick Liebmann, Milan Varsadiya, Mette Svenning, Muhammad Waqas, Sebastian Petters, Andreas Richter, Georg Guggenberger, Jiri Barta, and Tim Urich

The methane-cycling microbiomes in Arctic permafrost-affected soils play crucial roles in the production and consumption of this important greenhouse gas. However, little is known about the distributions of Arctic methanogens and methanotrophs across the regional scale and along the vertical soil profile, as well as their responses to the widespread permafrost thaw. Using a unique sample set from nine different locations across the pan-Arctic, we identified methanogen and methanotroph phylotypes in 729 datasets of 16S rRNA gene amplicons.

In 621 samples of intact permafrost soils across the pan-Arctic, only 22 methanogen and 26 methanotroph phylotypes were identified. Relative abundances of both functional groups varied significantly between sites and soil horizons. Only four methanogen phylotypes were detected at all locations, with the hydrogenotrophic Methanobacterium lacus dominating. Remarkably, the permafrost soil methane filter was almost exclusively comprised of a few phylotypes closely related to the obligate methanotrophic species Methylobacter tundripaludum.

In degraded permafrost sites in Alaska, M. tundripaludum also dominated the methanotroph microbiome in the wet site. However, in dry, water-drained former permafrost site, Methylocapsa phylotypes, closely related with the atmospheric methane oxidizing bacteria, were exclusively found and dominant, indicating a massive restructuring of the methanotroph guild that consequently resulted in functional changes from a soil methane filter to an atmospheric methane sink.  

This study provides first insights into the identity and intricate spatial distribution of methanotrophs and methanogens in permafrost soils at a pan-Arctic scale and their responses to different water status after permafrost degradation. These findings point towards a few key microbes particularly relevant for future studies on Arctic CH4 dynamics in a warming climate and that under future dry conditions more atmospheric CH4 uptake in Arctic upland soils might happen.

How to cite: Wang, H., Lindemann, E., Liebmann, P., Varsadiya, M., Svenning, M., Waqas, M., Petters, S., Richter, A., Guggenberger, G., Barta, J., and Urich, T.: The methane-cycling microbiome in intact and degraded permafrost soils of the pan-Arctic, EGU General Assembly 2025, Vienna, Austria, 27 Apr–2 May 2025, EGU25-19512, https://doi.org/10.5194/egusphere-egu25-19512, 2025.

EGU25-21632 | ECS | Posters on site | SSS4.5

Elevated mass-specific soil microbial growth rates and no sign of thermal acclimation at a long-term warming gradient 

Thayer Taft, Sean R. Darcy, Ksenia Guseva, Kian Jenab, Cornelia Rottensteiner, Stefan Gorka, Lucia Fuchslueger, Christian Ranits, Alberto Canarini, Bjarni D. Sigurdsson, Andreas Richter, and Christina Kaiser

Warming increases soil microbial respiration which leads to significant soil C loss. However, it has been shown that the initial increase in soil respiration tends to level off in the long term, sometimes even returning to pre-warming levels. Two main hypotheses explain this short-lived thermal respiration increase: (i) The concentration of C substrate in soils declines due to increased microbial activity, becoming a limiting factor and leading to reduced overall respiration, or (ii) Microbial physiology adjusts to higher temperatures to improve fitness under new environmental conditions. The latter concept of a physiological thermal acclimation predicts that microbes in soils exposed to long-term warming will exhibit lower mass-specific growth and respiration rates at a given temperature compared to those at ambient levels.  The main objective of this study was to separate the roles of microbial acclimation and substrate limitation in reducing the response of soil respiration to long-term warming. 

We examined the microbial respiration and growth rates along long-term (>50 years) geothermal warming gradients in Iceland (ForHOT experiment). Soils collected at multiple temperature steps between ambient temperature and +15 °C field warming were incubated in the laboratory at their respective field temperatures. In addition, soils collected from the ambient sites were incubated the same temperatures as the field-warmed soils. Soils were labelled with deuterium-enriched water during incubation, followed by extraction of phospholipid fatty acids (PLFAs). Analyzing the 2H incorporation into PLFAs by Gas Chromatography coupled to isotope ratio mass spectrometry (GC-IRMS) allowed us to estimate group-specific microbial growth rates.

When incubated at the same temperatures, soils exposed to long-term warming exhibited lower overall respiration rates (per gram of soil) compared to ambient soils. However, the respiration rate per unit of microbial biomass remained comparable between warmed and ambient. This suggests that the reduction in total respiration is likely due to carbon depletion and a subsequent decrease in overall microbial biomass, rather than a thermal acclimation. Interestingly, at long-term warmed field sites, mass-specific growth rates were considerably higher than those observed in ambient soils subjected to short-term warming at the same temperature. This finding also contradicts the thermal acclimation hypothesis, indicating that prolonged warming does not diminish the temperature response of microbial activity. Instead, our results demonstrate that – on a per unit of microbial biomass basis – long-term microbial temperature response is even more pronounced compared to immediate warming. The disparity between long-term and short-term temperature responses varied among microbial groups. While Firmicutes displayed similar growth responses to warming in both scenarios, fungi and gram-negative bacteria showed significantly higher mass-specific growth rates in long-term warmed plots compared to ambient soils exposed to corresponding levels of short-term warming. These results demonstrate that changes in microbial community function and composition following warming run counter to the typical concept of thermal acclimation.

How to cite: Taft, T., Darcy, S. R., Guseva, K., Jenab, K., Rottensteiner, C., Gorka, S., Fuchslueger, L., Ranits, C., Canarini, A., Sigurdsson, B. D., Richter, A., and Kaiser, C.: Elevated mass-specific soil microbial growth rates and no sign of thermal acclimation at a long-term warming gradient, EGU General Assembly 2025, Vienna, Austria, 27 Apr–2 May 2025, EGU25-21632, https://doi.org/10.5194/egusphere-egu25-21632, 2025.

EGU25-412 | ECS | Orals | HS10.10

Integrating ecohydrological, isotopic, and numerical approaches to assess water use in montane Scots pine under varying wetness conditions  

Loujain Alharfouch, Pilar Llorens, Juan J. Hidalgo, Joaquin Jiménez-Martínez, Jesús Ariel Castro-López, Francesc Gallart, and Jérôme Latron

Mediterranean mountain regions are facing significant challenges due to climate change, including declining annual rainfall, prolonged dry spells, and increasingly frequent summer storms. These challenges pose serious threats to ecosystem resilience and the sustainable management of water resources and tackling them requires effective ecohydrological strategies. However, understanding water flow through the critical zone remains challenging due to the intricate water partitioning processes shaped by soil and vegetation heterogeneities. In an attempt to somewhat diminish this complexity, this study aims to investigate the water use dynamics of montane Scots pine (Pinus sylvestris L.) under varying wetness conditions by integrating ecohydrological data, stable water isotope (²H and ¹⁸O), and numerical modeling with Hydrus 1D.

We conducted a comprehensive plot-scale field investigation in the Vallcebre research catchments (NE Spain), monitoring two sets of three Scots pine trees since May 2022. Data collection included throughfall, sap flow, stem diameter variations, and soil water potential and content down to 70 cm depth, all at 5-minute intervals. Weekly sampling of different water pools (throughfall, bulk and mobile soil water down to 100 cm, groundwater, and xylem water) provided isotope data across the growing season of 2022. The analysis of these datasets revealed dynamic tree water uptake behavior, with shifts in source water contributions across variable wetness conditions. We observed that tree water uptake predominantly contained winter precipitation, even after a large summer storm delivering more than 60 mm of rainfall in a single day after a 20-day dry spell. However, later in the growing season, the isotopic composition shifted to reflect a roughly equal contribution from both summer and winter precipitation.

We used the Hydrus 1D model to test three distinct root distribution estimation methods and utilizing our field ecohydrological, and isotopic data as inputs. The simulations revealed that the choice of root distribution significantly influenced model performance. The model captured the patterns of soil moisture and atmospheric demand, particularly emphasizing how shifts in these factors influence tree water use efficiency and water stress responses. These findings demonstrate the importance of accurately representing root distribution in ecohydrological models to improve our understanding of tree water uptake processes. Our integrated approach provides a reliable framework for exploring the complex water dynamics in montane Scots pine ecosystems, offering insights into tree resilience under future climate scenarios.

Keywords: Ecohydrology; Soil-plant-water interactions; Stable isotopes; Modelling; Root distribution, Scots pine

How to cite: Alharfouch, L., Llorens, P., Hidalgo, J. J., Jiménez-Martínez, J., Castro-López, J. A., Gallart, F., and Latron, J.: Integrating ecohydrological, isotopic, and numerical approaches to assess water use in montane Scots pine under varying wetness conditions , EGU General Assembly 2025, Vienna, Austria, 27 Apr–2 May 2025, EGU25-412, https://doi.org/10.5194/egusphere-egu25-412, 2025.

EGU25-944 | ECS | Orals | HS10.10

Investigating stable isotope signatures variability across tree compartments 

Jesus Ariel Castro Lopez, Jérôme Latron, Pilar Llorens, Loujain Alharfouch, Adrià Barbeta, Teresa Gimeno, and Elisabet Martínez-Sancho

Water stable isotopes are valuable proxies for tracing water fluxes within the critical zone, the Earth’s layer extending from vegetation through to deep aquifers. This technique has helped to develop conceptual models of water distribution across scales, making it essential to understand how trees regulate water stored within their internal compartments. To investigate this, we sampled a representative Pinus sylvestris tree within an ecohydrologically monitored forest plot in the Vallcebre research catchments (NE Spain). The primary aim of this sampling was to assess potential variability in the isotopic signatures across different parts of the tree to enhance understanding of soil-root-tree water uptake processes. Samples were collected from various soil depths (0–100 cm), woody tissues of twigs and branches (at 3 canopy heights), the stem (cores at 3 different heights), and roots in all four cardinal directions during two sampling days (July and September 2023). Water from soil and wood samples was extracted using: cryogenic vacuum distillation (CVD) and cavitron (centrifugation). Stable isotope ratios were measured for all samples using infrared laser spectrometry (Picarro). Additional data included long-term meteorological records, throughfall volumes and isotopic signatures, soil moisture content and potential, sap flow and tree water deficit rates (from adjacent trees). Results showed consistent patterns across sampling dates: twigs and branches displayed isotopic values close to those of soil and throughfall, whereas roots and stem tissues exhibited more depleted values, clearly distinct from soil, twig, and branch signatures. To determine whether these isotopic observed differences arise from methodological issues (differences between cavitron and cryogenic extractions and/or the part of the wood sampled) or reveal intrinsic processes within the tree, in a third sampling campaign (July 2024) we sampled soil, roots, stem, branches and twigs. From roots and branches we took samples for CVD and Cavitron extraction and from the stem we took heartwood and sapwood samples. In addition, selected samples from the third campaign will be analyzed by both Picarro and isotope ratio mass spectrometry (IRMS). This additional information promise new insights into the internal water dynamics of trees, clarifying if observed isotopic patterns reflect true physiological processes or methodological artifacts. This is critical for advancing our understanding of tree water dynamics and their role in critical zone water fluxes.

How to cite: Castro Lopez, J. A., Latron, J., Llorens, P., Alharfouch, L., Barbeta, A., Gimeno, T., and Martínez-Sancho, E.: Investigating stable isotope signatures variability across tree compartments, EGU General Assembly 2025, Vienna, Austria, 27 Apr–2 May 2025, EGU25-944, https://doi.org/10.5194/egusphere-egu25-944, 2025.

EGU25-1690 | Orals | HS10.10

Precipitation event characteristics influence its partitioning into evapotranspiration and streamflow regardless of the season 

Hatice Türk, Paolo Benettin, Michael Stockinger, and Christine Stumpp

The partitioning of precipitation into streamflow (Q) and evapotranspiration (ET ) is a fundamental aspect of the terrestrial
water cycle. Gaining insights into the mechanisms governing precipitation partitioning is critical for nutrient transport in
surface and subsurface water fluxes, ensuring plant water supply and maintaining atmospheric water dynamics. While previous
studies have highlighted the role of seasonal variability in precipitation partitioning, the influence of event characteristics
on precipitation partitioning has received less attention. In this study, we used hydrometeorological and tracer data from a
forested headwater catchment (Wüstebach, DE, 38.5 ha ) and a tracer-aided model based on StorAge Selection (SAS) functions
to quantify precipitation partitioning across different event types (mild, moderate and intense) and seasons after a period
of one year. Similar to previous studies, we showed seasonal precipitation input variability affects its partitioning.
Roughly about 82 % of spring season precipitation is released back into the atmosphere after one year, while this rate decreased
to 41 % for autumn season precipitation. Different season’s precipitation showed variation in partitioning to streamflow as
well. Approximately 11 % of autumn season precipitation ended in streamflow after one year, while this rate decreased to
3 % for spring season precipitation. However, within the same season, event characteristics showed stronger variation in
the partitioning of precipitation to ET and Q. Independent of in which season the precipitation fell, from mild to intense
events, ET partitioning decreased, and Q partitioning increased. Particularly for autumn precipitation, event types showed the
greatest variation in partitioning to ET and Q. ET partitioning for autumn precipitation declined roughly by 30%, Q partitioning
increased by 2%, and the fraction of precipitation remaining in the storage increased by 30% from mild to intense events. For
winter, ET decreased by 20 %, and Q and storage both increased by 6% and 15%, respectively. These patterns were consistent
across all seasons, indicating that precipitation event characteristics exerted a strong influence on the long-term partitioning
of precipitation. Thus, while seasonal variability remains important for precipitation partitioning, our results highlight which
type of precipitation returns to the atmosphere, contributes to discharge, or persists within catchment storage. These findings
emphasize the need to consider event-level precipitation dynamics under changing climatic conditions, given their potential
to alter water availability, contaminant transport, and flood mitigation strategies.

How to cite: Türk, H., Benettin, P., Stockinger, M., and Stumpp, C.: Precipitation event characteristics influence its partitioning into evapotranspiration and streamflow regardless of the season, EGU General Assembly 2025, Vienna, Austria, 27 Apr–2 May 2025, EGU25-1690, https://doi.org/10.5194/egusphere-egu25-1690, 2025.

EGU25-2250 | ECS | Posters on site | HS10.10

Decoding lake water dynamics to optimize watershed agriculture through isotopic analyses of memory effects and hydrological connectivity 

Junen Wu, Bin Yang, Feng Cheng, Fan Zhao, Sha Ma, Xia Yuan, Huanhuan Zeng, Cheng Tang, Kun Yang, and Lei Zhao

Navigating the complex dynamics of lake water systems is critical in the context of intensifying global environmental changes. This study employs a novel stable isotope analysis to investigate the hydrological connections and water source contributions in Dianchi Lake, China. The research reveals a significant “memory effect”, where the lake’s current water volume is primarily influenced by its historical water conditions. The study also quantifies the relative contributions of various water sources, including precipitation, surface water, soil water in different agricultural land use types, and groundwater, to the lake’s water balance. The results identify agricultural land use practices are found to impact the lake’s hydrology, with greenhouse soils contributing less water than open field soils. And water outflow, rather than evaporation, as the primary factor reducing nearshore lake volume, highlighting the influence of human activities such as irrigation withdrawals and groundwater exploitation. The research also explores the interplay between meteorological factors and water source contributions, revealing the impact of seasonal variations and weather events on the lake’s water dynamics. By integrating stable isotope data with meteorological records and applying advanced modeling techniques, the study presents a quantitative framework for predicting future hydrological changes in the lake catchment. This innovative approach advances our understanding of complex lake water systems and provides valuable insights for effective water resource management, ecological conservation, and climate change adaptation strategies. 

How to cite: Wu, J., Yang, B., Cheng, F., Zhao, F., Ma, S., Yuan, X., Zeng, H., Tang, C., Yang, K., and Zhao, L.: Decoding lake water dynamics to optimize watershed agriculture through isotopic analyses of memory effects and hydrological connectivity, EGU General Assembly 2025, Vienna, Austria, 27 Apr–2 May 2025, EGU25-2250, https://doi.org/10.5194/egusphere-egu25-2250, 2025.

The climate-change-induced increased frequency of droughts and shifts in rainfall patterns will most likely impact the interaction of trees with components of the hydrological cycle, e.g., rainfall, soil water, or groundwater. To study this, an increasing number of scientists use in-situ measurement systems capable of high-resolution measurement of the stable water isotopes (δ18O, δ2H) of xylem and soil water. These systems often use gas-permeable probes to sample water vapor in isotopic equilibrium with the liquid xylem or soil water, which are connected to transport tubing of several meters length that guide the vapor sample to the gas-inlet of a field-deployed isotope analyzer. Potential issues of these systems include (a) the accidental transport of liquid water to the isotope analyzer (e.g., by damage to the tubing, or inadequate sealing of connections), and (b) the maximum transport tubing length to obtain a reliable measurement. Here, we tested two different syringe filters (0.45 µm Nylon, and 0.2 µm PTFE) in terms of preventing liquid water from passing through, and from allowing water vapor to pass through without fractionation of isotope ratios. By switching between two known water sources, we further analyzed the effect of a possible filter cake made up of water vapor of the previous measurement trapped in the filter material on subsequent isotope measurements (memory effect). Lastly, using a 4 mm diameter tube we tested lengths from 1.3 m to 15.3 m in 1-m-increments to assess maximum tubing lengths for a reliable analysis. Results showed that only 0.2 µm filters were able to prevent liquid water from breaking through, and that isotope values were slightly enriched (δ18O: +0.47‰, δ2H: +1.3‰). However, this enrichment was not statistically significant due to the small sample size of only three repeated measurements with and without the filter installed. No influence of a possible filter cake was found as two waters of known isotope ratios could be repeatedly measured when switching back-and-forth between water sources (standard deviations were on average 0.15‰ for δ18O and 0.6‰ for δ2H). Tests of tubing length showed a maximum length of 6.3 m for the isotope ratios to reach the target value when measuring for 20 minutes. Between 15.3 m to 12.3 m, no discernible change in isotope ratios was detected, and from 12.3 m to 7.3 m the expected isotope ratio was only detected after the 20-minute measurement window. Using the vapor volume of our 4 mm diameter and 6.3 m long tube of approximately 80 cm³, we calculated that the often-used tubes of 1/8-inch inner diameter (~1.58 mm) could theoretically be up to 40 m long. We thus recommend using a maximum transport tubing length that corresponds to approximately 80 cm³ of gas that needs to be transported. If liquid water intrusion might pose a danger to field-deployed measurement equipment, 0.2 µm PTFE syringe filters can be used to stop the liquid water. However, the issue of potential fractionation of these filters is not yet resolved.

How to cite: Stockinger, M. and Stumpp, C.: In-situ measurement of the stable isotopes of soil and xylem water using liquid-vapor equilibration: protection against water intrusion and maximum tubing lengths for automatic systems, EGU General Assembly 2025, Vienna, Austria, 27 Apr–2 May 2025, EGU25-3627, https://doi.org/10.5194/egusphere-egu25-3627, 2025.

EGU25-3707 | ECS | Orals | HS10.10

Evidence of xylem hydraulic sectoring in apple trees from a deuterium tracing experiment in a split-root system 

Nicola Giuliani, Anna-Lena Haug, Stefano Brighenti, Agnese Aguzzoni, Damiano Zanotelli, Daniele Penna, and Massimo Tagliavini

Xylem is the plant tissue devoted to water transport. Its structure and anatomy vary among tree species, ranging from integrated (i.e., well-connected) to sectored networks. While xylem hydraulic sectoring has some advantages (e.g., reduced spread of pathogens and embolism), it also limits the exchange of water and nutrients between plant organs in different locations in the tree. In agricultural settings, where water and fertilizer inputs are often localized, preferential flow pathways in xylem could lead to non-homogeneous distribution of these resources within the trees. We therefore carried out an experiment to determine the degree of sectoriality in apple tree xylem, hypothesizing that differences in water availability at root level would influence this behavior.

To test our hypothesis, we potted young apple trees in a split-root system with four independent compartments. Soil compartments in different sets of trees were irrigated with water having different isotopic composition (enriched, δ2H ≈ 1650‰, or tap, δ2H ≈ -80‰) or left dry, obtaining five different treatments (100, 50_W, 25_W, 50_D, and 25_D, where the number represents the percentage of sectors receiving labelled water, and W and D indicate whether the remaining sectors were irrigated with tap water or left dry, respectively). Four days after the labelled irrigation, we destructively sampled shoots, trunk, rootstock, roots, and soil in each pot, every time collecting four samples corresponding to the respective sectors of the split-root system. Water was subsequently extracted from the samples by cryogenic vacuum distillation and its isotopic composition determined with IRMS. A two-end-member mixing model was applied to determine the contribution of labelled soil water in each tree organ.

In the trees receiving water in all sectors (100, 50_W, and 25_W), the average fraction of labelled soil water measured in the tree was consistent with that in the soil and reflected the number of soil sectors receiving labelled water in the respective treatment (100%, 50%, or 25% of enriched soil water). Conversely, when the labeled water was applied only to one or two soil compartments (25_D and 50_D), the average fraction of enriched soil water in the trees was higher than when the other compartments received unlabeled water (25_W and 50_W), indicating a higher water uptake by the roots in the irrigated sectors. Interestingly, in all treatments except the 100, we observed a high variability in the fraction of labelled soil water among different parts of the canopy within each tree. When soil water availability was homogeneous (50_W, 25_W), at least one sector of the tree canopy showed a negligible (<10%) contribution of labelled soil water, indicating that water flow was predominantly axial. When part of the soil was dry (50_D, 25_D), lateral water movement was enhanced, evidencing that hydraulic sectoring is affected by the water availability at root level. Therefore, when trees have access to water pools with different availability and isotopic fingerprint, the isotopic composition of water could be spatially variable also within the plant. This has consequences in ecohydrological studies.

How to cite: Giuliani, N., Haug, A.-L., Brighenti, S., Aguzzoni, A., Zanotelli, D., Penna, D., and Tagliavini, M.: Evidence of xylem hydraulic sectoring in apple trees from a deuterium tracing experiment in a split-root system, EGU General Assembly 2025, Vienna, Austria, 27 Apr–2 May 2025, EGU25-3707, https://doi.org/10.5194/egusphere-egu25-3707, 2025.

EGU25-7378 | ECS | Posters on site | HS10.10

Isotope-Enhanced Ecohydrological Modeling of Snow-Driven Recharge in Semi-Arid Mountains 

Nadia Rhoujjati, Sylvain Kuppel, Yassine Ait Brahim, Ali Rhoujjati, Nicolas Patris, Lhoussaine Bouchaou, Taha Attou, and Lahoucine Hanich

This study investigates the dynamic behavior of snow in semi-arid mountainous landscapes, emphasizing the use of the isotope signal as a tool for tracing hydrological processes. Thin snowpack poses a significant challenge, leading to extensive shifts in isotope values and complicating the estimation of catchment-average snowpack signatures. Traditional mixing models fall short in such scenarios, necessitating detailed approaches involving sampling along the hydrological pathway. The research employs a tracer-enabled spatially-distributed, process-based ecohydrological modeling approach to evaluate groundwater recharge processes in the complex settings of a regional watershed in the Middle Atlas mountains of Morocco. The study's objectives are to quantify recharge rates and dynamics seasonal variations, conducting a comparative analysis of yearly to sub-seasonal trends dating from 2017 onwards, and exploring stable isotope dynamics in snow-fed compartments of the hydrological cycle. The preliminary results of the ecohydrological simulations are discussed ; the simulated streamflow exceeds observed values, attributed to factors such as low winter evapotranspiration and the generalized spatialization of parameters. Variations in water table levels of each aquifer, and evapotranspiration data reveal a time lag influenced by seasonal variations and vegetation density. Stable isotopes closely mirror observed data, indicating the model's capability to capture the dynamic behavior of the aquifer system, with spatialized maps revealing a time delay between peak SWE (Snow Water Equivalent) abundance and isotopic depletion. Recharge dynamics are notably influenced by Triassic clay formations, with higher rates in exceptionally wet years and variations based on geological properties. The study highlights the important role of SWE in groundwater recharge, with peak SWE coinciding with major recharge events, and decreasing SWE contributing to groundwater depletion.

Keywords: Recharge, snowpack, isotope, ech2o-iso, snowmelt.

How to cite: Rhoujjati, N., Kuppel, S., Ait Brahim, Y., Rhoujjati, A., Patris, N., Bouchaou, L., Attou, T., and Hanich, L.: Isotope-Enhanced Ecohydrological Modeling of Snow-Driven Recharge in Semi-Arid Mountains, EGU General Assembly 2025, Vienna, Austria, 27 Apr–2 May 2025, EGU25-7378, https://doi.org/10.5194/egusphere-egu25-7378, 2025.

EGU25-8051 | Posters on site | HS10.10

Effects of fertilizer and weeding on stable isotope composition (¹³C–¹⁸O) in different carbohydrate pools across the cassava canopy 

Wivine Munyahali, Jonas Van Laere, Fidèle Barhebwa, Damas Birindwa, Roel Merckx, Rebecca Hood-Nowotny, and Gerd Dercon

Intrinsic water use efficiency (iWUE) is a critical characteristic for optimizing cassava (Manihot esculenta Crantz) performance under climate change. Stable isotope composition provides a valuable tool for estimating iWUE, yet the key drivers of isotope variation across the cassava canopy remain unclear. In this study, conducted at 17 farms across three agroecological zones in the Eastern Democratic Republic of Congo, we examined how agronomic practices (fertilizer application and weeding) influence carbon (δ¹³C) and oxygen (Δ¹⁸O) isotope composition at different canopy positions and in carbohydrate pools during the bulk root initiation stage. Physiological and morphological variables were measured at noon across the upper, middle, and lower canopy of cassava plants grown on-farm during the rainy season. These variables were related to δ¹³C and Δ¹⁸O in bulk leaf material, extracted cellulose, and soluble sugars.

Fertilizer application increased δ¹³C of soluble sugars (+0.6 ‰, p < 0.1) and bulk (+0.3 ‰, p < 0.1) in the drier zone, suggesting enhanced iWUE under fertilized conditions. Path analysis showed that leaf nitrogen concentration became increasingly correlated with δ¹³C from the upper to the lower canopy, while the influence of stomatal conductance declined. In upper-canopy leaves, higher stomatal conductance was associated with elevated vapour pressure deficit (VPD), possibly due to co-varying increased light intensities. Assumptions of the dual isotope approach related to Δ¹⁸O were not met, and therefore require further investigation. These findings provide new insights into the drivers of iWUE in cassava, highlighting the roles of canopy position and agronomic practices. This knowledge can inform strategies to improve cassava resilience and productivity under climate change.

How to cite: Munyahali, W., Van Laere, J., Barhebwa, F., Birindwa, D., Merckx, R., Hood-Nowotny, R., and Dercon, G.: Effects of fertilizer and weeding on stable isotope composition (¹³C–¹⁸O) in different carbohydrate pools across the cassava canopy, EGU General Assembly 2025, Vienna, Austria, 27 Apr–2 May 2025, EGU25-8051, https://doi.org/10.5194/egusphere-egu25-8051, 2025.

EGU25-8143 | ECS | Posters on site | HS10.10

Effects of drought stress on assimilation and carbon allocation in a fruiting arabica coffee plant explained by 13C-CO2 pulse labelling 

Janice Nakamya, Jonas Van Laere, Rebecca Hood-Nowotny, Roel Merckx, Christian Resch, Jason Mitchell, Brenda Trust, and Gerd Dercon

The effects of drought on coffee yield and quality during the flowering and fruiting stages are becoming a challenge in many coffee-producing regions. Nevertheless, coffee plants exhibit various adaptive mechanisms that mitigate the effects of short-term water scarcity during these phenological phases. Plants undergo numerous physiological and metabolic alterations in response to water deficits during their critical developmental stages, for example, during flowering, one of the stages that is related to yield. Although understanding these responses is essential for effective breeding and management strategies, they remain inadequately documented for coffee. This study employed a rapid and accurate method of pulse labelling utilising 13C-CO2 on 32 four-year-old Venecia Arabica coffee plants from Costa Rica in a greenhouse. Carbon assimilation in young and old leaf pairs was assessed at 10, 11, 12, and 13 days post-stress initiation to determine the metabolic differences in leaf age and orientation. The allocation of assimilates to soluble sugars, starch, and cellulose in various structural components, such as fruits, stems, roots, and old and young leaves, was also measured at harvest (15 days of stress). These findings demonstrate a significant reduction (p< 0.05) in carbon assimilation and, consequently, photosynthesis under drought stress conditions, with a more pronounced decrease in older leaf pairs. This study revealed altered assimilate partitioning, with plants prioritising allocation to roots to presumably sustained soil water uptake. Conversely, under water stress, carbon allocation to young leaves diminished, whereas in fruit, a priority sink,  the assimilates remained constant for starch but increased for sugar (0.33±0.21%). Carbohydrate metabolism exhibited notable changes, including a significant (p< 0.05) decrease in foliar soluble sugars and enhanced starch allocation to stems and roots. Additionally, a significant (p< 0.0001) increase in cellulose production was observed, particularly in the older leaves (94%), stems (93%), and roots (89%), which suggests a physiological drought response with the upregulation of cellulose production, possibly providing structural support and protection against herbivory. In summary, this study revealed a response to short-term water deficit between the two leaf age categories and clarified the allocation of new assimilates in Coffea arabica. L. This study provides a foundation for improved breeding and management strategies to support the resilience and sustainability of coffee production.


How to cite: Nakamya, J., Van Laere, J., Hood-Nowotny, R., Merckx, R., Resch, C., Mitchell, J., Trust, B., and Dercon, G.: Effects of drought stress on assimilation and carbon allocation in a fruiting arabica coffee plant explained by 13C-CO2 pulse labelling, EGU General Assembly 2025, Vienna, Austria, 27 Apr–2 May 2025, EGU25-8143, https://doi.org/10.5194/egusphere-egu25-8143, 2025.

EGU25-8739 | ECS | Posters on site | HS10.10

Ecohydrological characterization of a terraced hill vineyard in Corno di Rosazzo (Italy) 

Mirco Peschiutta, Vittoria Posocco, Martina Tomasella, Lucìa Nadia Biruk, Paolo Sivilotti, Giorgio Alberti, Mauro Masiol, Luca Zini, Chiara Calligaris, Giuliano Dreossi, Mirko Sodini, Klemen Lisjak, and Barbara Stenni

Climate change is causing more frequent heat waves and droughts in recent summer in the Mediterranean area. This phenomenon is posing risks for viticulture, regarding both the quantity produced and the quality of the wines. Adaptation and mitigation measures to climate change effects include the use of emergency irrigation and soil management practices. In this context, ecohydrological studies about the water dynamics in the soil, as well as the patterns and variability of vines root water uptake (RWU) depth throughout the growing season, can provide valuable insights for achieving more efficient and sustainable water resource use in viticulture.

As part of the Interreg Ita-Slo IRRIGAVIT project, during the 2024 growing season, we conducted an ecohydrological characterization of a vineyard cultivated with Vitis vinifera cv. Ribolla Gialla (grafted on Kober 5BB) on a terrace in Corno di Rosazzo (Friuli Venezia-Giulia, Northeast Italy), using stable water isotope composition (δ18O, δ2H, d-excess) to track water fluxes in the soil-plant-atmosphere continuum. The site was chosen due to its soil composition, primarily consisting of flysch residuals (weathered alternations of marls and sandstones).

We sampled monthly precipitation from February 2024 to January 2025, as well as individual precipitation from spring to late summer 2024. In the plot located on the highest terrace of the hillslope, we sampled soil and vines sap every two to three weeks, collecting three soil cores and nine sap samples per sampling date. Soil cores were divided into 10 cm segments down to 35 cm of depth and 20 cm segments from that to the maximum reached depth (more than 1 m). Soil water was extracted in the lab using a cryogenic vacuum distillation (CVD) line. Sap samples were extracted using a vacuum pump system in the field from three shoots of plants close to each drilling point.

Rainwater and soil water samples were analysed using a CRDS laser spectroscope Picarro L2130-i in liquid mode, while the sap samples were analysed with the same instrument, coupled with a Picarro Induction Module to minimize the organic spectral interference. In addition, soil water content and water potential were measured, and soil mineralogy and particle size were assessed. Soil moisture and plant water potential were monitored in the field.

The 2024 growing season was particularly challenging for viticulture in Northeast Italy: frequent rainfall in spring damaged vines’ flowers, the summer was hot and dry, while heavy rainfall occurred during harvest. Visual inspections of soil samples revealed roots reaching up to 1.50 m deep. Isotopic data indicated that vines RWU occurred mainly in the top 20 cm of soil, which retained sufficient moisture even during the hot, dry summer with high vapour pressure deficit (VPD) values. This may have been due to soil management practices, such as using shredded cover crops to create mulch, enriching the topsoil with organic matter and improving water retention.

How to cite: Peschiutta, M., Posocco, V., Tomasella, M., Biruk, L. N., Sivilotti, P., Alberti, G., Masiol, M., Zini, L., Calligaris, C., Dreossi, G., Sodini, M., Lisjak, K., and Stenni, B.: Ecohydrological characterization of a terraced hill vineyard in Corno di Rosazzo (Italy), EGU General Assembly 2025, Vienna, Austria, 27 Apr–2 May 2025, EGU25-8739, https://doi.org/10.5194/egusphere-egu25-8739, 2025.

EGU25-8777 | ECS | Posters on site | HS10.10

Seasonal isotope distribution in soil profiles and its implications for plant water uptake 

Franciele de Bastos, Michael Stockinger, Megan Asanza-Grabenbauer, and Christine Stumpp

The increase in average temperatures and change in precipitation patterns derived from climate change affect forests differently, varying from the species' composition and forest characteristics. Understanding the ecophysiological behavior of trees under climate change and its impacts on the hydrological processes on a catchment scale requires a multidisciplinary approach, with an initial focus on the interactions on the soil-plant-atmosphere continuum. To better characterize soil water availability dynamics and comprehend how it may be affected by climate change, water isotope ratios of conservative tracers (δ18O, δ2H) can be used as fingerprints of infiltration processes, providing information on the seasonal origin of soil water infiltrated in the vadose zone. This study aims to characterize profiles of water isotopes in soil water to evaluate its seasonal isotope distribution. This information will be essential for further evaluations of seasonal water use by trees, contributing to understanding processes from the plot to the catchment scale.

The study will be conducted in an experimental plot (DRAIN Station) in the Rosalia catchment (950 ha), located on the border between the Austrian states Burgenland and Lower Austria. The catchment elevation ranges from 385 to 725 m, with a mean annual precipitation of 790 mm and a mean annual temperature of 8.2 °C. The soils are predominantly Cambisols, and the main land use comprises forests, predominantly beech (Fagus sylvatica) and Norway spruce (Picea abies). The DRAIN Station is located upstream in a beech stand representative of the forest in the catchment and has an average slope of 16°. This plot is a permanent monitoring station part of the LTER (Long-Term Ecosystem Research), a global network focused on long-term measurements of nitrogen, carbon, and water balance. A variety of environmental variables are measured at plot and catchment scale, adding spatial and temporal heterogeneity in the evaluation of hydrological processes.

At the DRAIN Station, a transect of four soil profiles representative of the plot will be defined and soil samples will be collected every 5-10 cm down to 60 cm using a split spoon sampler. To determine the precipitation water isotope ratios, daily precipitation data collected at the catchment’s climate station will be analyzed. The soil and water samples will be analyzed in the laboratory for stable isotopes (δ18O, δ2H) using a Picarro laser-spectroscope. The mean monthly water isotope ratios in precipitation will be determined over 12 months and compared with the water isotope profiles of δ18O and δ2H.

These results will enhance the understanding of the infiltration processes and seasonal distribution of water fluxes in the vadose zone. Moreover, the spatial variability of isotope ratios among soil profiles, such as infiltration depth and velocity, will be assessed. By integrating the seasonal isotope distribution in soil profiles with transit time distribution and hydrological modeling, a deeper understanding of the hydrological processes across different scales can be achieved.

How to cite: de Bastos, F., Stockinger, M., Asanza-Grabenbauer, M., and Stumpp, C.: Seasonal isotope distribution in soil profiles and its implications for plant water uptake, EGU General Assembly 2025, Vienna, Austria, 27 Apr–2 May 2025, EGU25-8777, https://doi.org/10.5194/egusphere-egu25-8777, 2025.

EGU25-9711 | ECS | Orals | HS10.10

Stable Isotope Fractionation in an Agricultural Field during Wet-Dry Cycles 

Adhitya c u, Richa Ojha, and Saumyen Guha

In an agricultural field, crops in the Rabi and Zaid seasons are exposed to repeated wet-dry cycles between precipitation and/or irrigation events. There is a general consensus in the literature that no isotopic fractionation occurs during water uptake by the plants. The isotopic shifts in soil water at different soil tensions, if occurs during repeated wet-dry cycles, are expected to influence the isotopic composition of the plant’s xylem water. The objective of this study was to investigate the isotope enrichment and/or depletion during repeated wet-dry cycles in an agricultural field within the plant-available water range, specifically from field capacity to wilting point. The pressure-saturation curves and isotope retention patterns were compared to observe the changes in the isotopic compositions of plant-available water.

The laboratory experiments were conducted with soil (silty sand) from an agricultural plot that undergoes regular cultivation of 2-crops a year (Rice-Wheat) with no tillage. A modified pressure plate apparatus was fabricated to simultaneously measure the pressure vs. saturation and isotope compositions at each pressure. The pressure plate apparatus was designed to ensure mass balance across the imbibed, exuded, and retained water at each suction pressure, throughout all the wet-dry cycles. The experiments were conducted over five wet-dry cycles with the same reference water of known isotopic composition. The exuded water was analyzed directly, and the retained water content at each suction pressure of five wet-dry cycles was extracted using cryogenic vacuum distillation. The isotopic composition of all the samples was analyzed using an LGR OA-ICOS liquid water isotope analyzer.  

The pressure-saturation curves across all five cycles exhibited no significant changes for drainage. Drained water, even at a small suction pressure of 0.1 bar, was enriched in both δ²H and δ¹⁸O compared to the isotopic composition of the imbibed water. Within a cycle, both δ²H and δ¹⁸O in the exuded water showed depletion as the suction pressure increased. The δ²H composition of the exuded water became enriched with the progression of the wet-dry cycles. The δ¹⁸O composition of the exuded water, on the other hand, showed depletion with the progression of the wet-dry cycles. These results indicate that plant xylem water may show a mismatch with irrigation water due to fractionation during the wet-dry cycles.

How to cite: c u, A., Ojha, R., and Guha, S.: Stable Isotope Fractionation in an Agricultural Field during Wet-Dry Cycles, EGU General Assembly 2025, Vienna, Austria, 27 Apr–2 May 2025, EGU25-9711, https://doi.org/10.5194/egusphere-egu25-9711, 2025.

EGU25-9792 | ECS | Posters on site | HS10.10

Revealing the origin and age of tree water uptake along a forested hillslope 

Célia Rouvenaz and Marius Floriancic

crouvenaz@student.ethz.ch

floriancic@ifu.baug.ethz.ch


The forest water cycle is dominated by vegetation-mediated processes, such as interception, infiltration, and transpiration, that greatly affect the redistribution of water between the atmosphere and subsurface. Yet, subsurface water transport and storage are poorly understood, complicating comprehensive analyses of tree water uptake.

Here we explore the performance and sensitivity of the model EcH2O-iso with a novel isotope tracer dataset from the WaldLab experimental forest site, a small catchment located in a mixed beech and spruce forest in Zürich, Switzerland. Five years ago, we began measuring water fluxes and stable water isotopes in precipitation, soils of various depths, groundwater, streams and xylem. The model EcH2O-iso is a process-based, spatially distributed ecohydrological model which allows to use water isotopic tracers (2H and 18O) for age tracking. Each grid cell is locally coupled with energy balance, hydrological transfer, vegetation growth and dynamics.

After setting up and parametrizing the model we validated model outputs with the measured isotope timeseries in different depths of the soil, groundwater, streamflow and xylem water along the sampled hillslope. We also tested to what extent input precipitation isotopes measured outside the forest are a reliable input to the model, by rerunning simulations with inputs from i) measured throughfall isotopes and ii) isotopic values obtained from drainage from the forest-floor litter layer. We performed multiple sensitivity analyses to better understand the sensitivity of certain model parameters and assessed which parameters need to be calibrated more precisely for future use of the model for this site.

How to cite: Rouvenaz, C. and Floriancic, M.: Revealing the origin and age of tree water uptake along a forested hillslope, EGU General Assembly 2025, Vienna, Austria, 27 Apr–2 May 2025, EGU25-9792, https://doi.org/10.5194/egusphere-egu25-9792, 2025.

EGU25-9957 | ECS | Orals | HS10.10

Geographical, spatial, and temporal water sources in a Mediterranean forested catchment. 

Mingming Feng, Francesca Sofia Manco di Villahermosa, Matteo Verdone, Ilenia Murgia, Ginevra Fabiani, Giulia Zuecco, Stefano Brighenti, Jiulian Klaus, Christian Massari, Marco Borga, Ming Jiang, and Daniele Penna

Forested catchments play a key role in storing and releasing fresh water. Climate changes affect global hydrological and ecosystem processes with effects also observed at small scales. In this context, investigating spatial and temporal water origins in small forested catchments is fundamental to understand and better predict the behavior of hydrological processes. However, very little is known about both the spatial and temporal origin of water across different ecohydrological compartments in Mediterranean forested catchments.

In this study, we collected hydrometeorological and isotopic data in the Re della Pietra experimental catchment (2 km2) located in the Tuscan Appennines (Central Italy) to understand the origin of stream water at different spatial and temporal scales and the sources of tree-water uptake. Starting in April 2019, we collected water samples for isotope analysis (d18O, d2H) from precipitation, throughfall, springs, and the stream at different sections (4 locations from upstream to downstream). In addition, we sampled soil at different depths (0-20cm, 20-40cm, 40-60cm) and several monitored beech trees. Hydro-meteorological parameters are monitored in the Lecciona subcatchment (0.3 km2).

Results based on the HYSPLIT model revealed that the Northern Lower Atlantic dominates the water vapor of precipitation in both wet and dry periods. In contrast, water vapor from the Arctic Ocean was observed only in wet periods, while in dry ones, there was a small contribution of Mediterranean water vapor. Furthermore, there were significant spatial and temporal variations of isotopes (δ18O and δ2H) and electrical conductivity among water in various ecohydrological compartments. Both the main stream and the tributary were mainly recharged by spring water and only secondarily by precipitation and soil water with significant seasonal variations. Spring water decreased in wet periods but increased in dry periods, and precipitation and soil compartments showed opposite behaviours. Trees mainly used soil water from shallow layers(0-20 cm: 51.1% ± 13.1%, 20-40 cm: 37.1% ± 15.6%, 40-60 cm: 7.5% ±6.3%) in wet periods, while in dry periods, tree water uptake came from deep soil layers(0-20 cm: 13.41% ± 12.7%, 20-40 cm: 55.6% ± 26.1%, 40-60 cm: 8.35% ± 3.6%). The dominant negative values of the Seasonal Origin Index in all ecohydrological compartments except shallow soil layers revealed that winter precipitation was used even in midsummer by the trees and that both surface and subsurface water reflect larger contributions from winter sources. These results imply the resilient behaviour of this catchment to cope against summer droughts and provide a preliminary theoretical basis for managing forest and water resources in Mediterranean catchments.

How to cite: Feng, M., Manco di Villahermosa, F. S., Verdone, M., Murgia, I., Fabiani, G., Zuecco, G., Brighenti, S., Klaus, J., Massari, C., Borga, M., Jiang, M., and Penna, D.: Geographical, spatial, and temporal water sources in a Mediterranean forested catchment., EGU General Assembly 2025, Vienna, Austria, 27 Apr–2 May 2025, EGU25-9957, https://doi.org/10.5194/egusphere-egu25-9957, 2025.

EGU25-10527 | Posters on site | HS10.10

Which water sources do trees on floodplains in southeastern Brazil use for transpiration? 

Aline Meyer Oliveira, Marius Floriancic, Fernanda Moreira Gianasi, Barbara Herbstritt, Patricia Vieira Pompeu, Felipe de Carvalho Araújo, André Maciel Silva-Sene, Miguel Gama Reis, Camila Farrapo, Leony Aparecido Silva Ferreira, Rubens Manoel dos Santos, and Ilja van Meerveld

Seasonal floodplain forests are important ecosystems that attenuate floods and have high biodiversity. However, floodplains are threatened by human activities, such as dam building, agricultural water use, and climate change. Improving our understanding of the functioning of floodplain forests can aid in their protection. Trees in the floodplain forests in southeastern Brazil experience flooding for more than a month per year but also must endure very dry periods where the groundwater level is several meters below the surface. Species composition depends on the flooding regime, but which water the trees use for transpiration is largely unknown. As a result, their vulnerability to changes in climate or flooding regime remains poorly understood.

We sampled the different water sources (precipitation, streamflow, groundwater, and soil water at different depths) and vegetation (covering more than 60 tree species) across six floodplain forests in the Rio Grande and São Francisco basins in southeastern Brazil during four campaigns (two dry and two wet seasons). At each floodplain, we took samples from three different “eco-units”: levees (close to the river), terraces (wettest parts of the floodplain), and plains (regions that do not get flooded). The samples were analyzed for the abundance of hydrogen and oxygen stable isotopes. These data were used together with the MixSIAR model to investigate the contribution of soil water (down to 1 m) for tree water uptake.

The variability in xylem water was large and there was no consistent variation in the isotopic composition of the soil water between the dry and wet seasons. Instead, soil water reflected the isotopic signature of wet season precipitation and overbank flow. We hypothesize that the soil isotopic signature is reset by precipitation and overbank flow every wet season. There was also no consistent pattern in the isotopic composition of the xylem water across the three “eco-units”. The mixing model analyses suggest that for the floodplains in the Rio Grande basin, soil water was the main source during the wet season (64% ± 17) but not during the dry season (43% ± 17), when groundwater or stream water were the predominant sources. For the floodplains in the drier São Francisco basin, soil water was the main source of tree water uptake (60% ± 17 and 72% ± 15 for wet and dry seasons, respectively). However, uncertainties are very high due to the similar isotopic composition of the potential source waters.

How to cite: Meyer Oliveira, A., Floriancic, M., Moreira Gianasi, F., Herbstritt, B., Vieira Pompeu, P., de Carvalho Araújo, F., Maciel Silva-Sene, A., Gama Reis, M., Farrapo, C., Aparecido Silva Ferreira, L., Manoel dos Santos, R., and van Meerveld, I.: Which water sources do trees on floodplains in southeastern Brazil use for transpiration?, EGU General Assembly 2025, Vienna, Austria, 27 Apr–2 May 2025, EGU25-10527, https://doi.org/10.5194/egusphere-egu25-10527, 2025.

Agricultural crops play a crucial role in the global water cycle. Yet, climate change may alter crop physiology, agricultural ecosystems, and interactions within the land-atmosphere (L-A) system. Understanding crop transpiration (T) and soil evaporation (E) rates, along with their temporal dynamics and connection to the L-A system, is essential for predicting future hydro-climatic conditions and assessing agricultural land-use practices, particularly under the increasing frequency of extreme weather events.
Here, we introduce the DFG Research Unit “LAFI” (Land-Atmosphere Feedback Initiative) subproject 3, which focuses on partitioning evapotranspiration into E and T using real-time water isotope in-situ measurements.
We will study water fluxes and their isotopic composition across the L-A system to investigate water-related processes in high temporal and spatial resolution via canopy and leaf chambers for evapotranspiration (ET) and T, as well as membrane probes for soil water vapor isotope measurements. This innovative isotope measurement platform will enable the determination of root water uptake (RWU) contributions and depths for key crop species (wheat and maize) at the Land-Atmosphere Feedback Observatory (University of Hohenheim, Germany). Additionally, it will facilitate the evaluation of water transit times and the partitioning of ET.
Analyses will be species-specific and will examine the impact of varying environmental conditions on RWU, water transit times, ET, and ET partitioning. The results will provide insights into the vulnerability of crop species to climate-induced changes in precipitation patterns and soil moisture availability.

How to cite: Orlowski, N. and Kübert, A.: DFG Research Unit: Land-Atmosphere Feedback Initiative (LAFI): Using real-time isotopic in-situ measurements to partition evapotranspiration into soil evaporation and plant transpiration at two distinct cropland sites , EGU General Assembly 2025, Vienna, Austria, 27 Apr–2 May 2025, EGU25-11886, https://doi.org/10.5194/egusphere-egu25-11886, 2025.

EGU25-12138 | ECS | Orals | HS10.10

A new laboratory approach to extract soil water for stable isotope analysis from large soil samples 

Jiří Kocum, Jan Haidl, Ondřej Gebouský, Kristýna Falátková, Václav Šípek, Martin Šanda, Natalie Orlowski, and Lukáš Vlček

The reliability of soil water stable isotope analysis is -among other things- based on a correct soil water extraction. Currently used extraction methods are prone to isotope fractionation (especially with clay samples) and exhibit shortcomings limiting and/or complicating their usage. A newly developed soil water extraction method –Circulating Air Soil Water Extraction– is based on the principle of complete evaporation and condensation of the soil water in a closed circuit. Owing to its simple design, there is no need for any chemicals, gases, high pressure or high-temperature regimes. On the other hand, at present, the proposed apparatus with four independent extraction slots can be used at most twice a day.

The experimental tests proved no significant isotope fractionation effects leading to erroneous results caused by the extraction. In all experiments, the δ18O and δ2H did not exceed the limits ± 0.2 ‰ and ± 2 ‰, respectively, which is fully acceptable for hydrologic studies. Extraction of pure water samples shifts the isotope composition by 0.04±0.06 ‰ and 0.06±0.35 ‰ for δ18O and δ2H, respectively.

Soil water extraction tests were conducted with five distinct soil types (loamy sand, sandy loam, sandy clay, silt loam, and clay) using 40-150 grams of pre-oven-dried soil, which was subsequently rehydrated to 10 and 20 % water content. The shift in the isotopic composition ranged from -0.04 and 0.07 ‰ for δ18O and from 0.4 to 1.3 ‰ for δ2H with the corresponding standard deviations ± (0.08 – 0.25) ‰ and ± (0.34 – 0.58) ‰. The results exhibit high accuracy which predetermines this method for high-precision studies where unambiguous specification of the water origin is required. The accuracy is adversely counterbalanced by a reduced number of processed samples per day: at present eight (2 x 4 simultaneously measured samples at four extraction slots).

The proposed extraction method has proven versatility in handling various soil types with different soil textures and water contents. The main advantages are the high accuracy of the results, simple design of the apparatus setup, low operating costs, time reduction in operating the device, easy maintenance, and the ability to process large soil samples providing large and representative quantities of soil water.

How to cite: Kocum, J., Haidl, J., Gebouský, O., Falátková, K., Šípek, V., Šanda, M., Orlowski, N., and Vlček, L.: A new laboratory approach to extract soil water for stable isotope analysis from large soil samples, EGU General Assembly 2025, Vienna, Austria, 27 Apr–2 May 2025, EGU25-12138, https://doi.org/10.5194/egusphere-egu25-12138, 2025.

EGU25-14397 | ECS | Posters on site | HS10.10

CryoSCOPE: Quantifying hydrologic partitioning in snow-dominated landscapes 

Dillon Mungle, Marius Floriancic, Peter Molnar, and Harsh Beria

The EU-Horizon project CryoSCOPE, launched in February 2025, investigates the interplay between atmospheric, cryospheric, and hydrologic systems across varied landscapes, including the Swiss Alps, Finnish Lapland, Svalbard, and the Himalayas. A key focus in CryoSCOPE is to quantify hydrologic partitioning—how precipitation is distributed among streamflow, groundwater, and evapotranspiration—in snow-dominated environments. By integrating stable water isotope data in different hydrological fluxes, evapotranspiration measurements from mobile flux towers, and extensive hydrometeorological data, CryoSCOPE will quantify partitioning processes over seasonal and interannual scales. This presentation highlights a case study from Waldlabor, a forested site in Switzerland, demonstrating the observed seasonal hydrological partitioning patterns.

CryoSCOPE emphasizes expanding stable water isotope datasets in cold regions, enhancing insights into hydrologic dynamics in snow-dominated systems. These efforts aim to improve predictive models and support sustainable water resource management in globally relevant “cold spots”. By advancing understanding of water distribution and movement in cold environments, CryoSCOPE provides critical knowledge to inform water management and policy development in the face of climate change.

How to cite: Mungle, D., Floriancic, M., Molnar, P., and Beria, H.: CryoSCOPE: Quantifying hydrologic partitioning in snow-dominated landscapes, EGU General Assembly 2025, Vienna, Austria, 27 Apr–2 May 2025, EGU25-14397, https://doi.org/10.5194/egusphere-egu25-14397, 2025.

EGU25-14569 | ECS | Posters on site | HS10.10

Evapotranspiration partitioning using stable isotopes of O and H 

Pravesh Singh, Diravia Balan, Richa Ojha, Rajesh Srivastava, Shivam Tripathi, Saumyen Guha, Gopal Krishan, and ms Rao

Partitioning of evapotranspiration (ET) is a fundamental challenge in ecohydrological research, critical for advancing our understanding of the soil-plant-atmosphere continuum. This study investigates ET partitioning for spring wheat crops grown at an experimental plot at IIT Kanpur using the stable isotopes of oxygen and hydrogen. By exploiting the distinct isotopic signatures of evaporation (E) and transpiration (T), the contributions of these processes to total ET were quantified. The isotopic compositions of ET and E were determined using the Keeling plot and the Craig-Gordon model respectively, whereas the isotopic composition of the stem was taken as the isotopic composition of T. Sensitivity analysis was performed to identify and prioritize the accurate measurement of variables significantly influencing ET partitioning. Results indicated that the transpiration fraction in ET varied between 38% and 96%, depending on crop growth stage and water availability. A comparison of results from isotopic methods and hydrometric methods revealed good agreement on most days, with discrepancies on some days attributed to uncertainties in estimating key parameters such as temperature and relative humidity. To capture interannual variability, additional experiments were conducted in subsequent years, providing further insights into the dynamics of ET partitioning.  

How to cite: Singh, P., Balan, D., Ojha, R., Srivastava, R., Tripathi, S., Guha, S., Krishan, G., and Rao, M.: Evapotranspiration partitioning using stable isotopes of O and H, EGU General Assembly 2025, Vienna, Austria, 27 Apr–2 May 2025, EGU25-14569, https://doi.org/10.5194/egusphere-egu25-14569, 2025.

EGU25-16403 | ECS | Orals | HS10.10

Belowground niche partitioning and water uptake dynamics in temperate grasslands using stable isotopes 

Sepideh Golshani, Tomáš Hájek, Undine Schöllkopf, Johanna Harisson, Hassan Jafari, Barbora Rybová, Katja Tielbörger, and Maria Májeková

Belowground niche partitioning is a key mechanism for maintaining plant species diversity in grasslands. However, limited empirical data and precise methodologies restrict our understanding of plant belowground coexistence strategies. Here, we examined various scenarios of plant species niche overlap based on their water uptake depths. The study was conducted across 75 grassland plots within the Biodiversity Exploratories in three distinct German regions, using the natural abundance of oxygen stable isotopes (δ18O) to link the plant xylem water to its source depth in the soil (up to 50 cm). By applying plot-level and regional-level mixed model statistical methods, we first tested the accuracy of water uptake depth predictions of 25 species as one of the critical steps. These water uptake depth predictions were then used to calculate the overlap in resource uptake niches among single-species water uptake flexibility across regions, as well as different growth forms and root systems of species.

Our results demonstrate that water uptake depths strongly correlate with environmental factors such as soil type and the geographical gradient of the plots. Regional-level mixed models demonstrated higher accuracy, revealing similar variations in water uptake depths across regions and species compared to the plot-level approach, highlighting diverse water use strategies in grasslands. Furthermore, our niche overlap findings indicate that fibrous root systems generally show greater overlap than taproot systems. Additionally, the overlap calculations for single species across three regions showed diverse patterns, emphasizing the utility of stable isotopes in addressing various ecological questions. These findings enhance our understanding of belowground coexistence mechanisms and ecosystem dynamics, emphasizing the importance of precise measurement techniques in revealing the complex interactions that drive resource use in temperate grasslands.

How to cite: Golshani, S., Hájek, T., Schöllkopf, U., Harisson, J., Jafari, H., Rybová, B., Tielbörger, K., and Májeková, M.: Belowground niche partitioning and water uptake dynamics in temperate grasslands using stable isotopes, EGU General Assembly 2025, Vienna, Austria, 27 Apr–2 May 2025, EGU25-16403, https://doi.org/10.5194/egusphere-egu25-16403, 2025.

EGU25-17104 | ECS | Posters on site | HS10.10

The role of deep roots in enhancing drought tolerance and nutrient uptake in diverse species and genotypes of grasses 

Qiaoyan Li, Simon Fiil Svane, Olga Popovic, Georgios Statiris, and Kristian Thorup Kristensen

Deep roots play a vital role in water and nutrient uptake and supply to assist in higher tolerance of increasing drought events under current global climate change scenarios. However, few studies have been made under field conditions to identify the differences between species and genotypes of grasses in root traits, water use efficiency (WUE), and nutrient uptake under drought stress. Stable isotope applications have revolutionized our understanding of water and nutrient dynamics in root systems, offering precise insights into plant resource uptake. In this study, experiments with grasses were done in a large-scale semi-field root phenotyping facility (RadiMax) equipped with rainout shelters to simulate drought conditions. In five experiments from 2016 to 2023, we measured the variations of root traits related to rooting depth among grass species and genotypes. The RadiMax facility enables the observation of root growth in up to 600 lines of diverse species and genotypes, with 150 to 300 lines being utilized in various grass experiments. Root traits were observed through minirhizotrons to more than 2 m depth and were quantified using an AI-based image analysis system (RootPainter). The RadiMax facility also allows deep placement of stable isotopes (2H and 15N), to be used as tracers for deep uptake by the root system. In this study, stable isotopic labelling was used in three studies from 2019 to 2023, in combination with the natural enrichment of 13C as a drought stress indicator. In this way, direct root phenotyping through minirhizotrons was combined with deep root function phenotyping based on the stable isotope measurements. Our preliminary results indicate that deep rooting will benefit plants as it contributes to deep water uptake under drought conditions, which indicates that selecting deep root traits should be included in the breeding of grass cultivars, to develop more drought-resilient genotypes.

How to cite: Li, Q., Svane, S. F., Popovic, O., Statiris, G., and Kristensen, K. T.: The role of deep roots in enhancing drought tolerance and nutrient uptake in diverse species and genotypes of grasses, EGU General Assembly 2025, Vienna, Austria, 27 Apr–2 May 2025, EGU25-17104, https://doi.org/10.5194/egusphere-egu25-17104, 2025.

EGU25-17243 | ECS | Orals | HS10.10

Stable water isotope seasonality at the soil-vegetation interface in cold climate 

Filip Muhic, Pertti Ala-Aho, Matthias Sprenger, Kashif Noor, Jeffrey Welker, Björn Klöve, and Hannu Marttila

Mixing and transport mechanisms of water in unsaturated shallow soil govern the partition of infiltrating water into the plant available water in soil water storage and groundwater recharge and modify the distribution of soil solutes and contaminants in subsurface. Consequently, they play a major role in the regulation of eco-hydrological processes at the soil–vegetation–atmosphere continuum. In sub-arctic regions, where both current and predicted warming rates are highest, the water cycle is undergoing marked changes and a limited understanding of storage and movement of water in soil has been recognized as one of the biggest knowledge gaps in addressing this issue. Stable isotopes of water are frequently used to explore water fluxes at the soil-vegetation interface, as they have proved to be a potent tool for tracing the origin and variability of waters that occupy different soil and plant compartments. 
We used a combination of field experiments and surveys that utilize stable isotopes of water as both natural and artificial tracer to assess the main drivers of spatiotemporal variability of water fluxes at the soil-vegetation interface in a sub-arctic catchment. First, soil coring and xylem sampling campaign was performed to quantify the variability of soil water isotopes under different land covers and in different seasons, and further identify under which conditions is soil water isotopic composition reflected in the stem water. Afterwards, an irrigation experiment using deuterated water was carried out on a forested hilltop to understand how infiltrating water gets redistributed in subsurface and how sub-arctic forest till soil and vegetation respond to massive infiltration events. The studies were conducted at the Pallas catchment, located in Northern Finland.
We found that seasonal rainfall variation and late snowmelt events were clearly represented in forest till soils, while the water input signal was heavily attenuated in forested peatlands. However, the seasonal evolution of soil water pools was not reflected in tree stem dynamics. In addition, the main infiltration mechanisms in shallow till soil were delineated through an inspection of interplay between soil water fluxes of different mobility. We further observed how a large snowmelt event can cause an isotopic homogenization of all water fluxes at the soil–vegetation interface.
Our results highlight the unique role of snowmelt in replenishing and sustaining soil water storage and modifying isotope dynamics at the soil–vegetation interface.

How to cite: Muhic, F., Ala-Aho, P., Sprenger, M., Noor, K., Welker, J., Klöve, B., and Marttila, H.: Stable water isotope seasonality at the soil-vegetation interface in cold climate, EGU General Assembly 2025, Vienna, Austria, 27 Apr–2 May 2025, EGU25-17243, https://doi.org/10.5194/egusphere-egu25-17243, 2025.

EGU25-18327 | Posters on site | HS10.10

Testing a new method for extracting plant water for isotopic analysis 

Giulia Zuecco, Diego Todini-Zicavo, Elizabeth Joan Aarts, and Chiara Marchina

In ecohydrology, stable water isotopes (δ2H and δ18O) are valuable tools for investigating the water’s movement through the soil-plant-atmosphere continuum. Recent tracer-based studies using stable water isotopes showed that different methods for extracting water from plant tissues can return different isotopic compositions due to the presence of organic contaminants and because these methods extract different plant water domains. While Cryogenic Vacuum Distillation (CVD) is widely recognized as a standard method of plant water extraction for isotopic analysis, its indiscriminate water extraction has proven problematic. Various other techniques have been developed and tested for plant water extraction, such as direct vapour equilibration, mechanical squeezing and centrifugation. However, there remains a necessity to develop a cost and time efficient method to discriminately extract xylem water, which better represents the source waters used by plants for transpiration.

In this work, we evaluated the viability of Vacuum Extraction (VAC) - a method previously used in ecophysiology for chemical analysis - for the extraction of plant water for isotopic analysis. The specific objectives were to i) assess the likely influence of organic contaminants (glucose, fructose, sucrose, ethanol and methanol) in water samples extracted by VAC, ii) determine whether there is a significant difference in the isotopic signature of plant water extracted by VAC from lignified samples with and without bark, iii) compare the isotopic composition of plant water extracted by VAC and CVD.

The comparison tests were carried out in late March and early July 2024 on trees or shrubs of Cornus sanguinea, Carpinus orientalis, Prunus cerasifera, Photinia serratifolia, and Populus canadensis, located in a village close to Padua (Italy). In March, samples were taken from lignified twigs, and we prepared replicates with and without bark for extraction by VAC. In July, twig samples were collected for extraction by VAC and by CVD. Given the negligible presence of organic contaminants in VAC samples, we performed their isotopic analysis by laser spectroscopy. Conversely, CVD samples were analysed by isotope-ratio mass spectrometry.  

Our results showed no significant differences in the sugar levels of samples with and without bark, and no clear relation between the sugar content and the isotopic composition of plant water extracted by VAC. Additionally, when comparing CVD and VAC, the δ18O values were similar, but there were significant differences in the δ2H between the two methods, with VAC samples plotting significantly closer to the Local Meteoric Water Line compared to CVD samples. These first results indicate that VAC is a promising and effective method for the extraction of plant water for isotopic analysis. However, further tests should be performed for other species and under different environmental conditions.


Acknowledgements: This study was carried out within the Agritech National Research Center and received funding from the European Union Next-Generation EU (PIANO NAZIONALE DI RIPRESA E RESILIENZA (PNRR) – MISSIONE 4 COMPONENTE 2, INVESTIMENTO 1.4 – D.D. 1032 17/06/2022, CN00000022). This abstract reflects only the authors’ views and opinions, neither the European Union nor the European Commission can be considered responsible for them.


How to cite: Zuecco, G., Todini-Zicavo, D., Aarts, E. J., and Marchina, C.: Testing a new method for extracting plant water for isotopic analysis, EGU General Assembly 2025, Vienna, Austria, 27 Apr–2 May 2025, EGU25-18327, https://doi.org/10.5194/egusphere-egu25-18327, 2025.

EGU25-18736 | Orals | HS10.10 | Highlight

Exploring root water uptake of beech and spruce trees across Europe  

Marco Lehmann, Josie Geris, Daniele Penna, Youri Rothfuss, Ilja van Meerveld, and Katrin Meusburger

Ecohydrological studies aiming to understand patterns in root water uptake by trees based on plant and soil water isotope data are often confined to one or a few nearby locations. In this study, we took advantage of recently established pan-European hydrogen (δ2H) and oxygen (δ18O) isotope datasets (10.16904/envidat.542) to assess root water uptake depth for beech and spruce trees across Europe. For a subset of sites, δ17O data were available as well.

Our analysis revealed consistent isotopic enrichment in xylem water of spruce trees compared to beech trees across all mixed-species sites (N=13), suggesting that spruce predominantly used shallower soil water regardless of environmental conditions. Additionally, we observed isotopic enrichment in stem xylem water from spring to summer at most beech and spruce sites (N=32), suggesting both species relied on isotopically enriched summer precipitation. Interestingly, for a subset of sites (N=8), there was an inverse pattern, with isotopic depletion in summer, implying shifts to deeper soil water sources or uptake of shallow soil water that was isotopically depleted in summer compared to spring conditions.

To further explore these findings, we will visually and statistically examine them using isotope data from the soil (10–90 cm depth). We will analyze the role of climate (using gridded data), alongside site-, soil-, and tree-specific metadata to better understand the factors influencing the variation in root water uptake at the continental scale. Additionally, we will explore the potential of oxygen-17 excess to provide further insights into root water uptake dynamics.

How to cite: Lehmann, M., Geris, J., Penna, D., Rothfuss, Y., van Meerveld, I., and Meusburger, K.: Exploring root water uptake of beech and spruce trees across Europe , EGU General Assembly 2025, Vienna, Austria, 27 Apr–2 May 2025, EGU25-18736, https://doi.org/10.5194/egusphere-egu25-18736, 2025.

EGU25-1391 | ECS | Orals | HS10.3

Electromagnetic Induction as a means to assess the hydrological impact of rewetting agricultural fen peat sites 

David O Leary, Patrick Tuohy, Owen Fenton, Asaf Shnel, Hilary Pierce, Mark Healy, and Eve Daly

Globally, there is an increasing focus on the rehabilitation of organic soils currently under agricultural management, particularly modified peatlands which are significant net emitters of greenhouse gases. These carbon-rich landscapes have been extensively modified through drainage and agricultural intervention, transforming natural ecosystems into agricultural production systems.

Traditional land use practices have involved drainage to lower water tables, enabling agricultural productivity but simultaneously triggering significant carbon emissions. A potential approach for rehabilitation of these soils is "rewetting" - a strategic intervention aimed at restoring hydrological conditions closer to the soil's natural state. Rewetting offers a potential nature-based solution to reduce greenhouse gas emissions while simultaneously preserving these ecologically rich landscapes.

The primary objective of rewetting is to manage the water table to be, on average, within 30 cm of the surface throughout the year. This is conventionally achieved by infilling or damming open drainage channels that historically surrounded agricultural fields. However, a critical knowledge gap exists regarding the precise spatial extent and effectiveness of such rewetting efforts.

In Ireland, the ReWET project aims to contribute critical knowledge to emerging global strategies for peatland restoration and climate change mitigation on agriculturally altered peat soils sites. This is achieved by partial rewetting of several agricultural sites under various management practices, primarily cattle grazing, and subsequent monitoring of the impact of rewetting on several key indicators, such as water table depth.

Geophysical techniques offer promising methodological approaches to address the understanding of spatial extend of rewetting efforts. Electrical geophysical methods, which measure soil electrical conductivity, are particularly sensitive to water content and can provide detailed insights into subsurface moisture dynamics. Specifically, Electro-Magnetic Induction (EMI) surveys provide non-invasive, high-resolution mapping of subsurface electrical properties, which can correlate with soil moisture conditions.

In this study, EMI using a CMD Mini-Explorer 6L instrument was deployed several times on one ReWET site in Ireland, classified as a fen peat, to assess the hydrological modifications induced by rewetting interventions. Combining EMI measurements with advanced machine learning clustering, in-situ water table depth and soil moisture data, this study was able to identify the hydrological influence and extent of the rewetting, allowing for a quantitative assessment as to the efficacy of the rewetting operation.

Methodologically, this study demonstrates the utility of geophysical techniques in monitoring and evaluating field-scale hydrological interventions. The approach developed could be readily translated to other peatland restoration projects, providing a robust, non-destructive monitoring framework.

By quantifying the spatial and temporal dynamics of rewetting efforts, this research supports more precise, evidence-based approaches to peatland management. The insights generated are crucial for environmental managers, climate policy makers, and agricultural stakeholders seeking to balance productive land use with ecological conservation and carbon sequestration objectives.

How to cite: O Leary, D., Tuohy, P., Fenton, O., Shnel, A., Pierce, H., Healy, M., and Daly, E.: Electromagnetic Induction as a means to assess the hydrological impact of rewetting agricultural fen peat sites, EGU General Assembly 2025, Vienna, Austria, 27 Apr–2 May 2025, EGU25-1391, https://doi.org/10.5194/egusphere-egu25-1391, 2025.

EGU25-4497 | Orals | HS10.3

Carbon fluxes and In-Stream Metabolism in a High-Altitude Tropical Peatland Ecosystem of The Andes Mountains 

Diego Riveros-Iregui, Keridwen Whitmore, Ricardo Jaramillo, Amanda DelVecchia, and Esteban Suarez

The importance of rivers and streams to the global carbon cycle is well established, and increasingly. research has emphasized the role of in-stream metabolism on carbon transformation within aquatic environments. However, while stream metabolism studies are abundant in northern latitudes, research on tropical streams remains notably scarce. In this study, we characterized carbon fluxes into and out of a small stream in a tropical, peatland-rich ecosystem of the Andes mountains. We measured dissolved oxygen, carbon dioxide, and discharge every 15 minutes at 4 locations downstream of a large peatland. Measurements were collected semi-continuously for a period of 12 months. CO2evasion was both measured directly and estimated indirectly for comparison. We used continuous dissolved oxygen to estimate daily ecosystem respiration (ER) and gross primary production (GPP) throughout the study period using a Bayesian-based metabolism model. Our results unveiled both seasonal and event-driven patterns in carbon dynamics throughout the year. At the peatland outlet, the stream channel was strongly heterotrophic throughout the study period (GPP << ER), GPP averaged 0.1896 g O2 m-2 d-1, and ER averaged -1.862 g O2 m-2 d-1. ER and GPP were suppressed directly following high flow events, but ER rates rebounded to higher than pre-storm levels in the following days. Seasonally, rates of ER were highest during dry months of the year, but rates of GPP were lowest during the dry season. Aquatic CO2 concentrations were also elevated during the dry season, but discharge was much lower. As a result, we found the majority of CO2 was exported from the peatland during the wet season when hydrologic connectivity was highest. Taking together, our results provide much needed process understanding of carbon dynamics in understudied, high-elevation tropical catchments.

How to cite: Riveros-Iregui, D., Whitmore, K., Jaramillo, R., DelVecchia, A., and Suarez, E.: Carbon fluxes and In-Stream Metabolism in a High-Altitude Tropical Peatland Ecosystem of The Andes Mountains, EGU General Assembly 2025, Vienna, Austria, 27 Apr–2 May 2025, EGU25-4497, https://doi.org/10.5194/egusphere-egu25-4497, 2025.

EGU25-4514 | ECS | Posters on site | HS10.3

Defining thresholds to peat smouldering in the Peat Moisture Code using hydrological modelling  

Sophie Wilkinson, Gregory Verkaik, Paul Moore, Owen Sutton, and Mike Waddington

The Canadian Forest Fire Danger Rating System (CFFDRS), and in particular the Fire Weather Index System (FWI), are tools used widely across Canada and globally for assessing wildfire potential and predicting wildfire behaviour. While the FWI system has been readily utilized across a number of different forest stand types, the use of the FWI system to represent wildfire potential or behaviour in peatlands has been shown to be less effective, especially in the case of smouldering (flameless) peat fires. This is, in part, due to the wide variation in peat properties and hydrological responses to meteorological forcings between different peatland types and hydrogeological settings within the same region. To begin to address this issue the next generation CFFDRS has incorporated a Peat Moisture Code (PMC) that better represents the ecohydrological feedbacks controlling peatland water table and near-surface moisture responses to fire weather. This new code, however, will still require interpretation based on peatland characteristics to best understand the potential for peatland smouldering fires to initiate and propagate. Here we utilized Hydrus 1-D to model the hydrological response to a drying period across a large range of hypothetical peat property profiles to quantify peat smouldering thresholds and to test the robustness of the PMC. Using the same fire weather inputs used in Hydrus, we determined the daily PMC (and Drought Code) value throughout the drying period. Using the soil water tension and moisture content output by Hydrus and the bulk density with depth input into our Peat Smouldering and Ignition (PSI) model, which uses a thermodynamic approach to predict smouldering propagation, we determined the PMC values that corresponded to varying levels of peat smouldering potential (i.e., surface ignition, moderate smouldering depth, and extreme smouldering depth) across the range of peat profile types. Finally, we mapped typical peatland types onto the “phase space” of peat properties to develop a tool for fire management agencies to best interpret PMC values and the smouldering potential they represent in the various peatlands within their management areas.  

How to cite: Wilkinson, S., Verkaik, G., Moore, P., Sutton, O., and Waddington, M.: Defining thresholds to peat smouldering in the Peat Moisture Code using hydrological modelling , EGU General Assembly 2025, Vienna, Austria, 27 Apr–2 May 2025, EGU25-4514, https://doi.org/10.5194/egusphere-egu25-4514, 2025.

EGU25-4544 | ECS | Posters on site | HS10.3

Ecohydrological Controls on post-fire Sphagnum moss recovery in Boreal Shield peatlands 

Maia Moore, Paul Moore, Alex Furukawa, and Mike Waddington

Northern peatlands are critical carbon sinks, and wildfire is the largest disturbance within the Boreal ecozone. The return of a peatland to a carbon sink and the post disturbance resilience of peatlands depends greatly on the ecohydrological recovery and reestablishment of Sphagnum mosses.

We examined post-fire moss accumulation and moss moisture stress (soil water tension, soil moisture) in triplicate burned and unburned Boreal Shield Sphagnum dominated peatland types (shallow, deep peatland middle, and deep peatland margin). Additional climatological and geophysical measurements were taken to identify ecohydrological controls on post-fire Sphagnum recovery.

The soil water tension exceeded 100 mbar (an established physiological threshold for Sphagnum) when the water table was lost from the peat profile, which only occurred in the shallowest peatlands. We found no significant difference in the moss moisture stress between the burned and unburned landscapes 5-years post fire. Depth of burn, remnant post-fire soil depth, and post-fire soil accumulation did not show a significant relationship with soil water tension 5-years post fire. Rather, current peat depth best explained moss moisture stress in burned and unburned landscapes, suggesting a peat depth threshold, above which Sphagnum drought resilience increases. Our ongoing research seeks to identify the critical depth threshold for greater moss resilience in a natural, disturbed, and recovering environment through Hydrus-1D modelling with the aim to provide researchers and practitioners information to maximise peatland ecosystem recovery through post-fire restoration.

How to cite: Moore, M., Moore, P., Furukawa, A., and Waddington, M.: Ecohydrological Controls on post-fire Sphagnum moss recovery in Boreal Shield peatlands, EGU General Assembly 2025, Vienna, Austria, 27 Apr–2 May 2025, EGU25-4544, https://doi.org/10.5194/egusphere-egu25-4544, 2025.

EGU25-5116 | Orals | HS10.3

Hydrogeophysics reveals evidence for groundwater inputs influencing the hydrology and ecology of northern raised bogs 

Lee Slater, Henry Moore, Xavier Comas, Marty Briggs, Claus Holzapfel, Hadas Parag, Andrew Reeve, and Victoria Niedzinski

Northern raised peat bogs are usually assumed to be entirely precipitation-fed, implying that they lack groundwater inputs from underlying sediments. The development and persistence of patterned pools in raised bogs have historically been attributed to both surficial flow filling depressions along the peat surface, and subtle differences in peat pore water chemistry. In contrast, we find hydrogeophysical evidence that patterned pools in three northern peat bogs of Maine (USA) are partially fed by localized upwelling of minerogenous groundwater from underlying glacial sediments imaged using ground-penetrating radar. Paired point measurements of temperature and specific conductance (SpC) around numerous pools across the three raised bogs showed statistically significant relationships diagnostic of focused groundwater upwelling, despite hydraulic heads measured using nests of piezometers generally suggesting downward flow around pools. Drone-based thermal infrared (TIR) mapping, augmented by handheld TIR imaging, further indicated groundwater inputs into pools during cold and warm seasons. Surface water samples from upwelling zones showed elevated iron and manganese concentrations indicative of glacial aquifer sources.   Vegetation samples taken around two pools with contrasting groundwater inputs indicate that the composition of plant communities is associated with contrasting water chemistry. This supports the hypothesis that these inputs influence the vegetation within the raised bog ecosystem. Visual observations and information from shallow geophysics suggest that macropore, ‘peat pipe’ features might enhance vertical connectivity between groundwater and pools, and horizontal connectivity by connecting pools across the landscape.

How to cite: Slater, L., Moore, H., Comas, X., Briggs, M., Holzapfel, C., Parag, H., Reeve, A., and Niedzinski, V.: Hydrogeophysics reveals evidence for groundwater inputs influencing the hydrology and ecology of northern raised bogs, EGU General Assembly 2025, Vienna, Austria, 27 Apr–2 May 2025, EGU25-5116, https://doi.org/10.5194/egusphere-egu25-5116, 2025.

EGU25-5226 | Posters on site | HS10.3

Plants as indicators of hydrological quality in sedge-moss fen ecosystems 

Łukasz Kozub, Aleksandra Kukułka, and Mateusz Wilk

Mesotrophic sedge-moss-dominated fen ecosystems develop only under favourable hydrological conditions, the most important of which is stable groundwater discharge through permeable undecomposed peat layers. As a result of anthropogenic hydrological changes and landscape transformation, these ecosystem types, once widespread in temperate Europe, are now rare and conservation or restoration measures are required to maintain them. The success of conservation and restoration of these ecosystems is highly dependent on the ability to maintain or restore favourable hydrological regimes and soil properties. The assessment and monitoring of hydrological and soil habitat quality can be time consuming, costly and technically challenging. The concept of indicator species combines the ecological requirements of species with the possibility of using them as indicators of averaged, often long-term environmental conditions. However, selecting indicator species in a way that allows their widespread use is only possible if a sufficiently large and diverse dataset linking species occurrence with measured environmental conditions is available. In our study, we used vegetation data combined with hydrological and soil data collected from 46 plots within 23 fens located along a transect of more than 500 km across the northern part of Poland. On this basis, using the so-called Huisman-Olff-Fresco models, we selected species of vascular plants and bryophytes that could be indicators of stable groundwater discharge (low amplitude of water level fluctuations) and unchanged soil conditions (low bulk density of peat). The list of these species only partially overlaps with previously published lists of indicator species for sedge-moss fen vegetation known from the literature, and can be used for a rapid and inexpensive assessment of the degree of change in abiotic conditions within fen ecosystems.

How to cite: Kozub, Ł., Kukułka, A., and Wilk, M.: Plants as indicators of hydrological quality in sedge-moss fen ecosystems, EGU General Assembly 2025, Vienna, Austria, 27 Apr–2 May 2025, EGU25-5226, https://doi.org/10.5194/egusphere-egu25-5226, 2025.

EGU25-5298 | ECS | Posters on site | HS10.3

Effect of peat burn severity on peatland DOC concentration and DOM composition exported following wildfire 

Alexandra Clark, Colin McCarter, Alex Furukawa, Erik Emilson, and Mike Waddington

Climate change is increasing boreal biome drying, area-burned, wildfire intensity, and burn severity as evidenced by the unprecedented 2023 Canadian wildfire season (>15 Mha burned). Of particular concern in boreal wildfires are deep burning smouldering peat fires that can switch peatlands to net emitters of atmospheric carbon. Less studied are the effects of peat fires on water-borne carbon and the deleterious impacts on downstream water quality as the burned area recovers post-fire. To better understand the impacts of wildfires on northern peatlands, we investigated the effects of varying peat burn severities on the dissolved organic carbon (DOC) concentration and composition of dissolved organic matter (DOM) exported from peatlands located in Ontario's Boreal Shield ecozone. Using a paired peatlands approach with twelve peatlands of comparable size and catchment, runoff and water quality were measured within the footprint of the Parry Sound #33 wildfire (burned) and near Dinner Lake (unburned). Over three years (2021-2023), exported DOC concentrations decreased with increasing burn severity but the composition of DOM varied across burn severities. Spectral slope (SR), SUVA254, and humification index (HIX) were utilized to assess DOM composition. Lower HIX and higher SR values were observed indicating smaller, less humified DOM as burn severity increased. SUVA­254, however, showed no strong trends across burn severities suggesting that returning vegetation composition may have a strong control on DOM composition. Considering that climate change is increasing burn severity, the recovery of burned peatlands may play a large role in the export of DOC concentration and DOM composition post-wildfire.

How to cite: Clark, A., McCarter, C., Furukawa, A., Emilson, E., and Waddington, M.: Effect of peat burn severity on peatland DOC concentration and DOM composition exported following wildfire, EGU General Assembly 2025, Vienna, Austria, 27 Apr–2 May 2025, EGU25-5298, https://doi.org/10.5194/egusphere-egu25-5298, 2025.

EGU25-5657 | ECS | Posters on site | HS10.3

Soil shrinkage effects on variably saturated properties and thermal properties of peatland-dominated permafrost mires 

Radhakrishna Bangalore Lakshmiprasad, Thomas Graf, Edon Morina, Valentin Kühn, Stephan Peth, and Ullrich Dettmann

Soil shrinkage significantly alters hydraulic and thermal properties in peatland-dominated permafrost regions. This study examines the impact of shrinkage on soil water characteristic curves and thermal conductivity drying curves in Storflaket Mire, Sweden. Seven peat samples were collected at three depths close to the surface. The HYPROP and WP4C devices determined the soil water characteristic curve parameters. The HYPROP device is a transient evaporation experiment that measures soil water potential heads and corresponding volumetric water content. The WP4C measures the dry-range soil water potential and the corresponding volumetric water content. The VARIOS device was used to determine the thermal conductivity drying curves of the peat samples. The shrinkage effects were accounted for by measurements taken with a vernier caliper, followed by validation using a three-dimensional structured light scanner under air-dried conditions. 

The results from the hydrological experiments showed that shrinkage effects were most pronounced in the deepest layers. Comparing cases with and without shrinkage revealed a 40% reduction in volume under air-dried conditions. The hydraulic conductivity curves showed minimal changes between the cases with and without shrinkage, assuming that tortuosity remains constant with shrinkage. Including dry-range measurements was essential for a more reliable soil water characteristic curve representation. Shrinkage alongside dry-range measurements showed that the pore size distribution shifts from macropores (300–3000 μm) to micropores (3–30 μm), indicating reduced bimodality with depth. This change likely explains the higher matric potential in the deepest layers. The results from the thermal experiments revealed near-linear thermal conductivity drying curves, with dry surface peat exhibiting lower conductivity than saturated deeper layers. Empirical models based solely on volumetric water content outperformed traditional parameter-based models in predicting thermal conductivity.

How to cite: Bangalore Lakshmiprasad, R., Graf, T., Morina, E., Kühn, V., Peth, S., and Dettmann, U.: Soil shrinkage effects on variably saturated properties and thermal properties of peatland-dominated permafrost mires, EGU General Assembly 2025, Vienna, Austria, 27 Apr–2 May 2025, EGU25-5657, https://doi.org/10.5194/egusphere-egu25-5657, 2025.

EGU25-6103 | Orals | HS10.3

Local climate impacts from ongoing restoration of a peatland – the Onlanden Experiment 

Fred Worrall, Wiebe Borren, and Warner Reinink

We have shown that peatlands represent a cool humid island in their landscape context and that this cool humid island effect could be brought about by successful peatland restoration. However, it has been difficult to dis-entangle the controls on the direct climate impact of peatlands. Previous studies have been limited by a lack of pre-intervention data and the lack of significant target against which to test impact. The Onlanden, an area of peat south west of the city of Groningen, came under restoration management in 2012 when water tables were restored, but without active revegetation. The water table on the site was monitored before restoration and is ongoing and the area is . The direct climate impact of the restoration was assessed using remotely sensed land surface temperature, albedo and vegetation indices. Furthermore, the impact was modelled based upon a forced convection approach. The study can show that day time temperatures over the peatlands cooled relative to the surrounding land by up to 1.1 K (°C), but there was no significant change in night time temperatures. But there was a more dramatic change was observed for the peatlands the average amplitude of the diurnal temperature cycle decreased by upto 2.4 K (°C) over the period of the restoration.

The presence of an overall cooling effect means that a rising water table led to a lowering of the Bowen ratio. However, this result would suggest that open water would achieve an even greater cooling effect but would limit peatland development.

How to cite: Worrall, F., Borren, W., and Reinink, W.: Local climate impacts from ongoing restoration of a peatland – the Onlanden Experiment, EGU General Assembly 2025, Vienna, Austria, 27 Apr–2 May 2025, EGU25-6103, https://doi.org/10.5194/egusphere-egu25-6103, 2025.

EGU25-6329 | ECS | Orals | HS10.3

A Novel Method for Determining Vertical Hydraulic Properties of Peat Using Naturally Occurring Pressure Fluctuations 

Raul Paat, Argo Jõeleht, Grete Sabine Sarap, and Marko Kohv

Peatlands are an invaluable part of our landscapes. To evaluate their interactions with underlying groundwater systems, the hydraulic properties of peat must be understood. Traditional methods for assessing vertical hydraulic conductivity in deep, compacted peat layers face challenges due to low permeability and sample collection difficulties. We introduce a field-based approach to determine vertical hydraulic diffusivity using naturally occurring hydraulic pressure fluctuations. Measurements were conducted at two peatlands in northeastern Estonia, using pressure transducers installed at various depths to capture fluctuations influenced by atmospheric pressure changes.

The vertical hydraulic diffusivity was calculated analytically from the recorded pressure data and combined with laboratory-measured specific storage values to estimate vertical hydraulic conductivity. Results indicate that deeper fen peat layers exhibit hydraulic conductivity values comparable to previous in-situ measurements, demonstrating the method’s viability for assessing the hydraulic properties of low-permeability peat. The method was also applied to calculate the hydraulic properties of the upper, less decomposed portions of the peatland. However, its applicability in more conductive peat layers requires further testing.

This observational method offers a practical solution for measuring the hydraulic properties of deeper peat layers, providing a way for a holistic understanding of their hydrological functioning. It addresses scale-dependent effects associated with conventional field methods, providing critical data for broader-scale hydraulic modeling and peatland management decisions. Furthermore, this method enhances understanding of peatland vulnerability to anthropogenic and climatic influences, supporting the development of strategies to mitigate hydrological disturbances in these vital ecosystems.

How to cite: Paat, R., Jõeleht, A., Sarap, G. S., and Kohv, M.: A Novel Method for Determining Vertical Hydraulic Properties of Peat Using Naturally Occurring Pressure Fluctuations, EGU General Assembly 2025, Vienna, Austria, 27 Apr–2 May 2025, EGU25-6329, https://doi.org/10.5194/egusphere-egu25-6329, 2025.

EGU25-6425 | ECS | Orals | HS10.3

Mapping and monitoring peatland soil moisture using drone-borne Ground-Penetrating Radar 

Maud Henrion, Yanfei Li, Kaijun Wu, François Jonard, Sophie Opfergelt, Veerle Vanacker, Kristof Van Oost, and Sébastien Lambot

The moisture status of peatlands is an important factor as it directly affects carbon dynamics. Therefore, it is critical to characterize and understand peatland moisture status and to monitor its spatial and temporal variations. This study aims to evaluate the potential of drone-borne ground-penetrating radar (GPR) in combination with full-wave inversion to investigate the spatial and temporal variability of peatland root-zone moisture. A secondary objective is to assess its benefits for restoration applications. This study was carried out on a 4.5 ha peatland in the Belgian Hautes Fagnes which was previously degraded by forestry activities. Ground-penetrating radar measurements were conducted every 2 to 4 weeks for 17 months, resulting in 19 peatland soil moisture maps with a 5-meter resolution. Reference soil moisture data were collected using ground-based probes to enable comparison.

The temporal variability showed an overall correlation of 0.71 between the GPR and the ground-based probes, indicating that this method effectively captures overall moisture dynamics across the entire study site throughout different seasons. In contrast, the spatial comparison of GPR with the ground-based probes showed a lower correlation, namely 0.23, which is attributed to the high micro-variability of soil moisture (on centimeter to meter scales) and the spatial mismatch between the measurements and their characterization areas and depths. However, we show that the spatial data contained high information content when applying a spatial clustering analysis to produce maps of homogeneous moisture classes. These clusters aligned well with other specific site characteristics, such as peat depth and vegetation composition, and can be used to support the planning of restoration efforts. This study introduces a new approach to studying peatland root-zone moisture and shows potential to guide and monitor peatland restoration strategies.

How to cite: Henrion, M., Li, Y., Wu, K., Jonard, F., Opfergelt, S., Vanacker, V., Van Oost, K., and Lambot, S.: Mapping and monitoring peatland soil moisture using drone-borne Ground-Penetrating Radar, EGU General Assembly 2025, Vienna, Austria, 27 Apr–2 May 2025, EGU25-6425, https://doi.org/10.5194/egusphere-egu25-6425, 2025.

EGU25-6587 | ECS | Orals | HS10.3

Hydraulic Functions of Peat Across Types and Climate Zones 

Ji Qi, Sophia Weigt, Miaorun Wang, Fereidoun Rezanezhad, William Quinton, Dominik Zak, Sate Ahmad, Lingxiao Wang, Ying Zhao, Bernd Lennartz, and Haojie Liu

Abstract

The hydro-physical properties of peat play a pivotal role in regulating the water, nutrient, and carbon cycles of peatland ecosystems. Despite their importance and complexity, our understanding of peat hydraulic properties remains limited. In this study, we compiled a comprehensive global database of the peat physical, hydraulic, and chemical properties, including bulk density (BD), porosity, macroporosity, saturated hydraulic conductivity (Ks), carbon content, and carbon density, encompassing tropical peatlands, northern fens, northern bogs, and permafrost regions. Our primary objective was to examine how these properties vary along a BD gradient across different climate zones. The results revealed a robust linear relationship between carbon density and BD for peat types with carbon content exceeding 35% (R2> 0.92, p < 0.001), suggesting that these functions can serve as reliable tools for estimating the carbon stock of peatlands. However, the specific functions differed between peat types and climate zones. Total porosity was found to decrease linearly as BD increased, while macroporosity followed a power-law relationship with BD. These trends were consistent across all peat types, underscoring a strong and reliable association between BD and both total porosity and macroporosity. Additionally, Ks exhibited a general decline with increasing BD, with the relationship characterized by log-log functions that varied among peat types and climate zones. This indicates that Ks is significantly influenced by the peat-forming vegetation such as wood, sphagnum, sedge, and the prevailing climatic conditions of the peatland. This study demonstrated that the key peat hydro-physical-chemical parameters—including carbon density, porosity, macroporosity, and Ks can be reliably estimated using the BD, with relatively high coefficients of determination (R2 > 0.4), highlighting the critical importance of determining BD as a proxy for estimating other hydro-physical properties of peat when direct measurements are unavailable.

Keywords: peat; physical and hydraulic properties; bulk density; carbon density; saturated hydraulic conductivity, permafrost peatlands

Corresponding author: Haojie Liu (haojie.liu@uni-rostock.de)

Phone: +49 (381) 498 3193; Fax:  +49 (381) 498 3122

How to cite: Qi, J., Weigt, S., Wang, M., Rezanezhad, F., Quinton, W., Zak, D., Ahmad, S., Wang, L., Zhao, Y., Lennartz, B., and Liu, H.: Hydraulic Functions of Peat Across Types and Climate Zones, EGU General Assembly 2025, Vienna, Austria, 27 Apr–2 May 2025, EGU25-6587, https://doi.org/10.5194/egusphere-egu25-6587, 2025.

EGU25-6636 | ECS | Orals | HS10.3

Vegetation in the shadow of radiation: disentangling the cooling mechanism in a drained peatland ecosystem 

Vincent E. Flemming, Nicolas Behrens, and Mana Gharun

Peatland ecosystems play a critical role in climate regulation by storing carbon and modulating energy fluxes. During evapotranspiration, radiative energy is converted into latent heat, which cools the atmosphere. Ecosystem energy fluxes which are strongly influenced by climate conditions can be tightly coupled to CO2 fluxes through vegetation functioning. The relationship between carbon and energy fluxes in peatland ecosystems however remains relatively underexplored. Here we analyze eddy covariance measurements from a degraded raised bog in Amtsvenn-Hündfelder Moor (DE-Amv), located in North Rhine-Westphalia, Germany, to investigate the link between CO2 uptake, canopy conductance and energy fluxes. DE-Amv has been part of the Natura 2000 network since 2004, with its flora dominated by Calluna vulgaris (L.) Hull and Molinia caerulea (L.) Moench. The dataset covers the entire year of 2023. We used the data to (1) examine the seasonal cycles of radiative and turbulent energy fluxes, and (2) evaluate the relationship between CO2 uptake and energy fluxes. To investigate the ecophysiological drivers of latent heat flux (LE), we estimated canopy conductance (Gc) by inverting the Penman-Monteith equation and modelling a continuous time series of Gc over the study period.

Our results showed that the mean daily peaks of latent heat flux ranged from 8.5 W m⁻² to 215 W m⁻² in one year, with LE being strongly influenced by vegetation productivity (i.e., Gross Primary Productivity, GPP). Principal component analysis showed that GPP, vapor pressure deficit, and net radiation are the key drivers of LE dynamics (r > 0.85 for all variables). During the vegetation growing period (March to October) Gc ranged from a minimum daily value of 1.2 mm s-1 in spring and autumn, to a maximum daily value of 15 mm s-1 in August. While Gc was primarily driven by relative humidity during the colder months, it was mainly driven by net radiation from June to September, and it was not limited by VPD or soil moisture.

This study demonstrates how ecosystem eddy covariance flux measurements can quantify the stomatal regulation of energy fluxes in peatland ecosystems. By highlighting the strong coupling between energy and CO2 fluxes, we emphasize the importance of understanding how environmental factors, particularly atmospheric vapor pressure deficit (VPD) and soil moisture, constrain Gc. Such insights are vital for predicting the effects of drier climatic conditions on the cooling capacity of drained peatlands, where vegetation type and management significantly influence their cooling potential.

How to cite: Flemming, V. E., Behrens, N., and Gharun, M.: Vegetation in the shadow of radiation: disentangling the cooling mechanism in a drained peatland ecosystem, EGU General Assembly 2025, Vienna, Austria, 27 Apr–2 May 2025, EGU25-6636, https://doi.org/10.5194/egusphere-egu25-6636, 2025.

EGU25-7035 | ECS | Orals | HS10.3

Empirical analyses of the hydrological influence of a riparian wetland in the Montmorency Forest, Quebec, Canada 

Marc-André Bourgault, Yalynka Strach, and François Anctil

Riparian wetlands are strongly connected to water bodies and their capacity to provide hydrological services varies greatly over time. A better understanding of the temporal variability of this connectivity is necessary to improve our knowledge of how and when wetlands can influence floods. This work aims to empirically quantify the influence of a riparian wetland on floods in a small watershed located in the Montmorency Forest, Québec, Canada. To this end, 15-minute hydrometric data were retrieved from three Quebec government stations: one located upstream of a riparian wetland, one located downstream, and one located nearby in a control watershed with similar physical characteristics to the other two. With these data, a total of 229 flood events were identified between 1996 and 2022. The maximum flows for each event and the timing of each flood peak were isolated. Peak flow reductions and delays between the arrival of the flood peak for each flood event and between all catchments were calculated. Pre-flood flow, flood volume, total precipitation causing the flood, average water temperature during the flood and water level within the riparian wetland were used to explain the peak flow reduction patterns. The results show that the wetland reduces peak flow by a median of 27 % with a maximum reduction of 66 %. However, for some events there is an increase in peak flow after passing through the wetland. Delays in the arrival of the flood peak show a median of 135 minutes with a maximum value of 1300 minutes. Hysteresis patterns were observed between the river flow measured downstream of the riparian wetland and the water level measured in the wetland, indicating that the previous wetness of the riparian wetland influences the peak flow reduction capacity of the riparian wetland. Further hydrological and biogeochemical monitoring will be carried out at this site and will be used to improve our understanding of hydrological and biogeochemical processes in riparian wetlands, which are still poorly understood. Any future results will be compared with results from several sites in the Saint-Lawrence Lowlands, Québec, Canada, where an integrated wetland water and carbon cycle monitoring program is currently underway.

How to cite: Bourgault, M.-A., Strach, Y., and Anctil, F.: Empirical analyses of the hydrological influence of a riparian wetland in the Montmorency Forest, Quebec, Canada, EGU General Assembly 2025, Vienna, Austria, 27 Apr–2 May 2025, EGU25-7035, https://doi.org/10.5194/egusphere-egu25-7035, 2025.

EGU25-7081 | ECS | Posters on site | HS10.3

Water storage dynamics of boreal shield peatlands: Implications for runoff and peat formation 

Alex Furukawa, Mike Waddington, and Paul Moore

Northern peatlands are globally significant carbon stores that serve a number of hydrological, ecological and biogeochemical functions on the landscape, in close association with their water table (WT) position. While generally considered resilient to disturbance, thanks to autogenic feedbacks that regulate the WT, previous work suggests that not all peatlands are equal in this regard. That is, this ecohydrological resilience may vary with peatland depth and catchment size. There appear to be thresholds of peat depth, after which there are significant shifts in resilience, including the susceptibility of the WT falling below the peat profile and greater depths of burn from wildfire.


We investigated the role of factors at the peatland to catchment scale on WT behaviour across a continuum of peatland and catchment sizes on the Boreal Shield. While the mean WT depth was not associated with any such factors, WT variability was greater in shallower peatlands, with the effect more pronounced during seasonal moisture deficit. On the other hand, the role of catchment and topographic position was more seasonally variable. With respect to hydrological functions of storage and runoff, deeper peatlands always maintained their saturated zone and were generally more ‘filled’, leading to greater hydrological connectivity. While the WT in deeper peatlands more closely followed seasonal moisture deficits and surpluses (i.e., precipitation less potential evapotranspiration; P-PET), shallow peatlands experienced greater WT drawdown rates during drying events. This research contributes to a growing body of work supporting the importance of peat depth to ecohydrological resilience, and identifying the thresholds at which peatlands may accumulate sufficient peat thickness and feedbacks for long-term persistence.

How to cite: Furukawa, A., Waddington, M., and Moore, P.: Water storage dynamics of boreal shield peatlands: Implications for runoff and peat formation, EGU General Assembly 2025, Vienna, Austria, 27 Apr–2 May 2025, EGU25-7081, https://doi.org/10.5194/egusphere-egu25-7081, 2025.

EGU25-7267 | Posters on site | HS10.3

Underreported CO2 emissions in an oil palm plantation on tropical peat in Malaysia 

Monique Y. Leclerc and Gengsheng Zhang

Tropical peats are large contributors to greenhouse gas emissions and differ markedly from their counterparts at temperate latitudes. The rapid deforestation and subsequent land conversion of tropical virgin forests in Southeast Asia have been decried by environmental groups worldwide even though there is little robust scientific evidence to ascertain the net amount of greenhouse gas released to the atmosphere. Owing to the lucrative seed oil production, the conversion to oil palm plantations at a large scale further exacerbates the situation. This paper shows CO2 emissions in a converted oil palm plantation grown on tropical peat in northeast Malaysia. It discusses the various factors impacting the emissions including the wide range of tropical peat characteristics and the variability in the monsoon season. Robust eddy-covariance data show that during the Monsoon season, monthly mean carbon emission rate has 73-85 tons CO2 ha-1 yr-1 while during the dry season, monthly mean carbon emission rate arrives at 98-133 tons CO2 ha-1 yr-1.  

How to cite: Leclerc, M. Y. and Zhang, G.: Underreported CO2 emissions in an oil palm plantation on tropical peat in Malaysia, EGU General Assembly 2025, Vienna, Austria, 27 Apr–2 May 2025, EGU25-7267, https://doi.org/10.5194/egusphere-egu25-7267, 2025.

EGU25-8565 | ECS | Posters on site | HS10.3

Effects of rewetting on the evaporation of peatland meadows in the Netherlands 

Veronique Boon, Alexander Buzacott, Merit van den Berg, Laurent Bataille, Jim Boonman, Bart Kruijt, and Ype van der Velde

Decomposition of peat, caused by drainage to support agricultural activity on the land, results in land subsidence and high greenhouse gas (GHG) emissions. To reduce emissions and subsidence in the Netherlands, and mitigate climate change, rewetting of peatlands by raising groundwater tables is seen as the most effective and straightforward measure. The Dutch National Research Program on Greenhouse Gas Emissions from Peatlands (NOBV) was initiated to quantify the effects of rewetting measures on GHG emissions. However, the effects of higher water tables on water usage through evaporation remain unexplored. Freshwater shortages in summer are an already occurring problem and increased evaporation of peatlands due to rewetting potentially further increases this problem.

This study aims to quantify the increase in evaporation under wetter conditions on peatland meadows in the Netherlands. We have built a dataset with both evaporation and water table depth data, measured on five different  Dutch peat meadows in the years 2020-2024. Both transparent automated flux chambers and eddy covariance measurements are used to establish the water flux. Water management practices, and consequently water table depth, varied between sites. As a result, the direct effects of a higher water table on the amount of evaporation can be studied.

First results suggest that higher groundwater tables on peatland meadows lead to higher evaporation. Looking at yearly averages, evaporation increased with 5.9 ± 2.5% for every 10 cm water level increase. This indicates that rewetting substantially increases the water use of peatlands.

How to cite: Boon, V., Buzacott, A., van den Berg, M., Bataille, L., Boonman, J., Kruijt, B., and van der Velde, Y.: Effects of rewetting on the evaporation of peatland meadows in the Netherlands, EGU General Assembly 2025, Vienna, Austria, 27 Apr–2 May 2025, EGU25-8565, https://doi.org/10.5194/egusphere-egu25-8565, 2025.

EGU25-9312 | ECS | Orals | HS10.3

Examining the relationship between rainfall and water table position in grassland peat soils 

Hilary Pierce, David O'Leary, Eve Daly, Owen Fenton, Asaf Shnel, Mark Healy, and Patrick Tuohy

The artificial drainage of carbon-rich peat soils is a common practice to increase agronomic production on waterlogged lands but may lead to the release of carbon dioxide to the atmosphere. In Ireland, there are an estimated 300-350,000 ha of permanent grassland on peat soils, with varying degrees of drainage. 80,000 ha of these grassland peat soils are targeted in the Irish National Climate Action Plan for reduced management intensity which involves manipulating the water table by removing and blocking existing artificial drainage features. This process is often referred to as ‘active water table management’ or ‘rewetting’.

Actively managing the water table in grassland peat soils is an important tool to reach EU climate neutrality goals by 2050 because the water table position dictates the carbon storage dynamics of the soils. Research shows that raising the water table in these grassland peat soils by 10 cm can reduce overall greenhouse gas emissions from them. However, to achieve this, the impact that peat soil formation and subsequent anthropogenic activities (e.g., drainage and peat extraction) has had on the hydrology of these lands must be better understood.

The Irish Department of Agriculture, Food and the Marine-funded project, ReWET, aims to provide a deeper understanding of the hydrologic impacts of active water table management on grassland peat soils. An objective of this project is to investigate rainfall and water table relationships at agricultural grassland sites on peat soils to: (1) compare these relationships within and across peat classification types, and (2) determine field scale hydrological patterns that can be used to aid in the classification of these and other sites into fen or raised bog peat types to establish future restoration potential. For this study, six field sites on grassland farms were selected and classified into peatland type based on their soil characteristics. The sites were instrumented with rainfall gauges and dipwells with pressure sensors to record the water table position every 15 minutes and were monitored from September 2023 through August 2024.

Results from this study show that hydrologic differences between and within peat classification types exist. For each site the annual average water table depth demonstrated that peat soil type has an impact on the drainage depth and that fen peat sites were more deeply drained than raised bog sites despite similar surface drain design. Rainfall event-based analysis allowed the sites to be compared based on total rainfall depth, water table rise, lag time from the start of an event to the highest water table position and calculated specific yield. The event-based analysis was also used to correlate water table rise with rainfall at each site and for each peat classification type. It was found that, overall, the fen sites exhibited a stronger correlation between water table rise and rainfall than the raised bog sites. The fen sites also had larger average water table fluctuations, longer average lag times and smaller average calculated specific yields during events than the raised bog sites.

How to cite: Pierce, H., O'Leary, D., Daly, E., Fenton, O., Shnel, A., Healy, M., and Tuohy, P.: Examining the relationship between rainfall and water table position in grassland peat soils, EGU General Assembly 2025, Vienna, Austria, 27 Apr–2 May 2025, EGU25-9312, https://doi.org/10.5194/egusphere-egu25-9312, 2025.

EGU25-10511 | ECS | Orals | HS10.3

A MODFLOW Field-scale Model to Estimate Ditch Blocking Impact on Peat Water Table 

Muhammad Malik Ar Rahiem, Bärbel Tiemeyer, Merten Minke, Ullrich Dettmann, Heinrich Höper, and Arndt Piayda

Drainage is the main cause of a lower water table in peatlands, resulting in high greenhouse gas emissions. To combat this issue, the water table in peatlands must be raised, one most obvious way is by elevating the water level on the ditches. This practice has been implemented in many countries with extensive peatlands, such as Germany, Finland, Indonesia, Malaysia, etc. One question arises: how much is the water table raised in the peatland body after ditch water table was elevated?

To estimate the impact of elevating the water table in ditches on the field water table, we developed a field-scale model using MODFLOW6 in Python with the FloPy package. A physically-based model was chosen to account for different physical properties of peat and the underlying sediment layer, as well as topography and climate settings. The model was tested on a fen grassland field underlain by a highly porous sand layer in Gnarrenburger Moor, Northwest Germany. We used nationally available datasets as input, including elevation (DEM with 5m resolution), precipitation, and evapotranspiration data. The field size is 550m x 55m, bordered by ditches on all sides, and was dammed on two sides. A daily transient simulation was performed for 1,023 days from November 2020 to August 2023, and the model was calibrated using observational data.

The calibrated model results show an RMSE of 10 cm and a bias of 3 cm compared to observed water levels. We assessed the impact of ditch blocking by creating scenarios with and without ditch blocking. We found that by raising the water table in the ditches by an average of 31 cm (November 2021 – August 2022) and 30 cm (November 2022 – August 2023), the water table at the observation point was raised by 7 cm and 11 cm, respectively. For the entire field, the model estimate average water table raise by 20 cm (from -50 cm to -30 cm) and 23 cm (from -46 cm to -23 cm). If we only consider water table to calculate CO2 emission, this corresponds to CO2 emission reductions of 5.21 tCO2 ha-1yr-1 and 12 tCO2 ha-1yr-1. Sensitivity analysis, conducted by adjusting calibrated parameters by ±5%, shows that the ditch water table is the most important factor influencing the field water table.

MODFLOW only considers saturated flow, thus minimizing the requirement for parameters. This model requires only saturated hydraulic conductivity (vertical and horizontal), specific yield, riverbed conductivity, and initial head for transient simulation. In this study, all parameters were unknown and therefore optimized. Despite this simplification, the model successfully simulates the observed water table.

The model was developed solely in a Python environment, utilizing open-source software and nationally available data, making it transferable to other sites with minimal modification. The intention is to apply the model to more rewetted agricultural peatland sites in Germany, as raising the water table in peatland drainage has become a Federal Government program.

How to cite: Ar Rahiem, M. M., Tiemeyer, B., Minke, M., Dettmann, U., Höper, H., and Piayda, A.: A MODFLOW Field-scale Model to Estimate Ditch Blocking Impact on Peat Water Table, EGU General Assembly 2025, Vienna, Austria, 27 Apr–2 May 2025, EGU25-10511, https://doi.org/10.5194/egusphere-egu25-10511, 2025.

EGU25-10961 | Orals | HS10.3

Modelling hydrological responses of a peatland to disturbance by geologic exploration 

Maryam Bayatvarkeshi, Maria Strack, and Scott Ketcheson

The slow recovery of trees in peatlands disturbed by linear clearings that arise from geologic exploration, also known as seismic lines, has spurred scholarly investigation into the underlying factors. The effect of tree canopy removal on the line on local water balance is one of the unanswered questions in past studies. Hence, this study aimed to provide insights into the impact of seismic lines on water balance components using CoupModel. Simulated values were compared with field measurements from a seismic line located in Fort McMurray, Alberta, Canada. The simulations indicated an increase in precipitation, soil moisture and temperature, and snow depth on the seismic line compared to undisturbed conditions with results aligned with the field measurements. Simulations also showed that the snow density on the seismic line was 4.6 % higher than the adjacent natural area (herein referred to as offline). Furthermore, the predicted shallower groundwater depth on the line was consistent with the observations. Although simulated net radiation off the line was higher than on the line, the actual evapotranspiration (AET) on the line was 8.3% higher than off the line. It was also found that evaporation from moss is the dominant component of the AET from the seismic line and adjacent natural area. However, greater precipitation inputs due to reduced interception outweighed the high AET on the seismic line, so that the seismic line had higher water storage than off the line by 38%. Sensitivity indicated the importance of site location (i.e., latitude), soil physical properties, and leaf area index parameters in simulations.  As a consequence, the initial model of water balance necessitates future researchers to explore the impact of different seismic lines, particularly at the catchment scale, to better understand the cumulative impact of these disturbances on water balance in boreal ecosystems. 

How to cite: Bayatvarkeshi, M., Strack, M., and Ketcheson, S.: Modelling hydrological responses of a peatland to disturbance by geologic exploration, EGU General Assembly 2025, Vienna, Austria, 27 Apr–2 May 2025, EGU25-10961, https://doi.org/10.5194/egusphere-egu25-10961, 2025.

EGU25-12288 | Posters on site | HS10.3

The importance of subsoil groundwater table measurement in peatlands 

Lukas Vlcek, Jiri Kocum, and Vaclav Sipek

This study investigates groundwater table fluctuations within selected montane peat bogs in Czechia, focusing on their hydrological processes and the role of deeper subsoil aquifers beneath the peaty soil horizon. Montane peat bogs, such as those in the Šumava Mountains, are critical landscape components due to their role in carbon sequestration and as unique ecosystems supporting many species. While previous research often relies on near-surface groundwater table measurements, this study highlights the importance of subsoil water sources and their contribution to the hydrological dynamics of ombrotrophic peat bogs. Subsoil aquifers can significantly influence vertical water movement, including percolation and evaporation, whereas their absence may accelerate fluctuations in the near-surface water table.

The research also explores the implications of well penetration, perforation depth, and the connectivity of more permeable layers beneath the peat soil profile. Using manual and automatic measurements taken across various locations within the peat bog, the study provides a detailed analysis of vertical groundwater fluctuations, demonstrating notable variability across different vegetation covers and peat layers. These findings contribute to a deeper understanding of the hydrological function of peat bogs, offering insights into the interactions between rainfall events, groundwater behavior, and runoff response.

The study emphasizes the essential role of montane peat bogs in maintaining hydrological balance in the context of climate change. The insights gained are particularly relevant for peatland restoration efforts and climate adaptation strategies, as they underline the need for a comprehensive approach to groundwater monitoring that includes subsoil aquifer dynamics.

This research was supported by the GACR project 23-06859K.

How to cite: Vlcek, L., Kocum, J., and Sipek, V.: The importance of subsoil groundwater table measurement in peatlands, EGU General Assembly 2025, Vienna, Austria, 27 Apr–2 May 2025, EGU25-12288, https://doi.org/10.5194/egusphere-egu25-12288, 2025.

EGU25-12415 | ECS | Orals | HS10.3

From Peatlands to Boreal Lakes: Fill-and-Spill Hydrology and Dissolved Organic Carbon (DOC) Transport in the Headwaters of the Hudson Bay Lowlands, Canada 

Nicole Balliston, Grace Cullinane, Sarah Finkelstein, Alessia Guzzi, Julia Hathaway, Zou Zou Kuzyk, Keilan Ledger, Tim Papakyriakou, Maria Strack, Marianne Vogel, and Alex Litvinov

The boreal peatlands of the northern Canadian Shield in Ontario, Canada, serve as headwater systems for the Hudson Bay Lowlands (HBL), the third-largest peatland complex globally and a critical carbon reservoir. This landscape—shaped by a heterogeneous mix of exposed bedrock outcrops and low-conductivity glacio-marine sediments—comprises a mosaic of treed peatlands, post-glacial lakes, and river systems, which play a key role in regulating water and carbon fluxes to downstream ecosystems. Despite their importance, the hydrological connectivity of these peatlands and their role in dissolved organic carbon (DOC) transport remain poorly understood, especially in the context of changing hydrological conditions.

This study investigates the hydrological and DOC dynamics along two 400 m flowpaths that originate in peatlands and terminate at Tomorrow Lake (49°55'2"N, 80°41'59"W), a 2.5 km² post-glacial lake draining into the North French River watershed. In June 2024, five monitoring nests were installed along each transect, equipped with porewater sippers (30 and 50 cm below ground surface) and screened pipes at depths of 75, 100, 150, and 200 cm. Continuous water table data were logged, and DOC concentrations were measured during June, August, and September 2024. A meteorological station, installed in August, captured local hydrological inputs and outputs, providing a detailed view of seasonal variability.

Results reveal a complex “fill-and-spill” hydrological connectivity at the flowpath outlets, driven by variations in topography. In the steeper transect, water tables dropped sharply from <30 cm below ground surface (bgs) at the peatland center to >150 cm bgs at the lake interface, entering the underlying low-conductivity mineral soil. This suggests slow, diffuse subsurface flow as the dominant transport mechanism. Average DOC concentrations correspondingly declined from 33 mg/L in the peatland center to 19 mg/L at the lake edge, aligning closely with average lake outflow concentrations (16 mg/L) and indicating potential carbon filtration through the mineral soil. By contrast, in the flatter transect, water tables remained elevated near the lake interface (<30 cm bgs), and a pipe-like surficial flow point was observed at the outlet in June transporting disproportionately large volumes of water—up to five orders of magnitude greater than subsurface flow—while maintaining elevated DOC concentrations (35–40 mg/L). DOC concentrations at the outflow remained high throughout the summer. However, the discharge rate progressively declined as the water table levels receded, almost ceasing entirely by September.

DOC concentrations in Tomorrow Lake are comparable the median annual concentration in downgradient North French River (~19 mg/L) the larger Moose River that this watershed supports (~16 mg/L), suggesting high connectivity within this landscape. These findings underscore the need to evaluate hydrological and biogeochemical processes holistically, integrating headwater and downstream dynamics, while considering seasonal and interannual variability to better understand contemporary carbon transport, transformation, and the anticipated responses of these systems to climate warming.

How to cite: Balliston, N., Cullinane, G., Finkelstein, S., Guzzi, A., Hathaway, J., Kuzyk, Z. Z., Ledger, K., Papakyriakou, T., Strack, M., Vogel, M., and Litvinov, A.: From Peatlands to Boreal Lakes: Fill-and-Spill Hydrology and Dissolved Organic Carbon (DOC) Transport in the Headwaters of the Hudson Bay Lowlands, Canada, EGU General Assembly 2025, Vienna, Austria, 27 Apr–2 May 2025, EGU25-12415, https://doi.org/10.5194/egusphere-egu25-12415, 2025.

EGU25-13740 | ECS | Posters on site | HS10.3

Groundwater modelling for supporting sustainable water management to avoid water usage conflict in Lanoraie peatland (Quebec, Canada) 

Emmanuel Dubois, Marie Larocque, Julien Chene, and Jonathan Chabot-Grégoire

Wetlands, particularly peatlands, have historically been used for agricultural production, as exemplified by the Lanoraie peatland complex in the St. Lawrence Valley (Quebec, Canada). In this region, unlined artificial ponds located at the interface between the peat and the surrounding sandy substrate are used for agricultural irrigation. However, low water levels in these ponds, as well as in neighboring rivers, have led to irrigation deficits, especially during summer low-flow periods when water demand is at its peak. This situation poses the risk of water use conflicts and draining the peatland could irreversibly harm its ecological functions. A recent project assessed the impact of agricultural ponds on the hydrology of the peatland-river-aquifer system to support sustainable water management. A comprehensive monitoring program has successfully collected essential environmental data, including information on geology, river flows, and groundwater levels. Using these data, a groundwater flow model was developed for a small area of the peatland complex. The results showed that pumping from the ponds could partially dewater the peatland, thereby endangering its ecological integrity. Building on these findings, a new project aims to evaluate the hydrological and hydrogeological dynamics of the peatland, to assess the impacts of vegetation, water use, and climate changes on its hydrology, to develop indicators to guide sustainable water allocation, and to explore potential Nature-based solutions to mitigate the effects of pumping. Methodological advancements are planned to develop a modelling framework allowing to incorporate the impact of peatland afforestation while accounting for the high sensitivity of peat deposits to groundwater level fluctuations. The knowledge generated will directly support integrated water resource management in the region.

How to cite: Dubois, E., Larocque, M., Chene, J., and Chabot-Grégoire, J.: Groundwater modelling for supporting sustainable water management to avoid water usage conflict in Lanoraie peatland (Quebec, Canada), EGU General Assembly 2025, Vienna, Austria, 27 Apr–2 May 2025, EGU25-13740, https://doi.org/10.5194/egusphere-egu25-13740, 2025.

EGU25-13948 | Orals | HS10.3 | Highlight

Quantifying Peatland Ecohydrological Resilience to Drought and Wildfire by Thinking Outside the Bog  

James Michael Waddington, Paul Moore, Owen Sutton, Alex Furukawa, Maia Moore, Greg Verkaik, Brandon Van Huizen, and Sophie Wilkinson

Peatlands are globally important long-term sinks of carbon, however there is concern that climate change-mediated drought will weaken their carbon sink function due to enhanced decomposition and moss moisture stress. Furthermore, heightened drought will also increase peat combustion loss during wildfire leading to peatland degradation and a potential ecosystem regime shift. Despite research developments on ecohydrological tipping points in semi-arid ecosystems, research in peatlands on the wet end of the ecosystem continuum has been “bogged down” (pun fully intended) by the traditional conceptual models of peatland hydrology and ecology. The consequences of this thinking loom large, given that northern peatlands face increases in the severity, areal extent, and frequency of climate-mediated (e.g., wildfire, drought) and land-use (e.g., drainage, flooding, and mining) disturbances, placing the future integrity of these critical ecosystem services in jeopardy.

In this presentation we explore the need for “thinking outside the bog” to quantify the ecohydrological tipping points to drought and wildfire. We argue that peatland ecohydrological resilience is a non-linear function of water storage dynamics and that water table data or peat moisture data alone are insufficient to capture this hydrological complexity. Given that the ability of Sphagnum moss to resist drought is largely a function of the rate of water loss by evaporation, the rate of upward water supply from the water table, and the water storage properties of the peat matrix, we suggest that ecohydrological resilience can be quantified by the magnitude and duration of the disconnect between the water table and near-surface peat. We discuss ways to measure ecohydrological resilience and explore simple metrics that reveal when critical tipping points have been exceeded and the implications this has for carbon storage and fluxes.

How to cite: Waddington, J. M., Moore, P., Sutton, O., Furukawa, A., Moore, M., Verkaik, G., Van Huizen, B., and Wilkinson, S.: Quantifying Peatland Ecohydrological Resilience to Drought and Wildfire by Thinking Outside the Bog , EGU General Assembly 2025, Vienna, Austria, 27 Apr–2 May 2025, EGU25-13948, https://doi.org/10.5194/egusphere-egu25-13948, 2025.

EGU25-14974 | Posters on site | HS10.3

Simple approach for groundwater level modelling for wetland restoration planning 

Andis Kalvāns, Konrāds Popovs, and Aija Dēliņa

The restoration and stabilization of the hydrological regime is essential part in the peatland restoration for climate change mitigation – reduction of greenhouse gas emissions. Essential parameter to evaluate the success of the restoration is the median water table depth. It can be derived from hydrological modelling, but fully coupled modelling is complex and time consuming. Here we report on a simplified approach to simulate the likely outcomes of the hydrological restoration of a temperate floodplain wetland in Latvia, Norther Europe. We subdivided the model territory into 10 m size gird cels and apply a one-dimensional water balance model with daily time step for each of the cells. The model was forced by precipitation and evapotranspiration data derived from ERA5-land reanalysis and river water level from nearby gauging station. The groundwater filtration to the nearest ditch was calculated from water table gradient, assuming stationary conditions and using the water table as input from the previous model time step. The simple model can reasonably accommodate surface water pooling as well as timing of minimum and maximum water levels. In comparison to two-year period the model RMSE was 0.13 to 0.17 m while MSD -0.08 to 0.07 m. The simple approach can provide reasonable forecasts of management scenarios for restoration planning and carbon farming projects, without the need for fully coupled hydrological modelling.

How to cite: Kalvāns, A., Popovs, K., and Dēliņa, A.: Simple approach for groundwater level modelling for wetland restoration planning, EGU General Assembly 2025, Vienna, Austria, 27 Apr–2 May 2025, EGU25-14974, https://doi.org/10.5194/egusphere-egu25-14974, 2025.

EGU25-15948 | Posters on site | HS10.3

Advancing peatland water level monitoring by combining Sentinel-1, Sentinel-2, and peat-specific SMAP Level-4 data 

Michel Bechtold, Kevin Tansey, Harika Ankathi, Gerardo Lopez Saldana, Yara Al Sarrouh, Iuliia Burdun, Lucas Boeykens, Ullrich Dettmann, Fred Worrall, and Gabrielle De Lannoy

Peatlands are global hot spots of soil organic carbon, regionally important regulators of the water cycle, and provide several more critical ecosystem services. However, monitoring peatland hydrology remains challenging due to the complex surface properties and hydrodynamics in these areas. This study presents the development of a peatland water level product by integrating Sentinel-1 synthetic aperture radar, Sentinel-2 optical imagery, and the Soil Moisture Active Passive (SMAP) Level-4 (L4) product to advance the monitoring of peatland hydrology at high spatial resolution.

Our approach downscales the 9 km SMAP L4 product, which includes a specialized model parameterized for peatland processes, to 100 m using Sentinel-1 and Sentinel-2, addressing the spatial variability of peatland hydrology. SMAP L4 aids in resolving ambiguities in backscatter-to-water level relationships from Sentinel-1, distinguishing between subsurface and surface water level fluctuations. Additionally, the Normalized Difference Water Index (NDWI) and the optical trapezoid model (OPTRAM), derived from Sentinel-2, contribute to resolving ambiguities of the Sentinel-1 backscatter dynamics and to enhance the accuracy of water level estimates. NDWI assists in the identification of open water surfaces while OPTRAM mainly adds information on the interannual water level anomalies. Our product is provided with retrieval uncertainty estimates for each pixel.

We present the validation of our product across boreal, temperate, and tropical peatlands using time series of in situ water level data and surface water maps from high-resolution optical imagery. Our preliminary results highlight considerable variability in the quality of the new product over different peatlands and biomes. We discuss how quality differences relate to site characteristics and the retrieval uncertainty estimates.

Our approach targets a scalable and transferable method for monitoring peatland hydrology, addressing critical needs in management and conservation. Understanding hydrological state variables is essential due to their primary role in regulating ecosystem services. While SMAP L4-SM may not be directly useful for stakeholders at the management scale, the downscaled product holds significant potential for management applications. This method could become an operational tool for researchers and practitioners across diverse peatland research and application fields. This work is part of the ESA WorldPeatland project.

How to cite: Bechtold, M., Tansey, K., Ankathi, H., Lopez Saldana, G., Al Sarrouh, Y., Burdun, I., Boeykens, L., Dettmann, U., Worrall, F., and De Lannoy, G.: Advancing peatland water level monitoring by combining Sentinel-1, Sentinel-2, and peat-specific SMAP Level-4 data, EGU General Assembly 2025, Vienna, Austria, 27 Apr–2 May 2025, EGU25-15948, https://doi.org/10.5194/egusphere-egu25-15948, 2025.

EGU25-18396 | ECS | Posters on site | HS10.3

Mapping of Groundwater-Dependent Ecosystems in Denmark utilizing remotely sensed indices and topography in unsupervised clustering  

David Terpager Christiansen, Julian Koch, and Guy Schurgers

Groundwater-Dependent Ecosystems (GDE) can be broadly categorized as ecosystems where 
the vegetation utilizes groundwater for a significant part of transpiration and depends on 
groundwater access for maintaining plant health. The use of remotely sensed data for GDE
detection has evolved considerably in the past decade. Especially areas with a distinct dry
season have received much attention, as GDEs remain ‘greener’ during dry periods which 
makes dry-season NDVI an excellent indicator for GDE presence. However, for temperate 
GDEs, where no distinct dry season occurs, indicators suitable for GDE identification are 
currently lacking.  
Denmark is characterized by a temperate climate, which challenges existing GDE detection 
methods. To overcome this, we introduce two NDVI-based GDE indicators. Initially, NDVI 
dynamics of known GDEs were compared with surrounding ecosystems in a well-studied river 
valley containing cultivated and pristine peatlands with shallow groundwater. It was found 
that GDEs have a later onset of the growth season, due to soils being water-logged. To derive 
this NDVI-based GDE indicator, the average relative difference of NDVI between March and 
July from 2018 to 2024 was calculated for each cell. The second method uses the difference 
in responses to occasional summer droughts. The drought year 2018 resulted in large-scale 
wilting of vegetation in Denmark, but GDEs, being able to utilize groundwater, were more 
resilient. Thus, the summer of 2018 could be used as a pseudo dry season, and the difference 
of NDVI between 2018 and the average of the following 5 years was calculated for each cell as 
the second NDVI-based GDE indicator. Sentinel-2 at 10m resolution was sourced for 
calculating the NDVI indicators. The high-spatial resolution of the Sentinel data was critical, 
as the Danish GDEs are often small (below 1 ha), and found in narrow river valleys with 
considerable heterogeneity in land use and land cover. The two NDVI-based GDE indicators 
were applied together with topography-based indicators in different classification approaches 
to map GDEs. The tested classification approaches were based on a manual scoring routine 
and an unsupervised clustering. Their results were evaluated against more than 10,000 
polygons spanning ~110 km2 with GDE information derived from field surveying. It was found 
that incorporating the two NDVI indicators together with topography and depth to the 
groundwater table resulted in a very satisfying classification. The derived spatial patterns of 
the classification could largely be linked to land use, i.e. drainage of peat soils in the river 
valleys for cultivation or grazing.  

How to cite: Christiansen, D. T., Koch, J., and Schurgers, G.: Mapping of Groundwater-Dependent Ecosystems in Denmark utilizing remotely sensed indices and topography in unsupervised clustering , EGU General Assembly 2025, Vienna, Austria, 27 Apr–2 May 2025, EGU25-18396, https://doi.org/10.5194/egusphere-egu25-18396, 2025.

EGU25-18568 | ECS | Posters on site | HS10.3

Improving water table interpolation accuracy using high-resolution LiDAR-based Digital Elevation Models from drone surveys 

Timothy Husting, Görres Grenzdörffer, Gerald Jurasinski, John Couwenberg, Mario Trouillier, Henriette Rossa, Milan Bergheim, and Daniel Pönisch

Introduction 
Peatlands play a key role in storing carbon (C), as in their natural state they act as a C-sink by maintaining high water levels. When peatlands are drained for agricultural purposes, they are a significant source of greenhouse gas emissions. The water table's position relative to the soil surface significantly influences emissions. While current field-based methods to model hydrology are effective, they often lack scalability, highlighting the need for innovative approaches to accurately derive spatial water table levels. This study presents a scalable, high-resolution methodology for deriving Digital Elevation Models (DEMs) from Light Detection and Ranging (LiDAR) data and interpolating water level measurements to classify water level classes. 

Therefore, we compared a publicly available DEM1 with a UAS (Unmanned Aerial System) LiDAR-DEM to quantify deviations from ground-truth elevation measurements. The primary objectives of the study were: a) to investigate the extent to which inaccuracies between the DEMs and ground-truth data can be quantified, and b) to evaluate the potential of UAS LiDAR-derived DEMs for deriving spatially distributed water levels using elevation data and gauge measurements. 

Methods and Materials 

The study was conducted in the Hechtgrabenniederung near Rostock, Germany (54° 6′ N, 12° 7′ E). High-density LiDAR point clouds were generated using a DJI Matrice 300 drone, equipped with an L1 LiDAR and processed into a DEM with DJI Terra software. Water level time series were collected from an in-situ gauge measurement at a location within the study area. To evaluate accuracy, the publicly available DEM1 and the UAV LiDAR-derived DEM were validated against ground-truth elevation data points obtained through Real-Time Kinematic (RTK) measurements, with deviations quantified using statistical metrics. Finally, kriging was applied to interpolate water table levels from gauge measurements relative to the DEM, providing spatially resolved hydrological insights. 

Preliminary result 

Preliminary results indicate that UAV LiDAR-derived DEMs offer greater accuracy and resolution compared to publicly available DEMs, especially in capturing heterogeneous topographic variations and temporal changes in peatland morphology resulting from deep drainage. The integration of kriging further refines the precision and spatial resolution of water table interpolations, enabling accurate derivation of water level classes. These results provide detailed insights into the temporal and spatial dynamics of peatland topography and water levels, particularly during transitional phases like post-rewetting. 

Conclusion and Outlook 

The application of UAV LiDAR-derived DEMs for mapping peatland topography and water table levels has the potential to significantly improve accuracy and precision. This methodology demonstrates potential as a scalable technique for deriving hydrological parameters, effectively bridging the gap between field-based water table measurements and large-scale hydrological modeling. Future research will extend this approach to additional sites and leverage the more precise water level classes derived from LiDAR-DEM to advance the G-E-S-T approach (Gas-Emission-Type-Site), particularly during transitional phases such as post-rewetting, where vegetation is not adapted to the site conditions. 

How to cite: Husting, T., Grenzdörffer, G., Jurasinski, G., Couwenberg, J., Trouillier, M., Rossa, H., Bergheim, M., and Pönisch, D.: Improving water table interpolation accuracy using high-resolution LiDAR-based Digital Elevation Models from drone surveys, EGU General Assembly 2025, Vienna, Austria, 27 Apr–2 May 2025, EGU25-18568, https://doi.org/10.5194/egusphere-egu25-18568, 2025.

EGU25-18639 | ECS | Orals | HS10.3

Hydrophysical properties of ombrotrophic peat show anisotropic patterns along a degradation transect 

Raphael Müller, Enze Zhang, Bartłomiej Glina, and Stephan Glatzel

In previous studies we found that the vertical movement of solutes within water-saturated peat of Puergschachen bog is limited. Furthermore, it is evident from literature that the hydrophysical and chemical properties of peat are influenced by the parent material of peat (i.e. plant material and layering), land use and the decomposition of peat. The study site, Puergschachen bog (an Long Term Ecosystem Research (LTER) site located in the Enns Valley, Styria), exhibits different stages of degradation, ranging from slightly degraded peat (Center), intermediately degraded (Inter), and two more strongly influenced sites covered with Betula pubescens (Birch) and Pinus mugo (Edge), which allows investigations along a degradation transect.

The objective of this study is to address the following research questions: how do hydrophysical and chemical properties of peat vary along a degradation transect and to what extent does depth influence these properties? We hypothesized that the degradation of peat influences the hydrophysical (saturated hydraulic conductivity (kF), water retention (pF2.5), bulk density (BD)) and chemical properties of peat (dissolved organic carbon (DOC), aromaticity of DOC (SUVA254) and total dissolved nitrogen (TDN)), and that these parameters vary with depth.

Hydrophysical parameters were measured under laboratory conditions using undisturbed peat samples from sites along a degradation transect in two depths (10–20 cm and 20–30 cm). For each site and depth, 5 replicates in vertical and horizontal direction were taken. Chemical parameters were measured for bog water sampled seasonally in 4 depths (10–20, 35–45, 60–70 and 85–95 cm). A non-parametric Man-Whitney-Test was used to test for significant differences between groups.

Our results revealed that BD differed significantly between Center (0.053 ± 0.011 (mean ± SD)) and Birch (0.071 ± 0.023) and Edge (0.076 ± 0.014 g cm-3) and were generally slightly higher in upper horizons (10–20 cm). kF measurements showed that horizontal and vertical flow directions differ between sites as an anisotropic behavior of peat with higher horizontal conductivities in the upper (10–20 cm) and lower (20–30 cm) horizons for Center and Birch and higher vertical conductivities (both depths) for Edge, was observed. Water retentions at pF2.5 differed between sites and depths and were generally higher for deeper horizons, indicating reduced pore sizes, binding water stronger in pores. Also, differences between horizons were highest for Edge peat. Birch showed the highest DOC concentrations together with the highest aromaticity. DOC concentrations decreased with depth at all sites, while TDN and SUVA254 showed no constant depth-related pattern.

Our results indicate that water and solute transport through peat is linked with peat degradation, which inhibits or allows movement within the soil. As shown, hydraulic conductivities can develop highly heterogeneous and anisotropic patterns of directional movement. Further studies are needed to assess the extent to which these heterogeneous hydrophysical properties affect solute transport and how this might influence peat decomposition processes.

How to cite: Müller, R., Zhang, E., Glina, B., and Glatzel, S.: Hydrophysical properties of ombrotrophic peat show anisotropic patterns along a degradation transect, EGU General Assembly 2025, Vienna, Austria, 27 Apr–2 May 2025, EGU25-18639, https://doi.org/10.5194/egusphere-egu25-18639, 2025.

EGU25-19625 | ECS | Posters on site | HS10.3

High-Resolution Mapping of Peatland Water Table Depth Using Innovative Multi-Level Downscaling of SMAP Data  

Hamidreza Rahimi, Ali Saidian, Laurie Friday, Toktam Hatamisengeli, and David Coomes

The Water Table Depth (WTD) in peatlands plays a crucial role in habitats, agriculture, and CO2 emissions. WTD observations often face limitations in terms of record length and spatial distribution, which can impact modeling results. Soil Moisture Active Passive (SMAP) data, with its sub-daily temporal resolution, provides a valuable resource for WTD monitoring in peatlands. However, SMAP data with an 11-km spatial resolution is large-scale and requires downscaling to achieve finer resolution for detailed analysis. In this study, an innovative downscaling technique was used to convert the 11-km SMAP-WTD data into 10-m resolution. Employing a multi-level machine learning downscaling approach, the SMAP-WTD data is first downscaled from 11-km to 1-km, and subsequently from 1-km to 10-m using input data at corresponding scales. Elevation, land use, precipitation, and NDVI were used as independent variables, and the Classification and Regression Trees (CART) algorithm was applied for downscaling SMAP-WTD. The model's performance was evaluated using R, RMSE, MBE, and MAE indices, while the TRE index was employed to assess the importance of the model inputs.

How to cite: Rahimi, H., Saidian, A., Friday, L., Hatamisengeli, T., and Coomes, D.: High-Resolution Mapping of Peatland Water Table Depth Using Innovative Multi-Level Downscaling of SMAP Data , EGU General Assembly 2025, Vienna, Austria, 27 Apr–2 May 2025, EGU25-19625, https://doi.org/10.5194/egusphere-egu25-19625, 2025.

EGU25-20214 | Orals | HS10.3

Multi-stable isotope tracing of elevated sulfate export from a forested headwater wetland following an induced flood pulse event 

David O'Connell, Paul Coulson, Feridoun Rezanezhad, Angela Mills, Ana Lima, Hans Durr, Merrin Macrae, Chris Parsons, Sherry Shiff, and Philippe Van Cappellen

Flooding events following periods of drought can export large quantities of sulfate (SO42-) from headwater wetlands to surface waters, however the source and mechanism of SO42- release have rarely been studied.  Due to the projected increases in severity and frequency of summer droughts and episodic flooding events as a result of climate change, there is a need to better understand the nature of episodic pulses of sulfate from wetlands and their downstream impacts on water quality. In this study, we monitored the evolution of the concentration and isotopic composition of surface and groundwater SO42- in Beverly Swamp, a peat marsh area in southern Ontario, Canada, during a controlled field-scale flooding event. The event was created by the rapid drawdown of the upstream located Valens Reservoir at the end of a drought period. Up to seven-fold increases in SO42- concentrations, relative to the pre-flood background levels, were observed during the flooding of the marsh. Stable S and O isotope ratios were analysed in stream and groundwaters to investigate the sources of SO42-.

Following the flooding event, SO42- concentrations in the outflow from the marsh increased significantly, while δ34S-SO42- values decreased. The latter is interpreted as indicative of SO42- generated by sulphide oxidation (Schiff et al. 2005). Sulphide is likely produced by dissimilatory SO42- reduction occurring during wet conditions, with storage of the resulting sulfide minerals in the upper peat layers. During the dry summer, the sulfides are re-oxidised to SO42- and flushed from the wetland during flooding. Stable 18O-H2O isotope signatures identified water released from Valens Reservoir as the initial driver of the SO42- export across the wetland, followed by groundwater seepage from the deeper peat layers. Acidity increased shortly after the SO42- pulse, but quickly dropped down to background levels due to buffering capacity of the wetland.

How to cite: O'Connell, D., Coulson, P., Rezanezhad, F., Mills, A., Lima, A., Durr, H., Macrae, M., Parsons, C., Shiff, S., and Van Cappellen, P.: Multi-stable isotope tracing of elevated sulfate export from a forested headwater wetland following an induced flood pulse event, EGU General Assembly 2025, Vienna, Austria, 27 Apr–2 May 2025, EGU25-20214, https://doi.org/10.5194/egusphere-egu25-20214, 2025.

EGU25-1712 | ECS | Posters on site | CL1.2.1

Trees resilience to drought in forest ecosystems from Eastern Carpathians, Romania 

Andrei Popa, Mihai Balabasciuc, and Ionel Popa

Carpathian forest ecosystems play a major role in providing ecosystem services and ecological stability in Europe. Increasing drought frequency and intensity is a reality in plains and hills regions, becoming a threat also for mountain forest ecosystems. Forests are among the most vulnerable terrestrial ecosystems to these extremes. The impacts of climate change vary from the reduction of productivity and loss of overall ecosystem biodiversity to even the mortality of trees. Our study assessed the growth and drought resilience of three main forest species from the Carpathians: Picea abies, Abies alba, and Fagus sylvatica.
Based on an extensive tree ring data network consisting of over 6000 trees from 158 plots for P. abies, 64 plots for A. alba, and 65 plots for F. sylvatica, distributed along an elevation gradient, we (i) evaluate the basal area increment variability and (ii) quantify the resilience to the most extreme drought years from last 100 years. To assess the tree's capacity to react to water deficit, we used the resilience indices: resistance, recovery, and recovery period.
Our results show an evident growth decline of P. abies from elevation below 1400 m, with a similar trend in the case of A. alba from elevation below 800 m. A. alba and F. sylvatica show an increasing trend of basal area increment in plots from medium and high elevations. F. sylvatica and A. alba have a higher resistance and resilience to water deficit at low elevations than P. abies. Generally, the recovery period from drought events increases with elevation from all species. 

How to cite: Popa, A., Balabasciuc, M., and Popa, I.: Trees resilience to drought in forest ecosystems from Eastern Carpathians, Romania, EGU General Assembly 2025, Vienna, Austria, 27 Apr–2 May 2025, EGU25-1712, https://doi.org/10.5194/egusphere-egu25-1712, 2025.

How do climatic conditions, particularly rainfall, influence the radial growth and vascular traits of Vachellia macracantha in tropical dry forests? This study aimed to measure the tree-ring width (TRW) and vascular variables (AVLA, TVLA, VDLA) of V. macracantha in the Tumbesian dry forest of southern Ecuador, construct chronologies for these variables, and analyze their relationship with precipitation. Using standard dendrochronological methods, we measured TRW and vascular traits, subsequently developing chronologies for both TRW and the vessel variables. These chronologies were correlated with precipitation data to assess climate-growth relationships. Results showed a positive correlation between precipitation and both TRW and AVLA, indicating that higher rainfall promotes radial growth and larger vessel lumen areas. In contrast, precipitation was negatively correlated with TVLA and VDLA, suggesting a decrease in vessel density and total lumen area under wetter conditions. These findings underscore the adaptability of V. macracantha to fluctuating water availability, demonstrating how it balances hydraulic efficiency and safety. By integrating dendrochronology and wood anatomy, this study provides critical insights into the growth dynamics of tropical dry forests and offers a robust foundation for conservation strategies in the face of changing climate conditions.

How to cite: Peña, K.: Effect of climate on ring-width and vessel variables of Vachellia macracantha from dry forest in Southern Ecuador, EGU General Assembly 2025, Vienna, Austria, 27 Apr–2 May 2025, EGU25-1964, https://doi.org/10.5194/egusphere-egu25-1964, 2025.

EGU25-3163 | ECS | Posters on site | CL1.2.1

The effects of individual tree competition on growth-based resilience to a fast-changing climate 

Rebecca Partemi, Tom Levanič, and Jernej Jevšenak

Climate change poses a significant threat to forest ecosystems worldwide, intensifying the frequency and severity of extreme droughts that challenge tree survival, growth and carbon sequestration. In addition to climate variability, one of the most significant factors affecting tree growth is competition, which ultimately shapes resource availability, stand structure, and microclimatic conditions. However, our understanding of how individual traits and stand-level characteristics influence the resilience of different tree species to climate stressors remains limited. While competition is recognized as a key driver of tree growth dynamics, its impact on the climate sensitivity and coping strategies of trees to drought conditions is poorly understood.

In this study, we investigate the interplay between individual tree competition and tree size characteristics such as diameter at breast height (DBH) and social status in modulating growth and responses to climate variability. Specifically, we examine how various growth-based resilience indicators (resilience, resistance, recovery and recovery period) and climate-growth relationships are affected by stand-level competition obtained by measuring DBH of each competitor tree within a 10-meter radius of our focal trees. By integrating competition data with dendrochronological analyses, we assessed how current competition status affects the resilience of Norway spruce (Picea abies), Scots pine (Pinus sylvestris), and Silver fir (Abies alba) to warmer and drier climate, both in past and present contexts, between two sites with differing productivity levels.

We hypothesize that smaller trees and those under strong competition are less exposed, as shading from larger trees may buffer them against extreme environmental conditions such as high temperatures and water stress. This shading effect likely creates a more stable microclimate, mitigating drought conditions. However, these benefits may come at the cost of slower growth rates and reduced access to resources under competitive pressure.

This study provides valuable insights into the relationship between stand dynamics and tree resilience to climate stressors. Understanding how competition and tree status concurrently shape climate sensitivity and potentially moderate drought consequences, can help achieve a more nuanced perspective on forest management. These insights can inform strategies to promote forest resilience by fostering greater species diversity and vertical structural complexity, creating forests that are better suited to withstand increased frequency of climatic extremes. Promoting diverse and vertically layered forests not only supports sustainable and adaptive forestry practices but also enhances ecosystem stability and the capacity to mitigate environmental challenges. 

How to cite: Partemi, R., Levanič, T., and Jevšenak, J.: The effects of individual tree competition on growth-based resilience to a fast-changing climate, EGU General Assembly 2025, Vienna, Austria, 27 Apr–2 May 2025, EGU25-3163, https://doi.org/10.5194/egusphere-egu25-3163, 2025.

Green alder (Alnus alnobetula (Ehrh.) K. Koch) is a tall, multi-stemmed deciduous shrub widespread in the Central European Alps across the treeline ecotone. The focus of this study was (i) to determine key dates of intra-annual radial stem growth (RG), and (ii) to assess environmental factor most closely related to daily RG along an elevational transect. For this purpose, RG was continuously recorded by dendrometers mounted on shoots (n=16–20 dendrometer records per year) at three study plots on Mt. Patscherkofel (1940–2150 m asl) during the growing seasons 2022–2024, and in potted saplings (n=3) at 600 m asl (Botanical garden in Innsbruck, Tyrol, Austria). The Gompertz function was applied to determine phenological dates of intra-annual RG dynamics, i.e., onset, end, duration and time of maximum RG. Daily radial stem increments were extracted from dendrometer traces, and Spearman correlations (ρ) with environmental variables were determined. Results revealed that within the treeline ecotone RG started and ceased around end of June (doy 177±7) and end of August (233±9), respectively. The mean growth duration was found to be 56 ± 9 days. Within the treeline ecotone mild temperatures in May and cold spells during the growing period led to an earlier start and end of RG, respectively. The time of maximum RG was observed in early July (doy 192±8), with about 60 % of the annual increment developing during this month. Although RG in the valley already started in mid-May (doy 134±2) and lasted until mid-October (doy 286±8; duration: 153±7 days), time of maximum RG in 2024 was reached at a similar point in time as within the treeline ecotone (doy 194±13). The environmental factor most closely related to intra-annual RG was soil temperature along the entire elevational transect (ρ=0.371–0.419; P<0.01). Air and cambial temperature were less closely related to RG at all study plots. Precipitation constrained RG at the forest line (ρ=0.549, P<0.001) and at the south-facing treeline site (ρ=0.426, P<0.001). Soil water content and vapour pressure deficit of the air had no significant influence on RG. Results of this study revealed a high degree of plasticity in RG of A. alnobetula, with the RG period spanning two and five months within the treeline ecotone and in the valley, respectively. The greater significance of soil temperature compared to air and cambial temperature for RG is most likely attributable to a non-linear relationship between RG and temperature.

This research was funded by the Austrian Science Fund (FWF), P34706-B.

How to cite: Oberhuber, W., Wieser, G., and Gruber, A.: Effects of environmental variables on intra-annual dynamics of radial growth of green alder (Alnus alnobetula) along an elevational transect, EGU General Assembly 2025, Vienna, Austria, 27 Apr–2 May 2025, EGU25-4019, https://doi.org/10.5194/egusphere-egu25-4019, 2025.

EGU25-5180 | Posters on site | CL1.2.1

Tracking the isotopic fingerprint of defoliation in tree rings 

Valentina Vitali, Cecilia Franka Hofmann, Nikolaus Obojes, Elisabet Martínez-Sancho, Meisha Holloway-Phillips, Joanna Sydney Reim, Marçal Argelich Ninot, Bernhard Muigg, Willy Tegel, Jesus Julio Camarero Marinez, Matthias Saurer, and Yann Vitasse

Understanding changes in the physiological responses of trees to disturbances, and establishing proxies to reconstruct past events, is of high importance in a changing world. Recent studies have demonstrated the potential of δ2H in tree-ring cellulose as a proxy for physiological changes in carbon utilization, reflecting shifts between the use of current assimilates and stored C sources. These findings might explain the considerable annual variations in the strength of the δ18O and δ2H (O-H) relationship despite the shared hydrological pathway, underlining the complex interaction of hydrological and physiological processes. One of the situations where there is a clear disruption of carbon assimilation and tree functioning is defoliation events. Thus, tree-ring isotopes can be utilized to test the physiological signal recorded in tree rings by quantifying changes in δ13C, δ2H and δ18O values, and the decoupling of the O-H relationship. Here, we investigated the isotopic fingerprint of abiotic and biotic defoliation events in tree-ring cellulose, including (i) late-spring frost on European beech near its upper elevational limit in the Swiss Jura(ii) pine processionary moth outbreaks in northern Italy, and (iii) cockchafer moth outbreaks on archaeological oak material from Central European lowlands. Across all defoliation types, a common fingerprint was identified with significantly enriched δ2H, depleted δ18O, resulting in the decoupled (negative) O-H relationship, and non-affected δ13C values.  As defoliation causes reduced fresh carbon assimilation, the remobilization of stored non-structural carbohydrates (NSC) is likely the fundamental process for plant growth, metabolism, and canopy re-flushing. NSC differ in their isotopic ratio compared to fresh photosynthates, by exhibiting 2H-enrichment and 18O-depletion, explaining the negative O-H relationship in tree-ring cellulose. Since defoliation has been shown to induce allocation shifts by prioritizing NSC storage over radial growth, foliage loss also leads to substantial secondary growth reductions which was observed across all defoliation types. The generally non-significant changes in δ13C between outbreak and non-outbreak years indicate minor impacts on leaf stomatal conductance. In conclusion, this common isotopic fingerprint provides valuable insight into past defoliation events and their reconstruction, which is particularly relevant in the context of rapid environmental change.

How to cite: Vitali, V., Hofmann, C. F., Obojes, N., Martínez-Sancho, E., Holloway-Phillips, M., Reim, J. S., Argelich Ninot, M., Muigg, B., Tegel, W., Camarero Marinez, J. J., Saurer, M., and Vitasse, Y.: Tracking the isotopic fingerprint of defoliation in tree rings, EGU General Assembly 2025, Vienna, Austria, 27 Apr–2 May 2025, EGU25-5180, https://doi.org/10.5194/egusphere-egu25-5180, 2025.

EGU25-6466 | ECS | Posters on site | CL1.2.1

The First Tree-Ring Blue Intensity Measurements from the Korean Peninsula: Exploring Summer Temperature Signals 

Min-Seok Kim, Mauricio Fuentes, Hans Linderholm, Frida Lidman, Youngdae Koh, Chanhyuk Choi, Sung-Ho Woo, and Jee-Hoon Jeong

Tree-ring blue intensity (BI), a proxy measuring blue light reflection from tree-ring cores, has emerged as a promising tool for climate reconstruction, yet its application in East Asia remains limited. Here we evaluate the dendroclimatological potential of tree-ring blue intensity using Korean pine (Pinus koraiensis Siebold & Zucc.) samples from Mt. Seorak in the Korean Peninsula. We developed chronologies using tree-ring width (TRW) and three BI parameters (earlywood BI, maximum latewood BI, and delta BI), with delta BI (DBI) exhibiting robust correlations with summer (July-August) mean surface air temperature (SAT). Despite weak series intercorrelation in the BI chronologies, the DBI measurements preserved consistent temperature signals from the early 20th century to present, in contrast to the inconsitent climate response in the TRW data. The DBI chronology further demonstrated potential for reconstructing large-scale atmospheric patterns, including the circumglobal teleconnection pattern and subtropical jet stream. Our findings establish BI methodology as a valuable tool for enhancing climate reconstructions in subtropical East Asia, particularly in regions where traditional TRW measurements prove inadequate for capturing summer temperature signals.

How to cite: Kim, M.-S., Fuentes, M., Linderholm, H., Lidman, F., Koh, Y., Choi, C., Woo, S.-H., and Jeong, J.-H.: The First Tree-Ring Blue Intensity Measurements from the Korean Peninsula: Exploring Summer Temperature Signals, EGU General Assembly 2025, Vienna, Austria, 27 Apr–2 May 2025, EGU25-6466, https://doi.org/10.5194/egusphere-egu25-6466, 2025.

EGU25-7291 | ECS | Orals | CL1.2.1

Tree growth responses to climate variability: The case of Clethra arborea in the Azores and Madeira islands. 

André Neves, Diogo Pavão, Ricardo Camarinho, Lurdes Silva, and Luís Silva

Forests on oceanic islands present unique opportunities for dendroclimatic research, owing to the pronounced climatic gradients over short geographic distances. In the Azores archipelago, with a temperate oceanic climate, with low thermal amplitude, and mild and relatively wet Summers, Clethra arborea Aiton (Clethraceae) is one of the most recent examples in the Azores of the generally unexpected consequences that the introduction of an exotic species, introduced in São Miguel Island (Azores) probably in 1950s. Madeira island climate is slightly warmer and more humid than the Azores, with distinct variations between the north and south of the island due to its topography. Here, Clethra arborea Aiton is an endemic plant. Forest management is essential for maintaining and improving the provision of ecosystem services, while dendrochronological techniques can be instrumental in supporting this effort. There are not many dendrochronological studies that have targeted this species elsewhere and, both archipelagos, are widely unexplored in terms of dendroclimatology, so, this study in the Azores and Madeira is aimed to understand its climate-growth relationships better and allow the identification of possible limiting factors on growth through tree-ring inter-annual pattern variations. For this purpose, we sampled 606 trees from two populations (São Miguel and Madeira islands). Following standard dendrochronological methods, we obtained four site chronologies from São Miguel Island and four site chronologies from Madeira Island. We used a stepwise modelling approach, with Random Forest and Generalized Linear Models. Our results suggest that Clethra arborea benefits from the conditions of year-round precipitation in the Azores while in Madeira, only on site Encumeada (EN) it benefits from these conditions. For this species, and in the future, higher Winter and Spring temperatures could lead to increased water stress and reduced growth rates. This should be reflected when forecasting the future distribution and productivity of Clethra arborea under diverse climate change scenarios. Our findings provide essential insights for developing management strategies for this species.

How to cite: Neves, A., Pavão, D., Camarinho, R., Silva, L., and Silva, L.: Tree growth responses to climate variability: The case of Clethra arborea in the Azores and Madeira islands., EGU General Assembly 2025, Vienna, Austria, 27 Apr–2 May 2025, EGU25-7291, https://doi.org/10.5194/egusphere-egu25-7291, 2025.

    Dynamic fluctuations in sea surface temperature within the North Atlantic Ocean (NA-SST) exert a pivotal influence on global climate change. Yet, the specific impacts of these variations on the temperature shifts within the Qinling-Bashan Mountains (QBM) of China, remain to be fully elucidated. Furthermore, a debate surrounding the manifestation of the Little Ice Age (LIA) within the QBM is ongoing, primarily due to the scarcity of reliable, long-term, and high-resolution temperature records. To bridge these knowledge gaps, in this paper, we present a ~250-year temperature reconstruction (Tmax11-7) developed based on a tree-ring-width chronology from the QBM. The new reconstruction not only aligns with a local winter temperature reconstruction based on historical document evidence, but also reveals robust regional and hemispheric temperature signals. Intriguingly, the study shows that the warming trend observed in the QBM since the Industrial Era is less pronounced than that witnessed across China and the Northern Hemisphere. The Tmax11-7 reconstruction provides a glimpse into the final stages of the LIA, highlighting a relatively colder 19th century followed by a warmer 20th century. Notably, the warming trend post-1970s remains within the bounds of the 250-year temperature framework. The research further uncovers that NA-SST has predominantly governed the QBM's temperature fluctuations over the past centuries, as evidenced by the tight positive correlation between Atlantic multidecadal Oscillation (AMO)/Atlantic multidecadal variability (AMV) and Tmax11-7. However, this dominant influence of NA-SST was temporarily subdued between 1900 and 1930 CE due to the interference of Pacific Decadal Oscillation (PDO). This finding serves as a reminder that future temperature projections for the QBM must account not only for the primary role of NA-SST but also the modulating effects of the PDO. The study is essential for shaping effective environmental management and adaptation strategies in the region.

How to cite: Cai, Q. and Liu, Y.: The influence of North Atlantic sea surface temperature fluctuations on the climate of the Qinling-Bashan Mountains over the past 250 years, EGU General Assembly 2025, Vienna, Austria, 27 Apr–2 May 2025, EGU25-8087, https://doi.org/10.5194/egusphere-egu25-8087, 2025.

EGU25-8655 | ECS | Posters on site | CL1.2.1

Using GARCH Models to Detect Forthcoming Transitions in Tree Growth 

Samuel Egan and Christian Zang

In numerous ecological systems, forthcoming critical transitions can be identified using a variety of methods for deriving early warning indicators. Several methods focus on characteristics of time-series related to system behaviour or properties, including changes in time-series variability. One such method is conditional heteroskedasticity (CH). CH defines a time series as having a non-constant variability, that is also dependent on the variability at previous time-steps, where increases in variability indicate that the system under study is nearing a critical transition. Here, we apply this concept to time series of radial growth, measured as tree-ring widths: a general autoregressive conditional heteroskedasticity (GARCH) model is used to produce a CH time-series from detrended tree-ring data. By analysing the variability trends within this time series, conclusions can be made relating to the system’s proximity to transition. Whilst this form of analysis is not a novel concept in the field of ecology, such a thorough examination of the models’ ability to detect change in the variability of tree-ring data is yet to be carried out. We propose the application of a dual-model approach, using both GARCH and VS-Lite models, with an aim of determining the efficacy of such a strategy to detect not only changes in tree-growth stability, but more specifically changes induced by climate stressors. This approach has the potential to forecast impending critical transitions in tree-growth behaviour, possible fluctuations in the rate of mortality, and quantify the influence of climate on growth stability at both the tree and site-level.   

How to cite: Egan, S. and Zang, C.: Using GARCH Models to Detect Forthcoming Transitions in Tree Growth, EGU General Assembly 2025, Vienna, Austria, 27 Apr–2 May 2025, EGU25-8655, https://doi.org/10.5194/egusphere-egu25-8655, 2025.

    Climate change has played a pivotal role in shaping Chinese history, especially during the Ming Dynasty. Previous studies have focused primarily on the Chongzhen megadrought, which is widely considered as the primary climatic perturbation behind the demise of the Ming Dynasty. However, relatively little is known about other severe drought events and their potential impact on the dynasty collapse. Additionally, the characteristics of an exceptional climatic anomaly termed the “Late Ming Weak Monsoon Period” are unclear. In this study, we reconstructed the historical variations of Palmer Drought Severity Index for July–September based on tree-ring stable oxygen isotopes (δ18O) from 1556 CE to 2015 CE in southwest Loess Plateau. Our study reveals a significant weakening of the Asian summer monsoon between 1561 CE and 1661 CE, consistent with the Late Ming Weak Monsoon Period, and unravels its structural characteristics in details. Our reconstruction also captures a distinct humidification trend over northwest China since the early 2000s and suggests that this current humidification trend will persist in this region for the next few years. Notably, in addition to the well-known Chongzhen megadrought, our study records the severe Wanli megdrought (1585–1590 CE) during the late Ming Dynasty, an event that rarely featured in earlier studies, exhibiting comparable duration and severity to the Chongzhen megadrought. Further analysis indicates that Wanli megadrought may have served as an early trigger for the collapse of the Ming Dynasty. Furthermore, our analysis implicates the El Niño–Southern Oscillation as a contributing factor in both the Wanli and Chongzhen megadroughts, and thus to the ultimate collapse of the Ming Dynasty by affecting the Asian summer monsoon intensity.

How to cite: Ren, M. and Liu, Y.: The collapse of the Ming Dynasty actually began with the Wanli megadrought: insights from a hydroclimate reconstruction based on tree-ring δ18O over the past 460 years, EGU General Assembly 2025, Vienna, Austria, 27 Apr–2 May 2025, EGU25-8716, https://doi.org/10.5194/egusphere-egu25-8716, 2025.

Global climate change influences the growth and distribution of forest species, including Qinghai spruce (Picea crassifolia), a dominant species on the northeastern Qinghai-Tibet Plateau and a key afforestation species in Northwest China. Using tree-ring data and a random forest algorithm, this study developed a radial growth model to simulate the annual growth of P. crassifolia from 1950 to 2100 under different climate scenarios. The analysis revealed that soil moisture in June and precipitation in September of the previous year were critical factors influencing growth, with optimal thresholds of 0.36±0.09 m³·m⁻³ and 92.56±20.21 mm, respectively. Future projections indicated that the SSP1-1.9 scenario is beneficial for growth, while SSP2-4.5 and SSP5-8.5 scenarios lead to significant habitat degradation and reduced suitable areas. These results emphasize the need for adaptive afforestation and management strategies to address climate variability, providing valuable insights for sustainable forest restoration and conservation in the region.

How to cite: Zhao, Z. and Guo, Y.: Using Tree-Ring Data to Model the Growth Dynamics of Qinghai Spruce Under Future Climate Scenarios, EGU General Assembly 2025, Vienna, Austria, 27 Apr–2 May 2025, EGU25-9542, https://doi.org/10.5194/egusphere-egu25-9542, 2025.

EGU25-11095 | ECS | Orals | CL1.2.1

Temperature-Humidity-Wind index variability on the Qinghai-Tibet Plateau over the past half millennium 

Boya Zhang, Feng Shi, Juan Feng, Jinbao Li, and Bao Yang

The Qinghai-Tibet Plateau has experienced rapid warming over the past six decades, resulting in more frequent extreme weather events with significant impacts on human health. This warming trend, along with improved infrastructure and transportation, has spurred a rise in summer tourism, boosting local economies yet exposing visitors and residents to high risks of public health. However, the relationship between the historical variability of THW index on the Qinghai-Tibet Plateau and human health under the combined influence of external forcing factors and internal climate variability remains unclear. In this study, we reconstructed the summer (June–August) Temperature–Humidity–Wind (THW) index, an indicator of apparent temperature and associated health impacts, across the western, southern, southeastern and northeastern Qinghai–Tibet Plateau over the past 500 years. Our results reveal that the post-1971 CE upward trend in the THW index for the southern, southeastern, and northeastern plateau regions is the most rapid of the past five centuries. Despite the accelerated warming, current THW values remain below the thresholds for heat-related health risks. Notably, the two coldest intervals during 1630–1660 and 1670–1700 CE exhibited marked drops in THW index, possibly lowering oxygen levels and exacerbating chronic mountain sickness, thereby reducing life expectancy. Solar activity shows a significant positive correlation with the THW index on multi-decadal timescales and affects the THW index by altering the radiation flux at the top of the Earth's atmosphere and amplifying it through the water vapor transport feedback mechanism of the ocean. However, the relationship between the Atlantic Multidecadal Oscillation (AMO) and the THW index shifted from negative to positive after the Industrial Revolution. This shift likely stems from the AMO-driven changes in the North Atlantic sea surface temperatures, which alters the Silk Road teleconnection wave train and leads to spatially inconsistent THW patterns. These findings highlight the critical influence of long-term climate variability on human health, underscoring the importance of Predicting future THW index trends by modeling to guide effective public health strategies during global warming.

How to cite: Zhang, B., Shi, F., Feng, J., Li, J., and Yang, B.: Temperature-Humidity-Wind index variability on the Qinghai-Tibet Plateau over the past half millennium, EGU General Assembly 2025, Vienna, Austria, 27 Apr–2 May 2025, EGU25-11095, https://doi.org/10.5194/egusphere-egu25-11095, 2025.

EGU25-12400 | Posters on site | CL1.2.1

Effects of nitrogen deposition and climate extremes on European forests: combining stable isotopes in tree rings and ecosystem fluxes 

Giorgio Matteucci, Marco Montedoro, Matteo Rossi, Francesco Mazzenga, and Rossella Guerrieri

The ability of forests to continue providing important ecosystem services and mitigating climate change depends on their ability to adapt to global change pressures, such as more frequent climate extremes (specifically drought and heatwaves) and changes in atmospheric pollutants, such as reactive nitrogen compounds. On the one hand, nitrogen deposition could stimulate tree growth in a CO2 richer word, but on the other hand increasing atmospheric nitrogen input, above the critical load, could result in forest dieback, through soil acidification and nutrient imbalances but also by making trees more vulnerable to climate extremes. How do these global change components interact and affect forest carbon, water and nitrogen cycling? What are tree ecolophysiological mechanisms involved? Are those mechanisms synchronized (in terms of magnitude and temporal trends) at tree and ecosystem scales? Does nitrogen deposition affect tree and forest responses to climate extremes? 
In order to answer these fundamental questions, we considered 12 forests along a climate and nitrogen deposition gradient (from 3 to 42 kg ha-1 yr-1) in Europe, including four of the most widespread tree species in European forests: Fagus sylvatica, Quercus spp., Picea abies, Pinus sylvestris. Forests sites were selected within established networks, namely ICOS and eLTER (for the ecosystem scale measurements of carbon and water fluxes with eddy covariance technique and other ecological parameters) and ICP Forests (for atmospheric nitrogen deposition). We will present preliminary results on the combinination of existing data on ecosystem fluxes with dendroecological data (growth and stable carbon, oxygen and nitrogen isotope ratios) to explore multidecadal changes in forest water-use efficiency and elucidate tree physiological mechanisms underpinning those responses. Moreover, in specific years characterized by climate extremes, an intra-annual isotope approach will be considered to evaluate possible divergences among tree species in the physiological signal and between tree and ecosystem responses, but also to elucidate the contribution of nitrogen deposition in affecting responses to climate extremes. 
Collaborators at the ICOS and ICP Forests sites selected for the study are greatly acknowledged

How to cite: Matteucci, G., Montedoro, M., Rossi, M., Mazzenga, F., and Guerrieri, R.: Effects of nitrogen deposition and climate extremes on European forests: combining stable isotopes in tree rings and ecosystem fluxes, EGU General Assembly 2025, Vienna, Austria, 27 Apr–2 May 2025, EGU25-12400, https://doi.org/10.5194/egusphere-egu25-12400, 2025.

EGU25-12457 | Orals | CL1.2.1

Warming Tipping Point for tree growth in boreal permafrost landscapes 

Raquel Alfaro Sánchez, Jennifer L. Baltzer, and Sharon L. Smith

Boreal ecosystems are warming at three to four times the global average due to Arctic amplification. At these higher latitudes, where plant growth is constrained by low temperatures, climate warming is expected to shift the tree line northward and enhance vegetation productivity.

Permafrost thaw is also a major driver of climate-induced landscape changes in the north, significantly impacting tree growth and productivity. Approximately 80% of the boreal biome lies within the permafrost region. With continued global warming, permafrost temperatures will rise, leading to increased thaw rates and a reduction in permafrost extent.

Some studies suggest that permafrost thaw may benefit the functioning of overlying forests, primarily due to warmer soils, deeper permafrost tables, and access to newly released resources previously trapped in the frozen ground. However, the combined effects of climate change on growth trajectories in boreal trees remain uncertain. Indeed, satellite and ground-based vegetation studies, including tree-ring analyses, reveal substantial inconsistencies across the boreal and Arctic biomes, with some regions showing accelerated growth and greening, while others exhibit reduced growth and browning.

Here, we assembled a network of tree-ring data from sites with a historical record of permafrost thaw, spanning a climatic gradient in the boreal-subarctic Canadian region, to analyze tree growth patterns and identify their primary drivers—temperature, moisture, or permafrost changes.

Our findings revealed that the positive response of tree growth to warmer temperatures shifted in recent decades, with no significant positive temperature response at any studied site after 2007. Sensitivity to moisture also varied, showing exclusively negative impacts of higher vapor pressure deficit and precipitation on tree growth. Overall, tree growth exhibited a steady increase across the climatic gradient, peaking between 1993 and 2007, followed by a decline after 2007.

Nearly all permafrost monitoring sites examined showed consistent increases in permafrost thaw since 2007, with more pronounced ground destabilization occurring at lower latitudes within the climatic gradient. We found that permafrost thaw generally had a negative impact on tree growth. These reductions in growth were linked to ground destabilization caused by seasonal and long-term changes in ice-rich permafrost, which led to trees tilting off-vertical. Tree leaning triggered the formation of reaction wood, which alters radial growth as the trees counteract the physical instability of the permafrost.

Our results indicate that continued climate warming will drive widespread reductions in radial growth in boreal forests, leading to decreased carbon sequestration capacity.

How to cite: Alfaro Sánchez, R., Baltzer, J. L., and Smith, S. L.: Warming Tipping Point for tree growth in boreal permafrost landscapes, EGU General Assembly 2025, Vienna, Austria, 27 Apr–2 May 2025, EGU25-12457, https://doi.org/10.5194/egusphere-egu25-12457, 2025.

EGU25-13082 | ECS | Posters on site | CL1.2.1

Peatland trees contain strong and temporally stable hydroclimate information in tree-ring δ13C and δ18O records 

Karolina Janecka, Kerstin Treydte, Silvia Piccinelli, Loïc Francon, Marçal Argelich Ninot, Johannes Edvardsson, Christophe Corona, Veiko Lehsten, and Markus Stoffel

Peatland trees are valuable archives of paleoclimatic information; however, gaps persist in understanding the relationships between tree growth, peatland hydrology, and hydroclimate variables. While previous research in peatlands has mainly focused on tree-ring widths (TRW), yielding inconclusive results, the potential of stable carbon (δ13C) and oxygen (δ18O) isotopes in tree rings remains unexplored. In this study, we develop TRW, δ13C, and δ18O chronologies of Scots pine trees located in a Swedish peatland and a reference site on bedrock with a mineral soil layer. We assess their responses to hydroclimate conditions and evaluate their potential for reconstructing hydroclimate variations. Our findings show significant differences in mean TRW and δ13C values between the peatland and reference sites. Moreover, while all three proxies exhibit uniform year-to-year variations across sites, we observe discrepancies in long-term trends, particularly in δ13C. Although the climate sensitivity of TRW is weak and non-homogenous, the δ13C and δ18O peatland and reference chronologies contain robust and consistent signals, with a maximum sensitivity to water table, precipitation, and vapor pressure deficit (VPD) variations during summer. Both δ13C and δ18O chronologies show stable relationships with three key hydroclimate variables over time. In conclusion, while TRWs from living peatland pines at our sites have limited potential to record high-frequency hydroclimate information, δ13C and δ18O chronologies can serve as excellent proxies for the reconstruction of past hydroclimate changes.

How to cite: Janecka, K., Treydte, K., Piccinelli, S., Francon, L., Argelich Ninot, M., Edvardsson, J., Corona, C., Lehsten, V., and Stoffel, M.: Peatland trees contain strong and temporally stable hydroclimate information in tree-ring δ13C and δ18O records, EGU General Assembly 2025, Vienna, Austria, 27 Apr–2 May 2025, EGU25-13082, https://doi.org/10.5194/egusphere-egu25-13082, 2025.

EGU25-13144 | Orals | CL1.2.1

Long-term dynamics of forest and aquatic net primary productivity inferred from tree-ring and limnological records in a sub-alpine lake 

Emanuele Ziaco, Flavia Tromboni, Facundo Scordo, Carina Seitz, and Sudeep Chandra

Terrestrial and aquatic ecosystems are connected through the exchange of nutrients, energy, and organisms. Investigating the spatio-temporal synchronicity (i.e., coupling and decoupling) of Net Primary Productivity (NPP) across these ecosystems is essential for understanding their responses to current and future environmental changes. While tree rings provide a robust proxy for reconstructing terrestrial NPP (TNPP) and its historical fluctuations under varying climatic and environmental conditions, a comparable approach for freshwater ecosystems is hindered by the lack of long-term records of aquatic NPP (ANPP). In this study, we compared annually resolved time series of TNPP, derived from ring-width chronologies of white fir (Abies concolor) and lodgepole pine (Pinus contorta) in the Castle Lake basin (USA), with ANPP records from 1961 to 2020 collected by the long-term ecological research program at the lake. Our analysis focused on identifying patterns of synchronicity between TNPP and ANPP and their climatic drivers across high- and low-frequency domains. Our results revealed a one-year lagged negative effect of TNPP on ANPP, potentially linked to nutrient uptake by vegetation, and a delayed influence of ANPP on TNPP, with a lag of 5–10 years. In the low-frequency domain, we identified a pronounced episode of decoupling (1961–1988), followed by a phase of coupling (1989–2012). These dynamics appear to be driven by contrasting climatic sensitivities: TNPP was negatively influenced by June–July temperatures and drought stress throughout the growing season, whereas ANPP was positively associated with April temperatures and constrained by winter precipitation.  This study highlights the value of long-term monitoring in disentangling the complex interactions between terrestrial and aquatic ecosystems. Our research suggests that the response of aquatic and terrestrial ecosystems to climate change might be characterized by complex patterns of synchronicity, highlighting the importance of cross-disciplinary research. Measurements that connect fundamental processes across the terrestrial to aquatic ecosystems are needed to understand the connections between lake, watershed, and climate, particularly given the certain future of warming in the region.

How to cite: Ziaco, E., Tromboni, F., Scordo, F., Seitz, C., and Chandra, S.: Long-term dynamics of forest and aquatic net primary productivity inferred from tree-ring and limnological records in a sub-alpine lake, EGU General Assembly 2025, Vienna, Austria, 27 Apr–2 May 2025, EGU25-13144, https://doi.org/10.5194/egusphere-egu25-13144, 2025.

EGU25-15294 | Orals | CL1.2.1

Jet stream controls on European climate and agriculture since 1300 CE 

Guobao Xu, Ellie Broadman, Isabel Dorado-Liñán, and Valerie Trouet

The jet stream is an important dynamic driver of climate variability in the Northern Hemisphere mid-latitudes. Modern variability in the position of summer jet stream latitude in the North Atlantic-European sector (EU JSL) promotes dipole patterns in air pressure, temperature, precipitation, and drought between northwestern and southeastern Europe. EU JSL variability and its impacts on regional climatic extremes and societal events are poorly understood, particularly prior to anthropogenic warming. Based on three temperature sensitive European tree-ring records, we develop a reconstruction of interannual summer EU JSL variability over 1300-2004 CE (R2 = 38.5%) and compare it to independent historical documented climatic and societal records, such as grape harvest, grain prices, plagues, and human mortality. Here, we show contrasting summer climate extremes associated with EU JSL variability back to 1300 CE, as well as biophysical, economic, and human demographic impacts, including wildfires and epidemics. In light of projections for altered jet stream behavior and intensified climate extremes, our findings underscore the importance of considering EU JSL variability when evaluating amplified future climate risk.

How to cite: Xu, G., Broadman, E., Dorado-Liñán, I., and Trouet, V.: Jet stream controls on European climate and agriculture since 1300 CE, EGU General Assembly 2025, Vienna, Austria, 27 Apr–2 May 2025, EGU25-15294, https://doi.org/10.5194/egusphere-egu25-15294, 2025.

EGU25-15521 | ECS | Posters on site | CL1.2.1

Examining Forest Structure and Growth Dynamics Using Dendrochronology 

Ching-Chu Tsai, Yu-Fang Wang, and Su-Ting Cheng

Extreme climate events pose a potential threat to the forest structure stability, triggering tree growth release (GR) and possible shifts in tree social status. This study used a dendrochronological approach to investigate changes in tree competition in a 100-year-old Japanese cedar (Cryptomeria japonica) plantation at the JinGangZuan site, managed by the Experimental Forest of National Taiwan University. Tree-ring data was used to reconstruct historical GR events and explored the relationship between GR and the maximum wind speed. In addition, we evaluated tree social status shifts by comparing each sample tree’s diameter at breast height (DBH) with the stand’s quadratic mean DBH from forest inventory data.

Our findings identified a major GR event around 1970 and revealed a significant positive correlation (r = 0.73, P = 0.01) between GR and maximum wind speed. Most high wind events occurred during typhoon periods. Despite these disturbances, the overall social structure remained largely unchanged among the 113 sampled trees, suggesting that GR does not necessarily drive significant status shifts. Specifically, 79.6% of trees retained their original social status (“big trees remain big and small trees remain small”), while 20.4% exhibited some degree of status change. Most codominant-to-dominant status changes occurred in early growth stages, while status change in later stages appear to be randomly distributed. We suspected disturbances tend to remove weaker trees, complicating direct comparisons among individuals.

Notably, typhoon strength has increased over the past four decades and is expected to intensify further under global warming. Although this study suggests minimal impacts of disturbances on forest structure at the JinGangZuan site, proactive adaptation measures are advisable. Tree-ring analysis offers valuable insights into stand development following extreme events, providing critical guidance for refining forest management strategies in an era of changing environmental conditions.

How to cite: Tsai, C.-C., Wang, Y.-F., and Cheng, S.-T.: Examining Forest Structure and Growth Dynamics Using Dendrochronology, EGU General Assembly 2025, Vienna, Austria, 27 Apr–2 May 2025, EGU25-15521, https://doi.org/10.5194/egusphere-egu25-15521, 2025.

EGU25-15925 | Orals | CL1.2.1

Species Differences in δ13C and δ18O in Arctic Shrubs: Evidence from a Snow Fence Experiment 

Candice Power, Katja Rinne-Garmston, Bo Elberling, Elina Sahlstedt, Urs Treier, Jeffrey M. Welker, and Signe Normand

Carbon (δ13C) and oxygen (δ18O) isotopes provide key insights into plant physiological processes, including water-use efficiency, water source utilization, and carbon assimilation. In Arctic ecosystems, changes in snow conditions may influence shrub growth, physiology, and isotopic composition by altering soil moisture, temperature, and soil nutrient conditions with carry-over effects from winter to the main growing season. We analyzed δ13C and δ18O values in two dominant Arctic shrub species, Salix glauca (gray willow) and Betula nana (dwarf birch), growing at a snow fence experiment implemented summer 2012 on Disko Island, Greenland. Using novel laser ablation methods with beam sizes of 100μm and 40μm for δ18O and δ13C, respectively, we analyzed growth rings from 20 individuals per species, covering the period 2007-2017. In total, we obtained 255 δ18O measurements (122 for S. glauca and 133 for B. nana) and 352 δ13C measurements (175 for S. glauca and 177 for B. nana). We obtained annual resolution measurements of δ18O for 162 rings and of δ13C for 320 rings, despite narrow rings averaging ~93μm (~85μm for S. glauca and ~100μm for B. nana). Our preliminary results indicate that increased snow depth due to the snow fence did not significantly alter the carbon or oxygen values in either species. While δ18O values were similar between the species, suggesting similar water sources regardless of snow depth, S. glauca had significantly enriched δ13C values than B. nana, indicating greater water-use efficiency, which may give it a competitive advantage during drier periods. These findings suggest that species-specific physiological traits, rather than snow depth changes, may be the primary drivers of isotopic differences in Arctic shrubs, with implications for shrub expansion and Arctic carbon and water cycles.   

How to cite: Power, C., Rinne-Garmston, K., Elberling, B., Sahlstedt, E., Treier, U., Welker, J. M., and Normand, S.: Species Differences in δ13C and δ18O in Arctic Shrubs: Evidence from a Snow Fence Experiment, EGU General Assembly 2025, Vienna, Austria, 27 Apr–2 May 2025, EGU25-15925, https://doi.org/10.5194/egusphere-egu25-15925, 2025.

For many non-commercial but abundant tree species, detailed knowledge about their seasonal timing of wood formation is lacking. Radius dendrometers are a way of detailly assessing stem diameter variations, that contain both information on tree water status as well as irreversible growth. Recently, low-cost sensors allow to expand the number of replicates and species to assess in detail the seasonal growth of trees. Here we present preliminary results on a dendrometer network (400+ dendrometers) in Belgium (12 species) and in Central-Africa (59 species), and we discuss future avenues for research. Especially the link with dendro-anatomy will be made, and will be specifically challenging for tropical species. Knowing the seasonal window of tree growth allows us to interpret dendroclimatic analysis in temperate regions, and allows us to explore seasonal tropical tree growth, which holds many uncertainties and where rings are not always periodical and visible.

How to cite: De Mil, T.: Deploying a radius dendrometer network to reveal the seasonal growth of trees, EGU General Assembly 2025, Vienna, Austria, 27 Apr–2 May 2025, EGU25-19941, https://doi.org/10.5194/egusphere-egu25-19941, 2025.

EGU25-20027 | Posters on site | CL1.2.1

Multi-proxy tree ring analysis to improve the dating around the Older Dryas  

Simona Staub, Lukas Wacker, Edouard Bard, Patrick Fonti, Frédéric Guibal, Christian Marschal, Cécile Miramont, Daniel Nievergelt, Frederick Reinig, Andreas Rigling, Frauke Rostek, Matthias Saurer, Anne Verstege, and Kerstin Treydte

The longest absolute tree-ring chronology is extended by the Swiss Late Glacial chronology back to about 14 000 BP (years before 1950) with an uncertainty of only 8 years (2-sig, Reinig 2020). Recently published chronologies from Southern France (Bard et al. 2023) extend the Swiss chronologies throughout the Older Dryas further back to 14 350 BP. However, an accurate placement of the mid-resolution (1yr ever 3yr) French radiocarbon chronologies is so far not available and purely base on low-resolution Swiss radiocarbon measurements.

By performing stable isotope (δ18O and δ13C) measurements on French and Swiss trees and additional annual-resolution radiocarbon measurements, we will present a new accurate dating of the French chronologies. We suggest a link between Switzerland and France based on stable isotope signatures, that agrees with the new high-resolution radiocarbon measurement. The evidence of the new placement based on the new multi-proxy approach will be given.


Bard, E. et al. A radiocarbon spike at 14 300 cal yr BP in subfossil trees provides the impulse response function of the global carbon cycle during the Late Glacial. Philosophical Transactions of the Royal Society A: Mathematical, Physical and Engineering Sciences 381 (2023). https://doi.org/10.1098/rsta.2022.0206

Reinig, F. et al. Illuminating Intcal during the Younger Dryas. Radiocarbon 62, 883-889 (2020). https://doi.org/10.1017/Rdc.2020.15

How to cite: Staub, S., Wacker, L., Bard, E., Fonti, P., Guibal, F., Marschal, C., Miramont, C., Nievergelt, D., Reinig, F., Rigling, A., Rostek, F., Saurer, M., Verstege, A., and Treydte, K.: Multi-proxy tree ring analysis to improve the dating around the Older Dryas , EGU General Assembly 2025, Vienna, Austria, 27 Apr–2 May 2025, EGU25-20027, https://doi.org/10.5194/egusphere-egu25-20027, 2025.

EGU25-6050 | Posters on site | HS1.2.3

The First year of the French lysimetric network 

Antoine Sobaga, Pierre Faure-Catteloin, Samuel Abiven, Florence Habets, Noële Enjelvin, and French lysimetric network community

The need for continuous local and long-term observations in the vadose zone has been growing for many years, as they are essential for improving our understanding of the processes occurring in the vadose zone of the soil and enhancing seasonal forecasts from numerical models.

Lysimeters and Ecotrons are the main tools to directly access water and nutrient transport over long periods of time. In France, with the impulsion of the ONEWATER project, a French lysimeter network is in development since April 2024, taking benefice of the existing structure.

A workshop was organised to identify all the sites in France and to collect expectations. We  considered about the major scientific questions that could be supported by such a network, and identifying the measurement systems and instruments that are compatible with our ambitions, as well as considering the management and diffusion of the data.

In 2024, 32 lysimeter sites have been identified in France, with a total of 650 lysimeters. These sites are very heterogeneous : i) different type and size of devices : (columns, boxes, plates, mini-lysimeters, porous cells, Ecotrons, etc.); ii) different filling methods (undisturbed or reconstituted), iii) different measurements (probes, frequency…), iv) different atmospheric condition (natural or controlled)… Despite each site is unique and has specific scientific objectives, they all measure drainage.

The site managers expect this network will help sharing experience in terms of device management, data valorisation and probe development, and to enable the data collected in the sites to be more used.

A main issue with this heterogeneous network is to be able to compare and interprete each site. To do so  several methods will be used, from in situ temporary experiment to numerical simulations. Additional, the individual sites would benefit from some upgrade, with the use of  similar low-cost probes  and  effort will be done to share and valorize the lysimetric data.

How to cite: Sobaga, A., Faure-Catteloin, P., Abiven, S., Habets, F., Enjelvin, N., and lysimetric network community, F.: The First year of the French lysimetric network, EGU General Assembly 2025, Vienna, Austria, 27 Apr–2 May 2025, EGU25-6050, https://doi.org/10.5194/egusphere-egu25-6050, 2025.

EGU25-7456 | ECS | Posters on site | HS1.2.3

Investigating the Effects of Future Climate Scenario on Arbuscular Mycorrhizal Fungal Spore Dynamics in a Belgian Pear Orchard Ecosystem 

Chloë Vercauteren, Vera Claessens, and Nadia Soudzilovskaia

Climate change poses a significant threat to global natural- and agroecosystems, affecting key soil microbial communities, such as arbuscular mycorrhizal fungi (AMF). These fungi form symbiotic relationships with most terrestrial plants, including economically important ones like fruit trees. AMF are significantly sensitive to various climatic parameters, which influence their species composition, diversity, and ecological functions. Additionally, climate change alters AMF temporal dynamics, affecting their growth, distribution, and interactions with host plants across seasons.

Despite these insights, a critical knowledge gap remains in understanding how multiple climatic parameters simultaneously affect the dynamics of AMF communities. This study aims to address this gap by investigating the response of AMF in pear orchards to the worst-case climate scenario (i.e., RCP8.5) projected for Belgium in 2040. We used a state-of-the-art Ecotron facility, to simulate both ambient (2018) and future (2040) climate conditions in a pear orchard. In total six trees have been grown in the Ecotron in each of the climatic conditions. We assessed diversity, composition, and temporal dynamics of AMF spores, revealing patterns of  dormancy and activity, and providing insights into shifts of AMF community phenology induced by climate change. Our research elucidates climate-driven dynamics of AMF in agricultural systems, and provides insights into maintaining sustainable crop production and soil fertility under future climate conditions.

How to cite: Vercauteren, C., Claessens, V., and Soudzilovskaia, N.: Investigating the Effects of Future Climate Scenario on Arbuscular Mycorrhizal Fungal Spore Dynamics in a Belgian Pear Orchard Ecosystem, EGU General Assembly 2025, Vienna, Austria, 27 Apr–2 May 2025, EGU25-7456, https://doi.org/10.5194/egusphere-egu25-7456, 2025.

EGU25-8343 | ECS | Posters on site | HS1.2.3

Soil solution chemistry along a land cover transect in the alpine tundra (NW Italian Alps) 

Andrea Benech, Emanuele Pintaldi, Nicola Colombo, and Michele Freppaz

Soil solution sampling is a critical approach to understand the dynamics of water and nutrient transport in terrestrial ecosystems, however little information is available for high-elevation environments. During the summer 2024, soil solution was sampled at 10 cm depth in the Long Term Ecological Research-LTER site Istituto Mosso (2650 – 2900 m a.s.l., NW Italian Alps), using 30 soil disc lysimeters among 3 distinct vegetation communities belonging to alpine tundra ecosystem: snowbed communities, Carex curvula grasslands, and mixed conditions. This work presents new insights in the application of soil suction lysimeters at high-elevated, logistically-complex environments. By collecting and analyzing the soil solution, we aimed to contribute to the comprehension of the functioning of alpine tundra ecosystems, particularly under the pressure of climate change, focusing on the possible shift in vegetation cover from snowbed communities toward Carex curvula grasslands due to higher air/soil temperature and earlier spring snowmelt. These measurements were complemented by continuous monitoring of soil temperature and moisture, providing a comprehensive understanding of soil dynamics in these ecosystems. Special attention was paid to the transport processes of water and nutrients (namely carbon and nitrogen), which are fundamental to understand biogeochemical cycling in alpine areas. Notably, the content of Dissolved Organic Carbon (DOC) was the highest in Carex curvula grasslands, while nitrate concentrations exceeded those of ammonium across all sites. The outcomes of this study are expected to contribute to advancing methodologies in soil solution sampling and provide critical information for evaluating alpine ecosystem responses to changing climatic conditions. These findings will also help refining our understanding of water and nutrient dynamics, offering implications for both ecological research and management strategies in vulnerable high-elevation environments.

Research supported by NBFC - University of Turin/DISAFA, funded by the Italian Ministry of University and Research, PNRR, Mission 4 Component 2, “Dalla ricerca all’impresa”, Investment 1.4, Project CN00000033

How to cite: Benech, A., Pintaldi, E., Colombo, N., and Freppaz, M.: Soil solution chemistry along a land cover transect in the alpine tundra (NW Italian Alps), EGU General Assembly 2025, Vienna, Austria, 27 Apr–2 May 2025, EGU25-8343, https://doi.org/10.5194/egusphere-egu25-8343, 2025.

EGU25-8359 | Posters on site | HS1.2.3 | Highlight

Development of the "Agricultural Simulator" AgraSim for comprehensive experimental simulation and analysis of environmental impacts on processes in the soil-plant-atmosphere system 

Joschka Neumann, Nicolas Brüggemann, Patrick Chaumet, Normen Hermes, Jan Huwer, Peter Kirchner, Werner Lesmeister, Wilhelm August Mertens, Thomas Pütz, Jörg Wolters, Harry Vereecken, and Ghaleb Natour

For studying the effects of future climate conditions on plant physiological, biogeochemical, hydrological and atmospheric processes in agroecosystems, we developed a large-scale research infrastructure, called AgraSim. AgraSim is an experimental simulator consisting of six mesocosms, each of them consisting of an integrated climate chamber, plant chamber and lysimeter system. The system makes it possible to simulate the environmental conditions in the mesocosms in a fully controlled manner under different weather and climate conditions ranging from tropical to boreal climate. Moreover, it provides a unique way of imposing future climate conditions which presently cannot be implemented under real-world conditions. It allows monitoring and controlling states and fluxes of a broad range of processes in the soil-plant-atmosphere system. This information can then be used to give input to process models, to improve process descriptions and to serve as a platform for the development of a digital twin of the soil-plant-atmosphere system. In detail, each mesocosm consists of a high-precision lysimeter (weighable, control of temperature and lower boundary) with a monolithic soil core (1 m2 surface area and 1.5 m depth) and a transparent, fully controllable plant chamber (7 m3 volume) with an LED light source very similar to the natural solar spectrum with a maximum intensity of 2,500 μmol of photosynthetically active photons per square meter and second. With an in-house developed, fully automated process control system, defined climatic and weather conditions as well as air compositions can be set and varied on the basis of a predefined weather data profile. The inner surfaces of the plant chambers have the purest and most inert properties possible, with the aim of minimizing interactions between the ambient air of the plants and the chamber wall. Strong LED-based plant lighting provides light conditions similar to daylight, which prevents too large heat input into the chamber. A new concept was developed and implemented to dissipate this heat by avoiding condensation at all times, as condensation dissolves gas molecules from the air in the condensate, changing the isotope composition and thus impeding the atmospheric measurements. The process technology includes the precise control of the supply air volume flow, pressure, humidity, carbon dioxide content, air temperature, light intensity within the plant chamber, soil temperature and irrigation.

How to cite: Neumann, J., Brüggemann, N., Chaumet, P., Hermes, N., Huwer, J., Kirchner, P., Lesmeister, W., Mertens, W. A., Pütz, T., Wolters, J., Vereecken, H., and Natour, G.: Development of the "Agricultural Simulator" AgraSim for comprehensive experimental simulation and analysis of environmental impacts on processes in the soil-plant-atmosphere system, EGU General Assembly 2025, Vienna, Austria, 27 Apr–2 May 2025, EGU25-8359, https://doi.org/10.5194/egusphere-egu25-8359, 2025.

EGU25-11225 | Posters on site | HS1.2.3

Higher decomposer functional diversity bolsters ecosystem gross primary productivity resistance under drought: a three-year ecotron study 

Alexandru Milcu, Sandra Barantal, Emmanuel S Gritti, Justine Laoue, Johanne Nahmani, and Stephan Hattenschwiller

Projected climatic conditions, such as more frequent and prolonged droughts, are expected to become more common in many regions of the world according to the IPCC 2023 report, particularly in the Mediterranean. These conditions can reduce plant CO2 uptake, gross primary productivity, and decomposition rates, potentially disrupting the carbon cycle. While higher soil biodiversity might mitigate these adverse drought effects by enhancing productivity and decomposition stability, the net effect on ecosystem CO2 exchange remains largely uncertain, making future carbon cycle predictions challenging.

Using a reconstructed Mediterranean understory model ecosystem, we conducted a three-year experiment in 16 lysimeters (1m³ soil volume, 1m² surface area) at the Montpellier European Ecotron (www.ecotron.cnrs.fr). We tested two levels of decomposer functional diversity (low and high) under ambient summer drought and more intense drought conditions (-30% precipitation and longer drought spells). Our results show that higher decomposer functional diversity maintained up to 25% higher gross primary productivity (GPP) during the early stages of drought. This response was partly due to better water uptake from the deeper soil layers, as indicated by volumetric water content sensors.

How to cite: Milcu, A., Barantal, S., Gritti, E. S., Laoue, J., Nahmani, J., and Hattenschwiller, S.: Higher decomposer functional diversity bolsters ecosystem gross primary productivity resistance under drought: a three-year ecotron study, EGU General Assembly 2025, Vienna, Austria, 27 Apr–2 May 2025, EGU25-11225, https://doi.org/10.5194/egusphere-egu25-11225, 2025.

The dynamic changes of soil water and salt are crucial for crop growth and agricultural productivity. Understanding soil water and salt movement mechanisms, influenced by natural and human factors like climate change, groundwater, and brackish water irrigation, remains challenging. This study focused on the Yellow River Irrigation District, a critical grain-producing area with limited freshwater resources and saline soils. Using Yucheng Station as a case study, field experiments (2004–2020) and model simulations (2023–2053) were conducted to investigate the dynamics and influencing factors of soil water and salt under winter wheat-summer maize rotation.

Field experiments revealed that crop yields decreased with groundwater depth, significantly impacting soil water and salt dynamics. HYDRUS-1D simulations, calibrated with monitoring data (2020–2023), effectively captured these dynamics, achieving high accuracy in soil moisture and salt concentration predictions. Climate change scenarios showed soil water and salt fluctuations aligned with crop growth cycles, with rainfall intensity and crop evapotranspiration being key factors. Higher rainfall in SSP585 scenarios enhanced salt leaching compared to SSP245, while salt accumulation in the cultivation layer was prominent during dry years.

Groundwater depth significantly influenced farmland-water interactions. At shallower depths (2 m), groundwater contributed substantially to crop water use but posed risks of soil salt stress. Conversely, deeper depths (4 m) reduced these contributions, highlighting the balance needed for optimal groundwater management. Long-term brackish water irrigation showed increasing soil salt trends, with salt migration influenced by rainfall and groundwater depth. To mitigate risks and enhance brackish water use, irrigation with ≤3 g/L salt concentration and groundwater depth control at 3 m is recommended for sustainable soil water and salt management, ensuring crop productivity and food security under future climate conditions.

How to cite: Li, F., Qiao, Y., and Li, Z.: Dynamics of Soil Water and Salt in Saline Farmlands: Implications for Brackish Water Irrigation and Climate Resilience, EGU General Assembly 2025, Vienna, Austria, 27 Apr–2 May 2025, EGU25-16521, https://doi.org/10.5194/egusphere-egu25-16521, 2025.

EGU25-18588 | Posters on site | HS1.2.3

The Ecotron Time Machine – Simulating Climate Change in Controlled Environment Facilities 

Bálint Jákli, Roman Meier, and Manuela Baumgarten

Controlled Environment Facilities (CEFs) – including phytotron, ecotron, and lysimeter systems – are essential tools in experimental plant research. Studies conducted in CEFs have substantially advanced our understanding of ecological, physiological, and molecular responses to environmental factors, and have played an important role in the development and parameterization of mechanistic models.

Until recently, climate change research in controlled environments primarily focused on the static manipulation of a single (or few) parameters, notably temperature. However, modern CEFs now enable the highly precise, simultaneous control of multiple environmental variables, such as temperature, VPD, light, soil temperature, and soil moisture, as well as the accurate manipulation of atmospheric gases (e.g., CO₂ and ozone).

The ability to maintain these factors at high temporal resolution effectively turns CEFs into “time machines,” allowing researchers to investigate plant and model-ecosystem responses under realistic climate change scenarios. Although the technical implementation of complex climate series has become more feasible, the core challenge lies in generating climate series that capture potential future conditions while avoiding oversimplification and meeting the scientific requirements for standardization and reproducibility.

In this contribution, we present examples from various experiments conducted at the TUM Model EcoSystem Analyser (TUMmesa). These range from incremental manipulation of individual environmental variables, through the replication of historically recorded climate series, to the dynamic downscaling of global climate models driven by representative concentration pathway (RCP) scenarios.

These recent advancements highlight the potential of modern CEFs to deepen our understanding of plant-environment interactions and support robust investigations of climate change impacts on terrestrial ecosystems.

How to cite: Jákli, B., Meier, R., and Baumgarten, M.: The Ecotron Time Machine – Simulating Climate Change in Controlled Environment Facilities, EGU General Assembly 2025, Vienna, Austria, 27 Apr–2 May 2025, EGU25-18588, https://doi.org/10.5194/egusphere-egu25-18588, 2025.

EGU25-21639 | Posters on site | HS1.2.3

Measuring Evapotranspiration at Cabauw (The Netherlands)  

Evert I. F. de Bruijn and Jessica M. I. Strickland

Droughts in the Netherlands have been exacerbated by climate change, urging better scientific understanding of the hydrological cycle. Moreover, reliable predictions and management rely on accurate water observations at the surface. To date, the Royal Netherlands Meteorological Institute (KNMI) primarily estimates evaporation based on the meteorological conditions such as precipitation and temperature. Meanwhile, the Cabauw Experimental Site for Atmospheric Research has maintained decades of in-situ evaporation observations, exploring a range of indirect in-situ methods. Nonetheless, to better understand how moisture leaves the surface, more direct methods are required. A new smart lysimeter has been deployed which measures the water inflow and outflow of a representative soil and vegetation column. We evaluate this direct method for measuring evapotranspiration and 
compare the performance to other established methods, such as the eddy covariance method. Lysimeter measurements, although precise, are spatially limited, sensitive to small-scale variations, and require rigorous validation. Therefore, we present the initial results of the validation and explore the lysimeter’s potential as a reference standard for more accessible instruments that could broaden the scope of the evaporation observations network. Furthermore, by integrating supplementary in-situ measurements, our findings suggest that applying validated lysimeter data may lead to better closure of the surface energy balance. Looking towards the future, these results have the potential to advance hydrological research, 
inform models, as well as environmental decision-making. 

How to cite: de Bruijn, E. I. F. and Strickland, J. M. I.: Measuring Evapotranspiration at Cabauw (The Netherlands) , EGU General Assembly 2025, Vienna, Austria, 27 Apr–2 May 2025, EGU25-21639, https://doi.org/10.5194/egusphere-egu25-21639, 2025.

EGU25-21644 | Posters on site | HS1.2.3

Advancing Design and Functionality of Lysimeter/Ecotron Systems through Modeling  

Janja Vrzel, Maria Mursaikova, Hans Kupfersberger, and Gernot Klammler

Lysimeter systems play a crucial role in understanding the complex interactions within the soil-plant-atmosphere  continuum.  In  the  context  of  climate  change,  where  precise  insights  into  water  and nutrient fluxes, energy exchange, and greenhouse gas dynamics are essential, lysimeters equipped with advanced hydraulic and thermal controls are increasingly indispensable. A key innovation in this field is the integration of suction-controlled hydraulic boundary conditions and active temperature regulation, which significantly enhances the capability of lysimeters to mimic natural processes while maintaining  experimental  control.  These  functionalities  are  particularly  critical  in  ecotron experimental platforms, where controlled yet realistic environmental conditions are required for high-resolution and high-quality observations. 
Our  research  focuses  on  the  optimization  of  lysimeter  design  and  functionality  using  advanced computational tools. Specifically, we developed a 2D- and a comprehensive 3D-modeling approaches to  investigate  and  refine  the  technical  design  of  lysimeter  systems  equipped  with underpressure-controlled hydraulic boundary conditions and temperature regulation mechanisms. Two simulation models,  HYDRUS  and  FEFLOW,  were  systematically  tested  and  compared  for  their  suitability  in simulating these complex systems. 
We  present  the  results  of  scenario  analyses  conducted  to  evaluate  and  optimize  critical  design parameters, including (1) the number and spatial arrangement of suction cups required to achieve precise suction-controlled hydraulic boundary conditions, (2) the number, positioning, and dimensions of  heat  exchanger  pipes  for  effective  temperature  regulation  and  (3)  the  influence  of  insulation thickness at the bottom of the lysimeter on thermal efficiency and system stability. Our findings also demonstrate the strengths and limitations of both HYDRUS and FEFLOW in capturing the dynamics of water and energy transport in lysimeters. Our work not only contributes to the technical advancement of lysimeter and ecotron platforms but also supports their broader application in ecosystem research. By  integrating  robust  design  methodologies  with  cutting-edge  simulation  tools,  we  provide  a framework for enhancing the reliability and functionality of these experimental systems.  
In  conclusion,  this  study  highlights  the  potential  of  modeling  and  scenario-based  optimization in improving the design and operational efficiency of lysimeters with advanced hydraulic and thermal controls.  The  insights  gained  from  our  research  are  expected  to  support  future  applications of lysimeter and ecotron systems in addressing critical questions related to climate change impacts on terrestrial ecosystems. 

How to cite: Vrzel, J., Mursaikova, M., Kupfersberger, H., and Klammler, G.: Advancing Design and Functionality of Lysimeter/Ecotron Systems through Modeling , EGU General Assembly 2025, Vienna, Austria, 27 Apr–2 May 2025, EGU25-21644, https://doi.org/10.5194/egusphere-egu25-21644, 2025.

EGU25-1437 | Posters on site | AS2.3

Estimating Ground Heat Flux from Net Radiation 

Cheng-I Hsieh and Supattra Visessri

Ground heat flux may play an important role in surface energy balance. In this study we evaluate the performance of the objective hysteresis model (OHM) for estimating ground heat flux from net radiation and compare it with the linear regression model. The experimental sites include residential roofs (concrete), campus grassland, agricultural grassland, and peat bog. Our field measurements show that the mean partition coefficient from net radiation to ground heat flux varied from 0.47 (concrete roof) to 0.079 (agricultural grassland). The mean hysteresis (lag) factors for residential roof, campus grassland, and peat bog were 0.55, 0.26, and 0.11 h, respectively; and the hysteresis factor at the agricultural site was only 0.032 h. However, the partition and hysteresis coefficients in the OHM were found to vary with time for the same surface. Our measurements and analysis show that when the hysteresis factor is larger than 0.11 h, ground heat flux estimates from net radiation can be improved (17–37% reduction in the root mean square error) by using OHM instead of a simple linear regression model.

How to cite: Hsieh, C.-I. and Visessri, S.: Estimating Ground Heat Flux from Net Radiation, EGU General Assembly 2025, Vienna, Austria, 27 Apr–2 May 2025, EGU25-1437, https://doi.org/10.5194/egusphere-egu25-1437, 2025.

The Tibetan Plateau (TP) greatly affects climate and environment systems over Asian through the lower atmospheric mass/energy transfer processes. However, the lower atmospheric processes were not clearly understood due to the limitation of observational data, especially over the TP mountain regions. Observations and model simulations suggested a distinguished land-air transfer and vertical structure over the TP mountain regions, which largely differ from those over plateau flat regions. An inhomogeneous distributions are also found in the land-air exchange processes over the whole TP regions, and a new high-resolution dataset are consequently constructed and developed, under the consideration of different TP climate classification.

How to cite: Zhou, L.: Observational Studies on the Land-air Exchange Processes over the Tibetan Mountain, EGU General Assembly 2025, Vienna, Austria, 27 Apr–2 May 2025, EGU25-1539, https://doi.org/10.5194/egusphere-egu25-1539, 2025.

EGU25-1695 | Orals | AS2.3

Continuous measurements of O2:CO2 flux exchange ratios above a cropland in central Germany 

Christian Markwitz, Edgar Tunsch, Andrew Manning, Penelope Pickers, and Alexander Knohl

The O2:CO2 exchange ratio of land-atmosphere fluxes (ER) can be used to identify sources and sinks of CO2 in land ecosystems. During photosynthesis, the O2:CO2 ER at the leaf level is approximately -1 mol mol-1, reflecting the uptake of one mole of CO2 associated with the release of one mole of O2. However, the ER at the level of entire ecosystems is largely unknown.

Here we present a unique dataset of two years of continuous O2 and CO2 flux measurements at the agricultural FLUXNET site Reinshof (51°29'24.0"N, 9°55'55.2"E, DE-Rns) near Göttingen, Germany, in 2023 and 2024. Fluxes were calculated using flux-gradient approaches with air sampled from three inlets situated at 0.5, 1.0 and 3.0 m above ground. Dry mole fractions of O2 and CO2 were measured using a modified Oxzilla II differential oxygen analyzer (Sable Systems, USA) and a Li-820 CO2 infrared gas analyser (LiCor Biosciences, USA), respectively.

The results show that O2 and CO2 mole fractions and net O2 and CO2 fluxes were strongly anticorrelated. The O2:CO2 flux ER showed a distinct annual cycle, with values around -1.5 mol mol-1 under bare soil conditions and -1.1 mol mol-1 during the main growing season when sugar beet (2023) and winter wheat (2024) was grown, respectively. An influence from anthropogenic emissions was observed during the winter with stable atmospheric stratification, when winds originated from the city centre of Göttingen or the nearby road. The longer vegetation period of sugar beet in 2023 was well reflected by extended O2 release and CO2 uptake, as well as ERs at around -1.1 mol mol-1.

In conclusion, the O2:CO2 ER of a cropland showed considerable seasonal variability, which offers the opportunity to use O2 flux measurements as a tracer of the carbon cycle.

How to cite: Markwitz, C., Tunsch, E., Manning, A., Pickers, P., and Knohl, A.: Continuous measurements of O2:CO2 flux exchange ratios above a cropland in central Germany, EGU General Assembly 2025, Vienna, Austria, 27 Apr–2 May 2025, EGU25-1695, https://doi.org/10.5194/egusphere-egu25-1695, 2025.

EGU25-2935 | Posters on site | AS2.3

Ensemble machine learning for interpretable soil heat flux estimation 

Darren Drewry and James Cross

Soil heat flux (SHF) is a key component of the surface energy balance and a driver of soil physiochemical and biological processes. Despite its importance accurate estimation of soil heat flux is hindered due to variations in soil composition, overlying vegetation density and phenology, and highly variable environmental forcings. These factors have challenged the development of robust models of SHF, with modeling studies focused on mid-day conditions corresponding to satellite overpass times, missing the significant variability that occurs throughout diurnal periods across a growing season. Here we assess the performance of ensemble machine learning modeling for predicting soil heat flux at half-hourly resolution for multiple agro-ecosystems. Observations span a wide range of phenological and climatological variability over a complete growing season. We utilized the random forest machine learning (ML) approach to develop a wide range of models utilizing combinations of predictor variables that include widely-available meteorological conditions and proximal remote sensing observations of reflectance indices and land surface temperature (LST). The performance of the ML models developed here was compared to a set of six semi-empirical soil heat flux models developed around the use of remote sensing information. The random forest ML ensembles demonstrated a general ability to significantly outperform the six semi-empirical models in capturing diurnal variations across the growing season for each of the four crops examined here (soybean, corn, sorghum and miscanthus). We found ML models using the complete set of meteorological and remote sensing predictors captured over 90% of the variability in SHF across all crops. ML models using only LST and NDVI as predictors were able to capture over 82% of SHF variability across all crops. Shapley additive explanations (SHAP) methods were examined to allow for model interpretability, providing insights into the typically opaque ML modeling process. From a set of seven observation variables an exhaustive search was performed to identify predictor attributions for each of the four crops examined here. Models trained with fewer input variables tended to display more linear and interpretable feature attribution, suggestive of physical consistency. LST and air temperature were often the most crucial predictors when present due to high correlation with soil heat flux, with NDVI the next most crucial predictor due to its ability to quantify canopy density and phenological status. These results suggest that robust and accurate soil heat flux estimations can be made at high-temporal resolution purely through simple proximal remote sensing observations and widely available meteorological observations.

How to cite: Drewry, D. and Cross, J.: Ensemble machine learning for interpretable soil heat flux estimation, EGU General Assembly 2025, Vienna, Austria, 27 Apr–2 May 2025, EGU25-2935, https://doi.org/10.5194/egusphere-egu25-2935, 2025.

EGU25-3154 | ECS | Posters on site | AS2.3

Exploring Forest-Atmosphere Interactions Under Heat Extremes in a Semi-Arid Region  

Yotam Menachem, Leehi Magaritz-Ronen, Eyal Rotenberg, Lior Hochman, Shira Raveh-Rubin, and Dan Yakir

The potential effects of desert plantations, such as those used for climate change mitigation, during extreme heat waves remain an important and unresolved question. While the influence of large-scale surface heterogeneity, such as land-sea distribution and mountain ranges on weather, is well established and incorporated in operational numerical weather prediction models, the impact of smaller-scale heterogeneities remains uncertain. Specifically, the interplay between the synoptic forcing and the arising effects of mesoscale interactions is not yet fully understood.  

The Eastern Mediterranean and the Middle East face intensified heat and drought due to climate change, impacting regional weather and local ecosystems. Semi-arid forests, such as the Yatir pine forest on the edge of the Negev Desert, provide a unique lens through which to study land surface-atmosphere feedback, particularly under extreme heat events. 

Ongoing studies show that due to high incoming solar radiation and its low albedo, the Yatir Forest net radiation is higher than in any other eco-regions, balanced by a large sensible heat flux. Thus, the resulting cooler surface suppresses the emission of longwave radiation compared with the surrounding warmer shrubland. The thermal contrast between the forest and the surrounding shrubland can also result in the development of secondary circulations within the PBL. The combined effects of these processes significantly modify the surface-atmosphere energy exchange, can affect the forest microclimate, and, if extended to a larger scale, could potentially impact regional weather and climate.

This research investigates the interactions between the Yatir Forest and the atmosphere under dry heat extremes, focusing on mechanisms driving radiation dynamics, energy fluxes, and local circulations. Our approach combines in-situ measurements from the Yatir Forest, atmospheric reanalysis data, Lagrangian analysis, and high-resolution simulations using the ICON numerical weather prediction model. Through a series of numerical forest configuration experiments incorporating forest-atmosphere feedback, we examine the potential of semi-arid afforestation to influence boundary layer dynamics, exploring the implications for local and potentially regional moderation of extreme climatic events and sustainable land use. We incorporate the concept of the canopy convector effect for semi-arid regions to demonstrate the sensitivity of the numerical results to surface parameters and synoptic conditions causing heat waves.  

  • Department of Earth and Planetary Sciences, Weizmann Institute of Science, Rehovot, Israel (yotam.menachem@weizmann.ac.il)

How to cite: Menachem, Y., Magaritz-Ronen, L., Rotenberg, E., Hochman, L., Raveh-Rubin, S., and Yakir, D.: Exploring Forest-Atmosphere Interactions Under Heat Extremes in a Semi-Arid Region , EGU General Assembly 2025, Vienna, Austria, 27 Apr–2 May 2025, EGU25-3154, https://doi.org/10.5194/egusphere-egu25-3154, 2025.

Open-path (OP) infrared gas analyzers (IRGA) are widely used for CO2 eddy covariance flux measurements in diverse ecosystems, including in arid desert environments. These high sensible heat and low CO2 flux conditions can lead to a systematic bias in the estimation of the carbon exchange. Numerous studies using both open- and closed-path IRGAs report large overestimates of CO2 uptake in the OP measurements, which persists for all seasons and is not driven by biological activity, but rather by instrumentation artefacts. Despite the attempts to address these biases, their origin and the appropriate correction approaches remain unresolved. Sensor-path heat exchange has been considered as a potential source of the bias. Consequently, later models OP gas analyzers have eliminated the self-heating effects, yet they still exhibit apparent CO2 uptake. In this study we consider the influence of ambient air temperature on the absorption in the CO2 spectral band typically used in non-dispersive broadband IRGAs as the source of the bias. We show the results from simulations of infrared transmission in the CO2 spectral band using high resolution molecular transmission (HITRAN) database.  We evaluated the temperature sensitivity of an IRGA by simulating integrated absorption spectra for a typical interference optical filter with a 100 nm passband where the CO2 density was kept constant, and the gas mixture temperature was varied between 244 and 385 K. The data show that if the absorption is not corrected for temperature of the air in the optical sensing path a bias is introduced. The bias causes underestimation of CO2 density at warmer temperatures and overestimation of CO2 density at low temperatures. We conclude that OP gas analyzer measurements need to be corrected for the effects of changes in air temperature in the sensing path. We demonstrate that the correction is not universal, but rather instrument specific and depends on the actual pass band of the specific interference filter used.

How to cite: Bogoev, I.: Addressing a sensible heat bias in open-path eddy covariance carbon dioxide flux measurements, EGU General Assembly 2025, Vienna, Austria, 27 Apr–2 May 2025, EGU25-4594, https://doi.org/10.5194/egusphere-egu25-4594, 2025.

EGU25-5075 | ECS | Posters on site | AS2.3

High-resolution monitoring of CO2/O2 transport in recharge wells 

Ehud Lavner, Avner Gross, and Elad Levintal

The Earth's surface forms a dynamic boundary characterized by continuous gas exchanges between the critical zone and the overlying atmosphere. As global concern grows over climate change driven by increasing levels of greenhouse gases – such as carbon dioxide (CO2) and methane (CH4) – abandoned oil, gas, and even groundwater wells can be significant sources of these emissions. Here, we monitor CO2 and oxygen (O2) and quantify the CO2 flux in two different recharge wells – one that extends below the groundwater level (wet well) and one that reaches into the unsaturated zone above the groundwater level (dry well). Novel monitoring systems that measure CO2, O2, temperature, and relative humidity were installed at the top and bottom of each well, enabling high-resolution, continuous data collection at 1-min time intervals. Using atmospheric measurements taken from a nearby meteorological station, we investigate the mechanisms that influence the air transport between the wells and the atmosphere. The high-resolution measurements indicate different air transport mechanisms between the two wells. In the wet well, there was stratification during the summer, with consistently high CO2 values ​​measured at the bottom of the well while low values ​​were measured at the top of the well. In the dry well, two daily outflow cycles were observed, with high CO2 concentrations and fluxes from the well to the atmosphere. These findings highlight the potential contribution of recharge wells to CO₂ emissions and the importance of understanding their transport mechanisms.

How to cite: Lavner, E., Gross, A., and Levintal, E.: High-resolution monitoring of CO2/O2 transport in recharge wells, EGU General Assembly 2025, Vienna, Austria, 27 Apr–2 May 2025, EGU25-5075, https://doi.org/10.5194/egusphere-egu25-5075, 2025.

EGU25-6444 | Orals | AS2.3

Towards improved understanding on flow decoupling at eddy covariance sites with the aid of a universal coupling metric 

Olli Peltola, Toprak Aslan, Mika Aurela, Annalea Lohila, Ivan Mammarella, Dario Papale, Christoph K. Thomas, and Timo Vesala

Eddy covariance (EC) flux observations deviate from the fluxes at the ecosystem-atmosphere interface when the turbulent flow is decoupled from the surface. This problem severely limits the applicability of the EC technique to monitor ecosystem-atmosphere interactions including trace gas exchange. Despite some progress on understanding vertical coupling processes over the past years, the role and interplay of dynamic stability, canopy drag, and the strength of vertical turbulent mixing remains insufficiently understood. Furthermore, the commonly used metric to identify decoupling, friction velocity, does not represent these processes.

In this work we use the recently developed decoupling metric Omega to detect decoupling at 45 contrasting EC sites across a broad range of canopy architectures and biomes (Peltola et al. 2025, https://doi.org/10.1016/j.agrformet.2024.110326). Omega encapsulates the main processes controlling decoupling in a single dimensionless metric, thus providing a unified framework for studying coupling at all sites. We focus on evaluating the applicability of Omega to detect decoupling at these sites and use it to evaluate the processes controlling decoupling across sites.

The results show that Omega was able to identify coupling at all tested sites satisfactorily. The vertical turbulent carbon dioxide flux showed a similar Omega dependence at all sites, although there was some site-to-site variability. In contrast, when the change in storage flux term was added to the analysis, the similarity between sites disappeared. This suggests that the storage flux term depends on parameters other than those controlling vertical turbulent mixing. Canopy drag played an important role in the formation of decoupling at dense forest sites, and at such sites decoupling was observed even during the day.

Based on these findings, we delineate different Omega regimes in which different mass balance terms (vertical turbulent flux, storage flux and advective components) are important, and discuss improved approaches for detecting the regime where the sum of vertical turbulent flux and storage flux equals the surface gas exchange.

How to cite: Peltola, O., Aslan, T., Aurela, M., Lohila, A., Mammarella, I., Papale, D., Thomas, C. K., and Vesala, T.: Towards improved understanding on flow decoupling at eddy covariance sites with the aid of a universal coupling metric, EGU General Assembly 2025, Vienna, Austria, 27 Apr–2 May 2025, EGU25-6444, https://doi.org/10.5194/egusphere-egu25-6444, 2025.

EGU25-6639 | ECS | Posters on site | AS2.3

Methodological challenges for understory eddy-covariance measurements 

Alexander Platter, Albin Hammerle, and Georg Wohlfahrt

Understory eddy-covariance measurements provide valuable insights into ecosystem CO2 exchange processes, particularly in understanding the interplay between understory and overstory exchange processes. However, their placement deep within the canopy presents some methodological challenges not typically encountered in standard eddy-covariance measurements above the canopy, where surface layer assumptions are generally applicable.

Key challenges arise from the violation of these surface layer assumptions in common flux correction and quality control procedures. Traditional frequency response corrections for flux calculations often rely on idealized cospectra derived from surface layer theory. These assumptions do not hold within the canopy, where spectra and cospectra exhibit distinct characteristics. Furthermore, commonly used turbulence-based quality control metrics, like the integral turbulence test, rely on surface layer scaling relationships to compare measured and modeled fluxes. The application of these relationships within the canopy is questionable due to the altered turbulence structure. For net ecosystem exchange (NEE) measurements, conventional filtering methods, such as friction velocity (u*) filtering, aim to identify periods when measured fluxes are expected to closely represent the true NEE. However, the low fluxes and turbulence characteristic of the understory environment complicate the reliable application of these filtering approaches.

This study critically examines and revises established correction and quality control procedures specifically for understory eddy-covariance measurements. We investigate the impact of these revised methods on understory CO2 exchange estimates using data from an understory site in Tyrol, Austria (At-Mmg). Our results are further compared with the total net ecosystem exchange estimated by an above-canopy eddy-covariance system over the past three years.


How to cite: Platter, A., Hammerle, A., and Wohlfahrt, G.: Methodological challenges for understory eddy-covariance measurements, EGU General Assembly 2025, Vienna, Austria, 27 Apr–2 May 2025, EGU25-6639, https://doi.org/10.5194/egusphere-egu25-6639, 2025.

EGU25-6957 | Posters on site | AS2.3

Carbon fluxes controlled by land management and disturbances at a cluster of long-term ecosystem monitoring sites in Central Europe 

Thomas Grünwald, Matthias Mauder, Luise Wanner, Markus Hehn, Uta Moderow, Ronald Queck, Heiko Prasse, and Christian Bernhofer

Terrestrial ecosystems play a crucial role in carbon sequestration and provide vital ecosystem services such as food, energy, and raw materials. Climate change, through rising temperatures, altered precipitation patterns, and extreme events, threatens the carbon sink potential of these ecosystems, with forests and grasslands particularly at risk. Long-term data from flux tower networks offer valuable insights into how different ecosystems respond to climate change and management interventions, helping to develop strategies to mitigate greenhouse gas emissions and maintain ecosystem resilience. In this study, we present such data from a <10 km cluster of long-term FLUXNET/ICOS sites in Central Europe, comprising an old spruce forest (DE-Tha), a young oak plantation after a cleared windthrow (DE-Hzd), a permanent grassland site (DE-Gri), and an agricultural site with a crop rotation typical for this region (DE-Kli). By analysing decades of data from these four eddy covariance measurement sites, the research highlights the influence of drought, management, and land cover changes on CO2 and H2O fluxes. The interannual variability of evapotranspiration depends less on land use than the CO2 exchange. Our findings show that  forests without terminal disturbances can act as larger carbon sinks than previously estimated. DE-Tha is a consistent carbon sink, with thinning helping to maintain the CO2 sequestration at a stable level of 350 gC m−2 a−1. In contrast, disturbances like clear cutting or windthrow can cause ecosystems to become carbon sources for several years, with recovery delayed due to soil carbon losses from increased respiration (DE-Hzd). While DE-Hzd was resilient to drought, the carbon uptake of DE-Tha was significantly reduced by around 50% during dry years compared to wet years. Furthermore, sustainable management maintains carbon sequestration and land-use practices, such as crop selection, significantly impact net ecosystem productivity. These insights are valuable for optimizing land management strategies to enhance carbon sinks in similar regions.

How to cite: Grünwald, T., Mauder, M., Wanner, L., Hehn, M., Moderow, U., Queck, R., Prasse, H., and Bernhofer, C.: Carbon fluxes controlled by land management and disturbances at a cluster of long-term ecosystem monitoring sites in Central Europe, EGU General Assembly 2025, Vienna, Austria, 27 Apr–2 May 2025, EGU25-6957, https://doi.org/10.5194/egusphere-egu25-6957, 2025.

We present first results of a new BROOK90 hydrological model version. This new version includes a closed energy and water balance for subdaily time steps based on an adapted Shuttleworth-Wallace model for the description of energy and water fluxes for different evaporation components, like interception, soil evaporation and transpiration. The simulation results have been compared to ICOS eddy-covariance measurements from the Anchor Station Tharandt for the year 2022.

The comparison shows considerable good result for 30-minute estimates of latent and sensible heat fluxes from dry surfaces, whiles simulated fluxes from wet surfaces perform worse. Snow conditions seem to be almost random, but rainy conditions might possess a certain correlation between measured and simulated fluxes. Reason for these results can be found on the one hand in the choice of model parameters for vegetation like maximal canopy resistances, leaf area index or canopy height in the model and on the other hand, limitations of the eddy-covariance measurements under wet conditions.

How to cite: Kronenberg, R., Vorobevskii, I., and Luong, T. T.: First results of an extended BROOK90 hydrological model to estimate subdaily water and energy fluxes. A case study of ICOS Anchor station in Tharandt, Germany, EGU General Assembly 2025, Vienna, Austria, 27 Apr–2 May 2025, EGU25-9419, https://doi.org/10.5194/egusphere-egu25-9419, 2025.

EGU25-9629 | ECS | Posters on site | AS2.3

Metrological Traceability in Eddy Covariance Measurements of CO2 Flux 

Alberto Bottacin, Michela Sega, Francesca Durbiano, Francesca Rolle, and Nicola Arriga

The Eddy Covariance (EC) technique is widely used to quantify carbon dioxide (CO2) fluxes between the atmosphere and terrestrial ecosystems, playing a crucial role in climate research and carbon cycle studies. To maximize the impact and the meaningfulness of these measurements, they have to be comparable in time and space. The reliability and comparability of EC data critically depend on ensuring metrological traceability to SI units through national standards or internationally agreed references by means of rigorous calibration practices.

This study examines the traceability chain for key EC components (air temperature and pressure, wind components and CO2 concentration in air), emphasizing calibration processes for gas analyzers. Gas analyzers, which measure CO2 amount fractions, are calibrated using traceable gas mixtures, such as Certified Reference Materials, linked to primary national standards, ensuring accuracy and minimizing biases. We assess the impact of the calibration uncertainty on overall flux estimates and propose a methodology for periodic recalibration of the analysers to account for their drift and response to environmental influences.

By establishing robust links to national metrology standards, this work enhances the traceability and reliability of EC data across diverse ecosystems and temporal scales. The outcomes provide a foundation for harmonizing EC networks globally, improving confidence in CO2 flux measurements and their role in shaping evidence-based climate policies. This focus on calibration underscores the importance of metrology in advancing the precision and usefulness of environmental measurements.


How to cite: Bottacin, A., Sega, M., Durbiano, F., Rolle, F., and Arriga, N.: Metrological Traceability in Eddy Covariance Measurements of CO2 Flux, EGU General Assembly 2025, Vienna, Austria, 27 Apr–2 May 2025, EGU25-9629, https://doi.org/10.5194/egusphere-egu25-9629, 2025.

EGU25-9912 | ECS | Posters on site | AS2.3

Parametrization of extremely heterogeneous land-surface processes 

Christian Wedemeyer and Yaping Shao

The land surface plays a crucial role in the climate system, significantly influencing the exchanges of energy, mass, and momentum among the atmosphere, biosphere, and lithosphere. While land-surface processes in homogeneous terrains are well understood and effectively integrated into the parameterization schemes of existing weather models, our understanding of these processes in extremely heterogeneous regions remains insufficient. This gap in knowledge limits our capacity to accurately parameterize land-surface interactions in such areas. Extremely heterogeneous surfaces are characterized by a variety of soil types and pronounced orographic features, such as mountains or steep slopes.

State-of-the-art weather models commonly utilize the Monin-Obukhov similarity theory (MOST) for parameterizing surface momentum, heat, and moisture fluxes. However, these similarity functions are based on empirical data obtained from field campaigns conducted in homogeneous environments. When these functions are applied to extremely heterogeneous regions, they can produce large biases between modeled and observed surface sensible or latent heat fluxes. Furthermore, in large-eddy simulations (LES), the underlying assumptions of MOST - such as horizontal homogeneity and stationarity - are often violated. Additionally, inconsistencies arise between the fluxes calculated using subgrid closure schemes and those derived from MOST in the surface layer.

To tackle these challenges, we propose an alternative approach that circumvents the use of MOST for parameterizing surface fluxes. In land-surface-parameterization schemes, surface fluxes are often determined using resistance networks. Instead of estimating these resistances using MOST, our aerodynamic resistance approach (ARA) uses the eddy viscosity/diffusivity calculated by the subgrid closure schemes.

First tests in idealized large-eddy simulations (LES) using the Weather Research and Forecasting model (WRF) show that the ARA-calculated surface fluxes are more consistent with the subgrid closure calculations than the MOST-derived fluxes. Next, the ARA will be tested in real-case simulations of the Tengchong site (China) on the Tibetan plateau which is known for its heterogeneous landscape. Moreover, the simulation results will be compared to observational data which has been available at the site for more than 12 years.

How to cite: Wedemeyer, C. and Shao, Y.: Parametrization of extremely heterogeneous land-surface processes, EGU General Assembly 2025, Vienna, Austria, 27 Apr–2 May 2025, EGU25-9912, https://doi.org/10.5194/egusphere-egu25-9912, 2025.

EGU25-10813 | ECS | Orals | AS2.3

Analysing the time scales of variability in carbon dioxide and energy balance components of a tropical Amazon rainforest in central Peru 

Lea Heidemann, Eric Cosio, Rudi Cruz, Juliane Diller, Armin Niessner, Johannes Olesch, Norma Salinas, Rafael Stern, and Christoph Thomas

The Amazon Rainforest plays a vital role in the global carbon and water cycle, yet responses of old growth tropical rainforests to climate change and rising CO2 concentrations remain poorly understood. Especially the western part of the Amazon is underrepresented in ecohydrological studies. At the Panguana research station, as part of the AndesFlux Network, fluxes of CO2, water vapor and the dynamics of the CO2, CH4 and water vapor profile inside the forest and above the 35 m tall canopy have been continuously monitored since December 2023 to fill this gap and determine whether this site acts as a net source or sink for carbon. Building on this objective, our focus extends to understanding the timescales and ecosystem drivers responsible for flux variability, a crucial step toward predicting ecosystem responses to future changes.

As the main objective, we aim at understanding what are the main drivers for ecosystem flux variability, e.g. incoming solar radiation, water availability, or water vapor deficit and on which timescale we can detect the highest variability of ecosystem fluxes. In a tropical region the highest variability in an annual dataset would be expected to occur on a seasonal timescale. However, we did not observe the expected difference in latent heat flux when comparing the mean dial course on a seasonal basis. Surprisingly, we found the highest variability of latent heat flux to occur on much shorter timescales of up to ten days, coinciding with variability of incoming shortwave radiation for which a timescale of highest variability of eight days was detected. Understanding the processes causing this periodicity in latent heat flux in a tropical region and resulting effects on CO2 flux is the primary objective of this analysis.

A further objective of this study presented here is to calculate a CO2-based carbon budget, with the inclusion of the storage term change to understand the effect of ecosystem respiration at night. While the methane exchange to the carbon budget may be significant at this site, it is outside the scope of the current study. Additional objectives of this project include calculating the energy balance of this site and analysing at the surface water balance to better understand seasonal differences and their impact on the carbon cycle.

After calculating the 4h-daytime energy balance closure with different perturbation time scales, we selected a perturbation timescale of 20 min as the best compromise between reducing the systematic and random flux errors. This choice leads to a high energy balance closure of 75% over the course of one year maximizing to 80% when calculated for the rainy season.

These analyses contribute to a deeper understanding of the driving processes of ecosystem exchange in the tropical rainforest near the Andes and help to assess how this part of the Amazon basin may respond to future changes in water availability and atmospheric circulation.

How to cite: Heidemann, L., Cosio, E., Cruz, R., Diller, J., Niessner, A., Olesch, J., Salinas, N., Stern, R., and Thomas, C.: Analysing the time scales of variability in carbon dioxide and energy balance components of a tropical Amazon rainforest in central Peru, EGU General Assembly 2025, Vienna, Austria, 27 Apr–2 May 2025, EGU25-10813, https://doi.org/10.5194/egusphere-egu25-10813, 2025.

EGU25-10940 | ECS | Posters on site | AS2.3

Measuring urban surface fluxes using a mobile eddy-covariance system at a fine resolution to develop a heat mitigation strategy in a mid-sized European city   

Lars Spakowski, Sophie Resch, Johannes Olesch, and Christoph Thomas

As demographic trends continue to point towards urbanisation and urban climate change-related health risks are increasing, a fundamental understanding of the processes that shape the urban boundary layer climate is becoming increasingly important. While previous studies have used mobile measurement devices to measure instantaneous physical weather elements in high spatial resolution in an urban environment, high-resolution measurement data on atmospheric flux densities in cities is scarce.

We present an innovative approach to measure latent and sensible heat fluxes, as well as CO2 fluxes and further flow statistics as TKE in a mid-sized city (75,000 citizens) in Central Europe using a mobile eddy-covariance (EC) system on a cargo bike with first measurements executed during a radiation night and three consecutive heat days in August 2024. Our goal was to gain flux density data for several street transects in a heterogeneous urban environment during the hottest and coldest time periods of the day. To compare the measured temperature and humidity used for the eddy-covariance calculations, we set up eight weather stations mounted on streetlights along our measurement route, at which we stopped for two minutes each. Motion data was observed with an integrated high precision inertial navigation system (INS) to adjust the EC observation for bicycle movements. To ensure nearly steady-state conditions were fulfilled, the perturbation and averaging periods were fitted to calculate flux densities along approximately homogeneous street transects. As the bike velocity of 4 to 6 m s-1 only allows for relatively short averaging periods of up to a minute in the heterogenous environment, only the high-frequency fraction of the turbulence spectrum can be quantified. Assuming a similar distribution of the inertial subrange turbulence across the research area, this choice still allowed for comparison of the fluxes along the route.

With our route traversing a range of land surface conditions from a densely built-up district centre to a floodplain valley adjacent to the city, we were able to determine a strong heterogeneity in the expression of the urban heat and park cool islands within our study area. First results of the EC calculations indicate the capability of our mobile flux system to detect fine differences in flux densities within the heterogeneous urban environment.

Our flux measurements together with the additionally measured weather elements of solar radiation, temperature, humidity, wind direction and wind speed from the eight stationary micro weather stations within the study area provide the foundation for the development of a heat adaption strategy in the city district aiming at creating an environment with diminished health risks and urban heat island effects. 

How to cite: Spakowski, L., Resch, S., Olesch, J., and Thomas, C.: Measuring urban surface fluxes using a mobile eddy-covariance system at a fine resolution to develop a heat mitigation strategy in a mid-sized European city  , EGU General Assembly 2025, Vienna, Austria, 27 Apr–2 May 2025, EGU25-10940, https://doi.org/10.5194/egusphere-egu25-10940, 2025.

EGU25-11746 | ECS | Posters on site | AS2.3

Evaluating a Flux Footprint Model Using Tracer Release Experiments and Tall Tower Eddy Covariance Measurements 

Ziqiong Wang, Konstantinos Kissas, Charlotte Scheutz, and Andreas Ibrom

In complex and heterogeneous landscapes, determining the spatial origin of measured fluxes is critical for interpreting eddy covariance (EC) data accurately. To address this, footprint models are used to simulate the transport of turbulence and quantify the contribution of different areas within the source region. These models rely on theoretical assumptions, such as homogeneous and stationary atmospheric conditions, which often deviate significantly from real-world conditions particularly in terrains with uneven topography or land cover. This discrepancy may lead to substantial uncertainties, as the models may fail to accurately represent the true flux contributions under these non-ideal conditions.

To evaluate the reliability of the Flux Footprint Prediction (FFP) model (Kljun et al., 2015) and its performance under real-world conditions, we conducted three tracer release campaigns in the upwind region of a tall tower EC greenhouse gas observation system located at Hove (55.7169°N, 12.2375°E), a rural area west of Copenhagen, Denmark. The experiments utilized acetylene (C₂H₂) as the tracer gas, released at a controlled and precisely known emission rate.  The FFP model were assessed using data from different averaging intervals, enabling a detailed comparison of temporal resolutions and their impact on flux estimates.

The observed fluxes were systematically compared with the model predictions, allowing us to identify discrepancies and provide critical insights into the strengths and limitations of the FFP model, particularly in rural and heterogeneous landscapes. Moreover, the analysis highlights the influence of averaging intervals on the agreement between measured and modelled fluxes. This work also provides a reference for applying tracer release experiments in heterogeneous terrain using the tall tower EC system, contributing to the understanding of experimental design and model validation in such environments.

How to cite: Wang, Z., Kissas, K., Scheutz, C., and Ibrom, A.: Evaluating a Flux Footprint Model Using Tracer Release Experiments and Tall Tower Eddy Covariance Measurements, EGU General Assembly 2025, Vienna, Austria, 27 Apr–2 May 2025, EGU25-11746, https://doi.org/10.5194/egusphere-egu25-11746, 2025.

For the past five decades, modelers have relied on Monin-Obukhov Similarity Theory (MOST) to model surface exchanges for application in atmospheric models for boundary layer meteorology and weather and climate prediction. During this time, studies have also illuminated some of the limitations of MOST based surface layer parameterizations, particularly when MOST’s foundational assumptions of flat and horizontally homogeneous terrain are violated. Recent work over groups of meteorological towers from Stiperski and Calaf 2023 have provided a promising method to account for these deviations from the ideal, traditional MOST using the anisotropy of turbulence to create new surface exchange relations. These modified relations may be able to capture the deviations from MOST specifically around non-homogeneous surfaces, and non-stationarity. To further assess the validity of the Stiperski relations, we examine them over 7 years of turbulence data from the 47, ecologically diverse eddy-covariance tower sites in the National Ecological Observation Network (NEON) and develop new anisotropy generalized MOST scalings for the scalar variances of moisture and carbon.


The relations from Stiperski and Calaf 2023 show significant improvement over traditional MOST based schemes for predicting the velocity variances as well as the variances of heat, moisture and carbon in the NEON network under both stable and unstable stratification. This extends the work of Stiperski and Calaf to vegetated canopies, where the scaling has not been previously examined. The improvement is consistent across the varied ecosystems present in NEON, including tropical, arctic, and mountainous sites. For the streamwise velocity variance, for example, we see a median improvement (measured with a skill score) of 40% at the NEON sites. Characteristics of anisotropy are also examined across the sites, with an eye towards developing model relations for turbulence anisotropy applicable in large scale schemes (i.e. numerical weather prediction and earth system models. Initial results for the scaling of the gradients of heat and momentum, which can be used to parameterize surface fluxes in the modeling context, are also shown, with promising improvement over traditional MOST despite significant scatter. The route for application of these schemes in surface layer parameterizations in ESMs is also briefly explored, with an eye towards the potential for significant improvements in modeling of surface exchange.


How to cite: Waterman, T., Stiperski, I., and Calaf, M.: Extending Generalized Surface Layer Scaling to Diverse, Complex Terrain and Canopies for Improved Land-Atmosphere Exchange, EGU General Assembly 2025, Vienna, Austria, 27 Apr–2 May 2025, EGU25-11806, https://doi.org/10.5194/egusphere-egu25-11806, 2025.

EGU25-12023 | ECS | Posters on site | AS2.3

Irrigation impacts on the severe summer 2003 drought and heat wave event in Central Europe 

Dragan Petrovic, Benjamin Fersch, and Harald Kunstmann

Irrigation is triggered through climatic conditions, but reversely affects the climate itself. A model sensitivity analysis of the irrigation impacts on the severe summer 2003 drought and heat wave event in Central Europe is carried out here. For this purpose, the Weather Research and Forecasting (WRF) model is employed with a newly developed and modified irrigation scheme. A two-domain nested setup with 12 km horizontal grid resolution in the outer domain and convection-resolving 3 km in the inner domain is selected. Two ensembles, one with and one without irrigation, are initialized to assess the irrigation impacts with greater security. Four subregions are defined: a region containing all of Germany, two small regions with locally higher irrigation amounts within Germany and an area in the Po Valley, the region with highest irrigation quantities in Central Europe. This way, the influence of different irrigation amounts is investigated. Impacts on the following variables are examined in different temporal scales: air temperature, soil moisture, planetary boundary layer height (PBLH), sensible and latent heat flux, moisture flux divergence, convective available potential energy (CAPE), and convective inhibition (CIN). The results indicate that the overall influence of irrigation during the extreme event is rather small. This is related to the comparatively low irrigation amounts and the extreme conditions. A partially significant increase in soil moisture in the topsoil layer occurs in the Po Valley. Generally, irrigation is found to reduce PBLH and sensible heat flux as well as increasing the latent heat flux. In addition, a cooling effect is partly found in the daily mean cycle of temperature. Furthermore, there are visible effects on moisture flux divergence (tendency to decrease or convergence), on CAPE (increase) and on CIN (less increase). These effects are most pronounced in the Po Valley due to the higher irrigation amounts.

How to cite: Petrovic, D., Fersch, B., and Kunstmann, H.: Irrigation impacts on the severe summer 2003 drought and heat wave event in Central Europe, EGU General Assembly 2025, Vienna, Austria, 27 Apr–2 May 2025, EGU25-12023, https://doi.org/10.5194/egusphere-egu25-12023, 2025.

EGU25-12704 | Orals | AS2.3

Spatial source attribution of eddy covariance flux data by inversion optimization 

Mark Schlutow, Ray Chew, Theresia Yazbeck, and Mathias Göckede

Since eddy covariance (EC) flux towers are typically mounted within structured landscapes, interpreting EC flux data is complicated due to spatial heterogeneity, which may exhibit sources and sinks simultaneously. This complexity makes it challenging to understand mechanisms and controls determining flux budgets for the individual land cover types that make up the entire ecosystem. Therefore, it complicates the scaling of flux results in space and/or time, or comparing EC fluxes under different environmental conditions.

We present a novel tool to decompose blended flux data from EC towers into individual components emitted by different land cover types within the tower’s footprint. The tool has two key components: 1) an exceptionally efficient algorithm that solves the steady-state transport equation, and 2) a linear optimizer to solve the inversion problem. This design allows for the analysis of years of continuous EC data on a typical desktop computer in a short time, with output consisting of half-hourly flux data for each land cover type individually.

The approach is entirely data-driven and can be applied to the fluxes of energy and scalars such as methane, N2O, or CO2. The model takes as input a land cover map containing the footprint and the standard output from the raw eddy data processing software, EddyPro. The accuracy of the flux attribution tool was validated using two EC towers in close proximity, sharing the same ecosystem and meteorological conditions, but with different land cover structures in the footprint. The agreement between the inversion results for each of the towers proves its applicability for a wide range of research questions.

How to cite: Schlutow, M., Chew, R., Yazbeck, T., and Göckede, M.: Spatial source attribution of eddy covariance flux data by inversion optimization, EGU General Assembly 2025, Vienna, Austria, 27 Apr–2 May 2025, EGU25-12704, https://doi.org/10.5194/egusphere-egu25-12704, 2025.

While covering only about 3% of the global land surface, peatlands store approximately one-third of all terrestrial carbon (C) and 12–21% of global soil organic nitrogen (N). Pristine peatland soils typically function as minor sinks for carbon dioxide (CO2), moderate sources of methane (CH4), and minor to moderate sources of nitrous oxide (N2O). However, over the past century, extensive drainage of peatlands for forestry, particularly in temperate and boreal regions, has substantially altered the dynamics of greenhouse gases (GHG).

The lowering of the groundwater table has a crucial impact on soil GHG exchange with aerobic conditions inhibiting methanogenesis, thereby reducing CH4 flux, while simultaneously increasing N2O flux and accelerating peat decomposition. These changes transform peatlands from carbon sinks to net carbon sources and intensify their N2O emissions. However, actively growing tree stands may partially offset soil carbon losses through sequestration and indirectly modulate CH4 and N2O fluxes by altering soil moisture and microbial activity.

While the net ecosystem exchange of drained peatland forest soils is relatively well studied, there's limited knowledge regarding ecosystem-scale GHG fluxes, especially in the transitional hemiboreal forest zone. In this study, we present the first years of eddy-covariance measurements of CO2, CH4, and N2O fluxes from a drained peatland forest in Eastern Estonia. The site, drained in the early 1970s via an open-ditch network, is dominated by Downy Birch (Betula pubescens, 64%) and Norway Spruce (Picea abies, 36%). The current soil profile, classified as Drainic Eutric Histosol, features a peat layer approximately one meter thick and a moderate C:N ratio (15.1) in the upper soil horizon. Our findings contribute to the growing body of knowledge on peatland forest GHG fluxes, offering valuable data for managing forested peatlands in a changing climate.

How to cite: Krasnova, A., Soosaar, K., and Mander, Ü.: The greenhouse gas exchange of a drained peatland forest: first insights from eddy-covariance measurements of CO2, CH4 and N2O fluxes in Estonia, EGU General Assembly 2025, Vienna, Austria, 27 Apr–2 May 2025, EGU25-13303, https://doi.org/10.5194/egusphere-egu25-13303, 2025.

EGU25-14269 | Orals | AS2.3

Investigating the Role of Kilometer-scale Surface Thermal Heterogeneity in Secondary Circulations Using Satellite Remote Sensing and Doppler Lidars 

Nathaniel Chaney, Peter Germ, Marc Calaf, Eric Pardyjak, and Tyler Waterman

Spatially organized km-scale surface thermal heterogeneity can lead to the formation of secondary circulations, which, in turn, can influence the boundary layer and the initiation, development, and enhancement of cumulus clouds. While the importance of this process is becoming well recognized, quantitative understanding of the relationship between thermal heterogeneity and the corresponding circulations remains largely confined to modeling studies. In this study, we use observational data from the ARM Southern Great Plains (SGP) site to explore how combining satellite remote sensing of land surface temperature (LST) with a mesoscale network of Doppler lidars can help understand the role of surface thermal heterogeneity in driving secondary circulations.
We analyze data from five Doppler lidars at SGP, which have been continuously measuring vertical profiles of wind components (u, v, w) at high temporal frequency since 2016. The combination of the five time-varying profiles are used to compute vertically integrated dispersive kinetic energy (DKE) at each time step as an indirect measure of circulation strength. LST data from GOES-16/17 is then used to quantify surface thermal heterogeneity, particularly in the morning hours. Our analysis focuses on days with minimal synoptic forcing to isolate local effects. Preliminary results show a statistically significant positive correlation between surface thermal heterogeneity and DKE, suggesting a link to the strength of secondary circulations. This study highlights the potential to improve our understanding of this process and provides a valuable tool for evaluating Earth system models that aim to represent the role of km-scale thermal heterogeneity in the atmosphere.

How to cite: Chaney, N., Germ, P., Calaf, M., Pardyjak, E., and Waterman, T.: Investigating the Role of Kilometer-scale Surface Thermal Heterogeneity in Secondary Circulations Using Satellite Remote Sensing and Doppler Lidars, EGU General Assembly 2025, Vienna, Austria, 27 Apr–2 May 2025, EGU25-14269, https://doi.org/10.5194/egusphere-egu25-14269, 2025.

EGU25-15199 | ECS | Orals | AS2.3

Discovering new Influences on Dispersive Heat Fluxes over Heterogeneous Surfaces with Machine Learning 

Benita Wagner, Matthias Karlbauer, Martin Butz, Matthias Mauder, and Luise Wanner

To better understand and quantify the dynamics of surface thermal heterogeneities and their effect on energy transport in form of dispersive fluxes within the atmospheric boundary layer, we investigate the significance and applicability of the heterogeneity parameter after Margairaz et al. (2020). We aim to overcome this non-dimensional scaling quantity, since it depends on parameters such as the heterogeneity length, scale, and temperature amplitude, which are originally determined for checker-board-type surfaces but may be less suited to describe the complexity of real-world surface structures. To address this goal, we train separate artificial neural networks (ANNs) to predict dispersive sensible and latent heat fluxes for a randomized quadratically shaped heterogeneity distribution, as well as for datasets from the CHEESEHEAD19 campaign representing a real-world complex surface heterogeneity with a broad spectrum of patch sizes and gradual changes in surface characteristics. To investigate the role of the different input variables, we train various ANNs receiving different combinations of variables and compute feature importance weightings afterwards. We scrutinize the role of traditional input variables such as the heterogeneity parameter, temperature or humidity gradients, boundary layer height, and atmospheric stability measures. Further, we consider the incorporation of raw input features, such as horizontal and vertical wind speed, temperatures, and humidities. Finally, we incorporate spatial temperature maps, which we pre-process with a convolutional ANN. We make three core observations. First, the incorporation of raw input features beyond traditional variables improves both the dispersive sensible and latent heat flux diagnosis, suggesting room for improvement in the input variable selection and combination. Second, the inclusion of the spatial temperature map is more meaningful for dispersive latent than for sensible heat flux diagnosis. Third, the heterogeneity parameter after Margairaz et al. (2020) is informative for synthetic randomized quadratically shaped surfaces, but not for real-world complex surface heterogeneity environments, in which case the spatial temperature map processed by a convolutional ANN is most valuable. The results imply that the role of the compressed spatial temperature map should be explored further. We ultimately aim to extract an equation from the neural network characterizing heterogeneous surfaces. Furthermore, the incorporation of the other identified useful raw input features – ideally in form of an equation – needs to be assessed in further depth. 

How to cite: Wagner, B., Karlbauer, M., Butz, M., Mauder, M., and Wanner, L.: Discovering new Influences on Dispersive Heat Fluxes over Heterogeneous Surfaces with Machine Learning, EGU General Assembly 2025, Vienna, Austria, 27 Apr–2 May 2025, EGU25-15199, https://doi.org/10.5194/egusphere-egu25-15199, 2025.

EGU25-15275 | ECS | Orals | AS2.3

Urban effects on atmospheric boundary-layer clouds, mixed-layer height and fog detected by a dense network of ceilometers in Berlin, Germany 

Daniel Fenner, Andreas Christen, Sue Grimmond, Simone Kotthaus, Fred Meier, and Matthias Zeeman

Gaining a deeper understanding of dynamic interactions between cities and the atmospheric boundary layer (ABL) and ABL processes in general is crucial for, e.g., the development and application of next-generation numerical weather prediction and climate modelling. In this context, detailed ABL observations provide essential information to identify potential spatial heterogeneity in urban and rural environments with respect to surface-atmosphere exchanges and resulting ABL characteristics such as ABL clouds.

As part of the year-long urbisphere-Berlin measurement campaign in Berlin, Germany (October 2021-September 2022), a wide range of ABL observations were carried out to study impacts of the city on the ABL. Central to the deployed systematic network were 25 sites with ground-based Automatic Lidar and Ceilometers (ALC) to measure aerosol backscatter for investigation of intra-urban, urban-rural, and upwind-city-downwind effects of ABL clouds and detection of the mixed layer.

Here, we present a systematic investigation of year-round effects of the city on ABL cloud-base height and cloud-cover fraction, mixed-layer height, and near-surface fog conditions, exploiting the dense ALC network. The comprehensive data set allows studies along diurnal and annual cycles in high temporal resolution, as well as obtaining robust statistical results for groups of sites, considering spatial heterogeneity due to local effects around the sites. Our analyses show city effects on ABL clouds along the diurnal cycle including upwind-city-downwind effects, yet also depending on cloud type and season. Mixed-layer height undergoes a distinctive annual cycle, being systematically higher above the city and with intra-urban differentiation. Over the year, the occurrence of ground-based fog is on average 1,5 times more frequently found at rural sites compared to city sites, most prominent differences are found during autumn and winter. These results are the first that are based on the complete year-long urbisphere-Berlin ALC data and highlight potentials and benefits of such high-resolution observational data sets from ground-based remote sensing for future investigations.

How to cite: Fenner, D., Christen, A., Grimmond, S., Kotthaus, S., Meier, F., and Zeeman, M.: Urban effects on atmospheric boundary-layer clouds, mixed-layer height and fog detected by a dense network of ceilometers in Berlin, Germany, EGU General Assembly 2025, Vienna, Austria, 27 Apr–2 May 2025, EGU25-15275, https://doi.org/10.5194/egusphere-egu25-15275, 2025.

EGU25-17589 | Orals | AS2.3

Metrology for fluxes: eddy covariance measurement uncertainty 

Nicola Arriga and Alberto Bottacin

The uncertainty evaluation of eddy covariance flux measurements has been thoroughly developed in the last two decades. However, the various methods proposed are not yet fully compliant with the internationally accepted metrological guidelines, e.g. those indicated in the Guide to expression of uncertainty in measurement and related supplements issued by the Joint Committee for Guides in Metrology and internationally adopted as reference in metrology. Scope of this presentation is to implement the formal methodology for the determination of a combined standard uncertainty for the estimated fluxes through the law of propagation of uncertainty, assuming independent variables. Compared to previous methods, this approach considers the complete flux equation, including the coordinate rotations and the physical conversions and, most importantly, provides an easy to implement analytical tool to quantify the individual contributions to the full measurement uncertainty arising from all the variables actually included in the calculation (turbulent wind components, scalar of interest, air temperature and pressure). The linear method adopted for uncertainty propagation has been also validated through a Monte Carlo simulation, which is the gold standard for propagating probability distributions. The methodology has been applied to a full year of carbon dioxide fluxes measured in the San Rossore 2 ICOS Ecosystem Station, a Mediterranean forest, but it is valid for most of the common eddy covariance systems, being based on theoretical principles. The median of the estimated relative uncertainty of the flux over the considered year is 13.5%, assuming an instrumental uncertainty of 30 Pa for the barometer, 0.5 °C for the thermometer, 4 ppm for the CO2 analyzer and 0.4 m/s for the three components of the sonic anemometer. The main uncertainty contributions come from the analyzer and the vertical component of the anemometer, with medians of the evaluated relative uncertainties equal to 11.9% and 3.25%, respectively. Preliminary results suggest that the method is robust and confirm expectations about the relative contribution of the different instruments used for flux determination, but at the same time constitute a tool for a sounder metrological assessment of all eddy covariance measurements and applications.

How to cite: Arriga, N. and Bottacin, A.: Metrology for fluxes: eddy covariance measurement uncertainty, EGU General Assembly 2025, Vienna, Austria, 27 Apr–2 May 2025, EGU25-17589, https://doi.org/10.5194/egusphere-egu25-17589, 2025.

Land-atmosphere (L-A) feedback plays a key role in the evolution of Earth’s weather and climate system. However, the understanding and simulation of land-atmosphere interaction still suffers from severe limitations and errors. For instance, Abramowitz et al. (2024) demonstrated that the simulation of surface fluxes by land-atmosphere models, irrespective of their complexity, strongly deviates from observations. Similarly, Monin-Obukhov Similarity Theory (MOST) seems to be inadequate (Wulfmeyer et al. 2023) for the parameterization of evapotranspiration, but is nevertheless used in almost all coupled land-atmosphere system models.  

The overarching goal of LAFI is to understand and quantify L-A feedbacks via unique synergistic observations and model simulations from the micro-gamma (» 2 m) to the meso-gamma (» 2 km) scales across diurnal to seasonal time scales. In this presentation, we give an overview of the objectives and the current results of LAFI with respect to the understanding of surface-layer flow and fluxes, the energy balance closure (EBC), and entrainment over heterogenous agricultural terrain. More insight will be gained by the LAFI field campaign, which will be performed from Spring to Autumn 2025 at the Land-Atmosphere Feedback Observatory (LAFO) of the University of Hohenheim. The LAFI field campaign will enhance the current sensor synergy at LAFO, in order to capture key variables more fully within the soil, vegetation, and atmosphere compartments (Späth et al. 2023). Highlights of the new LAFI instrumentation include water-vapour isotope sensors, sap-flow sensors, fiber-optical distributed sensors (FODS, Thomas and Selker, 2021),unmanned aerial vehicles (UAVs), and scanning water-vapor, temperature, and wind lidar systems. We demonstrate how these measurements complement each other to gain new insights into flux-driver relationships, soil evaporation, crop transpiration, and entrainment, as well as the impact of land-surface heterogeneities and dispersive fluxes on the EBC. The very first results of this campaign will also be presented. 


References: 

Abramowitz et al. 2024: https://bg.copernicus.org/articles/21/5517/2024 

Späth et al. 2023: https://doi.org/10.5194/gi-12-25-2023 

Thomas, C.K., Selker, J.S., 2021. https://doi.org/10.1007/978-3-030-52171-4_20 

Wulfmeyer et al. 2023: https://link.springer.com/article/10.1007/s10546-022-00761-2  


How to cite: Wulfmeyer, V.: The Land-Atmosphere Feedback Initiative (LAFI): Field observations, modeling approaches, and first results, EGU General Assembly 2025, Vienna, Austria, 27 Apr–2 May 2025, EGU25-19157, https://doi.org/10.5194/egusphere-egu25-19157, 2025.

EGU25-19174 | ECS | Posters on site | AS2.3

Evaluation of CO2 and energy balance fluxes from a maize canopy in east Tennessee using the SURFATM model 

Taqi Raza, Erwan Personne, Nebila Lichiheb, Neal Eash, and Joel Oetting

Field crops can emit or store carbon depending on the season and cropping practices. A process-based modeling approach allowed us to predict the transfer pattern of the CO2 fluxes and energy balance between soil, vegetation, and atmosphere. In this study, the SURFATM-CO2 model was developed to simulate distinctly the CO2 exchanges between soil, plants, and the atmosphere. The model couples soil respiration, taking into account its temperature sensitivity, with photosynthesis and plant respiration process-based, taking into account the plant's CO2 compensation point. The SURFATM-CO2 process model was evaluated using field measurements obtained from a novel multiport profile system consisting of 4 vertical measurement heights to monitor the spatial and temporal variation of CO2, water, and temperature within and above the maize canopy in east Tennessee. The 5Hz frequency raw data were averaged into 15-minute runs and used as input for the SURFATM model. The model satisfactorily simulates the energy balance, and we are currently testing the model for the CO2 fluxes.  The main objective of this study is to understand the exchanges of CO2 between the soil, vegetation and atmosphere compartments. The finding of the SURFATM-CO2 model will highlight the ability of the SURFATM-model to capture the canopy-atmosphere interaction as well as provide a base for model application in the studies of carbon dynamics, and cropland ecosystem management.

How to cite: Raza, T., Personne, E., Lichiheb, N., Eash, N., and Oetting, J.: Evaluation of CO2 and energy balance fluxes from a maize canopy in east Tennessee using the SURFATM model, EGU General Assembly 2025, Vienna, Austria, 27 Apr–2 May 2025, EGU25-19174, https://doi.org/10.5194/egusphere-egu25-19174, 2025.

EGU25-20222 | ECS | Posters on site | AS2.3

 Assessing the discrepancy of energy fluxes over spring wheat under sloping topography conditionsbased on eddy covariance measurements 

Jingyu Yao, Zhongming Gao, Lei Li, Eric Russell, Shelley Pressley, and Yongjiu Dai

Accurately quantifying surface energy budgets in croplands is essential for efficient water resource allocation and sustainable agricultural practices. However, the representativeness of eddy covariance (EC) measurements in hilly agricultural fields remains less examined. In this study, we conducted an experiment employing three EC flux towers to assess the consistency of surface energy budget components across a hilly agricultural field (~90 acres). The experimental field was divided into three zones, each equipped with an EC tower positioned at its central location to ensure that 90% of the flux footprint fell within the corresponding zone (i.e., US-SZ1, US-SZ2 and US-SZ3). The meteorological conditions and energy fluxes were found to be significantly influenced by various agricultural activities, including both growing and non-growing periods, as well as cropland management practices. Despite relatively similar meteorological conditions observed across the three sites during the wheat growing period (WGP), substantial discrepancies were evident in the primary energy budget components, with the exception of net radiation, at both diurnal and seasonal scales. During WGP, the sensible, latent, and ground heat fluxes exhibited differences within 10%, 27%, and 29%, respectively, leading toconsiderable disparities in the energy balance closure. The closure ratios (CRs) for US-SZ1, US-SZ2, and US-SZ3 were approximately 93%, 84%, and 85% respectively. The influence of environmental variables on the discrepancies in their CRs were also investigated. The relationships between CRs and friction velocity, atmospheric stability, turbulent kinetic energy, as well as heat transport efficiency exhibited certain distinctions among the three sites. Our findings indicate that factors like site elevation, topography, and measurement uncertainty differentially affect energy flux components in sloping landscapes. Employing multiple tower/point measurements is crucial for reducing uncertainties in energy flux estimates under sloping terrain conditions.

How to cite: Yao, J., Gao, Z., Li, L., Russell, E., Pressley, S., and Dai, Y.:  Assessing the discrepancy of energy fluxes over spring wheat under sloping topography conditionsbased on eddy covariance measurements, EGU General Assembly 2025, Vienna, Austria, 27 Apr–2 May 2025, EGU25-20222, https://doi.org/10.5194/egusphere-egu25-20222, 2025.

EGU25-2846 | Orals | SSS9.2

Strong nutrient uplift associated with forest growth in northern forests 

Marie Spohn, Erik Karltun, and Johan Stendahl

Northern forests are currently taking up large quantities of carbon due to forest growth. Yet, it is not known for how long the capacity of the soils to provide enough nutrients to support high forest growth will last. Therefore, it is important to understand nutrient dynamics in northern forests.

We analyzed 33,500 forest soils in Sweden in four repeated inventories covering the period 1983 to 2022.

During the four decades, the standing wood volume and the tree stem diameter increased by 15% and 29%, respectively, across all of Sweden. The plant-available magnesium (Mg), calcium (Ca), and manganese (Mn) concentrations of the organic layer increased continuously and significantly over the four decades across all of Sweden by 38%, 21%, and 100%, respectively. In the south of Sweden, where tree growth and biomass are highest, the Mg and Ca concentrations increased particularly strongly by 62% and 31%, respectively, over the four decades. The concentrations of plant-available Mg and Ca of the organic layer and their increases were related to properties of the mineral soil, such as soil texture and the Mg concentration of the parent material. Further, Mg and Ca concentrations of the organic layer were significantly higher and increased more strongly in broadleaf forests and spruce forests than in pine forests. The nitrogen (N) stock of the organic layer was highest in the second inventory, i.e., in the 1990s, and lowest in the fourth inventory. From the first inventory in the 1980s to the fourth inventory, the N stock of the organic layer decreased by 6% across all of Sweden.

Our results suggest that the increase in tree biomass and tree size caused an uplift of Mg, Ca, and Mn from the mineral soil to the organic layer, likely due to tree luxury uptake of these elements in the mineral soil. Furthermore, the N stock of the organic layer decreased over the last decades likely due to tree growth, after it was comparatively high in the 1990s due to high atmospheric N deposition. Taken together, the results indicate that strong nutrient uplift from the mineral soil occurred in response to forest growth and that N rather than base cations might become more strongly limiting for tree growth in northern forests in the future.

How to cite: Spohn, M., Karltun, E., and Stendahl, J.: Strong nutrient uplift associated with forest growth in northern forests, EGU General Assembly 2025, Vienna, Austria, 27 Apr–2 May 2025, EGU25-2846, https://doi.org/10.5194/egusphere-egu25-2846, 2025.

EGU25-3178 | ECS | Orals | SSS9.2

Depth-dependent dynamics of microarthropods in forest floors: interactions with temperature and phosphorus levels 

Jingxuan Chen, Antoine Rocaboy, André Junggebauer, Jingzhong Lu, and Stefan Scheu

The forest floor (FF) serves as the critical interface between the aboveground and belowground components of forest ecosystems. It plays a pivotal role in regulating water and energy exchange between the atmosphere and the soil, providing habitat for roots and diverse soil organisms, mitigating soil erosion, and promoting tree growth in forest ecosystems. Forest floors buffer harsh environmental conditions and insulate soil, thereby mitigating the effect of climate extremes on soil fauna. Conversely, the soil fauna is key for shaping the structure of FFs. Considering the recently documented decline in FFs across Europe, changes in the composition and activity of soil animal detritivores and their consequences for changes in the structure of FFs need closer attention. Unfortunately, the structure of decomposer animal communities across different layers of FFs and their variation with soil nutrient status and climatic factors has not been comprehensively investigated. We investigated the distribution patterns of two major decomposer microarthropod groups (Collembola and Oribatida)  across the different layers of the FF (Ol, Of/Oh and Ah) of 12 forest sites representing temperature and phosphorus gradients. A total of 58 Collembola  and 144 Oribatida species were recorded. Phosphorus as main factor neither significantly affected the abundance of Collembola nor that of Oribatida. The same was true for the effect of temperature on the abundance of Collembola, whereas the abundance of Oribatida varied significantly with temperature. Further, Oribatida richness significantly increased with increasing temperature but decreased with increasing phosphorus level. The effect of layer was highly significant for both Collembola and Oribatida. Specifically, the abundance, richness and biomass of both microarthropod groups was at a maximum in the Of/Oh layer followed by Ah and Ol layer. Collembola and Oribatida community structured varied with temperature and phosphorus levels but in both this depended on layer. Soil and litter carbon-to-nitrogen ratio, pH, Gram-positive bacterial phospholipid fatty acids (PLFAs) and thickness of Ol and Of/Oh layers were identified as major drivers. The results suggest that the distribution and community composition of Collembola and Oribatida are intricately linked to both biotic and abiotic factors in the FF. These findings highlight the critical influence of temperature, phosphorus and FF stratification on soil microarthropod communities, alongside additional soil chemical, microbial and physical characteristics of the FF. The differential responses of Collembola and Oribatida to temperature and phosphorus gradients underscore functional and ecological differences between these groups, with Oribatida displaying a stronger sensitivity to climatic and nutrient changes. Overall, the results emphasize the importance of maintaining the structural integrity of forest floors to support diverse and resilient soil fauna communities.

How to cite: Chen, J., Rocaboy, A., Junggebauer, A., Lu, J., and Scheu, S.: Depth-dependent dynamics of microarthropods in forest floors: interactions with temperature and phosphorus levels, EGU General Assembly 2025, Vienna, Austria, 27 Apr–2 May 2025, EGU25-3178, https://doi.org/10.5194/egusphere-egu25-3178, 2025.

The forest floor (FF) possesses significant water retention capacity, facilitating the transfer of water between the atmosphere and the soil. However, knowledge on the water retention characteristics and water transport effects of the FF remains limited. Due to the predominance of laboratory investigations regarding the storage capacity of a forest’s litter layer, we designed and constructed a new grid lysimeter to directly and in-situ measure the water fluxes from and into the FF. The objective was to ascertain further information regarding storage capacities, retention durations, and resulting infiltration patterns.

We present the results of a network comprising forest floor lysimeters and soil moisture probes at three sites with different altitudes located in the Black Forest, SW Germany. The three sites exhibit an annual mean temperature gradient from 6.3°C to 10.3 °C, leading to humus forms that vary from typical F-Mull to typical Moder according to KA6. We analyze water fluxes in relation to two distinct tree species (beech and spruce) and varying positions under the tree crown (middle and edge).

Throughout the monitored period in 2024, we determined that water was retained up to six days in the FF, while the amount of stored water was higher in Moder compared to the F-Mull. Our innovative gridded lysimeter design enabled us to demonstrate the small-scale (0.0625 m²) variety of spatio-temporal infiltration patterns, which is significantly influenced by the FF. The findings of our lysimeter network provide a comprehensive understanding of the influence of the forest floor on the water cycle within forest ecosystems.

How to cite: Paulsen, H. and Weiler, M.: Storage and redistribution of water in the forest floor influence evaporation, retention and infiltration patterns, EGU General Assembly 2025, Vienna, Austria, 27 Apr–2 May 2025, EGU25-3185, https://doi.org/10.5194/egusphere-egu25-3185, 2025.

EGU25-3848 | ECS | Orals | SSS9.2

Exploring Bedrock-Driven SOM Dynamics and SOM-Mineral Associations in Forest Soil Organic Surface Layers 

Gabriela Villalba Ayala, Luis Carlos Colocho Hurtarte, Wantana Klysubun, Sophia Katholnigg, and Jörg Prietzel

Soil organic matter (SOM) in temperate forests starts its formation on the forest floor and supports essential ecosystem functions. Understanding its composition and dynamics is crucial for sustainable forest management. SOM accumulation depends strongly on interactions with mineral compounds, which protect it from microbial decomposition through various mechanisms. Our previous research using multi-step density fractionation, chemical characterization (main cations, total carbon), and Ca-XANES spectroscopy demonstrated that bedrock type (basalt, paragneiss, dolomite, limestone) significantly influences SOM-mineral associations and binding patterns in the organic soil surface layers (Of, Oh) of beech-dominated temperate forests.

This study further examines SOM composition, focusing on functional C groups (alkyl, O-alkyl, aryl, carboxyl) of bulk soils and density fractions of organic layers from different bedrock types using Cross-polarization (CP) magic angle spinning (MAS) 13C NMR spectroscopy. We also assess biomolecular composition (carbohydrates, carbonyls, lipids, lignin, proteins, and char) through the application of the Molecular Mixing Model by Nelson & Baldock (2005) and analyze non-cellulosic polysaccharides via gas chromatography to identify primary (plant-derived) and secondary (microbial-derived) polysaccharides.

Preliminary results reveal that Of layers are primarily composed of undecomposed or partially decomposed plant-derived SOM, with light fractions (<1.6 g cm⁻³) accounting for most SOM mass, enriched in O-alkyl compounds (e.g., carbohydrates, lignin). Despite the heavy fraction (>1.6 g cm⁻³), representing mineral-associated SOM, is small in Of layers, basalt samples had the largest contribution overall. This fraction contained more proteins and lipids, indicating advanced microbial processing. The marked carbonyl/carboxyl accumulation in basalt soils suggested enhanced stabilization via carboxylate sorption to Fe and Ca mineral surfaces. In Oh layers, density fractions >1.4 g cm⁻³ dominate, reflecting increased OM stabilization and decomposition. Bedrock-specific effects include elevated lipid accumulation in paragneiss soils and higher carbonyl/carboxyl and char ̶ fire-derived OM in dolomite soils. Higher Alkyl/O-Alkyl ratios in silicate-derived soils (e.g., paragneiss) indicate advanced SOM decomposition, accompanied by increased microbial-derived polysaccharide contributions (galactose, mannose), highlighting dynamic turnover in these soils.

Our findings highlight the interplay between SOM composition, SOM-mineral interactions, and bedrock type in regulating SOM dynamics. Future Fe-XANES analysis will clarify the role of different iron species (e.g., Fe-SOM complexes, different Fe minerals) in SOM stabilization and decomposition.

How to cite: Villalba Ayala, G., Colocho Hurtarte, L. C., Klysubun, W., Katholnigg, S., and Prietzel, J.: Exploring Bedrock-Driven SOM Dynamics and SOM-Mineral Associations in Forest Soil Organic Surface Layers, EGU General Assembly 2025, Vienna, Austria, 27 Apr–2 May 2025, EGU25-3848, https://doi.org/10.5194/egusphere-egu25-3848, 2025.

EGU25-4802 | ECS | Orals | SSS9.2

Microbial Diversity and Keystone Taxa in the Stratified Forest Floors of Beech Forests 

Sebastian Bibinger, Gabriela Villalba Ayala, Jörg Prietzel, Michael Schloter, and Stefanie Schulz

In forest ecosystems, the forest floor acts as a boundary between the mineral soil and the atmosphere, serving as a hub for microbial nutrient turnover and transport. The forest floor is stratified and comprises several distinct layers characterized by successional changes in properties like nutrient quality, oxygen content or rate of disturbance. How microbial community development follows changes in chemical forest floor properties is not studied so far. This study aims to characterize the microbiome and identify key-stone taxa of the forest floor at a fine vertical resolution across temperate, beech-dominated forests.

Forest floor samples were collected from three German beech-dominated forests differing in climate and soil phosphorus content, spanning eight distinct layers of the forest floor and topsoil profile (OL0, OL1, OLF, OHF, OH, A (0-5 cm), A (5-10 cm), A (10-20 cm)). Prokaryotic community composition was analysed using 16S rRNA gene amplicon sequencing. Layer-specific keystone taxa were identified by finding taxa shared across the sites and evaluating their impact on SpiecEasi based cooccurrence networks. Community assembly processes of each layer were assessed through b-NTI analyses. Additionally, total elemental concentrations were measured by ICP-OES.

A clear stratification of the forest floor microbiome was observed. Proteobacteria and Bacteroidota dominated the litter layers but declined with depth, whereas Acidobacteria and Chloroflexi became more abundant with depth in the forest soil profile. Redundancy analysis revealed that layer-specific physicochemical parameters, such as total carbon, nitrogen, and pH, had a strong influence on microbiome composition, with sulfur, calcium, potassium, iron, and aluminum also significantly impacting microbial community composition. Generally, the impact increased with depth. We found a set of key-stone taxa specific for each forest floor layer and present at every site, each with a combined contribution between 10 and 20% of the total layer microbial abundance. Differences between the microbiomes of the three forest sites based on bray-curtis distances were most evident in the fresh litter layer and the mineral horizons, while the microbiome in the fragmented and humic layers was more uniform. This is further confirmed by community assembly analysis, which showed that homogenizing selection became more pronounced with progressing litter decomposition.

The vertical stratification of the forest floor is mirrored closely by microbial community composition and assembly. Each layer comprises different niches, which are formed by changes in substrate quality, and support distinct key-stone taxa. Compositional differences between forest sites are likely based on climatic conditions and bedrock type, whose influence is biggest at boundary layers like fresh litter and mineral soil, respectively. Similar successional trends of the microbiomes and high abundance of shared taxa were found between the sites, suggesting that litter type could be the primary driver of the forest floor microbiome composition. These findings enhance our understanding of how vertical stratification and substrate quality influence the forest floor microbiome.

How to cite: Bibinger, S., Villalba Ayala, G., Prietzel, J., Schloter, M., and Schulz, S.: Microbial Diversity and Keystone Taxa in the Stratified Forest Floors of Beech Forests, EGU General Assembly 2025, Vienna, Austria, 27 Apr–2 May 2025, EGU25-4802, https://doi.org/10.5194/egusphere-egu25-4802, 2025.

EGU25-5414 | ECS | Posters on site | SSS9.2

Long-term effects of root removal and liming on non-symbiotic N2 fixation in boreal forests  

Wenyi Xu, Karina E. Clemmensen, and Marie Spohn

Biological N2 fixation is a major nitrogen (N) source in boreal forests, but the factors controlling N2 fixation in boreal forests are not well understood. Most plants in boreal forests rely on mycorrhizal fungi to take up N, boreal forest soils are typically acidic, and the high abundance of mycorrhizal fungi and low soil pH could restrict the abundance of diazotrophs and N2 fixation. To investigate the effects of mycorrhizal fungi and soil pH on N2 fixation two experiments were conducted over several years in a mature Pinus sylvestris forest in the boreal zone of Sweden; a pine and shrub root exclusion experiment and a liming experiment. We measured non-symbiotic N2 fixation, soil carbon (C) and nutrient availability, and the quality of soil organic matter over one growing season, eight and 40 years after the root trenching and liming experiments started, respectively. Both experiments showed that N2 fixation was still very low in June (during a 48 h incubation at 15°C), indicating that diazotrophs are dormant during large parts of the years and only regain their activity slowly. Further, we found that exclusion of pine roots and associated ectomycorrhizal fungi significantly increased the rate of non-symbiotic N2 fixation in the late growing season, while exclusion of shrubs and associated ericoid mycorrhizal fungi showed no significant effect. Exclusion of pine roots, shrubs and the associated mycorrhiza strongly increased soil NH4+-N concentrations and the aromaticity of the water-extractable organic matter but did not significantly affect non-symbiotic N2 fixation. The reason for this might be that the low soil C quality and the high soil N availability offset the effects of the reduced abundance of mycorrhizal fungi on N2 fixation. In contrast to our expectation, liming did not significantly increase the rate of N2 fixation, suggesting that soil pH was not the key factor limiting N2 fixation. Overall, this study suggests that the diazotrophs are in a dormant state during most part of the year. Further, the results indicate that tree roots and ectomycorrhizal fungi rather than shrubs and ericoid mycorrhizal fungi or acidic conditions restrict non-symbiotic N2 fixation in boreal forests.

How to cite: Xu, W., Clemmensen, K. E., and Spohn, M.: Long-term effects of root removal and liming on non-symbiotic N2 fixation in boreal forests , EGU General Assembly 2025, Vienna, Austria, 27 Apr–2 May 2025, EGU25-5414, https://doi.org/10.5194/egusphere-egu25-5414, 2025.

EGU25-5470 | ECS | Posters on site | SSS9.2

Thermal Conductivity of Forest Floor from Temperate Beech Forests: Laboratory Measurements and In Situ Projections 

Richard Neumann, Kai Schwärzel, and Steffen Trinks

The forest floor (FF) is the central place in forests where organic matter, nutrients, and water are stored, transformed, and transferred. The rate of these processes is influenced, among other factors, by the soil temperature regime. FF horizons, lying directly within the sphere of atmospheric influence, are frequently exposed to temperature fluctuations. To understand how heat is transported through the forest floor, values for heat conductivity and heat capacity are essential. We measured these parameters in various FF horizons from temperate beech forests under controlled laboratory conditions. Thermal conductivity was measured using a single-probe needle sensor, while water content dependence was assessed through an evaporation experiment with continuous measurements. Heat capacity was measured using a dual-probe needle sensor at various stages during the evaporation period. Our results show that volumetric water content is the most significant factor influencing both heat conductivity and heat capacity. We demonstrate that, at constant water content, increasing decomposition levels in FF horizons lead to higher thermal conductivity. We also found significantly lower thermal conductivities in FF horizons compared to underlying mineral soils at similar volumetric water contents. Moreover, unlike in mineral soil horizons, higher dry densities of FF material result in lower thermal conductivity when volumetric water content and the degree of decomposition remain constant. Our results support the hypothesis of an insulating effect of FF layers, which mitigates the impacts of temperature extremes on the underlying mineral soil. We recommend incorporating the thermal conductivity–water content relationships into heat balance modeling of forest soils.

How to cite: Neumann, R., Schwärzel, K., and Trinks, S.: Thermal Conductivity of Forest Floor from Temperate Beech Forests: Laboratory Measurements and In Situ Projections, EGU General Assembly 2025, Vienna, Austria, 27 Apr–2 May 2025, EGU25-5470, https://doi.org/10.5194/egusphere-egu25-5470, 2025.

EGU25-6585 | Posters on site | SSS9.2

Soil fauna as a webmasters of forest floor 

Martin Bartuška and Jan Frouz

Previous research show that soil fauna can consume about how of annual litter fall across world biomes. In some ecosystems such as temperate broadleaf forest it can be almost all annual litterfall.  In this study we use simple field microcosm experiment quantify amount of carbon incorporated by so fauna bioturbation in various forest ecosystems. We have found that more than half of carbon eaten by soil fauna, gets incorporated in the soil by fauna bioturbation.   Soil  fauna biotubation increased which increasing actual evapotranspiration and decreasing CN ratio of litter. 

By comparing manipulation experiment, proportion of biostructures in soil measured by thin soil  sections, and carbon distribution in top soil layers, in ecosystem which different abundance of soil fauna causing bioturbation, namely earthworms, we can demonstrate, that soil fauna bioturbation is a major process responsible for distribution of organic matter in litter overlaying soil horizons and mineral soil. This indirectly affect  fungal bacterial ration, composition of soil food web an many other soil processes 

How to cite: Bartuška, M. and Frouz, J.: Soil fauna as a webmasters of forest floor, EGU General Assembly 2025, Vienna, Austria, 27 Apr–2 May 2025, EGU25-6585, https://doi.org/10.5194/egusphere-egu25-6585, 2025.

EGU25-7587 | ECS | Orals | SSS9.2

The influence of forest floor properties on tree regeneration under changing environmental conditions 

Trung Hieu Doan, Martin Kohler, and Jürgen Bauhus

First-year seedlings, with nascent tissues and limited nutrient reserves, are much more sensitive to environmental stressors than mature trees. Seeds and seedlings rely on the forest floor (FF) as a source of water and nutrient supply while it harbours soil microbes that are both beneficial (e.g. mycorrhizae) and detrimental (pathogenic fungi) to early seedling establishment. Therefore, FF changes, along with and as a result of climate change, may have major impacts on tree regeneration success and composition, which have received little attention in forest research so far. Our greenhouse experiment investigates how changes in FF properties affect seedling establishment and growth of three Central European tree species differing in seed size: Fagus sylvatica (European beech), Acer pseudoplatanus (sycamore), and Picea abies (Norway spruce). We used FF material and mineral soil collected from three mixed European beech forest sites in Germany differing in soil P availability. Seeds were sown in December 2023, and seedling establishment and growth were monitored under different treatments (tree mixture; precipitation regime; application of fungicide; shredding of the FF) throughout one vegetation period before harvest in autumn 2024. Preliminary results indicate that shredded, fine-textured FF enhanced substantially the establishment rate of spruce in two out of three soil origins, while no consistent pattern was observed for beech and sycamore. This suggests that intact FF may act as a physical barrier for small-seeded species but is less mechanically impactful for species of larger seed size. The application of fungicides increased the establishment success of beech, indicating a significant impact of pathogenic fungi in FF. In terms of growth, broadleaved seedlings exhibited enhanced shoot length in phosphorus-rich soil, with sycamore showing a twofold increase and beech a 1.3-fold increase compared to phosphorus-poor condition. We also found that beech seedlings grown in monoculture achieved double the shoot length of those mixed with sycamore, indicating intense interspecific competition of sycamore under abundant light condition in the greenhouse. Interestingly, while fungicide application reduced length growth of both beech and sycamore in phosphorus-poor soil, it marginally improved growth in phosphorus-rich conditions, underscoring the importance of mycorrhizal associations in nutrient-limited environments. Further analyses are ongoing to assess the susceptibility of seeds and established seedlings to fungal infestations with changes in seasonal distribution of precipitation and to drought stress in dry periods. How soil nutrient availability mediates the growth responses to such factors will also be explored. These findings will deepen the understanding of the impact of forest floor properties on tree regeneration dynamics under changing environmental conditions.

How to cite: Doan, T. H., Kohler, M., and Bauhus, J.: The influence of forest floor properties on tree regeneration under changing environmental conditions, EGU General Assembly 2025, Vienna, Austria, 27 Apr–2 May 2025, EGU25-7587, https://doi.org/10.5194/egusphere-egu25-7587, 2025.

EGU25-8016 | ECS | Posters on site | SSS9.2

Soil VOC Storage and Emissions Across Horizons in Douglas Fir and European Beech Forests 

Hojin Lee, Jürgen Kreuzwieser, Sofie Katlewski, Pia Carolin Weber, and Christiane Werner

Soils are both significant carbon reservoirs and sources of carbon emissions, playing a critical role in the global carbon cycle. In addition to CO2 emissions from soil respiration, volatile organic compounds (VOCs) significantly influence atmospheric chemistry, ecosystem processes, and climate feedback mechanisms. While biogenic VOCs (BVOCs) from plants are well-studied, the contribution of soil-emitted VOCs remains relatively underexplored, particularly their distribution and dynamics across soil depths in forest ecosystems. This study aimed to quantify depth-specific soil VOC storage and emissions, investigate their relationship with CO2 emissions as an indicator of microbial activity, and assess how litter characteristics influence these dynamics.

The research was conducted in two forest plots at the ECOSENSE site located in the Black Forest, Germany. The plots were dominated by Douglas fir (coniferous) and European beech (broadleaf) trees. We examined VOC storage and emissions across soil depths, compared their proportions to CO2 emissions, and assessed how microbial activity and litter properties shaped these soil VOC dynamics.

Our findings reveal that VOC storage and emissions varied significantly with soil depth and litter characteristics. More specifically, VOC storage and emissions were much higher in the Douglas fir plot than those in the European beech plot, highlighting the influence of tree species-specific chemical inputs. This foundational understanding of soil VOC dynamics provides critical insights into their potential role in climate feedback mechanisms and supports future efforts to model VOC fluxes under changing environmental conditions.

How to cite: Lee, H., Kreuzwieser, J., Katlewski, S., Weber, P. C., and Werner, C.: Soil VOC Storage and Emissions Across Horizons in Douglas Fir and European Beech Forests, EGU General Assembly 2025, Vienna, Austria, 27 Apr–2 May 2025, EGU25-8016, https://doi.org/10.5194/egusphere-egu25-8016, 2025.

EGU25-10145 | ECS | Orals | SSS9.2

Site, season and soil depth affect the composition of root exudates in three temperate tree species 

Melissa Wannenmacher, Simon Haberstroh, Jürgen Kreuzwieser, and Christiane Werner

Root exudation is a key process for plants to acquire nutrients. This process works directly, or indirectly through the microbiome priming effect. Likewise, plants release a significant amount of carbon into the soil, which stresses the importance of root exudation for carbon cycling. Nonetheless, detailed data on root exudation, especially compound-specific data from forest trees are scarce, but urgently needed. Recent studies suggest a high importance of the forest floor for nutrient acquisition, which is therefore of special interest for studying root exudates.

In this study, we sampled root exudates of Fagus sylvatica, Picea abies and Acer pseudoplatanus at four temperate forest sites with varying mean annual air temperature, annual precipitation sums and soil phosphorus (P) levels. Samplings took place in spring and autumn and in two soil depths: the forest floor (surface layer of the forest soil with ≥ 15% organic carbon) and the upper mineral soil (A5 horizon). Root exudates were collected using an in-situ cuvette-based approach. For this purpose, living tree roots were cleaned, and after a period of recovery, incubated for 24 hours in a cuvette filled with glass beads and a nutrient solution. Compounds in the retrieved solution were analysed by a mass spectrometer coupled to a gas chromatograph.

81 compounds were included in the analysis and divided into functional groups. All studied species showed higher exudation in spring compared to autumn with a higher share of amines in spring. Differences in exudation patterns between species could be detected for the two soil depths: While F. sylvatica showed a higher exudation in the forest floor, P. abies and A. pseudoplatanus exuded more in the mineral soil. This pattern is expected for F. sylvatica and A. pseudoplatanus, since F. sylvatica, which usually is associated with ectomycorrhiza (ECM), is said to follow an organic nutrient strategy and A. pseudoplatanus, which usually is associated with arbuscular mycorrhiza (AM), is said to follow an inorganic nutrient strategy. However, the behaviour of P. abies usually being associated with ECM and therefore following an organic nutrient strategy is in contrast to what literature suggests. A site-species-interaction effect was found with increased exudation on P-poor sites with low temperature for F. sylvatica, and with high temperature for P. abies and A. pseudoplatanus.

Facing a thinning of the forest floor with globally increasing temperatures, studying root exudation can indicate the forest floor’s role for tree nutrition. Clear differences in root exudation in quantity and composition between species, seasons and soil depths urge the need for further research to elucidate the effect of site conditions on exudation patterns.

How to cite: Wannenmacher, M., Haberstroh, S., Kreuzwieser, J., and Werner, C.: Site, season and soil depth affect the composition of root exudates in three temperate tree species, EGU General Assembly 2025, Vienna, Austria, 27 Apr–2 May 2025, EGU25-10145, https://doi.org/10.5194/egusphere-egu25-10145, 2025.

EGU25-11387 | Posters on site | SSS9.2

Temperate forest floors: Ecosystem hub in transition? 

Jörg Niederberger and the DFG Research Group Forest Floor (FOR 5315)

The forest floor (FF) is the central hub in forests where organic matter, nutrients, and water are stored, transformed, and transferred. The FF is dominated by plant litter and its decomposition products, and thus differs fundamentally from the mineral soil. Although the FF is the most dynamic compartment of forest soils, it is often neglected, and inconsistent terminology complicates the synthesis of information from existing studies. The FF is expected to be the most responsive to changing climate, management, eutrophication, and acidification. Here, we (1) compile existing knowledge on the role of FFs for ecosystem service provision, (2) assess the vulnerability of FFs to forest change, and (3) identify important knowledge gaps for temperate forests. The role of FFs in nutrient, carbon, and water cycles depends on the turnover rates and accumulated mass of the FF, which reflects strong interdependences with the abundance, activity and composition of soil microbial and faunal communities. These mutually reinforcing interactions determine how much the FF or mineral soil dominates biogeochemical cycles and energy fluxes. With slow FF turnover, large proportions of nutrients are tightly cycled within the FF, organic matter accumulates due to limited decomposition and impaired bioturbation, and water is channelled through preferential flow-paths. With rapid FF turnover, the mineral soil is the main place for plant nutrient uptake and organic matter transformation, and water percolates more homogeneously. Under forest change in particular ecosystems with slow FF turnover could turn from carbon sinks into sources, losing their adaptability to nutrient-poor conditions and a large part of their water storage capacity. We conclude, that combined analyses of the key organisms and feedbacks with decomposing FF litter are required to understand the resilience of temperate forests against future changes.

How to cite: Niederberger, J. and the DFG Research Group Forest Floor (FOR 5315): Temperate forest floors: Ecosystem hub in transition?, EGU General Assembly 2025, Vienna, Austria, 27 Apr–2 May 2025, EGU25-11387, https://doi.org/10.5194/egusphere-egu25-11387, 2025.

EGU25-12430 | Posters on site | SSS9.2

Forest floor charcoal and fire – extent and legacy in Norwegian forests 

Lise Dalsgaard, Ryan Bright, Ingeborg Callesen, Stephanie Eisner, and Line Tau Strand

Fire has the immediate effect that roughly half of carbon and nitrogen is emitted and lost from forest floors, that the remaining ashes fertilize the ground and pools of dead organic matter and stable black carbon is produced. Depending on the intensity of the fire it will potentially have long lasting physical, chemical and biological effects. Fire as a disturbance agent to the forest floor has acted on the forest landscapes in Scandinavia since the last glaciation as a natural phenomenon and as a result of human activities. Fires have likely occurred in all forests in Norway even though sampling and dating of charcoal in selected landscapes indicate a lower frequency along the west coast than in the southeastern forest region and in neighboring Sweden.

Where the availability of synthetic fertilizers in agriculture (ca. 1900) and the significance of timber value and -trade (ca. 1700) mark important shifts in fire occurrence and avoidance, forest fires have been successfully suppressed with documented effects since the 1970’s likely leading to an accumulation of forest floor organic matter.

Using a one-time survey of >8000 registrations of the thickness of the forest floor, its sub-layers, humus form and the occurrence of charcoal in upland forests of the Norwegian National Forest Inventory, we investigate the regional distribution of charcoal occurrence in upland forests indicating earlier fire activity and look for legacies on carbon stocks or forest floor characteristics using available national soil survey data. Forest floors in boreal and cold temperate forests hold 30-60% of total forest soil carbon stocks equivalent in magnitude to that held by the living biomass of trees. Thus, we further estimate the areas and forest floor carbon stocks most likely to gain increased vulnerability to fire under future climate conditions.

How to cite: Dalsgaard, L., Bright, R., Callesen, I., Eisner, S., and Tau Strand, L.: Forest floor charcoal and fire – extent and legacy in Norwegian forests, EGU General Assembly 2025, Vienna, Austria, 27 Apr–2 May 2025, EGU25-12430, https://doi.org/10.5194/egusphere-egu25-12430, 2025.

EGU25-12638 | Posters on site | SSS9.2

Effects of forest floor mosses on elemental cycling in spruce forests 

Marianne Koranda, Sören Risse, Harald Zechmeister, and Wolfgang Wanek

Mosses are abundant components of understory vegetation in coniferous forests. The poikilohydric life style of bryophytes implies that active phases in moist state alternate with inactive phases in dry state, which requires a range of physiological adaptations, such as the accumulation of sugars and antioxidants. Re-wetting of desiccated bryophytes during intensive summer rain events, however, may cause considerable leakage of intracellular moss metabolites, leading to a flush of labile carbon (C) compounds washed into the soil.

In the presented study we investigated (1) what amounts of C and nutrients are leached from forest floor mosses over a growing season; (2) how C leaching from mosses is related to the climatic conditions at the field site; (3) how moss layers alter the chemical composition of the canopy throughfall. We collected leachates under four species of forest floor mosses in two montane spruce forests differing in climate over a 4-months growing season.

Our results showed that total fluxes of dissolved organic C (DOC) by the moss leachates were comparable at the two field sites, irrespective of climatic conditions, although C concentrations were higher in moss leachates at the drier site. Surprisingly, C leaching from mosses was rather stable compared to the significant temporal variation in DOC concentration in canopy throughfall. Furthermore, we found that moss layers significantly altered the chemical quality and elemental composition of the canopy throughfall, and that this effect depended on the moss species, field site and season.

Our study demonstrates that moss leachates represent a significant soil C input and relevant labile C source for soil microorganisms besides root exudates and litter leachates, and that forest floor mosses play an important role in elemental cycling of montane spruce forests.

How to cite: Koranda, M., Risse, S., Zechmeister, H., and Wanek, W.: Effects of forest floor mosses on elemental cycling in spruce forests, EGU General Assembly 2025, Vienna, Austria, 27 Apr–2 May 2025, EGU25-12638, https://doi.org/10.5194/egusphere-egu25-12638, 2025.

EGU25-12987 | ECS | Posters on site | SSS9.2

Deforestation effects on the spatial distribution of C and N in the soils of a forested headwater catchment in the Eifel, Germany 

Maia Batsatsashvili, Lea Dedden, Roland Bol, Gretchen Gettel, Karsten Kalbitz, Inge Wiekenkamp, and Thomas Pütz

Riverine systems are distinct components of the natural environment which have significant roles in storing and processing terrestrial carbon. While processing organic matter, rivers release large amount of greenhouse gasses to the atmosphere. In this light, headwater streams are particularly interesting. Due to their high connectivity with the surrounding landscapes, these small streams are strongly influenced by terrestrial inputs of carbon and nitrogen and groundwater inflow. Therefore, despite smaller surface area, their role in C and N cycling is crucial. The amount and character of C and N inputs to headwater streams is highly dependent on soil and vegetation types of the catchment. Soils, connecting the atmosphere, hydrosphere and lithosphere and supporting various ecosystem processes, are believed to exhibit strong responses to ecosystem disturbances. Among these disturbances are climate change impacts and modified landcover.

The aim of this study is to analyze three-dimensional variability of biogeochemical processes in the soils of a forested headwater catchment, following partial clearcut of a spruce forest.

The high resolved data on soil properties were collected in the Wüstebach catchment (Eifel/Lower Rhine Valley), a long-term environmental observation site of the TERENO (Terrestrial Environmental Observatories) project. The Wüstebach is a forested catchment in which nine hectares of Norway spruce was cleared in 2013 and has been replanted with original beech.

Three extensive soil sampling campaigns were conducted in the catchment: the first just before a partial clear-cut in 2013, the second after the clearcut in 2014 and the third, five years after the clearcut in 2018. The sampling produced high-resolution data on physical and biogeochemical soil parameters per horizon.

The plan of this study is to perform geostatistical analysis of the data and produce three-dimensional surface prediction models of the spatial distribution of the two nutrients: C and N in 2013, 2014 and 2018 over the entire catchment.

How to cite: Batsatsashvili, M., Dedden, L., Bol, R., Gettel, G., Kalbitz, K., Wiekenkamp, I., and Pütz, T.: Deforestation effects on the spatial distribution of C and N in the soils of a forested headwater catchment in the Eifel, Germany, EGU General Assembly 2025, Vienna, Austria, 27 Apr–2 May 2025, EGU25-12987, https://doi.org/10.5194/egusphere-egu25-12987, 2025.

EGU25-13645 | ECS | Orals | SSS9.2

Pairwise O2 and CO2 in soil studies: using the apparent respiration quotient to partition soil respiration components 

Qiwen Zhang, Susan Trumbore, Anna Lengert, Thorsten Schäfer, and Boaz Hilman

Soil CO2 efflux is the sum of heterotrophic and autotrophic respiration. However, measuring these two fluxes separately in intact forest soils, in high spatiotemporal resolution, is challenging and costly. The apparent respiratory quotient (ARQ), defined as the ratio of CO2 efflux to O2 influx, is primarily determined by the stoichiometry of the respiratory substrate and exhibits the potential to differentiate between the components of soil CO2 efflux. Empirical studies have demonstrated that ARQ is approximately 1 for root respiration, which is associated with carbohydrate metabolism, and 0.7-0.8 for mineral soil respiration, which is associated with decomposition of soil organic matter. In order to explore the use of ARQ in respiration partitioning, we combined a novel continuous measurement of ARQ from soil chambers with laboratory incubations in a temperate pine forest. To test the ability of ARQ to partition soil respiration sources, three different approaches were applied: Firstly, root abundance was controlled by placing chambers along a root density gradient (close and far from tree stems) and by no-root control chambers. Secondly, chamber ARQ was compared with ARQ of the individual soil components. Thirdly, the results were compared to respiration partitioning evaluated by radiocarbon (Δ14C) measurements. ARQ of individual soil components was highest in roots (0.96 ± 0.01, mean ± standard error), intermediate in litter (0.88 ± 0.03), and lowest in soils from the organic layer (0.83 ± 0.04) and mineral layer (0.83 ± 0.06). The mean ARQ in the soil chambers was 0.91 ± 0.08, and was usually within the range of the individual soil components. This suggests that root respiration contributed 62% to total respiration. Chamber ARQ was higher than the no-roots chambers (0.74 ± 0.05) and higher at closer to the tree stems (0.96 ± 0.07 vs. 0.84 ± 0.09 far from the stems), suggesting that root respiration percentage from total respiration was 72% near the stems and 21% far from the stems. For comparison, according to Δ14C, root respiration’s contribution was 55% and 14% for close and far from the stems, respectively. On a diurnal timescale, soil CO2 efflux was synchronized with air temperature, while ARQ exhibited an out-of-phase relationship with air temperature, with higher values recorded during the night than daytime (0.97 ± 0.06 vs. 0.85 ± 0.10, respectively). The elevated nocturnal ARQ may be attributed to greater temperature sensitivity in mineral soil respiration than in root respiration, reduced ARQ during daylight hours due to transport of root-respired CO2 in the xylem stream, or increased root oxidation with elevated ARQ during night. Overall, our primary results indicated that ARQ is a cost-effective approach to disentangle respiratory sources at seasonal and diurnal scales.

How to cite: Zhang, Q., Trumbore, S., Lengert, A., Schäfer, T., and Hilman, B.: Pairwise O2 and CO2 in soil studies: using the apparent respiration quotient to partition soil respiration components, EGU General Assembly 2025, Vienna, Austria, 27 Apr–2 May 2025, EGU25-13645, https://doi.org/10.5194/egusphere-egu25-13645, 2025.

EGU25-13812 | ECS | Posters on site | SSS9.2

Assessing silicon’s role in leaf-litter decomposition, carbon and nitrogen cycling across microclimates in temperate beech forests  

Stephen Boahen Asabere, Simon Drollinger, Behnaz Bakhshi Mohebbi, Sirjana Poudel, and Daniela Sauer

Leaf-litter decomposition is a key driver of carbon (C) and nutrient cycling in terrestrial ecosystems, governed by climate and the litter chemical composition. Silicon (Si), a ubiquitous element in terrestrial ecosystems that has various beneficial effects on plants, is an integral component of leaf-litter. However, the relationship between leaf-litter decomposition and Si content remains poorly constrained, particularly in temperate beech forests where Si uptake predominantly occurs through passive mechanisms. Here, we investigated the relationships between total beech-leaf Si content, mass loss, decomposition rate (k), and contents of C and nitrogen (N) of beech (Fagus sylvatica) leaf-litter under five temperate beech-forest stands with differing microclimatic conditions, in two sandstone regions of Lower Saxony, central Germany.

We incubated 441 leaf-litter bags that were sampled bi-monthly over two years to capture fine-scale temporal decomposition dynamics. Each site was equipped with soil temperature and moisture loggers, allowing differentiation of the sites into three microclimatic classes: (i) warm-dry (14.5°C mean topsoil (0-6 cm) temperature, 21% mean soil moisture), (ii) intermediate (13.2°C, 31.4%), (iii) cool-wet (9.7 °C, 38.8%).

The median total Si content of beech leaves across all sites was 1.1% dw-1, comparable to the 1.0% dw-1 observed in unincubated leaf-litter samples. Decomposition rate (k) was positively related to Si content under intermediate (R2 = 0.14, p < 0.05) and warm-dry (R2 = 0.2, p < 0.05) conditions, whereas no such relationship was observed under cool-wet conditions. Median k values were noticeably higher under both cool-wet and intermediate conditions (0.31 g yr-1) compared to warm-dry conditions (0.18 g y-1). There was no relationship between Si and C content, but N content exhibited a weak but positive correlation with Si under all climate conditions, with the strongest relationship observed under warm-dry conditions (R2= 0.21, p < 0.05). Over the two-year study, C content decreased from an initial 49% to 41% under intermediate conditions, representing only 16.8% decrease, while N content increased from 0.9% to 1.42% under the same conditions. During mass loss for the same period, Si and N contents increased while C content decreased across all sites. These findings reflected immobilization of N by microbes, but a release of C with mass loss.

The stability of Si content over time, along with the positive relationship to mass loss, suggests that the total Si pool of beech leaves predominantly comprises structured opal compounds that resist mineralization under temperate forest conditions. While this has theoretical implications for linking the Si cycle to C sequestration, the weak relationship observed here, coupled with the decreased C content, suggest further investigation. We conclude that Si influences litter decomposition in a context-dependent manner, with stronger effects under drier and warmer conditions, where soil moisture limitations may intensify its role in C and nutrient cycling. 

How to cite: Asabere, S. B., Drollinger, S., Mohebbi, B. B., Poudel, S., and Sauer, D.: Assessing silicon’s role in leaf-litter decomposition, carbon and nitrogen cycling across microclimates in temperate beech forests , EGU General Assembly 2025, Vienna, Austria, 27 Apr–2 May 2025, EGU25-13812, https://doi.org/10.5194/egusphere-egu25-13812, 2025.

EGU25-13934 | ECS | Posters on site | SSS9.2

From Litterfall to Respiration: Investigating Soil Processes in Differing Irish Forests 

Blair Ruffing, Brian Tobin, Mathew Saunders, and Ken Byrne

Forest ecosystems are critical hubs of biogeochemical activity, playing a major role in global carbon cycling by storing and cycling substantial quantities of terrestrial carbon both above and below ground. The forest floor serves as a dynamic interface where organic inputs, such as litterfall and root turnover, drive soil processes that influence carbon fluxes. Understanding the interactions between photosynthetic activity, soil respiration, and decomposition is key to determining whether forests act as carbon sources or sinks. To gain deeper insights into these processes, it is essential to measure soil respiration and partition its autotrophic and heterotrophic components, linking aboveground organic inputs to belowground carbon and nutrient cycling.

This study investigates soil carbon flux dynamics in three distinct Irish forest types: a commercial coniferous forest on mineral soil, a broadleaf-dominated native woodland on mineral soil, and a mixed-species forest on peat soil. These forests, characterized by differences in soil type, species composition, and management practices, offer unique insights into the interactions between litterfall, fine root dynamics, and soil respiration.

Aboveground litter inputs were quantified through monthly litterfall collection using bucket traps over a two-year period, revealing distinct patterns both within and between sites. Litter decomposition was assessed with one-year litterbag experiments, while fine root production and turnover were evaluated using one-year in-growth core experiments. Soil respiration was measured twice monthly over a two-year period using two trenched collars installed to a depth of 25 cm and two untrenched collars, with the inclusion and removal of litter enabling a detailed analysis of autotrophic and heterotrophic contributions. Elemental analysis of mineral soils (0–50 cm) and organic soils (0–150 cm) provided key insights into carbon, hydrogen, and nitrogen content, offering valuable data on soil organic matter composition and nutrient availability across the soil profile in the three forest types.

Over the two-year study period, results show that the commercial coniferous forest exhibited the lowest average total soil respiration rates, averaging 52.10 tonnes CO₂/ha/yr. Conversely, the native woodland and the mixed-species peatland forest showed similar and higher soil respiration rates, averaging 54.31 tonnes CO₂/ha/yr. Across all sites and seasons, heterotrophic respiration contributed more to total ecosystem respiration than autotrophic respiration.

By integrating data on litterfall, decomposition, fine root dynamics, and soil elemental composition, this study highlights the critical role of organic inputs and root processes in driving soil respiration and carbon cycling in forests. These findings will enhance carbon modeling efforts, improve predictions of ecosystem responses to environmental change, and inform sustainable forest management strategies for climate change mitigation.

How to cite: Ruffing, B., Tobin, B., Saunders, M., and Byrne, K.: From Litterfall to Respiration: Investigating Soil Processes in Differing Irish Forests, EGU General Assembly 2025, Vienna, Austria, 27 Apr–2 May 2025, EGU25-13934, https://doi.org/10.5194/egusphere-egu25-13934, 2025.

EGU25-15380 | Orals | SSS9.2

Ectomycorrhizal fungi take over decomposition when saprotrophs fail 

Björn Lindahl, Florian Barbi, Karina Clemmensen, Anders Dahlberg, and Johan Stendahl

Forest ecosystems change along fertility gradients, both at large climatic scales and locally, depending on mineralogy and hydrology. Changes in vegetation communities and traits along fertility gradients have been studied thoroughly, but corresponding changes in soil fungal communities are less well understood. In boreal coniferous forests, ectomycorrhizal fungi play a pivotal role, not only in tree nutrient uptake, but also in decomposition, and interact with free-living saprotrophs in complex manners.

We conducted DNA-based analyses of soil fungal communities in a national forest inventory across Sweden. In a local fertility gradient, we analysed fungal decomposer traits by metatranscriptomics. In the national data set, changes in relative abundances of fungal guilds were assessed in almost 1600 sites along climate and soil fertility gradients. In the local study we sequenced mRNA from composite samples of the organic horizon in 16 plots with contrasting N content, pH and tree species. We specifically targeted expression of genes coding for cellulolytic and oxidative enzymes and analysed responsible fungal taxa.

The abundance of free-living saprotrophic basidiomycetes with well-developed capacity to decompose recalcitrant organic substrates (e.g. Mycena species) declined in colder climate and in more acidic and nitrogen-poor soils. In the metatranscriptomes we found reduced expression of basidiomycete cellulase genes and indications of supressed growth of basidiomycete saprotrophs under more acidic and nitrogen poor conditions. In contrary, ectomycorrhizal species with well-developed oxidative enzyme systems, mainly members of the genus Cortinarius, increased in relative abundance towards colder climates and nitrogen-poor soils. In the metatranscriptomes, mycorrhizal Cortinarius species accounted for 60% of gene expression of extracellular peroxidases, which are central for decomposition in the boreal forest floor that is rich in lignin, melanin and tannins. Overall expression of peroxidase genes was upregulated in unfertile pine plots relative to more fertile spruce plots.

Altogether, we see indications that saprotrophic basidiomycetes are severely hampered by the harsh conditions in the organic horizon of boreal forests and have major problems to maintain their role as major decomposers. When the saprotrophs fail, decomposition is instead maintained by certain ectomycorrhizal fungi, who use their direct supply of carbon from the tree roots to drive oxidative decomposition, presumably liberating tightly bound nutrients for themselves and their hosts. In line with this hypothesis, unfertile conditions trigger increased investment in oxidative enzymes. The mycorrhizal link between living roots and decomposition implies that organic matter turnover in boreal forests may be largely controlled by the trees, analogous to a strong and direct priming effect.

How to cite: Lindahl, B., Barbi, F., Clemmensen, K., Dahlberg, A., and Stendahl, J.: Ectomycorrhizal fungi take over decomposition when saprotrophs fail, EGU General Assembly 2025, Vienna, Austria, 27 Apr–2 May 2025, EGU25-15380, https://doi.org/10.5194/egusphere-egu25-15380, 2025.

EGU25-15603 | Posters on site | SSS9.2

BVOC fluxes in boreal forest floor and associated soil microbiome after forest fire 

Saborni Maiti, Huizhong Zhang-Turpeinen, Dhiraj Paul, Xudan Zhu, Francesco Sorrentino, Henri M.P. Siljanen, James Blande, Jukka Pumpanen, and Frank Berninger

Boreal forests play a crucial role in emitting biogenic volatile organic compounds (BVOCs), which have both warming and cooling effects on the Earth's climate. These forests are among the primary sources of secondary organic aerosols (SOAs). Plant-emitted BVOCs, such as isoprenoids (including isoprene, monoterpenes, and sesquiterpenes), serve as precursors to SOAs, significantly affecting air quality and climate. Recent research indicates that forest fires also have long-term impacts on BVOC emissions, which are influenced by the frequency and severity of these fires, exacerbated by climate warming. Despite their importance, the effects of forest fires on BVOC emissions, their production and consumption by plants and associated soil microbes, as well as the underlying genetic mechanisms, remain poorly understood.

In this study, we quantify post-fire BVOC emissions from the forest floor, including above-ground plantlets, below-ground plant parts, and soil microbes by trapping forest floor BVOCs using a dynamic headspace technique. To investigate belowground BVOCs, we established mesocosms—blocks of soil with intact vegetation on top—within strictly controlled climate chambers. BVOCs were collected from mesocosm soil, as well as from root-free soil, using a dynamic enclosure technique. Soil DNA was extracted for amplification of 16S rRNA and ITS region from the samples and sent for sequencing to detect changes in microbial composition between pre- and post-fire conditions. We designed BVOC-specific probes for targeted metagenomics, such as those for monoterpene synthesis, isoprene synthesis, and monoterpene degrading enzymes, to analyze the production and consumption of BVOCs by the soil microbiome and to correlate these findings with forest floor BVOC flux data.

We have identified various volatile chemical groups, such as monoterpenes and isoprene, and quantified their fluxes in forest floor vegetation before and after fires. This study provides a clearer understanding of BVOC emissions and their consumption in the atmosphere from the boreal forest floor and soil microbiome under pre- and post-fire conditions.


How to cite: Maiti, S., Zhang-Turpeinen, H., Paul, D., Zhu, X., Sorrentino, F., Siljanen, H. M. P., Blande, J., Pumpanen, J., and Berninger, F.: BVOC fluxes in boreal forest floor and associated soil microbiome after forest fire, EGU General Assembly 2025, Vienna, Austria, 27 Apr–2 May 2025, EGU25-15603, https://doi.org/10.5194/egusphere-egu25-15603, 2025.

EGU25-17399 | Posters on site | SSS9.2

The forest floor as a habitat for mycorrhizae across temperature and P availability gradients 

Ina C. Meier, Maï Bergmann, Birte Buske, Fernanda Dietz, Martin Bidartondo, and Laura Martinez-Suz

The mycorrhizal symbiosis is a central component of plant-soil feedbacks and carbon (C) cycles of forest ecosystems. Yet even though it is known that the two major mycorrhizal association types influence litter decomposition and soil organic matter formation differently, it remains unresolved whether this also influences their preference for the forest floor as a habitat. We aimed to test such preference in mature European beech (Fagus sylvatica L., ECM host) forests admixed with sycamore maple (Acer pseudoplatanus L., AM host) by measuring extracellular enzyme activities in the forest floor and mineral soil of twelve study sites located across gradients of rising temperature and inorganic phosphorus (P) limitation. Sampling took place in the forest floor and at 0-5 cm, 5-10 cm and 10-20 cm soil depth in the proximity of beech and maple trees, respectively, and the activity of recalcitrant C and organic P and nitrogen (N) degrading enzymes were analyzed. In our presentation we will discuss whether our results support the hypotheses that (i) mycorrhizal fungi are more dependent on forest floor C in nutrient-poor forest stands and (ii) arbuscular mycorrhizal fungi are superior in P-poor forest floors and ectomycorrhizal fungi in P-rich forest floors.

How to cite: Meier, I. C., Bergmann, M., Buske, B., Dietz, F., Bidartondo, M., and Martinez-Suz, L.: The forest floor as a habitat for mycorrhizae across temperature and P availability gradients, EGU General Assembly 2025, Vienna, Austria, 27 Apr–2 May 2025, EGU25-17399, https://doi.org/10.5194/egusphere-egu25-17399, 2025.

EGU25-18261 | ECS | Posters on site | SSS9.2

How soil fauna affects carbon fluxes in forest floors: Insights from size compartmentalized communities 

Philipp de Jong, Jingxuan Chen, Patrick Schleppi, Sebastian Doetterl, Stefan Scheu, and Frank Hagedorn

The forest floor (FF) represents the interface between the production of aboveground biomass and the belowground cycling and storing of C. The conditions within the FF, including its structure, faunal community composition, and microbial activity, may influence the pathway, quantity, and stability of organic matter (OM) transferred and stored in the mineral soil beneath. C inputs like litter are either mineralized to CO2, leached as dissolved organic C (DOC) into deeper soil, transformed into stable soil organic matter (SOM) by microbial communities or transferred into the mineral soil through soil fauna. While the impact of certain macrofauna like earthworms is well-studied, the role of mesofauna remains less understood despite evidence of their contribution to SOM cycling. To address this the DFG research group “Forest Floor” established a field mesocosm experiment across elevation gradients within temperate mixed forests in Germany and Switzerland. Four gradients were set up across different types of parent material including basalt, paragneiss, and limestone, resulting in differing FF types across and within gradients. Within each site, mesocosms were installed under beech- and maple-dominated canopies, respectively. The mesocosms had vertical openings on the sites covered with different mesh sizes (4 mm, 1 mm, and 0.045 mm) to allow horizontal movement in and out of the mesocosm. These mesh sizes create three size compartmentalized soil fauna communities with increasing limitations due to body size. A set of mesocosms with 4 mm mesh size is non-rotated while all other mesocosms are regularly rotated to limit root ingrowth. Site-specific FF was placed into the mesocosm undisturbed, then defaunated and its Ol horizon was replaced with beech or maple litter highly enriched with 13C, 15N, and 2H. We measure CO2 and 13CO2 1 ,2 ,4 ,6 ,12, and 16 months after the mesocosm were placed in the field. DOC is collected bi-weekly in suction plates below the non-rotated mesocosms. This will allow us to establish a mass balance of beech and maple litter turnover as affected by different soil fauna communities in contrasting FF types. We expect the FF to accumulate with decreasing mesocosm accessibility resulting in a shift in C fluxes. A lower CO2 flux due to unfavorable conditions might be counterbalanced by increased DOC production.

How to cite: de Jong, P., Chen, J., Schleppi, P., Doetterl, S., Scheu, S., and Hagedorn, F.: How soil fauna affects carbon fluxes in forest floors: Insights from size compartmentalized communities, EGU General Assembly 2025, Vienna, Austria, 27 Apr–2 May 2025, EGU25-18261, https://doi.org/10.5194/egusphere-egu25-18261, 2025.

EGU25-18496 | ECS | Posters on site | SSS9.2

Resin extractions from forest floors reveal tree specific adaptation to the phosphorus status of the mineral soil in European beech forests 

Lexie Schilling, Lars Vesterdal, Jörg Prietzel, and Friederike Lang

Slow turnover of the forest floor (FF) is often assumed to be related to immobilization of nutrients within the organic matter. However, the FF is also assumed to be an important nutrient source at sites with low nutrient concentrations in the mineral soil. Yet, little is known about the availability of nutrients present in the FF and how it is related to FF turnover.

Within the DFG-funded Research Unit FOREST FLOOR we identify processes that control the relevance of the FF for tree phosphorus (P) nutrition as compared to the mineral topsoil in European beech (Fagus sylvatica) forests with admixtures of spruce (Picea abies) and maple (Acer pseudoplatanus). We quantified plant-available P at lab conditions using resin exchangers in the FF and the mineral topsoil up to 20 cm along four elevation-related temperature gradients of different soil P status. We hypothesize that the FF gains in importance for P nutrition with decreasing P status of the mineral soil.

Results show that along the P gradient with high mean annual temperature (MAT: 9-10 °C), highest resin extractable P (Presin) concentrations within one site are found in the mineral soil. On the P gradient with low MAT (5-6.1 °C) however, highest Presin concentrations are found in the FF and also in SOM rich mineral soil, especially at the silicate site with low total P concentrations. This translates into surprisingly high Presin values under beech (P-poor site Kandel, Black forest FF: 290 ± 200 µg P/g soil, Ah horizon: 410 ± 110 µg P/g soil), which corresponds to twice the amount extracted by citric acid. Presin concentration under beech clearly differed from plots under spruce and maple with mostly 100 µg P/g soil at all temperature classes for P poor mineral soils. However, this high P availability in the FF was not observed for carbonate sites.

In conclusion, the innovative resin extraction method provided new insights regarding P nutrition in beech forests compared to citric acid as reference method. High P availability under beech at Kandel despite low MAT and low P status of the mineral soil indicate a tight recycling of P resources via the FF and SOM rich mineral soil. Our results show that the effect of increasing MAT on P availability depends on the P status of the mineral soil. These findings suggest a crucial role of the FF for beech forest P nutrition and its potential vulnerability under climate change.

How to cite: Schilling, L., Vesterdal, L., Prietzel, J., and Lang, F.: Resin extractions from forest floors reveal tree specific adaptation to the phosphorus status of the mineral soil in European beech forests, EGU General Assembly 2025, Vienna, Austria, 27 Apr–2 May 2025, EGU25-18496, https://doi.org/10.5194/egusphere-egu25-18496, 2025.

EGU25-18998 | ECS | Posters on site | SSS9.2

In-situ imaging of iron and manganese mobilisation in forest floor layers 

Jonas Hahn, Prof. Dr.Friederike Lang, and PD Dr. Helmer Schack-Kirchner

In-situ imaging of iron and manganese mobilisation in forest floor layers

Mobility of iron and manganese in forest soils is controlled by the redox state, the overall pH-value and the concentration of complexing organic acids. The solubility of Mn and Fe oxides is an indicator of reductive activity processes and furthermore strongly connected to the availability of phosphorus for plants. Yet the strong small-scale heterogeneity of forest floor makes the spatial and temporal patterns of stable and soluble iron and manganese forms challenging to quantify. 20 etched 10x15cm glass slabs were coated with either an iron or manganese oxide (goethite and birnessite, respectively). Slabs were vertically inserted in the forest floor with close contact between the oxide coating and the soil, and left for one growing season in a spruce-beech forest. The forest floor was a moder circa 12 cm thick, and the soil was a Dystric Cambisol. In fine humus-rich Ohf and Obh horizons, the rate of mobilisation of goethite and birnessite was generally > 50 % of the area, with more birnessite lost than goethite. Most mobilisation was found along the finest roots in the organic horizons. For goethite, mobilisation underwent a gradual transition from high mobility in organic horizons to minimal mobility in mineral soil. For birnessite in contrast, there was barely any mobilisation in mineral soil. The substantial mobilisation in organic horizons primarily along fine roots suggest that complexation by exuded organic acids is a dominant process in iron and manganese mobilisation. Yet deeper in the forest floor and mineral soil, reductive processes due to aeration deficiencies likely play the major role in iron and manganese mobility. Since the complexation of iron by organic acids can enhance phosphorus availability, we conclude that the spatial pattern of iron mobilisation reflects the root- and mycorrhiza-driven P-mobilisation.

How to cite: Hahn, J., Lang, P. Dr. F., and Schack-Kirchner, P. Dr. H.: In-situ imaging of iron and manganese mobilisation in forest floor layers, EGU General Assembly 2025, Vienna, Austria, 27 Apr–2 May 2025, EGU25-18998, https://doi.org/10.5194/egusphere-egu25-18998, 2025.

EGU25-19450 | Orals | SSS9.2

European beech forests create an impressive diversity of forest floors 

Friederike Lang, Jörg Niederberger, Lexie Schilling, Stefan Scheu, Jingxuan Chen, Stefanie Schulz, Michael Schloter, Sebastian Bibinger, and Jörg Prietzel

Forest floors are the interface between vegetation and soil and are therefore often neglected by science. Wrongly so, because they are highly sensitive and integrative indicators of ecosystem processes and fulfil important functions. Using an interdisciplinary approach, we analyse the properties and functioning of organic layers at 12 temperate forest sites, dominated by European beech and differing in P-status and mean annual air temperature. In agreement with literature, we found increasing mass of FF with decreasing temperature and P availability in the mineral soil. However, we found no significant differences in FF mass and C stocks between calcareous (n=3) and silicate (n=9) sites. The range of FF properties found by far exceeds the range of mineral soil properties. The pH(KCl) values of organic layers (OF and OH horizons) varied between 2.6 and 6.6. The FF mass ranged from 17 to 81 t ha-1, the C-stock from 6.2 to 38.8 t ha-1, the C/N ratio from 16 to 44, the concentrations of citrate extractable P from 66 to 487 mg kg-1 and the cation exchange capacity from 186 to 634 µmolc g-1. Gross FF turnover calculated based on litterfall and FF mass ranged from 3.0 to 22.9 a. The fine root biomass showed close correlation with FF mass and precipitation at the studied sites. Cool and wet sites showed the highest root biomass. The identification and analyses of controlling factors and interrelationships with the microbial community and soil fauna at the study sites are currently in progress and will be presented. Based on the results obtained so far we conclude that the huge plasticity of European beech is mirrored by the heterogeneity of beech forest floor properties.

How to cite: Lang, F., Niederberger, J., Schilling, L., Scheu, S., Chen, J., Schulz, S., Schloter, M., Bibinger, S., and Prietzel, J.: European beech forests create an impressive diversity of forest floors, EGU General Assembly 2025, Vienna, Austria, 27 Apr–2 May 2025, EGU25-19450, https://doi.org/10.5194/egusphere-egu25-19450, 2025.

EGU25-20166 | Posters on site | SSS9.2

Changes in organic matter and upper mineral soil on clear cuts 

Radek Novotný, Václav Tejnecký, Martin Valtera, Lenka Pavlů, Věra Fadrhonsová, Ladislav Holík, Luboš Borůvka, and Vít Šrámek

Large-scale (i.e., > 1ha) clearcuts were studied in 2022–2024 at fifteen sites across the Czech Republic. Chemical properties and stock of selected elements were assessed in organic topsoil (OF+OH) and mineral soil (0–30 cm) layers in a block design on salvage-logged plots with different management of logging residues (cleaning vs. chipping) and adjacent control (survived) stands of Norway spruce (Picea abies L. Karst.). The rate of organic matter (OM) decomposition at the logged and control plots was evaluated based on the decomposition the experiments with standardized teabags and litterbags using the in-situ organic material (organic topsoil layer).

Changes in the water-extractable organic carbon (DOC) contents showed accelerated mineralization of organic matter on clearcuts. Significant differences in the quality of organic matter between the clearcut and a control stand were found only in the organic topsoil. No significant differences were found in the soil contents of risk elements (aqua-regia extracted As, Cd, Cu, Pb and Zn) between the clearcuts and a control treatment. Moreover, the distributions of risk elements in the soil profiles did not differ depending on the management of logging residues. Evaluation of the OM decomposition indicates slightly different weight loss of the samples from the stands and from the clearcuts, depending on the management of logging residues and the chemical composition of the organic layer.

This research was funded by the Ministry of Agriculture of the Czech Republic, project No. QK22020217.

How to cite: Novotný, R., Tejnecký, V., Valtera, M., Pavlů, L., Fadrhonsová, V., Holík, L., Borůvka, L., and Šrámek, V.: Changes in organic matter and upper mineral soil on clear cuts, EGU General Assembly 2025, Vienna, Austria, 27 Apr–2 May 2025, EGU25-20166, https://doi.org/10.5194/egusphere-egu25-20166, 2025.

EGU25-20671 | ECS | Posters on site | SSS9.2

Effects of forest structure and climate on decomposition processes and decomposer communities  

Johanna Asch, Marcell K. Peters, and Michael Scherer-Lorenzen

Temperate production forests have experienced a homogenization of forest structure under established management regimes, leading to a loss of biodiversity and changes in ecosystem functions, as well as a decreased resilience to disturbances. Management approaches such as the Enhancement of Structural Beta Complexity (ESBC) aim at reintroducing heterogeneity in production forests by emulating natural disturbances and succession through silvicultural manipulations. By breaking down organic matter and making it available for other organisms, decomposition processes and their associated invertebrate communities are an integral part of nutrient and carbon cycling. Animal derived necromass, such as carcasses and dung, is especially nutrient rich and provides due to its ephemeral nature resources for specialized decomposer communities. Through their tunnelling behaviour common dung beetle and burying beetle species, such as Anoplotrupes stercorosus and Nicrophorus vespilloides, play an important role in forest soil functioning by improving aeration and increasing nutrient input into the soil. Controlled by factors such as microclimate, which are directly influenced by forest stand structure, these processes and communities are likely strongly affected by forest stand homogenisation.

As part of the BETA-FOR research unit this study aims at disentangling the relationship between homogenization and decomposition in temperate production forests with a focus on decomposition rates and decomposer diversity. We have introduced different ESBC treatments by creating deadwood and canopy openings at eleven forests sites in production forests in Germany, each site comprised of nine ESBC-plots and nine control-plots (closed forests). On each plot, decomposition rates of different necromass, such as animal dung and rat carcasses, were determined by exposing the materials to plot conditions for specific lengths of time in spring and in summer 2023. Pitfall traps baited with dung and carcasses were installed directly afterwards to investigate decomposer diversity.

We found no difference in gamma- and beta-diversity of dung beetles and necrophagous beetles between ESBC-forests and control forests. However, Dung removal rates and dung beetle biomass decreased with increasing temperature. Dung beetle abundance and biomass, as well as dung removal rates were lower in summer and in warmer regions, this effect was especially strong on those plots of the ESBC-forests that had open forest canopies. Additionally, alpha diversity of both dung beetles and necrophagous beetles was lower on plots with open forest canopies in all regions.

This demonstrates that some important forest communities might not benefit from increased structural heterogeneity in forest stands and even react negatively to some aspects, such as more openings in the forest canopy. Canopy openings, especially in combination with higher temperatures, negatively impacted dung beetle communities, showing that under future climate warming and changes in forest structure these communities might face increased pressures.

How to cite: Asch, J., K. Peters, M., and Scherer-Lorenzen, M.: Effects of forest structure and climate on decomposition processes and decomposer communities , EGU General Assembly 2025, Vienna, Austria, 27 Apr–2 May 2025, EGU25-20671, https://doi.org/10.5194/egusphere-egu25-20671, 2025.

BG4 – Marine and Freshwater Biogeosciences

EGU25-630 | ECS | Posters on site | BG4.1

Blue carbon stocks and sources in four restored UK saltmarshes 

Catrina Gore, Laura Lehtovirta-Morley, Mark Chapman, Lisa Benson, Peter Mueller, and Stefanie Nolte

There is interest in using saltmarsh restoration, and that of other so-call blue carbon ecosystems, as a natural climate solution owing to the ability of these wetlands to sequester and store high amounts of organic carbon in their sediments. Given this, it is important to consider if restored saltmarshes come to function in the same way as natural, established habitats of the same type, and to determine the permanence and origin of the carbon stored in their sediments.

Several existing restored UK saltmarshes have not had their carbon stocks and sequestration rates assessed. Furthermore, the numerous studies of saltmarsh carbon stocks that do exist rarely consider the permanence of the carbon found in the sediment, and only sometimes assess whether the carbon comes from in-situ or external marine or terrestrial sources. This information is needed for carbon crediting schemes – how restoration projects can secure funding to ensure their implementation. To convert the carbon stored in a restored saltmarsh to carbon credits, it is necessary not only to quantify the amount of carbon being stored but also to establish whether it was buried due to the restoration and whether it is stored for a meaningful length of time.

Four restored UK saltmarshes were assessed as a part of this study. Firstly, carbon stock estimates were calculated for these sites that have so-far gone unquantified. This was achieved by developing a novel and inexpensive technique using foraminifera to gain an estimate of how much carbon can be attributed to restoration actions. Secondly, the quality/degradability of organic matter was determined using thermogravimetric analysis. And finally, the sources of organic matter were assessed using stable isotopes. Results show that much of the organic matter present in the sediment of the restored marshes is stable and recalcitrant, suggesting that it originated externally and was washed onto the marsh surface by the tide.

This project will add to our knowledge of UK blue carbon stocks while also implementing techniques that provide information additional to what is usually considered in saltmarsh studies. Developing a better understanding of the functioning of restored saltmarshes will allow judgements to be made about the value of restoration as a means of mitigating climate change.

How to cite: Gore, C., Lehtovirta-Morley, L., Chapman, M., Benson, L., Mueller, P., and Nolte, S.: Blue carbon stocks and sources in four restored UK saltmarshes, EGU General Assembly 2025, Vienna, Austria, 27 Apr–2 May 2025, EGU25-630, https://doi.org/10.5194/egusphere-egu25-630, 2025.

Assessing the effectiveness of past mangrove afforestation projects is vital for guiding future initiatives and enhancing success in areas eligible for restoration. This can be assessed by analyzing ecosystem carbon (EC) density, which includes both vegetation carbon (VC) density and soil organic carbon (SOC) density. Using 72 representative plots across five stand ages (12-44 years), we evaluated EC density in Sonneratia apetala-planted mangroves within the planted mangrove reserves in Bangladesh. Results revealed significant differences in VC density, SOC density, and EC density across varying stand ages, soil depths, and mangrove locations. The increased EC density observed over 44 years mangrove reserves (10.06 t/ha/year) with advancing stand ages provides empirical evidence for the effectiveness of afforestation in enhancing EC density levels in mangroves. Notably, the higher SOC density in the upper (0-20cm) soil layer (46 t/ha in 44-year-old stands) compared to the lower (40-60cm) soil layer (21 t/ha in 32-year-old stands) across mangroves indicates that most soil carbon is concentrated in the top 20 cm of the forest floor. The inverse relationship between climate extremes and SOC concentration and SOC density across mangrove reserves suggests that regardless of variations in stand ages and tree density, warming accelerates SOC decomposition and leads to a decline in SOC density. These findings underscore the critical role of afforestation in improving carbon density in mangroves, highlighting the need for continued investment in restoration efforts to maximize their ecosystem services.

How to cite: Hossain, Md. L.: Increasing stand age accelerates ecosystem carbon density while climate extremes reduce soil organic carbon density in 12-44 year-old Sonneratia apetala mangroves in Bangladesh, EGU General Assembly 2025, Vienna, Austria, 27 Apr–2 May 2025, EGU25-1020, https://doi.org/10.5194/egusphere-egu25-1020, 2025.

In coastal wetland ecosystems, decomposition of plant material is a key process in belowground carbon storage dynamics – the organic matter (OM) that does not break down has the potential to be preserved and contribute to soil/sediment carbon stocks. As such, factors that impact decomposition may also impact the capacity of wetlands to act as natural carbon sinks, particularly in a changing climate. OM decomposition is also an important process for the regeneration of nutrients and the support of ecosystem food webs. However, the paradigm of decomposition as an ecosystem service in its own right is less common in the literature for coastal wetland ecosystems than terrestrial or freshwater aquatic ecosystems.

In this presentation, we will explore the current state of blue carbon cycling in the context of decomposition. Studies on both natural litter and standardise tea litter, i.e. TeaComposition H2O, are showing how elevated temperatures enhance decay and reduce carbon preservation, but that other ecosystem-dependent characteristics like inundation and OM quality also influence the magnitude of this temperature effect. Increasing temperatures can also increase plant productivity, leading to scenarios where carbon decay could be mitigated by plant carbon production. Rising sea levels may also impact belowground OM production and decomposition that could affect soil/sediment strength and structure. Lastly, we will also explore this other side decomposition including if we can define a ‘good amount’ of decomposition that supports soil/sediment and ecosystem functions, while also promoting carbon preservation, particularly in management and restoration scenarios. The hope is to stimulate conversation and research ideas for understanding decomposition ecology for blue carbon and beyond.

How to cite: Trevathan-Tackett, S.: Decomposition in coastal wetlands and what may be beyond carbon preservation, EGU General Assembly 2025, Vienna, Austria, 27 Apr–2 May 2025, EGU25-1613, https://doi.org/10.5194/egusphere-egu25-1613, 2025.

EGU25-2042 | ECS | Orals | BG4.1 | Highlight

Climate change amplifies mangrove hypercapnic hypoxia and threatens fish habitats 

Gloria Reithmaier, Ariel K. Pezner, Adam Ulfsbo, Frank Melzner, and Isaac R. Santos

Mangroves provide habitats for many marine species and support fisheries in developing tropical countries. However, mangrove habitats are increasingly threatened by climate change. Here, we show how global warming and rising atmospheric CO2 will reduce dissolved oxygen and increase CO2 in mangrove waters, making them less suitable as fish refugia. Global observations from 23 mangroves revealed that most sites already experience mild (on average, 34–43% of the time) or severe (6–32%) hypercapnic hypoxia, i.e., low oxygen and high CO2 conditions. Hypercapnic hypoxia mostly occurs during low tide and in tropical mangroves. Climate projections indicate that oxygen will decrease by 5–35% and CO2 will increase by 8–60% by 2100. Therefore, hypercapnic hypoxia events will occur more frequently, last longer, and become more severe. These shifts will reduce mangrove biodiversity and decrease habitat quality for commercially valuable fish, likely reducing fishing yields in tropical developing countries.

How to cite: Reithmaier, G., Pezner, A. K., Ulfsbo, A., Melzner, F., and Santos, I. R.: Climate change amplifies mangrove hypercapnic hypoxia and threatens fish habitats, EGU General Assembly 2025, Vienna, Austria, 27 Apr–2 May 2025, EGU25-2042, https://doi.org/10.5194/egusphere-egu25-2042, 2025.

The Wadden Sea comprises the largest tidal flats of the world and extensive intertidal seagrass meadows occur in its northern part. However, their carbon storage potential is largely unknown. Belowground burial of carbon was assessed from different locations in 4 seagrass meadows. All meadows are large (76 – 441 ha), with a similar seagrass cover density (60 – 80 %), species composition (strongly dominated by Zostera noltei) and comparable age (> 90 years). The major difference is the sediment: 3 meadows have established on sandy tidal flats and 1 on mud flats. Sediment cores were taken down to 45 - 65 cm depth and organic matter was measured along vertical profiles. In the sandy sediments, the permanent carbon storage was really low, with an organic carbon content below 0.4 % (average 0.22 – 0.38 %). Input to carbon storage originates mainly from internal biomass production and the dominant species Zostera noltei is relatively small (leaf length about 15 cm) and sheds its leaves in winter, which are carried away by the current. However, in muddy sediment the carbon content was also low but with 1.1 % about 3 times higher. Muddy sediments have a low hydraulic connectivity and the sediment is waterlogged also during air-exposure at low tide. Waterlogged conditions make the sediment more anoxic, generating more reduced conditions which slows down decomposition. Furthermore, muddy sediment particles have a larger surface-to-volume ratio, allowing more organic material to adhere to the particles. Also, the sandy sediments occur in higher energy areas, where resuspension is more common, facilitating export of organic matter and lower burial rates.

How to cite: Dolch, T. and Koop-Jakobsen, K.: The impact of sediment grain size on the carbon storage potential of intertidal seagrass meadows in the northern Wadden Sea, EGU General Assembly 2025, Vienna, Austria, 27 Apr–2 May 2025, EGU25-3671, https://doi.org/10.5194/egusphere-egu25-3671, 2025.

EGU25-4378 | Posters on site | BG4.1

Restoration of seagrass meadows through a nature-based solution in the Caleri Lagoon (Po River Delta, Italy)  

Virginia Strati, Michele Mistri, Matteo Albéri, Enrico Chiarelli, Cinzia Cozzula, Federico Cunsolo, Nedime Irem Elek, Ghulam Hasnain, Fabio Mantovani, Michele Padoan, Maria Grazia Paletta, Marco Pezzi, Kassandra Giulia Cristina Raptis, Andrea Augusto Sfriso, Adriano Sfriso, and Cristina Munari

Seagrass meadows are pivotal Blue Carbon habitats that support biodiversity, coastal protection, provide vital ecosystem services while mitigating anthropogenic CO2 emissions through carbon sequestration. Globally, they are increasingly regressing due to the combined effects of climate change and human activities. In this context, restoration initiatives facilitate the reintroduction of seagrass meadows to sites where they were formerly present.

This study focuses on a nature-based restoration initiative in the Caleri lagoon, located in the Po River Delta (Italy) where the dwarf eelgrass Zostera noltei was transplanted to restore a depleted habitat.
A total of 135 sods, with a diameter of approximately 15 cm, were transplanted from the donor site in the Venice lagoon in autumn 2022 and late spring 2023.

On field monitoring of seagrass growth was carried out during August 2023 by means of UAV surveys and in June 2024 by means of ground surveys. The UAV survey was conducted employing a lightweight drone equipped with a high-resolution RGB camera. Visual inspection of the high-resolution orthomosaics, combined with prior knowledge of the transplantation sites, enabled precise mapping and identification of the transplanted seagrass sods. Measured diameters ranged from a minimum of 3 cm (indicative of a decrease in leaf density of the sod) to a maximum of 66 cm (indicative of a growth in leaf cover of more than 4 times). Ground measurements taken in June 2024 provided a rough estimate of the eelgrass meadow extent of 60 m2 with continuous meadow patches with diameters ranging between 1.5 and 3 m.

Additionally, the biota sampling and analysis showed clear positive signs of recovery of the benthic community. The diversity and evenness values of the 115 benthic species showed slightly higher values in the transplant site respect to the control site. A higher frequency of epifaunal predators and herbivores, and of organisms with longer life spans and larger body sizes was observed in the macrobenthic community. 

The restoration of Z. noltei in the Caleri lagoon exemplifies successful restoration practices that contribute to the mitigation of anthropogenic impacts, reinforcing the role of coastal vegetated ecosystems as buffers against environmental pressures. In addition, this case study underscores the critical importance of interdisciplinary approaches and continued monitoring to optimize restoration efforts and inform blue carbon policy development. In this context, high-resolution, non-intrusive UAV data collection supports monitoring activities by enabling frequent, repeatable surveys, thereby enhancing efficiency in time-sensitive studies.

How to cite: Strati, V., Mistri, M., Albéri, M., Chiarelli, E., Cozzula, C., Cunsolo, F., Elek, N. I., Hasnain, G., Mantovani, F., Padoan, M., Paletta, M. G., Pezzi, M., Raptis, K. G. C., Sfriso, A. A., Sfriso, A., and Munari, C.: Restoration of seagrass meadows through a nature-based solution in the Caleri Lagoon (Po River Delta, Italy) , EGU General Assembly 2025, Vienna, Austria, 27 Apr–2 May 2025, EGU25-4378, https://doi.org/10.5194/egusphere-egu25-4378, 2025.

EGU25-4999 | ECS | Orals | BG4.1

Revealing accumulated carbon storage of global mangroves from 2000 to 2020 

Moran Wang, Tianyuan Zhang, Yongjuan Xie, Zhiqiang Zhang, and Xudong Wu

Mangroves, as a vital component of blue carbon ecosystems play a crucial role in carbon sequestration and climate change mitigation. However, intensified anthropogenic activities such as aquaculture and agricultural farming resulted in significant losses of mangroves worldwide and substantially affected their carbon storage capacity. By developing a 1-km global gridded dataset of mangroves’ accumulated carbon storage from 2000 to 2020, we identified regional hotspots of carbon stock changes at different spatial scales and assessed the impact of mangrove extent changes on carbon sequestration capacity. The outcomes revealed the spatial-temporal heterogeneity of mangrove accumulated carbon storage and could serve as a reference for implementing reforestation initiatives in vulnerable areas, thus supporting the sustainable management of global mangrove ecosystems.

How to cite: Wang, M., Zhang, T., Xie, Y., Zhang, Z., and Wu, X.: Revealing accumulated carbon storage of global mangroves from 2000 to 2020, EGU General Assembly 2025, Vienna, Austria, 27 Apr–2 May 2025, EGU25-4999, https://doi.org/10.5194/egusphere-egu25-4999, 2025.

EGU25-5467 | Posters on site | BG4.1

Response mechanism of carbon balance in natural and restored mangrove ecosystems under the effects of storm surges 

Huimin Zou, Jianhua Zhu, Xiaojian Liu, Zhulin Chen, and Zhiyong Xue

Storm surges are unanticipated natural disturbances to mangrove forests, but little is known about how they alter ecosystem-level carbon dioxide exchange and methane flux of natural and restored mangrove forests. In this study, we quantified the impact of storm surge on CO2 and CH4 fluxes in natural (HK site) and restored (PYR site) mangroves, and analyzed the differences in the impact of environmental variables on CO2 and CH4 fluxes before, during, and after storm surges. The results showed that the intensity of carbon dioxide absorption was temporarily weakened at PYR site, while CO2 absorption even turned into CO2 source at HK site during the storm surge. The emission of CH4 was suppressed at both sites during the storm surge landfall. GPP, Reco, and CH4 emissions were reduced by 29% and 59%, 20% and 10%, and 50% and 40% at restored and natural mangroves, respectively, due to the storm surge. For the NEE at both sites, the most correlated environmental variable before, during, and after the storm surge was PPFD, with negative correlation coefficients of -0.89, -0.74, and -0.81, respectively. For PYR site, the correlations between FCH4 and VPD and RH both increased compared with those before and after the storm surge. For HK site, the correlations between FCH4 and VPD, RH, and TS during the storm surge were not significant, while the correlations between FCH4 and TS, WS, and PPFD were higher than those before and after the storm surge. These findings indicated that storm surges weaken CO2 absorption and inhibit methane emissions, and the carbon fluxes of natural and restored mangroves respond differently to storm surges. The research results can provide a basis for the study of mangrove carbon flux under extreme weather events.

How to cite: Zou, H., Zhu, J., Liu, X., Chen, Z., and Xue, Z.: Response mechanism of carbon balance in natural and restored mangrove ecosystems under the effects of storm surges, EGU General Assembly 2025, Vienna, Austria, 27 Apr–2 May 2025, EGU25-5467, https://doi.org/10.5194/egusphere-egu25-5467, 2025.

EGU25-6820 | Orals | BG4.1

Blue Carbon in Mekong Delta: Linking Policy, Science and Practice 

Hien Trinh and Vinh Truong

This study investigates the potential of blue carbon in mitigating climate change in the Mekong Delta, Vietnam, focusing on the interplay between policy, science, and practical implementation. It examines the role of mangroves in carbon sequestration, highlighting their significance in the global carbon cycle and their capacity to mitigate climate change. The research analyzes Vietnam's forest conservation policies, assessing their impacts on blue carbon projects.

Field studies across Ca Mau province in the Mekong Delta quantified mangrove carbon stocks, revealing significant carbon sequestration potential. However, mangrove loss due to land conversion and aquaculture poses a challenge. Policy analysis reveals that while Vietnam has a framework for forest management, including provisions for sustainable use and reforestation, certain regulations, particularly those concerning land use ratios and harvesting practices, can hinder mangrove restoration and blue carbon initiatives.

The study proposes an intervention strategy to enhance blue carbon sequestration, emphasizing sustainable silvicultural practices, sediment management, and the integration of mangrove conservation with aquaculture. Crucially, it advocates for a community-centered approach that protects livelihoods, provides financial compensation for potential income loss due to conservation efforts, and builds capacity for sustainable aquaculture practices. This research underscores the urgent need to align policies with scientific understanding and community needs to effectively harness the climate change mitigation potential of blue carbon in the Mekong Delta.

How to cite: Trinh, H. and Truong, V.: Blue Carbon in Mekong Delta: Linking Policy, Science and Practice, EGU General Assembly 2025, Vienna, Austria, 27 Apr–2 May 2025, EGU25-6820, https://doi.org/10.5194/egusphere-egu25-6820, 2025.

EGU25-6904 | Orals | BG4.1

Blue Carbon Additionality and Permanence in the coastal mangrove forests of the Mekong Delta, Viet Nam 

Truong Van Vinh, Ho Le Tuan, Sigit D Sasmito, Andre Rovai, Jaxine Livingston Wolfe, Vanyarat Kongsap, Pere Masque Barri, Tran Vu Khan Linh, Thomas Brook, George Biddulph, and William Austin

The Mekong Delta is one of the largest deltas in the world, spanning approximately 55,000 km2 and sharing approximately 50.2% of Vietnam’s mangrove ecosystems (90.8 km2 km2; Tinh et al., 2022). Supporting ~18 million people, the Mekong Delta region faces many pressures, including land conversion for shrimp aquaculture, expanding urban centres, deforestation, and coastal erosion. In response to these challenges, mangrove forests in the Mekong Delta have been the focus of several restoration and conservation efforts in recent years, with 27.3  km2 of coastal mangrove forests currently being restored and/or conserved under current forest management efforts.

The purpose of this study is to quantify how mangrove restoration in Ca Mau province, Viet Nam, delivers blue carbon additionality within mangrove ecosystems, particularly where land conversion for shrimp aquaculture has driven deforestation. Field sampling for total ecosystem carbon stocks across natural and restored forests, including integrated shrimp-mangrove aquaculture systems, reflecting one of the region's dominant land-use practices, was carried out by using standardized blue carbon protocols. Mangrove tree diameter, height and species, and downed dead wood were measured and recorded to estimate biomass and necromass carbon stocks. 397 soil samples were collected to estimate belowground soil carbon stocks. Preliminary results from two natural and two restored sites of different ages, show clear evidence of additionality in both aboveground and belowground carbon stores after restoration. However, a comparison of earth observation data between 2010 and 2024 allows us to provide a tentative estimate of carbon losses due to ongoing coastal erosion in these fringing mangrove forests.

These results highlight that efforts to restore mangrove forests in the Mekong Delta can deliver quantifiable blue carbon benefits, potentially underpinning new carbon crediting opportunities to help fund further mangrove restoration across the Mekong Delta. For restoration efforts to be effective in the long-term, careful consideration of ongoing habitat loss, increasingly driven by coastal erosion in response to anthropogenic sea-level rise, will be necessary.

How to cite: Vinh, T. V., Tuan, H. L., Sasmito, S. D., Rovai, A., Wolfe, J. L., Kongsap, V., Masque Barri, P., Linh, T. V. K., Brook, T., Biddulph, G., and Austin, W.: Blue Carbon Additionality and Permanence in the coastal mangrove forests of the Mekong Delta, Viet Nam, EGU General Assembly 2025, Vienna, Austria, 27 Apr–2 May 2025, EGU25-6904, https://doi.org/10.5194/egusphere-egu25-6904, 2025.

Mudflats and saltmarshes are increasingly recognised as having the potential to sequester and store blue carbon. There is interest in whether Managed Realignment (MR), the breaching of coastal defences to allow (re)inundation of land primarily aims to offset habitat losses, may also have additional benefits including the sequestration and storage of blue carbon. However, sequestration rates are expected to be highly variable because of variations in tidal range, suspended matter concentrations, vegetation assemblages and other environmental factors. In addition, to date there is limited consensus on sampling strategy, including maximum coring depth and spatio-temporal sampling interval. For example, maximum coring depths reported in the literature range from 0.1m to 1.0m. This study aims to critically assess the sampling strategy required to quantify carbon stocks in three spatially adjacent but environmentally distinct settings on the North bank of the macrotidal, hyperconcentrated, Humber Estuary, UK: an agricultural field that is a candidate for managed realignment, a recently breached managed realignment site, and a natural saltmarsh.

Cores were sampled to a depth of up to 3m at 59 locations spaced 250m apart in a 4km-long × 1km-wide area. Material extruded from each distinct horizon was grain-sized using a Malvern Mastersizer 3000 laser-diffraction particle analyser and water content and organic and inorganic carbon fractions were quantified using ThermoGravimetric Analysis (TGA; Leco, TGA701). Both organic and inorganic carbon contents were highly variable in the upper 1m, with differing trends between the natural saltmarsh and MR sites in comparison to the agricultural site: in general, organic carbon content was ~6.5% in the upper 1m and decreased to ~3-4% at a depth of 1.5m and 1.8m in the marshes, whereas organic carbon content was ~4.5% in the upper 0.3m and decreased to ~3% at and below a depth of 0.6m in the agricultural field. Inorganic carbon content was ~2% in the upper 0.3m at all sites, but whilst the marshes exhibited minimal variation with depth (varying between 1.8 and 3.8%), the agricultural field exhibited a decline to 0% between 0.4m and 0.8m, before increasing non-linearly to ~6% at a depth of 2m. However, these general trends mask large inter- and intra-site variability, with organic carbon ranging from 1.8% to 10.3% and inorganic carbon ranging from 0% to 8.6%.

The impact of our new empirical results on carbon sequestration estimates was explored using a 100,000-run Monte Carlo simulation framework in which organic and inorganic carbon contents were randomly selected from best-fit pdfs of data including and excluding cores from below 1m and 1.5m. Our results imply that carbon stocks estimated using cores extruded from only the upper 0.3m may significantly overestimate the total carbon sequestered and stored in saltmarshes and managed realignment sites. Cores to quantify carbon stocks in saltmarshes should extend to a depth of at least 1m and ideally to a depth of 1.5m.

How to cite: Trotman, C., Thomas, R., Forster, R., and Rogerson, M.: Are managed realignment sites net carbon sources or sinks? Insights from the Humber estuary, UK. Natural saltmarsh sites store more carbon at depth than managed realignment sites and agricultural land., EGU General Assembly 2025, Vienna, Austria, 27 Apr–2 May 2025, EGU25-8627, https://doi.org/10.5194/egusphere-egu25-8627, 2025.

EGU25-9117 | ECS | Orals | BG4.1

Rigorous Baseline Data: The Key to Successful Mangrove Conservation and Restoration Projects in West Africa. 

Ebuka Nwobi, Kelley Reardon, Farid Rohan, Aqsa Aslam, Max Mayer, Tanya Bryan, Sean Fitzpatrick, and Labeeqa Zaheer

Mangrove forests offer a wide range of ecosystem services that benefit both nature and communities living in and around them. Therefore, effective resource management is essential to sustain these invaluable benefits for future generations. Successful mangrove restoration and conservation relies on the foundation of rigorous baseline data. West Africa Blue (“Blue”) is a high-integrity developer of blue carbon projects in West and Central Africa, with two projects (Sierra Leone and Guinea) currently listed in the Verra registry. To ensure we provide the highest level of data possible for our carbon projects, we establish baselines for deforestation, restoration, carbon and biodiversity using rigorous analyses, including GIS-based tools, field data collection, and stakeholder and community engagement. Our system involves methodologies for assessing baseline deforestation and restoration potential, map validation, aboveground biomass, soil organic carbon, and biodiversity baseline. Utilizing public data and field validation exercises, our mapping processes are shown to generate mangrove change results with over 95% accuracy. Using standard operating procedures, we collect AGB data from the field to establish a regional AGB map using SAR and Lidar data. We collected data from Sierra Leone and Guinea and additional AGB data from Nigeria to establish a radar-AGB equation with RMSE of 70 tC/ ha and R2 of 0.41. Leveraging on over 3000 samples of cores, our long-term goals is to establish a regional organic matter (% LOI) ~ organic carbon (% Corg) equation to give a quicker and more accurate estimate of mangrove soil organic carbon.. Further, we carried out a biodiversity baseline assessment in collaboration with a local conservation organization in Sierra Leone called the Conservation Society of Sierra Leone (CSSL) using a mix of innovative and traditional methodologies, including Local Ecological Knowledge (LEK) surveys, camera traps, transects, and environmental DNA (eDNA) analysis with Nature Metrics. Establishing this comprehensive mapping, carbon and biodiversity baseline information helps build a strong foundation for effectively planning mangrove restoration and conservation.

How to cite: Nwobi, E., Reardon, K., Rohan, F., Aslam, A., Mayer, M., Bryan, T., Fitzpatrick, S., and Zaheer, L.: Rigorous Baseline Data: The Key to Successful Mangrove Conservation and Restoration Projects in West Africa., EGU General Assembly 2025, Vienna, Austria, 27 Apr–2 May 2025, EGU25-9117, https://doi.org/10.5194/egusphere-egu25-9117, 2025.

EGU25-9591 | ECS | Orals | BG4.1

Soil organic carbon content and reactivity at the pioneer saltmarsh-mudflat ecotone 

Cathilyn L. McIntosh, Craig Smeaton, Alex Huston, Kirstie Chalmers, Lauren Carl, Handong Yang, and William E. N. Austin

The Intergovernmental Panel on Climate Change (IPCC) currently recognizes vegetated coastal systems, such as saltmarshes, as actionable blue carbon habitats. While not yet officially acknowledged by the IPCC, recent research has highlighted the important role of adjacent mudflat habitats in long-term carbon storage, leading to their growing recognition as “emerging” blue carbon systems. Currently, most research on soil organic carbon (OC) dynamics in the intertidal zone focuses on either saltmarshes or mudflats, while overlooking transitional ecotonal zones. While OC dynamics in saltmarshes have been the main focus of the research community, significantly less attention has been given to tidal mudflats.

We collected soil cores from two different estuaries in England, along transects spanning the pioneer saltmarsh–mudflat ecotone to compare changes in OC storage, accumulation rates, and organic matter (OM) reactivity across these habitats. OC accumulation rates were calculated using 210Pb and 137Cs dating techniques. OM thermal reactivity, reflecting the susceptibility of soil OM to decomposition largely influenced by the balance of labile and recalcitrant OM pools, was assessed using the Carbon Reactivity Index (CRI) via thermogravimetric analysis.

Our results reveal that OC stocks, OC accumulation rates, and CRI values are similar across the pioneer saltmarsh–mudflat ecotone. In comparison to other saltmarsh systems across Great Britain, OC stocks were lower in both the saltmarsh and mudflat zones, yet OC accumulation rates were similar to published saltmarsh data from other regions in the UK. The CRI values indicate that OC stored in pioneer saltmarsh soils are more reactive, and therefore potentially at higher risk of remineralization than adjacent mudflat soils.

Our results suggest pioneer saltmarshes and mudflats, while exhibiting similar OC stocks and OC burial rates, do however exhibit marked changes of OM reactivity. The dynamic nature of these intertidal systems likely increases mineralization of high-reactivity OM across the ecotone, leading to the observation that intertidal mudflats are stores of relatively more stable OM compared to the adjacent pioneer saltmarsh. Our research contributes to the overall understanding of OC storage in saltmarsh pioneer zones and mudflats. We aim to help managers prioritize areas based on both their total OC stocks and their potential for OC remineralization, focusing efforts on protecting high-degradation risk zones.

How to cite: McIntosh, C. L., Smeaton, C., Huston, A., Chalmers, K., Carl, L., Yang, H., and Austin, W. E. N.: Soil organic carbon content and reactivity at the pioneer saltmarsh-mudflat ecotone, EGU General Assembly 2025, Vienna, Austria, 27 Apr–2 May 2025, EGU25-9591, https://doi.org/10.5194/egusphere-egu25-9591, 2025.

EGU25-9623 | ECS | Posters on site | BG4.1

Quantifying inorganic carbon fluxes in temperate seagrass meadows 

Samuel Scott-Askin, Isaac R Santos, Gerli Albert, Sara Forsberg, Maria E Asplund, Diana Deyanova, Aurora M Ricart, Martin Gullström, Mats Björk, and Gloria M S Reithmaier

Understanding the carbon sequestration potential of blue carbon ecosystems is a crucial component for developing nature-based solutions to combat climate change. Alkalinity generation is an often-overlooked carbon sequestration mechanism, especially in seagrass meadows. Here, we quantified alkalinity (TA) and dissolved inorganic carbon (DIC) fluxes at temperate seagrass meadows in Sweden, using 24-hour in-situ chamber incubations during the late part of the productive season in early September. Observed net TA fluxes to the water column of 22 ± 10 mmol m-2 d-1 were 19% lower than DIC fluxes (27 ± 6 mmol m-2 d-1). Both fluxes were largely related to day-night cycles. A sink of TA during the day was counteracted by a 3-times stronger source at night. DIC fluxes displayed a highly variable source, being 3 to 50-times higher at night compared to daytime. TA and DIC fluxes were slightly lower than those reported for seagrasses in warmer climates and for other coastal wetlands, i.e., mangroves and saltmarshes. Nonetheless, alkalinity generation in temperate seagrasses contributes to their carbon sequestration potential and warrants consideration in future investigations.

How to cite: Scott-Askin, S., Santos, I. R., Albert, G., Forsberg, S., Asplund, M. E., Deyanova, D., Ricart, A. M., Gullström, M., Björk, M., and Reithmaier, G. M. S.: Quantifying inorganic carbon fluxes in temperate seagrass meadows, EGU General Assembly 2025, Vienna, Austria, 27 Apr–2 May 2025, EGU25-9623, https://doi.org/10.5194/egusphere-egu25-9623, 2025.

EGU25-9674 | Orals | BG4.1

Restoration of native saltmarshes enhances carbon sequestration and mitigates warming effects following Spartina alterniflora removal 

Dong Wang, Fabio A Labra, Hualei Yang, Yuekai Hu, Zhiyuan Zhao, and Lin Yuan*

The overwhelming dispersion of exotic species Spartina alterniflora threatened the structure and function in native coastal ecosystems. Consequently, native saltmarshes restoration has emerged as a nature-based solution following the removal of invasive species. However, given S. alterniflora as a high carbon sequestration species, it remains uncertain on the impacts of native saltmarshes restoration on coastal blue carbon benefits following its eradication. Here, this study quantified atmospheric carbon uptake and organic carbon storage in restored saltmarsh to assess whether native saltmarsh (Phragmites australis and Bolboschoenoplectus mariqueter) restoration can compensate for the carbon sinks and the climate effects following S. alterniflora eradication. The results showed that removal of S. alterniflora drastically reduced atmospheric carbon uptake, with unrestored bare mudflat turning into carbon sources. After restored native saltmarsh, the atmospheric carbon uptake remained lower than pre-eradication levels of S. alterniflora but provided significant greater carbon sink benefits compared to unrestored bare mudflat. Additionally, the total organic carbon density of soil and vegetation at 50 cm depth in restored native saltmarsh (P. australis and B. mariqueter) exceeded that of unrestored bare mudflat by over 1.4 times, restoring over 70% that observed before eliminating S. alterniflora. Considering the sustained global warming potentials (SGWP) of CH4 over the 100-year timescale, both restored native saltmarsh communities exhibited a net cooling effect for mitigating climate warming, compared to invasive S. alterniflora community and unrestored bare mudflat after S. alterniflora removal. Our findings not only reveal that saltmarsh restoration provides a substantial route to mitigating climate change, but also highlight the trade-off between the carbon losses from eliminating invasive species and the carbon offset achieved through restoring native vegetation in affected ecosystems. This study provides actionable insights for regions confronting analogous challenges with invasive species and restoration scenarios, enabling the development of more comprehensive strategies to ensure effective carbon compensation. Future restoration efforts in invaded ecosystems should prioritize co-benefits such as conserving native ecosystems and enhancing carbon sequestration.

How to cite: Wang, D., Labra, F. A., Yang, H., Hu, Y., Zhao, Z., and Yuan*, L.: Restoration of native saltmarshes enhances carbon sequestration and mitigates warming effects following Spartina alterniflora removal, EGU General Assembly 2025, Vienna, Austria, 27 Apr–2 May 2025, EGU25-9674, https://doi.org/10.5194/egusphere-egu25-9674, 2025.

EGU25-10929 | ECS | Orals | BG4.1

Low climate benefits of Nordic coastal marshes  

Carmen Leiva Dueñas, Gary T. Banta, Christoffer Boström, Franziska Eller, Johan Eklöf, Line Holm Andersen, Kai Jensen, Marianna Lanari, Ella Logemann, Pere Masquè, Thomas Ostertag, Christoph Reisdorff, Anaïs Richard, Anu Vehmaa, Jukka Alm, and Dorte Krause-Jensen

Saltmarshes, recognized as effective organic carbon (OC) sinks, have gained attention for their potential contribution to climate mitigation through protection and restoration. However, the heterogeneous and geologically young nature of Nordic coastal marshes likely explains the limited research on their climate mitigation potential. To fill this gap, we examined soil OC storage, long-term OC accumulation rates, and soil methane emissions across four Nordic coastal marshes spanning broad climate and environmental gradients. Additionally, we evaluated the effects of grazing, a common management practice. The four Nordic saltmarshes assessed store a median of 7 kg OC m−2 (interquartile range, IQR: 8–6) in the top 15-35 cm of soil and accumulate 41 g OC m−2 yr−1 (IQR: 47–32). Considering only the saltmarsh's additional OC, most relevant to climate mitigation, these values drop to 4 kg OC m−2 (IQR: 6–2) and 21 g OC m−2 yr−1 (IQR: 33–11). Globally, both rates are comparatively low. Higher saltmarsh age and root:shoot ratio strongly and positively correlated with OC stocks and accumulation rates. The elevated root:shoot ratios seemed a morphological adaption to stressful conditions (higher soil salinity, slightly alkaline soils, warmer temperatures, and low water and nutrient availability) reflected in the saltmarsh plant composition. Soil methane emissions reduced the climate benefit of OC accumulation by 0.15–7.3% in Danish saltmarshes, which remained strong CO2eq sinks, but by 70% in Finnish saltmarshes, leaving them as much weaker sinks. Grazing slightly increased soil OC stocks but did not affect OC accumulation rates or methane fluxes. However, greenhouse gas emissions from livestock farming, even at low grazing intensity, largely outweighed saltmarsh climate benefits. A comprehensive Nordic saltmarsh management strategy is needed, extending beyond the current focus on biodiversity to include coastal protection, nutrient retention, and other ecosystem services, including their limited, yet relevant, role in climate mitigation.

How to cite: Leiva Dueñas, C., T. Banta, G., Boström, C., Eller, F., Eklöf, J., Holm Andersen, L., Jensen, K., Lanari, M., Logemann, E., Masquè, P., Ostertag, T., Reisdorff, C., Richard, A., Vehmaa, A., Alm, J., and Krause-Jensen, D.: Low climate benefits of Nordic coastal marshes , EGU General Assembly 2025, Vienna, Austria, 27 Apr–2 May 2025, EGU25-10929, https://doi.org/10.5194/egusphere-egu25-10929, 2025.

Coastal wetlands - an important blue carbon ecosystems - are an exceptionally efficient carbon storage sinks on Earth with high carbon sequestration capacity, contributing significantly to combating climate change. Accurate carbon budgeting of coastal marshes requires a complete understanding of different processes/components including the net ecosystem exchange of CO2 with atmosphere, the lateral carbon export lost with tidal draining, and the soil carbon accumulation rate. Yet, most, if not all, current studies present these three components separately, largely due to the knowledge gaps among the diffferent disciplines. Here, for the first time, we bring together measurements of eddy-covaiance flux tower, soil carbon burial data, and lateral carbon export measurements collected in the Xisha marsh - a tidal freshwater wetlands near the first order of Yangtze bifurcation in the Yangtze river delta. Each data set is collected, processed and analyzed in part with disciplinary methodologies. High resolution measurements of time series lateral carbon continuted for one complete hydrological cycle in the system and results show that teh lateral carbon loss with tides contribute up to 20% in this dynamic estuarine blue carbon system. This study highlights the importance of taking the lateral carbon loss into consideration for better closing up the estuarine blue carbon budget.

How to cite: Cao, F.: Closing the Coastal Wetlands Carbon Budget using tower-based measurements, soil carbon accumulation rates and high resolution lateral carbon flux observations, EGU General Assembly 2025, Vienna, Austria, 27 Apr–2 May 2025, EGU25-11664, https://doi.org/10.5194/egusphere-egu25-11664, 2025.

EGU25-12961 | Orals | BG4.1

Challenges for carbon crediting in Zostera marina (eelgrass) meadows 

Dorte Krause-Jensen, Carmen Leiva Dueñas, and Hilary Kennedy

The protection and restoration of seagrass meadows are recognised contributions to address the combined biodiversity-, climate- and pollution crises because the meadows are hotspots of biodiversity and soil organic carbon (OC) storage and have experienced major global declines in response to pressures. However, the OC storage capacity and the associated climate change mitigation and carbon crediting potential vary among and within seagrass species. Here we address the potential for carbon crediting in meadows of Zostera marina (eelgrass), the most widely distributed seagrass species, through a review of soil OC stocks, accumulation rates and net organic matter inputs (subtracting the inherent mineral-protected OC). Eelgrass soil OC stocks and accumulation rates display a wide range of values, but especially accumulation rates are typically lower than the average global values for seagrasses. Only 22% of the eelgrass soil samples in this compilation would return positive OC values after subtracting the inherent mineral-protected fraction, and OC stocks under eelgrass meadows were generally not significantly different from stocks of nearby unvegetated soils. These features may partly be due to potentially strong spatial heterogeneity and temporal dynamics of eelgrass meadows, general eelgrass traits as well as export of eelgrass carbon beyond the meadows. We discuss how the findings affect the implementation of effective policies and methodologies that are required for the conservation and restoration policies relating to seagrass meadows. 

How to cite: Krause-Jensen, D., Leiva Dueñas, C., and Kennedy, H.: Challenges for carbon crediting in Zostera marina (eelgrass) meadows, EGU General Assembly 2025, Vienna, Austria, 27 Apr–2 May 2025, EGU25-12961, https://doi.org/10.5194/egusphere-egu25-12961, 2025.

EGU25-14310 | ECS | Posters on site | BG4.1

High Resolution Mapping of Carbon Stocks and Sequestration and Organic Matter Sources over the last 2000 Years in the Sprague River Marsh, Phippsburg Maine 

Adelle Welch, Beverly Johnson, Phillip Dostie, Margo Danahey, Adi Kolff, Izzy Larson, Evelyn Marchand, Riley Baker, Hadley Blodgett, and Sam Turtle

Salt marshes are regarded as key blue carbon stocks with high rates of carbon sequestration due to tidal inundation. However, the impacts that rising sea levels and human development and alterations to salt marshes have on carbon stocks and organic matter deposition have yet to be fully understood. The Sprague River Marsh, in Phippsburg Maine, has been subject to many alterations through the last 400 years (ditching, the building of a tidal restriction and the dredging and redirection of the natural tidal channel).  This study analyzes the geochemical records (carbon density and sequestration, d13C, d15N, and C:N ratio) of 40 previously collected sediment cores and 3 new sediment cores, from the Sprague River Marsh. The carbon density data were used to identify areas of high carbon stocks within the upper meter of the marsh. The northernmost area of the Sprague Marsh had significantly higher carbon stocks than elsewhere. The stable isotope data were parsed into different time intervals (0-50, 50-100, 100-200, 200-300, 300-500, 500-1000, 1000-2000 YRS BP) based on an age model derived from 7 radiocarbon dates. Marsh surfaces were mapped using ArcGIS and Empirical Bayesian Kriging to identify areas and times where organic deposition was dominated by high salt marsh, upland plant input, or marine input. These marsh surface reconstructions illuminate shifts in organic matter deposition with changes in relative sea level rise (in agreement with Johnson et al., 2007), the dredging of the tidal channel, marsh evolution and colonization, and growth of the marsh prior to European Colonization. This detailed history of Sprague Marsh can be used to identify areas of high carbon content and the number of sediment cores needed to accurately reconstruct marsh history and analyze and predict carbon stocks.

How to cite: Welch, A., Johnson, B., Dostie, P., Danahey, M., Kolff, A., Larson, I., Marchand, E., Baker, R., Blodgett, H., and Turtle, S.: High Resolution Mapping of Carbon Stocks and Sequestration and Organic Matter Sources over the last 2000 Years in the Sprague River Marsh, Phippsburg Maine, EGU General Assembly 2025, Vienna, Austria, 27 Apr–2 May 2025, EGU25-14310, https://doi.org/10.5194/egusphere-egu25-14310, 2025.

EGU25-15168 | ECS | Posters on site | BG4.1

Seasonal Dynamic Response of Oxygen Flux in Ecklonia Cava Forests to Environmental Factors: An Aquatic Eddy Covariance Study 

Jae Seong Lee, Chang Hwa Lee, Yong-Jae Baek, Sung-Han Kim, Kyung-Tae Kim, Dong Moon Choi, and Taihum Kim

Artificial restoration and conservation of kelp forests are globally implemented as part of ‘blue carbon’ initiatives to achieve carbon neutrality in response to climate change. Ecklonia Cava, a kelp species distributed along the eastern and southern coasts of Korea, plays a significant role as a primary producer in coastal rocky shores. Quantitative analysis of its productivity is essential to evaluate the ecological importance of coastal rocky shores in global carbon sequestration.

We quantified the oxygen flux on daily to seasonal timescales in Ecklonia Cava forests located on the eastern coast of Jejudo Island using the aquatic eddy covariance method. Additional measurements were conducted within the forest using custom-made multiple oxygen optode sensors to investigate oxygen dynamics associated with kelp metabolism. The oxygen flux exhibited daily and seasonal variability, strongly influenced by light availability, tidal flow velocity, temperature, and biomass. Dependent relationships between oxygen flux and environmental parameters, based on a partial least squares regression model, indicate that Ecklonia cava was stressed by dynamic environmental conditions. While substantial gross primary production was observed across seasons, net autotrophic conditions were observed only in spring. Seasonal differences in ecological function were closely associated with increased respiration and biomass loss caused by elevated temperatures during summer and autumn. Additional measurements within the forest revealed diurnal variations in oxygen flux depending on distance above the seabed, reflecting active photosynthetic and respiratory processes of kelp and benthic communities. Moderately tall (50-60 cm) Ecklonia Cava significantly contributes to carbon sequestration and ecological services.

How to cite: Lee, J. S., Lee, C. H., Baek, Y.-J., Kim, S.-H., Kim, K.-T., Choi, D. M., and Kim, T.: Seasonal Dynamic Response of Oxygen Flux in Ecklonia Cava Forests to Environmental Factors: An Aquatic Eddy Covariance Study, EGU General Assembly 2025, Vienna, Austria, 27 Apr–2 May 2025, EGU25-15168, https://doi.org/10.5194/egusphere-egu25-15168, 2025.

EGU25-15220 | Orals | BG4.1

Influence of past and future climate and land-use change on carbon and nitrogen accumulation in Baltic Sea seagrass meadows 

Martin Dahl, Elinor Andrén, Maria E. Asplund, Mats Björk, Miguel Angel Mateo, Oscar Serrano, Thomas Andrén, Sara Braun, Zilvinas Ežerinskis, Sara C. Forsberg, Andrius Garbaras, Joeri Kaal, Malin E. Kylander, Hans W. Linderholm, Vidya F. Madhavu, Pere Masqué, Justina Šapolaitė, J. Robin Svensson, Olena Vinogradova, and Martin Gullström

Eutrophication and climate change are among the most severe and long-standing environmental problems threatening a large variety of coastal habitats and species in the Baltic Sea and elsewhere. Urgent and adequate management actions are needed to mitigate the combined effects of climate change and anthropogenic activities. The overall purpose of this study is to assess the relative influence of past and future climate and land-use change on organic carbon (OC) and total nitrogen (TN) accumulation in Baltic Sea coastal sediments. Preliminary results from vegetated sediments (two monospecific Zostera marina meadows and one mixed habitat with other rooted vegetation) show higher mean OC accumulation rates (17.5 ± 3.7 g m-2 yr-1)in comparison to adjacent unvegetated sediments (14.2 ± 4.0 g m-2 yr-1) but similar mean TN accumulation (2.1 ± 0.4 and 2.0 ± 0.1 g m-2 yr-1, respectively) during the last century. Based on age-depth models and 14C-dated seagrass remains in the sediment, the colonization of the monospecific Z. marina meadows were dated to approximately 100 and 200 years ago (corresponding to 10 and 15 cm sediment depths). The establishment of the seagrass meadows seems to have led to large changes in sediment biogeochemical properties, including increases in %OC, TN and silt-clay content as well as higher proportion of refractory organic matter (lignin and phenol products) and a decrease in sediment density. A similar change pattern in sediment properties (except for no apparent changes in silt-clay and phenol content) was observed in the mixed Z. marina meadow, while this occurred already 2800 (±200) years ago (seen at about 48 cm sediment depth), which was likely due to the site’s location closer to land and more rapid geomorphological changes following land uplift compared to the monospecific Z. marina meadows. There were increased δ15N values during the last 50 to 100 years, which could be a result of increasing nutrient loads from agricultural activities and land-use change. Further analysis using regional land-use and climate models are being applied to decipher the effect of land-use changes, coastal exploitation, and climate change on OC and TN storage in coastal Baltic Sea vegetation and underlying sediments over centennial to millennial scales. This information can help guide coastal management to mitigate further human-induced impacts on coastal ecosystems.

How to cite: Dahl, M., Andrén, E., Asplund, M. E., Björk, M., Mateo, M. A., Serrano, O., Andrén, T., Braun, S., Ežerinskis, Z., Forsberg, S. C., Garbaras, A., Kaal, J., Kylander, M. E., Linderholm, H. W., Madhavu, V. F., Masqué, P., Šapolaitė, J., Svensson, J. R., Vinogradova, O., and Gullström, M.: Influence of past and future climate and land-use change on carbon and nitrogen accumulation in Baltic Sea seagrass meadows, EGU General Assembly 2025, Vienna, Austria, 27 Apr–2 May 2025, EGU25-15220, https://doi.org/10.5194/egusphere-egu25-15220, 2025.

EGU25-15655 | ECS | Orals | BG4.1

Species-specific methane production in anoxic seagrass sediments is linked to carbon source quality: a microcosm study 

Sara Forsberg, Maria Asplund, Martin Gullström, Hanna Kaliff, Paul Legrand, Diana Deyanova, Martin Dahl, and Mats Björk

Seagrass meadows play a significant role in capturing and storing organic carbon, both from its own primary production and from other adjacent habitats. A high accumulation of organic matter can cause oxygen depletion in the sediment due to aerobic remineralization, leaving space for anaerobic remineralization such as methanogenesis, where methane is produced in the final step. The extent of methane production is likely influenced by the quality of the degrading organic matter. In a long-term microcosm experiment, we studied how organic matter from eight different macrophytes, including seagrass (Zostera marina), reed (Phragmites australis), green macroalgae (Ulva lactuca, Ulva sp.), brown macroalgae (Fucus serratus, Ectocarpales), and red macroalgae (Furcellaria lumbricalis and Polysiphonia spp.), added as a carbon source, affects methane production in anoxic seagrass sediments from the cold-temperate Swedish west coast. Sediment from a unvegetated area with low carbon input was mixed with a small amount of seagrass sediment, functioning as an inoculum of the associated microbial community. The sediment was then placed in glass bottles and each carbon source (dried and homogenized) were added separately to the different bottles and mixed in with the sediment. Seawater was added but leaving enough space for a gas phase. The bottles were kept under anoxic condition with nitrogen flushing and a gas-tight septa. The methane in the gas phase were measured regularly (from twice a week in the beginning to once a month at the end) for nearly two years. The total emission was calculated as the cumulative methane emitted from every measuring point during the experiment. Our preliminary findings revealed that methane emission patterns were highly dependent on the carbon source, with the total cumulative methane emission during the experiment ranging between 0.01 and 47.42 mg, which corresponds to a loss of 0.0009 to 4.5 % of the added organic carbon. The two selected red macroalgae in this study, although of different plants structure (i.e. one filamentous and one more rigid), both generated significantly higher methane emission than all the other carbon sources. Thereby, the origin of carbon source appeared to have a greater influence on methane production than the plant structure. From the selected carbon sources, the treatment with red macroalgae yielded the highest methane levels, while the treatment with green macroalgae yielded the lowest levels. Interestingly, the treatment with organic carbon from Z. marina started to produce methane later than any other treatment and showed relatively low methane emissions (with a cumulative value of 2.70 mg corresponding to 0.26% of the added organic carbon) throughout the study period, highlighting that carbon source composition is crucial for the methane emission levels from seagrass meadow sediments.

How to cite: Forsberg, S., Asplund, M., Gullström, M., Kaliff, H., Legrand, P., Deyanova, D., Dahl, M., and Björk, M.: Species-specific methane production in anoxic seagrass sediments is linked to carbon source quality: a microcosm study, EGU General Assembly 2025, Vienna, Austria, 27 Apr–2 May 2025, EGU25-15655, https://doi.org/10.5194/egusphere-egu25-15655, 2025.

EGU25-15798 | ECS | Orals | BG4.1

Enhancing Blue Carbon Potential: The Role of Northward Mangroves in Replacing Spartina alterniflora Across Stand Age Dynamics 

Tingting Liu, Hualei Yang, Xiuzhen Li, Xuechu Chen, and Zhongzheng Yan

Mangroves, with their remarkable carbon sequestration capacity, are presented with significant opportunities for northward expansion driven by climate change, which may offer a potential restoration strategy for regions in China where Spartina alterniflora has been removed. However, few studies have compared the carbon absorption and accumulation between northward-afforested mangroves of varying stand ages and S. alterniflora. This study investigates carbon exchange dynamics and soil carbon accumulation in Kandelia obovate-dominated wetlands (3, 9, and 20 years old) and S. alterniflora in a subtropical estuary in China, while also collecting data on soil sedimentation rates and surface organic carbon content across the four wetlands. We estimated annual carbon exchange using gross primary production (GPP) models based on light intensity, along with ecosystem respiration (Reco) and methane (CH4eco) models adjusted for temperature, combined with year-round monitoring data. Using a space-for-time substitution approach, we examined the carbon sequestration capacity and accumulation rates across different stand ages of northward mangroves replacing S. alterniflora. Our monitoring findings revealed that although net ecosystem exchange (NEE) increased significantly with stand age, it remained slightly lower than that of S. alterniflora. Both Reco and GPP also increased with stand age, but a higher Reco/GPP ratio could offset CO₂ uptake. It was estimated that the Reco/GPP ratio of S. alterniflora (0.89) exceeded that of mangroves. Therefore, the annual carbon fixation through photosynthesis for the 3 yr, 9 yr, and 20 yr stands were 3.6, 5.8, and 9.9 t C m-² ha-¹, respectively. The mature stands exhibited significantly higher carbon fixation compared to S. alterniflora (-750 g C m-² a-¹), suggesting that although the carbon sequestration capacity of the northward mangroves is lower than that of S. alterniflora in the early stages, the carbon sink potential of the progressively maturing mangroves increases with stand age, ultimately surpassing that of S. alterniflora. Besides, CH4eco emissions in mangroves were negligible, similar to S. alterniflora, and lower than those in natural mangroves, likely due to the absence of aerial roots that mediate CH4eco release. Consequently, the net radiative cooling effect of mangroves increased with age, with the sustained-flux global warming potential metric with 100-year (SGWP100) of 20 yr mangroves being double that of 3 yr mangroves, and it exceeds with 9 yr mangroves and S. alterniflora. This indicates that the warming mitigation potential of mature northward mangroves surpasses that of S. alterniflora. The calculation results show that, although the plant carbon pool of S. alterniflora (5.4 t C ha⁻¹ a⁻¹) is significantly higher than that of the 3 yr (3.2 t C ha-1 a-1), 9 yr (2.4 t C ha-1 a-1), and 20 yr (1.5 t C ha-1 a-1) mangrove stands, it lacks long-term stability. Moreover, the soil carbon accumulation rate in S. alterniflora (1.5 t C ha-1 a-1) was significantly lower than that in the 20 yr mangrove stand (2.6 t C ha-1 a-1). This suggests that replacing S. alterniflora with northward-afforested mangroves is an effective long-term strategy for future coasts to enhance blue carbon sequestration.

How to cite: Liu, T., Yang, H., Li, X., Chen, X., and Yan, Z.: Enhancing Blue Carbon Potential: The Role of Northward Mangroves in Replacing Spartina alterniflora Across Stand Age Dynamics, EGU General Assembly 2025, Vienna, Austria, 27 Apr–2 May 2025, EGU25-15798, https://doi.org/10.5194/egusphere-egu25-15798, 2025.

EGU25-15958 | ECS | Posters on site | BG4.1

The distribution of potential blue carbon habitats in Sweden 

Sara Braun, Martin Dahl, Maria E. Asplund, Karin Ebert, Mats Björk, and Martin Gullström

The distribution of coastal habitats has major implications for biodiversity, population dynamics and various ecosystem services such as protection against erosion, nutrient uptake and blue carbon (BC) storage. Therefore, mapping of habitats in the coastal zone is essential and a prerequisite for understanding their spatiotemporal distribution and configuration. In this study, we compiled existing data based on remote sensing, spatial statistical modelling and ground-truth surveys to map the distribution of established (i.e. saltmarshes and seagrass meadows) and potential BC habitats (including other rooted submerged macrophytes besides seagrass and coastal forested wetlands) along the entire Swedish coastline. The coast was delimited to areas on land with an elevation of 5 meters or less and shallow-water areas down to a depth limit of approximately 6 m. Additionally, as a proxy for the effects of land-based human activities on the mapped BC habitats, a landscape analysis based on the distance to and total area of agricultural and urban areas in Sweden’s coastal drainage basins was carried out. The total area of BC habitats was estimated to be around 1900 km2, corresponding to about 30% of the total delimited Swedish coastal area. Seagrass meadows and shallow-water areas dominated by other rooted submerged macrophytes were the dominating BC habitats, covering approximately 1000 km2 and 500 km2, respectively. Following the natural salinity gradient along the Swedish coastline, seagrass meadows dominated in the marine environment on the Swedish west coast (including the Skagerrak, Kattegat and the Öresund area) and the southern part of the brackish Baltic Proper, while other rooted submerged macrophytes were primarily found at low salinity levels (~5 PSU and lower) in the northern Baltic Proper, Bothnian Sea and Bothnian Bay. The distance- and area-based landscape analysis showed that around 23% of the mapped BC habitats are areas potentially moderately to highly affected by land-based activities. BC habitats inside protected areas were found to be at a significantly lower risk compared to habitats outside protected areas (p < 0.05), but still around 24% (corresponding to an area around 130 km2) of the protected BC habitats are potentially moderately to highly affected by land-based activities. This nationwide mapping of both established and potential BC habitats shows that a large proportion of the long Swedish coastal zone includes BC habitats with great potential for supporting climate change mitigation and adaptation. Furthermore, this study contributes with important baseline information useful for assessing all possible BC habitats along the Swedish coastlines and highlights the importance of coastal management and marine spatial planning for the conservation of these habitats.

How to cite: Braun, S., Dahl, M., Asplund, M. E., Ebert, K., Björk, M., and Gullström, M.: The distribution of potential blue carbon habitats in Sweden, EGU General Assembly 2025, Vienna, Austria, 27 Apr–2 May 2025, EGU25-15958, https://doi.org/10.5194/egusphere-egu25-15958, 2025.

EGU25-16693 | ECS | Posters on site | BG4.1

Litter Quality Drives Decomposition and Prokaryotic Communities in Estuarine Marsh Soils 

Friederike Neiske, Luise Grüterich, Annette Eschenbach, Monica Wilson, Wolfgang R. Streit, Kai Jensen, and Joscha N. Becker

Climate change-induced sea-level rise and saltwater intrusion are expected to significantly influence carbon cycling in estuarine marshes by affecting microbial litter decomposition. However, the extent and mechanisms of these changes remain unclear. In this study, we investigated the impacts of litter quality and environmental conditions on litter decomposition and prokaryotic communities in an estuarine environment. We incubated both native and standardized litter (Tea Bag Index) in soils representative of various marsh types (freshwater, brackish, and salt) and different flooding frequencies (daily, monthly, and yearly) along the Elbe Estuary. The prokaryotic communities colonizing the litter and soil were characterized through 16S rRNA gene amplicon sequencing. Our findings indicate that litter quality plays a crucial role in litter decomposition along estuarine gradients. The decomposition of native litter increased with higher salinity and reduced flooding frequency, primarily influenced by the chemical properties of the litter, particularly lignin content and the lignin:N ratio. Conversely, the decomposition of tea litter decreased as salinity increased, suggesting that rising salinity creates unfavorable conditions for decomposition. The effects of flooding varied depending on litter quality: mass loss of recalcitrant litter (rooibos tea) diminished with more frequent flooding, while mass loss of labile litter (green tea) increased. Prokaryotic communities in both native and tea litter exhibited distinct assemblages and lower diversity compared to the local soil community, indicating selective colonization of the litter, which was especially evident for tea litter. Furthermore, tea mass loss was enhanced by a diverse soil prokaryotic community, whereas the decomposition of native litter seemed to be driven by an adapted soil prokaryotic community. Our results underscore the influence of biotic factors (litter quality and prokaryotic communities) and abiotic factors (salinity and flooding) on litter decomposition in estuarine ecosystems, suggesting that anticipated changes in salinity and hydrodynamics due to climate change could substantially alter decomposition dynamics in these environments.

How to cite: Neiske, F., Grüterich, L., Eschenbach, A., Wilson, M., Streit, W. R., Jensen, K., and Becker, J. N.: Litter Quality Drives Decomposition and Prokaryotic Communities in Estuarine Marsh Soils, EGU General Assembly 2025, Vienna, Austria, 27 Apr–2 May 2025, EGU25-16693, https://doi.org/10.5194/egusphere-egu25-16693, 2025.

EGU25-17831 | ECS | Orals | BG4.1

Microbial driven greenhouse gas flux of the intertidal seagrass Zostera noltei, across a seasonal cycle 

Alice Malcolm-McKay, Natalie Hicks, Corinne Whitby, Graham Underwood, Richard Unsworth, and Thomas Cameron

Seagrass meadows are important blue carbon habitats, due to their high productivity and large sedimentary carbon stocks. However, this can be biased when data from larger species, such as Posidonia oceanica, is extrapolated to global coverage. Carbon budgets of smaller seagrass species, such as Zostera noltei, have been seldom studied, despite these being one of the most common species found on North-West European coasts. In seagrass blue carbon studies, the inclusion of greenhouse gas (GHG) emissions is rare. This study addresses key knowledge gaps by analysing GHG (CO2 and CH4) exchange of the intertidal seagrass Z. noltei, in the southern North Sea, UK, across a full seasonal cycle. GHG exchange of Z. noltei meadows and adjacent non-vegetated mudflats (NVMF) were measured using novel in-situ closed-chambers, and the sedimentary microbial communities (notably, methanotrophs and methanogens) were characterised.


Overall, CO2 fluxes of Z. noltei seagrass were not different to that of NVMFs. Seagrass respiration offsets a large proportion of the plant’s carbon sink capacity, and this was particularly noticeable in spring. When methane emissions were included in the carbon budget, both habitats have net zero carbon emissions. The inclusion of respiration and methane emissions, over multiple seasons, are highly important considerations that are often missed in GHG exchange studies, potentially causing overestimations of seagrass blue carbon, globally. This presentation will also discuss seasonal changes in carbon-cycling microbial communities and how they underpin the measured GHG flux. This pioneering research is of international importance with implications for blue carbon science and natural capital markets.

How to cite: Malcolm-McKay, A., Hicks, N., Whitby, C., Underwood, G., Unsworth, R., and Cameron, T.: Microbial driven greenhouse gas flux of the intertidal seagrass Zostera noltei, across a seasonal cycle, EGU General Assembly 2025, Vienna, Austria, 27 Apr–2 May 2025, EGU25-17831, https://doi.org/10.5194/egusphere-egu25-17831, 2025.

EGU25-18749 | ECS | Posters on site | BG4.1

A case study on the relative organic carbon content response to intertidal sediment disturbances  

Lauren Carl, William Austin, and Julie Hope

While research in climate mitigation solutions have led to great interest in Blue Carbon Ecosystems (BCEs), such as mangroves, seagrass meadows, and tidal marshes, there has been a growing understanding that other marine environments could be critical to our understanding of BCEs. These “emerging” BCEs, include tidal flats and marine sediments. While receiving less attention than “traditional” BCEs, unvegetated sediments store significant amounts of carbon, globally accounting for an estimated 3,117,000 Mt of organic carbon (OC) within just the top 1 meter of sediment. The potential contributions of emerging BCEs to carbon sequestration are undoubtedly important, but physical disturbances, such as bottom trawling, dredging and climate-change-related weather events such as storms, risk transforming these carbon sinks into carbon sources. Understanding how physical disturbances affect sediment carbon storage and release is paramount to holistic, practical, and successful protection and management of coastal carbon resources.  

This study investigated the relative carbon loss from intertidal sediments with simulated physical disturbance to different depths over 9 weeks. Disturbance was applied to 20 intertidal sediment plots in the Tay estuary, Scotland weekly. The depth of disturbances varied across plots, including 2cm (surface), 10cm, 20cm depths, alongside controls (no disturbance) with 4 replicate plots of each. In addition, complete homogenization of sediment to 30cm depth was performed in the lab to simulate a single large mixing event. In-tact cores were extracted from all plots on weeks 2, 5 and 9 to understand cumulative effects. Each core was capped with a custom-built lid attached to an EMG-5 portable gas analyser to measure CO2 flux from the sediment. Each core was then artificially eroded under flow in the laboratory, with the labile and refractory fractions of the particulate carbon quantified from the eroded material. Cores were sliced to generate sediment profiles of different carbon fractions, and to quantify OC:N ratios. 

The single large mixing event simulated in week 9 (sediment homogenised to 30cm) resulted in a significantly higher loss of both labile and refractory carbon during erosion, while the loss of labile and refractory carbon was reduced in plots disturbed to 20cm depth compared to controls. CO2 flux data was variable across the weeks and treatments. While less pronounced, the changes in the carbon and nitrogen composition of sediment bed profiles, together with the resuspension of carbon under flow suggest that repeated disturbances may alter the subsequent loss of labile and refractory carbon to the overlying water column after disturbance events. More importantly, the disturbance from a single large mixing event can lead to significant subsequent losses of both labile and refractory carbon from the bed. Further investigations into the flux of dissolved and particulate carbon due to bed disturbance are required to understand the impact of physical disturbance on mudflat carbon dynamics. 

How to cite: Carl, L., Austin, W., and Hope, J.: A case study on the relative organic carbon content response to intertidal sediment disturbances , EGU General Assembly 2025, Vienna, Austria, 27 Apr–2 May 2025, EGU25-18749, https://doi.org/10.5194/egusphere-egu25-18749, 2025.

EGU25-19355 | ECS | Posters on site | BG4.1

Macrophyte Meadows in Europe’s Largest Coastal Lagoon: Nutrient and Carbon Sequestration  

Irene Alorda-Montiel, Ariane Arias-Ortiz, Valentí Rodellas, Júlia Rodríguez-Puig, Aaron Alorda-Kleinglass, Marc Diego-Feliu, Pere Masqué, Javier Gilabert, and Jordi Garcia-Orellana

Macrophyte-dominated benthic meadows play a key role in promoting sedimentation, carbon storage, and nutrient sequestration, especially in enclosed systems like coastal lagoons. However, these shallow ecosystems are highly susceptible to climate change and anthropogenic pressures, including nutrient inputs from agricultural runoff and urban discharges. Seagrasses and seaweed help regulate nutrient availability, reducing the risk of eutrophication by limiting nutrients accessible to opportunistic organisms.

In the Mar Menor coastal lagoon (southeastern Spain), recurrent eutrophication events since 2016 have caused severe ecological disruptions, including mass fish mortality. These events are driven by persistent nutrient inputs resulting from intensified agricultural practices. While the allochthonous seaweed Caulerpa prolifera and the native seagrass Cymodocea nodosa have demonstrated significant nutrient-sinking capabilities, the buffering potential of C. nodosa has diminished due to population declines during these episodes.

This study analyzed twelve sediment cores for total organic carbon (TOC %), δ¹³C, total nitrogen (TN %), and δ¹⁵N, with age estimations based on ²¹⁰Pb dating. Carbon sequestration rates, nutrient stocks, and nutrient origins were determined. Results revealed spatial variability in nutrient distribution, with higher organic carbon enrichment from terrestrial sources concentrated in the lagoon's central areas connected to agricultural lands. Nutrient-depth profiles indicated increased nutrient input beginning in the early 20th century.

The seasonal dynamics and potential loss of macrophyte meadows could exacerbate resuspension events, releasing nutrient-enriched sediments and triggering eutrophication, leading to ecological and socio-economic consequences. Understanding the role of macrophyte meadows in nutrient cycling within sediment-focused, enclosed systems is crucial for effectively managing and conserving these impacted habitats.


How to cite: Alorda-Montiel, I., Arias-Ortiz, A., Rodellas, V., Rodríguez-Puig, J., Alorda-Kleinglass, A., Diego-Feliu, M., Masqué, P., Gilabert, J., and Garcia-Orellana, J.: Macrophyte Meadows in Europe’s Largest Coastal Lagoon: Nutrient and Carbon Sequestration , EGU General Assembly 2025, Vienna, Austria, 27 Apr–2 May 2025, EGU25-19355, https://doi.org/10.5194/egusphere-egu25-19355, 2025.

EGU25-20359 | Posters on site | BG4.1

Carbon dynamics in three tidally restricted salt marshes in Maine, USA 

Beverly Johnson, Claire Enterline, Jamie Hollander, Kate Dickson, Anna Sarrazin, Kristen Puryear, and Slade Moore

The state of Maine has the second largest area of salt marsh habitat in the Northeast US, thus representing a significant coastal carbon sink in the region.  Many of these marshes experience restricted tidal inundation which can result in decreased efficiency of carbon sequestration and storage.  Little is known about the carbon dynamics associated with tidal restrictions in Maine salt marshes.  This study examines carbon dynamics upstream and downstream of tidal restrictions in 3 salt marshes in Maine, USA:  the Spurwink Marsh, in Cape Elizabeth; the Drakes Island Marsh, in Wells; and, the Jones Creek Marsh, in Scarborough.  In summer of 2023, carbon dynamics were assessed by measuring monthly greenhouse gas fluxes and pore water salinity, and by analyzing the soil core carbon density and longterm carbon sequestration rates.  Stream channel water levels and vegetation were also analyzed and provided some insight on the impact of the tidal restriction on the carbon dynamics of each marsh.  Each site behaved differently, due, in part, to the degree to which the tidal restriction appears to impact the hydrology of the site. The Spurwink Marsh has excellent hydrologic connectivity upstream and downstream of the restriction with similar soil carbon densities and sequestration in both areas of the marsh.  The highest CH4 fluxes are measured along the margins of the marsh where soil salinities are low and Typha species are growing.  The Drakes Island Marsh tidal restriction creates an impoundment which prevents adequate drainage during low tide and likely alters the microbial community in the soils.  Upstream of the restriction at Drakes Island, soil salinities are lower and CH4 emissions and carbon sequestration rates are higher.  The Jones Creek Marsh is the most degraded site we studied, with the highest rates of peat compaction and largest areas of pool habitat upstream of the restriction.  Soil carbon density values are lower upstream of the restriction likely due to increased decomposition in waterlogged soils.  CH4 fluxes were not significantly different or high on either side of the restriction.  These data provide important baseline information for predicting the carbon benefits that can be accrued with salt marsh restoration via tidal restoration.  

How to cite: Johnson, B., Enterline, C., Hollander, J., Dickson, K., Sarrazin, A., Puryear, K., and Moore, S.: Carbon dynamics in three tidally restricted salt marshes in Maine, USA, EGU General Assembly 2025, Vienna, Austria, 27 Apr–2 May 2025, EGU25-20359, https://doi.org/10.5194/egusphere-egu25-20359, 2025.

EGU25-20403 | ECS | Posters on site | BG4.1

Restoration and Sedimentation in Managed Realignment Saltmarshes: A Geochemical Perspective 

Rizky E. Muliawan, Amani Becker, Samuel A. Monk, Phillip E. Warwick, David G. Reading, Andrew Cundy, Laurent Amoudry, and Claire Evans

Saltmarshes provide critical ecosystem services, including carbon sequestration, biodiversity, and coastal protection, underscoring the need to understand how quickly and effectively the benefits recover following managed realignment. Realigned saltmarshes often differ from natural systems, even decades after restoration, and are highly influenced by hydrological and sedimentary changes. Accurately measuring carbon sequestration rates in these areas remains a challenge, given variable sediment accumulation, limited methodological approaches, and delays in carbon sink establishment post-restoration.

This study investigates the sediment structure and geochemical characteristics of both managed realigned and natural saltmarshes in the Ribble Estuary, UK. Sediment cores were collected along transects in three areas: Hesketh Out Marsh West (HOMW), realigned after 27 years of agricultural use; Hesketh Out Marsh East (HOME), realigned after 37 years under agriculture; and the adjacent natural Bank Marsh. Non-destructive ITRAX core scanning was employed to analyse sediment structure and geochemical evolution, supplemented by radiometric dating to determine sedimentation rates.

The findings reveal higher sediment densities at the realigned sites (HOMW and HOME), indicative of extended drainage and compaction. In contrast, natural marsh areas displayed enhanced lamination, reflecting regular tidal inundation and storm events. Following embankment breaches greater sediment dynamics were observed at the realigned sites, with elevated Ca/K ratios at HOME indicating the influx of marine sediments, and historical creek modifications contributing to erosion at HOMW. Notably, trace metal analysis revealed a significant reduction in heavy metal contaminants (Zn, Cu, Pb) at the realigned sites, reflecting a decline in historical industrial pollutants The marked decrease in these metals in realigned sites provided a means to estimate sedimentation rates, which ranged from 1.13–1.80 cm yr⁻¹ in HOMW and 0.87–1.50 cm yr⁻¹ in HOME. In contrast, radiometric dating highlighted spatial heterogeneity in sediment deposition across the estuary. Accretion rates at the natural Bank Marsh varied by elevation, from 0.21 cm yr⁻¹ in the upper marsh to 1.02 cm yr⁻¹ in the lower marsh—rates similar to those in the managed realignment sites, particularly HOME. Surprisingly, the more recently realigned HOME did not show higher accretion rates compared to HOMW or Bank Marsh, emphasizing the need for a deeper understanding of saltmarsh development under managed realignment. Overall, our findings demonstrate the value of non-destructive core scanning for assessing sedimentation rates where radiometric dating may be limited. They also highlight the complex, dynamic processes influencing sedimentation and carbon accumulation in saltmarsh ecosystems, emphasizing the need for continued, site-specific investigations into managed realignment outcomes.

How to cite: Muliawan, R. E., Becker, A., Monk, S. A., Warwick, P. E., Reading, D. G., Cundy, A., Amoudry, L., and Evans, C.: Restoration and Sedimentation in Managed Realignment Saltmarshes: A Geochemical Perspective, EGU General Assembly 2025, Vienna, Austria, 27 Apr–2 May 2025, EGU25-20403, https://doi.org/10.5194/egusphere-egu25-20403, 2025.

In marine sediments with high content of reactive iron oxides, nearly all hydrogen sulfide, which is produced by microbial sulfate reduction, is reoxidized to sulfide oxidation intermediates (sulfur, thiosulfate, and sulfite) and, eventually, to the terminal oxidation product, sulfate. Such sulfur cycling is called “cryptic” and is found in a wide variety of marine and limnic systems. Cryptic sulfur cycling may be fast but leaves scarce geochemical evidence. One of the marine systems, which is characterized by a cryptic sulfur cycle in the sediments is the Gulf of Aqaba, Red Sea. The gulf is strongly affected by high fluxes of aeolian dust deposition from the adjacent deserts, especially from Sahara, which is rich in reactive Fe(III) and Mn(IV) phases. Multiple lines of evidence, including presence of trace amounts of hydrogen sulfide, sulfide oxidation intermediates and pyrite in the sediments, isotopic composition of sulfate as well as direct measurements of microbial sulfate reduction rates prove the presence of cryptic sulfur cycling in the sediments of the Gulf of Aqaba. Quantification of the rates of microbial sulfate and iron reduction as well as of abiotic oxidation of hydrogen sulfide in the sediments allows us to provide for the first time quantitative constraints on the cryptic sulfur cycling in marine sediments.

How to cite: Kamyshny, A. and Grijalva Rodriguez, T. I.: Quantitative constraints on the cryptic sulfur cycling in marine sediments affected by high fluxes of reactive iron from terrigenous sources, EGU General Assembly 2025, Vienna, Austria, 27 Apr–2 May 2025, EGU25-8, https://doi.org/10.5194/egusphere-egu25-8, 2025.

Oxygen production in the top millimeters of coastal euphotic sediments occurs through the photosynthetic activity of autotrophic microphytobenthos (MPB). Oxygen reduction primarily occurs via organic carbon consumption by benthic organisms or aerobic bacteria, as well as the biologically mediated reoxidation of reduced inorganic species. These oxygen-related processes are significantly influenced by physical fluctuations from radiation, temperature, and tidal changes, which affect MPB eco-physiology, including short- and long-term photoacclimation and circadian-driven vertical migration. Consequently, oxygen dynamics vary considerably over timescales from seconds to seasons, making accurate quantification challenging.

To improve forecasting under future scenarios, we first developed a one-dimensional thermodynamics model (TM) to study heat exchange mechanisms at the sediment-water interface and predict high-resolution tidal flat temperatures. To capture oxygen dynamics on small spatial and temporal scales, we designed and conducted irradiance and oxygen micro-profiling experiments under controlled physical conditions in a mesocosm. Oxygen profiles and gross primary production (GPP) rates of MPB near steady state were measured with spatial steps of 100 μm and temporal steps of 0.2 s. The vertical distribution of MPB biomass was modeled as a truncated normal distribution function to capture MPB migration in response to light changes. Based on these profiles, we created an oxygen reaction-transport model (ORTM) that explicitly incorporates MPB photosynthesis, vertical migration, and oxygen consumption processes, including mineralization, reoxidation, and photorespiration. The TM output was then used to drive the ORTM, simulating oxygen dynamics under fluctuating conditions.

Our results demonstrate that MPB production increases with temperature up to an optimal point (~1.5 mol O₂/m²/day around 35 °C) but drops sharply to zero when the temperature exceeds a threshold (~40 °C). Oxygen consumption processes show greater heat tolerance, persisting at temperatures above 45 °C, with reoxidation comprising the majority of total consumption at higher temperatures. Dominant oxygen consumption pathways include mineralization and reoxidation, though increasing light intensity significantly elevates photorespiration rates. Under emersion conditions, gross production rates decrease to around 40% compared to immersion, and the much higher diffusion coefficient at the surface leads to lower oxygen concentrations in the sediment.

In summary, we established a comprehensive 1D dynamic reaction-transport model, implemented in Fortran for enhanced simulation speed and featuring an interactive Shiny interface in R for model development. This study presents the first integrated sediment oxygen dynamics model connecting numerical modeling with high-precision measurements. Our findings offer new insights into the microbiological mechanisms impacting oxygen dynamics, and this model serves as a quantitative predictive tool for oxygen-related process rates and overall budgets in sediments. This foundation will support future in-depth studies on the impacts of climate change on sediment biogeochemistry.

How to cite: Liu, Q., Polerecky, L., and Soetaert, K.: Modeling Intertidal Sediment Oxygen Dynamics by Integrated Thermodynamic-Biogeochemical Models and High Resolution Measurements, EGU General Assembly 2025, Vienna, Austria, 27 Apr–2 May 2025, EGU25-69, https://doi.org/10.5194/egusphere-egu25-69, 2025.

Among the most important environments of the coastal zone are the estuaries where fresh water from land mixes with the sea water creating one of the most biologically productive regions on the earth. A wide range of human activities affect the estuaries and endanger their biodiversity due to unchecked development in many coastal areas across the world. A large fluctuation is observed in the pH in different parts of the estuaries. In view of the ocean acidification, it is important to delineate the pH tolerance range of the organisms thriving in the estuaries. In this study, we assess the effect of pH on the distribution and diversity of benthic foraminifera in a tropical estuary. The abundance and shell composition of both the living and recently dead benthic foraminifera was studied in the surface sediments collected from coarse sand rich pockets as well as the fine-grained organic matter rich sediments on the margins of the Terekhol estuary in the Goa state of India. The salinity, pH of the ambient water was noted and the sediment characteristics were analysed. The salinity ranged from 0.04 to 22.43 from the upstream station to the river mouth whereas pH varied from 6.99 to 7.84. The highest salinity and pH were recorded at the river mouth stations. Total Suspended Material (TSM) decreased from river mouth to upstream, with the highest TSM at the river mouth station (9.5 mg/l). The highest sand (%) was in the river mouth region and a higher percentage of sand was invariably observed in the middle part of the estuary. The sand and silt dominated the sediments throughout the estuary and the clay content was <24 % on all the stations. As compared to the middle channel stations, the sediments collected from the adjacent banks had higher organic carbon (Corg) content throughout the estuary. The highest Corg (4.52%) was observed at the upstream station. Except two stations in the river mouth, all of the stations in the Terekhol estuary showed higher Corg/N ratio (>10) indicating terrestrial input. A relatively higher CaCO3 (%) was observed in the river mouth region as compared to the upstream region. Benthic foraminiferal abundance was much higher in fine grained and Corg rich sediments on the banks as compared to sandy sediments devoid of the organic matter in the middle of the estuary. A distinct transition from the abundance of calcareous benthic foraminifera to agglutinated benthic foraminifera was observed at nearly neutral (7.14) pH. Ammonia dominated the calcareous benthic foraminifera at low pH, suggesting its wide pH tolerance range. This lower pH tolerance range is much lower than previously reported. Only, agglutinated benthic foraminifera were found at station with pH lower than 7.14. We report a much lower pH tolerance range of calcareous benthic foraminifera.

How to cite: Deepak, R. P. and Saraswat, R.: Transition from calcareous to agglutinated shelled benthic foraminifera at near neutral pH in a tropical estuary, EGU General Assembly 2025, Vienna, Austria, 27 Apr–2 May 2025, EGU25-297, https://doi.org/10.5194/egusphere-egu25-297, 2025.

EGU25-653 | ECS | Orals | BG4.2

Coupled Changes in Marine Primary Production and Phytoplankton Phenology in a Warming Ocean 

Yinuo Xu, Tingbao Xu, Hannelie Botha, and Bruce Doran

Marine ecosystems are experiencing uneven changes in response to the synergistic effects of climate change and anthropogenic pressures. Phytoplankton primary productivity, driven by photosynthesis, fuels marine ecosystems, providing the source material for trophic transfer and carbon export to the ocean interior. This study provides a large-scale assessment of net primary production (NPP) and its temporal variability across different latitudinal bands (40° N–45°S) in the Asia-Pacific region over 25 years (1998 –2022), with emphasis on bloom phenology. NPP is estimated through multi-model inter-fusion using satellite-based observations, which offers practical means for broad regional assessments given the limitations of direct measurement techniques. Our analysis reveals a decline in NPP of −3.2% per decade (equivalent to −15.31 mg C m−2 day−1 per decade, P < 0.01). NPP decreases with increasing latitude in both hemispheres, reaching minimum values at 20°–25° latitude that are 1.75-fold lower than equatorial values. The observed NPP trends are coupled with changes in phytoplankton phenology. Using three phenological threshold methods, phytoplankton bloom initiation has advanced by approximately −1.1 ± 10.4 days per decade, while termination occurred about −3.3 ± 10.5 days earlier per decade, resulting in shortened bloom durations of around −2.8 ±15.3 days per decade. The seasonal cycle demonstrated increased reproducibility over these temporal shifts, reflecting more stable annual variations. These changes in productivity and phenology patterns reflect the influence of climate change and anthropogenic pressures across the Asia-Pacific waters, with implications for ecosystem energy flow, carbon sequestration processes, and species composition. 

How to cite: Xu, Y., Xu, T., Botha, H., and Doran, B.: Coupled Changes in Marine Primary Production and Phytoplankton Phenology in a Warming Ocean, EGU General Assembly 2025, Vienna, Austria, 27 Apr–2 May 2025, EGU25-653, https://doi.org/10.5194/egusphere-egu25-653, 2025.

EGU25-1096 | ECS | Orals | BG4.2

High prokaryotic diversity in the oxygen minimum zone of the Bay of Bengal: Implications for nutrient cycling 

Sipai Nazirahmed, Praveen Rahi, Himanshu Saxena, Arvind Singh, and Rakeshkumar Panchal

The Bay of Bengal hosts the fourth most intense oxygen minimum zone (OMZ) globally, despite low primary productivity. Yet its microbial community and biogeochemical roles remain underexplored. We examined prokaryotic diversity in the euphotic zone and OMZ, revealing significantly higher alpha diversity in the OMZ than surface waters. Community structures varied between coastal and open ocean regions and within the OMZ across oxygen gradients. Proteobacteria dominated bacterial communities, with Cyanobacteria and Actinobacteria prevalent in the euphotic zone. In contrast, Marinimicrobiota, Marine Group B, Crenarchaeota, and others dominated the OMZ. Key genera included Prochlorococcus and SAR11 in the euphotic zone and SUP05 and SAR324 in the OMZ. Functional predictions indicated the prominence of denitrifiers, anammox bacteria, and sulfur oxidizers in the OMZ. This study underscores the critical role of microbial diversity in nitrogen and sulfur cycling in the Bay of Bengal.

How to cite: Nazirahmed, S., Rahi, P., Saxena, H., Singh, A., and Panchal, R.: High prokaryotic diversity in the oxygen minimum zone of the Bay of Bengal: Implications for nutrient cycling, EGU General Assembly 2025, Vienna, Austria, 27 Apr–2 May 2025, EGU25-1096, https://doi.org/10.5194/egusphere-egu25-1096, 2025.

EGU25-2752 | ECS | Orals | BG4.2

Eutrophication events cause an increase in greenhouse gas release from intertidal flats 

Nora Kainz, Carla Neumeier, Andreas Kappler, and Prachi Joshi

Intertidal flats, as part of coastal wetlands, play a crucial role in the global carbon cycle as they bury substantial quantities of carbon belowground (126 Tg C y-1). Identifying the extent and rate of carbon turnover and thus greenhouse gas release from these ecosystems is essential to better understand their role in the global carbon cycle. Located at the interface of marine and terrestrial environments, intertidal flats may act as mixing zones between riverine nutrient input and incoming tides that carry nutrients and particles.

Eutrophication, i.e., the stimulation of phytoplankton primary production, is particularly concerning in coastal waters. Phytoplankton exude carbon; during its decomposition, further nutrients are released. The effect of such an input on intertidal flat carbon cycles is unknown. Here, we investigated greenhouse gas fluxes from an intertidal flat during a simulated algal bloom. We chose the Wadden Sea coast, northern Germany as a representative field site.

Preliminary characterization data suggested that CO2 fluxes at our field site are not limited by the presence of electron acceptors, e.g., sulfate, belowground but by the concentration and composition of organic carbon. Hence, we hypothesize that with the addition of organic carbon inputs during an algal bloom, higher CO2 fluxes are emitted. We performed tidally influenced microcosm experiments in which the sediment was inundated twice a day during high tide with algae enhanced artificial seawater. In addition, we also added organic carbon only (lactate/acetate) to determine if the co-occurring nutrients during the algal bloom, e.g., nitrogen play a role.

We observed that the algae treatment emitted twice as much CO2 compared to the control over the course of the experiment. In the recovery phase (after the algae bloom) the CO2 fluxes were still elevated compared to the control. The carbon only treatment showed CO2 fluxes 1.6 times higher than the control. Thus, not only carbon but also other nutrients that are part of the algal bloom control the CO2 fluxes from this ecosystem; for example, ammonium as a nitrogen source may enhance the release of CO2. Aqueous and solid Fe data show an increase in Fe(II) in the algae and carbon only treatment, indicating Fe(III) reduction. Both treatments also show increased acid volatile sulfide concentrations, suggesting sulfate reduction. The results show that CO2 release from the Wadden Sea increases significantly during an algal bloom and remains elevated during recovery. Therefore, further control on nutrient inputs to the Wadden Sea is necessary to prevent eutrophication.

How to cite: Kainz, N., Neumeier, C., Kappler, A., and Joshi, P.: Eutrophication events cause an increase in greenhouse gas release from intertidal flats, EGU General Assembly 2025, Vienna, Austria, 27 Apr–2 May 2025, EGU25-2752, https://doi.org/10.5194/egusphere-egu25-2752, 2025.

EGU25-3437 | ECS | Posters on site | BG4.2

Preliminary results: Distributions of POC fluxes in the North Equatorial Currents of the Pacific Ocean  

Junhyeong Seo, Chihyun Oh, and Intae Kim

Thorium-234 (234Th; half-life = 24.1 days) has been used as an excellent tracer for estimating particle fluxes, including particulate organic carbon (POC) and trace elements, in the upper ocean. In this study, the distributions of total and particulate phases of 234Th (234Thtand 234Thp), POC, and other oceanographic parameters (temperature, salinity, and chlorophyll-a) were investigated in the North Equatorial Currents (NEC) during September 21-27, 2024. The study region, located within ; 13.5˚N and 134-157˚E, is interconnected with the Kuroshio Current and Mindanao Current. Meausrments were conducted in the upper 500 m of the water column. The calcualted Th fluxes at a depth of 100 m ranged from 1730 to 2850 dpm m–2 d–1, comparable to fluxes observed in other open-ocean regions. A subsurface chlorophyll maximum (SCM) layer was observed at depths of 125–150 m, indicating oligotrophic conditions in the study area. Notably, the activity of 234Thp was elevated within the SCM layer compared to other depths. These finding highlight the importance of understanding biogeochemical cycles in the NEC, which plays a crucial role in regional and global carbon and nutrient cycling.

How to cite: Seo, J., Oh, C., and Kim, I.: Preliminary results: Distributions of POC fluxes in the North Equatorial Currents of the Pacific Ocean , EGU General Assembly 2025, Vienna, Austria, 27 Apr–2 May 2025, EGU25-3437, https://doi.org/10.5194/egusphere-egu25-3437, 2025.

EGU25-5041 | ECS | Posters on site | BG4.2

Shelf water streamers: a potential pathway for ocean carbon sequestration in the Atlantic and Pacific Eastern Boundary Upwelling Systems 

Federica Benassi, Nadia Pinardi, Lorenzo Mentaschi, Ivan Federico, Silvia Bianconcini, and Samantha Siedlecki

Ocean carbon uptake is essential to the global carbon cycle, as the ocean absorbs about one third of the atmospheric carbon released by human activities. Central to this process is the biological carbon pump, fueled by phytoplankton primary production. This pump transports organic carbon from surface waters to the ocean's deeper layers, where it can remain sequestered for hundreds to thousands of years. Coastal shelf regions, with their shallow, nutrient-rich waters, play a particularly active role in this cycle, supporting higher productivity levels compared to the deeper open ocean. However, in these shallow waters, organic carbon is more likely to be remineralized before it reaches the deep ocean. In these coastal zones, submesoscale filaments—or streamers—form through the instability of coastal currents, creating long, narrow structures that concentrate phytoplankton and chlorophyll. These streamers enhance long-distance transport of organic material, carrying chlorophyll-rich waters from the productive shelf regions into the open ocean, potentially increasing carbon flux to deeper ocean layers. A systematic estimation of how much carbon is transported by these structures is missing from the literature, due to the challenges in detecting and measuring streamers, which exhibit strong time variability over scales of several days. To address this gap, our work proposes a K-means based framework to detect streamers from chlorophyll and sea surface temperature satellite data in the Pacific and Atlantic Eastern Boundary Upwelling regions, and estimate their associated lateral carbon transport from satellite ocean color data. By estimating this cross-shelf export, we aim to deduce the potential sequestration rate, assuming that offshore high-chlorophyll streamers might increase the sinking fluxes of organic carbon to the deep ocean. This method relies solely on satellite products and can be operationalized for constant monitoring of the process in the years to come.

How to cite: Benassi, F., Pinardi, N., Mentaschi, L., Federico, I., Bianconcini, S., and Siedlecki, S.: Shelf water streamers: a potential pathway for ocean carbon sequestration in the Atlantic and Pacific Eastern Boundary Upwelling Systems, EGU General Assembly 2025, Vienna, Austria, 27 Apr–2 May 2025, EGU25-5041, https://doi.org/10.5194/egusphere-egu25-5041, 2025.

EGU25-6800 | ECS | Posters on site | BG4.2

A New 1,10-Phenanthroline Method for Oxalate-extractable Iron Measurement 

Yan Zhang and Yi Liu

Iron separation from different solid phases is essential for evaluating the environmental function of iron in sediments. Oxalate is a commonly used extractant that effectively extract iron(hydro)oxides in sediments by complexation. However, when using spectrophotometry method, excess oxalate will interfere the complexation of iron with 1,10-phenanthroline resulting in the failure of iron measurement. In this study, we discovered an effective method for spectrophotometric analysis of iron samples with oxalate by adjusting the pH to 7-9, which changes the structure of the Fe-oxalate complexes and ensured the complexation of iron with 1,10-phenanthroline. Further exploration indicates that photolysis and heating also decompose Fe-oxalate complexes, but the performance is not as good as pH adjustment. The standard solution exhibits a strong linear relationship between absorbance (Abs) and concentration (Con): Abs = 0.1934 × Con + 0.1360, with a R2 of 0.9997, accuracy of 97.1%, and precision of 98.6%, which demonstrate the reliability of this method. Overall, the pretreatment is simple, and the influence of the organic solvent (oxalate) is diminished after pH adjustment. This method is expected to contribute to community by providing a new reliable, effective, less pre-treatment, costive, and sensitive testing approach and hopefully assist in the investigation on environmental function of iron minerals.

How to cite: Zhang, Y. and Liu, Y.: A New 1,10-Phenanthroline Method for Oxalate-extractable Iron Measurement, EGU General Assembly 2025, Vienna, Austria, 27 Apr–2 May 2025, EGU25-6800, https://doi.org/10.5194/egusphere-egu25-6800, 2025.

EGU25-9033 | Orals | BG4.2

Monthly Year-Round Characteristics and Ocean Export of Riverine Organic Matter: Relationship with Microplastics 

Chan-Yeong Je, Seung-Kyu Kim, Ji-Su Kim, Nan-Seon Song, and Tae-Ha Kim

Rivers play a crucial role in transporting carbon from terrestrial watersheds to oceans. Understanding the quantity and characteristics of riverine organic matter discharged into the ocean is essential for predicting changes in marine and global organic carbon cycles. Riverine organic matter, comprising both allochthonous and autochthonous fractions, is influenced by shifts in watershed sources driven by climate change, as well as socio-economic transformations that affect its production and characteristics. Plastics, a significant source of allochthonous organic carbon, could contribute substantially to rivers, and microplastics (MPs) generated from plastic degradation may alter carbon cycling within river systems through interactions with other organic materials. Despite their importance, MP exports from rivers to oceans remain poorly quantified and rarely measured in terms of carbon mass, with even less understanding of their interactions with other forms of riverine organic matter. To address this gap, we have investigated the five major rivers in South Korea, accounting for 90% of the freshwater discharge. Here, we present the preliminary results for three major rivers, representing Korean fluvial system connected to the Yellow Sea. Both particulate and dissolved organic matters were characterized in quantitative and qualitative terms by monthly sampling at each river-mouth station, including particulate organic carbon (POC), chlorophyll-a, transparent exopolymer particles (TEP), Coomassie stainable particles (CSP), and MPs for particulate forms and dissolved organic carbon (DOC) and dissolved organic matter (CDOM and FDOM) of dissolved forms. Considering the spatiotemporal variability of organic matters and MPs, river samples were collected three times a day at 2-3 hour intervals and in each sampling by compositing the samples taken from horizontally three cross-sectioned sites and vertically 3–5 water column layers per site. This study aims to quantify the monthly loads of total organic carbon (POC and DOC) entering the ocean from these rivers, assess the relationships between various forms of organic matter, and determine the relative contribution of MP-derived organic carbon to total organic carbon. Our results are expected to provide valuable insights into the ocean load and their inter-relationships of various organic matter forms originated from fluvial system, and their potential impact on the marine carbon cycle.

Acknowledgement: This work was supported by the National Research Foundation of Korea (NRF) grant funded by the Korea government (MSIT) (No. RS-2024-00356940).

How to cite: Je, C.-Y., Kim, S.-K., Kim, J.-S., Song, N.-S., and Kim, T.-H.: Monthly Year-Round Characteristics and Ocean Export of Riverine Organic Matter: Relationship with Microplastics, EGU General Assembly 2025, Vienna, Austria, 27 Apr–2 May 2025, EGU25-9033, https://doi.org/10.5194/egusphere-egu25-9033, 2025.

EGU25-9692 | ECS | Posters on site | BG4.2

LA-ICP-MS analyses of Caribbean coral Diploria strigosa reveals deviations in geochemical trends following explosive eruption of La Soufrière in April 2021. 

James Vincent, Sebastian Flöter, Alexandra Tsay, and Tom Shelkdrake

Volcanic tephra produced from explosive volcanism modifies chemical cycles in local and regional environments. In tropical volcanic island settings, pristine tephra produced from explosive volcanism is deposited directly into the surrounding seawater and impacts the physicochemical conditions of the marine ecosystem. Additionly, intense weathering of terrestrial deposits prolongs the input of tephra into the coastal environments for extended periods. Coral reefs growing around the coasts of volcanic islands react to changes in surrounding seawater conditions which is the basis of many tropical palaeoclimate studies. We use a common massive Caribbean coral Diploria strigosa to investigate volcanic distrubances in the physicochemical conditions of the marine ecoystem following the April 2021 explosive eruption of La Sourfrière (St. Vincent). A coral core was sampled from the north-west coast of Barbados in July 2022 and from St. Vincent in March 2024. These locations were chosen to compare how tephra quantities and grainsizes differences influence the physicochemical conditions and consequenlty the geochemical imprint of the eruption in coral skeletons. Element/Ca ratios were measured along the theca of each sample using LA-ICP-MS analyses. Our preliminary results from the proximal sample show clear disturbances in the seasonality of common geochemical proxies used for sea surface temperature calibrations (i.e. Li/Mg, Sr/Ca, U/Ca). Additionally, we show that Pb/Ca, Y/Ca, La/Ca and Nd/Ca are elevated following the eruption and exhibit seasonality which was absent prior to the eruption. The seasonal signal decreased progressively each year following the eruption and it interpreted to represent seasonal runoff during the rainy season.

How to cite: Vincent, J., Flöter, S., Tsay, A., and Shelkdrake, T.: LA-ICP-MS analyses of Caribbean coral Diploria strigosa reveals deviations in geochemical trends following explosive eruption of La Soufrière in April 2021., EGU General Assembly 2025, Vienna, Austria, 27 Apr–2 May 2025, EGU25-9692, https://doi.org/10.5194/egusphere-egu25-9692, 2025.

EGU25-10234 | ECS | Orals | BG4.2

Using BROM (Bottom RedOx Model) model to quantify the contribution of sediments in the eutrophication of a shallow Mediterranean coastal lagoon  

Louison Huchet, Anfisa Berezina, Evgeniy Yakushev, Isabelle Techer, and Sylvain Rigaud

Due to their semi-closed hydrological nature, lagoonal ecosystems are the location of important biogeochemical transformations. Over the past century, these systems have accumulated organic matter (OM), pollutants, and nutrients, that was predominantly stored in sediments. Today, sediments are thus largely involved in elements cycles in shallow coastal areas through their role in oxygen consumption, OM and nutrient recycling and chemical contaminant release, and are further involved in the ecological degradation. Thus, sediment reactions and associated benthic fluxes of oxygen, nutrients and chemicals elements are essential processes that act as a critical driver of the biogeochemical coastal cycles and important to better understand the environmental and chemical degradation. This recycling may also limit the depuration role that sediment may play on carbon, nutrients and other pollutants storage by burial. Quantifying sedimentary contributions to ecosystem degradation and epuration is challenging. Indeed, mass balance of oxygen, nutrient, and pollutant exchanges at the sediment-water interface (SWI) has strong temporal variability in relation to temperature, quality of the OM and availability of oxidants that impact the efficiency of OM mineralization and burial and nutrients recycling over time. To address these gaps, the Bottom RedOx Model (BROM), a 1D diagenetic coupled benthic-pelagic modelling tool with O-N-P-Si-C-Fe-Mn-S biogeochemical module is particularly relevant as it is able to simulate organic matter production and mineralization, as well as major elemental cycles and trace elements fluxes at the sediment-water interface. It was applied in the Bolmon lagoon, a shallow Mediterranean lagoon impacted by eutrophication, deoxygenation and chemical pollution. In this study, the model was firstly calibrated using vertical profiles of diagenetic variables (O2, nutrients, trace elements, etc.) collected during seasonal field campaigns. It was then employed to better understand the diagenetic response to change in the physicochemistry of the water column and to reconstruct continuous fluxes over time and finally to estimate the net mass budget at the sediment-water interface. Results revealed substantial temporal variability in fluxes, predominantly driven by water column oxygen concentration and benthic macrofaunal activity that evolved seasonally in response to hydroclimatic and ecological conditions. The net mass balance highlighted that the sediment acted as a significant oxygen sink and nutrient source. Resulting OM degradation and burial was then discussed with respect to the prevalent physicochemical conditions in the lagoon. Comparison with riverine inputs underscored the sediment compartment as a critical factor influencing the ecological state of the Bolmon lagoon, necessitating its integration into future management strategies.

How to cite: Huchet, L., Berezina, A., Yakushev, E., Techer, I., and Rigaud, S.: Using BROM (Bottom RedOx Model) model to quantify the contribution of sediments in the eutrophication of a shallow Mediterranean coastal lagoon , EGU General Assembly 2025, Vienna, Austria, 27 Apr–2 May 2025, EGU25-10234, https://doi.org/10.5194/egusphere-egu25-10234, 2025.

EGU25-10267 | ECS | Orals | BG4.2

Clearing the Water on Ecosystem-Level Effects of Seawater Turbidity on the North West European Shelf. 

Rhiannon Morton, Jerry Blackford, Ute Schuster, Barend van Maanen, and Shaun Rigby

Seawater turbidity influences primary production, nutrient exchanges and the carbon cycle in our oceans. As turbidity is likely to increase throughout the twenty-first century, due to factors including the increased occurrence of storm events and anthropogenic pressures, the potential impacts on ecosystems must be investigated. Greater understanding of the relationship between light availability and ecosystem health will aid in forecasting the future biogeochemical state of shelf seas under a changing climate.

Seven sites across the North West European Shelf (NWES) are investigated to generate a picture of the impacts of turbidity in different environmental settings. For example, study sites with differing salinity concentrations, stratification or proximity to land represent the varied conditions around the British Isles. Hindcast data is crucial for depicting seasonal and interannual patterns in seawater turbidity on the shelf since 1990. We show that changes to chlorophyll increase turbidity on the NWES. Furthermore, the total optical absorption coefficient of water indicates turbidity across the shelf. In-situ measurement and earth observation data will also be used to calibrate model parameters and verify model outputs.

The hydrodynamic-ecosystem model ERSEM is used to represent the 1D water column. As light availability within the water column is determined by organic and inorganic particles, the specific shortwave backscattering properties (m2/mg C) of particulate organic matter (POM) are altered to represent greater turbidity. The effects on biogeochemistry, carbon, phytoplankton and zooplankton are studied to assess the response of the ecosystem to higher turbidity in European shelf seas. Results suggest that increasing the backscattering of POM has different impacts depending on environmental conditions. Increasing backscattering in the North Sea reduced microphytoplankton. Conversely, increased backscattering in the North Atlantic increased microphytoplankton.

Here we present the results of the 1D ERSEM turbidity analysis and supporting hindcast observational conclusions. Findings from the 1D ERSEM analysis and hindcast data will be utilized to inform the 3D ERSEM modelling of suspended particulate matter across the NWES. Future work will incorporate these findings into generating two environmental scenarios (such as increased temperature along with increased storminess and higher riverine discharge) to forecast the potential future of seawater turbidity on the NWES.

How to cite: Morton, R., Blackford, J., Schuster, U., van Maanen, B., and Rigby, S.: Clearing the Water on Ecosystem-Level Effects of Seawater Turbidity on the North West European Shelf., EGU General Assembly 2025, Vienna, Austria, 27 Apr–2 May 2025, EGU25-10267, https://doi.org/10.5194/egusphere-egu25-10267, 2025.

Nitrogen fixation by cyanobacteria in the Baltic Sea plays a crucial role in the context of eutrophication, as it promotes biomass production in the absence of dissolved inorganic nitrogen (DIN). Its contribution to the N budget is comparable to the combined sum of riverine and airborne DIN input, ranging from 300 kt-N/yr to 800 kt-N/yr. The vast range is due to internal fluctuations and significant uncertainties in various techniques used to determine N2 fixation and in extrapolate local studies to entire basins. To overcome some of the limitations we introduce a new approach based on large-scale records of the surface water N2 depletion during summer.

For our studies we use a membrane contactor (Liquicel) to establish gas phase equilibrium for atmospheric gases dissolved in seawater. The mole fractions of N2, Ar and O2 in the gas phase are continuously determined by mass spectrometry, yielding the concentration of these gases by multiplication with the total pressure and the respective solubility constants.

Thorough laboratory tests demonstrated that our Gas Equilibrium–Membrane-Inlet Mass Spectrometer (GE-MIMS) has sufficient accuracy and precision to detect and quantify nitrogen fixation. In June/July 2023, the GE-MIMS was deployed (i) on a voluntary observing ship (VOS, “Finnmaid”) for surface water gas analyses and (ii) for vertical water column studies on RV Elisabeth Mann Borgese along the VOS route between Helsinki and Travemünde. The VOS campaign enabled repeated transects along the same route and providing high spatial and temporal resolution time series of N2 concentration changes due to nitrogen fixation. First results clearly indicate regions and episodes where N2 fixation was active. Concurrent records of pCO2 obtained from a different measurement system, along with O2 concentrations, will be used for an independent characterization of cyanobacterial biomass production and thus of the associated N2 fixation. Additionally, Ar measurements are used to account for the air-sea gas exchange.

Our objectives are to identify factors initiating and limiting cyanobacteria growth, with the final goal of determining Baltic Proper's N2 fixation capacity.

How to cite: Iwe, S., Schmale, O., and Schneider, B.: Development of a Gas-Equilibrium Membrane-Inlet Mass spectrometer (GE-MIMS) for continuous N2, Ar and O2 measurements to quantify nitrogen fixation in the Baltic Sea, EGU General Assembly 2025, Vienna, Austria, 27 Apr–2 May 2025, EGU25-10437, https://doi.org/10.5194/egusphere-egu25-10437, 2025.

EGU25-10541 | ECS | Orals | BG4.2 | Highlight

Variable organic matter stoichiometry enhances the biological drawdown of CO2 in the Northwest European shelf seas 

Kubilay Timur Demir, Moritz Mathis, Jan Kossack, Feifei Liu, Ute Daewel, Christoph Stegert, Helmuth Thomas, and Corinna Schrum

Variations in the elemental ratios of carbon, nitrogen, and phosphorus in marine organic matter (OM) and their influence on carbon cycling remain uncertain in both open and coastal oceans. While observations consistently show carbon enrichment and phosphorus depletion relative to elemental Redfield ratios, many biogeochemical models assume fixed Redfield stoichiometry. As a result, they often underestimate biological carbon fixation, limiting their ability to accurately represent carbon fluxes. Here, we provide a comprehensive assessment of the effects of variable OM stoichiometry on carbon cycling in the Northwest European shelf seas using the coupled 3D physical-biogeochemical modeling system SCHISM-ECOSMO-CO2. For this, we integrate two pathways for variable OM stoichiometry into the ecosystem model component ECOSMO: a release of carbon-enriched dissolved OM under nutrient limitation and the preferential remineralization of organic nitrogen and phosphorus. We evaluate both their individual and combined effects compared to a reference configuration with fixed Redfield stoichiometry. The variable stoichiometry configurations result in a 10-33% increase in annual net CO₂-uptake. This additional uptake is driven by enhanced OM cycling, with greater surface net autotrophy and subsurface net heterotrophy. As a result, the seasonal biological drawdown of DIC increases, enhancing the biological contribution to pCO₂ changes and shifting the maximum CO₂-uptake from winter to spring and summer. These results underscore the crucial role of variable stoichiometry in accurately representing the shelf carbon pump mechanism in the Northwest European shelf seas, as it has a significant impact on the efficiency of carbon sequestration. They also highlight the need to incorporate variable OM stoichiometry into regional and global biogeochemical models for a more accurate representation of the marine carbon cycle.

How to cite: Demir, K. T., Mathis, M., Kossack, J., Liu, F., Daewel, U., Stegert, C., Thomas, H., and Schrum, C.: Variable organic matter stoichiometry enhances the biological drawdown of CO2 in the Northwest European shelf seas, EGU General Assembly 2025, Vienna, Austria, 27 Apr–2 May 2025, EGU25-10541, https://doi.org/10.5194/egusphere-egu25-10541, 2025.

EGU25-10695 | Posters on site | BG4.2

Microplastic Transport Trends in a Tide-Dominated Coastal Lagoon: Insights from Arcachon Bay (SW France) 

Arnaud Le Pedevic, Isabel Jalón-Rojas, Charlotte Lefebvre, Jérôme Cachot, and Bénédicte Morin

Understanding the transport of microplastics in coastal and estuarine areas is critical for assessing their global distribution and ecological impact. These regions act as dynamic interfaces where microplastics can accumulate, transform, and be transported to the open ocean or coastal sediments. In this study, we investigate the seasonal transport dynamics of microplastics in Arcachon Bay (SW France), a tide-dominated coastal lagoon characterized by 70% intertidal flats, using a numerical Lagrangian model combined with in-situ observations. Modeled trajectories were validated against Lagrangian drifter data under various conditions, showing remarkable agreement, including beaching and refloating processes at sandbars during ebb and flood tides, respectively. In-situ observations of microplastic concentrations and properties, collected in April 2019 from the sea surface, water column, and intertidal bottom sediments at single times across five stations, were used to set up the numerical model and to contextualize and discuss the simulation results. Trajectories of the three prevalent particle categories (low-density fragments, PET fibers, and rubber fragments) were simulated from major sources (rivers, sewage, port, and fishing areas) across two contrasting seasons, with trends compared to in-situ observations. The analysis is expected to reveal distinct seasonal transport pathways influenced by particle properties and hydrodynamic conditions, providing insights into dispersal patterns, retention zones, and potential hotspots for microplastic accumulation. The modeling results aim also elucidate transport patterns suggested by localized observations, such as the presence of hotspots of low-density particles at the sea surface within the channels, the greater abundance of fibers and rubbery particles outside the bay, the role of intertidal channels in flushing or retaining different particle types, and the combined influence of source location (e.g., sewage) and hydrodynamics on these distributions.

How to cite: Le Pedevic, A., Jalón-Rojas, I., Lefebvre, C., Cachot, J., and Morin, B.: Microplastic Transport Trends in a Tide-Dominated Coastal Lagoon: Insights from Arcachon Bay (SW France), EGU General Assembly 2025, Vienna, Austria, 27 Apr–2 May 2025, EGU25-10695, https://doi.org/10.5194/egusphere-egu25-10695, 2025.

EGU25-11176 | ECS | Orals | BG4.2

The coastal nitrogen filter in highly dynamic permeable sediments of the southern Baltic Sea 

Kaja Gentsch, Soeren Ahmerkamp, Peter Holtermann, Ugo Marzocchi, Oliver Thiele, and Maren Voss

Coastal zones are often described as effective filters for land-derived nutrient loads, referred to as the coastal filter, which applies in particular to bays and estuaries with higher water residence times. Open coastal zones are high energy environments in which the sediments are influenced by waves and currents, and residence time is short. Most open coastal zones are covered by permeable sandy sediments. Contrary to previous assumptions and despite their low organic matter content, permeable sandy sediments contribute to benthic nitrogen cycling and oxygen dynamics. However, there is a lack of understanding of how seasonality and physical processes govern denitrification and dissimilatory nitrate reduction to ammonium (DNRA) in permeable sediments in shallow coastal zones. For this study, monthly field and laboratory experiments were conducted in an annual cycle, combining physical and biogeochemical measurements. Rates of denitrification and DNRA were measured with an adapted revised isotope pairing technique to simulate advective pore water flow during the incubations. Denitrification followed a seasonal cycle with higher N2-production rates observed in autumn and winter compared to summer. The data suggest that the oxygen penetration depth, activity of benthic primary producers and oxygen respiration are more dependent on prevailing ambient conditions, e.g. wave action, rather than on the season. Our results highlight the largely unknown nitrogen removal potential of permeable sediments. They also demonstrate the importance of including currents, waves, winds and past storms in the analysis of the biogeochemistry in permeable sediments in order to obtain a realistic picture of the prevailing processes.

How to cite: Gentsch, K., Ahmerkamp, S., Holtermann, P., Marzocchi, U., Thiele, O., and Voss, M.: The coastal nitrogen filter in highly dynamic permeable sediments of the southern Baltic Sea, EGU General Assembly 2025, Vienna, Austria, 27 Apr–2 May 2025, EGU25-11176, https://doi.org/10.5194/egusphere-egu25-11176, 2025.

EGU25-11252 | ECS | Orals | BG4.2

Mercury concentrations along the Amazon estuary and plume: Spatial trends and geochemical processes 

Luiza Silva do Nascimento, Inácio Abreu Pestana, Michael Seidel, Jomar Marques da Silva Junior, Braulio Cherene Vaz de Oliveira, Philipe Ribeiro Gomes, Andrea Koschinsky, Thorsten Dittmar, and Carlos Eduardo de Rezende

Mercury (Hg) contamination in the Amazon is a recurring topic in scientific literature, with high concentrations reported in various environmental compartments, including water in dissolved and particulate fractions, soils, sediments, and fish. Despite the substantial body of research on Hg contamination in the Amazon, studies focusing on the coastal and continental shelf zones remain scarce, and, to our knowledge, no study has specifically evaluated Hg contamination in the waters of these areas. The Amazon coastal region and its continental shelf exhibit complex hydrodynamics influenced by the Amazon River discharge, ocean currents, and extensive mangrove systems, all of which can significantly affect Hg dynamics and transport. This study aims to investigate Hg concentrations in water and sediments in the coastal and oceanic region of the Amazon, identifying spatial trends and the main geochemical processes influencing its transport. The research covered the Amazon River estuary (Amazon Transect), the northern Amazon River plume (North Plume), the Pará River estuary (Pará Transect), an extensive mangrove area (Mangrove Belt), and a region influenced by the North Brazil Current (NBC). Sampling occurred during the high-discharge period of the Amazon River. Results showed that total Hg concentrations in water varied across regions, with the highest levels recorded in the Pará Transect and the lowest in the North Plume. These concentrations were positively correlated with total organic carbon and suspended particulate matter, which were identified as important geochemical supports for Hg transport on the continental shelf. Similarly, Hg concentrations in sediments reflected the patterns observed in unfiltered water. The Mangrove Belt and North Plume were significant zones of Hg deposition, while estuarine areas, such as the Amazon and Pará transects, acted as primary sources of Hg to the marine environment. Isotopic and elemental analyses of organic matter, combined with the observed negative relationship between Hg concentrations and the salinity gradient, suggest that the primary sources of Hg on the continental shelf are Amazonian soils and the resuspension of sediments from the shelf itself. These findings highlight that deforestation in the Amazon, a widely debated issue, extends its impact beyond terrestrial ecosystems, influencing water quality in the tropical Atlantic Ocean and posing risks to coastal and marine biota.

How to cite: Silva do Nascimento, L., Abreu Pestana, I., Seidel, M., Marques da Silva Junior, J., Cherene Vaz de Oliveira, B., Ribeiro Gomes, P., Koschinsky, A., Dittmar, T., and de Rezende, C. E.: Mercury concentrations along the Amazon estuary and plume: Spatial trends and geochemical processes, EGU General Assembly 2025, Vienna, Austria, 27 Apr–2 May 2025, EGU25-11252, https://doi.org/10.5194/egusphere-egu25-11252, 2025.

Technologies for carbon dioxide (CO2) removal and long-term storage should be urgently developed to mitigate climate change. Among various carbon sequestration strategies, CO2 storage in seawater has emerged as a promising approach with geological timescale storage potential.  The pH-equilibrated ocean alkalinization, an improvement over Accelerated Weathering of Limestone (AWL), facilitates the conversion of CO2, seawater, and carbonate minerals into bicarbonate-enriched solutions. This process is based on effectively engineering and accelerating the geological weathering process and, supported by extensive experimental data, has been further refined into a scalable solution by Limenet®.The analyzed process is driven by a reaction that produces a pH-balanced seawater-bicarbonate solution, offering dual benefits: CO2 storage and mitigation of seawater acidification, potentially benefiting marine biota. However, real-world implementation requires effective discharge of bicarbonate-enriched solutions into dynamic marine environments. Existing studies have focused on controlled conditions, leaving a significant knowledge gap regarding free jet discharge in turbulent, variable marine settings. Critical design factors include discharge arrays, temperature, seasonal variability, and the impacts of turbulent mixing and deep-water discharges.This study addresses these gaps using Computational Fluid Dynamics (CFD) to simulate the behavior of bicarbonate discharges in marine environments. Large Eddy Simulations (LES) are employed with OpenFOAMv12 to resolve turbulent scales and model the reaction-convection-diffusion processes. Adaptive Mesh Refinement is used to optimize computational costs, and the seawater equation of state, including temperature and density gradients, follows TEOS-10 standards. The simulations track passive conservative scalars, such as Dissolved Inorganic Carbon (DIC) and Total Alkalinity (TA), using a fictitious equilibrium chemistry approach.The study also explores buoyancy-variable jets influenced by injection temperature and marine conditions such as seasonal temperature gradients and salinity variations. A mesh convergence analysis ensures numerical accuracy, and statistical stationarity is achieved to characterize the naturally unsteady jet dynamics. The findings will elucidate critical hotspots for secondary CO2 production, assess the influence of marine state characteristics, and establish boundary conditions for larger-scale regional models in a two-way nested framework. By characterizing the spatio-temporal evolution of bicarbonate discharge jets, this work aims to provide a robust framework for future parametric analyses and large-scale industrial implementation. The results will advance understanding of the interplay between chemical, physical, and environmental factors in marine carbon sequestration, contributing to the development of effective, scalable solutions for mitigating atmospheric CO2 levels.

How to cite: Bindoni, D. and Abbà, A.: LES of bicarbonate injection for CO2 storage in seawater based on pH-equilibrated ocean alkalinization, EGU General Assembly 2025, Vienna, Austria, 27 Apr–2 May 2025, EGU25-11833, https://doi.org/10.5194/egusphere-egu25-11833, 2025.

EGU25-12048 | Posters on site | BG4.2

Unraveling the physical and biological controls of the global coastal CO2 sink 

Pierre Regnier, Alizee Roobaert, Goulven Laruelle, Enhui Liao, and Laure Resplandy

In spite of considerable efforts using approaches combining observations and modeling, the mechanisms governing the exchange of carbon dioxide (CO2) at the air-sea interface and the spatio-temporal variability of this exchange in coastal oceans are not yet fully understood. The present study uses simulations performed over the last decades with the global ocean biogeochemical model MOM6-COBALT to quantify the relative contributions of thermal changes, oceanic transport, freshwater fluxes, and biological processes to the spatial and seasonal variability of CO2 sources and sinks in the coastal ocean worldwide. These results allow identifying five distinct coastal domains each characterized by different behaviors: coastal regions dominated by biological carbon drawdown, regions controlled by vertical transport, influenced by land-derived inputs, regions shaped by intracoastal alongshore currents, and regions with weak CO2 fluxes. Using the spatial distribution of these behaviors, we propose a new, process-based delineation of the global coastal ocean that reflects the dominance of specific controlling processes for the spatial and seasonal dynamics of the CO2 exchange at the air-sea interface.

Our results also reveal that the spatiotemporal variability of CO2 fluxes in coastal regions is primarily driven by exchanges with the open ocean and local intra-coastal processes, while the influence of continental inputs remains confined to specific hotspot areas. In addition, although thermal changes are often associated with seasonal CO2 variability, their dominance stems from compensating effects between larger non-thermal processes, particularly biological drawdown and vertical transport.

The classification of the global coastal ocean presented in our study provides an updated process-based vision of the complex interplay between physical and biogeochemical drivers of CO2 exchange at the air-water interface. These findings provide a more comprehensive framework for understanding coastal CO2 dynamics and their role in the global carbon cycle, offering valuable insights for predicting the responses of coastal regions to both natural and anthropogenic environmental changes.

How to cite: Regnier, P., Roobaert, A., Laruelle, G., Liao, E., and Resplandy, L.: Unraveling the physical and biological controls of the global coastal CO2 sink, EGU General Assembly 2025, Vienna, Austria, 27 Apr–2 May 2025, EGU25-12048, https://doi.org/10.5194/egusphere-egu25-12048, 2025.

EGU25-12112 | ECS | Orals | BG4.2

How Intensified Oceanic Transports Shift Organic Carbon Pathways in the Benguela Upwelling System 

Amr Talaat Salama, Tomas Lovato, Momme Butenschön, and Marco Zavatarelli

The Benguela Upwelling System (BUS) is one of the most productive marine ecosystems globally, providing vital ecological services and economic values. Under global warming conditions, upwelling intensification is expected to enhance the vertical ascent of nutrient-rich deep waters, fueling primary production. However, this intensification may also increase offshore lateral advection, potentially counteracting coastal ecosystem productivity. Enhanced offshore transport could reduce phytoplankton availability in coastal zones, affecting zooplankton and higher trophic levels, and weaken microbial activity by altering organic carbon sinking to deeper layers. This study quantifies the extent of Total Organic Carbon (TOC) lateral transport under varying upwelling conditions and examines associated changes in organic carbon pathways within the marine food web.

We employ a coupled physical-biogeochemical modeling system based on the Nucleus for European Modeling of the Ocean (NEMO v4.2.2) and the Biogeochemical Flux Model (BFM v5.3). A regional model configuration, encompassing the larger BUS domain at a 1/16° horizontal resolution, was nested into a global ocean model at 1/4° resolution using a two-way nesting approach. The BFM explicitly resolves pelagic-benthic coupling through sediment remineralization and adopts an intermediate-complexity structure to describe lower trophic-level ecosystem dynamics. The coupled model simulation spans 1980–2020, driven by ERA5 atmospheric forcing and GLOFASv2.1 runoff data.

Our results reveal that offshore lateral TOC transport in the upper 200 m of the Benguela region has steadily increased over the past four decades, with rates surpassing 2 mg C·m⁻²·s⁻¹ per decade. This trend reflects intensified coastal upwelling dynamics, which was more significant in the northern subregion during the austral spring season. Additionally, the displacement of organic matter export in the epipelagic zone towards the offshore open ocean highlights shifts in organic carbon pathways. These changes have also impacted the standing stocks of living and non-living groups within the lower trophic ecosystem, influencing carbon sinking dynamics across different pelagic zones.

How to cite: Talaat Salama, A., Lovato, T., Butenschön, M., and Zavatarelli, M.: How Intensified Oceanic Transports Shift Organic Carbon Pathways in the Benguela Upwelling System, EGU General Assembly 2025, Vienna, Austria, 27 Apr–2 May 2025, EGU25-12112, https://doi.org/10.5194/egusphere-egu25-12112, 2025.

Land-ocean boundary system across South Asia harbors diverse coastal biotopes with rich belowground carbon storage and functional microbial intricacies. Microbial metabolism, the fundamental basis of C geochemistry are crucial in maintaining stable organic carbon storage. Indian Sundarbans, a UNESCO World heritage site and RAMSAR site with freshwater influence, facing an increasing rate of anthropogenic perturbations from eastern to western part. The current study includes a vertical depth profiling of nitrate-N across sedimentary scales i.e. Sundarbans Biological Observatory Time Series and Dhanchi Reserve Forest, to assess the possible impact on carbon storage. Concentration of nitrate-N is higher in Western part and increasing total nitrogen concentration (2.37-3.08 mg/g) across depth, corroborates organic carbon storage. Metal species analysis further suggest the mounting anthropogenic stressors in Western part of Indian Sundarbans as compared to Dhanchi. Based on microbial phospholipid fatty acid patterns, 11-octadecanoic acid and heptadecanoic acid in top layer- a typical gram-negative bacterial signature and presence of narL, narQ in cultured strain, validates the rapid turnover of nitrate through microbial nitrification as implied by δ15N values (3.16- 4.18 per mil). These results highlighted the role of nitrate-N towards contribution to organic carbon pool through shaping microbial community.

How to cite: Roy, A. and Bhadury, P.: Role of nitrogen mobilization on sedimentary carbon storage of Indian Sundarbans- an integrated biogeo-omics approach, EGU General Assembly 2025, Vienna, Austria, 27 Apr–2 May 2025, EGU25-14707, https://doi.org/10.5194/egusphere-egu25-14707, 2025.

Coastal intertidal wetlands are widespread along the French Atlantic coast. As blue carbon ecosystems, they can capture and sequester carbon in a sustainable manner. Local carbon density, net CO2 sequestration, CH4 emission, alkalinity production and its transfer to the ocean are regulated by a variety of factors, including salinity, nutrient loads, tides and seasonality. This study focuses on carbon sequestration as alkalinity in the intertidal zone of the Arcachon lagoon. Carbon dioxide capture through alkalinity production represents durable (>1,000 years) CO2 removal. Specifically, we studied the hydrology and chemical composition of waters draining from salt marshes at low tide by sampling these waters along a tidal creek, which is mainly fed by seepage of pore water from the salt marsh sediments. We also measured discharge rates. These measurements were taken in different seasons and at different tidal amplitudes. Our results show that brackish waters are systematically enriched in alkalinity and depleted in sulfate compared to the mixture between local seawater and freshwater endmembers. This suggests that sulfate reduction in sediments and sulfide precipitation in sediments are important processes in alkalinity generation. Measured fluxes show that for a drained salt marsh area of 30 ha, about 2,000 moles of C are sequestered as alkalinity (560 kgC/ha/yr), and transferred to the open Arcachon lagoon per tide. This indicates that salt marshes are efficient at sequestering carbon, not only as "blue carbon" but also as alkalinity. Therefore, tidal pumping is an important and generally overlooked process in this sequestration.

How to cite: Kanfer, P.: Expanding Blue Carbon horizons: Alkalinity as a key carbon sequestration pathway in Arcachon salt marshes, EGU General Assembly 2025, Vienna, Austria, 27 Apr–2 May 2025, EGU25-15217, https://doi.org/10.5194/egusphere-egu25-15217, 2025.

EGU25-15582 | Posters on site | BG4.2

Traceability as a tool for identification of microplastic pollution and healthy food in the Goro lagoon  

Elisa Pignoni, Chiara Fini, Giacomo Bettini, Cristina Botezatu, Andrea Sfriso, Corinne Corbau, Carlo Giannelli, Cesare Stefanelli, and Massimo Coltorti

Coastal lagoons are ecologically and socio-economically important because they provide valuable services. In Italy, the lagoon of Goro (Ferrara) is characterised by numerous shellfish farms, where the most cultivated species are clams. However, these environments are subject to various pressures, both natural, such as variations in temperature, nutrients and salinity, and artificial, such as the pollution caused by microplastics. Contamination of the sediments and thus of the animals reared on the sandy seabed is possible. As microplastics are an emerging contaminant and there is no limit to the amount of microplastics found in livestock, it is important to track the movement of livestock from seed to sale. Software is being developed to digitise all the steps along the supply chain, allowing consumers to know the origin of the produce, whose quality is judged by the amount of microplastics found in the sediments and in the animals. The result will be an assessment not only of the quality of the product, but also of the level of pollution in the lagoon where the clams have been farmed. 

How to cite: Pignoni, E., Fini, C., Bettini, G., Botezatu, C., Sfriso, A., Corbau, C., Giannelli, C., Stefanelli, C., and Coltorti, M.: Traceability as a tool for identification of microplastic pollution and healthy food in the Goro lagoon , EGU General Assembly 2025, Vienna, Austria, 27 Apr–2 May 2025, EGU25-15582, https://doi.org/10.5194/egusphere-egu25-15582, 2025.

EGU25-15890 | ECS | Posters on site | BG4.2

Assessing Sediment Carbon Stocks and Microbial Turnover in Shallow Coastal Areas of the Baltic Sea 

Nishant Nishant, Greg Cowie, and Tom Jilbert

Coastal sediments are known for their role in long-term carbon sequestration. Bathymetric depressions in coastal settings accumulate fine grained organic-rich material, removing carbon from biogeochemical cycles in the water column. However, the importance of shallow near-shore settings as carbon sinks is yet to be explored. Sediments in such settings may contain large amounts of carbon from various marine and terrestrial sources, that may be either buried in-situ or transported to deeper areas. Transport and deposition of organic matter in the littoral zones of the Baltic Sea are highly complex. In this study, hand core sediments and porewaters were analysed to quantify the spatial distribution of dissolved and particulate carbon over a strong gradient of salinity and wave exposure in shallow locations (3–4 m water depth). We compared four groups of locations in the coastal zone: sheltered estuary, sheltered archipelago, semi-sheltered archipelago, exposed shoreline, in each case determined sediment carbon stock and microbial turnover as a fraction of the stock. Results were also compared against data for deeper known sites of sediment accumulation in the Baltic Sea. In the shallow near-shore settings, highest carbon stocks (~4000g C/m2 in the uppermost 25 cm) were observed in sediments in the low wave energy systems (sheltered estuary and sheltered archipelago). Grain size analysis confirms that these areas are characterized by relatively fine material (d50 is <63μm). In contrast, exposed shoreline areas were generally sandy and had carbon stocks one to two orders of magnitude lower than in the sheltered locations. Using porewater profiles to estimate diffusive fluxes of dissolved inorganic carbon, methane, and dissolved organic carbon, we observed variable rates of carbon turnover between the sampling locations, expressed as a fraction of the stock remineralised in a one-year period. Our findings highlight the importance of sheltered near-shore sediments in the carbon budget and dynamics of this coastal system and underscore the need to capture small-scale spatial heterogeneities when quantifying the fate of organic carbon in coastal settings. 

Keywords: Carbon sequestration, Coastal sediments, Sediment dynamics, Baltic Sea

How to cite: Nishant, N., Cowie, G., and Jilbert, T.: Assessing Sediment Carbon Stocks and Microbial Turnover in Shallow Coastal Areas of the Baltic Sea, EGU General Assembly 2025, Vienna, Austria, 27 Apr–2 May 2025, EGU25-15890, https://doi.org/10.5194/egusphere-egu25-15890, 2025.

EGU25-16411 | ECS | Orals | BG4.2

Quantifying the fish contribution to on-shelf carbon sink: a case study of the Irish Sea 

Paula Silvar, Emma L. Cavan, Angela Martin, Jacob Bentley, Simeon L. Hill, and David Reid

The marine biological carbon pump plays a crucial role in the sequestration of atmospheric carbon and, therefore, is paramount to global climate regulation. Most existing research on biological carbon sinks has focused on understanding the role of oceanic (off-shelf) species and processes where the carbon can quickly be removed from contact with the atmosphere.  We know little about how species living on continental shelves contribute to and influence carbon sequestration due to complex biological and physical transport process dynamics. This knowledge gap is becoming an issue as decision-makers seek to consider the impacts of anthropogenic pressures (e.g., fishing) on the flow and storage of carbon across shelf ecosystems. Most commercial fishing takes place in shelf seas. Fishing could impact carbon sinks and sequestration by altering population biomasses, ecosystem dynamics, and trophic interactions. Here, we explore the potential contribution of a selected fish population in the Irish Sea to carbon sinks and the impacts of fishing on that. The Irish Sea ecosystem, situated between Ireland and the UK, is a shelf ecosystem encompassing important commercial species populations, including herring, the species of interest in this study. An Ecopath with Ecosim (EwE) model of the Irish Sea has been developed to reconstruct the region's food web. We combine the Irish Sea EwE ecosystem model outputs of biomass with faecal egestion and attenuation rates under alternate fishing scenarios to provide a novel quantitative assessment of the annual flux of carbon that sinks to the continental shelf seafloor to then, in part, becomes buried in the sediment. Under the baseline fishing scenario, the Irish Sea Atlantic herring faecal pellet flux contribution was 84% higher than the carcass flux deposited on the seafloor. This carbon flux substantially increased for the non-fishing scenario with bigger changes in carcass carbon flux. Pelagic fish contribute significantly to the carbon flux, particularly with faecal pellets. The overall carbon deposition from the fish community changed little between scenarios with and without fishing on Atlantic herring due to food-web balancing. Our results provide an early insight into the relationship between commercial species, fishing, and biological carbon sink for shelf ecosystems.

How to cite: Silvar, P., Cavan, E. L., Martin, A., Bentley, J., Hill, S. L., and Reid, D.: Quantifying the fish contribution to on-shelf carbon sink: a case study of the Irish Sea, EGU General Assembly 2025, Vienna, Austria, 27 Apr–2 May 2025, EGU25-16411, https://doi.org/10.5194/egusphere-egu25-16411, 2025.

EGU25-16690 | Posters on site | BG4.2

The Contrasting Role of Marine- and Land-terminating Glaciers on Biogeochemical Cycles in Kongsfjorden, Svalbard 

Helmuth Thomas, Claudia Elena Schmidt, Daniel Pröfrock, Grit Steinhöfel, Torben Stichel, Chantal Mears, and Laura Wehrmann

The Arctic Ocean and its coastal areas are especially vulnerable to climate change. Its ecosystem is rapidly changing in response to temperature increase, loss of sea ice, and freshwater input. However, the scientific community currently lacks sufficient information on the mechanisms and drivers behind the biogeochemical cycling of these additional inputs and the consequences that may arise for the Arctic environment.

This case study of Kongsfjorden, western coastal Svalbard, provides insights on how freshwater runoff from marine- and land-terminating glaciers influences the biogeochemical cycles and distribution patterns of carbon, nutrients and trace elements in an Arctic fjord system. We collected samples from the water column at stations along the fjord axis and proglacial river catchments and analyzed concentrations of dissolved trace elements (dAl, dV, dFe, dMn, dCo, dNi, dCu, dZn, dCd, and dPb), dissolved nutrients (nitrate, nitrite, silicate, phosphate), as well as alkalinity and dissolved inorganic carbon. Statistical tools were applied to identify and quantify biogeochemical processes within the fjord that govern the distribution of dissolved constituents. We found the biogeochemical cycles of Kongsfjorden to be influenced by the different chemical composition of proglacial and subglacial discharge but also by physically driven effects triggered by the glacier systems.

Our results suggest that the glacier type affects nutrient availability and therefore primary production. The subglacial discharge at the base of the marine-terminating glacier creates a highly turbulent zone in the inner part of the fjord, which transports nutrients from deep water to the photic zone. We found lower nutrient availability in areas of land-terminating glaciers due to less turbulent mixing and a more stratified water column. Consequently, this may lead to lower primary production compared to areas directly affected by marine-terminating glaciers.

Glacial discharge of both marine-terminating glaciers and riverine discharge of land-terminating glaciers are important sources for dissolved trace elements (dAl, dMn, dCo, dNi, dCu and dPb) that are involved in biological and scavenging processes within marine systems. The different weathering regimes of marine- and land-terminating glaciers result in different chemical signatures in proglacial and subglacial discharge. Our data shows that intensive carbonate weathering in proglacial catchments supplies fjord waters with additional dissolved carbonates and therefore attenuates reduced buffering capacities by glacial runoff.

We identified benthic fluxes across the sediment-water interface to supply fjord waters with silicate, dFe, dCu and dZn. We hypothesize these benthic fluxes are higher close to land-terminating glaciers, since more reactive particulate trace element species are generated by proglacial and riverine processes. This might drive benthic cycling and could lead to increased remobilization from the sediment.

This published study provides valuable insight into biogeochemical processes and carbon cycling within a climate sensitive high-latitude fjord region, which may help predict Arctic ecosystem change. As a result of the progressive glacier retreat, we predict Arctic fjords to become less productive ecosystems in the future. Ultimately this has the potential to alter the circulation of water masses and consequently change the redistribution of nutrients and essential trace elements in the water column. (https://doi.org/10.1029/2023GB008087)

How to cite: Thomas, H., Schmidt, C. E., Pröfrock, D., Steinhöfel, G., Stichel, T., Mears, C., and Wehrmann, L.: The Contrasting Role of Marine- and Land-terminating Glaciers on Biogeochemical Cycles in Kongsfjorden, Svalbard, EGU General Assembly 2025, Vienna, Austria, 27 Apr–2 May 2025, EGU25-16690, https://doi.org/10.5194/egusphere-egu25-16690, 2025.

EGU25-18936 | Orals | BG4.2

Biogeochemical modeling of the Marano and Grado lagoon (Italy) adding a benthic-pelagic coupling 

Isabella Scroccaro, Celia Laurent, Leslie Aveytua Alcarez, and Donata Canu

The Marano and Grado Lagoon, situated in the northeastern coast of Italy, is a shallow coastal ecosystem of significant ecological value at both regional and international levels. The effects of human activities related to local socio-economic development, alongside climate variability, necessitate a deeper understanding of the lagoon's trophic dynamics and the development of effective management strategies. In this study, we present a multi-year analysis of the biogeochemistry of the Marano and Grado Lagoon, utilizing both observational data and a high-resolution coupled physical-biogeochemical model that incorporates explicit benthic-pelagic interactions. This model integrates the transport model SHYFEM (available at https://github.com/SHYFEM-model/shyfem) with the biogeochemical model BFM (Biogeochemical Flux Model, bfm-community.eu/). The biogeochemical component simulates processes in both the water column and sediments, also ensuring their coupling. We conducted ten-year simulations for the physical-chemical properties (2006-2015) and five-year simulations for the biogeochemical processes (2010-2014). Our findings reveal that the distributions of the pelagic biogeochemical state variables align reasonably well with the observed data, while the concentrations of benthic state variables are consistent with established characteristics of the lagoon benthic environment.

How to cite: Scroccaro, I., Laurent, C., Aveytua Alcarez, L., and Canu, D.: Biogeochemical modeling of the Marano and Grado lagoon (Italy) adding a benthic-pelagic coupling, EGU General Assembly 2025, Vienna, Austria, 27 Apr–2 May 2025, EGU25-18936, https://doi.org/10.5194/egusphere-egu25-18936, 2025.

EGU25-19291 | ECS | Posters on site | BG4.2

Marine gel production in coastal diatoms studied by experimental and modeling approaches under varying light conditions 

Youri Jourdevant, Auria Brun, Luz Amadei Martínez, Koen Sabbe, Xavier Desmit, Goulven Gildas Laruelle, Arthur Capet, and Nathan Terseleer

Marine gels are organic polymers spanning from dissolved Exopolymeric Substances (EPS; nm to µm) to Transparent Exopolymer Particles (TEP; µm to mm), playing a key role in marine ecosystems by enhancing flocculation between organic and mineral particles. This process significantly affects the size distribution, density, and vertical transport of Suspended Particulate Matter (SPM) as well as the carbon cycle in the ocean. In turbid coastal environments, TEP produced by phytoplankton determines the seasonality of SPM concentration and influences the export of particulate organic matter. Although the biogeochemical importance of TEP and EPS is now recognized, the factors controlling their production by phytoplankton remain poorly understood and their dynamics is seldom included in biogeochemical models.

This study combines experimental laboratory approaches with mechanistic numerical modeling to decipher the complex relationships between light intensity, interspecific variation, and marine gel production in a turbid coastal zone. Laboratory experiments were conducted on six representative marine diatom strains isolated from the coastal Belgian Part of the North Sea. Following the carbon overflow hypothesis, which suggests that excess cellular internal carbon compared to nutrients leads to EPS excretion and subsequent TEP formation, the strains were subjected to varying light intensities. EPS and TEP concentrations were measured along with phytoplankton and bacterial abundances, as well as particulate organic carbon and nitrogen concentrations during exponential and stationary growth phases. This set of experiments is used to further develop a zero-dimensional biogeochemical model initially designed to simulate dissolved organic matter production and TEP formation during a mesocosm diatom bloom.

Analysis of EPS production revealed distinct patterns across strains, with maximum specific EPS production rates varying by 35%. No correlation between mean cell volume and specific EPS or TEP production was found. Despite the absence of a systematic correlation, specific production rates and TEP formation were generally higher under high light conditions, supporting the carbon overflow hypothesis. The smallest taxon Skeletonema sp. exhibited irregular EPS dynamics with significant losses, suggesting interspecific differences in EPS reactivity and bacterial activity. Cellular C:N ratios remained stable (5-7 mol C:mol N) across all conditions, indicating maintained internal stoichiometry in stationary phase, with no clear relationship to EPS or TEP production.

Preliminary model simulations showed increased TEP:phytoplankton biomass ratios under high irradiance conditions compared to moderate and low light conditions, agreeing with the more similar and lower TEP production reached in medium and low light experiments. Yet, despite the low interspecific variation in maximum EPS production rates suggesting that a homogeneous parameterization could be used, other resource acquisition parameters are known to vary with cell size, and the current constant model parameterization could not allow the adequate simulation of all experiments. This set of experimental data and simulations shows that the underlying mechanisms controlling marine gel production require further investigation and improvement of our biogeochemical models to better represent particle and carbon dynamics in coastal systems.

How to cite: Jourdevant, Y., Brun, A., Amadei Martínez, L., Sabbe, K., Desmit, X., Laruelle, G. G., Capet, A., and Terseleer, N.: Marine gel production in coastal diatoms studied by experimental and modeling approaches under varying light conditions, EGU General Assembly 2025, Vienna, Austria, 27 Apr–2 May 2025, EGU25-19291, https://doi.org/10.5194/egusphere-egu25-19291, 2025.

EGU25-19531 | Orals | BG4.2

Microplastics dynamics under low freshwater discharge conditions in the Guadalquivir estuary 

Daniel González-Fernández, Sandra Manzano, Rocío Quintana, Ana Pilar Martín-García, Sara Sirviente, and Miguel Jorge Sánchez-Guerrero-Hernández

Estuaries behave retention zones for anthropogenic pollutants, including urban  waste and plastics. Under tidal influence, the river flow can be reversed depending on the strength of the tide (neap and spring conditions) and the freshwater discharge in the river basin. In the Guadalquivir River (south Spain), the basin is highly regulated, and most of its drainage area is constrain by a dam at the head of the estuary (ca. 100 km from its mouth). Here, we presents the results of a microplastic monitoring program in the Guadalquivir Estuary. Microplastic samples in sub-superficial waters (triplicates) were collected by net (200 microns mesh) on a bi-monthly basis (neap and spring conditions) in the period 2020-2022 (120 samples), under a wide range of environmental conditions. Most of the samples coincided with very low precipitation and freshwater discharge  periods. Microplastics concentrations varied from 0 to 7 items per cubic meter, mostly fragments and films, and comprised a majority of polyethene and polypropylene particles (75%). Microplastics variability was not correlated with river current speed, salinity and turbidity, indicating the complexity of processes involved in the dynamics of microplastics under low freshwater discharge, when the tide dominates the river flow. These results can be considered as a current baseline, where concentration of microplastics is under 1 item per cubic meter (Quartile 3) for extended periods, while pollution peaks during flood periods in the estuary can exceed 2 orders of magnitude such baseline level.

How to cite: González-Fernández, D., Manzano, S., Quintana, R., Martín-García, A. P., Sirviente, S., and Sánchez-Guerrero-Hernández, M. J.: Microplastics dynamics under low freshwater discharge conditions in the Guadalquivir estuary, EGU General Assembly 2025, Vienna, Austria, 27 Apr–2 May 2025, EGU25-19531, https://doi.org/10.5194/egusphere-egu25-19531, 2025.

EGU25-19833 | Orals | BG4.2

Budgeting the particulate organic matter from the suspended particulate matter in shelf seas 

Xavier Desmit, Rolf Riethmüller, Saumya Silori, Markus Schartau, Dimitry Van der Zande, and Michael Fettweis

Dissolved CO2 and buried organic matter budgets have been studied in shelf seas to identify carbon fractions that are exported to the ocean interior or preserved in the sediment. However, the fate of suspended particulate organic matter remains less understood, particularly because its lability is difficult to identify. Analysis of the different fractions of particulate organic matter in the North Sea could contribute to understanding its fate. The particulate organic carbon (POC) concentration follows coastal-offshore gradients that can be predicted with the suspended particulate matter (SPM) concentration. The POC:SPM ratio indeed features a typical exponential decrease with the SPM concentration. While that ratio is higher offshore where SPM concentrations are minimum, it reaches low asymptotic values at the coast where SPM concentrations are high. Such a relationship is actually found in many different systems (coastal zones, estuaries) and at different latitudes. A semi-empirical model has been proposed to fit the observed data of that relationship in the southern North Sea (German Bight: Schartau et al., 2019; Belgian zone: Fettweis et al., 2022). Based on the model assumptions, it is possible to separate two fractions of POC: the fresh fraction, that is assumed to accumulate during the bloom and to be degraded within the season, and a more refractory POC fraction. More detailed calculations allow this latter fraction to be divided into a slow POC, which includes the refractory detritus, and a mineral POC, that is the POC adsorbed on the surfaces of clay minerals. We assume that suspended mineral particles in the North Sea provide a total surface area saturated with adsorbed organic matter, also considering an underlying dynamic equilibrium between adsorption and desorption of organic matter. We then calculate the SPM budget in the North Sea from satellite remote sensing and vertical concentration profiles obtained from in situ observations. On this basis, we can use the semi-empirical model to establish a budget of the fresh, refractory detrital and mineral fractions of POC on the shelf.

How to cite: Desmit, X., Riethmüller, R., Silori, S., Schartau, M., Van der Zande, D., and Fettweis, M.: Budgeting the particulate organic matter from the suspended particulate matter in shelf seas, EGU General Assembly 2025, Vienna, Austria, 27 Apr–2 May 2025, EGU25-19833, https://doi.org/10.5194/egusphere-egu25-19833, 2025.

EGU25-553 | ECS | Orals | BG4.3

Transition of a semi-arid lake from freshwater to saline system: significant change in biogeochemical process rates 

Ajayeta Rathi, Siddhartha Sarkar, Abdur Rahman, Mohammad Atif Khan, and Sanjeev Kumar

In recent decades, climate change and human interventions have caused severe changes such as desiccation, freshwater salinization, and increased nutrient loading etc. in the freshwater lacustrine ecosystems across the world. Due to these changes, lakes are facing a regime shift from macrophytes to phytoplankton-dominated ecosystems, which have several implications for the health of these ecosystems and ultimately for the in-lake biogeochemical carbon and nitrogen cycling. The present study attempted to understand the effect of the shift in lake hydrology and associated physiochemical parameters on the carbon and nitrogen assimilation efficiency in a tropical freshwater lake situated in semi-arid western India. Multiple field campaigns were conducted in three seasons (summer, monsoon, and winter) and rates of phytoplankton primary production (PP) and dinitrogen (N2) fixation were estimated using 13C and 15N tracer techniques. It was observed that PP and N2 fixation were lower during summer due to inhibition because of higher temperature, higher radiation, and salinity. PP showed a significant increase during monsoon as the lake received nutrients from catchment runoff and a shift to a phytoplankton-dominated ecosystem occurred. Additionally, to support this higher PP, N2 fixers were also active as higher rates of N2 fixation were observed during monsoon. During winter, the metabolic activity of the organism appears to reduce with a decrease in temperature which leads to lower PP and N2 fixation than monsoon. In the lakes, the regime shift might lead to higher carbon sequestration during phytoplankton-dominated stages than macrophyte-dominated.


How to cite: Rathi, A., Sarkar, S., Rahman, A., Khan, M. A., and Kumar, S.: Transition of a semi-arid lake from freshwater to saline system: significant change in biogeochemical process rates, EGU General Assembly 2025, Vienna, Austria, 27 Apr–2 May 2025, EGU25-553, https://doi.org/10.5194/egusphere-egu25-553, 2025.

Protecting wetlands from various human activities requires a deep understanding of their aquatic limnology. This calls for continuous monitoring, which generates extensive and complex datasets. By applying statistical analyses and modelling techniques, these datasets can be effectively interpreted to uncover, define, and gain critical insights into the functions and processes that drive aquatic ecosystems. The present study aims to integrate water quality, sedimentology, aquatic toxicology and modelling techniques to present a detailed and comprehensive assessment of different components of Deepor Beel's (a Ramsar site) ecosystem. Deepor Beel is situated on the banks of the Brahmaputra River in the northeastern region of India and holds immense significance to the city of Guwahati. Originally spanning across more than 40 sq. km area, rampant encroachment and anthropogenic disturbances have not only degraded the wetland ecosystem but also reduced its effective area to now a meagre four sq. km. Large-scale eutrophication due to the discharge of untreated municipal wastewater has played a significant role in the wetland's deterioration. Although several restoration measures were undertaken in the past, they could have been more effective as they lacked prognosis. Hence, we carried out systematic monitoring (the first such extensive monitoring was undertaken) of four components of Deepor Beel's ecosystem, i.e., water, sediment, fish, and aquatic weeds, to understand the governing factors responsible for the wetland's deterioration. We employed different multivariate statistical techniques to understand the sampling site's characterization and behaviour under various environmental and climatic stresses and identify and quantify latent pollution sources contributing to wetland pollution. In addition, a novel water quality index was developed employing Shannon Entropy, which encompasses all essential variables for a comprehensive understanding of the wetland's water quality. We assessed sediment contamination from heavy metals—including chromium (Cr), cadmium (Cd), iron (Fe), manganese (Mn), copper (Cu), lead (Pb), and mercury (Hg)—and conducted fractionation studies, revealing important insights into how these metals interact within the ecosystem. Fish samples from three indigenous species that are locally consumed were collected, and we analyzed the bioaccumulation of heavy metals in various tissues and organs. Our findings indicated significant amounts of heavy metals in the fish organs, making their consumption potentially carcinogenic for humans. Finally, a eutrophication-based ecological model was developed to understand the nutrient dynamics within the wetland. The model was calibrated, and sensitivity analyses were performed and validated using the dataset generated through the laboratory analyses. The model was then simulated for two scenarios: 1) harvesting of aquatic weeds reflecting the current practices, and 2) establishing a treatment unit handling the nitrogen and phosphorus loadings. The results demonstrated that treating the inflow is a more sustainable approach to reducing eutrophication, and this strategy should be implemented promptly. Given the gravity of the situation for Deepor Beel, the findings of this study are significant and call for immediate attention and action.

How to cite: Dash, S. and Gupta, P.: Understanding the governing dynamics and trade-offs between heavy metals and nutrients in heavily contaminated wetlands, EGU General Assembly 2025, Vienna, Austria, 27 Apr–2 May 2025, EGU25-656, https://doi.org/10.5194/egusphere-egu25-656, 2025.

EGU25-1409 | Posters on site | BG4.3

CO2 fluxes at a hypersaline shallow playa. The organomineral crust makes the difference.  

Andrea Butturini, Oscar Cabestrero, Joan Ferriol, Arnau Blasco, Yolanda García, Merce Berlanga, Pere Picart, Rosa Gomez, Jordi Urmeneta, Anna maria Romaní, and Esther Sanza-Montero

Shallow hypersaline playas are flat endorheic basins that form a salt crust at the top sediment layer. They are episodically flooded after intense rainfall events. After flooding, if precipitation does not persist, evaporation causes the water to recede, and salinity can increase up to 35–45%. Ultimately, the system dries up and evaporites like eugsterite (Na4Ca(SO4)3·2H2O), blödite (Na2Mg(SO4)2·4H2O), halite (NaCl) and gypsum (CaSO4·2H2O) can precipitate forming a rigid crust layer.

The present study focuses on measuring the exchange of CO2 between the upper sediments and the atmosphere at “La Muerte” playa-lake in the Monegros region (Aragon, Northeast Spain). Its main characteristic is the presence of a benthic organicmineral film dominated by cyanobacteria which uniformly covers the basin after rain events. As the water body evaporates, the biofilm contracts, while precipitated minerals replace organics and partially cement pore spaces, forming a rigid, salt crust–biofilm assemblage up to 1 cm thick. The two main objectives of the present study are:

  • To estimate the net CO2 exchanges under wet and dry conditions and therefore to verify the impact of water availability in modulating the magnitude and sign of CO2 fluxes
  • To investigate the significance of the upper organomineral crust on modulating the CO2


To accomplish these objectives this study relies on field in-situ short-term incubations complemented by additional ex-situ laboratory estimates. Main preliminary outputs are:

  • Net CO2 emission typically predominated over net consumption.
  • Net CO2 emission increased in summer, under dry conditions. Net CO2 consumption is detected under water-saturated conditions only.
  • The CO2 emissions decreased in incubations where the surface biofilm remained undisturbed, as opposed to those where it was removed.
  • Most subsurface CO2 emission originates from just below the crust (ca. 1 cm depth) to 8 cm depth.
  • Under dry conditions, primary productivity of phototrophs at the top biofilm crust is insufficient to account for the observed decrease in CO2

Overall, these results suggest that although the upper layer is not an impermeable barrier to gas flows, such as CO2, it transiently mitigates its seepage into the atmosphere.

How to cite: Butturini, A., Cabestrero, O., Ferriol, J., Blasco, A., García, Y., Berlanga, M., Picart, P., Gomez, R., Urmeneta, J., Romaní, A. M., and Sanza-Montero, E.: CO2 fluxes at a hypersaline shallow playa. The organomineral crust makes the difference. , EGU General Assembly 2025, Vienna, Austria, 27 Apr–2 May 2025, EGU25-1409, https://doi.org/10.5194/egusphere-egu25-1409, 2025.

EGU25-1873 | ECS | Posters on site | BG4.3

The Arabian Gulf: A Field Laboratory for Studying Marine Biocalcifier Resilience Under Natural and Anthropogenic Stress - Current Progress and Future Directions 

Sinatrya Diko Prayudi, Bassam Tawabini, Korhan Ayranci, and Michael Kaminski

Over the past 10,000 years since the last reemergence of marine systems from glacial conditions, the Arabian Gulf has become a well-known semi-restricted basin with no equal. Despite its importance as a present-day analogue for past geological environments and events, such as the Messinian Salinity Crisis and the rise and fall of the Dammam Sea during the Middle Eocene, there has been limited research development from academia, and these studies tend to be localized. The resilience of living marine organisms, particularly biocalcifiers, in the face of future climate change and global warming within this naturally stressed environment is also a major concern.

This work elaborates on the progress in understanding the impact of stressed environments on living biocalcifiers amid uncertainties in future climatic perturbations and human-induced problems. Various approaches have been used in the region, including thermal tolerance experiments, global warming predictions, and studies of human waste impacts (heavy-trace elements, microplastics, etc.). Several advancements have been made, such as experimenting with the thermal tolerance of intertidal and shallow-water benthic biocalcifiers, observing a “kill zone” linked to prolonged summer heat and desalination plant plumes, and studying the occurrence of microplastic waste in the soft tissues of selected biocalcifiers. To develop a comprehensive understanding and provide accurate proxies for past and future conditions, and to understand how marine biocalcifiers and their habitats in the Arabian Gulf change spatio-temporally, more work and collaboration are needed. As an academic institution in the region, we welcome future collaboration.

How to cite: Prayudi, S. D., Tawabini, B., Ayranci, K., and Kaminski, M.: The Arabian Gulf: A Field Laboratory for Studying Marine Biocalcifier Resilience Under Natural and Anthropogenic Stress - Current Progress and Future Directions, EGU General Assembly 2025, Vienna, Austria, 27 Apr–2 May 2025, EGU25-1873, https://doi.org/10.5194/egusphere-egu25-1873, 2025.

EGU25-2083 | ECS | Posters on site | BG4.3

Oxygen and sulphur trends in a highly hypertrophic lake: a case study from Salbker South, Germany 

Marlene Dordoni, Luisa Coder, Yvonne Rosenlöcher, and Jörg Tittel

Lakes that are supersaturated with nutrients often meet the definition of hypertrophy and draw scientific attention due to their distinctive biogeochemical dynamics. Salbker South, an urban lake located in Magdeburg, Germany, exemplifies such an environment. Since summer 2022, it has been the focus of a high-frequency monitoring that reported total phosphorus (TP) and chlorophyll a (chl a) levels as high as 1.4 mg L⁻1 and 417 µg L⁻1, respectively. TP and chl a contribute to substantial organic carbon (OC) accumulation and create a fragile ecosystem where biological communities are under threat from processes such as anoxia induced by OC-mineralisation during thermal stratification between May and September. Anoxic events involve both the hypolimnion, which becomes undersaturated in DO down to 0.0 mg L-1within a week from the onset of thermal stratification, and the epilimnion where diurnal changes in DO span from 0.0 to > 20 mg L-1. Additionally, the high sulphate (SO₄) levels in the lake (up to 1.46 mg L-1) that are derived from the Zechstein Formation and hamper water electrical conductivity to 4 – 5 mS cm-1 facilitate the production of hydrogen sulphide (H₂S). As a result, H₂S concentrations in the deeper waters have been recorded to exceed 8.2 mg L-1. These dynamics position Salbker South as a natural H₂S generator. To mitigate these issues and reduce yearly cyanobacterial blooms, targeted restoration programs aimed to lower nutrient concentrations and stabilize lake biogeochemical balances are urgently needed. Our monitoring program that includes nearby groundwater wells, the Elbe River, and Lake Salbker North, is set to continue, aiming to establish this site as a hub for scientific innovation and interdisciplinary collaboration.

How to cite: Dordoni, M., Coder, L., Rosenlöcher, Y., and Tittel, J.: Oxygen and sulphur trends in a highly hypertrophic lake: a case study from Salbker South, Germany, EGU General Assembly 2025, Vienna, Austria, 27 Apr–2 May 2025, EGU25-2083, https://doi.org/10.5194/egusphere-egu25-2083, 2025.

EGU25-2753 | Posters on site | BG4.3

Invariable selection of compounds from organic matter by stream microbes 

Jörg Tittel, Volker Lüderitz, Sabine Radke, Yvonne Rosenlöcher, and Oliver J. Lechtenfeld

Organic carbon (OC) in rivers is one of the most rapidly recycled carbon pools. However, there is no consensus on the mechanisms that determine which compounds are remineralized. We studied the radiocarbon age of dissolved OC (DOC) that is decomposed in laboratory experiments across a range of stream bulk DOC ages. Stream DOC was collected from small forested catchments under summer dry flow, average flow and storm flow conditions. The ∆14C of respiratory CO2 increased with the ∆14C of stream DOC (P = 0.006, N = 16). However, the slope of the regression was small (0.20 ± 0.06) and the dependence was weak (R2 = 0.43). In further experiments, we used leachates of catchment soil from 0-8 cm and 8-20 cm depth and a 1:1 mixture of the two depths as initial DOC. Again, the increase in ∆14C-CO2 as a function of ∆14C-DOC was significant (R2 = 0.74, P = 0.028, N = 6), but the slope was small (0.13 ± 0.04) and the age range of respired DOC was narrow (modern to 280 years BP) compared to initial leachate DOC (600 to 3400 years BP). Fourier-transform ion cyclotron resonance mass spectrometry showed that similar (small, unsaturated, oxygen-rich) CHO molecules were consumed regardless of DOM source. The narrow age ranges of respired DOC suggest that intrinsic chemical quality sets the limits for which compounds can be utilized under given geochemical conditions. However, strategies of microorganisms to optimize growth (optimal foraging) may modulate their specific substrate choice, as indicated by the dependence of the age of respired OC on the age composition of the original DOC.

How to cite: Tittel, J., Lüderitz, V., Radke, S., Rosenlöcher, Y., and Lechtenfeld, O. J.: Invariable selection of compounds from organic matter by stream microbes, EGU General Assembly 2025, Vienna, Austria, 27 Apr–2 May 2025, EGU25-2753, https://doi.org/10.5194/egusphere-egu25-2753, 2025.

Ammonia is one of the dominant foraminiferal species in the intertidal zone and the late Quaternary delta stratigraphy, which has been popularly used as a key micropaleontological indicator for the past environment.  However, its classification has been battled since 19th century.  The development of molecular analysis has shed a new light on the taxonomy and phylogeny of foraminifers over the last several decades.

Ammonia confertitesta Zheng 1978, taxonomically erected and adopted in the microfossil study for the Shangdong peninsula, China, is the most dominant species in the surface sediments of shallow water of the Yellow Sea.  This species was reported recently in the European ocean environment (harbor), regarding as a non-indigenous species.  Ammonia aomoriensis (Asano, 1951) has also been adopted in some recent publications.  For a better understanding of its taxonomy and distribution, in this study, living Ammonia specimens were collected from the muddy sediments at the Haimen inter-tidal zone of the southwestern Yellow Sea, and performed molecular analyses on their SSU rDNA sequences.

A large number of the inter- and intra-specific SSU rDNA sequences were obtained for Ammonia confertitesta specimens of the southwestern Yellow Sea. These sequences were conducted phylogenetic analysis together with other related Ammonia sequences from the GenBank.

The phylogenetic tree shows that Ammonia catesbyana (d'Orbigny, 1839), Ammonia aomoriensis (Asano,1951), Ammonia confertitesta Zheng 1978 and Ammonia sp. T6 (Hayward et al. 2004) form one distinct group (Clade A), and suggests that A. confertitesta, A. catesbyana and A. aomoriensis be synonymous.  Ammonia catesbyana, was first reported and described from the shallow waters off Cuba (D'Orbigny, 1839).  Therefore, instead of others, we propose that Ammonia catesbyana (D'Orbigny, 1839) be a valid nomination for the distinct group; and the worldwide distribution of Ammonia catesbyana implies that Ammonia confertitesta Zheng 1978 in Europe is probably not a non-indigenous species from the East Asia marine waters.


This work is supported by the CAS Strategic Priority Project (XDB XDB26000000) and the National Natural Science Foundation of China (Grants 41776073).

How to cite: Li, B. and Zhang, K.: Taxonomy of Ammonia catesbyana (d'Orbigny, 1839) revisited: evidence on the intraspecific DNA sequences from the intertidal sediments of the southwestern Yellow Sea, EGU General Assembly 2025, Vienna, Austria, 27 Apr–2 May 2025, EGU25-2972, https://doi.org/10.5194/egusphere-egu25-2972, 2025.

This study investigates the spatiotemporal dynamics of water quality, phytoplankton, and zooplankton communities in two hydrologically connected reservoirs, Lantan and Renyitan, where water is transferred from Renyitan to Lantan. Seasonal and spatial analyses were conducted on key water quality parameters, including ammonia nitrogen (NH₄-N), total phosphorus (TP), dissolved oxygen (DO), and chemical oxygen demand (COD), and their influence on plankton abundance and diversity was assessed. Zooplankton abundances averaged 1500 ± 200 individuals/mL during the wet season, significantly higher than the dry season’s 1200 ± 150 individuals/mL (p = 0.0096, d = 1.58). Phytoplankton abundances also increased significantly during the wet season (p = 0.013), driven by nutrient enrichment from surface runoff and hydrological mixing. Diversity indices, such as the Shannon-Wiener Index (H') and Margalef’s Richness Index (DMg), displayed notable seasonal variations (p < 0.001), suggesting greater diversity and community balance in the wet season. Depth-related variations were more pronounced for zooplankton, with higher species richness (50 ± 8 species) and diversity (H' = 2.5 ± 0.2) in shallow zones, compared to opportunistic dominance in deeper waters (Dominance Index D = 0.7 ± 0.1). Phytoplankton depth-related differences were minor, with shallow samples averaging 5200 cells/mL compared to 4900 cells/mL in deep waters (p = 0.537). Inter-reservoir comparisons revealed higher biodiversity and community balance in Renyitan, whereas Lantan exhibited localized nutrient imbalances, promoting dominance of specific taxa.  Non-Metric Multidimensional Scaling (NMDS) analysis highlighted significant seasonal shifts in plankton communities, with broader dispersion in the wet season due to dynamic environmental conditions. Deep-water habitats exhibited greater ecological stability, clustering tightly around NMDS centroids. Canonical correlation analysis (CCA) identified TN, TP, and DO as critical environmental drivers (p < 0.01). These findings emphasize the influence of seasonal and depth-related dynamics on plankton communities within connected reservoirs. Insights derived from this study provide valuable foundations for nutrient management, bloom mitigation strategies, and sustainable reservoir ecosystem management. Future research incorporating molecular tools and long-term monitoring is recommended to enhance understanding of community resilience in the face of climate-driven changes.

How to cite: Kuo, Y.-M.: Spatiotemporal Dynamics of Water Quality and Plankton Communities in Hydrologically Connected Reservoirs, EGU General Assembly 2025, Vienna, Austria, 27 Apr–2 May 2025, EGU25-3050, https://doi.org/10.5194/egusphere-egu25-3050, 2025.

    There is a close relationship between the face of benthic foraminifera and water masses. Benthic foraminifera are sensitive to changes in seawater temperature, nutrients, and dissolved oxygen, making them a good material for reconstructing paleoceanographic environments, and thus are frequently used as indicators of the sedimentary environments. An alternation of brownish gray to greenish gray (“red-green”) intervals was observed at IODP Expedition 368 Site U1502 in the northern South China Sea. In this study, we analyzed benthic foraminiferal assemblages in sediments from two sections of Hole U1502A to reconstruct changes in bottom water mass properties in the northern South China Sea during the Middle-Late Miocene.
    Abundant benthic foraminifera were found in both sections, with higher abundance in the Late Miocene section (10R1W) than in the Middle Miocene section (29R5W-30R6W). Among them, a total of 78 genera and 225 species of benthic foraminifera were identified, and both sections were dominated by Epistominella exigua, Nuttallides umbonifera, Globocassidulina subglobosa, Gyroidinoides orbicularis ,and Oridorsalis umbonata,indicating a long-term deep-sea environment.
    Additionally, significant variations in the abundance of Uvigerina peregrina and Bulimina alazanensis were found in the two sections. The abundance of U. peregrina was much higher than that of B. alazanensis in the Middle Miocene section, whereas in the Late Miocene section, the abundance of U. peregrina decreased dramatically while that of B. alazanensis increased significantly. Since B. alazanensis occupied the same niche in the South Pacific deep water as U. peregrina in the North Pacific, this may suggest that the northern South China Sea was influenced by alternating deep water masses originating from the North Pacific to the South Pacific during the Middle-Late Miocene.

    This work is supported by the CAS Strategic Priority Project (XDB XDB26000000) and the National Natural Science Foundation of China (Grants 41776073).

How to cite: Zhang, K. and Li, B.: Reconstructing Middle-Late Miocene Bottom Water Mass Properties in the Northern South China Sea: Insights from Benthic Foraminifera, EGU General Assembly 2025, Vienna, Austria, 27 Apr–2 May 2025, EGU25-3932, https://doi.org/10.5194/egusphere-egu25-3932, 2025.

EGU25-4232 | Posters on site | BG4.3

Fluorescence Monitoring and Modeling for Understanding Organic Matter Dynamics in European Rivers 

Xinyu Liu, Steven Loiselle, Luisa Galgani, Amedeo Boldrini, Alessio Polvani, and Riccardo Cirrone

This study focuses on exploring the dynamics of dissolved organic matter (DOM) using high-frequency, continuous monitoring coupled with advanced fluorescence spectroscopy and statistical modeling. By combining continuous fluorescence sondes with spot sampling, we show temporal and longitudinal dynamics of DOM over a 14-month period in two UK rivers. The integration of fluorescence excitation-emission matrix (EEM) spectroscopy and Parallel Factor Analysis (PARAFAC) enabled the identification of key fluorescent components, including humic and protein-like substances. Real-time monitoring of these two DOM components reveals significant diel and seasonal variations in both the quantities and characteristics of DOM. External carbon sources (treatment works, agricultural land use) showed increased protein-like DOM, particularly during summer, indicating the influence of labile organic matter. A new fluorescence ratio (humic DOM/protein-like DOM) proved to be a robust indicator for differentiating between microbial-derived labile DOM and more refractory humic substances, offering new insights into organic matter processing and nutrient cycling in the studied ecosystems.

Modeling approaches, based on ANCOVA and logistic regression, demonstrated that allochthonous sources, precipitation, and seasonal temperature variations were key drivers of DOM dynamics. Periods of low temperature and high precipitation were characterized by a notable increase in humic-like DOM concentrations, primarily due to enhanced runoff of terrestrial organic matter into the river system. In contrast, as temperature increased, tryptophan-like DOM concentrations rose, reflecting heightened microbial activity driven by warmer conditions. The elevated temperature not only stimulated microbial metabolism but also accelerated the decomposition of organic matter, leading to the production of more labile, protein-like substances. These contrasting seasonal trends highlight the dual influence of hydrological inputs and temperature-driven biological processes on DOM patterns.

How to cite: Liu, X., Loiselle, S., Galgani, L., Boldrini, A., Polvani, A., and Cirrone, R.: Fluorescence Monitoring and Modeling for Understanding Organic Matter Dynamics in European Rivers, EGU General Assembly 2025, Vienna, Austria, 27 Apr–2 May 2025, EGU25-4232, https://doi.org/10.5194/egusphere-egu25-4232, 2025.

EGU25-4249 | ECS | Orals | BG4.3

Organic matter composition and water stoichiometry are main drivers of heterotrophic nitrate uptake in Mediterranean headwater streams. 

Xavier Peñarroya, Núria Catalán, Anna Freixa, Anna Lupon, Xavier Triadó-Margarit, Eugènia Martí, Montserrat Soler, Emili O. Casamayor, and Susana Bernal

Heterotrophic bacteria can contribute to improve stream water quality by taking up nitrate (NO3-) from the water column, although microbial demand for this nutrient is usually lower than for other inorganic nitrogen (N) forms, such as ammonium. Heterotrophic NO3- uptake has been related to the availability of dissolved organic carbon (DOC) relative to nutrients (i.e., DOC:nutrients ratios). Yet, how dissolved organic matter (DOM) composition and specific microbial assemblages influence NO3- uptake remains poorly understood. We conducted laboratory incubations to investigate heterotrophic NO3- uptake kinetics in 9 Mediterranean freshwater ecosystems, primarily headwater streams, exhibiting wide variation in DOC:NO3 ratios (from 1.5 to 750). Moreover, we characterized DOM composition using spectroscopic indexes and its degradation via a Reactivity Continuum model approach. Microbial community composition and functioning were assessed by analysing extracellular enzymatic activities and the potential abundance of N-cycling genes.  Our results revealed that NO3- uptake rates (kNO3) were positively related with DOC:NO3 ratios (r2 = 0.4) and to NO3:SRP ratios as well (r2 = 0.6). Furthermore, kNO3 was negatively correlated to the humification index (r2= 0.7), suggesting that a higher proportion of humic-like compounds slow down heterotrophic NO3- uptake. A partial least squares regression model (PLS) pinpointed that DOC and nutrient stoichiometry, DOM composition and reactivity, and microbial composition and activity collectively contributed to explain the variability in kNO3 observed across treatments. Our findings suggest that heterotrophic NO3- uptake may show significant responsiveness to shifts towards more labile DOM sources and nutrient imbalances induced by global change.

How to cite: Peñarroya, X., Catalán, N., Freixa, A., Lupon, A., Triadó-Margarit, X., Martí, E., Soler, M., O. Casamayor, E., and Bernal, S.: Organic matter composition and water stoichiometry are main drivers of heterotrophic nitrate uptake in Mediterranean headwater streams., EGU General Assembly 2025, Vienna, Austria, 27 Apr–2 May 2025, EGU25-4249, https://doi.org/10.5194/egusphere-egu25-4249, 2025.

EGU25-6612 | Orals | BG4.3

Predictions of riverine gas exchange rates may be biased towards low-submergence rivers 

Giulio Dolcetti and Annunziato Siviglia

The exchange of gas across the interface between rivers and the atmosphere is a key control of oxygen and carbon fluxes (in the form of carbon dioxide and/or methane) in rivers and streams. The intensity of gas exchange is measured by the gas transfer velocity, k, a parameter expressing the efficiency of sub-surface mixing driven by turbulence in water. Scaled experiments and theoretical analysis both suggest a significant shift in the drivers of k depending on the relative submergence, i.e., the ratio between water depth H and the characteristic bed roughness scale, D: In high-submergence (deep) rivers, turbulent mixing is dominated by viscous forces, while in low-submergence (shallow) rivers by form drag due to protruding bed roughness elements. However, the bed roughness scale is not usually reported in field gas transfer datasets and the effects of submergence are neglected by existing models.

We conducted a meta-analysis of the largest known dataset of gas transfer velocity and hydraulic flow parameters to investigate the potential role of submergence on gas transfer in the field, estimating the relative submergence according to the observed flow resistance through an established semi-empirical variable-power relation. Then, we used the same model to partition the gas transfer velocity into its friction (high submergence) and macro-roughness (low submergence) constituents. The results indicate that 93% of data was recorded in low-submergence streams and rivers (partition coefficient > 0.5). Such skewness in the data distribution is explained by the difficulty in measuring the gas transfer velocity in large rivers using existing methods. Due to the different physical mechanisms governing gas exchange, widely used semi-empirical models calibrated in shallow rivers may overestimate k in deep rivers. Since large rivers contribute around 50% of global riverine CO2 emissions, the impact on global emissions uncertainties may be significant. Ultimately, our results highlight the urgent need for improved measurement approaches to characterise the gas transfer velocities in large rivers, and the importance of introducing systematic quantitative riverbed surveying into gas exchange measurement protocols.

How to cite: Dolcetti, G. and Siviglia, A.: Predictions of riverine gas exchange rates may be biased towards low-submergence rivers, EGU General Assembly 2025, Vienna, Austria, 27 Apr–2 May 2025, EGU25-6612, https://doi.org/10.5194/egusphere-egu25-6612, 2025.

EGU25-7203 | Posters on site | BG4.3

Unraveling dissolved organic matter sources and their link to land use along the Rapel River Continuum, Chile 

Morgane Derrien, Simona Retelletti Brogi, Leo Chasselin, Fernando Lizana, Zoé Hayet, Mario Flores, Ignacia Yanten, Chiara Santinelli, and Céline Lavergne

Inland aquatic ecosystems play a crucial role in the carbon cycle, acting as an interface for carbon exchange between the atmosphere, terrestrial ecosystems, and the oceans. Due to their importance, dissolved organic matter (DOM) dynamics in continental water bodies have been widely studied. However, most studies are limited to specific sections of river basins, such as headwaters or estuaries, leaving a significant gap in understanding continuous fluvial systems encompassing the entire watershed, particularly regarding the behavior of DOM at the basin scale. To address this gap, we investigated the DOM dynamics within a watershed of 14,000 km² with diverse geomorphological features, following its entire course from the Andes to its only outlet into the Pacific Ocean. This watershed is highly diverse, combining high mountain areas impacted by mining activities with intensively farmed agricultural zones, livestock production in the central region, residential areas, and various recreational activities. The study aims to analyze variations in DOM characteristics along a fluvial continuum and their relationship with land use in different basin sections. A total of 25 sampling points were selected across the basin, including locations within the three sub-basins and the most significant tributaries. At each station, water physicochemical properties were measured by using a portable multiparametric probe, and water samples were collected for measurements of dissolved organic carbon (DOC) concentration, DOM optical properties (fluorescence and absorbance spectroscopy), isotopic analyses, as well as metalloids. A portable sensor was also used to measure nitrate concentrations directly on site. The results allowed us to (i) identify the sources of DOM, (ii) characterize DOM dynamics along the continuous river, and (iii) establish the relationship between DOM sources and different land use types across the basin's sections. This study provides the first regional-scale investigation of DOM dynamics along a river continuum in Chile and offers valuable insights into DOM responses across such systems, raising questions about existing theories of the river continuum concept. Finally, this study represents the first step of a more comprehensive and multidisciplinary study that will also cover seasonality and interannual variability of DOM dynamics and aquatic microbial community diversity in this region.

How to cite: Derrien, M., Retelletti Brogi, S., Chasselin, L., Lizana, F., Hayet, Z., Flores, M., Yanten, I., Santinelli, C., and Lavergne, C.: Unraveling dissolved organic matter sources and their link to land use along the Rapel River Continuum, Chile, EGU General Assembly 2025, Vienna, Austria, 27 Apr–2 May 2025, EGU25-7203, https://doi.org/10.5194/egusphere-egu25-7203, 2025.

EGU25-7457 | ECS | Orals | BG4.3

Drivers of stream metabolism in anthropogenically disturbed mountainous streams of Uganda.  

Florence Nansumbi, Gabriele Weigelhofer, Robinson Odong, and Thomas Hein

Stream metabolism is a fundamental ecosystem function that includes gross primary productivity (GPP) and ecosystem respiration (ER). These processes measure the energy supply and consumption in the aquatic system and are the basis for the green and brown food webs. Because of their sensitivity to environmental stressors, they are important in aquatic ecosystem management as functional indicators of the ecosystem’s health. They also have the benefit of being an integrative indicator of ecosystem change since they are influenced by multiple factors at different scales. Although the drivers of metabolism in river systems are known, there is great variation in the factors controlling stream metabolism within and between individual river systems due to natural and anthropogenic drivers. Additionally, limiting factors can vary from one system to another, leading to distinct metabolic regimes.
In Uganda's mountainous regions, the interaction between natural factors such as elevation and human-induced disturbances, including deforestation, agriculture and urbanization can cause metabolic patterns to deviate from those predicted for headwater streams. Understanding the drivers of stream metabolism in these anthropogenically impacted ecosystems is therefore crucial for their sustainable management. Considering the increased impact of anthropogenic activities on headwater streams and the general lack of understanding of the drivers of metabolism in these systems, this study examined the drivers of metabolism in anthropogenically disturbed headwater montane streams in western Uganda.
Over 7 months, metabolism and its hypothesised drivers were measured in 11 tropical stream reaches at high elevation. Stepwise regression was used to build models to understand the factors influencing GPP and ER at catchment and local scales. At large scales, stream order, catchment area, and percentage of agriculture and forest cover influenced GPP, while stream order, elevation and the percentage of urban land use influenced ER. Structural equation modelling showed that catchment factors influenced GPP through effects on local drivers such as stream width, ammonia and phosphorous concentrations in sediments, turbidity and canopy cover. On the other hand, the catchment drivers controlled ER through influence on discharge, temperature, phosphorus, and ammonia. Our results suggest that metabolism in mountainous streams is not only affected by anthropogenic activities, but elevation also plays an important role for the observed patterns. The high elevation and steep slopes initiate further sediment-related processes, erosion and sedimentation, influencing metabolism.

How to cite: Nansumbi, F., Weigelhofer, G., Odong, R., and Hein, T.: Drivers of stream metabolism in anthropogenically disturbed mountainous streams of Uganda. , EGU General Assembly 2025, Vienna, Austria, 27 Apr–2 May 2025, EGU25-7457, https://doi.org/10.5194/egusphere-egu25-7457, 2025.

EGU25-8073 | Orals | BG4.3

A High-Throughput Automated Microfossil Classification System Using Deep Learning 

Takuya Itaki, Ayumu Miyakawa, Kazuhide Mimura, and Minoru Ikehara

The rapid advancement of computational power has facilitated the widespread adoption of deep learning, a subset of artificial intelligence (AI), in various fields. Automated microfossil classification using AI is increasingly explored as a solution to reduce labor and address the declining availability of skilled personnel. However, practical implementation in research remains limited due to challenges such as the need for extensive training datasets and the lack of advanced equipment like automated microscopes. To address these issues, we implemented deep learning as a function to automatically classify microfossils on a virtual slide scanner that can process up to 360 microscope slides continuously. This study applied the system to sediment core DCR-1PC from the Indian Ocean sector of the Southern Ocean to obtain high-resolution records of the radiolarian analysis.

How to cite: Itaki, T., Miyakawa, A., Mimura, K., and Ikehara, M.: A High-Throughput Automated Microfossil Classification System Using Deep Learning, EGU General Assembly 2025, Vienna, Austria, 27 Apr–2 May 2025, EGU25-8073, https://doi.org/10.5194/egusphere-egu25-8073, 2025.

EGU25-8520 | Orals | BG4.3

Confluences act as biogeochemical hot spots in Mediterranean stream networks 

Anna Lupon, Xavi Peñarroya, Carolina Jativa, Zhao Xinyue, Eugènia Martí, Núria Catalán, Valentí Rodellas, Susana Bernal, Gerard Rocher-Ros, Sílvia Poblador, Stephanie Merbt, and Carolina Olid

Headwater streams are critical for global biogeochemical cycles, transporting and retaining large amounts of carbon (C), nitrogen (N) and phosphorus (P). However, global element fluxes within headwater fluvial networks remain poorly constrained, partially due to the extreme spatial variability in water chemistry. Here, we assessed how confluences shape C, N and P concentrations and major biogeochemical fluxes along Mediterranean fluvial networks. We hypothesized that confluences act as biogeochemical hotspots because lateral inflows can supply limiting resources to the receiving streams. To test this hypothesis, we conducted synoptic surveys in fall 2024 across three Mediterranean headwater fluvial networks within the Tordera basin (Catalonia). We measured organic and inorganic C, N and P concentrations every 50 meters along the mainstem as well as in major lateral inflows, including permanent tributaries, intermittent tributaries and preferential groundwater flowpaths. Further, we performed laboratory incubations to assess changes in heterotrophic activity, C degradation and nutrient uptake between sites located upstream and downstream of major confluences. Preliminary results show that C:N:P ratios varied across streams (from 483:2:1 to 818:58:1), suggesting that stream biota was limited by either N, P or both. Further, confluences shaped element concentrations along the mainstem by either diluting element concentrations (mixing effect) or delivering limiting nutrients that enhanced biogeochemical activity (reactor effect). Overall, these findings underscore the role of confluences as biogeochemical hotspots and highlight their importance for regulating water chemistry and element fluxes within stream networks.

How to cite: Lupon, A., Peñarroya, X., Jativa, C., Xinyue, Z., Martí, E., Catalán, N., Rodellas, V., Bernal, S., Rocher-Ros, G., Poblador, S., Merbt, S., and Olid, C.: Confluences act as biogeochemical hot spots in Mediterranean stream networks, EGU General Assembly 2025, Vienna, Austria, 27 Apr–2 May 2025, EGU25-8520, https://doi.org/10.5194/egusphere-egu25-8520, 2025.

EGU25-8876 | Orals | BG4.3

Similar pattern of diurnal nitrate retention in different stream orders: seasonal to sub-daily insights from high-frequency data 

Michael Rode, Xiaoqiang Yang, Xiaolin Zhang, and Sakline Shawon

High-frequency nitrate-N () data are increasingly available, while accurate assessments of the importance of in-stream retention processes is deviating stream orders are still unclear. In this presentation we hypothesize that similar diurnal nitrate uptake pattern exists in different stream orders and that these patterns can reveal insights into the dominance of uptake processes across stream scales. To test this assumption continuous 15-min estimates of  retention was derived in a 1st stream and  a 6th-order reach of the lower Bode River network (27.4 km, central Germany) using a one station method for the 1st order agricultural headwater stream and a two-station approach for the 6th order stream applying a data fusion framework capturing river hydraulics and their impacts on solute signal propagation through river hydrodynamic modelling (Yang et al. 2023). This methodological setting was used for long-term sensor monitoring data from 2015-2023 capturing highly deviating hydrological (normal and drought) and stream morphological conditions. The unique  retention estimates revealed very similar characteristic diurnal variation of  retention pattern. Three very similar clusters of diel uptake patterns were identified in both streams, potentially representing changes in dominant autotrophic and heterotrophic   retention processes. While the dominating N-uptake clusters were similar in both systems, their seasonal occurrence showed significant differences between the two streams. For example, clusters reflecting assimilatory N-uptake dominated in the 1st order stream in all years and seasons. In the 6th order reach autotrophy-characterized clusters mostly occurred during early seasons, which are then followed by a shift to heterotrophic-dominated uptake pattern during summer- autumn low-flow periods. In addition, dominance of autotrophic   retention extended more widely across seasons during the drought years. In contrast, the 1st order stream showed relevance of both autotrophic and heterotrophic uptake even in the winter month due to the stimulation by elevated spring water temperature. The analysis of characteristic uptake clusters and the suggested framework can be flexibly transferred across sites and scales, thereby complementing high-frequency monitoring to identify in-stream uptake processes and to inform river management.

Reference

Yang, X., Zhang, X., Graeber, D., Hensley, R., Jarvie, H., Lorke, A., Borchardt, D., Lif, Q., Rode, M. (2023) Large-stream nitrate retention patterns shift during droughts: Seasonal to sub-daily insights from high-frequency data-model fusion. Water Research, 243, 120347.

How to cite: Rode, M., Yang, X., Zhang, X., and Shawon, S.: Similar pattern of diurnal nitrate retention in different stream orders: seasonal to sub-daily insights from high-frequency data, EGU General Assembly 2025, Vienna, Austria, 27 Apr–2 May 2025, EGU25-8876, https://doi.org/10.5194/egusphere-egu25-8876, 2025.

EGU25-9005 | ECS | Posters on site | BG4.3

Impacts of natural and anthropogenic factors on microbiological water quality indicators along an urban riverine tropical wetland   

Flavia Byekwaso, Guenter Langergraber, Gabriele Weigelhofer, Rose Kaggwa, Frank Kansiime, and Thomas Hein

Impacts of natural and anthropogenic factors on microbiological water quality indicators along an urban riverine tropical wetland  

Flavia Byekwaso1,3,6, Guenter Langergraber2, Gabriele Weigelhofer1,3, Rose Kaggwa4, Frank Kansiime5,  Thomas Hein1,3

1 University of Natural Resources and Life Sciences, Vienna (BOKU), Department of Ecosystem Management, Climate and Biodiversity, Institute of Hydrobiology and Aquatic Ecosystem Management, Gregor-Mendel-Strasse 33, 1180 Vienna, Austria

2 University of Natural Resources and Life Sciences, Vienna (BOKU), Department of Landscape, Water and Infrastructure, Institute of Sanitary Engineering and Water Pollution Control, Muthgasse 18, 1190 Vienna, Austria

3 WasserCluster Lunz, Dr. Kupelwieser-Promenade 5, 3293 Lunz am See, Austria

4National Water and Sewerage Corporation, P.O. BOX 7053, Kampala, Uganda

5 Makerere University, Department of Environmental Management, P.O. BOX 7062, Kampala, Uganda

6 Ministry of Water and Environment, Climate Change Department, P.O BOX 20026, Kampala, Uganda

ABSTRACT


Water quality monitoring is essential for understanding seasonal variations in microbiological indicators and their implications for public health. Waterborne bacteria and pathogens are a significant cause of human diseases, especially in developing countries.  The study aimed to understand the factors that cause seasonal changes in the concentrations of microbiological water quality indicators along a riverine tropical wetland. In total, 144 water samples were collected for 12 months at six sites along Lubigi wetland in Kampala, Uganda, receiving varying stormwater and wastewater inputs from urban water infrastructure during the dry and wet seasons. Water samples were analysed using specific microbiological assay tests for Escherichia coli, faecal coliforms, heterotrophic plate counts, Enterococcus and Salmonella species. Generally, the highest concentrations of microbial contamination were detected during the dry season at all sites. There was a decreasing trend in microbial contamination for all the selected five microbiological indicators with increasing distances from the sources of stormwater and wastewater inflows in the upstream reaches towards the downstream areas of Lubigi wetland. Nitrogen compounds, Escherichia coli, faecal coliforms, Enterococcus and Salmonella species originated from stormwater, whereas wastewater discharges delivered primarily phosphorus compounds, organic matter and heterotroph plate counts. E. coli and heterotrophic plate counts were positively correlated with water temperature and salinity. E. coli, faecal coliforms and heterotroph plate counts were positively associated with Biological Oxygen Demand (BOD5). Escherichia coli, faecal coliforms and Enterococcus species were positively correlated with NH4-N. Escherichia coli, faecal coliforms, and heterotrophs dominated with high concentrations during the dry seasons, while Enterococcus and Salmonella species were more prevalent in the wet season. Escherichia coli, faecal coliforms and Salmonella showed insignificant logarithmic reductions during both seasons, showing when the carrying capacities of Nsooba main channel and Lubigi sewage treatment plant systems were exceeded. Enterococcus species showed no reduction in both seasons, which implied continuous high in-stream contamination. Heterotrophs showed significantly higher logarithmic reduction during the wet season than in the dry season. This suggested a concentration reduction during the wet season and loading/increase in the dry seasons. Our research findings may be used by the public health sector to understand relationships between the occurrence of surface water quality microbiological indicators and the prevalence of diseases through strategic seasonal monitoring and evaluation in Kampala and the region.

How to cite: Byekwaso, F., Langergraber, G., Weigelhofer, G., Kaggwa, R., Kansiime, F., and Hein, T.: Impacts of natural and anthropogenic factors on microbiological water quality indicators along an urban riverine tropical wetland  , EGU General Assembly 2025, Vienna, Austria, 27 Apr–2 May 2025, EGU25-9005, https://doi.org/10.5194/egusphere-egu25-9005, 2025.

EGU25-9893 | Orals | BG4.3

Reproduction and morphological variability of Cyprideis torosa under different water temperatures and salinities in laboratory cultures 

Christopher Berndt, Matthias Nagy, Isolde Berger, Romana Melis, and Gianguido Salvi

Natural habitats consist of a large variety and variability of environmental factors. Reproduction in laboratory cultures is thus a highly effective way to pinpoint and quantify the impact of a specific environmental factor on a species which is hardly possible in natural environments.

The most common ostracod species in European marginal marine environments is Cyprideis torosa (Jones, 1850). It is a morphologically variable species but laboratory reproduction experiments of C. torosa are scarce and thus reducing an undisputed use of its morphological variability as a paleo-environmental proxy.

Although it is usually intended to use ostracod valves as paleo-thermometer, the nature of the impact of temperature on ostracods and on their morphology remains questionable. We aim to test whether temperature plays a significant role influencing the morphological characteristics of C. torosa in different salinities. In addition, laboratory cultures are a great opportunity to better understand the life cycle of ostracods, their reproduction times and juvenile numbers.

We collected samples from Marano Lagoon (Italy) at salinity levels of 7.2, 17.2 and 29.6 psu. For our experimental setup, we transferred boiled (= sterile) sediment (<150µm) from each of the newly established cultures in five crystallizing dishes, added lagoon water from each sampling location, and added 8 male and 12 female adult specimens of C. torosa. We placed one dish per salinity level in incubators at fixed 15, 20, 30 or 35°C and one outdoors. After finding at least 10 hatched juveniles, adult specimens were removed and remaining juveniles were raised to adulthood. Subsequently, we continued to check the abundance of juveniles and remove newly grown adults from the culture in monthly sievings. The morphological characteristics of the original and new adults were mutually compared.

The first results of our cultivation experiment suggest a rather stable reproduction rate at constant temperatures and salinities. The reproductive activity of C. torosa is highest in the lower saline cultures at 20 and 30°C and decreases with higher salinities as well as extreme low and high temperatures. First morphometric results indicate a phenotypic salinity-temperature modification of its size, ornamentation and shape.

How to cite: Berndt, C., Nagy, M., Berger, I., Melis, R., and Salvi, G.: Reproduction and morphological variability of Cyprideis torosa under different water temperatures and salinities in laboratory cultures, EGU General Assembly 2025, Vienna, Austria, 27 Apr–2 May 2025, EGU25-9893, https://doi.org/10.5194/egusphere-egu25-9893, 2025.

EGU25-10171 | ECS | Orals | BG4.3

The Impact of Seagrasses Disappearance on the Marine Phosphorus Cycle 

Neta Soto, Gilad Antler, and Avner Gross

Seagrasses are marine plants that play a crucial role in climate change mitigation through carbon sequestration. This process relies heavily on nutrients, e.g., phosphorus (P), which is often limiting in marine environments. However, the complex dynamics between seagrasses and P reservoirs remain poorly understood. Moreover, seagrasses are rapidly disappearing worldwide at alarming rates, making it crucial to study their impact on the marine P cycle, particularly in light of their decline. Here, we investigate P speciation in seagrass-influenced sediments, bioavailability, and transformations during seagrasses decomposition. The P distribution within the plant exhibits correlation with elongation as the young leaves contain more P than the old leaves, indicating the plant’s P allocation efficiency. This is further explored in decomposition experiments which reveal that aboveground biomass releases more P than belowground biomass. These findings underscore the critical influence of seagrass on P dynamics amid global seagrass decline.

How to cite: Soto, N., Antler, G., and Gross, A.: The Impact of Seagrasses Disappearance on the Marine Phosphorus Cycle, EGU General Assembly 2025, Vienna, Austria, 27 Apr–2 May 2025, EGU25-10171, https://doi.org/10.5194/egusphere-egu25-10171, 2025.

Current rising temperatures in the oceans change marine habitats and faunal compositions as well as physiological and metabolic processes in marine organisms. While thermal stress is potentially threatening existing benthic communities it can be advantageous for invasive species that are better adapted to high temperatures. One such example of a successfully expanding species is the symbiont-bearing large benthic foraminifera Amphistegina lobifera Larsen, 1976 originating from the Red Sea, that has spread throughout the coastal ecosystems of the eastern Mediterranean. Studies on A. lobifera have shown its high tolerance to increasing temperature with regards to survivorship and photochemistry in temperature ranges from 24 °C to 36 °C. Interestingly, little is known about the species’ actual metabolic and photosynthetic activity with respect to oxygen consumption and production under different temperatures, especially towards the lower boundaries of its optimal environment. This study addresses this gap with a quantitative assessment of A. lobifera’s respiration rates that also allows for better comparison with other species and environmental factors. Amphistegina lobifera was permanently cultivated in the laboratory at University of Vienna in artificial seawater (ASW) at 24 °C and 38 psu with a day:night light cycle of 8:16 hours and ~ 10 µmol photons/m²/s light intensity. A non-invasive method was used to analyse oxygen respiration rates. The method involved placing an Oxygen Sensor Spot in a small, 2 ml airtight glass vial filled with ASW alongside the foraminifera. Oxygen concentrations under dark and light conditions (~ 30 µmol photons/m²/s) at different temperatures (16 °C, 20 °C, 24 °C, 28 °C, 32 °C, 36 °C) were recorded. Seventeen cleaned, living specimens were measured in triplicate after a 24-hour acclimation period. Respiration rates, normalized for biovolume (µm³), ranged from 3.73 × 10⁻⁹ nmol O₂/µm³/h at 16 °C to 2.83 × 10⁻⁸ nmol O₂/µm³/h at 32 °C under dark conditions. Oxygen production under light conditions consistently exceeded consumption. Gross photosynthesis was lowest at 36 °C (1.45 × 10⁻⁹ nmol O₂/µm³/h) compared to the overall mean of 4.06 × 10⁻⁸ nmol O₂/µm³/h. These results will give further insights into the ecological impacts and the contribution to biogeochemical cycles of A. lobifera in future ocean environments. Furthermore, the method provides a robust approach for comparing respiration rates across species and isolating the effects of specific environmental factors on metabolic rates.

How to cite: Palme, T. and Nagy, M.: Quantifying respiration and photosynthesis rates in Amphistegina lobifera at different temperatures, EGU General Assembly 2025, Vienna, Austria, 27 Apr–2 May 2025, EGU25-10216, https://doi.org/10.5194/egusphere-egu25-10216, 2025.

EGU25-10385 | Posters on site | BG4.3

Changes in carbon isotope distribution in sediments of Lake Plateliai, Lithuania, over the last 130 years 

Rūta Barisevičiūtė, Jonas Mažeika, Jūrate Karosiene, Jūratė Kasperovičienė, Žilvinas Ežerinskis, and Justina Šapolaitė

The radiocarbon (14C) dating of lake sediments is widely used to estimate the so-called reservoir age (RA), i.e. the 14C age difference between the atmospheric and lake ecosystem carbon reservoirs. However, lake sediments are a mixture of autochthonous and various allochthonous carbon sources having distinct 14C specific activities. The RA depends on the catchment bedrock, CO2 exchange rates between water and the atmosphere, which are affected by organic carbon production and decomposition rates, inflow/outflow of organic and inorganic mater, water residence time, water level fluctuations, climate change, and other environmental factors impacting the lake’s catchment area. Every disturbance affecting carbon exchange between the water ecosystem, the terrestrial environment, and the atmosphere impacts carbon isotope distribution in the lake ecosystem.

Lake Plateliai is the largest lake in the north-western part of Lithuania (Samogitia). It is located on the territory of Samogitia National Park. The absence of cultivated fields on the park’s territory conditioned the lake to remain one of the cleanest in Lithuania. The present study focusses on sediment records from Lake Plateliai over the last 130 years. This time period is related to dam-induced lake’s water level fluctuations, increase/decrease in primary productivity due to intensive agricultural development since the 1960s, and its decline in the 1990s.

The aim of this work was to estimate how environmental factors have influenced the carbon cycle within the lake and how these impacts are recorded in sediments, i.e., changes in sedimentation rate, carbon isotope distribution among organic sediment fractions.

During the last 130 years, the radiocarbon reservoir age of the of the alkali soluble and alkali insoluble fractions of lake sediments has been reduced by 872.4 ±80 years, and a decreasing trend of 14C concentration values is recorded/observed in the upper layers. The14C specific activity values in both sediment organic fractions coincided during the last ten years and 1885-1932. However, changes in the water level during the period 1963-1976 and unknown events in 1939-1940 led to the introduction of allochthonous origin matter into the lake ecosystem, resulting lower 14C concentrations in the alkali soluble fraction compared to the alkali insoluble fraction.

How to cite: Barisevičiūtė, R., Mažeika, J., Karosiene, J., Kasperovičienė, J., Ežerinskis, Ž., and Šapolaitė, J.: Changes in carbon isotope distribution in sediments of Lake Plateliai, Lithuania, over the last 130 years, EGU General Assembly 2025, Vienna, Austria, 27 Apr–2 May 2025, EGU25-10385, https://doi.org/10.5194/egusphere-egu25-10385, 2025.

EGU25-10803 | Orals | BG4.3

A new approach for identifying catchment typologies based on phosphorus impact risks 

Per-Erik Mellander, Phil Jordan, Rachel Cassidy, Golnaz Ezzati, Jean Ortega, Marc Stutter, Magdalena Bieroza, Remi Dupas, Adrian Collins, Russell Adams, Kevin Hiscock, Richard Cooper, and Phil Haygarth

Phosphorus (P) transfer indices (Mobilisation index and Delivery index) were recently introduced to facilitate a standardized, systematic and objective method to evaluate P transfer and impact risks at the catchment scale. The method was developed from high-frequency hydro-chemo-metric data using ratios of high and low percentiles of P concentrations and mass loads. Using a large dataset from 23 catchments in North-western Europe, we present a pooled catchment approach to establish a relationship between the Mobilisation and Delivery indices with the catchments’ baseflow and flashiness indices with the objective to identify catchment P impact risk typologies. While hydrology largely controls P transfer, the deviation from this hydrological relationship highlighted the presence of other influences, such as intrinsic P retention and point source or legacy P controls. The method distinguishes the type of dominating mobilisation and delivery risk (runoff, point source and/or legacy P) and of intrinsic retention (poor solubility and/or poor hydrological connectivity).

The P mobilisation in 12 of the catchments was dominated by hydrological controls. Five other catchments, with large flat areas, high water storage capacity and/or with a high P sorption capacity, had a potential to retain 39% - 68% of reactive P (RP) corresponding to an annual retention of 0.02 - 0.32 kg RP/ha. The highest intrinsic P retention was in a karstic limestone spring contribution zone rich in calcium. Finally, six of the catchments manifested a varying degree of point source influences, which elevated the RP mobilisation by 16% -77% and corresponded to an annual loss of 0.02 – 0.12 kg RP/ha. While hydrological controls dominated P delivery in all catchments, two catchments manifested a P delivery reduced by 72% and 76% due to poor hydrological connectivity (0.02 and 0.12 kg RP/ha per year). Eight catchments had a higher Delivery index in relation to the Mobilisation index, and these catchments were those with above average hydrological flashiness. We propose that these catchments are, to a varying degree, influenced by legacy P (river scouring and/or resuspension of P). This highlights that mobilisation risk could be independent from delivery risk owing to the hydrological connectivity of the landscape.

The proposed approach can guide P pollution management by identifying and quantifying the underlying dominant impact risks within catchments. Identifying catchment typologies based on P risk classes can be further useful for scaling up and for understanding the additional pressures caused by climate and land use changes.

How to cite: Mellander, P.-E., Jordan, P., Cassidy, R., Ezzati, G., Ortega, J., Stutter, M., Bieroza, M., Dupas, R., Collins, A., Adams, R., Hiscock, K., Cooper, R., and Haygarth, P.: A new approach for identifying catchment typologies based on phosphorus impact risks, EGU General Assembly 2025, Vienna, Austria, 27 Apr–2 May 2025, EGU25-10803, https://doi.org/10.5194/egusphere-egu25-10803, 2025.

The Arctic Ocean is experiencing rapid environmental changes, with current warming rates exceeding the global average. This accelerated warming has triggered profound shifts in sea ice extent, thickness, and seasonal dynamics. As a result, these alterations impacted the timing of phytoplankton blooming, expanded open-water habitats, and modified the timing of primary production with far-reaching implications for benthic-pelagic coupling processes and benthic ecosystems. This study investigates benthic microfaunal communities, particularly benthic foraminifera (Rhizaria) and ostracoda (Crustacea), as they serve as sensitive indicators for contemporary Arctic conditions. Their distribution, abundance, and standing stocks reflect key factors such as organic matter availability, seasonal ice cover, and water mass properties (e.g., salinity and temperature). The materials for this study were collected during the expedition PS92 (ARK-XXIX/1) "TRANSSIZ" (Transitions in the Arctic Seasonal Sea Ice Zone, 19 May – 28 June 2015) aboard the German research icebreaker Polarstern. This six-week mission focused on early spring ecological and biogeochemical processes across the European Arctic margins. The study area covers the eastern flank of the Yermak Plateau and the northern continental slope of the Barents Sea. Sampling water depths ranged from 470 m to 1829 m. The four cores (PS92/19, PS92/27, PS92/31, PS92/39) were collected with a multiple corer (MUC) with an internal diameter of 10 cm (surface area 78,5 cm2). The MUC frame was equipped with a live broadcasting video system that transfers pictures to the ship via glass fibre cable. A Sanyo HD400P camera (10x optical zoom) captured images of under-ice fauna, marine snow in the water column, and phytodetritus originating from the spring blooms. Surface sediment samples were collected and analysed in the 63 and 125 μm size fractions to identify and characterise microfaunal communities. The results will provide a better understanding of how Arctic benthic ecosystems are adapting to a rapidly transforming environment. Additionally, current spring results will provide data that attempts to fill an existing gap in Arctic benthic foraminifera and ostracoda sampling.

How to cite: Faizieva, K., Wollenburg, J., Berndt, C., and Heinz, P.: Deep-sea living benthic foraminifera and ostracoda from the European Arctic margin and the Yermak Plateau during the spring phytoplankton blooms in the Arctic Ocean: distribution, abundance, and standing stocks, EGU General Assembly 2025, Vienna, Austria, 27 Apr–2 May 2025, EGU25-10942, https://doi.org/10.5194/egusphere-egu25-10942, 2025.

EGU25-11080 | ECS | Orals | BG4.3

Changes in spatial dissolved Fe and total Mn in a tropical river in Brazil: Influence of reservoirs with different operational dynamics 

Échily Sartori, Diego Lacerda, Cristiane dos Santos Vergilio, and Carlos Eduardo de Rezende

Brazil has 1,320 hydroelectric plants in operation, distributed throughout its territory. The construction of dams for water storage and energy generation causes significant changes in sediment transport and hydrological dynamics, affecting the biogeochemical cycle of various elements. In the Southeast region, the Paraíba do Sul River Basin (PSR) accounts for approximately 6% of these plants, making it a strategic area for studying the environmental impacts associated with reservoirs. To assess the impacts on physicochemical and elemental dynamics (i.e., Dissolved Oxygen “dO2”, pH, turbidity, dissolved Fe, and total Mn), this study analyzed three years (2021–2023) of water quality monitoring data along the main course of the river, covering four dams with different operational systems (Santa Branca and Funil: storage; Lavrinhas and Anta: run-of-river). The dO2 median concentration increased downstream, while turbidity, d-Fe, and t-Mn showed a decreasing trend. On the other hand, pH levels remained relatively stable, with little variation. However, near the dams, a decrease in dO2, pH, turbidity, and d-Fe concentrations was observed immediately downstream of the Santa Branca and Funil dams. Conversely, the Lavrinhas and Anta dams showed little or no influence on these variables. The upper region of the PSR is characterized by intense industrialization, which contributes to the deterioration of water quality variables in this section of the river. The reservoirs in the basin exhibit distinct dynamics, influencing the levels of these variables in different ways. Santa Branca and Funil are larger storage reservoirs with depths ranging from 20 to 40 meters, where intermediate and deep layers have distinct characteristics from surface waters, promoting hydrogeochemical changes at certain times of the year. These waters are generally more acidic and less oxygenated due to the decomposition of organic matter and the respiration of organisms. Additionally, these reservoirs promote particle deposition, contributing to reduced turbidity downstream. These conditions favor the release Fe and Mn from bottom sediments, increasing their dissolved concentrations in the water column. The availability of Fe and Mn, as well as other nutrients, increases the growth of macrophytes and phytoplankton productivity, generating large areas of eutrophication. This process reduces the dissolved fraction of these elements and consequently increases the particulate fraction. On the other hand, Lavrinhas and Anta are run-of-river reservoirs with shallower depths and little to no stratification in the water column, resulting in less significant changes in parameters downstream. However, even in run-of-river reservoirs, depth can influence variable dynamics. This is evident in the case of Anta, which showed an influence on Fe and Mn levels, highlighting that even smaller run-of-river reservoirs can impact the cycles of these elements. In conclusion, long-term studies on these reservoirs are essential, since over the years we have been reporting high concentrations of cyanobacteria with the potential to produce toxins, which has led to interruptions in water supply to the population.

How to cite: Sartori, É., Lacerda, D., dos Santos Vergilio, C., and Eduardo de Rezende, C.: Changes in spatial dissolved Fe and total Mn in a tropical river in Brazil: Influence of reservoirs with different operational dynamics, EGU General Assembly 2025, Vienna, Austria, 27 Apr–2 May 2025, EGU25-11080, https://doi.org/10.5194/egusphere-egu25-11080, 2025.

EGU25-13098 | ECS | Orals | BG4.3

The Role of Littoral Vegetation and Open Water Greenhouse Gas Fluxes on the Carbon Budget of Urban Stormwater Ponds 

Della Zhou, Fereidoun Rezanezhad, Stephanie Slowinski, Jovana Radosavljevic, and Philippe Van Cappellen

Stormwater ponds (SWPs) are a common stormwater management technology in new urban developments and have been suggested to be significant sources of the greenhouse gases (GHGs) carbon dioxide (CO2) and methane (CH4). However, they also sequester organic carbon and reduce the surface runoff of nutrients, hence, altering nutrient limitation patterns, trophic conditions, and GHG exchanges. Although numerous studies have focused on estimating open water GHG emissions in artificial ponds, there are limited studies that evaluate net carbon budgets of urban SWP systems comprehensively. In this study, we assessed the relative contributions of the littoral vegetation and open water GHG fluxes to the carbon budgets in two SWPs located in the City of Kitchener, Ontario, Canada. CO2 and CH4 fluxes were measured in the forebay and main basin of two SWPs draining catchments with two different catchment land use (residential versus industrial). Using vegetation and floating chambers, CO2 and CH4 fluxes were measured bi-weekly across all seasons, capturing Net Ecosystem Exchange (NEE), Ecosystem Respiration (ER), and Gross Ecosystem Production (GEP) from both bank and submerged vegetation, plus the diffusive and ebullitive fluxes from the open water surface. Additionally, key parameters, including photosynthetically active radiation (PAR), air and soil temperature, water pH, conductivity, and dissolved gas concentrations, were also measured. We observed significant differences in the fluxes between the littoral vegetation and open water surfaces. Carbon gas emissions from the open water surface were dominated by ebullitive CH₄ fluxes, with the open water acting as a net carbon source. Ebullition events occurred more frequently and with greater intensity in the forebay areas of the SWPs, contributing the most to open water carbon emissions. In contrast, carbon gas emissions from the vegetation were largely driven by photosynthesis and soil respiration, with the vegetated littoral zone functioning as a net CO2 sink. Different vegetation types exhibited varied responses to meteorological conditions, but all showed clear seasonal trends, with higher gas fluxes in summer due to increased biological activity, and minimal fluxes during the frozen season. Unlike vegetation, open water fluxes did not display a distinct seasonal trend; instead, they were primarily influenced by precipitation events and inflow runoff. The forebay of the industrial pond received higher carbon inputs from contaminated stormwater runoff, leading to greater sediment accumulation and elevated GHG fluxes, with frequent and high-intensity CH4 ebullition events being a notable feature. Our findings highlight the critical influence of land use, hydrological events, and seasonal cycles on the carbon balance of SWPs and their potential role in urban carbon cycling. 

How to cite: Zhou, D., Rezanezhad, F., Slowinski, S., Radosavljevic, J., and Van Cappellen, P.: The Role of Littoral Vegetation and Open Water Greenhouse Gas Fluxes on the Carbon Budget of Urban Stormwater Ponds, EGU General Assembly 2025, Vienna, Austria, 27 Apr–2 May 2025, EGU25-13098, https://doi.org/10.5194/egusphere-egu25-13098, 2025.

EGU25-13121 | ECS | Orals | BG4.3

Water quality and greenhouse gas emissions from degraded forest drainage ditches on peat soil  

Jürgen Sarjas, Margit Kõiv-Vainik, Kadir Yildiz, Isaac Okiti, Ilona Tamm, Mihkel Pindus, and Kuno Kasak

Draining land from excess water is a common practice in forestry to accelerate tree growth, but it has significant environmental implications, particularly in the case of peatland forests. Drainage exposes nutrient-rich peat soils to oxygen, triggering peat decomposition and mineralization, which leads to increased CO2 emissions from the soil and the leaching of solids, organic matter, and nutrients to water. While accelerated tree growth may partially offset CO2emissions, unmanaged drainage ditches are possible hotspots for greenhouse gas (GHG) emissions.  

This preliminary study monitors water quality and quantity, and GHG emissions in unmanaged ditches of four sub-catchments of a 507.6 ha peatland forest drainage system in western Estonia. Ditch reconstruction works will be done in the summer of 2025. To mitigate the negative impacts, ecological water protection measures - sedimentation ponds and hybrid systems combining ponds with treatment wetlands, are used. From July 2022, once per month, water temperature, dissolved oxygen content, electrical conductivity, pH, redox potential, and turbidity are measured onsite from ditches entering mitigation measures. From grab samples total suspended solids (TSS), total inorganic carbon, total organic carbon (TOC), dissolved organic carbon, total phosphorus (TP), phosphate-phosphorus, total nitrogen (TN), nitrite-nitrogen, nitrate-nitrogen, ammonium, sulfate, magnesium, calcium, chlorides, and total iron are analyzed in the laboratory. Flow rates monitored from the outflows of mitigation measures with V-weirs combined with automated water level loggers are the basis for the estimation of potential sediment and nutrient loads. From April 2023, monthly CH4 and CO2 fluxes were measured on four 0.6 km sections of unmanaged ditches entering mitigation measures with a floating chamber and portable LI-7810 trace gas analyzer. In addition, an extensive random mapping of GHG emissions from unmanaged ditches of the whole drainage system was conducted in May 2024. 

The median concentration (range presented in parenthesis) of TSS 10.0 (2.0-200), TOC 53.0 (28-81), TP was 0.032 (0.012-0.281), and TN 2.70 (0.78-14.0) mg L-1 are indicating that the studied ditches are a source of diffused water pollution, foremost for phosphorus. 

The median CH4 and CO2 flux emissions from unmanaged ditches entering mitigation measures were 0.30 (0.01-69.39) mg CH4-C m-2h-1 and 31.02 (0.39-644.38) mg CO2-C m-2h-1, respectively. The mapping resulted with median CH4 and CO2emissions of 1.40 (0.06-70.25, n=33) mg CH4-C m-2h-1 and 30.30 (-64.46-100.14, n=23) mg CO2-C m-2h-1. GHG emissions from unmanaged ditches show high seasonal variability, high emissions in summer, and relatively low mean emissions during autumn and spring.  

The performed monitoring gives unique information about the water quality and quantity, and GHG emissions in unmanaged ditches. This background data is the main input for evaluating the impact of reconstruction works of peatland forest ditches and the performance of mitigation measures.

How to cite: Sarjas, J., Kõiv-Vainik, M., Yildiz, K., Okiti, I., Tamm, I., Pindus, M., and Kasak, K.: Water quality and greenhouse gas emissions from degraded forest drainage ditches on peat soil , EGU General Assembly 2025, Vienna, Austria, 27 Apr–2 May 2025, EGU25-13121, https://doi.org/10.5194/egusphere-egu25-13121, 2025.

EGU25-13368 | Orals | BG4.3

Towards sustainable nutrient management along the Land-Sea continuum, an integrated modeling perspective 

Goulven G. Laruelle, Antoine Casquin, Vincent Thieu, Marie Silvestre, Arthur Capet, and Pierre Regnier

The Land-Ocean Aquatic Continuum (LOAC) plays a pivotal role in the transfer and transformation of carbon and nutrients from terrestrial systems to coastal waters, critically influencing coastal eutrophication resulting from excessive nitrogen (N) and phosphorus (P) loads from rivers compared to Silica (Si). Indeed, both agricultural practices on land and biogeochemical processes in and near streams as well as within estuaries control the eventual export of carbon and nutrients into the coastal sea. To address the complex interplay of biogeochemical processes that govern these transfers, an integrated modeling approach combining agricultural practices (GRAFS, an agri-food system model), river network and wetland processes (pyNuts-Riverstrahler modelling framework), and estuarine dynamics (C-GEM model) was applied across metropolitan France over the 2014–2019 period. The estuarine dynamics were modelled only where relevant, on 40 macro-tidal estuaries along the French Atlantic coast. This comprehensive framework explicitly quantifies the cascading fluxes of Dissolved Organic Carbon (DOC), and different forms of N, P and Si from headwaters to estuarine outlets. In addition, three different scenarios of agricultural practices modulating N diffuse inputs were designed and applied ranging from ‘business as usual’ to a switch towards ‘agroecology’. The modeling chain described above was applied to all watersheds larger than 300 km2 (n = 80) using reference conditions representative of the 2014-2019 period and validated by an extensive riverine database of 392,870 measurements from 929 stations.  

This integrated approach allows quantifying potential excess in nutrient export into the coastal seas compared to Redfield ratios between N, P and Si. Our simulations reveal that even under the most optimistic trajectories of nutrient reduction from agricultural practices, some coastal regions such as those flowing into the Celtic Sea will still experience nutrients exports above admissible values, despite in and near streams processes in rivers and estuaries typically removing 20-60% of the nutrient inputs from the land. Our results thus highlight the need for an integrated approach of nutrient management strategies encompassing terrestrial ecosystems, inland and coastal waters. Such an approach is needed to evaluate how these management strategies can help achieve sustainable water quality thresholds across the interconnected aquatic ecosystems of the LOAC.

How to cite: Laruelle, G. G., Casquin, A., Thieu, V., Silvestre, M., Capet, A., and Regnier, P.: Towards sustainable nutrient management along the Land-Sea continuum, an integrated modeling perspective, EGU General Assembly 2025, Vienna, Austria, 27 Apr–2 May 2025, EGU25-13368, https://doi.org/10.5194/egusphere-egu25-13368, 2025.

EGU25-13388 | ECS | Posters on site | BG4.3

Impact of headwater streams on N2O emissions from agricultural catchments 

Camille Vautier, Pratik Gokhale, Doralou Béraud, Rock S. Bagagnan, Barbara Yvard, Eliot Chatton, and Anniet Laverman

Mineral and organic fertilization is estimated to be responsible for 70% of N2O emissions worldwide, a greenhouse gas which is approximately 270 times more potent than CO2. N2O emissions occur during biogeochemical processes of the nitrogen cycle, which take place in the various compartments of the water cycle (soil, aquifer, hyporheic zone, streams, etc.). During the transport of nitrate in the aquifer, incomplete denitrification can produce N2O and lead to groundwater concentration of N2O higher than the atmospheric equilibrium concentration. As groundwater then discharges into streams, excess N2O can be released to the atmosphere7. N2O can also be produced through incomplete denitrification in the hyporheic zone.

The emission of N2O from a stream depends on the denitrification occurring in the contributing compartments but also of the rate of gas exchanges between the stream and the atmosphere. Recent studies have shown that small-scale streambed heterogeneities are hot spots for gas exchanges. Yet, they are not considered in empirical equations to calculate gas exchange rates. Empirical equations only consider global parameters of the stream (ex: slope, water velocity, depth) and overlook local hot spots for gas exchanges. This suggests that N2O emissions from headwaters could be underestimated. Since headwater streams drain about 70% of the land surface on Earth, underestimating their rule in N2O emissions may lead to a significant bias in the global estimation of N2O emissions from freshwater ecosystems.

Here we investigate the rule of headwaters in the global N2O emissions, in order to better characterize the N-cycle in headwaters and the associated greenhouse gas emissions. We measure N2O along various headwater streams in agricultural areas using gas chromatography coupled to electron capture detection (GC-ECD). We further perform in-situ monitoring of N2O on a few representative sites using a continuous flow membrane inlet mass spectrometer (CF-MIMS) which is brought to the field in a mobile laboratory. To trace the origin of N2O, measurements are coupled with other tracers (nitrate, nitrite, nitrogen isotopes, radon, dissolved silica, etc.). Results reveal a large oversaturation of N2O in agricultural headwater streams and allow to track the production and emissions of N2O along headwater streams. This research links the disruption of biogeochemical cycles to another largely crossed planetary boundary, global warming. It therefore addresses a crucial issue of ecological transition in rural areas, the use of fertilizers, from the global perspective of greenhouse gas emissions.

How to cite: Vautier, C., Gokhale, P., Béraud, D., Bagagnan, R. S., Yvard, B., Chatton, E., and Laverman, A.: Impact of headwater streams on N2O emissions from agricultural catchments, EGU General Assembly 2025, Vienna, Austria, 27 Apr–2 May 2025, EGU25-13388, https://doi.org/10.5194/egusphere-egu25-13388, 2025.

EGU25-13396 | ECS | Orals | BG4.3

Microbial control of sediment phosphorus release along a river-floodplain gradient 

Michele Meyer, Matthias Koschorreck, Markus Weitere, Daniel Graeber, David Kneis, and Nuria Perujo

Sediment phosphorus release, also referred to as internal loading,  typically delays the response of eutrophic waters to reductions in external nutrient inputs. Internal loading is particularly relevant in shallow waterbodies like floodplain lakes with high sediment-to-water ratios. Traditionally, sediment phosphorus release has largely been explained by the biogeochemical interactions of iron, phosphorus, and oxygen. However, in sediments with a limited availability of iron but high organic content, the direct release of phosphorus from microbial mineralisation is the major mechanism behind internal loading. This is particularly the case in floodplains where benthic microbial functional diversity and corresponding activity play a pivotal role in sediment phosphorus release. Lateral hydrological connectivity further modulates sediment nutrient fluxes and microbial processes by altering biogeochemical conditions. Although the importance of microbe-organic matter interactions for phosphorus dynamics has been recognised, they are often not considered when assessing sediment phosphorus release.

Here, we analyse the trajectory of potential sediment phosphorus release as well as dissolved carbon and nitrogen concentrations along a river-floodplain gradient of the River Elbe (Germany) from April to September 2024. Specifically, we link the dynamics of nutrients to dissolved organic matter quality and quantity, extracellular enzyme release, metabolic carbon diversity and further sediment biogeochemical parameters. Our findings reveal a general decrease in dissolved phosphorus concentrations from the river to the floodplain backwaters. However, in the periodically disconnected waterbody, we observed unexpectedly high soluble reactive phosphorus concentrations (~0.5 mg L⁻¹) following hydrological isolation, coinciding with elevated benthic extracellular phosphatase and β-glucosidase activity. Further linkages between the prevalent dissolved organic matter components, microbial mineralisation and microbial functional diversity were analysed and will be presented. Our results contribute to the mechanistic understanding of how microbial mineralisation processes modulated by hydrological connectivity shape sediment phosphorus release in river-floodplain systems.

How to cite: Meyer, M., Koschorreck, M., Weitere, M., Graeber, D., Kneis, D., and Perujo, N.: Microbial control of sediment phosphorus release along a river-floodplain gradient, EGU General Assembly 2025, Vienna, Austria, 27 Apr–2 May 2025, EGU25-13396, https://doi.org/10.5194/egusphere-egu25-13396, 2025.

EGU25-14264 | Posters on site | BG4.3

Development of pH Visualization Methods to Study Shell Formation in Juvenile Pearl Oyster Pinctada fucata 

Takashi Toyofuku, Yukiko Nagai, Michio Suzuki, and Takashi Atsumi

Biomineralization in pearl oysters (Pinctada fucata) is well-studied due to their economic value and research accessibility. Their shells comprise an outer calcite prismatic layer and an inner aragonite nacreous layer, presenting the classic calcite-aragonite polymorphism problem in biomineralization research. While molecular and genetic aspects of shell formation are increasingly understood, direct observation of formation mechanisms remains limited.

This study applied microscopic pH imaging techniques, previously successful in foraminifera research, to observe pH dynamics during shell development. Post-settlement individuals (shell length ~0.5 mm) from Mie Prefecture Fisheries Research Institute were examined using HPTS (pyranine) fluorescence microscopy. Observations revealed specific pH distributions, with elevated levels (~8.1 compared to ambient seawater ~7.7) parallel to growth lines near shell thickening areas, while soft tissue regions showed lower pH (<6.0), likely corresponding to digestive areas. These findings indicate active pH regulation during shell formation in bivalves.

Further research should investigate pH pattern responses to varying environmental conditions, particularly regarding climate change parameters. Studies of specific mechanisms creating these pH gradients and comparisons across developmental stages would enhance our understanding of biomineralization processes, benefiting both fundamental research and pearl cultivation practices.

How to cite: Toyofuku, T., Nagai, Y., Suzuki, M., and Atsumi, T.: Development of pH Visualization Methods to Study Shell Formation in Juvenile Pearl Oyster Pinctada fucata, EGU General Assembly 2025, Vienna, Austria, 27 Apr–2 May 2025, EGU25-14264, https://doi.org/10.5194/egusphere-egu25-14264, 2025.

River damming has altered riverine biogeochemical cycles, yet we still lack a mechanistic understanding of how modified hydrodynamic conditions reshape mainstream-tributary ecosystems, particularly the coupling between physicochemistry processes and phytoplankton functional groups in channel-type reservoirs. Here, through high-frequency sampling and multidimensional analysis of the Xiangjiaba Reservoir in the upper Yangtze River, China, we explored spatial heterogeneity of tributary ecosystems and its underlying mechanisms. Distinct spatial patterns emerged - while maintaining strong connectivity between mainstream and tributaries (connectivity index: 0.85), the inter-tributary connectivity remained notably weak (0.26-0.34). Intriguingly, adjacent tributaries (Xining and Zhongdu Rivers) developed markedly different ecological characteristics, whereas geographically distant tributaries (Zhongdu and Dawenxi Rivers) displayed unexpected ecological convergence, challenging conventional spatial distance-ecological similarity paradigms. This spatial heterogeneity was reflected in both biogeochemical processes and phytoplankton functional groups: restricted water exchange in tributaries may promote nutrient accumulation (TN: 1.35-1.45 mg/L), leading to distinct shifts in functional group composition (ρ = 0.574, p < 0.001). We identified a critical threshold in relative water column stability (RWCS = 5.111/m) beyond which bloom-forming functional groups became dominant. Temporal analysis revealed synchronized patterns where tributary algal biomass peaked when system connectivity reached its minimum (0.30) in May, highlighting the cascading effects from hydrodynamics to ecosystem functions. These findings provide fresh perspectives on tributary ecosystem heterogeneity in regulated rivers, with important implications for reservoir management under global change.

How to cite: Wang, X. and Sun, J.: Spatial heterogeneity of tributary ecosystems in a channel-type reservoir: Linking physicochemistry to phytoplankton functional groups, EGU General Assembly 2025, Vienna, Austria, 27 Apr–2 May 2025, EGU25-14379, https://doi.org/10.5194/egusphere-egu25-14379, 2025.

EGU25-14627 | ECS | Orals | BG4.3

On why the embankment matters when assessing greenhouse gas emissions from urban stormwater ponds 

Stephanie Slowinski, Della Zhou, Jovana Radosavljevic, Cynthia Bova, Hannah Weatherson, Md Abdus Sabur, Bowen Zhou, Fereidoun Rezanezhad, and Philippe Van Cappellen

Urban stormwater ponds (SWPs) are a common runoff control measure that can also have beneficial outcomes for water quality. However, pond emissions of greenhouse gases (GHGs), such as carbon dioxide (CO2) and methane (CH4), raise questions about the climate impact of SWPs. Here, we establish whole-system annual carbon budgets for two SWPs in the City of Kitchener, Ontario, Canada, to compare the open water CO2 and CH4 effluxes to other input and output fluxes of carbon. These include the fluxes of particulate and dissolved inorganic and organic carbon at the inlet and outlet points of the pond, plus those associated with the sediments accumulating in the ponds. In both SWPs, the open-water effluxes of CO2 and CH4 are small compared to the inflow, outflow, and burial carbon fluxes. The SWP sediment budgets further imply that a large fraction of the sediment accumulating in the ponds is supplied by erosion of the embankment. The accompanying delivery of soil organic matter, together with direct litter and organic detritus inputs from the vegetation surrounding the pond, serves as an important source of the open-water CO2 and CH4 emissions. The latter are therefore largely derived from atmospheric CO2 fixed by the ponds’ littoral and embankment vegetation. Consequently, although the SWPs open waters emit CO2 and CH4, the entire SWP engineered systems, including the embankment, act as net CO2 sinks. Overall, our results point to the potential to design and manage SWPs for enhanced climate change mitigation.

How to cite: Slowinski, S., Zhou, D., Radosavljevic, J., Bova, C., Weatherson, H., Sabur, M. A., Zhou, B., Rezanezhad, F., and Van Cappellen, P.: On why the embankment matters when assessing greenhouse gas emissions from urban stormwater ponds, EGU General Assembly 2025, Vienna, Austria, 27 Apr–2 May 2025, EGU25-14627, https://doi.org/10.5194/egusphere-egu25-14627, 2025.

Global atmospheric methane (CH4) emissions have risen significantly, tripling in atmospheric concentrations since preindustrial times. Wetlands, as the largest natural source of CH4 emissions, contribute significantly to the global CH4 budget. However, quantifying wetland CH4 emissions remains highly uncertain due to the complex interplay of hydrological and biogeochemical processes. In this study, we develop a random forest (RF) and SHapley Additive exPlanations (SHAP) framework to identify the main predictors of CH4 emissions across different climate zones and on a global scale. We used monthly global environmental variables and CH4 flux emissions from FLUXNET-CH4 dataset, incorporating 39 wetland sites over the globe. These sites are classified into tropical, temperate, and boreal regions by latitude. Key variables considered in the analysis included mineral-associated organic carbon, soil organic carbon, soil moisture, and canopy height. Our findings reveal that air temperature and latent heat are the most important predictors of CH4 at both global and regional scale. Regionally, tropical wetlands are primarily influenced by canopy height, water table level and soil organic carbon while soil temperature emerges as the dominant driver in temperate and boreal wetlands. Furthermore, we analyze the similarities and differences in CH4 predictors across climate zones to improve our understanding of regional and global wetlands CH4 dynamics. Understanding the main predictors of CH4 emissions across wetland regions is essential for improving CH4 budget accuracy on both regional and global scales.

How to cite: Rivas Pozo, E. and Kim, Y.: Identifying the main drivers of methane flux in wetlands using machine learning and FLUXNET data across climate zones, EGU General Assembly 2025, Vienna, Austria, 27 Apr–2 May 2025, EGU25-15443, https://doi.org/10.5194/egusphere-egu25-15443, 2025.

Benthic foraminifera are a group of protists that inhabit a diverse range of habitats from salt marsh meadows to the deepest sea. Recently, benthic foraminifera have been shown to intracellularly accumulate phosphate. Intracellular phosphate concentrations can be 100-1000 times higher than in the surrounding water. Phosphate is an important macronutrient in marine ecosystems and widely used as an industrial fertilizer, which is potentially leaked to the ocean. We show that phosphate storage in foraminifera is widespread and occurs in diverse environments such as tidal flats, hypoxic fjord basins, oxygen minimum zones and the Mid-Atlantic Ridge. The highest intracellular phosphate concentrations have been found in cells of the species Ammonia confertitesta from the German Wadden Sea. The total amount of intracellular phosphate stored in A. confertitesta in the Wadden Sea during a bloom is as high as ~5% of the annual consumption of phosphorus (P)-fertilizer in Germany. More detailed budget calculations for the Southern North Sea and the Peruvian oxygen minimum zone indicate that benthic foraminifera may buffer riverine P runoff for ~37 days at the Southern North Sea and ~21 days at the Peruvian margin. This indicates that these organisms are likely relevant for marine P-cycling. They potentially buffer anthropogenic eutrophication in coastal environments.

The intracellular phosphate storage seems to have diverse functions. Coupled TEM-EDS and cryo-SEM-EDS was used to map the intracellular phosphorous distribution in cells of the species Ammonia veneta and Bolivina spissa. Phosphorous accumulations were associated with round vesicles, possibly acidocalcisomes that are typically used to store polyphosphates in eukaryotic cells. The metabolic functions of these organelles can range from regulation of osmotic pressure and intracellular pH to calcium and energy storage. Foraminifera encode the genes required for both a polyphosphate, as well as a creatine phosphate metabolism. Creatine phosphate and polyphosphates are good energy carriers that can generate energy, when electron acceptors are depleted. Thus, storage of energetic P-compounds, such as creatine phosphate and polyphosphate, is likely also an adaptation of foraminifera to O2 depletion.

How to cite: Glock, N. and the Foram Phosphate Team: Widespread occurrence of phosphate storage in foraminifera might buffer anthropogenic eutrophication in coastal environments , EGU General Assembly 2025, Vienna, Austria, 27 Apr–2 May 2025, EGU25-16170, https://doi.org/10.5194/egusphere-egu25-16170, 2025.

EGU25-16261 | Posters on site | BG4.3

Machine Learning for identification and classification of Foraminifera: testing on monothalamids 

Alessandra Negri, Anna Sabbatini, Francesca Caridi, and Domenico Potena

Here we propose an AI-based approach using Machine Learning (ML) to assist species identification and reduce morphotype redundancy in the study of monothalamous foraminifera. In fact, this group of protists, is often overlooked in taxonomic studies due to their morphological simplicity and diversity. These single-celled organisms with "soft" tests are poorly studied, with only a few species identified, while many morphotypes remain undescribed. Taxonomic research on monothalamids is limited by challenges in identification, lack of fossilization, and the time-intensive nature of the work. This gap may lead to underestimating biodiversity and hinder detecting ecosystem degradation. Despite these challenges, monothalamids play key roles in marine ecosystems, making their diversity crucial for conservation and resource management. With this in mind, we analyzed images from the scientific literature, extracting key morphological traits, such as chamber shape, shell type, composition, and aperture type, through objective human annotation to build a dataset processed by ML algorithms. Clustering techniques, such as K-Means, revealed that basic shape, followed by shell type and composition, were the primary features distinguishing clusters. This approach enabled more objective morphotype classification, improving consistency and reducing human bias. These findings align with recent taxonomic revisions and demonstrate that applying unsupervised ML methods enhances species identification accuracy and streamlines the analysis of high-dimensional datasets.

How to cite: Negri, A., Sabbatini, A., Caridi, F., and Potena, D.: Machine Learning for identification and classification of Foraminifera: testing on monothalamids, EGU General Assembly 2025, Vienna, Austria, 27 Apr–2 May 2025, EGU25-16261, https://doi.org/10.5194/egusphere-egu25-16261, 2025.

EGU25-16513 | ECS | Posters on site | BG4.3

Manipulative temperature experiments with the foraminifer Sorites orbiculus using inoculated Symbiodiniaceae symbionts 

Adrian Schoerghofer, Lukas Theodor Timme, Sneha Manda, and Christiane Schmidt

The presence of algal symbionts in Large Benthic Foraminifera (LBF) facilitates the success of the group as important carbonate producers in the ocean. However, the symbiosis makes the holobiont more susceptible to heat stress. Modulating the foraminiferal host-symbiont relationship is one approach that could serve as an adaptation mechanism to elevated temperatures. Recently, a menthol-DCMU (3-(3,4-dichlorophenyl)-1,1-dimethylurea) bleaching method made investigations of host-symbiont combinations in foraminifera possible. Here, we performed a manipulative temperature experiment at three temperatures (25°C, 28°C, and 31°C) on the dinoflagellate-bearing Sorites orbiculus for two weeks. Before the experiment, specimens were menthol-DCMU bleached and inoculated with strains of Symbiodiniaceae (ITS2 strains: F2 sensu stricto, CCMP2467, and KB8) previously isolated from cnidarian hosts. Three controls, including untreated specimens, menthol-DCMU bleached specimens continuously treated with DCMU, and menthol-DCMU bleached specimens recovering in artificial seawater, were used. To assess the physiological impact of the treatments on the specimens, the survivorship and growth of the hosts, and the efficiency of photosystem II (Fv:Fm) of the symbionts were measured. Survivorship was between 75-100% based on PAM fluorescence values and light microscopy. Inoculated specimens with strain KB8 exhibited similar growth to the controls at 31°C. Contrastingly, strain CCMP2467 had lower growth than the controls at each temperature. Growth did not differ between the controls. PAM fluorometry revealed that photosynthetic yields (Fv:Fm) between the 25°C and 31°C treatments were not different between strains, while in the 28°C treatment, strain CCMP2467 showed low photosynthetic activity, indicating stress in the photosystems. Contrary to our expectations, menthol-DCMU bleached individuals continuously treated with DCMU, exhibited similar growth rates as untreated holobionts. The results suggest that S. orbiculus can sustain growth between a temperature range of 25°C to at least 31°C independently of a functional symbiosis. Further investigations are needed to gain insights into the host-symbiont relationship, the potential of its modulation as an adaptation mechanism to elevated temperatures, and the role of symbionts in the growth and calcification of foraminifera.

How to cite: Schoerghofer, A., Timme, L. T., Manda, S., and Schmidt, C.: Manipulative temperature experiments with the foraminifer Sorites orbiculus using inoculated Symbiodiniaceae symbionts, EGU General Assembly 2025, Vienna, Austria, 27 Apr–2 May 2025, EGU25-16513, https://doi.org/10.5194/egusphere-egu25-16513, 2025.

EGU25-16543 | ECS | Orals | BG4.3

Changing precipitation patterns affect nitrate input to and subsequent cycling in a subalpine lake 

Daniela V Machado, Astrid Harjung, Yuliya Vystavna, Stefan Terzer-Wassmuth, Martin J Kainz, and Leonard Wassenaar

Subalpine lakes are highly sensitive ecosystems that respond rapidly to variations in temperature, precipitation, and hydrological inputs triggered by climate change. These lakes are typically oligotrophic, and the availability of nutrients is highly dependent on nutrient loads with rainfall and runoff and further controlled by in-catchment processes. Altered precipitation patterns, rising (water) temperatures, and ice- and snow-free winters can significantly impact these ecosystems' water balance, stratification, and nutrient dynamics. Understanding these processes is critical, as small environmental changes can affect their biogeochemical cycles and biological communities. Although the effects of warming on subalpine lakes are recognized, the magnitude by which climate change impacts the water balance and nutrient dynamics in these ecosystems remains uncertain. Moreover, subalpine lakes, as part of the headwater catchment, impact water and nutrient availability downstream. In this context, water stable isotopes provide essential insights into the hydrological processes, helping to understand the water balance and mixing processes of lakes. Long-term data from subalpine Lake Lunz, Austria, indicate a decrease in nitrate concentrations (N−NO3) during the past decade. This study investigates the spatiotemporal patterns of N−NO3 and stable water isotopes (δ18O−H2O and δ2H−H2O) during two hydrometeorological cycles. Samples were collected monthly from the inflow, outflow, epi-, meta-, and hypolimnion of the lake. Preliminary results showed that precipitation and snowmelt during spring significantly influenced lake water levels and nitrate inputs. Stable water isotope analyses revealed seasonal isotopic stratification, with higher values of δ18O−H2O in the epilimnion during summer following an isotopically enriched signal from the catchment. The hypolimnion exhibited stable isotopic values of water with minimal variation, suggesting limited vertical mixing. Nitrate concentrations in the inflow and the epilimnion were higher in winter and spring, coinciding with depleted isotopic values from the water molecule and suggesting snow melt as an essential source of N−NO3. On the other hand, the hypolimnion showed increased nitrate concentrations as stratification persisted and dissolved oxygen levels declined, possibly due to remineralization of organic matter from the thick layer of fine sediment at the bottom of the lake. These findings indicate the need to study the sensitivity of lake nutrient dynamics to variations in hydrological inputs during climate change.

How to cite: Machado, D. V., Harjung, A., Vystavna, Y., Terzer-Wassmuth, S., Kainz, M. J., and Wassenaar, L.: Changing precipitation patterns affect nitrate input to and subsequent cycling in a subalpine lake, EGU General Assembly 2025, Vienna, Austria, 27 Apr–2 May 2025, EGU25-16543, https://doi.org/10.5194/egusphere-egu25-16543, 2025.

EGU25-17878 | Orals | BG4.3

Fluocopée® probe deployment in the Seine river (France): Towards high-frequency in situ monitoring of aquatic environments using fluorescence spectrometry 

Antoine Raoult, Angélique Goffin, Vivien Raymond, Flavien Desbourdes, Metehan Yilmaz, Rania Krimou, Jérémy Mougin, Sabrina Guérin-Rechdaoui, Vincent Rocher, Sylvie Thibert, and Gilles Varrault

      Over the past two decades, there has been a notable advancement in the development of high-frequency measuring equipment for the monitoring of biophysical and chemical parameters in surface water. Optical probes, especially fluorescence probes, are of particular importance in the integration of high-frequency measurements into environmental monitoring. The joint development of the Fluocopée® probe by LEESU and SIAAP represents a further contribution to this dynamic. This innovative fluorescence probe is capable of monitoring temporal evolution of 25 fluorophores in situ at high frequency (every 15 minutes), thereby enabling the characterization of dissolved organic matter (DOM). The extensive range of fluorophores monitored by the Fluocopée® probe facilitates the monitoring of water quality and the investigation of the biogeochemical processes linked to DOM in aquatic environments. Furthermore, its sensitivity is compatible with the levels of OM concentration observed in continental aquatic environments.


      Since October 2023, several Fluocopée® probes have been implemented on the river Seine and its two main tributaries (the Marne and Oise rivers) at six sites upstream and downstream of the Paris conurbation (see Figure 1). This allows us to assess the spatial variability of organic matter in the river Seine across the Paris conurbation at a high temporal frequency and provides a valuable opportunity to enhance our comprehension of the organic matter biogeochemical dynamics in the river Seine as well as to assess the impact of urban pressures. The installation of Fluocopée® probes at sites already equipped (as part of the MeSeine monitoring system or drinking water treatment plants intakes) with numerous measuring devices has been shown to facilitate the interpretation of fluorescence data by providing supplementary information from the chronicles of other physicochemical parameters (pH, turbidity, dissolved O2, TSS, Abs254nm, fecal indicator bacteria etc.). 


      Furthermore, proxies for determining dissolved organic carbon (DOC) and its biodegradable fraction on the basis of fluorescence measurements have been developed in our laboratory. The development of these models was achieved by identifying the most suitable existing correlation between these physiochemical parameters and fluorescence measurements using various statistical algorithms (e.g., multilinear regressions, partial least squares regressions, machine learning algorithms, etc.). Used in association with Fluocopée®, these proxies provide estimation of these parameters at high frequency in addition to fluorescence measurements.


      The fluorescence, DOC and biodegradable DOC concentration measurements acquired at high frequency over a year using our monitoring system will be presented and discussed. The influence of the hydroclimatic situation and the impact of urban pressures on the organic matter dynamics in the Seine across Paris Conurbation will be assessed. Additionally, it will provide a detailed account of the methodology employed to process these data sets, from the initial acquisition of raw data to its subsequent validation.

Figure 1 : Implantation of Fluocopée® probes

How to cite: Raoult, A., Goffin, A., Raymond, V., Desbourdes, F., Yilmaz, M., Krimou, R., Mougin, J., Guérin-Rechdaoui, S., Rocher, V., Thibert, S., and Varrault, G.: Fluocopée® probe deployment in the Seine river (France): Towards high-frequency in situ monitoring of aquatic environments using fluorescence spectrometry, EGU General Assembly 2025, Vienna, Austria, 27 Apr–2 May 2025, EGU25-17878, https://doi.org/10.5194/egusphere-egu25-17878, 2025.

EGU25-20020 | ECS | Orals | BG4.3

Ostracoda and Foraminifera as indicators of anthropogenic impacts – case studies from Sub-Saharan Africa 

Olga Schmitz, Mauro Alivernini, Lailah Gifty Akita, Jemma Finch, Trevor Hill, Torsten Haberzettl, and Peter Frenzel

Rising sea levels and intensifying storms, as a consequence of a changing climate, impact our coastal ecosystems. This impact is exacerbated by human-induced pressures which include: organic and contaminant pollution by agricultural activities, industry, urban sewage, and traffic threatening ecosystems and its services, and increasing human populations.

Within the two studied regions of Ghana and South Africa there is a paucity of effective water quality monitoring data, management, and strategies. With the changing climate and rising water demands, it is critical to maintain and restore water bodies to ensure their sustainable future. To achieve this objective, one of the methods is to apply bioindicators. Today, there is a growing global interest in using bioindicators for water quality monitoring, which can provide valuable insights into environmental conditions by analyzing the abundance, and species and population composition of bioindicator populations. Bioindicators provide an integrated and sensitive approach to environmental monitoring by capturing the cumulative effects of contaminants over time, and by revealing indirect biotic effects and bioaccumulation that may be missed by traditional chemical and physical measurements.

We present the first comprehensive investigation of marginal marine Ostracoda and Foraminifera in Ghana, shedding light on their ecology and distribution in western Africa. Elevated Foraminiferal Abnormality Index (FAI) values correlate with high heavy metal concentrations and variable salinity, suggesting pollution-induced abnormalities. Certain taxa, such as Quinqueloculina sp., Ammonia sp., and Cyprideis remanei dominate in contaminated areas, due to their tolerance to various pollutants. This study reveals a positive correlation between organic matter content and faunal diversity, contrary to typical pollution-diversity trends, likely influenced by salinity and allochthonous inputs. Heavy metal concentrations exceed thresholds near settlements, indicating significant anthropogenic pollution. Despite the pollution, higher diversity is observed, particularly in sites with marine-like salinity, suggesting complex responses to mixed effects to salinity or hydrographical effects and heavy metals.

Furthermore, we conducted a study on the uMlalazi river, South Africa, where, despite previous assumptions regarding the river’s pristine condition, we found high pollution, emphasizing the need for a continuous monitoring strategy. For assessing pollution and ecological health, we focused on Foraminifera and Ostracoda. We identified 17 ostracod species and 19 foraminifer species. Three distinct assemblages correlated with varying salinity and Pollution Load Index (PLI) levels. Our findings support the common trend of reduced species diversity with increased pollution. FAI correlated with PLI, showing that malformations where predominantly anthropogenically driven. Geochemical analysis indicated significant anthropogenic pressure, with elevated concentrations of heavy metals, sulphur, and microplastics from human induced activities such as sugarcane farming, urban sewages, fish farming and unknown sources.

Our studies emphasize the potential of Ostracoda and Foraminifera as indicators of environmental pressure and stresses, and a call for a more complete datasets to establish clearer correlations between meiofaunal associations and pollution effects.

How to cite: Schmitz, O., Alivernini, M., Akita, L. G., Finch, J., Hill, T., Haberzettl, T., and Frenzel, P.: Ostracoda and Foraminifera as indicators of anthropogenic impacts – case studies from Sub-Saharan Africa, EGU General Assembly 2025, Vienna, Austria, 27 Apr–2 May 2025, EGU25-20020, https://doi.org/10.5194/egusphere-egu25-20020, 2025.

EGU25-20615 | Orals | BG4.3

Modeling Benthic Foraminiferal Diversity in the Arabian Gulf: Species Distribution and Environmental Controls in a Basin-Wide Assessment 

Abduljamiu Amao, Khalid Al-Ramadan, Michael Kaminski, and Fabrizio Frontalini

Using extensive datasets of benthic foraminiferal occurrences, we investigate spatial patterns of species diversity across the Arabian Gulf and assess how environmental gradients influence these distributions through species distribution modeling approaches. We evaluate the effectiveness of stacked species distribution models in predicting foraminiferal diversity patterns and identifying potential diversity hotspots across the Arabian Gulf basin. We compiled a comprehensive dataset of benthic foraminiferal occurrences from published literature and public databases, encompassing more than 492 species from nine orders. Using an ensemble of species distribution models, we predict the spatial patterns of individual species and stack these predictions to estimate foraminiferal species richness across the basin. We validated model predictions using independent datasets and assessed the relative importance of environmental variables. Our stacked species distribution models showed high performance (mean AUC > 0.94, TSS > 0.8, Kappa > 0.82), revealing a clear north-south gradient in foraminiferal species richness. The highest diversity was observed in the northern part of the Gulf, contrasting with typical latitudinal diversity gradients. Bathymetry and dissolved oxygen emerged as primary drivers of foraminiferal distributions (10.50% and 8.55% contribution respectively), followed by iron concentration and salinity. The eastern part of the Gulf displayed higher diversity compared to the western regions, likely reflecting the influence of the counterclockwise circulation pattern. Our study provides the first basin-wide assessment of benthic foraminiferal diversity in the Arabian Gulf, revealing complex spatial patterns and environmental relationships. The models' ability to delineate species-specific niches and environmental gradients enables efficient prediction of species responses to climate-driven changes. This approach establishes a robust baseline for monitoring ecosystem shifts and offers valuable insights for both paleoenvironmental reconstructions and future targeted studies in this extreme marine environment.

How to cite: Amao, A., Al-Ramadan, K., Kaminski, M., and Frontalini, F.: Modeling Benthic Foraminiferal Diversity in the Arabian Gulf: Species Distribution and Environmental Controls in a Basin-Wide Assessment, EGU General Assembly 2025, Vienna, Austria, 27 Apr–2 May 2025, EGU25-20615, https://doi.org/10.5194/egusphere-egu25-20615, 2025.

EGU25-21176 | Posters on site | BG4.3

First detection of azaspiracid-2 in shellfish from the Croatian coast of the Adriatic Sea 

Romana Roje-Busatto, Ivana Ujević, Antonija Bulić, Stjepan Orhanović, Ivana Pezelj, and Tanja Bogdanović

Due to the ubiquitous anthropogenic and climatic changes altering the marine habitat and ecology of biotoxin producers, the aim of this study was to assess the risk of human consumption associated with the accumulation of lipophilic toxins in the commercially important bivalve mollusc (mussel Mytilus galloprovincialis Lamarck, 1819) in the Krka River estuary located in the central part of the Croatian Adriatic Sea coast. Shellfish samples were collected weekly at three sampling stations during 2024, with a focus on monitoring lipophilic biotoxins. This study confirmed the first occurrence of the azaspiracid biotoxin, namely azaspiracid-2 (AZA-2), in shellfish from the Croatian part of the eastern Adriatic Sea coast. However, the toxicity only occurred in the first five months of the investigated year, as no AZA-2 toxin could be detected in shellfish sampled after May. Shellfish soft tissue samples were subjected to liquid chromatography–mass spectrometry (LC–MS) analysis to determine the presence of okadaic acid, dinophysistoxins, pectenotoxins, azaspiracids, yessotoxins and spirolides. The presence of lipophilic toxins in the samples was confirmed by comparing the retention times in the chromatograms and the fragmentation spectra with those of certified reference materials from the National Research Council, Canada. In particular, levels of azaspiracid-2 in the range of 0.03 -146.90 µg/kg were determined. The highest AZA-2 concentrations were found in the January samples. Thereafter, the concentrations showed a decreasing trend until the end of May, when they were no longer detected for the rest of the year. The concentration of this toxin was below the maximum permitted level in all samples in accordance with the EU regulation. Azaspiracids (AZAs) are a group of polyether compounds with a spirocyclic structure that can cause symptoms such as nausea, vomiting, diarrhoea and stomach cramps in humans. This is the first report on the occurrence of AZA-2 in the Croatian part of the Adriatic Sea and proves that the occurrence of lipophilic biotoxins needs to be further investigated and monitored in order to protect public health, but also with regard to aquaculture activities and their socio-economic benefits.

How to cite: Roje-Busatto, R., Ujević, I., Bulić, A., Orhanović, S., Pezelj, I., and Bogdanović, T.: First detection of azaspiracid-2 in shellfish from the Croatian coast of the Adriatic Sea, EGU General Assembly 2025, Vienna, Austria, 27 Apr–2 May 2025, EGU25-21176, https://doi.org/10.5194/egusphere-egu25-21176, 2025.

Despite far-reaching legal regulations and extensive management measures, nitrogen and phosphorus are still elevated in many river systems causing the degradation of ecosystems and the failure to achieve good ecological status following the EU-WFD. Our study analyzes the long-term change in nitrogen surpluses, and quantifies the denitrification rates as well as the residence time in soil and groundwater. The goal is to assess the effect and the time lag of management measures and to evaluate the achievability of environmental goals, e.g. EU-WFD or EU-MSFD. 

The calculations were carried out with a completely revised version of the widely applied nutrient emission model “MONERIS” with a resolution of 1 km x 1 km on a monthly basis from 2003 to 2020 for all German rivers including their hydrologically connected catchment areas in neighboring countries. The runoff and residence times were modeled using an integrated precipitation-runoff model and the retention processes in soil and groundwater were calculated via a coupled three-layer denitrification module, based on soil characteristics such as pH, soil texture, soil temperature, leakage water concentration. The effect of oxygen-reduced conditions in soils is represented by the water saturation.

The residence time in the soil ranges usually between a few days and a month, with local peaks of up to several months. The residence time in groundwater shows strong spatial variations. It ranges between less than 5 years and more than 100 years, however, for the N-balance history, a maximum of 50 years was taken into account. Although longer residence times generally lead to higher total denitrification, the rates are strongly controlled by local site characteristics such as pH value, N leachate concentration and soil texture. 

Due to the highly variable denitrification rates (< 1 – 92 kg/ha/yr, mean 44.1 kg/ha/yr), nitrogen emissions vary despite resulting from similar N surpluses. However, the proportions of the emission pathways surface runoff, interflow, and groundwater determined both the total emissions due to different denitrification rates as well as the resulting average lag time between fertilizer application and nutrients entering a surface water. Locally, the total residence time as mean over all pathways is determined by the proportions of runoff components and the respective residence times involved. Whereas areas with a high proportion of direct runoff and sealed urban areas react within months or even days, the lag time in surface waters results as a runoff-weighted average of local residence time in its upstream reaches.

The management to reach environmental quality goals and the need to rapidly reduce N surpluses and N concentrations in surface waters require comprehensible links between reduction measures and their effects on concentrations in surface waters. Our results indicate that the efficiency of measures to reduce nutrient concentrations in surface waters should not be assessed solely on the basis of the quantitative reduction potential, but also taking into account the time component. This also opens up the possibility of achieving a higher level of acceptance among the public and politicians if the time delays are known and considered during implementation.

How to cite: Venohr, M. and Oprei, A.: Implications of nitrogen legacy on the effectiveness of management measures in central European river catchments, EGU General Assembly 2025, Vienna, Austria, 27 Apr–2 May 2025, EGU25-21186, https://doi.org/10.5194/egusphere-egu25-21186, 2025.

EGU25-343 | ECS | Posters on site | BG4.6

The role of sediments in modulating nitrous oxide production in the Southern Benguela Upwelling System: insights from stable isotopic tracers 

Sina Wallschuss, Julie Granger, Annie Bourbonnais, Raquel Flynn, Jessica Burger, Keshnee Pillay, and Sarah Fawcett

The ocean accounts for ~20 to 30% of global nitrous oxide (N2O) emissions, with coastal upwelling systems estimated to contribute disproportionately to the sea-air flux of this potent greenhouse gas. To resolve the mechanisms of and controls on N2O production in coastal upwelling systems, we measured the concentration and nitrogen and oxygen isotopic composition of N2O (δ15N-N2O and δ18O-N2O) along a cross-shelf transect in the Southern Benguela Upwelling System. At the shelf bottom, N2O concentrations increased from the outer shelf towards the shore (11 to 32 nM) inversely to dissolved oxygen (182 ± 17 to <1 μM) and in concert with the remineralization tracers, Apparent Oxygen Utilization (AOU; 108 ± 21 to 221 ± 33 μM) and Nitrogen (N)-deficit (up to 20.4 μM). These observations suggest that both nitrification and denitrification may be involved in N2O production on the SBUS shelf. The δ15N-N2O confirms both processes as potential N2O sources on the shelf, with high δ18O-N2O values (≤ 57.2‰) specifically implicating the sediments as the primary N2O source to the water column. Isotopic changes across the shelf delineate three discrete domains, each with distinct N2O sources. Sedimentary nitrification dominates N2O production on the midshelf, while coupled nitrification-denitrification or direct denitrification explains N2O production on the inner-shelf. At the shallow inner-shelf, where oxygen concentrations are depleted, both water column and sedimentary denitrification account for the production and partial consumption of N2O. This study uncovers the disproportionate contribution of  sedimentary N cycling to N2O production on the SBUS shelf.

How to cite: Wallschuss, S., Granger, J., Bourbonnais, A., Flynn, R., Burger, J., Pillay, K., and Fawcett, S.: The role of sediments in modulating nitrous oxide production in the Southern Benguela Upwelling System: insights from stable isotopic tracers, EGU General Assembly 2025, Vienna, Austria, 27 Apr–2 May 2025, EGU25-343, https://doi.org/10.5194/egusphere-egu25-343, 2025.

EGU25-920 | ECS | Orals | BG4.6

Estimation of Greenhouse Gas Emissions from Ganga River Sediment, India 

Pooja Upadhyay, Jai Prakash Verma, Sanjeev Kumar Prajapati, and Amit Kumar

Greenhouse gas production in riverine sediments is extensively influenced by the aerobic and anaerobic breakdown of organic matter and the processes of nitrification and denitrification. These processes are further enhanced by nitrogen-rich organic substrates in the sediments, which produce potent GHGs such as Methane (CH4) and Nitrous Oxide (N2O). While extensive research has been conducted on terrestrial ecosystems, little attention is given to estimating GHG emissions from riverine sediments. In this context, an incubation study was conducted to estimate the emissions of CH4 and N2O from sediment samples collected from the Ganga River at three locations representing varied environmental conditions: the urban area, city outskirts, and an agricultural area. Samples were taken during the winter (wet season) and summer (dry season) to assess seasonal emission variations. The study observed a wide range in the daily production of CH4, varying from 0.51 μg g-1d-1 to 3.82 μg g-1d-1 across the sampling sites (S1, S2, and S3). The highest CH4 production was observed during the summer (March) season at the urban periphery (S1), indicating that warmer temperatures and increasing microbial activities during the dry season may enhance CH4 emissions. Similarly, the daily N2O production ranged from 1721.37 μg g-1d-1 to 2024.57 μg g-1d-1, with the highest N2O emissions occurring at S3 during the summer season. N2O production is driven primarily by the microbial reduction of nitrates in anoxic conditions, and higher nitrogen inputs from fertilizers at the agricultural site likely amplify denitrification, leading to elevated N2O emissions. Moreover, the significant positive correlation of CH4 production with Total Organic Carbon (TOC), C/N ratio and Electrical Conductivity (EC), while N2O with EC, pH, and Water Temperature (TW) confirms the crucial role of environmental variables in GHG emissions. These findings highlighted the substantial role of riverine sediments as sources of GHG emissions, which are often understated in national/global GHG inventories. Riverine sediments, particularly in regions influenced by human activities, are significant in the global carbon budget. The study emphasizes incorporating riverine sediments in future GHG emission models and inventories, especially in the context of climate change mitigation strategies. In addition, more comprehensive studies are required to understand the GHG dynamic in these environments and their impact on global climate change. 


How to cite: Upadhyay, P., Verma, J. P., Prajapati, S. K., and Kumar, A.: Estimation of Greenhouse Gas Emissions from Ganga River Sediment, India, EGU General Assembly 2025, Vienna, Austria, 27 Apr–2 May 2025, EGU25-920, https://doi.org/10.5194/egusphere-egu25-920, 2025.

EGU25-1226 | ECS | Posters on site | BG4.6

How does climate change impact aquatic net community production? - A novel mesocosm 

Desiree Burckin and Luca Telesca

Understanding the biological processes of natural ecosystems is integral to predict their responses to anthropogenic climate change and increasingly extreme climate events. Our ability to quantify net primary production (NPP) is key to better understand community food web structure and carbon sequestration. Traditional ex situ and discrete laboratory experiments, using Winkler incubation methods, provide limitations when accounting for the complex biological processes that occur in aquatic ecosystems. Current in situ chamber approaches are limited in their physical scope. Previous experiments have measured primary productivity in flora using benthic enclosures, as well as spatially discrete geochemical changes in the water columns by using either the Eulerian or Lagrangian fluid motion models. This work shows a non-invasive two-chambered mesocosm, coupled with an equilibrator and a weather station, to accurately calculate levels of net primary production, gross primary productivity (GPP) and total respiration (R) in aquatic communities. Equilibrator data allowed us to calculate daily changes in pCO2, and their correlation with NPP, GPP, and R. A three-day deployment measured r trends that were consistent with expected diurnal natural cycles, demonstrating that our novel mesocosm is a reliable non-invasive method to measure NPP, GPP, and R in aquatic ecosystems. This tool also may provide a standardized approach to quantify marine community productivity and it can be deployed for longer periods of time to understand the trends between NPP and anthropogenic climate change. This study is part of a larger effort to explore how climate change is impacting net community production.

How to cite: Burckin, D. and Telesca, L.: How does climate change impact aquatic net community production? - A novel mesocosm, EGU General Assembly 2025, Vienna, Austria, 27 Apr–2 May 2025, EGU25-1226, https://doi.org/10.5194/egusphere-egu25-1226, 2025.

EGU25-1353 | Orals | BG4.6

ELM-Wet: A new wet-landunit patch-level approach for modeling carbon and methane fluxes from wetlands 

Gil Bohrer, Theresia Yazbeck, Justine Missik, Jorge Villa, Madeline Scyphers, Robert Bordelon, Diana Taj, Oleksandr Shchehlov, Yang Ju, Kelly Wrighton, Eric Ward, Qing Zhu, Hyunyoung Oh, Benjamin Sulman, and William Riley

We intoduce the development of a new wetland-focused version of the Energy’s Exascale Earth System Model (E3SM) Land-surface Model (ELM). The updated version, ELM-Wet, activates a separate wet-landunit for simulation of wetlands. This Wet-landunit handles multiple eco-hydrological functional type patches. We introduced wetland-specific hydrology through prescribing site-level (whole wetland) constraints on surface water elevation and including a patch-level characteristic maximal inundation depth that enables resolving different sustained inundation depth for different patches, and if data exists, prescribing inundation depth at the site and patch levels. We modified the calculation of methane transport through palnt aerenchyma based on observed conductance for different vegetation types. We use BOA, a new Bayesian Optimization toolpack, to parameterize the processes controlling CO2 and CH4 fluxes in the wetland landunit. Site-level simulations of a coastal freshwater wetland in Louisiana (US-LA2) were performed with the updated model. Eddy covariance observations of CO2 and CH4 fluxes from 2012-2013 were used to train the model. Flux data from 2021 were used for validation. Patch-specific chamber flux observations and observations of CH4 concentration profiles in the soil porewater from 2021 were used for evaluation of the model performance in terms of soil concentration profiles at the patch level. Our results show that ELM-Wet with BOA optimization was able torepresent inter-daily and seasonal CO2 and CH4 fluxes and concentration dynamics across the wetland’s eco-hydrological patches.

How to cite: Bohrer, G., Yazbeck, T., Missik, J., Villa, J., Scyphers, M., Bordelon, R., Taj, D., Shchehlov, O., Ju, Y., Wrighton, K., Ward, E., Zhu, Q., Oh, H., Sulman, B., and Riley, W.: ELM-Wet: A new wet-landunit patch-level approach for modeling carbon and methane fluxes from wetlands, EGU General Assembly 2025, Vienna, Austria, 27 Apr–2 May 2025, EGU25-1353, https://doi.org/10.5194/egusphere-egu25-1353, 2025.

EGU25-1516 | Posters on site | BG4.6

Greenhouse Gas Emissions from Agricultural Ditches in the North China Plain 

Zhifeng Yan and Zhengkui Ge

Agricultural ditches are pervasive in agricultural areas and are potential greenhouse gas (GHG) hotspots, since they directly receive abundant nutrients from neighboring farmlands. However, few studies measure GHG concentrations or fluxes in this particular waterbody, likely resulting in underestimations of GHG emissions from agricultural regions. Here we conducted seasonal field studies to investigate the GHG concentrations and fluxes from agricultural ditch systems in the North China Plain. The results showed that almost all the ditches were large GHG sources, and their concentration were higher than that in the rivers connecting to the ditch systems. Nutrient input was the primary driver stimulating GHG production and emissions, resulting in GHG concentrations and fluxes increasing from rivers to collector ditches as the ditch systems approached farmlands and potentially received more nutrients. Overall, this study demonstrated that agricultural ditches were hotspots of GHG emissions, and future GHG estimations should incorporate this ubiquitous but underrepresented waterbody. 

How to cite: Yan, Z. and Ge, Z.: Greenhouse Gas Emissions from Agricultural Ditches in the North China Plain, EGU General Assembly 2025, Vienna, Austria, 27 Apr–2 May 2025, EGU25-1516, https://doi.org/10.5194/egusphere-egu25-1516, 2025.

Rivers are important sources of the carbon dioxide (CO2) released into the atmosphere; however, research on CO2 fluxes from riverine headwater regions is sparse, particularly from rivers from in the Tibetan Plateau (TP) region, which has large glaciers and permafrost. We conducted a three-year (2020–2022) observational study of CO2 fluxes from the riverine headwater region of the Qilian Mountains (QLMs) to determine diurnal and seasonal CO2 variations and fluxes. Our results revealed that the annual average CO2 emission was 0.45 (0.03–1.60) kg m–2 yr–1, with the highest fluxes observed in winter [0.87 (0.08–2.67) μmol m–2 s–1], which was approximately three times higher than fluxes in other seasons. Glacier meltwater altered the diurnal pattern of riverine CO2 fluxes by diluting CO2 and dissolved inorganic carbon. Meanwhile, CO2 release from rivers in the permafrost region was dictated by river order, with a linear decrease as river order increased. Considering diurnal and seasonal variations, the total CO2 fluxes from the headwater regions of the QLMs were approximately 39.57 (30.04–50.21) Gg C yr–1, representing 76% of the pre-calibration fluxes. This study provides essential insights into CO2 release from headwaters, which have substantial implications for understanding CO2 outgassing.

How to cite: Shang, X.: Riverine Carbon Dioxide Release in the Headwater Region of the Qilian Mountains, Northern China, EGU General Assembly 2025, Vienna, Austria, 27 Apr–2 May 2025, EGU25-1795, https://doi.org/10.5194/egusphere-egu25-1795, 2025.

Due to complexity, inland water carbon (C) cycling processes have a significant impact on the C source-sink status of terrestrial ecosystems over short-term (days, months, and years), long-term (decades, centuries, and millennia), and geological timescales. This has a determining effect on the C source-sink stability status of inland waterbodies. In such waterbodies, stable C source-sink processes primarily include terrestrial biosphere production, lithospheric organic carbon (OC) oxidization, rock weathering, and riverine C transport. Conversely, metabolic C processes have an unstable effect on the C source-sink status of inland waterbodies. Moreover, these inland water processes may cause significant C sink underestimations, which relevant studies have largely ignored. A new means to account for this “missing C” in inland waterbodies is an in-depth understanding of the metabolic C processes and associated driving effects of biological regulation mechanisms on the C source-sink status. This new approach can help us to more accurately quantify the global ecosystem C budget. The purpose of this study is threefold: (i) to clarify metabolic C processes and associated biological regulation mechanisms in inland waterbodies; (ii) to systematically analyze C cycling processes and associated C source-sink effects in inland waterbodies; (iii) to reveal driving mechanisms of metabolic C processes on C source-sink stability in inland waterbodies. This will allow us to gain a better understanding into how to more accurately calibrate C source-sink functions globally. It will also provide an in-depth understanding of the role that terrestrial ecosystems play in C neutralization under global climate change.

How to cite: Gao, Y., Wang, M., and Sun, K.: Metabolic inland water carbon cycling processes and associated biological regulation mechanisms that drive shifts in unstable carbon sources and sinks, EGU General Assembly 2025, Vienna, Austria, 27 Apr–2 May 2025, EGU25-1989, https://doi.org/10.5194/egusphere-egu25-1989, 2025.

EGU25-2515 | ECS | Orals | BG4.6

Carbon fluxes under the littoral wet-dry continuum of natural shallow lakes 

Jérémy Mayen, Marco Bartoli, Sara Benelli, Vincent Bertrin, Bianca Lecchini, Qwilherm Jan, and Cristina Ribaudo

Lacustrine littoral zones are generally considered as carbon (C) sources towards the atmosphere because oxygen availability in sediments and dissolved organic matter stimulate bacterial respiration and carbon dioxide (CO2) emissions. On the contrary, pelagic zones can promote methane (CH4) emissions linked to anoxic conditions in sediments. These processes can be disrupted by aquatic primary production or by CH4 oxidation. In the context of climate change and anthropogenic water withdrawals, long-lasting droughts will significantly increase the exposure to the air of lake littoral zones, that likely accelerating the organic matter decomposition and C emissions. In this study, we assess net ecosystem uptake and emission from C fluxes at the scale of two natural shallow lakes (SW of France) related to hydroperiod. CO2 and CH4 fluxes were measured seasonally by terrestrial and floating chambers in the littoral zone on soils exposed to the air under different conditions (presence or absence of vegetation, sands or organic sediments, degree of water saturation) and in the pelagic zone according to the depth. Our results reveal significant variations in C fluxes along the littoral wet-dry continuum, that underlying the relevance of considering the lacustrine littoral zone for obtaining comprehensive carbon budgets, especially within climate changing scenarios.

How to cite: Mayen, J., Bartoli, M., Benelli, S., Bertrin, V., Lecchini, B., Jan, Q., and Ribaudo, C.: Carbon fluxes under the littoral wet-dry continuum of natural shallow lakes, EGU General Assembly 2025, Vienna, Austria, 27 Apr–2 May 2025, EGU25-2515, https://doi.org/10.5194/egusphere-egu25-2515, 2025.

EGU25-2719 | ECS | Orals | BG4.6

Methanogenic Rates in Sediments Explain Long-Term Trends on Spatial and Seasonal Variation of CH4 Cycling in the Littoral Zone of Lake Constance 

Katharina Julia Kiefel, Armando Sepulveda Jauregui, Frank Peeters, Lea Loraine Ropella, Hilmar Hofmann, and Karla Martinez Cruz

Lakes are significant sources of the greenhouse gas methane (CH₄) to the atmosphere, with littoral zones recognized as hotspots for CH₄ emissions. However, the specific pathways driving the enrichment of CH₄ in the littoral zones of lakes remain poorly understood, contributing to uncertainties in global lake CH₄ budgets. To address this gap, our study investigates the role of littoral sediments as the main source of dissolved CH₄ in lakes and the drivers behind the high yet variable CH₄ concentrations in the water column along the different seasons. We specifically focus on the impact of temperature fluctuations on methanogenic rates in sediments over different seasons.

The CH₄ dynamics in lake sediments exhibit significant spatial variability driven by differences in sediment properties. In this study, we aimed to explain the seasonal variability of dissolved CH₄ concentrations in the water column by linking them to sediment fluxes, which are driven by methanogenic activity within the sediments. To achieve this, we conducted seasonal field campaigns in Lake Constance, Germany, during 2024 and complemented them with data obtained ten years ago. We measured sediment-to-water CH₄ fluxes, dissolved CH₄ concentrations in water and sediments, and potential methanogenesis rates under varying temperature conditions in sediment cores from diverse littoral sites. Stable isotope analysis of CH₄ and CO₂ provided further insights into the origin and fate of methane from the sediments into the water column.

Our findings reveal that CH₄ cycling varies spatially across sites and among seasons, as expected, yet long-term trends remain relatively stable over several years despite short-term seasonal fluctuations. Methanogenic rates represent a good proxy for explaining the spatial heterogeneity of CH₄ dynamics in the littoral zone and remain as the main source of littoral dissolved CH4. These results highlight the importance of site-specific and seasonal variations in regulating CH₄ cycling in Lake Constance, providing valuable insights into the drivers of CH₄ dynamics in lake littoral zones.

How to cite: Kiefel, K. J., Sepulveda Jauregui, A., Peeters, F., Ropella, L. L., Hofmann, H., and Martinez Cruz, K.: Methanogenic Rates in Sediments Explain Long-Term Trends on Spatial and Seasonal Variation of CH4 Cycling in the Littoral Zone of Lake Constance, EGU General Assembly 2025, Vienna, Austria, 27 Apr–2 May 2025, EGU25-2719, https://doi.org/10.5194/egusphere-egu25-2719, 2025.

EGU25-3208 | ECS | Posters on site | BG4.6 | Highlight

Globally elevated greenhouse gas emissions from polluted urban rivers 

Wenhao Xu and Xinghui Xia

Cities are at the heart of global anthropogenic greenhouse gas (GHG) emissions, with rivers embedded in urban landscapes as a potentially large yet uncharacterized GHG source. Urban rivers emit GHGs due to excess carbon and nitrogen inputs from urban environments and their watersheds. Here relying on a compiled urban river GHG dataset and robust modelling, we estimated that globally urban rivers emitted annually 1.1, 42.3 and 0.021 Tg CH4, CO2 and N2O, totalling 78.1 ± 3.5 Tg CO2-equivalent (CO2-eq) emissions. Predicted GHG emissions were nearly twofold those from non-urban rivers (~815 versus 414 mmol CO2-eq m−2 d−1) and similar to scope-1 urban emissions in intensity (1,058 mmol CO2-eq m−2 d−1), with particularly higher CH4 and N2O emissions linked to widespread eutrophication and altered carbon and nutrient cycling in urban rivers. Globally, the emissions varied with national income levels with the highest emissions happening in lower–middle-income countries where river pollution control is deficient. These findings highlight the importance of pollution controls in mitigating urban river GHG emissions and ensuring urban sustainability.

How to cite: Xu, W. and Xia, X.: Globally elevated greenhouse gas emissions from polluted urban rivers, EGU General Assembly 2025, Vienna, Austria, 27 Apr–2 May 2025, EGU25-3208, https://doi.org/10.5194/egusphere-egu25-3208, 2025.

Eutrophic lakes are considered as an important source of methane (CH4) to the atmosphere. However, the prediction for CH4 emission from lakes with different trophic states under warming is still enigmatic. Here, we found temperature dependence of diffusive methane emissions was lower in phytoplankton-dominated zone than that in macrophyte-dominated zone in two typical shallow lakes. Furthermore, an investigation on twenty lakes from the middle and lower reaches of Yangtze River showed that diffusive CH4 flux was significantly higher in summer than that in winter, with the ecosystem-level Q10 ranged from 0.77 to 3.94 and significantly decreased with increasing phytoplankton. This indicates that eutrophication reduces temperature dependence of diffusive methane emissions in freshwater lakes. When the view extends to diffusive CH4 emission in global lakes, the estimation regarding temperature dependence as a constant in the past overestimated global methane release for 2.3%-30% under warming for 1-2 °C. This weak positive feedback of CH4 emission suggests that climate warming may have a lesser exacerbating effect on atmospheric CH4 concentrations than predicted.

How to cite: Li, B.: Eutrophication reduces temperature dependence of diffusive methane emissions in freshwater lakes, EGU General Assembly 2025, Vienna, Austria, 27 Apr–2 May 2025, EGU25-5579, https://doi.org/10.5194/egusphere-egu25-5579, 2025.

EGU25-5790 | ECS | Orals | BG4.6

Significant spatial heterogeneity and distinct determinants of N2O emission in Pearl River Estuary, China 

Yue Dong, Xiang Cheng, Shengrui Wang, Shangbin Xiao, and Chenghao Wang

Estuaries play a crucial role in the global nitrous oxide (N2O) budget, but significant uncertainties remain in estimating their emissions due to anthropogenic impacts, particularly wastewater discharge. Using advanced high-resolution, real-time measurements, this study reveals that the Pearl River Estuary is a substantial N2O emission source, estimated at 1.05 Gg yr-1 (range: 0.92-1.23 Gg yr-1) with pronounced spatial heterogeneity. Wastewater discharge significantly enhances emissions by introducing abundant nutrients, altering carbon-to-nitrogen stoichiometry, and stimulating biochemical processes. A meta-analysis further demonstrates that nitrogen inputs from wastewater widely increase N2O emissions in global estuaries, though emission factors are considerably lower than IPCC estimates due to biological saturation. These findings highlight the need for refined emission factor estimates through comprehensive bottom-up studies to better understand estuarine contributions to the global N2O budget.

How to cite: Dong, Y., Cheng, X., Wang, S., Xiao, S., and Wang, C.: Significant spatial heterogeneity and distinct determinants of N2O emission in Pearl River Estuary, China, EGU General Assembly 2025, Vienna, Austria, 27 Apr–2 May 2025, EGU25-5790, https://doi.org/10.5194/egusphere-egu25-5790, 2025.

EGU25-6281 | ECS | Posters on site | BG4.6

Dynamic Regulation of Nutrient Stoichiometry and Greenhouse Gas Mitigation through Blue-Carbon Restoration in Xiaohai Lagoon, Hainan—China's Largest Tropical Lagoon   

Xin Quan, Ya Zhuang, Yang Wang, Chunwei Fu, Ying Huang, Shimin Xiao, Shunsi Wang, Huan Mi, Huidan Yang, Bin Chen, Fengying Li, Min Xu, Lifang Wang, Yongkai Chang, Xiaojun Li, Chuanjun Du, Jianan Liu, Ehui Tan, Jianzhong Su, and Shuh-ji Kao

Marine nutrient cycling, particularly of carbon (C), nitrogen (N), phosphorus (P), and silicon (Si), is intricately linked to phytoplankton metabolism, with the Redfield ratio (106:16:1, extended to 15–20 for Si) traditionally serving as a benchmark for nutrient stoichiometry. However, tropical coastal ecosystems experience significant spatial and temporal heterogeneity due to anthropogenic activities, geographic variability, and seasonal shifts, exacerbating imbalances in carbon and nutrient dynamics.

Blue-carbon ecosystems, as a "natural solution," offer the potential to mitigate eutrophication and acidification. These highly productive systems can transform CO₂ sources into carbon sinks, contributing to carbon neutrality and improving coastal ecosystem resilience. Xiaohai Lagoon, the largest lagoon in Hainan, China, represents a successful case study of blue-carbon restoration. Over three years of comprehensive restoration measures, including large-scale seagrass and seaweed planting, the lagoon achieved Class I water quality through substantial government investment.

Using high-resolution field surveys and real-time water quality monitoring, this study demonstrates how blue-carbon ecosystems dynamically regulate lagoon health through in situ metabolism. During the rainy season (October–December), blue-carbon species rapidly absorbed excess nutrients from land sources, and by November, shifted nutrient dynamics from nitrogen (N) limitation to phosphorus (P) limitation. This transformation converted the lagoon from a CO₂ emission source to a CO₂ sink through photosynthesis. During this process, the combined CO₂ equivalents of three typical greenhouse gases—CO₂, CH₄ (methane), and N₂O (nitrous oxide)—turned negative, −617 g CO₂e m⁻² annually under mean conditions and up to −1,800 g CO₂e m⁻² annually under optimal conditions, underscoring the substantial role of blue-carbon systems in mitigating climate change. In addition, dissolved oxygen (DO) levels increased (107%–136%), and acidification was alleviated (pH 8.41 ± 0.14). However, the decomposition of organic matter from declining blue-carbon species disrupted stoichiometry and caused water quality to deteriorate again, underscoring the critical need for sustained ecological governance.

Our findings highlight the pivotal role of blue-carbon restoration in regulating offshore nutrient stoichiometry, mitigating greenhouse gas fluxes, and enhancing coastal ecosystem health.  Scaling these results to 10 Hainan lagoons reveals a mitigation potential of ~310,000–500,000 tons CO₂e annually. These insights provide a scientific foundation for advancing Hainan’s ecological civilization pilot zone and offer practical strategies for global coastal management and achieving carbon neutrality.

How to cite: Quan, X., Zhuang, Y., Wang, Y., Fu, C., Huang, Y., Xiao, S., Wang, S., Mi, H., Yang, H., Chen, B., Li, F., Xu, M., Wang, L., Chang, Y., Li, X., Du, C., Liu, J., Tan, E., Su, J., and Kao, S.: Dynamic Regulation of Nutrient Stoichiometry and Greenhouse Gas Mitigation through Blue-Carbon Restoration in Xiaohai Lagoon, Hainan—China's Largest Tropical Lagoon  , EGU General Assembly 2025, Vienna, Austria, 27 Apr–2 May 2025, EGU25-6281, https://doi.org/10.5194/egusphere-egu25-6281, 2025.

EGU25-7104 | ECS | Posters on site | BG4.6

Drivers of stream-microbial cycling and greenhouse gas dynamics across a land-use gradient 

Sophie Comer-Warner, Wilfred Wollheim, and Ashley Bulseco

Catchment land-use has multiple impacts on streams affecting water quality, organic matter quantity and microbial community structure and function, which are key drivers of biogeochemical cycling and greenhouse gas fluxes. While previous studies have examined effects of land-use on stream greenhouse gas emissions, few have considered these together with microbial community structure and function or the connectivity between streams, their sediments and nearby riparian zones. Here, we examined microbial communities, dissolved organic carbon quantity and quality, and nutrient concentrations as drivers of greenhouse gas fluxes in headwater streams. We investigated potential greenhouse gas fluxes from streambed sediments and adjacent riparian zone sediments, as well as in-situ, surface water greenhouse gas concentrations, in 16 headwater streams across a land use gradient (categorised by percent agriculture, residential, industrial, and human development) in Massachusetts, USA. We found that riparian and streambed sediments at paired locations had different responses to land-use and that different greenhouse gases had different responses to land-use diversity. This work underscores the importance of combining microbial and biogeochemical measurements, especially in highly connected and complex systems that experience human-driven impacts across scales, to further understanding of whole corridor greenhouse gas fluxes.

How to cite: Comer-Warner, S., Wollheim, W., and Bulseco, A.: Drivers of stream-microbial cycling and greenhouse gas dynamics across a land-use gradient, EGU General Assembly 2025, Vienna, Austria, 27 Apr–2 May 2025, EGU25-7104, https://doi.org/10.5194/egusphere-egu25-7104, 2025.

EGU25-7678 | ECS | Orals | BG4.6

Summer droughts amplify the diel CO2 variations in temperate rivers 

Peifang Leng, Michael Rode, and Matthias Koschorreck

As droughts become more frequent, understanding their impact on diel CO2 variations in river ecosystems—particularly at sub-daily scales—becomes increasingly crucial. To explore diel CO2 fluctuations and carbon dynamics at fine temporal scales, we deployed in situ sensors to monitor CO2 concentrations in two rivers in Germany during both non-drought and drought summers, aiming to quantify how drought affects sub-daily CO2 dynamics.

Our results show that summer drought significantly amplifies diel CO2 amplitude, with increases of 62% in the stream and 24% in the river under drought conditions. However, daily mean CO2 concentrations did not differ significantly between drought and non-drought summers. Shallower water depths are the main cause of the amplified diel CO2 fluctuations, which reduce gas exchange and ecosystem respiration. Specifically, a 43% decrease in water depth in the stream and 44% in the river resulted in 13% and 25% reductions in gas exchange, respectively, and a corresponding 26% and 57% decline in ecosystem respiration.

These findings suggest that diel CO2 amplitude is more sensitive to changes in water depth than to the increased radiation and temperature associated with drought. Our study highlights the vulnerability of shallow rivers to drought and underscores the importance of high-frequency CO2 monitoring to capture sub-daily variations more accurately. As droughts become more frequent, single daily measurements may become highly uncertain, making high-frequency monitoring essential for improving CO2 emission estimates.

How to cite: Leng, P., Rode, M., and Koschorreck, M.: Summer droughts amplify the diel CO2 variations in temperate rivers, EGU General Assembly 2025, Vienna, Austria, 27 Apr–2 May 2025, EGU25-7678, https://doi.org/10.5194/egusphere-egu25-7678, 2025.

EGU25-7903 | ECS | Posters on site | BG4.6

Control and contribution of methylotrophic methanogenesis to methane production in coastal sediments 

Qiao Liu, Bingzheng Wu, Fengping Wang, and Guang-Chao Zhuang

Methylotrophic methanogenesis was recently recognized as a key process in driving cryptic methane cycling within sulfate-reducing sediments. In this study, we conducted biogeochemical analyses of methanogenic substrates, activity, and communities in two sediment cores (4−5 m) from the East China Sea, to constrain the dynamics and control of methylotrophic methanogenesis in coastal sediments. We detected micromolar concentrations of methane in the presence of sulfate and high methane concentrations (up to 4.2 mM) below the sulfate-methane transition zone (SMTZ, ~150-170 cm). The stable isotope composition of methane was strongly depleted (−77 to −91‰), indicating the biological production. Methanogenic substrates including H2/CO2, acetate, and methylated compounds were detected in the porewaters and/or sediments. Radiotracer experiments indicated methane production from various substrates, and the presence of sulfate did not inhibit methanogenesis at either site. At the coastal site with the dominance of marine organic matter (TOC: 0.4%; C/N ratio: ~6; δ13C-TOC: −22‰), methane was primarily produced from hydrogenotrophic methanogenesis, consistent with the progressive enrichment of 13C in dissolved inorganic carbon with depth below the SMTZ. However, methylotrophic methanogenesis from methanol and trimethylamine contributed significantly to methane production (up to 30.2%) at the estuarine site (TOC: 0.5%; C/N ratio: 7.4, δ13C-TOC: −23‰) with elevated terrestrial organic matter input, also reflected from the predominance of long chain odd carbon n-alkanes. These findings suggested that organic carbon source and composition, instead of sulfate, control methanogenic activity, providing evidence that high terrestrial organic inputs could significantly enhance methylotrophic methanogenesis in coastal sediments.

How to cite: Liu, Q., Wu, B., Wang, F., and Zhuang, G.-C.: Control and contribution of methylotrophic methanogenesis to methane production in coastal sediments, EGU General Assembly 2025, Vienna, Austria, 27 Apr–2 May 2025, EGU25-7903, https://doi.org/10.5194/egusphere-egu25-7903, 2025.

EGU25-8267 | Posters on site | BG4.6

Ship-based methodologies to investigate methane emissions from abandoned wells and natural sources: a case study from the Dutch North Sea 

Ilona Velzeboer, Arjan Hensen, Pim van den Bulk, Harmen van Mansom, Geert de Bruin, Henk de Haas, Annalise Delre, Henko de Stigter, Martin Wilpshaar, Helge Niemann, and Gert-Jan Reichart

Methane is commercially exploited at continental margins (worldwide/globally) from drilled wells. Typically, these are sealed with concrete once exploitation becomes commercially unprofitable. However, such wells may leak methane to the overlying water column and potentially to the atmosphere. Tailored towards the shallow water depth of the Dutch EEZ (Exclusive Economic Zone) of the North Sea, we developed four ship-based methods to detect methane in the water column or to measure methane emissions from the sea surface to the atmosphere.

1. Online measurements of methane in the water column. Water from a few meters above the seabed was pumped up via a weighted hose (“SLURF”) and the concentration and composition of gases in the water (CH4, C2H6, N2O, CO2 and CO) were measured with a laser spectrometer.

2. Floating chamber to quantify the flux of CH4 coming from the water phase into the atmosphere. Trace gases in the sampled air from a custom build floating chamber for offshore measurements were transported in a closed loop to the same laser spectrometer as the water phase measurements for concentration measurements. A known amount of a tracer gas was added to the return line with a controlled flow to estimate fluxes.

3. Gradient measurements. A 3D sonic anemometer and a frame equipped with three inlets positioned at three heights above sea level were mounted at the ship’s portside. Gradient measurements for determining gas emissions were conducted by using a valve system that alternated between the inlets, allowing to measure CH4, CO2 and CO at each height with a gas analyzer for 5 min intervals.

4. Plume measurements. The multibeam (MBES) was used to detect the bubble plumes and to detect the exact location where the bubble plume exit the water (exit point). Fluxes of bubble plumes from the water column to the atmosphere were then assessed by sailing downwind of the bubble plumes with the gradient system facing towards the exit point upwind. Emission rates were then determined by using a Gaussian plume model.

In this presentation, we will show preliminary data sets collected with these methods showing that bubble plumes rising from the seabed can be indicated next to dissolved methane and we will provide estimates of methane fluxes from individual bubble plumes into the atmosphere.

How to cite: Velzeboer, I., Hensen, A., van den Bulk, P., van Mansom, H., de Bruin, G., de Haas, H., Delre, A., de Stigter, H., Wilpshaar, M., Niemann, H., and Reichart, G.-J.: Ship-based methodologies to investigate methane emissions from abandoned wells and natural sources: a case study from the Dutch North Sea, EGU General Assembly 2025, Vienna, Austria, 27 Apr–2 May 2025, EGU25-8267, https://doi.org/10.5194/egusphere-egu25-8267, 2025.

EGU25-8378 | ECS | Orals | BG4.6

Mapping of carbon dioxide and methane sea-air fluxes in coastal, shallow waters of the Stockholm archipelago, Baltic Sea 

Thea Bisander, John Prytherch, and Volker Brüchert

Shallow coastal waters play a crucial role in the global carbon cycle through the sea-air exchange of greenhouse gases such as carbon dioxide (CO2) and methane (CH4). These regions are hotspots for both sequestration and emission of these gases; however, their contributions to global and regional budgets remain poorly quantified. Understanding the spatial and temporal variability of CO2 and CH4 exchange in coastal waters is essential for refining our knowledge of the climate system, especially as these systems face increasing anthropogenic pressures that may significantly alter their gas dynamics. Here, we present findings on CO2 and CH4 fluxes from seven shallow (<6 m) sampling locations in the Stockholm archipelago, Baltic Sea. These locations represent four distinct habitat groups – macroalgae on pebbles/bedrock, sand, macrophyte communities, and reed beds – and were monitored across a full annual cycle using the floating chamber method. In the summer months, most habitats acted as CO2 sinks, with the highest uptake recorded in the pebbles/bedrock habitat in July (-937 ± 161 mg m-2 d-1). During autumn and winter, however, all habitats shifted to CO2 emission, peaking in the reed beds in October with an efflux of 1757 ± 328 mg m-2 d-1. Annually, five of the seven locations exhibited net CO2 emissions. Further, all habitats were year-round sources of CH4, with average monthly diffusive emissions ranging from 0.1 ± 0.01 mg m-2 d-1 to 26 ± 1.5 mg m-2 d-1. The fluxes generally followed a seasonal pattern, with higher emissions in summer and lower emissions in winter. Ebullition fluxes were observed in all habitats except the pebbles/bedrock, with monthly fluxes reaching up to 249 mg m-2 d-1 and contributing between 20 and 98% of the total annual CH4 flux in the locations where it occurred. Upscaling the CO2 and CH4 fluxes over waters < 6 m in the Stockholm archipelago (680 km2) rendered CO2-equivalent fluxes for a 100-year timescale ranging between -0.04 and 0.3 Tg CO2-eq yr-1, where 80% of the uncertainty from flux variability could be attributed to CH4. These findings suggest that CH4 plays a much larger role in the sea-air exchange of carbon-based greenhouse gases than previously estimated in northern, temperate coastal waters.

How to cite: Bisander, T., Prytherch, J., and Brüchert, V.: Mapping of carbon dioxide and methane sea-air fluxes in coastal, shallow waters of the Stockholm archipelago, Baltic Sea, EGU General Assembly 2025, Vienna, Austria, 27 Apr–2 May 2025, EGU25-8378, https://doi.org/10.5194/egusphere-egu25-8378, 2025.

EGU25-8448 | Orals | BG4.6

China’s lakes shifted from a CO2 source to a sink over two decades 

Qitao Xiao, Juhua Luo, Tianci Qi, and Hongtao Duan

China’s lakes are globally significant and have experienced widespread changes, however, how they shift their roles in CO2 emissions over time remains elusive due to a shortage of time series data. We took advantage of two national lakes surveys to calculate the CO2 partial pressure (pCO2) and quantify the CO2 emissions during two time periods (1988-1992 and 2007-2010). Lakes across China have shifted from a substantial CO2 source (2.748 Tg C yr-1) to a minor sink (-0.408 Tg C yr-1), advocated by the fact that pCO2 was halved from 709 μatm to 332 μatm. This shift was predominantly caused by increased primary production in eutrophic lakes, decreased external loadings in organic carbon-rich lakes, and expanded water volume in endorheic lakes. This nationwide CO2 source-sink transition highlighted the roles of multiple mechanisms in altering CO2 flux in lakes, calling for a comprehensive investigation of multiple environmental changes in assessing CO2 dynamics.

How to cite: Xiao, Q., Luo, J., Qi, T., and Duan, H.: China’s lakes shifted from a CO2 source to a sink over two decades, EGU General Assembly 2025, Vienna, Austria, 27 Apr–2 May 2025, EGU25-8448, https://doi.org/10.5194/egusphere-egu25-8448, 2025.

EGU25-8529 | Orals | BG4.6

Biogeochemical dynamics and greenhouse gas emissions from groundwater-fed springs in a tropical highland system, Taita Hills, East Africa 

Sharon Gubamwoyo, Gretchen Gettel, Ricky Mwanake, Damaris Kisha, and Thomas Hein

Groundwater-fed springs are crucial for human well-being in sub-Saharan Africa but are unsustainably managed, with a 2.3% annual population growth rate and 50% of the population relying on groundwater. Over-abstraction and contamination from land-use changes persist, impacting biogeochemical processes and greenhouse gas (GHG) emissions. However, the extent and effects of this contamination are understudied and not included in GHG budgets for tropical systems. Analyzing spring water quality provides valuable insights into subsurface processes and their effect on GHG emissions. This study, investigated the impact of land use changes on GHG emissions from 10 springs in diverse land uses (Agricultural and Mixed Forest-Agricultural) within a tropical highland ecosystem in Taita Hills, Kenya, from April 2023 to February 2024. Gas samples (CO2, CH4, and N2O) were collected using the headspace equilibrium technique. Gas concentrations, fluxes, and transfer velocities were calculated and compared between the land uses. Additionally, in-situ measurements (pH, Electrical Conductivity, Dissolved Oxygen, stream velocity, and discharge) and laboratory analyses (NO3-N, NH4-N, DOC, TDN) determined the underlying biogeochemical conditions relevant to GHG emissions. The results indicated significantly higher average CO2 flux from the agricultural-impacted springs compared to the mixed forest-agricultural springs (mean ± SE = 2722.7 ± 248.1 mg CO2-C m-2 h-1 and mean ± SE = 2098.5 ± 75 mg CO2-C m-2 h-1 respectively; p < 0.05). This was due to the significantly higher negative correlation with DO, pH and DOC, and positive correlation with stream velocity which may be attributed to microbial respiration and decomposition in the system. CH4 was significantly higher in the mixed forest-agricultural springs compared to the agricultural springs (mean ± SE = 8.9 ± 1.2 mg CH4-C m-2 h-1 and mean ± SE = 4.7 ± 0.8 mg CH4-C m-2 h-1 respectively; p < 0.05). This was mainly due to the higher negative correlation with DO and positive correlation with DOC and NH4-N which was only evident in the mixed forest-agricultural attributed to methanogenesis in these springs. N2O was significantly higher in the agricultural springs with one order of magnitude higher than mixed forest-agricultural (mean ± SE = 3.6 ± 0.5 mg N2O-N m-2 h-1 and mean ± SE = 0.3 ± 0.05 mg N2O-N m-2 h-1 respectively; p < 0.05). N2O was mainly driven by high positive correlations with NO3-N, DO and stream velocity. Correlations inferred  nitrification was the main controlling process in the mixed forest-agricultural springs while denitrification was the major process in the agricultural springs due to the negative correlation with DO. The results indicate that increased fertilizer use increased NO3-N thus an increase in GHG emissions. Understanding the various controlling processes at different land use points of the springs is crucial for better management. Our study suggests that water quality significantly influences biogeochemical processes and GHG emissions, such as high NO3-N leading to N2O-N. We also recommend that practicing mixed forest-agricultural could help manage CO2 and N2O emissions. Further analysis incorporating seasonal variations is underway to better understand the GHG hot moments.

How to cite: Gubamwoyo, S., Gettel, G., Mwanake, R., Kisha, D., and Hein, T.: Biogeochemical dynamics and greenhouse gas emissions from groundwater-fed springs in a tropical highland system, Taita Hills, East Africa, EGU General Assembly 2025, Vienna, Austria, 27 Apr–2 May 2025, EGU25-8529, https://doi.org/10.5194/egusphere-egu25-8529, 2025.

EGU25-8709 | ECS | Posters on site | BG4.6

Decoding Spatiotemporal Methane Emissions in Permafrost Catchments: A Machine Learning Approach 

Michael Thayne, Karl Kemper, Christian Wille, and Torsten Sachs

Methane (CH4) emissions from permafrost catchments represent a critical component of climate feedback mechanisms. Therefore, understanding spatiotemporal dynamics and drivers of CH4 emissions from rapidly changing permafrost regions is critical for improving our understanding of these changes. However, flux calculations must rely on methods which precisely and flexibly account for non-linear gas concentration increases when using a floating chamber system. Exponential concentration increase, convex increases, and/or step changes from ebullition occur frequently in CH4 concentrations collected using floating chambers. This study introduces a flexible alternative to the available methods for isolating non-linear concentration increases by using the results of gradient boosting models and general additive models to calculate flux via an interactive algorithm. We used the algorithm to calculate CH4 fluxes for 707 floating chamber measurements collected from a surface water in a permafrost catchment between May and August and over two field seasons on Disko Island, Greenland. Resulting flux calculations were visualized as heatmaps overlaid on an orthomosaic of the catchment area, revealing significant spatial and temporal patterns in CH4 emission hotspots. Approximately 94% of CH4 emissions were attributed to diffusive processes while the remaining 6% were attributed to processes resulting from ebullition. Because ebullitive events were statistically unpredictable, we report here on diffusive CH4 emissions, which had a median of 0.0002 mg/m2/s-1 and showed seasonal variability, ranging between -0.0001 and 0.02 mg/m2/s-1, with highest emissions occurring during the thaw period and in the height of growing season. The highest uptake levels were outliers detected atop snow in 2024, but overall, there was not significant uptake across surface water. Streams connected to the lake emitted significantly higher rates of CH4 throughout the season as compared to the surface of the lake. Gradient boosting machine results suggest emission hotspots were partially dependent on shifting environmental conditions where fluxes during the thaw season were controlled by variability in rainfall, wind direction, increasing air and soil temperatures, and high soil moisture content in the active layer (i.e., increasing surface water levels). Climatological and hydrogeological controls progressively gave way to biogeochemical controls as the system began to warm, oxidize, and utilize the 24-hour Arctic sunlight and the accumulated dissolved organic matter from the thaw period. Overall, this study provides insight into the seasonal dynamics shaping CH4 emissions in a dynamic permafrost catchment. 

How to cite: Thayne, M., Kemper, K., Wille, C., and Sachs, T.: Decoding Spatiotemporal Methane Emissions in Permafrost Catchments: A Machine Learning Approach, EGU General Assembly 2025, Vienna, Austria, 27 Apr–2 May 2025, EGU25-8709, https://doi.org/10.5194/egusphere-egu25-8709, 2025.

EGU25-9105 | Orals | BG4.6

Eutrophication reshaped the dependence of carbon emission on lake size: More attention to global upscaling 

Hongtao Duan, Qitao Xiao, Tianci Qi, and Juhua Luo

Accurate estimation of carbon gas (CO2 and CH4) emissions from lakes is crucial for understanding the global carbon budget. Carbon gas emissions have been considered greatest in small lakes, however, this conclusion may be biased due to limited samples of diverse lake types and sizes. Remote sensing would allow detailed mapping of regional emissions but has hitherto not been developed. Here, we demonstrate the high accuracy, continuity, and large-scale observation capabilities of optical satellite data in mapping CO2 and CH4 dynamics. Using this innovative approach, we investigated 113 meso-eutrophic lakes in eastern China and estimated diffusive carbon gas fluxes. Our findings indicate that eutrophication tends to shift small productive lakes from being CO2 sources to sinks. However, the sampled lakes acted zonally as carbon sources due to significant CO2 emissions from larger lakes. Furthermore, CH4 emissions offset CO2 uptake, accounting for 56% of the total annual carbon efflux (in CO2-equivalents). We found that large lakes (>100 km2, comprising 23% of the total abundance) dominated the carbon emissions (92% of total efflux) due to their larger surface area and less eutrophication. Moreover, eutrophication affected the relationship between lake size and carbon emissions. Neglecting these effects may result in significant overestimation of CO2 emissions (by one order of magnitude) and underestimation of CH4 emissions (by three times). This study highlights the remarkable potential of satellite-based observations in addressing biases in lake carbon emission estimation. It emphasizes the necessity of incorporating large lakes to enhance global-scale carbon upscaling estimates. 

How to cite: Duan, H., Xiao, Q., Qi, T., and Luo, J.: Eutrophication reshaped the dependence of carbon emission on lake size: More attention to global upscaling, EGU General Assembly 2025, Vienna, Austria, 27 Apr–2 May 2025, EGU25-9105, https://doi.org/10.5194/egusphere-egu25-9105, 2025.

EGU25-9172 | ECS | Posters on site | BG4.6

CH4, CO2 and BVOC emissions from three subarctic lakes in Northern Sweden with different chemical properties 

Ida Roos Friis, Kirsten Seestern Christoffersen, Riikka Rinnan, Jonas Stage Sø, Lasse Egebjerg Ravn, and Jing Tang

Climate warming is stronger in the northern high latitudes than the global average, making ecosystems in the region prone to change with future warming. Approximately 50% of all lakes are located north of 60°N, and lake area is projected to increase from permafrost thaw and meltwater from glaciers, making lakes increasingly important parts of the terrestrial ecosystem carbon budget. We currently lack a process understanding of variations in CO2 and CH4 fluxes from high latitude lakes. Lakes are also a source of biogenic volatile organic compounds (BVOCs), and these reactive compounds influence atmospheric oxidation and contribute to aerosol formation. However, to the best of our knowledge, almost no flux measurements of BVOCs have been conducted on lakes and no measurements have been conducted in high latitude lakes, leaving this area largely unexplored but with growing interest due to expanding lake areas in this pristine environment.

This field study aims to quantify the magnitude, composition and variation in emission of CO2, CH4 and BVOCs from two small thermokarst lakes at different ages and a riverine lake, all located in subarctic Sweden. Data was collected during a two-week campaign in July-August 2024. For each site, we measured CO2, CH4 and BVOCs fluxes using floating chambers, analyzed chemical and physical properties of water samples and collected environmental variables. The lakes had different DOC, NO3- and PO43- concentrations as well as pH, despite being located less than one km from each other. The riverine lake is neutral while both thermokarst lakes are acidic. DOC ranged from mean 61.91 mg L-1 in the younger thermokarst lake to 20.93 mg L-1 in the vegetation-colonized thermokarst lake and 6.67 mg L-1 in the riverine lake.

All three lakes had distinguished emission magnitudes of BVOCs. The colonized thermokarst lake showed larger isoprene and hydrocarbon emissions than the other two lakes. Overall, the lake BVOC emissions are of similar or higher magnitude than the surrounding terrestrial ecosystem emissions found in other studies. We found that the younger thermokarst lake had the highest emissions of CH4. For CO2, the riverine lake and the colonized lake are small sinks of CO2 while the younger thermokarst lake is a source. We observed large hourly variation in CO2 and CH4 emissions in the three lakes with no clear diel pattern. This could be because of a temporal lag effect between production and consumption in the water and sampling at the surface, as well as relatively stable water temperatures over the diel cycle. Additionally, for the colonized thermokarst lake, photosynthesis was limited because the high vegetation density blocked light from entering the water around the non-see-through chamber.

This study provides quantitative information about emissions of three climate-relevant gases from different high latitude lakes in the growing season. The pioneering sampling of BVOC emissions from lakes paves the way for further exploring reactive volatiles from freshwater systems. Understanding the processes behind these flux variations allows for a more holistic representation of high latitude ecosystems by including diverse freshwater ecosystems, e.g. in regional ecosystem model simulations.

How to cite: Roos Friis, I., Seestern Christoffersen, K., Rinnan, R., Stage Sø, J., Egebjerg Ravn, L., and Tang, J.: CH4, CO2 and BVOC emissions from three subarctic lakes in Northern Sweden with different chemical properties, EGU General Assembly 2025, Vienna, Austria, 27 Apr–2 May 2025, EGU25-9172, https://doi.org/10.5194/egusphere-egu25-9172, 2025.

EGU25-9431 | Posters on site | BG4.6

Satellite remote sensing reveals rapid loss of submerged aquatic vegetation in global lakes 

Juhua Luo, Ying Xu, Qitao Xiao, Chunyu Zhang, and Hongtao Duan

Aquatic vegetation (AV), as vital primary producers and carbon sinks in lakes, is crucial for lake ecosystem health, with submerged aquatic vegetation (SAV) and floating/emergent aquatic vegetation (FEAV) representing distinct states. However, global dynamics of SAV and FEAV are poorly understood due to data scarcity. We developed an innovative AV mapping algorithm using 1.4 million Landsat images from 1989 to 2021, creating a global database of 5587 lakes. On average, AV covers 108,186 km2 globally (FEAV: 15.8%, SAV: 13.1%). Over two decades, SAV decreased by 30.4% while FEAV increased by 15.6%, indicating a significant net loss of AV. This shift suggests a move towards shaded and turbid conditions, driven primarily by human-induced eutrophication until the early 2010s, with global warming likely playing a role thereafter. These trends signal deteriorating lake health globally.

How to cite: Luo, J., Xu, Y., Xiao, Q., Zhang, C., and Duan, H.: Satellite remote sensing reveals rapid loss of submerged aquatic vegetation in global lakes, EGU General Assembly 2025, Vienna, Austria, 27 Apr–2 May 2025, EGU25-9431, https://doi.org/10.5194/egusphere-egu25-9431, 2025.

EGU25-9701 | ECS | Orals | BG4.6

Equilibrium unveiled: Carbon fluxes of a natural Fennoscandian river 

Judith Vogt, Joonatan Ala-Könni, Ivan Mammarella, Clara Mendoza-Lera, Jukka Pumpanen, Carlos Palacin-Lizarbe, Taija Saarela, Wasi Hashmi, Huizhong Zhang-Turpeinen, Niko Kinnunen, Anne Ojala, Janne Rinne, and Mathias Göckede

According to recent data-driven upscaling, emissions from rivers in the Arctic-boreal region offset between half to all of the wetland carbon dioxide (CO2) sink, and release substantial amounts of methane (CH4) despite their much smaller surface area. However, observational data in natural riverine ecosystems in this region remain scarce, and carbon emission estimates show large uncertainties.

In order to estimate the carbon budget of a natural river, we determined chamber-derived water-air fluxes and surface partial pressures of CO2 and CH4 on four transects along the Fennoscandian river Teno. In addition, hydrochemical parameters were measured. CO2 fluxes were low and ranged from -0.1 to 0.9 µmol m-2 s-1 without significant spatial differences. CH4 fluxes were highest in an area of shallow water and pronounced benthic vegetation, but overall showed small emissions (0.02 to 13.66 nmol m-2 s-1). Partial pressures of CO2 and CH4 were mostly in equilibrium with the atmosphere, and pCH4 was only slightly elevated where highest CH4 fluxes were found.

On each transect, the carbon fluxes were driven by different local factors including dissolved oxygen saturation, water temperature, pH and turbidity. Therefore, knowledge about heterogeneous patterns across landscapes is important to understand spatial variability of riverine biogeochemistry and enhance process understanding. Results from this study can be used to benchmark Earth System and process-based models, and to evaluate the impact of disturbances on river carbon dynamics.

How to cite: Vogt, J., Ala-Könni, J., Mammarella, I., Mendoza-Lera, C., Pumpanen, J., Palacin-Lizarbe, C., Saarela, T., Hashmi, W., Zhang-Turpeinen, H., Kinnunen, N., Ojala, A., Rinne, J., and Göckede, M.: Equilibrium unveiled: Carbon fluxes of a natural Fennoscandian river, EGU General Assembly 2025, Vienna, Austria, 27 Apr–2 May 2025, EGU25-9701, https://doi.org/10.5194/egusphere-egu25-9701, 2025.

Rewetting of previously drained wetlands in the forested landscape is suggested as an efficient Nature Based Solution to combat multiple environmental challenges e.g. to protect biodiversity, improve water resilience, and reduce greenhouse gas emissions. In parallel with this human induced re-creation of wet areas there are also non-human activities i.e. damming by beavers, that that could have a similar water retaining function. However, the consequence of these different water retaining actions on carbon exported via runoff is often ignored in climate benefit and water quality assessments. Here we explored the effect of rewetting and beaver dams on total organic carbon (TOC), carbon dioxide (CO2) and methane (CH4) in runoff by comparing data collected in a coordinated sampling campaign across hemiboreal Sweden. In total, runoff from 68 sites were sampled across five site types including rewetted sites (n=15), beaver dams (n=14) and pristine wetlands (11). To assess the effect of rewetting and beaver dams, runoff samples was also collected in drained wetlands (n=15) and at sites without beaver dams (n=14), both used as reference sites.

It was evident that rewetted sites stood out and displayed higher runoff TOC and CO2 concentrations (on average 2-fold higher) than observed in all other site types. In contrast, no difference in TOC or CO2 concentrations was observed among the remaining four site types. Rewetted sites also showed the highest CH4 concentrations, 5-fold higher than observed in pristine and reference (drained wetlands and sites without beaver dams) sites. However, CH4 concentrations in rewetted sites were not statistically different than observed in beaver dams.  Collectively, this suggest that rewetting cause elevated runoff concentrations of all major carbon forms compared to both drained and pristine wetlands. In addition, beaver dams were identified as potential hotspots for CH4 formation despite not showing any elevated runoff concentrations of the other carbon forms. We attribute the effect of rewetting on runoff carbon to an enhanced connectivity to carbon-rich terrestrial sources, but also to enhanced metabolic production under anoxic conditions, as rewetted sites showed lower oxygen in runoff than all other site types. We further speculate that the elevated CH4 in beaver dams could be linked to another type of organic substrate, as beaver dams are not necessarily located in areas with peat-rich soils. The findings from the current study suggest that rewetting of drained wetlands has implications for both climate and downstream water quality, and that those implications might differ compared to effects from non-human inundation (i.e. beaver dams). 

How to cite: Wallin, M., Wang, M., Ecke, F., and Eklöf, K.: Inundation of forested landscapes by human induced rewetting and beaver dams – effects on dissolved carbon and greenhouse gases in runoff , EGU General Assembly 2025, Vienna, Austria, 27 Apr–2 May 2025, EGU25-9862, https://doi.org/10.5194/egusphere-egu25-9862, 2025.

EGU25-10179 | Posters on site | BG4.6

Long term flux measurements of carbon dioxide and methane over a small boreal lake using eddy covariance technique 

Ivan Mammarella, Joonatan Ala-Könni, Marta Fregona, Jouni Heiskanen, Kukka-Maaria Kohonen, Asta Laasonen, Xuefei Li, Sally MacIntyre, Anne Ojala, Aki Vähä, and Timo Vesala

Advancing our understanding on physical and biogeochemical processes controlling turbulent exchange of energy, carbon dioxide (CO2), methane (CH4) and other trace gases across lacustrine systems is crucial in order to improve climate and weather forecast models. Lakes are capable of processing large amounts of organic carbon of terrestrial origin, and their importance in landscape carbon cycle and climate change issues is well recognized. Nevertheless, the amount of CO2 and CH4 released into the atmosphere is still uncertain.

Here, we investigate the temporal dynamics of CO2 and CH4 exchange using eleven years (for CO2) and three years (for CH4) of eddy covariance flux measurements over the Lake Kuivajärvi, a small boreal lake in southern Finland.

The lake ecosystem acted mostly as a net CO2 source (0.42±1.56 mmol m-2 s-1) throughout the ice-free periods and had a relatively high interannual variability when compared to the surrounding forests and wetlands. On average, the lake is a net source of CH4 (0.63±2.44 nmol m-2 s-1), but the measured annual emissions are lower than for CO2, revealing thatmost of the CH4 produced at the lake bottom is oxidized in the water column. Carbon dioxide and methane emissions are largely affected by the weather forcing through the effects of wind shear and nocturnal water cooling, which deepens the mixed layer and enhances gas exchange at the air-water interface.

How to cite: Mammarella, I., Ala-Könni, J., Fregona, M., Heiskanen, J., Kohonen, K.-M., Laasonen, A., Li, X., MacIntyre, S., Ojala, A., Vähä, A., and Vesala, T.: Long term flux measurements of carbon dioxide and methane over a small boreal lake using eddy covariance technique, EGU General Assembly 2025, Vienna, Austria, 27 Apr–2 May 2025, EGU25-10179, https://doi.org/10.5194/egusphere-egu25-10179, 2025.

EGU25-10882 | Orals | BG4.6

Hydrothermal versus microbial methane degassing pathways: case studies from two Italian shallow coastal systems 

Matteo Bazzaro, Cinzia Giuseppina Caruso, Cinzia De Vittor, Giuseppe De Rosa, Valentina Esposito, Marco Graziano, Viviana Fonti, Francesca Iacuzzo, Vincenzo Alessandro Laudicella, Manfredi Longo, Sabina Morici, and Gianluca Lazzaro

Methane (CH4), even though orders of magnitude less abundant than carbon dioxide (CO2) in the atmosphere, is today recognized as one of the most powerful greenhouse gases, being an even stronger absorber of Earth’s emitted thermal infrared radiation than CO2. Atmospheric CH4 concentrations are now more than 2.6 times above estimated pre-industrial equilibrium levels and such an increase is largely the result of anthropogenic emissions related to human activities. In order to verify potential emission reductions linked to the adoption of effective climate change mitigation strategies, a precise quantification of the global CH4 budget is actually needed. According to the most recent modelling, these calculations are still subject to considerable uncertainties, the most important of which is due to the potential ocean natural emissions. In particular, the global marine CH4 flux appears to be mainly driven by shallow marine coastal environments (depth <50 m), where gas released from the seafloor could escape to the atmosphere before oxidation. However, due to limited and sparse data, there are large uncertainties in quantifying the actual contribution of coastal areas to atmospheric CH4

The MEFISTO project, combining classical physical, chemical, and molecular methods with innovative hydroacoustic approaches, aims to help close this knowledge gap by investigating the forcings favouring or preventing the release of CH4 in the atmosphere from two Italian shallow coastal areas: a seepage zone located off the Marano and Grado lagoon (Gulf of Trieste, Northern Adriatic Sea - NAd), characterised by the intermittent release of microbial gases, and the persistently degassing hydrothermal vent area off the Panarea Island (Aeolian Archipelago, Southern Tyrrhenian Sea). Preliminary data collected during seasonal sampling campaigns revealed large differences in terms of gas composition and flux intensity between the two study sites. In particular, very low gas fluxes (1.1 x 10⁻⁴ L/h) were detected in the NAd site, where seafloor depth varies between 14 and 21 meters below sea level (mbsl) and seeping gases are mainly composed of CH4. Conversely, remarkably variable fluxes, ranging from 1.0 x 10⁻¹  to 2.2 x 10³ L/h, were observed in the Panarea site, where seafloor depth varies between 8 and 21 mbsl but leaking gases have an extremely high CO2 content (about 98%). Our preliminary results suggest that neither the microbial nor the hydrothermal CH4 is released into the atmosphere in the respective study areas. Low CH4 fluxes combined with high hydrostatic loads and temperature seems to act as controlling factors in both sites, while tides appear to play a key role in particular in the NAd site. However, as methanotrophic bacteria can act as "methane filters" along the water column, ongoing metagenomic analyses on different environmental matrices will help us to assess the presence of these microorganisms, providing useful information about their role in regulating the CH4 fluxes. This in turn will help to achieve the MEFISTO project’s goal of elucidating the complex interplay between physical and biological forcings that favour or prevent the release of CH4 into the atmosphere from such environments.

How to cite: Bazzaro, M., Caruso, C. G., De Vittor, C., De Rosa, G., Esposito, V., Graziano, M., Fonti, V., Iacuzzo, F., Laudicella, V. A., Longo, M., Morici, S., and Lazzaro, G.: Hydrothermal versus microbial methane degassing pathways: case studies from two Italian shallow coastal systems, EGU General Assembly 2025, Vienna, Austria, 27 Apr–2 May 2025, EGU25-10882, https://doi.org/10.5194/egusphere-egu25-10882, 2025.

EGU25-12503 | Orals | BG4.6

Mitigation through restoration: reducing carbon gas emissions in alpine lakes 

Núria Catalán, Ada Pastor, Arnau Comas, Carolina Olid, Nuria Burgada, Laure Gandois, Marc Ventura, Teresa Buchaca, Esperanca Gacia, and Anna Lupon

Lakes play a significant role in the global carbon cycle by transforming, burying, emitting, and transporting carbon from terrestrial ecosystems to the ocean. Carbon is emitted primarily as carbon dioxide (CO₂) and methane (CH₄), both potent greenhouse gases (GHGs), but it can be difficult to determine whether lakes are net sources or sinks of those GHGs. Alpine lakes, which are sentinel systems experiencing rapid and severe climate change-related impacts, are especially challenging. Anthropogenic activities such as fishing or intensive pasture might additionally impact their C balance forcing them into net C sources to the atmosphere. Restoring those lakes might lead not just to recover their threatened biodiversity, but also their GHG balance, constituting a great mitigation strategy. Here we aim to test the potential of ongoing restoration efforts based on the recuperation of biodiversity for reducing C gas emissions in alpine lakes.

To do so, we focused on two alpine lakes in the Pyrenees, as representative examples of broader trends in mountain lake ecosystems. Lake Tres Estanys de Baix (TEB) has been suffering a eutrophication process due to the introduction of invasive fish species in the past. Conversely, Naorte has undergone ecological restoration, with the near-total removal of invasive fish through two European LIFE projects. In 2023, sensor-equipped platforms were installed in both lakes to continuously gather data on weather, oxygen (O₂), and CO₂ at depths of 2 and 8 meters. To obtain additional information on nutrients and carbon concentrations and the quality of dissolved organic matter (DOM), weekly manual samples were taken. The restored lake, Naorte, demonstrated remarkable recovery, with significantly improved water clarity and reduced emissions of CO₂ and CH₄ compared to the impacted lake, TEB. In TEB, DOM was more colored, and concentrations of dissolved organic carbon and nitrogen were higher. This lake also exhibited signs of nutrient imbalance, with lower levels of inorganic nitrogen species, further showing a disrupted metabolism. The carbon gas balance based on coupled O2 and CO2 measurements, revealed a striking contrast: TEB functioned as a net carbon source, actively emitting GHGs, whereas Naorte acted as a net carbon sink, sequestering more carbon than it released. These findings validate our initial hypothesis that removing invasive species can restore alpine lake’s natural ability to act as carbon sinks by significantly reducing its GHGs emissions.

Beyond in-lake measurements, atmospheric CO₂ sensors were deployed in the surrounding basins to capture broader carbon dynamics. The data collected was made available online in real-time allowing for immediate access and integration into educational resources, bringing the project’s findings directly to local communities. Approximately 300 students and teachers from rural schools in the Pyrenees participated in an outreach program, engaging with the data and exploring its implications. This initiative highlighted the transformative potential of ecological restoration not only to mitigate greenhouse gas emissions but also to recover mountain ecosystems. By involving young minds in understanding and addressing these environmental challenges, we aim to inspire a new generation to contribute to a sustainable and resilient socio-ecological future.

How to cite: Catalán, N., Pastor, A., Comas, A., Olid, C., Burgada, N., Gandois, L., Ventura, M., Buchaca, T., Gacia, E., and Lupon, A.: Mitigation through restoration: reducing carbon gas emissions in alpine lakes, EGU General Assembly 2025, Vienna, Austria, 27 Apr–2 May 2025, EGU25-12503, https://doi.org/10.5194/egusphere-egu25-12503, 2025.

EGU25-12836 | Orals | BG4.6

How Important is Sampling Frequency? Exploring Temporal Dynamics of GHG Emissions Using Low-Cost Sensors in Lake Mesocosms  

Tuba Bucak, Eti Ester Levi, Robert Ladwig, and Thomas Alexander Davidson

Greenhouse gas (GHG) emissions from freshwater ecosystems contribute significantly to global carbon budgets. However, these emissions remain poorly constrained due to limited high-frequency measurements. In this study, we tested a low-cost, high-frequency GHG measurement system in a long-running mesocosm experiment in Lemming, Denmark, over a seven-month period, focusing on CO₂ and CH₄ fluxes. We propose a methodology for calculating diffusive CH₄ fluxes using high-frequency sensor data and tested the effects of sampling interval upscaling of emissions by conducting theoretical experiments. 

Our findings reveal substantial temporal variability in GHG emissions, particularly for CH₄, with ebullitive fluxes dominating with high daily variation. Pronounced diurnal fluctuations were observed for CO₂ and diffusive CH₄ fluxes, while ebullitive CH₄ emissions showed no clear diurnal pattern. Our results show that relying solely on daytime measurements leads to a significant underestimation of overall CO₂ fluxes, whereas daytime measurements of diffusive CH₄ fluxes significantly overestimate the total flux. 

The results of the theoretical sampling interval experiments emphasize that infrequent sampling can introduce substantial uncertainty and lead to an underestimation of total emissions, particularly for ebullitive CH₄ fluxes. Simulated experiments demonstrated that increasing the sampling interval from daily to monthly markedly increased uncertainty, whereas weekly sampling intervals better captured overall GHG flux patterns and reduced the uncertainty compared to less frequent sampling. 

Our results highlight the importance of high-frequency GHG measurements in capturing both diurnal and seasonal variations, improving the accuracy of flux estimates, and reducing uncertainties in upscaling emissions to broader scale. Therefore, we emphasize the critical importance of optimizing sampling intervals and incorporating diurnal cycle measurements to enhance the accuracy and reliability of upscaled GHG measurements. Further development and application of low-cost, high-frequency sensor systems are critical to enhance the temporal and spatial coverage of freshwater GHG emissions and support future research in mitigating climate impacts from freshwater ecosystems. 


How to cite: Bucak, T., Levi, E. E., Ladwig, R., and Davidson, T. A.: How Important is Sampling Frequency? Exploring Temporal Dynamics of GHG Emissions Using Low-Cost Sensors in Lake Mesocosms , EGU General Assembly 2025, Vienna, Austria, 27 Apr–2 May 2025, EGU25-12836, https://doi.org/10.5194/egusphere-egu25-12836, 2025.

EGU25-13596 | ECS | Orals | BG4.6

The Global Importance of CO2 and CH4 Emissions from Ponds: A Large-Scale Data Perspective 

Jovana Radosavljevic, Ali Reza Shahvaran, Fereidoun Rezanezhad, Elodie Passeport, Stephanie Slowinski, and Philippe Van Cappellen

Inland waters, including small lakes and ponds, play a major role in the global carbon cycle. While they typically act as organic carbon sinks, they also emit the greenhouse gases (GHGs) carbon dioxide (CO2) and methane (CH4) to the atmosphere. Nonetheless, small inland waters, defined as those with a surface area (SA) of less than 5 hectares (further referred as “ponds”), are often excluded from large-scale CO2 and CH4 budgets. To help overcome this gap, we reviewed available global datasets on inland waters and selected G1WBM, GLCF GIW, GSW, and OSM, because these datasets provide sufficient information on ponds to assess their global distribution. We further compiled a dataset of CO2 and CH4 emissions plus water chemistry data from 950 ponds worldwide from existing literature and databases. Next, we applied a Monte Carlo analysis to the estimated surface areas and CO2 and CH4 emission ranges of ponds. The results suggest that ponds with SA < 1 ha emit 0.25–0.42 Pg C yr-1, and those of 1–5 ha emit 0.18–0.45 Pg C yr-1, accounting for up to 14 and 17%, respectively, of the total carbon gas emissions from all-sized lakes and ponds worldwide. Our estimates thus further highlight the potentially disproportionate, yet poorly constrained, importance of ponds in global GHG budgets. In addition to water chemistry data, we also extracted global gridded hydrometeorological and socio-economic data matched to each HydroBASIN-delineated basin of the 950 lakes. Using Random Forest regression (RFR) models, we found that pond water pH and watershed urbanization were the most important predictors of the CO2 emissions, while electrical conductivity (EC), SA, and pond depth were the most important variables for the CH4 emissions. The RFR modeling revealed that ponds in urban areas typically exhibit elevated pH levels, probably due to the ubiquitous use of cement-based construction materials. High pH levels, in turn, suppress CO2 emissions by retaining dissolved inorganic carbon under the form of aqueous bicarbonate (HCO3-). The role of non-sulfate-derived EC in modulating the CH4 emissions is attributed to the effect of salinity on the mixing intensity and the associated impact on water column oxygenation. Overall, our findings confirm the significant role of ponds in global carbon cycling. At the same time, they suggest that site-specific characteristics, including land use and water chemistry, can induce considerable variability in GHG emissions from ponds.

How to cite: Radosavljevic, J., Shahvaran, A. R., Rezanezhad, F., Passeport, E., Slowinski, S., and Van Cappellen, P.: The Global Importance of CO2 and CH4 Emissions from Ponds: A Large-Scale Data Perspective, EGU General Assembly 2025, Vienna, Austria, 27 Apr–2 May 2025, EGU25-13596, https://doi.org/10.5194/egusphere-egu25-13596, 2025.

EGU25-13764 | Orals | BG4.6

Global Inland Water Greenhouse Gas Emissions: Patterns, Trends, and Anthropogenic Drivers 

Ronny Lauerwald, David Bastviken, Tom Battin, Philippe Ciais, Hanqin Tian, George H. Allen, Gwenaël Abril, Núria Catalan, Bridget R. Deemer, Paul del Giorgio, Alessandra Marzadri, Yves Prairie, Suzanne Tank, Qianlai Zhuang, Lishan Ran, Josep Canadell, and Pierre Regnier

Inland waters (streams, rivers, lakes, and reservoirs) are important sources of greenhouse gases (GHGs), including carbon dioxide (CO2), methane (CH4) and nitrous oxide (N2O), to the atmosphere. Their importance has been acknowledged in the IPCC assessment reports and in the regional and global greenhouse budgets coordinated by the Global Carbon Project (GCP). In the framework of the 2nd phase of the REgional Carbon Cycle Assessment and Processes (RECCAP-2) initiative of the GCP, a comprehensive synthesis of existing estimates of regional to global inland water GHG emissions was conducted (Lauerwald et al., 2023a, 2023b) to support the inclusion of these emissions in (sub-)continental GHG budgets. Although that synthesis was published only two years ago, a number of new global estimates have been published since. Here, we present an updated synthesis of recent, global inland water GHG emissions estimates. Moreover, we go beyond the scope of the RECCAP2 synthesis by analyzing regional patterns in more detail, and summarizing the state of knowledge about long-term trends of inland water GHG emissions in response to changes in climate, land use, wastewater management and river damming. Based on that, we discuss how contemporary inland water GHG emissions are impacted by anthropogenic activities and how they may evolve over the 21st century.

We estimate that global inland water GHG emissions have a combined warming potential of 8 (5–13) Pg CO2-eq. yr⁻¹ for a 100-year time horizon (GWP100). CO2 emissions, primarily from tropical river systems, contribute approximately three-quarters of this total, while CH4, largely from lakes and reservoirs, accounts for most of the remainder. Notably, boreal and Arctic lakes are important emitters due to their large total area, while nutrient-rich lakes and reservoirs with warmer temperatures in the mid to low latitudes exhibit the highest per-area CH4 emission rates. Contributions from N2O emissions are relatively minor.

About one third of CH4 emissions and about three quarters of N2O emissions from global inland waters can be attributed to anthropogenic perturbations, primarily through eutrophication. For inland water CO2 emissions, quantification of the anthropogenic component is more complex. Empirical and modelling studies suggest that global greening also increases terrestrial carbon deliveries to inland waters, and through that, emissions of CO2 from inland waters. Moreover, changes in streamflow are an uncertain, but very important driver. Most dramatic increases are expected for inland water CH4 and N2O emissions, which are projected to strongly increase in response to global warming, while changes in nutrient loads from agricultural runoff may offset or enhance that trend.

References

Lauerwald et al. 2023a, GBC, https://doi.org/10.1029/2022GB007657

Lauerwald et al. 2023b, GBC, https://doi.org/10.1029/2022GB007658


How to cite: Lauerwald, R., Bastviken, D., Battin, T., Ciais, P., Tian, H., Allen, G. H., Abril, G., Catalan, N., Deemer, B. R., del Giorgio, P., Marzadri, A., Prairie, Y., Tank, S., Zhuang, Q., Ran, L., Canadell, J., and Regnier, P.: Global Inland Water Greenhouse Gas Emissions: Patterns, Trends, and Anthropogenic Drivers, EGU General Assembly 2025, Vienna, Austria, 27 Apr–2 May 2025, EGU25-13764, https://doi.org/10.5194/egusphere-egu25-13764, 2025.

EGU25-13995 | Orals | BG4.6

Methane fluxes from wetlands: Competition between Ebullition, Advection, and Diffusion 

Charles F. Harvey and Alison Hoyt

Methane is transported from wetlands by a variety of physical processes through a variety of pathways: ebullition (the formation of bubbles that rise to the surface), flushing (advection by pore water flowing into streams), and diffusion (both into plant roots and out through the surface).  We have formulated a theory that couples ebullition, diffusion, and flushing, and predicts how the competition between these processes leads to different porewater concentrations of dissolved gases and their isotopes. We apply the theory to explain why ebullition creates much higher concentrations of carbon dioxide and much different ratios of carbon-13 in both methane and carbon dioxide and then we use these results to explain the oberserved differences in carbon dioxide and methane concentrations and their isotope ratios between northern and southern wetlands. Implications of the theory also include: (1) Carbon isotope ratios in methane and carbon dioxide depend not only on the fractionation factor in methanogenesis but also on the magnitude of ebullition relative to advection. (2) Counterintuitively, higher methane concentrations in pore water occur at lower rates of methanogenesis, for all else held constant. (3) Pore water gas concentrations can be used to infer historical rates of ebullition. 

How to cite: Harvey, C. F. and Hoyt, A.: Methane fluxes from wetlands: Competition between Ebullition, Advection, and Diffusion, EGU General Assembly 2025, Vienna, Austria, 27 Apr–2 May 2025, EGU25-13995, https://doi.org/10.5194/egusphere-egu25-13995, 2025.

    Saline lakes are experiencing significant changes in salinity and organic matter content due to climate change. However, the specific impacts of these environmental changes on the production processes of nitrous oxide (N₂O)—particularly nitrification and denitrification—in saline lake sediments are still poorly understood, leading to significant uncertainty in current estimates of greenhouse gas (GHG) emission from these ecosystems. To address this gap, the present study used the isotope pair labelling technique to quantitatively assess the effects of climate-induced changes in environmental variables such as salinity and organic matter and their combined influence on N₂O production rates and production pathways from lake surface sediments. The results showed that saline lake sediments act as hotspots for N₂O production, with nitrification making a significant, although previously underestimated, contribution to the total N₂O flux; Salinity was found to limit N₂O production through both nitrifying and denitrifying processes in lake sediments, although dissolved organic carbon (DOC) in the sediment could mitigate the limitation caused by salt. In low-salinity lakes (salinity < 35 g/L), N₂O production, which mainly comes from denitrification, was significantly suppressed by salinity increase due to the increased sensitivity of denitrifying microbes to salinity change. Conversely, in high-salinity lakes (salinity > 35 g/L), where salinity stress remained pronounced, an increase in DOC appeared to play a crucial role in increasing N₂O production by triggering both denitrification and heterotrophic nitrification processes. Consequently, future investigations on GHG emissions from lakes should prioritize the evolving environmental dynamics driven by climate change and provide new insights and a solid scientific basis for predicting and managing future changes in these critical ecosystems.

Key words: N₂O production pathways, saline lakes, climate change, salinity, dissolved organic carbon.

How to cite: Sun, X. and Wang, B.: Antagonistic effect of changing salinity and dissolved organic carbon on N₂O production via different pathways in saline lakes, EGU General Assembly 2025, Vienna, Austria, 27 Apr–2 May 2025, EGU25-14939, https://doi.org/10.5194/egusphere-egu25-14939, 2025.

EGU25-15113 | ECS | Orals | BG4.6

Seasonal and diurnal dynamics of methane fluxes in Typha-dominated wetland treating diffuse agricultural pollution 

Isaac Okiti, Ilona Tamm, Kadir Yildiz, Jürgen Sarjas, Karin Maria Saarepuu, Mihkel Pindus, and Kuno Kasak

Treatment wetlands are recognized as multifunctional ecosystems capable of treating agricultural runoffs. Yet, while their nutrient removal efficiency can be high, it also comes with elevated emissions of greenhouse gases (GHGs), most importantly methane (CH4). Dense vegetation and availability of nutrients can make these water treatment systems into landscape-scale CH4 hotspots. Therefore, wetland management practices need to be developed to sustain nutrient removal efficiency while also reducing GHG emissions. Typha-dominated wetlands can modulate microbial processes and plant-mediated fluxes of CH4. However, understanding these emission patterns requires capturing seasonal trends and diurnal fluctuations. This study investigated CH4 flux variations and environmental parameters in a Typha-constructed wetland treating agricultural runoff from late spring (May 2024) to the end of the growing season (October 2024). The closed chambers (both opaque and transparent) were used with a LI-7810 trace gas analyzer (LICOR Biosciences). Biweekly measurements of CH4 and CO2 fluxes were made at five vegetated sampling spots and five non-vegetated sampling spots. During each sampling occasion, other parameters such as water temperature, pH, dissolved oxygen, oxidation-reduction potential, turbidity, conductivity, leaf area index (LAI), and water depth were measured using portable devices. To examine diurnal variability, three intensive 24-hour sampling campaigns were conducted on June 15, July 22, and August 18. During each of these campaigns, GHG fluxes, and the environmental parameters were measured hourly. The results showed that CH4 fluxes varied considerably across the five vegetated sampling points over the study period, ranging from 105 μg CH4-C m⁻² h⁻¹ to over 30,000 μg CH4-C m⁻² h⁻¹ while the non-vegetated sampling points peaked above 50,000 μg CH4-C m⁻² h⁻¹. However, a distinct diurnal pattern for CO2 and CH4 was observed. CO2 uptake peaked around mid-day, reaching above -700 CO2-C m-2 h-1driven primarily by photosynthetic activity influenced by photosynthetically active radiation (PAR), while CH4 fluxes varied with peak fluxes reaching above 10,000 μg CH4-C m⁻² h⁻¹ observed mostly in the evening (e.g., 4–5 pm and 6–7 pm), clearly driven by elevated temperature. Our studies show how plant growth, microbial activity, and environmental factors interact to regulate greenhouse gas fluxes in treatment wetlands. Understanding seasonal and daily variations is important for monitoring greenhouse gas fluxes and improving wetland management practices.

How to cite: Okiti, I., Tamm, I., Yildiz, K., Sarjas, J., Saarepuu, K. M., Pindus, M., and Kasak, K.: Seasonal and diurnal dynamics of methane fluxes in Typha-dominated wetland treating diffuse agricultural pollution, EGU General Assembly 2025, Vienna, Austria, 27 Apr–2 May 2025, EGU25-15113, https://doi.org/10.5194/egusphere-egu25-15113, 2025.

EGU25-15534 | Orals | BG4.6

Temporary thermal stratification and mixing drive variation in CO2 and CH4 dynamics in a shallow lake 

Thomas A. Davidson, Tuba Bucak, Eti Levi, Robert Ladwig, Christian Juncher Jørgensen, Martin Søndergaard, and Jesper Riis Christensen

Fresh waters are known to be significant, but highly uncertain, sources of greenhouse gas (GHG) emissions to the atmosphere. In particular, lakes and ponds have been identified as hotspots of methane (CH4) emissions, with large variation across systems.  One reason for this variability in estimates of emissions may be a mismatch between the scale of observation (often monthly) and how variable emissions are over relatively short timescales. Whilst studies have highlighted the importance of nutrient concentration, primary production and temperature in shaping fluxes of GHG, it is increasingly clear that physical limnology in small and shallow lakes may play a significant role.  Recent research has highlighted the prevalence of temporary thermal stratification in lakes previously classified as non-stratifying lakes, i.e. smaller shallow lakes and ponds. Here we present high frequency measurements from automatic flushing chambers and a novel CH4 sensor measuring dissolved concentrations to quantify diffusive and ebullitive emissions of CH4 along with diffusive fluxes of carbon dioxide (CO2) from an 11 hectare lake, with a maximum depth of 5 m. We compare these emissions with patterns of thermal stratification, that featured partial and full mixing events, over a three-month period from mid-June to late September. This shows that diffusive emissions of both CH4 and CO2 are shaped primarily by partial and full mixing events between the GHG-rich hypolimnetic waters and the lower concentrations in the surface waters and by full mixing events. Whereas ebullition is largely a function of the extent of the duration of anoxia in the bottom waters, with large releases triggered by atmospheric pressure changes.  The results show that the variable emissions found in syntheses of spatial data from multiple lakes can be found within this single lake over time. Thus, the high variability in emissions reported across lakes may be the result of infrequent sampling of temporally highly dynamic systems, rather than the systems having such variable emissions.

How to cite: Davidson, T. A., Bucak, T., Levi, E., Ladwig, R., Jørgensen, C. J., Søndergaard, M., and Christensen, J. R.: Temporary thermal stratification and mixing drive variation in CO2 and CH4 dynamics in a shallow lake, EGU General Assembly 2025, Vienna, Austria, 27 Apr–2 May 2025, EGU25-15534, https://doi.org/10.5194/egusphere-egu25-15534, 2025.

EGU25-15932 | ECS | Posters on site | BG4.6

Insights into seasonal dynamics of metalimnetic methane and hypolimnetic nitrous oxide in a deep Swiss alpine lake  

Santona Khatun, Roberto Grilli, Sébastien Manuel Lavanchy, Didier Jézéquel, Carsten J Schubert, Marie-Elodie Perga, and Jérôme Chappellaz

Methane (CH4) and nitrous oxide (N2O) are potent greenhouse gases (GHGs) and are involved in ozone depletion. They are the second and third most significant GHGs contributing to climate change, with global warming potentials approximately 25 times and 300 times greater than CO2. The contribution of freshwater lakes to CH4 and N2O emissions remains debatable. Oxygen-rich subsurface waters are recognized as hotspots of metalimnetic CH4 flux, while oxygen-driven diffusion in deep water columns is expected to enhance hypolimnetic N2O production in deep freshwater lakes. Therefore, understanding the seasonal dynamics of water-column CH4 and N2O in freshwater ecosystems is crucial for predicting their impact on future climate projections. Traditionally, both GHG gases have been thought to be primarily produced in sediments, with higher emissions occurring during the mixing events. However, the seasonal dynamics and characteristics of both water-column gases, including production in the water column which may contribute to atmospheric emissions, are often overlooked. Here, we hypothesize that both metalimnetic CH4 and hypolimnetic N2O might be present and emitted from deep lakes year-round. We will present our preliminary measurements of seasonal variations in CH4 and N2O concentrations in the deep Swiss alpine Lake Geneva. They relied on laser spectrometric probes called SubOcean, allowing in-situ and real-time observations of CH4 and N2O along the water column, with a remarkable depth resolution.

How to cite: Khatun, S., Grilli, R., Lavanchy, S. M., Jézéquel, D., Schubert, C. J., Perga, M.-E., and Chappellaz, J.: Insights into seasonal dynamics of metalimnetic methane and hypolimnetic nitrous oxide in a deep Swiss alpine lake , EGU General Assembly 2025, Vienna, Austria, 27 Apr–2 May 2025, EGU25-15932, https://doi.org/10.5194/egusphere-egu25-15932, 2025.

EGU25-16016 | ECS | Orals | BG4.6

Bubble size distributions in mountain streams 

Marcus Klaus, Nicola Durighetto, Eliot Chatton, Paolo Peruzzo, and Gianluca Botter

Mountain streams are hot spots for the exchange of gases such as oxygen or carbon dioxide with the atmosphere. Air-water gas exchange is accelerated by air bubbles entrained in turbulent flow and depends on bubble concentration and size. Yet, our understanding of gas exchange mechanisms and our ability to upscale gas fluxes is hampered by a severe lack of data on bubble size distributions in streams. Here, we measured bubble size distributions in 16 step-pool systems across six stream reaches in two mountain ranges (Dolomites, Italy; Vosges, France), combining Acoustic Bubble Spectrometry and ambient underwater sound recording. Bubble size distributions in our study streams were similar to those reported previously for ocean breaking waves: bubble concentrations decreased with bubble size following a power-law scaling, with a power exponent generally ranging from -2/3 to -10/3, increasing with bubble size, and varying both within and among step-pool systems. Total bubble concentrations exhibited a bilinear power law relationship with turbulent kinetic energy dissipation rates estimated from Acoustic Doppler Velocimetry, suggesting distinct bubble formation regimes under low and high turbulence. Bubble concentrations generally decreased with distance from steps, but invisible microbubbles still exhibited significant concentrations several meters downstream from steps where no visible macrobubbles were recorded. Our findings provide novel scaling laws for bubble size distributions, offering insights into the different gas exchange regimes observed in mountain streams. Additionally, they underscore the potential of bubble-mediated gas exchange even under absence of visible bubbles, highlighting the complexities involved in upscaling gas exchange mechanisms in such environments.

How to cite: Klaus, M., Durighetto, N., Chatton, E., Peruzzo, P., and Botter, G.: Bubble size distributions in mountain streams, EGU General Assembly 2025, Vienna, Austria, 27 Apr–2 May 2025, EGU25-16016, https://doi.org/10.5194/egusphere-egu25-16016, 2025.

EGU25-17014 | ECS | Orals | BG4.6

Spatiotemporal dynamics and controls of greenhouse gas emissions in agricultural ditches 

Khadija Aziz, Joachim Audet, Hannah Conroy, Pia Geranmayeh, Katarina Kyllmar, Michael Peacock, Sebastian Sobek, and Marcus Wallin

Agricultural ditches have been identified as emission hotspots of the three main atmospheric greenhouse gases (GHGs) i.e., carbon dioxide (CO2), methane (CH4) and nitrous oxide (N2O). However, due to lack of representative GHG emission data from these small waterbodies, their contribution to the total GHG emissions from the agricultural sector are reported as highly uncertain. In this study the aim was to 1) quantify the magnitude of GHG emissions and understand their spatiotemporal dynamics in agricultural ditches, and 2) identify gas specific controls that regulate those dynamics.

In our two-year field study, dissolved concentrations and fluxes of CO2, CH4 and N2O were measured in ditches, as well as concentrations in groundwater, of a clay soil dominated agricultural catchment located in central Sweden. Sampling was carried out biweekly during the growing season (April–November). Additional sampling for water chemistry and runoff was made to aid assessment of GHG controls. Local floating chamber-based GHG fluxes were further scaled for the entire ditch network for representative catchment scale emission estimates.

The results showed that both dissolved GHG concentrations and their respective fluxes were highly variable in space and time. In general, higher GHG concentrations and fluxes were observed during the summer and after rain events, but patterns were gas and site-specific. Across all sites, N2O concentrations were positively related to dissolved inorganic nitrogen (DIN), and CO2 to total organic carbon (TOC), whereas patterns for CH4 were more unpredictable. Groundwater data also revealed highly variable gas-specific patterns over time. While groundwater N2O concentrations was on average close to concentrations observed in the ditch, CO2 was 5-fold and CH4 1000-fold higher in groundwater indicating a gas-variable terrestrial source contribution to observed ditch emissions. Our study identified ditches as significant but also highly variable sources of CO2, CH4 and N2O emissions to the atmosphere. This further highlights the need for appropriate sampling and scaling designs that can capture these high spatiotemporal dynamics to provide representative catchment-based emission estimates.

How to cite: Aziz, K., Audet, J., Conroy, H., Geranmayeh, P., Kyllmar, K., Peacock, M., Sobek, S., and Wallin, M.: Spatiotemporal dynamics and controls of greenhouse gas emissions in agricultural ditches, EGU General Assembly 2025, Vienna, Austria, 27 Apr–2 May 2025, EGU25-17014, https://doi.org/10.5194/egusphere-egu25-17014, 2025.

EGU25-17543 | ECS | Orals | BG4.6

Response of methane gas fluxes to cage aquaculture in African lakes-Kivu and Muhazi, Rwanda 

Janvière Tuyisenge, Anne van Dam, Ken Irvine, and Gretchen Gettel

Aquaculture in floating cages has rapidly expanded in African lakes, driven by economic development and the need to increase fish production. However, this development has raised concerns about environmental impacts, including potential alterations of the benthic processes that could contribute to increased greenhouse gas emissions from cage culture sites which have not been measured so far. This study examined methane concentrations and fluxes from tilapia cage farming in Lakes Muhazi and Kivu, currently some of the major sites for cage aquaculture development in African lakes. In Lake Kivu, methane fluxes (FCH4-C) varied between 0 - 45.6 mg/m2/h in sites with cages, and 0 - 5.1 mg/m2/h in sites without cages. In Lake Muhazi, the FCH4-C varied between 0 - 67.6 mg/m2/h in sites with cages, and 0 - 7.7 mg/m2/h in sites without cages. Methane fluxes generally were higher in the shallow Lake Muhazi than in the deep Lake Kivu. Cage farms in bays exhibited higher fluxes than the cages located on open water. These findings suggest a contribution of cage aquaculture to methane fluxes in lakes, especially in shallow and enclosed areas. Understanding the dynamics of methane fluxes in response to aquaculture practices is essential for developing strategies for sustainable aquaculture that balance fish production in cages with environmental conservation.

How to cite: Tuyisenge, J., van Dam, A., Irvine, K., and Gettel, G.: Response of methane gas fluxes to cage aquaculture in African lakes-Kivu and Muhazi, Rwanda, EGU General Assembly 2025, Vienna, Austria, 27 Apr–2 May 2025, EGU25-17543, https://doi.org/10.5194/egusphere-egu25-17543, 2025.

EGU25-17722 | ECS | Orals | BG4.6

Automated versus expert processing of in situ CO2 and CH4 chamber measurements in complex and heterogeneous aquatic ecosystems  

Camille Minaudo, Katrin Attermeyer, Miguel Cabrera Brufau , Alba Camacho Santamans, Antonio Camacho, Constantin Cazacu, Relu Constantin Giuca, Benjamin Misteli, Jorge Montes Perez, Daniel Morant, Biel Obrador, Bruna Oliveira, Jolita Petkuvienė , Antonio Picazo, Carlos Rochera, and Daniel von Schiller

Measuring reliable greenhouse gases (GHGs) fluxes at the interface between water bodies and the atmosphere in inland waters is crucial in the context of climate change but remains highly challenging.  GHG fluxes can be measured directly in-situ with chambers placed at the water-atmosphere interface and connected to portable gas analysers providing high-frequency timeseries of GHGs partial pressures inside the chamber. Fluxes are usually assumed constant over the time of incubation, but varying GHG sources and changing environmental conditions and/or ebullition from the sediment produce non-linear patterns and breakpoints in the timeseries, not mentioning the possibility for poor manipulation of the device, disturbance of the sampling site by the operator, or malfunctioning sensors. Accordingly, it is common procedure to visualize and select part of the measurements manually for each incubation before proceeding with fluxes computation. In the ongoing Horizon Europe project RESTORE4Cs, we have performed CO2 and CH4 chamber measurements in 36 different sites located in 6 major coastal wetlands across Europe, including intertidal saltmarshes and seagrass beds, freshwater and brackish ponds and marshes, and coastal lagoons. Between October 2023 and August 2024, we have gathered a database of 822 floating chamber incubations, collected by multiple operators and with 3 different gas analysers.  

Here we focus on the data processing part and assess to what extent we need expert evaluation of the time series to produce reliable flux estimates. We have developed an automated data processing script able to compute fluxes estimates for all incubations. Timeseries are fitted with both a linear and non-linear models. The script identifies potential bubbling in CH4 measurements and estimates the diffusive versus ebullitive components based on the statistical characteristics of the first derivative of pCH4. All incubations were manually inspected by 16 members of our team, all experts in GHG chamber measurements with various levels of experience. About half of these timeseries were inspected independently by at least 3 experts, enabling to compare if and why experts disagree. 

For both CO2 and CH4, non-linear fitting performed better than linear models for 69% incubations, indicating a substantial number of non-linear patterns in the dataset; however, the difference between the two models was less than 10% for 86% of the incubations. The ebullition pathway was the dominant CH4 flux in less than 10% of the incubations. Experts disagreed substantially on the data selection in 34% of the incubations, which produced uncertainties in flux estimates larger than 10% of the inter-expert flux average. The highest discrepancies were related to suspicious or non-linear features in the time series. To avoid subjectivity and ensure robustness and repeatability of flux estimates, we present guidelines on how CO2 and CH4 incubation time series should be processed, regardless of whether they are processed automatically or after an expert manual inspection. 

How to cite: Minaudo, C., Attermeyer, K., Cabrera Brufau , M., Camacho Santamans, A., Camacho, A., Cazacu, C., Constantin Giuca, R., Misteli, B., Montes Perez, J., Morant, D., Obrador, B., Oliveira, B., Petkuvienė , J., Picazo, A., Rochera, C., and von Schiller, D.: Automated versus expert processing of in situ CO2 and CH4 chamber measurements in complex and heterogeneous aquatic ecosystems , EGU General Assembly 2025, Vienna, Austria, 27 Apr–2 May 2025, EGU25-17722, https://doi.org/10.5194/egusphere-egu25-17722, 2025.

EGU25-18312 | ECS | Posters on site | BG4.6

Seasonal and spatial dynamics of carbon dioxide and methane fluxes from a reservoir in Western Germany 

Najeeb Al-Amin Iddris, Vilna Tyystjärvi, Marco Halbig, Jonathan Janzen, Mattia Bonazza, Farshid Jahanbakhsi, Leonie Tabea Esters, and Ana Meijide

Dams play a critical role in water management and hydropower across Europe, yet the greenhouse gas (GHG) emissions from these reservoirs remain largely understudied, particularly in Germany. While hydropower is often considered a clean energy source, reservoirs can play a significant role in global carbon cycling and the global GHG budget, acting as both sources and sinks of carbon dioxide (CO₂) and methane (CH₄), depending on their ecological and management conditions. In this study, we measured CO₂ and CH₄ fluxes from the Rur Reservoir, located in the Eifel district of western Germany, in a catchment area characterized by a mix of agricultural and forested land. Land use practices in the area influence water quality, nutrient levels, and greenhouse gas emissions, particularly through organic matter input. Using floating chambers, we conducted weekly measurements during the summer and autumn and biweekly measurements in winter, starting in August 2024.

CO₂ fluxes displayed a distinct seasonal pattern, with the reservoir acting as a sink during summer (negative fluxes) before transitioning to a source in autumn, peaking mid-fall (~2600 mg CO₂ m⁻² d⁻¹). Fluxes declined to near-zero levels in early winter, with a transient spike (~6000 mg CO₂ m⁻² d⁻¹) in late November. Throughout the study period, the reservoir consistently emitted methane (CH₄), with fluxes ranging from 1 to 3 mg CH₄ m⁻² d⁻¹ with a slight peak observed mid-fall. CH₄ emissions were significantly higher in the pelagic zone compared to the dam and shoreline areas, whereas CO₂ fluxes showed no discernible spatial pattern across these zones. CO₂ fluxes were strongly correlated with water temperature (r =-0.82, p < 0.01), highlighting the sensitivity of emissions to thermal conditions.

These findings underscore the dynamic nature of GHG emissions in reservoirs and emphasize the importance of considering both seasonal and spatial variability to accurately quantify their contribution to regional and global carbon budgets.

How to cite: Iddris, N. A.-A., Tyystjärvi, V., Halbig, M., Janzen, J., Bonazza, M., Jahanbakhsi, F., Esters, L. T., and Meijide, A.: Seasonal and spatial dynamics of carbon dioxide and methane fluxes from a reservoir in Western Germany, EGU General Assembly 2025, Vienna, Austria, 27 Apr–2 May 2025, EGU25-18312, https://doi.org/10.5194/egusphere-egu25-18312, 2025.

EGU25-21913 | ECS | Orals | BG4.6

Evaluating the Recovery of Ecosystem Services in a Restored Seagrass Meadow: Greenhouse Gas Fluxes and Climate Mitigation Potential  

Julia Máñez-Crespo, Núria Marbà, Ángeles Ferias-Rodríguez, Eduardo Infantes, and Iris Hendriks

Seagrass meadows are critical components of coastal ecosystems, playing a significant role in the global carbon cycle. These "Blue Carbon Ecosystems" (BCEs) are highly effective natural carbon sinks because they are highly productive, trap allochthonous carbon, and can store sequestered carbon for centuries to millennia in the sediment. Hence, they contribute to the long-term removal of atmospheric CO2 and prevent the remineralization of buried carbon via methanogenesis, thereby supporting climate regulation. This study evaluates the recovery of ecosystem services, specifically greenhouse gas (GHG) flux regulation, in a Zostera marina seagrass meadow that has undergone phased restoration since 2015.

By assessing the fluxes of methane (CH4) and carbon dioxide (CO2) across different restoration stages using a LICOR 7810 and an incubator chamber, we explore how the meadow's GHG emissions and carbon sequestration capacity change over time as the ecosystem recovers. Our findings show that, after 9 years of restoration, CH4 emissions decreased by 1.11-fold and CO2 net sequestration increased by 1.23-fold compared to the eroded meadow. While CO2 fluxes in the older restored meadow are 1.33 times higher than those in the original meadow, CH4 fluxes are 3 times higher, indicating a greater challenge in restoring ecosystem services related to methane flux. Despite this, GHG fluxes, especially methane emissions, decrease over time, suggesting that restored meadows are gradually recovering their capacity as carbon sinks. This study highlights the potential of phased restoration to enhance carbon sequestration and support long-term climate mitigation efforts.

How to cite: Máñez-Crespo, J., Marbà, N., Ferias-Rodríguez, Á., Infantes, E., and Hendriks, I.: Evaluating the Recovery of Ecosystem Services in a Restored Seagrass Meadow: Greenhouse Gas Fluxes and Climate Mitigation Potential , EGU General Assembly 2025, Vienna, Austria, 27 Apr–2 May 2025, EGU25-21913, https://doi.org/10.5194/egusphere-egu25-21913, 2025.

It is well established that nearby unconfined aquifer systems are typically hydraulically connected to shallow lakes and wetland systems. This connection between surface waters and adjacent groundwater systems has significant implications for the effective protection and management of the high environmental values often associated with lake and wetland habitats. Understanding the behaviour and interactions of groundwater and stagnant water bodies in these systems is crucial. This study explores the seasonal dynamics and interactions between groundwater, stagnant water bodies (SWBs), and surface water in the lower Gangetic floodplain of eastern India, using isotopic mapping (δ18O values) and 222Rn values.

The δ18O values of groundwater were found to vary seasonally and spatially across the region. Groundwater near the River Ganges exhibited lower δ18O values, which increased as the distance from the river increased. The lowest δ18O value (-9.0‰) occurred in the post-monsoon season, and the highest value (-0.8‰) was observed during the monsoon. The higher δ18O values in monsoon were likely influenced by irrigation, which introduced water with higher isotopic values into the groundwater. This seasonal fluctuation reflects the impact of land use and agricultural practices on groundwater composition.

The SWBs showed different δ18O patterns, with values varying seasonally due to factors like evaporation, rainfall, groundwater seepage, and the size of the water body. The mean annual δ18O value of SWBs was -0.20‰. Larger SWBs, which are less affected by evaporation and more likely to be connected to the aquifer, exhibited lower δ18O values (from -3.0 to 0‰). In contrast, smaller SWBs showed higher δ18O values due to stronger evaporation effects. A significant correlation was observed between the δ18O values of SWBs and rainfall, with a one-month lag. This suggests that the SWBs are primarily influenced by the hydrological cycle, with the addition of rainwater during the monsoon season lowering the δ18O values.

The study also examined groundwater recharge using data from three boreholes located 15 km from the River Ganges. These boreholes tapped different aquifers at varying depths, revealing seasonal fluctuations in δ18O values. Shallow boreholes (20 meters) exhibited higher δ18O values, reflecting recent rainfall and evaporation. Deeper boreholes (30 meters and 50 meters) showed more negative δ18O values, suggesting recharge from different water sources. These variations highlight the influence of different recharge events and the seasonal patterns of groundwater interaction with surface water.

Radon (222Rn) levels were measured in the boreholes to assess groundwater-surface water interaction. The radon data suggested that lithology (rock and soil types) played a significant role in groundwater composition. Borehole-1, located in silty clay, showed higher radon levels than the other two boreholes in silty sand, reflecting differences in uranium content in the soil. In conclusion, this isotopic mapping study reveals the complex, seasonal interactions between groundwater, river water, rainwater, and SWBs in the lower Gangetic floodplain, with important implications for water resource management and environmental protection.

How to cite: Sanyal, P., Kumar, V., and Jakhar, M.: Water isotopes  and 222Rn in disentangling the impact of macroscale climatic controls and microscale hydrological processes in groundwater-wetland ecosystems in the lower Gangetic plain, Indian Peninsula  , EGU General Assembly 2025, Vienna, Austria, 27 Apr–2 May 2025, EGU25-672, https://doi.org/10.5194/egusphere-egu25-672, 2025.

EGU25-790 | ECS | Posters on site | BG4.8

Spatio-temporal analysis of hydrological connectivity of floodplain wetlands in the Ganga Plains, India 

Abhishek Sinha, Manudeo Singh, and Rajiv Sinha

The Ganga Plain (GP) is one of the largest alluvial floodplains in the world, where river meanders and floodplain wetlands are crucial surface water resources that support millions of people. Nearly 80% of GP wetlands are geographically isolated wetlands (GIWs), meaning that precipitation provides most of their water. These GIWs shrink and develop into vegetative patches as a result of groundwater extraction in the surrounding regions. This study has utilized geostatistical approaches to analyse hydrological connectivity and rainfall patterns for three decades at the sub-basin scale, transecting different hydroclimatic regimes. Hydrological connectivity, defined as the water-mediated transfer of matter and energy within or between hydrological cycle components, was evaluated using two methods: (i) structural connectivity, which is determined by terrain slope/ruggedness, and a rainfall-NDVI-weighted C factor map normalized by the Soil Index, and (ii) functional connectivity, which combines flow accumulation data to link rainfall patterns, connectivity, and water movement. We have mostly used freely available datasets from Google Earth Engine and processed them using cloud computing.

The initial finding revealed that 44% of wetlands in the Ganga Plain (GP) are classified as unstable, declining, lost, or intermittent, with an accuracy of 84%, emphasizing their susceptibility to deterioration. Rainfall in the GP varies significantly by location, ranging from 3000 mm in the north to 500 mm in the southwest, altering hydrological connectivity even more. Disruptions in this connectivity cause an unstable water flow, affecting wetland functionality and stability. The study highlights the importance of targeted actions in preserving hydrological connectivity across climatic zones and maintaining sustainable wetlands.


Keywords: Google Earth Engine, Ganga Plain, Wetlands, Hydrological Connectivity.

How to cite: Sinha, A., Singh, M., and Sinha, R.: Spatio-temporal analysis of hydrological connectivity of floodplain wetlands in the Ganga Plains, India, EGU General Assembly 2025, Vienna, Austria, 27 Apr–2 May 2025, EGU25-790, https://doi.org/10.5194/egusphere-egu25-790, 2025.

EGU25-924 | Orals | BG4.8

Tracking peatland recovery: insights from 20 years of satellite data 

Iuliia Burdun, Mari Myllymäki, Rebekka R.E. Artz, Mélina Guêné-Nanchen, Leonas Jarašius, Ain Kull, Erik A. Lilleskov, Kevin McCullough, Mara Pakalne, Jiabin Pu, Jurate Sendzikaite, Liga Strazdina, and Miina Rautiainen

Restoring degraded peatlands is a key strategy for climate change mitigation. This has driven increased restoration efforts, especially in northern regions with widespread degradation. Continuous spatial monitoring is critical, and remote sensing enables it by providing large-scale data. In our study, we analyzed restoration-induced changes in essential climate variables across degraded northern peatlands in Finland, Estonia, Latvia, Lithuania, the UK, Canada, and the USA. We hypothesized that, prior to restoration, degraded peatlands with different initial land cover types display more pronounced differences in essential climate variables compared to intact peatlands, but these differences diminish as restoration progresses. Using over 20 years of satellite data, we observed changes driven by restoration in vegetation cover, surface temperature, and albedo, with the latter two showing the strongest indications of peatlands gradually recovering their natural state over time.

How to cite: Burdun, I., Myllymäki, M., R.E. Artz, R., Guêné-Nanchen, M., Jarašius, L., Kull, A., A. Lilleskov, E., McCullough, K., Pakalne, M., Pu, J., Sendzikaite, J., Strazdina, L., and Rautiainen, M.: Tracking peatland recovery: insights from 20 years of satellite data, EGU General Assembly 2025, Vienna, Austria, 27 Apr–2 May 2025, EGU25-924, https://doi.org/10.5194/egusphere-egu25-924, 2025.

EGU25-960 | ECS | Orals | BG4.8

Identification of ecological zonation in tidal wetlands from high and medium-resolution satellite imagery 

Inês Carneiro, Katerina Katerina Kombiadou, Zhicheng Yang, Sonia Silvestri, and A. Rita Carrasco

Forecasting the temporal and spatial evolution of coastal wetlands is a complex and challenging endeavour, further complicated by shifting climatic conditions. From a coastal management perspective, however, it remains essential to anticipate local vulnerabilities and the potential compromise of ecological functions. This study aims to assess the skill of subpixel and pixel imagery classification algorithms in sensing the zonation of wetlands through satellite imagery by testing in wetland areas, using high spatial resolution imagery from Unmanned Aerial Vehicles (UAVs) and high and medium spatial resolution satellite imagery and identifying the related challenges. The research was conducted in one of the most important coastal lagoons of Portugal, Ria Formosa Lagoon. Hard and soft Random Forest regression algorithms were employed to estimate the zonation of marsh plants, the former applied to UAV data (centimetric pixel size) and the latter to high and medium resolution satellite imagery (WV-2 & -3 and Sentinel, respectively, metric to decametric pixel size). Employing a gradually increasing pixel size allowed to identify error propagation during the passage from pixel to sub-pixel estimators and lower resolutions. The obtained results provide important insights to the barriers and opportunities related to varying imagery sources, carrying an important message to local managers. When discussed within the context of dominant natural and human drives, the developed maps, along with methodology and monitoring, provide valuable scientific insights into vegetation succession in a mesotidal system. More importantly, they serve as essential tools for local coastal decision-makers in identifying priorities for strategic landscape conservation planning and ensuring the sustainability of ecological function as the carbon sequestration within ecosystems.

Acknowledgements: This study contributes to the projects DEVISE (https://doi.org/10.54499/2022.06615.PTDC) and C-Land (CEXC/4647/2024), both funded by the Fundação para a Ciência e a Tecnologia, and to project TraceLands (ID PP0090200), funded by the European Space Agency.

How to cite: Carneiro, I., Katerina Kombiadou, K., Yang, Z., Silvestri, S., and Carrasco, A. R.: Identification of ecological zonation in tidal wetlands from high and medium-resolution satellite imagery, EGU General Assembly 2025, Vienna, Austria, 27 Apr–2 May 2025, EGU25-960, https://doi.org/10.5194/egusphere-egu25-960, 2025.

Understanding the impact of anthropogenic climate variability on the surface inundation dynamics in the wetlands of drylands:  A case study of Ile-Balkhash Delta, Kazakhstan.

Kanchan Mishra1*, Philip Weber1, Kathryn E. Fitzsimmons2

1Department of Geosciences, University of Tübingen, Schnarrenbergstrasse 94-96, 72076 Tübingen, Germany.

2School of Earth Atmosphere and Environment, Monash University, Clayton VIC, Australia

(*Email: kanchan.mishra@uni-tuebingen.de)

The Ile-Balkhash Delta, a Ramsar wetland of international importance in southeastern Kazakhstan, is one of the largest deltas in arid Central Asia (ACA). Like other waterbodies in dryland regions, the Ile-Balkhash delta faces degradation and desertification driven by anthropogenic climate change and human-induced alterations. These changes disrupt the structure, function, and distribution of wetlands, resulting in ecological and socio-economic impacts, including habitat loss, declining water quality and quantity, and reduced carbon sequestration. Despite their sensitivity to environmental changes, the surface water dynamics of these wetlands remain poorly understood in arid settings.

This study aims to assess the seasonal surface inundation patterns (SIP) and their spatio-temporal dynamics in the Ile-Balkhash Delta from 1992 to 2024 using remote sensing, GIS, and logistic regression analysis. Climatic and anthropogenic drivers of wetland dynamics are identified, while a new classification algorithm quantifies degradation patterns and transitions under the current regulated hydrological regime, offering insights into physical processes and conservation strategies.

The study reveals a strong seasonal variability, with persistent water coverage peaking in spring (15.4%) and declining in summer (10.4%), reflecting substantial reductions during drier months. Interannual variability shows peaks in wetland areas during years such as 2000, 2004, 2010, 2016, and 2018, likely linked to upstream discharge and snowmelt. However, a marked decline in coverage post-2018 suggests potential shifts in the hydrological conditions of the wetlands. The analysis further highlights that upstream inflows and hydrological connectivity exert a stronger influence on wetland dynamics than localized rainfall and temperature, which primarily regulate evaporation rates. Across the entire delta (27,791 km²), total lost (231.95 km²) and gained (246.04 km²) areas are nearly balanced. However, persistent water remains limited (617.28 km², 10.6%), while seasonal and temporary water has expanded, emphasizing the dominance of temporary water areas. Regionally, the coastal region (SR-1, 2,750 km²) shows a net increase in inundation, with gains (117.84 km²) far exceeding losses (7.99 km²), resulting in dynamic seasonal water coverage. In contrast, the main Central Ile River Delta (SR-2, 5,357 km²) shows a net areal decline, with losses (127.35 km²) surpassing gains (40.70 km²), despite heightened seasonal fluctuations. Similarly, the southern arid inland regions (SR-3, 1,039 km²) exhibit modest gains (11.64 km²) dominated by larger losses (37.46 km²), indicating a shift toward ephemeral water occurrences. The findings highlight the complex and dynamic nature of water variability in the Ile-Balkhash Delta, emphasizing the need for integrated water management strategies to address ongoing hydrological changes and support wetland conservation under evolving climate and human pressures.


How to cite: Mishra, K., Weber, P., and Fitzsimmons, K. E.: Understanding the impact of anthropogenic climate variability on the surface inundation dynamics in the wetlands of drylands:  A case study of Ile-Balkhash Delta, Kazakhstan., EGU General Assembly 2025, Vienna, Austria, 27 Apr–2 May 2025, EGU25-3657, https://doi.org/10.5194/egusphere-egu25-3657, 2025.

EGU25-4184 | ECS | Posters on site | BG4.8

Remote sensing based Water Hyacinth monitoring using the novel Aquatic Macrophyte Index (AMI) 

Finn Münch, Marloes Penning de Vries, and Daphne van der Wal

Many people depend on inland water bodies as water resource. However, fundamental ecosystem services, like the provision of water for drinking and irrigation purposes, can be affected by eutrophication, climate change and invasive species. This challenge requires the regular observation and monitoring of freshwater bodies to take measures that preserve their valuable ecosystem services and warn the local population in the event of water-related health risks. Aquatic macrophytes and phytoplankton can be detected from space and used as a proxy to monitor the trophic state and water quality, for example by using vegetation indices such as NDVI or FAI. However, these indices fail to discriminate reliably between floating vegetation (like water hyacinth) and submerged vegetation.

The Aquatic Macrophyte Index (AMI) presented in this paper uses information from the green and shortwave infrared (SWIR) part of the electromagnetic spectrum to distinguish between aquatic macrophytes and phytoplankton. The respective plant’s water content causes a detectable absorption in the SWIR, which allows to differentiate aquatic macrophytes from phytoplankton. A fixed threshold of the AMI allows classification of aquatic macrophytes and phytoplankton, respectively, without the need to select a threshold for different study areas as it is the case for currently applied state of the art spectral indices. Satellite sensors of the Landsat and Sentinel-2 mission have the required bands for the computation of the AMI. Cloud free records of a harmonized dataset that combines imagery from both missions favor the performance of close to real time monitoring as well as timeseries analysis of the past decades.

The AMI can be applied to monitor the distribution of aquatic weed such as water hyacinth. The application of the AMI is exemplified using Lake Chivero (Zimbabwe) as case study representing the issue of hypertrophic lakes that are infested with rapidly expanding invasive species and algal blooms.

How to cite: Münch, F., Penning de Vries, M., and van der Wal, D.: Remote sensing based Water Hyacinth monitoring using the novel Aquatic Macrophyte Index (AMI), EGU General Assembly 2025, Vienna, Austria, 27 Apr–2 May 2025, EGU25-4184, https://doi.org/10.5194/egusphere-egu25-4184, 2025.

Wetlands are essential ecosystems providing critical ecological services, yet they face significant threats from human activities and climate change. Monitoring and mapping these areas accurately is fundamental to formulating effective conservation and restoration strategies. Remote sensing, combined with advanced deep learning techniques, offers a scalable and efficient solution for wetland classification and monitoring. However, the application of these technologies is often constrained by regional variations in wetland classification systems and the challenges of distinguishing ecologically similar wetland types. Notably, no study has yet leveraged deep learning for mapping wetlands within Denmark's unique wetland classification system, as defined by the Danish Nature Conservation framework.

This study presents a comprehensive benchmark analysis of three state-of-the-art deep learning models—Fully Convolutional Network (FCN), U-Net, and DeepLabV3—for wetland segmentation using high-resolution Earth observation data. We utilize the publicly available multispectral aerial imagery (RGB and NIR) and digital elevation models (DEM) to classify Denmark’s wetland areas, such as bogs, freshwater meadows, and salt marshes. By evaluating multiple input configurations, this study investigates the impact of integrating additional spectral and elevation data on the segmentation performance.

The results demonstrate that the DeepLabV3 model outperforms other architectures, achieving the highest accuracy and F-measure when leveraging the combined RGB, NIR, and DEM data. Despite these advancements, challenges remain, particularly in distinguishing ecologically similar wetland types (e.g., freshwater meadows and bogs) and addressing issues of label noise in ground truth datasets. This study highlights potential solutions, such as the inclusion of Synthetic Aperture Radar (SAR) data for temporal analysis and the adoption of noise-robust training and contrastive learning methods to enhance model robustness.

This benchmark not only establishes a foundation for improving deep learning methodologies for wetland mapping in Denmark but also contribute to global efforts aimed at developing innovative, scalable solutions for wetland conservation and restoration.

How to cite: Larsen, J. J. and Asif, M. R.: Benchmarking deep learning models for wetland mapping in Denmark using high-resolution earth observation data, EGU General Assembly 2025, Vienna, Austria, 27 Apr–2 May 2025, EGU25-4365, https://doi.org/10.5194/egusphere-egu25-4365, 2025.

River streamflow is fundamental to hydrological science, providing essential insights for freshwater resource management, flood and drought control, and riverine ecosystem preservation. However, conventional field measurements are predominantly limited to major rivers and downstream reaches, while hydrological models heavily depend on these observations for calibration and training. The declining availability of in-situ data significantly impedes global streamflow mapping, particularly for thousands of ungauged rivers, thereby constraining our understanding of hydrological processes.

The Surface Water and Ocean Topography (SWOT) satellite, launched in 2022, provides unprecedented observations of water surface elevation (WSE), river width, and slope for global rivers, enabling discharge estimation without traditional gauging data. It employs six well-established algorithms to optimize unobserved flow law parameters (FLPs), including friction coefficients and referenced cross-sectional areas. These FLPs effectively characterize hydraulic properties for individual river reaches, with accuracy continuously improving through prolonged SWOT monitoring periods. This critical information enables the reconstruction of river discharges using historical satellite observations and fundamental flow laws (e.g., Modified Manning’s equation) with SWOT-derived FLPs.

By applying the estimated FLPs to nadir altimeter virtual stations (e.g., Jason and Sentinel-3), our methodology enables global river discharge estimation using altimetric WSEs alone. This approach facilitates comprehensive river streamflow reconstruction dating back to early satellite operations, demonstrates gauge-independent generalization capability, and establishes a novel paradigm for tracking discharge dynamics by integrating historical observations with SWOT-based discharge. Validation by the SWOT science team indicates uncertainty levels below 30% for most river reaches. Our framework establishes a foundation for analyzing global river responses to climate change and hydrometeorological extremes, offering significant potential for enhancing resilience to hydrological variations in a changing climate.

How to cite: Fang, C. and Long, D.: SWOT-Driven Global River Discharge Reconstruction: A Novel Framework for Streamflow Analysis under Climate Change, EGU General Assembly 2025, Vienna, Austria, 27 Apr–2 May 2025, EGU25-4938, https://doi.org/10.5194/egusphere-egu25-4938, 2025.

River water levels and their dynamics are fundamental indicators of freshwater availability, climate change impacts on the water cycle, and regional water security. Although monitoring these changes is crucial for developing adaptive management strategies that balance human needs with ecosystem sustainability, traditional in-situ observations are mostly constrained to large rivers and downstream reaches. Satellite altimetry, using radar pulses to sense surface waters, open a new era to track global river stages and assess their temporal variations. Leveraging advanced Synthetic Aperture Radar techniques and our improved waveform retracking algorithm, we successfully monitored water levels at 46,993 Sentinel-3 virtual stations (VSs) from 2016 to 2024. These VSs, located at the intersections of satellite ground tracks and river channels, encompass rivers ranging from several meters to kilometers in width across diverse topographical settings. Water level change rates unveil a pronounced global wetting-drying pattern across river basins. Our analysis identifies significant water level declines in Central North America, Central South America, and Western Siberia, contrasting with widespread increases across Africa, Oceania, and Eastern and Southern Asia. These findings demonstrate the differential impact of intensifying hydrometeorological events on regional river dynamics and highlight accelerating change rates. Our results provide critical insights into water security assessment and resilience planning, emphasizing the urgent need for targeted policy interventions to address these hydrological changes.

How to cite: Long, D. and Fang, C.: Satellite altimetry reveals a contrasting wetting-drying pattern in global rivers under climate change, EGU General Assembly 2025, Vienna, Austria, 27 Apr–2 May 2025, EGU25-5482, https://doi.org/10.5194/egusphere-egu25-5482, 2025.

EGU25-7826 | ECS | Orals | BG4.8

Regional scale projections of future change in wetland hydrologic regimes in Australia 

Andrew John, Gabrielle Burns, and Rory Nathan

Wetlands provide key habitat for many species but are threatened by climate change. However, quantitatively projecting climate change impacts on wetland hydrologic regimes is difficult due to the often remote nature of wetlands, leading to a scarcity of data on wetland inundation. In these contexts, remote sensing offers a large scale tool for periodic observations of wetland water extent. In addition, wetlands can display a diverse range of inundation regimes, driven by the different hydrological processes that contribute to inflows. For example, perennial wetlands might have ongoing groundwater contributions or high rainfall that keep water levels elevated throughout the year. But more variable systems such as floodplain wetlands might rely on overbank river flows, such that they might only be inundated every few years. This large range in hydrologic variability can make modelling wetland inundation a difficult task.

We used a timeseries dataset of wetland inundation extents, extracted from Landsat-derived water observations over 1988-2022, to classify the hydrologic regime of 34,890 wetlands in the state of Victoria, Australia. Wetlands were classified as permanent, seasonal, intermittent or episodic systems, which represent increasing variability in inundation. We then calibrated a series of conceptual hydrologic and Long Short-Term Memory (LSTM) neural network models to simulate wetland inundation, driven by climate inputs. Conceptual hydrologic models were able to reasonably simulate wetland inundation for permanent, seasonal and intermittent systems, but struggled in representing the more variable episodic wetlands. For episodic wetlands, LSTM models performed better than conceptual hydrologic models, but many that calibrated well over the historic period showed unrealistic sensitivity to changes in climate inputs.

We then applied a range of climate projections to wetlands models, to understand potential future shifts in wetland hydrologic regimes, based on a subset of 8,334 of the best performing models. Climate change projections substantially reduced the proportion of permanent and seasonal wetlands and increase the proportion of episodic wetlands in Victoria. Our results suggest the biggest risk is to permanent wetlands, where even under a moderate emissions scenario nearly two thirds of permanent wetlands could transition to seasonal or intermittent systems by 2065. “Rare” wetlands (with an average inundation frequency of less than once every 10 years) are predicted to increase eight-fold under a high emissions scenario by 2065. These results demonstrate the significant vulnerability of wetland hydrology to climate change, with potential major implications for wetland habitat for freshwater ecosystems.

How to cite: John, A., Burns, G., and Nathan, R.: Regional scale projections of future change in wetland hydrologic regimes in Australia, EGU General Assembly 2025, Vienna, Austria, 27 Apr–2 May 2025, EGU25-7826, https://doi.org/10.5194/egusphere-egu25-7826, 2025.

EGU25-10013 | ECS | Posters on site | BG4.8

Seasonal and interannual variability of water-covered areas in the Ouémé delta (Bénin) from 2015 to 2023. 

Ferdinand Noémie, Chaigneau Alexis, Morel Yves, Kouraev Alexei, and Okpeitcha Victor

The Ouémé delta, located in southern Benin, serves as the main tributary system for the Nokoué lagoon, fed by the Sô and Ouémé rivers, that cross a vast plain of wetlands. This region experiences pronounced seasonality driven by the African monsoon, leading to significant river level fluctuations that cause major flooding and pose threats to the livelihoods and safety of riverine communities.

The aim of this study is to assess the spatio-temporal variability of water levels and inundated areas extent at seasonal and interannual scales from 2015 to 2023, using in-situ and satellite data in the Ouémé Delta.

First, water level data obtained from in-situ and Sentinel 3 altimetry in the rivers and the lagoon, show significant seasonal variability, with a difference of 8 meters between the dry season (December-April) and the wet season (September-November) in the Ouémé river. Strong interannual variability was also observed in Nokoué Lagoon, particularly between 2020, which experienced a minor flood (+0.75 m) and 2022, characterized by a major flood (+1.5m).

Then, the flood extent was analyzed using Sentinel-1A radar imagery. The average inundated area is estimated to 100 km² during wet season. Monthly flood probability maps indicate that the southern part of the Sô River is the most frequently flooded. These maps further highlight the southward propagation of flooding during the wet season. Since 2018, a marked increase in flood extent has been observed. From 2015 to 2017, the average inundated areas was around 40 km². However, post-2018, this figure has more than doubled. Between 2018 and 2023, significant year-to-year variations were observed, with a difference of 90 km² inundated areas between 2020 and 2022.

These obtained results, validated with independent data (Suomi-NPP/VIIRs flood data), provide a better understanding of the hydrological dynamics in the Ouémé delta. This work is conducted as part of the SCOast-DT and TOSCA projects, funded by the CNES (French space agency).

How to cite: Noémie, F., Alexis, C., Yves, M., Alexei, K., and Victor, O.: Seasonal and interannual variability of water-covered areas in the Ouémé delta (Bénin) from 2015 to 2023., EGU General Assembly 2025, Vienna, Austria, 27 Apr–2 May 2025, EGU25-10013, https://doi.org/10.5194/egusphere-egu25-10013, 2025.

Wetlands deliver critical ecosystem services, including serving as habitats for diverse species (some of which are vulnerable or endangered), facilitating nutrient cycling, storing and sequestering carbon, and offering recreational opportunities. However, over the past century, wetlands have experienced significant loss, degradation, and stress due to anthropogenic influences such as water diversion, agricultural expansion, and urbanization, as well as natural processes like sea-level rise and climate change. This underscores the urgency to protect, conserve, and restore the remaining wetlands worldwide. A fundamental component of wetland conservation, management, and restoration is the monitoring of their hydrological systems, as wetland ecosystems are inherently dependent on water availability. Hydrological monitoring is commonly conducted using stage (water level) stations, which provide high temporal resolution data but suffer from limited spatial resolution, as these stations are often distributed several kilometers apart or more. Additionally, many wetlands remain ungauged or are monitored with only a sparse network of stage stations due to logistical constraints.

Space-based remote sensing technologies offer an effective alternative, providing high spatial resolution measurements of wetland water levels and their temporal changes. These techniques include Synthetic Aperture Radar (SAR), optical imagery, and radar and laser altimetry. SAR observations yield two independent observables—amplitude and phase—each sensitive to distinct hydrological parameters. Radar and laser altimetry missions deliver centimeter-level accuracy in water-level measurements along satellite tracks.

To overcome the limitations of individual monitoring methods, we developed a novel, space-based, multi-sensor approach to estimate absolute water level changes in wetlands by integrating ICESat-2 laser altimetry and Sentinel-1 InSAR data. This approach employs ICESat-2 absolute water levels to calibrate Sentinel-1 InSAR-derived relative water level changes, generating high spatial resolution (50–200 m) maps of absolute water level changes across entire wetland areas. We applied this methodology to the South Florida Everglades, a natural laboratory characterized by significant wetland variability and abundant ground-based hydrological data. The analysis utilized all ICESat-2 observations for the region, comprising 202 ground tracks collected between October 2018 and December 2023. Additionally, we processed 146 Sentinel-1 interferograms from the same period using the Alaska Satellite Facility's Hybrid Pluggable Processing Pipeline. This yielded 103 water level change maps with temporal intervals ranging from 12 to 364 days. Validation against gauge data revealed a root mean square error (RMSE) of 15.4 cm for the absolute water level change estimates. Error sources included uncertainties in ICESat-2 observations, InSAR measurements, and the EDEN interpolation scheme. To further investigate error contributions, residuals were decomposed into short- and long-wavelength components. Short-wavelength errors, primarily attributed to InSAR data, captured localized variations, while long-wavelength errors, associated with ICESat-2 data, reflected broad-scale biases. By removing long-wavelength biases, we achieved an RMSE of 7.8 cm, demonstrating the potential for high-accuracy wetland water level monitoring using the integrated multi-sensor approach.

How to cite: Wdowinski, S. and Palomino-Ángel, S.: A Multi-sensor Approach for Hydrological Monitoring of Wetlands: Altimetry-InSAR (ICESat-2/Sentinel-1) Integration Method Development over the South Florida Everglades, EGU General Assembly 2025, Vienna, Austria, 27 Apr–2 May 2025, EGU25-11865, https://doi.org/10.5194/egusphere-egu25-11865, 2025.

EGU25-12134 | Posters on site | BG4.8

Characterizing an Artificial Wetland through Hydrologic and Isotopic Monitoring 

Andrea Dani, Matteo Nigro, Stefano Fioletti, Federico Preti, and Daniele Penna

Wetlands are critical ecosystems essential to human and environmental health, delivering diverse ecosystem services such as food security, biodiversity preservation, climate change mitigation, water filtration, aquifer feeding, and regulation. When present, wetlands play a vital role in catchment drainage systems, providing water storage, flow regulation, infiltration, and chemical processing. Despite their ecological significance, wetlands have been decreasing in number and extent globally. However, the construction of artificial wetlands has steadily increased in recent decades due to recognition of their eco-hydrological importance and benefits. Wetlands are widely acknowledged as an effective nature-based solution. The ecological status of wetlands and the performance of their ecosystem services are closely tied to the hydroperiod. A wetland's hydroperiod is determined by the interplay of water inflows and outflows, the geomorphology of the catchment, and subsurface properties. Understanding and managing the hydroperiod of artificial wetlands is vital to maintaining and increasing ecological and hydrological integrity. Hence, artificial wetlands must be assessed based on both their internal functional processes and their hydrological interactions with the surrounding environment, including water exchanges, sediment transport, and nutrient dynamics.

This study analyzes an artificial wetland in the Tuscany, Central Italy, known as Oasi di Gabbianello. Built in 2004, it has become an important ecological site, offering resources and habitat to various plant and animal species, especially migratory birds. The study objectives were to: i) characterize the hydroperiod and its key drivers; ii) develop both a conceptual and numerical hydrological model; and iii) validate the models using hydrometeorological and stable isotope data. These models are essential for enhancing the resilience of the wetland to future climatic stresses. 

A monitoring program was implemented, including continuous measurements of meteorological conditions, water inflow and outflow, and wetland water levels, alongside biweekly sampling for stable isotope analysis over one year. Continuous monitoring enabled a hydroperiod characterization, revealing precipitation and stream inflow as primary water gains, while evaporation and overflow constituted major losses. Seepage was undetectable at the resolution of observation. Both conceptual and numerical models accurately represented water volume variations, while stable isotope data highlighted transitions between recharge- and evaporation-dominated periods, providing an additional dataset for model validation.

Keywords: Wetland; Hydrology; Water Isotopes; Modelling.

How to cite: Dani, A., Nigro, M., Fioletti, S., Preti, F., and Penna, D.: Characterizing an Artificial Wetland through Hydrologic and Isotopic Monitoring, EGU General Assembly 2025, Vienna, Austria, 27 Apr–2 May 2025, EGU25-12134, https://doi.org/10.5194/egusphere-egu25-12134, 2025.

EGU25-12667 | ECS | Posters on site | BG4.8

Leveraging the Potential of Sentinel-3 and SWOT Radar Altimeters for Hydrological Monitoring in Vegetated Wetlands 

Sebastián Palomino-Ángel and Shimon Wdowinski

Wetlands are among the most productive ecosystems on Earth but also one of the most threatened by environmental and climate changes. Detailed spatial and temporal monitoring of water level patterns in wetlands is crucial to understanding the ecosystem status and dynamics, as it provides information about the amount of water stored and moving through a wetland at a given time. Space-based hydrologic monitoring of wetlands has successfully complemented ground-based hydrological observations by providing invaluable measurements of water levels and their changes over time in both gauged and ungauged areas. Detection of wetlands’ water level beneath vegetation cover requires active remote sensing technologies, where several technologies such as radar and laser altimetry, SAR amplitude, and Interferometric SAR have been successfully used. The increasing availability of data from new missions poses an opportunity to advance space-based hydrological applications, but it requires a consistent evaluation of the accuracy for such a purpose.

This study evaluates the new generation of satellite radar altimeters, including Sentinel-3 and SWOT-nadir observations, for water level retrieval in vegetated wetlands. The evaluation was conducted in the South Florida Everglades using the Altimetry Time Series (AlTiS) software with data acquired between 2023–2024. We used gauge data from the Everglades Depth Estimation Network (EDEN) as a reference for the analysis. Preliminary results show that both products provide accurate water level retrievals for the tested locations, with Root Mean Square Error (RMSE) of 0.02 m and R2 of 1.00 for Sentinel-3 (n = 24), and RMSE of 0.12 m and R2 of 0.99 for SWOT-nadir (n = 29). The results provide a first insight into the potential of both missions for tracking water level changes in vegetated wetlands and open new opportunities to strengthen hydrological monitoring in unmonitored areas. The next steps of the research will include performing a systematic evaluation of the products for various wetland types and exploring the potential of integrating the observations with additional datasets in multi-sensor approaches.

How to cite: Palomino-Ángel, S. and Wdowinski, S.: Leveraging the Potential of Sentinel-3 and SWOT Radar Altimeters for Hydrological Monitoring in Vegetated Wetlands, EGU General Assembly 2025, Vienna, Austria, 27 Apr–2 May 2025, EGU25-12667, https://doi.org/10.5194/egusphere-egu25-12667, 2025.

EGU25-12852 | ECS | Orals | BG4.8

Ecohydrological Monitoring of Temperate Raised Bogs by Using Backscatter Intensity of Synthetic Aperture Radar  

Mahdi Khoshlahjeh Azar, Alexis Hrysiewicz, Shane Donohue, Shane Regan, Raymond Flynn, and Eoghan P. Holohan

Peatland degradation promotes carbon emissions, biodiversity loss, water quality decline, and slope instability. Effective mitigation of these impacts depends on understanding and monitoring peatland ecohydrology across space and time. Synthetic Aperture Radar (SAR) satellites enable large-scale monitoring at moderate to high spatial resolution and, as SAR penetrates cloud, at consistent revisit times. However, exactly how SAR backscatter relates to peatland ecohydrology, in both space and time, is incompletely understood. We investigated spatio-temporal relationships between C-band SAR backscatter intensity and peatland ecohydrological characteristics at six temperate raised bogs in Ireland. The study sites range from near-intact raised bog to industrially-degraded bare peat; the near-natural sites have a well-characterized range of raised bog ecology. We assess Sentinel-1 C-band SAR backscatter intensity (radiometric terrain corrected) in both VV and VH polarization through time for the period 2015-2024. Time series of SAR backscatter intensity for all bogs show annual oscillations that are most pronounced in VV polarization. Intensity maxima occur in winter-spring; minima occur in summer-autumn. The amplitude of intensity oscillation and mean of VV intensity through time are consistently greater for bare peat than for near-intact bogs. The mean of VH intensity in time is lowest for areas of bare peat and areas of non-vascular vegetation (moss, Sphagnum), but it is highest for areas of vascular vegetation (Heather, Calluna). The annual oscillation in SAR intensity is attributed primarily to soil moisture variation, which is controlled by groundwater levels and seasonal precipitation. SAR intensity oscillation is greatest in drained bare peat because of more intense cycles of drying and wetting. The higher mean VV intensity in time of bare peat is attributed to the lack of attenuation of the SAR pulse by vegetation. The sensitivity of mean VH intensity in time to the nature of vegetation is explained by increased volumetric scattering of the radar waves in shrub-rich areas. Spatio-temporal shifts in SAR backscatter signatures can thus help identify and monitor the impacts of human activity on temperate raised bogs. For example, responses to early stages of restoration (rewetting) were detectable in the intensity time series as decreases in backscatter intensity and reduction, or loss of annual intensity oscillation. Consequently, this study provides an improved basis for incorporating SAR remote sensing into sustainable peatland management.

How to cite: Khoshlahjeh Azar, M., Hrysiewicz, A., Donohue, S., Regan, S., Flynn, R., and P. Holohan, E.: Ecohydrological Monitoring of Temperate Raised Bogs by Using Backscatter Intensity of Synthetic Aperture Radar , EGU General Assembly 2025, Vienna, Austria, 27 Apr–2 May 2025, EGU25-12852, https://doi.org/10.5194/egusphere-egu25-12852, 2025.

EGU25-15274 | ECS | Posters on site | BG4.8

Assessing the Impact of Land Use and Land Cover Changes on Wetland Landscape Patterns and Hydroecology: A Case Study of the Bakhira Wetland, India 

Manish Rawat, Ashish Pandey, Basant Yadav, and Praveen Kumar Gupta

Wetlands are among the most vital ecosystems on Earth, offering numerous ecosystem services such as habitats for biodiversity, water purification, carbon sequestration, and flood mitigation. The Bakhira Wetland, located in eastern Uttar Pradesh, India, is a designated Ramsar Site and was selected for this study to assess hydro ecologic and landscape changes. Agricultural expansion in the region has led to significant loss of natural vegetation, increased landscape fragmentation, and severe threats to wetland communities and biodiversity. These changes have adversely impacted the hydrological richness that sustains water resources. In recent years, the Bakhira Wetland has also faced challenges such as invasive species encroachment, water quality deterioration, and habitat fragmentation, primarily driven by continuous agricultural development. These issues have further affected migratory bird species, falling the ecological balance of the region. This study used remote sensing data to analyze land use and land cover changes, water extent shrinkage, siltation, aquatic vegetation dynamics, urbanization, and wetland landscape fragmentation. Results revealed a significant decline in water extent during both pre-monsoon and post-monsoon periods, largely due to excessive aquatic plant growth and substantial water withdrawals. The extent of agricultural land in the Bakhira catchment expanded from 62.44 km² in 2000 to 114.93 km² in 2022, while built-up areas grew from 5.77 km² to 8.40 km² over the same period. The study emphasized substantial habitat fragmentation and reduced ecological connectivity, particularly during the dry season, due to intensified human activities. Landscape diversity and fragmentation indices indicated an increase in the number of patches and patch density, reflecting a more fragmented habitat. However, metrics such as the Number of Patches (NP) and the Large Patch Index (LPI) showed a decline, signifying smaller, less cohesive, and more isolated patches. This fragmentation disrupts ecological flows and hinders species movement, raising concerns about long-term biodiversity conservation in the wetland. To address these challenges, sustainable practices in catchment areas are essential. This includes adopting strategies for improved cropland management, water conservation, and wetland rehabilitation. The findings from this study provide valuable insights into the hydrological functioning of wetlands and can guide future efforts in wetland resource protection, sustainable utilization, and the development of infrastructure for rational surface water use. Additionally, restoring degraded agricultural lands is crucial for maintaining ecological balance and ensuring the long-term sustainability of the Bakhira Wetland.

How to cite: Rawat, M., Pandey, A., Yadav, B., and Gupta, P. K.: Assessing the Impact of Land Use and Land Cover Changes on Wetland Landscape Patterns and Hydroecology: A Case Study of the Bakhira Wetland, India, EGU General Assembly 2025, Vienna, Austria, 27 Apr–2 May 2025, EGU25-15274, https://doi.org/10.5194/egusphere-egu25-15274, 2025.

EGU25-15330 | ECS | Orals | BG4.8

Building a Framework to Differentiate between Natural and Drained Peatlands in Europe by comparing Molecular and Remote Sensing Data 

Miriam Groß-Schmölders, Surya Gupta, Annett Wania, Maddie Grady, Jens Leifeld, and Christine Alewell

Peatlands are unique ecosystems with high biodiversity and environmental services such as water filtration and retention as well as carbon storage. Interestingly, however, in contrast to other soils and ecosystems, less is known about the extent and health (natural/rewetted versus drained/ degraded) of European peatlands1. With past human-induced drainage and degradation and recent or emerging restoration, there is an even greater need to monitor the extent and health of European peatlands1. Here we present results of a novel approach to (1) distinguish between unforested peatlands and surrounding areas (forest and grassland), and (2) separate drained/degraded from natural/rewetted peatlands, based on 12 European peatlands in three Köppen-Geiger climate classes2. We compare remote sensing data (Sentinel 2, PlanetScope optical bands) with the molecular composition of surface soils to differentiate between natural and drained peatlands. The peatland vegetation and surrounding areas are seperated based on red and near infrared (NIR) bands3. Furthermore, the natural and drained peatlands are distinguished by their Normalised Difference Vegetation Index (NDVI), Enhanced Vegetation Index Red (EVI), Green Normalised Vegetation Index (gNDVI) and Greenness Index (GI); known indicators of vegetation composition and health3,4. Simultaneously, two types of soil data were measured as indicators of soil health, i) peat stoichiometry (e.g., carbon to nitrogen ratio, degree of carbon oxidation), and ii) peat molecular composition using pyrolysis gas chromatography with integrated mass spectroscopy (PYGCMS), a fast and valid method to study a wide range of molecular compounds5. In particular, we analysed the relative abundance of molecules indicative of different vegetation classes and their transformation products, as well as the relative contribution of microbial input. The results showed that the red and NIR bands were useful to distinguish between grasslands and peatlands as the reflectance of grasslands is significantly high compared to peatlands. In addition, we were able to distinguish between drained and natural peatlands by the optical indices used. The molecular composition and remote sensing indicators of the sites clearly correlated and natural and drained sites could be distinguished. Therefore, remote sensing data might serve as a fast and valid method to obtain information on the extent and health status of European peatlands under different climatic conditions.


REFERENCES

1Andersen, R. et al, https://doi.org/10.1111/rec.12415.

2Kottek, M. et al, https://doi.org/10.1127/0941-2948/2006/0130.

3Burdun, I. et al., https://doi.org/10.1016/j.rse.2023.113736.

4Räsänen, A. et al., https://doi.org/10.1016/j.jag.2022.102866.

5Klein, K. et al., https://doi.org/10.1016/bs.agron.2020.09.002.

How to cite: Groß-Schmölders, M., Gupta, S., Wania, A., Grady, M., Leifeld, J., and Alewell, C.: Building a Framework to Differentiate between Natural and Drained Peatlands in Europe by comparing Molecular and Remote Sensing Data, EGU General Assembly 2025, Vienna, Austria, 27 Apr–2 May 2025, EGU25-15330, https://doi.org/10.5194/egusphere-egu25-15330, 2025.

EGU25-16456 | Posters on site | BG4.8

Automatic Vegetation Mapping in Peatlands Using Drone Imagery and Ecologically Informed Machine Learning 

Mario Trouillier, Daniel, L. Pönisch, Timothy, J. Husting, Henriette Rossa, Milan Bergheim, John Couwenberg, and Gerald Jurasinski

Drained peatlands emit vast amounts of greenhouse gases (GHGs), contributing around 4 % of global GHG emissions. Rewetting peatlands, thus, has the potential to lower global emissions significantly. Restoring drained peatlands to protect the peat body, restore species-rich peat-forming plant communities, and reduce GHG emissions is a long-term process. Monitoring rewetting and restoration of peatlands to quantify (avoided) emissions typically requires either direct measurements via the eddy covariance or closed chamber methods or vegetation maps, as vegetation can be used as a proxy for water-table depths and GHG emissions of peatlands. Both monitoring approaches are expensive and time-consuming, which makes them often unsuitable to monitor large-scale and heterogeneous peatlands over many years. Therefore, new concepts for scalable and efficient monitoring of peatlands are needed.

This research is part of a project that aims to develop an efficient monitoring system for peatlands that scales to hundreds of hectares. Our aim is to identify plant species in (degraded) peatlands using high-resolution drone imagery and a machine learning framework informed by ecological principles. In Northern Germany we acquired RGB (1 cm/px) and multispectral (2 cm/px) imagery using a DJI Mavic 3M quadcopter and processed these data into orthomosaics using WebODM. Additionally, using the point cloud from the photogrammetry process, we derived raster maps of the digital surface model (DSM), standard deviation (a proxy for plant height), and skewness (a proxy for foliage height distribution). In addition to the raster inputs, we used temperature sums (instead of date) and cloud cover percentage as inputs to the model to account for plant phenology and diverse lighting conditions. Our selection of spectral bands, points-cloud derived raster maps and metadata such as temperature sums are ecological informed epistemic priors that aim to increase the model accuracy. Ground truth data (vegetation maps) were generated by mapping the vegetation with an Emlid Reach RS3 Differential Global Positioning System. Since multiple plants can occur together in the same patch, this is a multi-class and multi-label problem from a machine learning perspective. Thus, we used One Hot Encoding to create 3D labels (height × width × species ID).

Our preliminary results show that the accuracy of machine learning models can be improved by providing the models with ecologically informed priors like plant heights and temperature sums, but the ground sampling distance remains the limiting factor for classification accuracy. Next, we will fuse our automatically generated vegetation maps with hydrological information derived from water level measurements to generate high resolution maps of GHG emissions of peatlands.

How to cite: Trouillier, M., Pönisch, D. L., Husting, T. J., Rossa, H., Bergheim, M., Couwenberg, J., and Jurasinski, G.: Automatic Vegetation Mapping in Peatlands Using Drone Imagery and Ecologically Informed Machine Learning, EGU General Assembly 2025, Vienna, Austria, 27 Apr–2 May 2025, EGU25-16456, https://doi.org/10.5194/egusphere-egu25-16456, 2025.

EGU25-21357 | Posters on site | BG4.8

Water governance in transboundary lakes: Earth Observation Data for Objective decisions  

Tania Fernanda Santos Santos and Gustavo Ayala

Water governance in transboundary lakes and wetlands where there are shared water bodies between countries presents significant challenges due to cultural diversity, differences in regulations, and conflicts over water use. In this paper, we will evaluate the water governance mechanisms developed in Latin America for the coordinated management of wetlands and lakes. We will show the challenges in two systems with a shared institution for lake management: the Lempa river basin between El Salvador, Honduras and Guatemala, and Lake Titicaca between Bolivia and Peru. Through the evaluation in workshops and a survey with the members of these institutions, we gather lessons learned on how the constitution of these institutions allows countries to address the coordinated management of water bodies and wetlands. Using earth information data, it is possible to objectively evaluate water dynamics in terms of quality and quantity, overcoming political will barriers. 

How to cite: Santos Santos, T. F. and Ayala, G.: Water governance in transboundary lakes: Earth Observation Data for Objective decisions , EGU General Assembly 2025, Vienna, Austria, 27 Apr–2 May 2025, EGU25-21357, https://doi.org/10.5194/egusphere-egu25-21357, 2025.

EGU25-3024 | Orals | BG4.11

Mapping vulnerable organic carbon in Norway’s continental margin sediments 

Markus Diesing, Marija Sciberras, Terje Thorsnes, Lilja Rún Bjarnadóttir, and Øyvind Grøner Moe

Continental margin sediments are a major hotspot for organic carbon burial and play a vital role in the carbon cycle. Disturbance of sedimentary organic carbon by human activities such as mobile bottom fishing might lead to (i) reductions of the organic carbon stocks, (ii) impacts on carbon cycling, primary productivity and biodiversity and (iii) ocean acidification and atmospheric CO2 emissions. Spatially explicit studies that have been conducted to inform marine management have so far looked at organic carbon stocks that have already been affected by mobile bottom fishing. Here, we focus instead on areas on the Norwegian continental margin that have not been fished previously, based on fishing data covering the years 2009 – 2020. We estimate that the surface sediment layer (0 – 2 cm) in unfished areas covering 765,600 km2 contains 139.2 Tg of organic carbon. Based on data from a meta-analysis of demersal fishing impacts on organic carbon density, we estimate that 16.4 Tg (1.8 – 29.6 Tg) of organic carbon might be vulnerable to mobile bottom fishing. Of this, approximately one third is currently located in existing area-based protection measures. Additional protection could be guided by hotspots of vulnerable organic carbon, which are found in the Barents Sea. We argue that the protection of vulnerable organic carbon that is at high risk of being lost in areas becoming accessible to fishing due to sea ice retreat in the northern Barents Sea should be prioritised over easing pressure on already impacted organic carbon stocks.

How to cite: Diesing, M., Sciberras, M., Thorsnes, T., Bjarnadóttir, L. R., and Moe, Ø. G.: Mapping vulnerable organic carbon in Norway’s continental margin sediments, EGU General Assembly 2025, Vienna, Austria, 27 Apr–2 May 2025, EGU25-3024, https://doi.org/10.5194/egusphere-egu25-3024, 2025.

Physical disturbance of the seafloor related to bottom trawling has led to widespread concern within the scientific community, as it may cause long-lasting impacts to benthic ecosystems, sediment composition, and biogeochemical cycling. Although trawling-induced effects on benthic habitats have been widely studied, the effects on sediment carbon mineralization and carbon stocks on the seabed remain unclear. Most of the catch obtained by bottom trawling is harvested from productive continental shelves, which play an important role in carbon sequestration and burial. Parts of the Baltic Sea have been trawled between one to ten times annually and thus provide a prime locality to study trawling related effects on benthic ecosystems and on the geochemical system. This study investigates the effects of trawling on carbon mineralization within the Bornholm Basin of the southern Baltic Sea, which has been consistently trawled until 2019. This was achieved through on-site sampling and analysis of porewater geochemistry, solid-phase sediment profiles, benthic fluxes and macrofaunal abundances sampled in the summer of 2023.

Comparisons between 4 study sites, paired into high-and low-trawled pairs based on fishing intensity data, revealed greater differences in measured physical and chemical properties than those between high- and low-trawled locality pairs, suggesting that environmental variability significantly influences carbon mineralization. However, high-trawled areas generally exhibited higher concentrations of TOC (total organic carbon) in their sediments as well as higher DIC (dissolved inorganic carbon) and nutrients in their porewaters. The higher porewater concentrations are likely a result of reduced advective transport and macrofaunal-related mixing, as a consequence of lower bioturbation and bioirrigation, whereby mineralization end-products (NH4+, PO43- and DIC) accumulate in porewaters due to slow upward diffusive transport to the sediment surface in comparison to low-trawled localities. Chlorophyll concentrations at the sediment surface from recently settled organic material from the spring phytoplankton bloom were higher at high-trawled localities and likely associated with the decreased macrofauna biomass and grazing activity. It is concluded that biogeochemical ecosystem functions in once-trawled sediment biotopes are only partially reconstituted after 4 years, with lasting differences in macrofaunal benthic community structure and bioturbation potential.    

How to cite: Golda, C., Brüchert, V., and Bradshaw, C.: Impact of benthic trawling on carbon mineralization in continental shelf sediments of the Bornholm Basin, southern Baltic Sea, EGU General Assembly 2025, Vienna, Austria, 27 Apr–2 May 2025, EGU25-4432, https://doi.org/10.5194/egusphere-egu25-4432, 2025.

Coastal sediments act as a huge reservoir of sedimentary organic carbon (SOC). Yet, the processes governing the long-term burial and preservation of this type of coastal organic carbon are complex and depend on the interplay between several factors, such as sedimentation rates, regional climatic conditions, post-depositional biological activity, and degradation. All these factors can significantly vary spatio-temporally within local micro-environmental conditions. The present study aims to understand the preservation of organic matter from two distinct climate zones of tropical India, the humid eastern lower Gangetic floodplain containing mangroves (average annual precipitation ranging ~1200–1600 mm) and the dry western Kachchh basin, which is essentially a salt flat (average annual precipitation ranging ~ 200–400 mm). At both places, sedimentation rates, total organic carbon (TOC), separated labile and refractory fractions of SOC (through chemical oxidation method), and their stable carbon isotopic (δ13C) compositions have been compared. The available data, along with the results from the present study, show that the sedimentation rate patterns through the Holocene are comparable at both study sites, showing higher rates (~0.4–0.6 cm/yr) up till Mid-Holocene which decreases to <0.05 cm/yr during the Late Holocene. The TOC ranges from 0.1 to 1.0% in Kachchh (average ~0.4%) and 0.2 to 2.1% in the lower Ganges floodplain (average ~0.6%). However, when the bulk and refractory fractions of SOC are compared, they reveal distinct patterns. The Gangetic floodplain exhibits a difference in the bulk and refractory δ13C values as it contains more labile and partially decomposed organic matter. In contrast, the Kachchh sediment shows consistent δ13C values in both the bulk and refractory fractions, indicating negligible presence of labile or decomposed organic matter. These findings suggest that in arid climates, the SOC is predominantly deposited in oxidized conditions, thus comprising mainly the refractory fraction of organic matter. At the same time, in humid environments, the SOC includes a mixture of labile and partially decomposed organic matter. This comparative study provides an example of how climatic variability plays a critical role in shaping SOC characteristics in otherwise similar depositional settings and emphasizes the importance of studying both labile and refractory fractions of SOC for reconstructing past climates.

How to cite: Ram, F.: Nature of organic matter preservation in coastal sediments: Insights from humid to arid climatic regimes of India., EGU General Assembly 2025, Vienna, Austria, 27 Apr–2 May 2025, EGU25-5189, https://doi.org/10.5194/egusphere-egu25-5189, 2025.

EGU25-5947 | Posters on site | BG4.11

Reconstructing past tidal dynamics and sediment transport on the Patagonian Shelf: implications for Blue Carbon 

Sophie Ward, Zoe Roseby, Sarah Bradley, and James Scourse

Mapping and understanding the distribution of seabed sediments in shelf seas is crucial for sustainable coastal management, offshore activities, and assessing and conserving Blue Carbon stocks. Fine-grained sediments, such as mud, play a vital role in long-term organic carbon storage, and so it is essential to map and measure the extent of these carbon-rich deposits across shelf seas. However, despite their importance in the global carbon cycle, many regional shelf seas, such as the Patagonian Shelf, remain poorly studied. We present a novel high-resolution palaeotidal model for the Patagonian Shelf and consider how changing tidal dynamics since the Last Glacial Maximum have contributed to the development and preservation of mud deposits across the shelf. The simulations are compared with existing seabed substrate data to identify correlations between spatial and temporal changes in tidally driven parameters with the locations of muddy, often carbon-rich, deposits. We utilise observational data gathered through an extensive data mining exercise of the region, which includes grain size data and total organic carbon data. This work both enhances understanding of the region's palaeoenvironmental dynamics and highlights opportunities for future research, including synthetic mapping approaches and carbon stock analyses.

How to cite: Ward, S., Roseby, Z., Bradley, S., and Scourse, J.: Reconstructing past tidal dynamics and sediment transport on the Patagonian Shelf: implications for Blue Carbon, EGU General Assembly 2025, Vienna, Austria, 27 Apr–2 May 2025, EGU25-5947, https://doi.org/10.5194/egusphere-egu25-5947, 2025.

EGU25-7278 | ECS | Posters on site | BG4.11

Decoding impacts of modern human development on terrestrial organic carbon sequestration seaward of the Ayeyarwady-Thanlwin rivers 

Evan Flynn, Steven Kuehl, Valier Galy, Manuel Colombo, and Courtney Harris

Continental shelf mud deposits off large rivers are substantial repositories for organic carbon; however, many of these rivers and the deltas they build have been extensively modified to support the development of growing coastal populations. While such modification is dramatic for most large Asian rivers (e.g., the Chang Jiang, Huang He, and Ganges-Brahmaputra), the Ayeyarwady-Thanlwin rivers remain an exception because of the absence of dams on the mainstems. Despite this, increased deforestation and associated land use change over the last 50 years has begun to alter fluvial sediment loads for this system, likely impacting the flux of sediment-bound terrestrial organic carbon to the global ocean. Together the Ayeyarwady- Thanlwin rivers transport a globally significant ~ 485 Mt yr-1 of sediment and as much as 7.7 Mt yr-1 of particulate organic carbon to the Northern Andaman Sea, where extreme tides in the Gulf of Martaban cause extensive resuspension of material prior to accumulation as a muddy, mid-shelf clinoform. Based on bulk stable isotope analyses, frequent resuspension of the seabed in the Gulf of Martaban creates a low-pass filter for geochemical signatures, effectively limiting signals of land use change during the past century. Whereas previous bulk analyses have indicated that terrestrial organic carbon may be remineralized during across-shelf transport, ramped pyrolysis/oxidation and radiocarbon methods show consistent terrestrial organic carbon character and content across the shelf, indicating that refractory terrestrial organic carbon dominates shelf deposits.  Comparing these findings with organic signatures of the rivers’ sediments, we suggest that significant remineralization of labile terrestrial material may occur prior to reaching the open shelf. Our findings also suggest that bulk sediment analyses have generally underestimated offshore terrestrial organic carbon content, which substantially impacts the derivation of carbon budgets for the Ayeyarwady-Thanlwin and other systems. While terrestrial organic carbon content in the offshore delta is currently high, with little indication of modern human impacts in the sediment record, organic carbon accumulation has the potential to be drastically impacted by future planned mainstem dam installation as well as changing climate (e.g., monsoon patterns and cyclone frequency and strength). Anticipated mainstem damming will likely alter the nature and magnitude of terrestrial organic carbon on the shelf due to increased reservoir retention and reduced sediment load. The consequent reduction in sediment supply may also drive the erosion of the clinoform, re-exposing and redistributing previously sequestered material on the shelf. The frequency of cyclonic activity and monsoon strength are also likely important climatic controls on offshore carbon delivery and sequestration. While the offshore Ayeyarwady delta currently exhibits minimal impacts from human activity, we predict that future damming and changes in climate will substantially alter terrestrial organic carbon sequestration in the offshore Ayeyarwady Delta, impacting both regional and global carbon budgets.

How to cite: Flynn, E., Kuehl, S., Galy, V., Colombo, M., and Harris, C.: Decoding impacts of modern human development on terrestrial organic carbon sequestration seaward of the Ayeyarwady-Thanlwin rivers, EGU General Assembly 2025, Vienna, Austria, 27 Apr–2 May 2025, EGU25-7278, https://doi.org/10.5194/egusphere-egu25-7278, 2025.

EGU25-9573 | Orals | BG4.11

Assessing seabed carbon storage and sequestration (Blue Carbon): response to pressures and management interventions 

Ruth Parker, John Aldridge, Louise Brown, David Clare, Franck Dal Molin, Clement Garcia, David Hughes, Clare Hynes, Claire Mason, Roi Martinez, Robert McEwan, Claire Powell, William Proctor, and Carolyn Graves

The subtidal seabed sedimentary habitats in the UK’s English waters contain between 80 and 100 Mt of organic carbon (OC) and so have a significant climate change mitigation potential (as Blue Carbon). Although it is known that OC input (amount and rate) and composition (source and reactivity), sediment type and environmental setting (e.g., temperature, oxygen) control both amount of OC stock and OC burial rates, the regional understanding of the links between these controls, their spatial variability remains poorly understood.  

Much of the UK’s shelf seabed organic carbon stock is under pressure from physical disturbances by various human activities, significantly trawling as well as climate forcing processes and temperature increases. These pressures promote changes in OC status and climate regulation service provision (storage and burial), although the net direction of change is highly uncertain. Management of human activities, including protection or restoration of seabed areas containing OC, may therefore provide a significant Nature-based Solution (NbS) to climate change itself.

We present an exemplar case study in the North Sea which aimed to identify and explore regions of OC climate regulation service provision and draw together evidence strands to support management decisions and measures to allow optimisation of sedimentary OC (‘Blue Carbon’) to mitigate climate change.

Three key aspects and related questions are addressed:

  • Organic carbon storage and burial in space across the shelf: what drives variability, and what is the role of OC composition, source and reactivity?
  • Present pressures on seabed carbon: Where is OC storage under pressure? By how much? What is the potential impact?
  • Policy and management: How can this evidence base inform management interventions and measures, including protection and recovery measures which promote the potential of the seabed climate change regulation service (blue carbon)?

Within each element insights into the developing underpinning datasets, future approaches needed, and remaining knowledge gaps and priorities will be presented.

How to cite: Parker, R., Aldridge, J., Brown, L., Clare, D., Dal Molin, F., Garcia, C., Hughes, D., Hynes, C., Mason, C., Martinez, R., McEwan, R., Powell, C., Proctor, W., and Graves, C.: Assessing seabed carbon storage and sequestration (Blue Carbon): response to pressures and management interventions, EGU General Assembly 2025, Vienna, Austria, 27 Apr–2 May 2025, EGU25-9573, https://doi.org/10.5194/egusphere-egu25-9573, 2025.

EGU25-10160 | ECS | Posters on site | BG4.11

Determination of Blue Carbon accumulation rates in sediments impacted by legacy oil and gas extraction activities  

Hugo Woodward-Rowe, Franck Dal Molin, John Jervis, Ruth Parker, Terri Davis, and Natalie Hicks

Continental shelf sediments are vast areas, some regions of which accumulate and store organic carbon. However, these regions are increasingly impacted by anthropogenic pressures, particularly from infrastructure related to energy extraction. While determining the standing stock of carbon within sediment provides a useful snapshot for current carbon budgets, directly measuring the accumulation potential allows for assessments of how inputs which drive carbon stocks will vary temporally and defines the climate regulation service (aka ‘blue carbon’) in space. However, estimating carbon accumulation potential of sediments can be confounded by anthropogenic activity, particularly around oil and gas extraction activities.

This study describes carbon stocks, sediment type and carbon accumulation rates (CARs) in sediment surrounding the North West Hutton decommissioned platform in the northern North Sea. By accounting for heavy metals derived from ICP-MS to create correction factors, previous estimates of CARs from gamma spectrometry have been corrected and CARs close to North West Hutton, which were previously undetermined, have been calculated. Results show that CARs determined by gamma spectrometry alone are consistently lower than those corrected by heavy metal attenuation factors and also using polonium-210 measurements from alpha spectrometry analysis. This work indicated that CARs could be underestimated in regions directly impacted by heavy metals associated with the extraction activity.

This novel method provides an opportunity to determine CARs in other marine areas impacted by similar chemical pollution pressures. Many coastal regions across Europe are directly affected by legacy or operational industrial discharges of waste containing enhanced levels of heavy metals and natural radioactivity, also known as NORM, in particular from mineral mining, extraction and processing activities. This work highlights  the potential underestimation in the offshore environment, but if this approach is applied to coastal sites where accumulation rates are generally considerably higher, and impacted by industry, this could have widespread implications for service assessments and blue carbon accounting.


How to cite: Woodward-Rowe, H., Dal Molin, F., Jervis, J., Parker, R., Davis, T., and Hicks, N.: Determination of Blue Carbon accumulation rates in sediments impacted by legacy oil and gas extraction activities , EGU General Assembly 2025, Vienna, Austria, 27 Apr–2 May 2025, EGU25-10160, https://doi.org/10.5194/egusphere-egu25-10160, 2025.

EGU25-10289 | Orals | BG4.11

Relative effects of bottom trawling and environmental factors on sedimentary carbon properties and degradation in the heavily trawled Kattegat 

Clare Bradshaw, Mats Blomqvist, Mattias Sköld, Claudia Ennas, Laura Seidel, Adele Maciute, and Antonio Pusceddu

Recent reviews have highlighted that the effect of bottom trawling on sediment carbon content and biogeochemistry varies depending on environmental conditions, the type of sediment (e.g. mud vs sand) and the chemical nature of the organic carbon. However, most data are from analyses of total carbon or organic matter and from bulk surface sediments (top 2 cm) rather than deeper sediment profiles, limiting our ability to interpret these results in terms of the biogeochemical processes involved in carbon degradation and burial.

The Kattegat is one of the most heavily trawled seas in the world with some parts being swept by fishing gear up to 15 times per year. However, fishing effort is patchy and there is also a marine protected area where bottom trawling is forbidden; the resulting large range in trawling disturbance makes the Kattegat an ideal site for studying potential impacts on the seafloor.

We analysed sediments across the trawling gradient, in 1cm-layers downcore, and determined the relative effect of trawling intensity and environmental variables (e.g. bottom water oxygen, sediment grain size) and biological variables (e.g. bioturbation) on sediment carbon content, reactivity and degradation rates. In general, environmental factors and physical properties of the sediment appeared to be the strongest explanatory variables, with trawling intensity being less important. The best explanatory variables also varied depending on the sediment depth analysed, potentially due to the relative importance of seasonal inputs of fresh organic carbon at the sediment surface, mixing depth and type of bioturbation and penetration depth of the trawls.

How to cite: Bradshaw, C., Blomqvist, M., Sköld, M., Ennas, C., Seidel, L., Maciute, A., and Pusceddu, A.: Relative effects of bottom trawling and environmental factors on sedimentary carbon properties and degradation in the heavily trawled Kattegat, EGU General Assembly 2025, Vienna, Austria, 27 Apr–2 May 2025, EGU25-10289, https://doi.org/10.5194/egusphere-egu25-10289, 2025.

EGU25-10366 | Posters on site | BG4.11

Mapping free gas surfaces in Baltic Sea sediments 

Peter Feldens and Elisabeth Seidel

Sediment echo sounder data are routinely collected during research cruises with a geophysical or geological programme. This has resulted in the accumulation of huge amounts of sub-bottom data over the last decades (more than 30,000 survey lines of variable length in the Baltic Sea for the IOW alone), which are often not further interpreted. On the other hand, the value of these datasets for research and industry is increasing, as new regulations (e.g. related to the establishment of marine protected areas) and offshore infrastructure (e.g. wind farms) often prohibit the collection of new survey data. Current topics of interest in the Baltic Sea include the reconstruction of the Late Pleistocene to Holocene palaeogeography of the Baltic Sea and the identification of fluid flow and free methane in the subsurface. The latter can be used to assess the potential release of methane from carbon-rich sediments accumulating in the Baltic Sea basins by identifying the extent, depth and temporal variation of free gas surfaces (e.g. due to seasonal effects and changing wind conditions) in sediment echosounder data. Free gas in the subsurface and water column is readily identified in sediment echosounder and low-frequency multibeam echosounder data due to the increase in acoustic impedance between water-saturated sediments and gas.  Information on methane release is needed to assess the suitability of natural sediments in the Baltic Sea basins as a long-term carbon sink. The methane reservoirs in the southern Baltic Sea are related to various sedimentary and tectonic situations. The frequent generation of methane due to organic carbon accumulation, which is released into the water column and potentially the atmosphere, would have an antagonistic effect on carbon burial. Due to the large amount of data available, a deep learning model (U-Net) is trained on sediment echo sounder data from the Arkona Basin in the southern Baltic Sea to identify free gas surfaces and their depth below the surface. The parameters of the free gas surfaces are related to the thickness of the Late Pleistocene and Holocene sedimentary units (Baltic Ice Lake, Ancylus Lake and Littorina Sea). Repeated lines of sediment echo sounder data allow assessment of changes in spatial extent and depth of free gas through time.

How to cite: Feldens, P. and Seidel, E.: Mapping free gas surfaces in Baltic Sea sediments, EGU General Assembly 2025, Vienna, Austria, 27 Apr–2 May 2025, EGU25-10366, https://doi.org/10.5194/egusphere-egu25-10366, 2025.

EGU25-10839 | Posters on site | BG4.11 | Highlight

Organic Carbon Burial in Global Continental Margin Sediments 

Sandra Arndt, Markus Diesing, Dominik Hülse, Sarah Paradis, and Craig Smeaton

Continental margin sediments are key long-term sinks for atmospheric carbon dioxide (CO₂). Despite their global significance, the magnitude and spatial distribution of organic carbon (OC) burial in this environment remains poorly quantified mainly due to the exceptional heterogeneity of the coastal ocean. Yet, this knowledge is critical not only for closing the global carbon budget but also for guiding policy decisions. Here, we integrate the rapidly growing observational data set with spatial machine learning and inverse as well as forward reaction-transport modelling, capturing the spatial heterogeneity of global continental margins to deliver robust OC flux estimates.

We estimate a global continental margin OC burial flux of 441 Tg C yr⁻¹ through the base of the mixed layer, decreasing to 293 Tg C yr⁻¹ at the 1 kyr age horizon (<1–33 m sediment depth). Approximately 70% of this burial occurs in the northern hemisphere, and >50% is concentrated within the latitudinal band 10°S–30°N. Using the MARgins and CATchments Segmentation framework, tropical regions show the highest OC flux densities and total long-term burial flux globally (5.4 tC km-2 yr⁻¹ and 64 Tg C yr⁻¹). In addition, polar regions and marginal seas also reveal high total long-term burial fluxes (42 Tg C yr⁻1 and 35 Tg C yr⁻¹). In polar regions, high burial is driven by modest OC flux densities over vast areas, while marginal seas exhibit high flux densities but limited spatial extent. Each of the other MARCAT regions contributes less than 15% to global OC burial. We thus find the highest OC burial rates in the Exclusive Economic Zones (EEZs) of Indonesia (27 Tg C yr⁻¹) and Russia (20 Tg C yr⁻¹), followed by the EEZs of the Philipines, Antarctica, the United States, Japan, Papua New Guinea, Canada, New Zealand, Brazil, Yemen, and Mexico (each accounting for 2-5% of global OC burial). The EU EEZs collectively bury approximately as much OC as the Russian EEZ.

When combined with global radiocarbon data for organic carbon (OC), our global estimates reveal several hotspots of young, marine-derived OC burial that actively remove contemporary atmospheric CO₂. These regions include tropical margins such as the Sunda Shelf, the Caribbean coastal zones, the western coast of Mexico, and the South China Sea, as well as marginal seas. In contrast, other burial hotspots—such as tropical margins adjacent to large river deltas or the Arctic shelf—predominantly sequester older, pre-aged terrestrial OC and petrogenic OC. While OC burial in these areas has a limited direct impact on contemporary CO₂ levels, it plays a crucial role in the modern carbon cycle by preventing the release of this geological carbon through microbial degradation.

How to cite: Arndt, S., Diesing, M., Hülse, D., Paradis, S., and Smeaton, C.: Organic Carbon Burial in Global Continental Margin Sediments, EGU General Assembly 2025, Vienna, Austria, 27 Apr–2 May 2025, EGU25-10839, https://doi.org/10.5194/egusphere-egu25-10839, 2025.

EGU25-11525 | Posters on site | BG4.11

Corrected Pb-210 based estimations of accumulation rates in marine sediments contaminated by legacy NORM discharges 

Franck Dal Molin, Hugo Woodward-Rowe, Terri Davis, John Jervis, Ruth Parker, and Natalie Hicks

In recent years, the lead-210 (210Pb) geochronological tool has been extensively utilised to determine the burial rate of Blue Carbon in various marine environments. Numerous physical disturbances, originating from both anthropogenic and natural sources, can influence its applications. Additionally, many non-nuclear industries discharge waste containing elevated levels of naturally occurring radioactive materials, known as NORM industries, which presents another challenge if sediment cores are collected near such industrial activities.

The presence of anthropogenically derived 210Pb and radium-226 (226Ra) is often associated with high concentrations of heavy elements such as aluminium, barium, iron, manganese, strontium, zinc, and lead. These elements can significantly impact the direct measurement of 210Pb via gamma spectrometry and, subsequently, the application of various 210Pb-based dating techniques, making estimates of accumulation rates particularly challenging.

In this study, several sediment cores were collected in proximity to a decommissioned oil and gas platform located offshore in the UK North Sea (North West Hutton (NWH), 61.11N, 1.31E). Elemental and radioelemental signatures from legacy NORM discharges were observed in the sediment cores collected within 200 metres north and south of the former NWH platform and were thoroughly characterised using ICP-MS and gamma spectrometry, respectively. This enabled the forensic differentiation of the NORM-derived 226Ra fraction from the natural background and the generation of relative factors based on bulk elemental composition analysis to correct 210Pb results obtained from initial gamma spectrometric analysis. This corrective approach was validated by measuring polonium-210, a decay product of 210Pb, via alpha spectrometry, and allowed the estimation for the first time of carbon accumulation rates in sediment cores using different modelling approaches (CIC, CFCS, CRS, and RPLUM).

How to cite: Dal Molin, F., Woodward-Rowe, H., Davis, T., Jervis, J., Parker, R., and Hicks, N.: Corrected Pb-210 based estimations of accumulation rates in marine sediments contaminated by legacy NORM discharges, EGU General Assembly 2025, Vienna, Austria, 27 Apr–2 May 2025, EGU25-11525, https://doi.org/10.5194/egusphere-egu25-11525, 2025.

EGU25-12515 | ECS | Posters on site | BG4.11

Combining sediment analysis with geospatial mapping to quantify carbon sequestration by an eelgrass bed on the Nova Scotian coast, eastern Canada.  

Emma Taniguchi, Amy Mui, Kristina Boerder, Markus Kienast, and Craig Brown

In recent years, seagrass has been presented as a solution to sequester excess carbon emissions from the atmosphere, with studies reporting that seagrass meadows are responsible for burying as much as 10% of anthropogenic carbon per year (Fourqurean et al. 2012). However, this estimate has started to seem improbable as more recent research, specifically from North American study sites, are reporting carbon stock estimates much lower than the global average. Here, we present estimates of organic carbon (OC) stock in an eelgrass meadow on the Eastern Shore of Nova Scotia, Canada. To quantify sediment OC stock, we combined sediment geochemical analysis with geospatial mapping based on high-resolution optical aerial imagery collected by drone flights. Three sediment cores, plus a control, were extracted from the meadow in regions with differing levels of vegetative cover. The control core was used to establish a background signal for sediment OC, which we assume to be representative of nearshore unvegetated sediments in the region.

Despite the health and anecdotally reported longevity of this eelgrass meadow measuring 4.7 Ha in size, the carbon stock is estimated to be less than 10 Mg OC/Ha. This is significantly lower than the global average estimates of ~163.3-660 Mg/Ha (Fourqurean et al. 2012) but is comparable to other reports emerging from the North American east coast (eg. 3.7 Mg/Ha from coastal Virginia, US: Greiner et al. 2013). From the individual core slices, the maximum sediment OC did not exceed 2.5 weight % even in the densest, healthiest part of the meadow. There was also a notable correlation between presence of coarse biomass and higher sediment OC in the bulk sample, suggesting that the carbon is mostly associated with living biomass rather than being buried and stored in sediments. Further, radiocarbon ages of the bulk OC of up to 1140 years in the topmost sediment layer imply a significant admixture of pre-aged, likely terrestrial, OC to the bulk OC, rendering the stock estimates absolute maximum estimates. Overall, this study adds to the growing body of evidence that suggests that global estimates of OC storage in eelgrass beds need to be carefully reevaluated. 

How to cite: Taniguchi, E., Mui, A., Boerder, K., Kienast, M., and Brown, C.: Combining sediment analysis with geospatial mapping to quantify carbon sequestration by an eelgrass bed on the Nova Scotian coast, eastern Canada. , EGU General Assembly 2025, Vienna, Austria, 27 Apr–2 May 2025, EGU25-12515, https://doi.org/10.5194/egusphere-egu25-12515, 2025.

EGU25-13070 | Orals | BG4.11

Not all continental shelf seafloor is the same: detailed sediment characterization dramatically reduces estimates of organic carbon standing stock 

Markus Kienast, Catherine Brenan, Vittorio Maselli, Christopher Algar, Benjamin Misiuk, and Craig Brown

Continental shelf sediments contain some of the largest stocks of organic carbon (OC) on Earth and critically influence the global carbon cycle. Quantifying how much OC continental shelves store and determining its residence time is key to assess how the ocean carbon cycle will be altered by climate change and anthropogenic perturbations of the seabed. Spatial variations in terrestrial carbon stocks are well studied and mapped at high resolution, but our knowledge of the distribution of marine OC in different seafloor settings is still very limited, particularly in dynamic and spatially variable shelf environments. This lack of knowledge reduces our ability to understand and predict how much and for how long the ocean sequesters CO2.

In this study, we use high-resolution multibeam echosounder (MBES) data from the Eastern Shore Islands offshore Nova Scotia (Canada), combined with OC measurements from discrete samples, to assess the distribution of OC content in seafloor sediments. We derive four different spatial estimates of organic carbon stock: (i) OC density estimates scaled to the entire study region assuming a homogenous seafloor, (ii) interpolation of OC density estimates using empirical Bayesian kriging, (iii) OC density estimates scaled to areas of soft substrate estimated using a high-resolution classified substrate map, and (iv) empirical Bayesian regression kriging of OC density within areas of estimated soft sediment only. These four distinct spatial models yielded dramatically different estimates of standing stock of OC in our study area of 223 km2: 80,901, 58,406, 16,437 and 6,475 t of OC, respectively. Our study demonstrates that high-resolution mapping is critically important for improved estimates of OC stocks on continental shelves and for the identification of carbon hotspots that need to be considered in seabed management and climate mitigation strategies. These results will be discussed in the larger context of OC storage on the Atlantic Canadian Shelf.

How to cite: Kienast, M., Brenan, C., Maselli, V., Algar, C., Misiuk, B., and Brown, C.: Not all continental shelf seafloor is the same: detailed sediment characterization dramatically reduces estimates of organic carbon standing stock, EGU General Assembly 2025, Vienna, Austria, 27 Apr–2 May 2025, EGU25-13070, https://doi.org/10.5194/egusphere-egu25-13070, 2025.

EGU25-15835 | ECS | Posters on site | BG4.11

Soil organic carbon preservation and decay trends in tidal marsh, mangrove and seagrass blue carbon ecosystems 

Nerea Piñeiro-Juncal, Miguel Ángel Mateo, Carmen Leiva-Dueñas, Eduard Serrano, Karina Inostroza, Montserrat Soler, Eugenia Apostolaki, Paul Lavery, Carlos Duarte, Anna Lafratta, and Oscar Serrano

The management of coastal blue carbon ecosystems can contribute to mitigate anthropogenic greenhouse gas emissions. However, limited information on soil organic carbon (OC) decay rates in tidal marsh, mangrove and seagrass soils hinders their inclusion in climate strategies and carbon-crediting schemes. Here, we analyzed downcore OC trends in 3,733 soil cores from blue carbon ecosystems worldwide. A decrease in OC content with soil depth was measured in 63% of the cores, whereas stable and increasing trends were observed in 23% and 14% of the cores, respectively. Based on 75 profiles where OC decay could be modelled, the OC decay rate in blue carbon ecosystems was 0.024±0.002 yr-1 over the last 100 years and 0.007±0.0007 yr-1 over the last 1,000 years. This results in the stabilization of 9% and 0.1% of the soil OC inputs 100 and 1,000 yr after burial, respectively, showcasing the long residence time of OC in the sinks associated to blue carbon ecosystems. The models provided can inform baseline scenarios towards the implementation of carbon-crediting schemes.

How to cite: Piñeiro-Juncal, N., Mateo, M. Á., Leiva-Dueñas, C., Serrano, E., Inostroza, K., Soler, M., Apostolaki, E., Lavery, P., Duarte, C., Lafratta, A., and Serrano, O.: Soil organic carbon preservation and decay trends in tidal marsh, mangrove and seagrass blue carbon ecosystems, EGU General Assembly 2025, Vienna, Austria, 27 Apr–2 May 2025, EGU25-15835, https://doi.org/10.5194/egusphere-egu25-15835, 2025.

EGU25-17000 | ECS | Posters on site | BG4.11

Assessing marine sedimentary carbon disturbance and seabed recovery in response to benthic trawling: a case study in the Celtic Sea 

Phoebe Walsh, Anthony Grey, Ciara Ní Mhaoldomhnaigh, William Hunter, Brian Kelleher, David Stokes, and Mark Coughlan

Bottom trawling is a widespread fishing practice that has consistently been established to result in harmful, enduring effects including physical modification of the seafloor, and impacts on biogeochemical cycling as well as benthic ecosystems. The mechanisms of the equipment used, such as trawl doors, penetrate the seafloor and disturb the sediment structure, resuspending particulate matter and altering the seafloor's organic matter composition and morphology. 


Previous studies have assessed the impacts of trawling on carbon storage in marine sediments, utilising sediment samples obtained from the seafloor and the water column to analyse the volume of sediment disturbed physically and geochemically. Additionally, Vessel Monitoring System (VMS) data has been employed to track fishing vessels and determine fishing intensity. These datasets are then widely used to determine the sedimentological and geochemical response to the trawl activity to demonstrate the potential global implications for disturbances in Blue Carbon environments regarding carbon remineralisation. However, post-trawl sampling intervals are irregular, differing in frequency and sampling methodology across studies. 


The Celtic Sea is an area of significant trawling activity, with a region known as “The Smalls”, a particular area of focus as a Nephrops fishing ground. The area comprises a predominantly muddy substrate and is intensely trawled using Otter trawl gear. A field experiment was conducted at two sites in the Celtic Sea in 2024 investigating the sediment and organic matter recovery following a trawl event. To do so, a benthic lander was deployed to measure seafloor community oxygen consumption rates. Sediment cores (30 cm) were recovered to calculate and qualify organic carbon stocks in addition to particle size analysis. Similarly, water samples were gathered near the seafloor to measure suspended sediment concentrations. Geophysical data was also gathered to measure seafloor sediment volumetric changes, persistence of trawl scars and sediment plume dynamics. The two sites examined in this study differed in their substrate type, with one site comprising muddy sediment and another slightly coarser silty sediment. A coordinated effort with the Irish Groundfish Survey (IGFS) allowed researchers to survey the two sites 12-24 hours in advance of a trawl occurring, establishing a baseline of environmental conditions. A geophysical survey was conducted in unison with the IGFS during trawling events and the area was then resurveyed over a time series of 1 hour to a week post trawl. Establishing pre-, during and post-trawl conditions at the two trawl sites and offering a thorough understanding of how the sedimentary carbon properties change following anthropogenic disturbance. 


Results indicate that oxygen consumption increased three times the original pre-trawled levels following a trawl event, with implications for carbon release. The use of ramped pyrolysis oxidation on core samples will elucidate changes in sedimentary organic carbon quality through carbon transformation/remineralisation. Different substrates at the two sites will allow for the analysis of differing sediment plume dynamics, with the finer substrate remaining in suspension for longer, potentially increasing transformation in the water column. The results of this study have implications for marine management in the area in the context of anthropogenic sediment disturbance. 

How to cite: Walsh, P., Grey, A., Ní Mhaoldomhnaigh, C., Hunter, W., Kelleher, B., Stokes, D., and Coughlan, M.: Assessing marine sedimentary carbon disturbance and seabed recovery in response to benthic trawling: a case study in the Celtic Sea, EGU General Assembly 2025, Vienna, Austria, 27 Apr–2 May 2025, EGU25-17000, https://doi.org/10.5194/egusphere-egu25-17000, 2025.

EGU25-17437 | ECS | Posters on site | BG4.11

Evolution and vulnerability of blue carbon stocks in a continental shelf mud depocenter: Fladen Ground, North Sea 

Torsa Sengupta, Zoe Roseby, Sophie Ward, Danielle Vosper, Maarten Blaauw, and James D Scourse

Muddy sediments across continental shelves serve as a reserve for blue carbon and act as a natural carbon sink, supporting the buffering ability of shelf seas against the global rise in carbon dioxide and associated climate warming. However, these areas are also exposed to anthropogenic activities, mainly fishing and bottom trawling, increasing the probability of additional carbon loss by remineralisation. For the successful management of shelf sea carbon stocks, it is thus important to understand the amount of carbon stored, the reactivity of the organic carbon (labile or refractory), and the transfer efficiency of the organic carbon. The transfer efficiency reflects the balance between the sediment accumulation rate and the degradation rate before the material ultimately gets buried. In areas of fast sediment accumulation, carbon will be sequestered quickly, protecting it from natural and anthropogenic disturbances. In areas with very slow sedimentation rates, the carbon will be exposed to disturbances for a longer period. Thus, different areas of the continental shelf with different depositional settings require specific marine management strategies. This study aims to understand the quantity, quality, and transfer efficiency of carbon within the muddy depocenter of the Fladen Ground, North Sea, which provides a case study for investigating the vulnerability of carbon in a relict mud deposit with very low active sedimentation. We present new age-depth models, dry bulk density, and total organic carbon (TOC) measurements from multiple sediment cores and use them to calculate organic carbon accumulation rates for the Fladen Ground.  This area has been exposed to historic and ongoing trawling, offering an opportunity to understand the fate of carbon in relict mud deposits under anthropogenic disturbances.

How to cite: Sengupta, T., Roseby, Z., Ward, S., Vosper, D., Blaauw, M., and Scourse, J. D.: Evolution and vulnerability of blue carbon stocks in a continental shelf mud depocenter: Fladen Ground, North Sea, EGU General Assembly 2025, Vienna, Austria, 27 Apr–2 May 2025, EGU25-17437, https://doi.org/10.5194/egusphere-egu25-17437, 2025.

EGU25-18790 | ECS | Orals | BG4.11

Carbon Storage in North Sea Sediments: Impacts of Climate Change and Offshore Wind Farms Revealed by Coupled Modeling 

Evgeny Ivanov, Jean-François Grailet, and Marilaure Grégoire

Coastal seas play a critical role in removing carbon from the atmosphere and sequestering it in marine sediments, partially offsetting anthropogenic greenhouse gas emissions. The North Sea, despite its shallow depth, intense tidal mixing, and increasing anthropogenic pressures, stores over a million tonnes of organic carbon (OC) annually in the deep Norwegian Trench, and exports OC to the Skagerrak Strait. However, the rapid pace of global climate change is disrupting biogeochemical cycles, including carbon dynamics in coastal seas.

In recent decades, the North Sea has become a hotspot for offshore wind farm (OWF) construction. Their hard substrates are colonized by filter feeders (e.g., blue mussels), which filter OC particles from the water column and biodeposit them onto the seabed, creating localized areas of carbon-enriched sediments near OWFs.

As part of the JPI Climate & Oceans project CE2COAST, which aims to evaluate pressures on coastal seas and their ecosystem services under a changing climate, we developed a high-resolution coupled hydrodynamic-wave-sediment-biogeochemical-diagenetic model. This model covers the North Sea, utilizing a 5x5 km resolution horizontal grid and a vertical grid comprising 30 water column layers and 26 sediment layers. It integrates pelagic and benthic biogeochemical processes, simulating sedimentary fluxes and solute diffusion at the sediment-water interface. OWFs are represented in the model as surface areas suitable for bivalve colonization, based on their location and turbine density. Changes to sediment properties that affect OC resuspension are incorporated to represent the retention of deposited OC by local ecosystems. The model has been calibrated and validated using available physical and biogeochemical data for both pelagic and sedimentary environments.

The model is used to assess the combined effects of climate change and OWFs on biogeochemical cycling, with a focus on carbon cycling and sequestration. Simulations were conducted for both current (1993–2023) and future climates (up to 2100) under the IPCC SSP370 “upper-middle” scenario. Scenarios for OWF construction were based on plans for 2035 and assumed constant until the end of the century. The model was forced by a regional atmospheric model (MAR), driven by outputs from the MPI climate model and at the lateral open boundaries by outputs from the NorESM2 Earth System model.

Key findings from comparisons between present conditions and projections include higher remineralization rates of organic carbon in both the water column and upper sediment layers, along with enhanced conditions for phytoplankton carbon fixation via photosynthesis. While increased primary production offsets higher remineralization rates in the water column, OWF construction along the European coast significantly alters traditional carbon transport pathways. Instead of being transported to the Skagerrak Strait and the Norwegian Trench, more organic carbon is retained in the shallow European shelf. This enhances the North Sea’s capacity to sequester OC in the medium term but raises concerns about its fate following the OWF decommissioning and the removal of hard substrates.

This study highlights the complex interplay of physical and biogeochemical processes in the North Sea and emphasizes the importance of coupled modeling approaches to predict future changes in carbon storage under a changing climate and increasing anthropogenic influence.

How to cite: Ivanov, E., Grailet, J.-F., and Grégoire, M.: Carbon Storage in North Sea Sediments: Impacts of Climate Change and Offshore Wind Farms Revealed by Coupled Modeling, EGU General Assembly 2025, Vienna, Austria, 27 Apr–2 May 2025, EGU25-18790, https://doi.org/10.5194/egusphere-egu25-18790, 2025.

EGU25-20490 | Orals | BG4.11

From Sediment to Sequestration: Linking Bioturbation to Carbon Cycling 

Adam Porter, Jasmin Godbold, Vasilis Kitidis, Martin Solan, and Ceri Lewis

Bioturbation by benthic and sediment-dwelling species significantly influences organic carbon preservation, accounting for 4% of the variation in sediment mixing depth. Yet our understanding of how different species, communities or functional bioturbation roles influence water-sediment carbon fluxes or contribute to long-term carbon burial is poorly understood. This is a key knowledge gap for assessing the impacts that seabed disturbance, such as bottom trawling, may have on carbon processes or for determining the potential carbon benefits of better seabed protection.  

As part of the Convex Seascape Survey, we have been investigating the effect of faunally mediated sediment mixing and burrow ventilation on water-sediment carbon processes and associated nutrient fluxes. In a series of mesocosm experiments, we assembled 17 macrofaunal invertebrate species in monoculture and in a three-species mixture. In all experiments, individuals were collected using a van veen grab from the Firth of Clyde or Loch Etive, Scotland, and were placed in sediment-filled mesocosm aquaria (6 x 6 x 23 cm) with overlying seawater. Fluorescent sediment particles were added after 24 hours to quantify sediment reworking, and experiments were maintained for up to 10 days. Using Carbon-13 labelled algae, we quantified the movement of particulate organic carbon into the sediment. Overlying water parameters (e.g., pH, DIC, oxygen consumption) and sediment mixing and burrow ventilation activities were measured to assess inter- and intra-species contributions to nutrient cycling and carbon flux.

Our data reveal that different groups of sediment mixers (predominantly deep burrowers versus surficial modifiers) perform distinct functional roles in the cycling of nutrients and carbon. We find, for example, that deep burrowers and active bioturbators promote higher levels of nitrite (NO₂⁻) and nitrate (NO₃⁻) release into the overlying water. This suggests that their burrow formation and ventilation enhance microbial nitrification, converting ammonium into nitrite and then nitrate. In contrast, surficial modifiers were associated with elevated levels of phosphorus and ammonium in the overlying water. This pattern likely reflects the dominance of ammonification, where organic matter decomposition releases ammonium and remineralisation releases phosphorous in surface layers with moderate oxygenation. Dissolved inorganic carbon release and concomitant alkalinity changes produced by individuals in our studies are species-specific and can be quite pronounced in relation to bioturbation function. The amount of particulate organic carbon redistributed by bioturbation is also species-specific and our labelled algae both help understand this redistribution of carbon in the surface sediments beyond more traditional methods of measuring bioturbation but also call into scrutiny categorical methods of grouping bioturbating organisms.

These findings highlight that functional traits of bioturbating animals matter more than taxonomic species identity in regulating carbon fluxes and burial at the water-sediment interface. They reveal a divergence of roles across sediment depths, emphasising the potential for functional loss and ecosystem degradation from depth-specific disturbances like bottom trawling.

How to cite: Porter, A., Godbold, J., Kitidis, V., Solan, M., and Lewis, C.: From Sediment to Sequestration: Linking Bioturbation to Carbon Cycling, EGU General Assembly 2025, Vienna, Austria, 27 Apr–2 May 2025, EGU25-20490, https://doi.org/10.5194/egusphere-egu25-20490, 2025.

EGU25-21089 | Posters on site | BG4.11

Organic carbon storage in northwest European shelf subtidal sediments: towards a consensus map 

Carolyn Graves, Jon Barry, Claire Mason, Clement Garcia, David Claire, Louise Brown, and Ruth Parker

Quantifying the various pools of marine carbon is a fundamental initial step towards establishing the potential value of ocean carbon storage in climate change mitigation. While subtidal sediments hold less carbon per unit area than the coastal ‘traditional blue carbon habitats’ (mangrove, saltmarsh, seagrass), their large extent makes them an important component of the UK’s blue carbon inventory. Global and regional maps of seabed organic carbon have been published, but they do not provide a consensus view of northwest European Shelf subtidal sediment carbon storage. Improved seabed carbon maps, using predictive mapping approaches, require high confidence measurements of sediment organic carbon content with appropriate good spatial coverage as well and overall sampling of predictor ‘parameter space’. They also rely on availability and selection of appropriate high-resolution predictor variables. Our efforts to map seabed organic carbon have two, sometimes complimentary sometimes conflicting, objectives: (i) to generate the most accurate map possible, and (ii) to provide our process-focused understanding of how and why carbon content varies and which parameters control that variability in the context of seabed biogeochemical cycling.

We initially applied a Gradient Boosting Machine Learning method to generate a new predicted seabed carbon map for the northwest European Shelf using more than 2,000 observations of near-surface sediment (0-2 to 0-10 cm below seafloor) organic carbon content. We explored the importance of various methodological decisions on the importance of different predictors (e.g., mud content) and the predictive power and accuracy of the model. We discuss the differences and similarities of our data product and mapping approach with previous seabed carbon maps, highlighting the impact of knowledge gaps on potential use by policymakers.

How to cite: Graves, C., Barry, J., Mason, C., Garcia, C., Claire, D., Brown, L., and Parker, R.: Organic carbon storage in northwest European shelf subtidal sediments: towards a consensus map, EGU General Assembly 2025, Vienna, Austria, 27 Apr–2 May 2025, EGU25-21089, https://doi.org/10.5194/egusphere-egu25-21089, 2025.

EGU25-21148 | Orals | BG4.11

How ‘blue’ is your carbon? Sources of sedimentary shelf carbon in the North and Celtic Seas using n-alkane lipid tracers and geochemical tools 

Clare Hynes, Claire Powell, Franck Dal Molin, Claire Mason, and Ruth Parker

The North and Celtic Seas are influenced by both natural and anthropogenic inputs of organic carbon. Allochthonous sources include terrestrial carbon, delivered via riverine and atmospheric pathways, while autochthonous sources include in-situ production of marine phytoplankton and other primary producers. Ultimately the sediment acts as sink and storage for deposited organic carbon. However, gaps remain around our knowledge of the provenance of this carbon, which is important for accurate carbon budgets and the move towards Net Zero, and for understanding how carbon may behave in the environment. Carbon composition differs with source, whether marine, terrestrial or anthropogenic, and this can influence the reactivity of that carbon. Labile, fresh carbon will be more easily degraded whilst refractory carbon will be more stable and long lasting. We used a molecular marker approach employing n-alkanes as carbon tracers to help unravel the complex sources of sedimentary organic carbon. Sediment cores were taken between 2021 - 2024 over numerous surveys encompassing different regions of the North and Celtic Seas, including nearshore, coastal and offshore locations, with differing sediment types ranging from sandy through to muddy. We analysed a suite of organic compounds, including n-alkanes and other biomarkers, polycyclic aromatic hydrocarbons (PAHs), and black carbon, to probe natural and anthropogenic carbon sources. Our results showed that organic carbon provenance varied in both space and time (depth). Nearshore and coastal sites generally had higher levels of terrestrial rather than marine carbon, however appreciable terrestrial inputs were also observed at various offshore locations, including at depth. Elsewhere offshore sites were dominated by marine and/or mixed sources, whilst anthropogenic inputs were observed at nearshore sites, and at coastal sites with finer sediment, but also offshore especially in the vicinity human oil and gas activity. Our study provides insights into different carbon sources, areas of accumulation and storage, as well as post depositional changes. This work moves us towards a classification of marine-terrestrial-anthropogenic sites in the North and Celtic Seas, which informs and supports marine management strategies including the climate mitigation potential of the English seabed.

How to cite: Hynes, C., Powell, C., Dal Molin, F., Mason, C., and Parker, R.: How ‘blue’ is your carbon? Sources of sedimentary shelf carbon in the North and Celtic Seas using n-alkane lipid tracers and geochemical tools, EGU General Assembly 2025, Vienna, Austria, 27 Apr–2 May 2025, EGU25-21148, https://doi.org/10.5194/egusphere-egu25-21148, 2025.

EGU25-21441 | Orals | BG4.11

Assessing, protecting and restoring the natural carbon storage capacity of marine sediments – the need for enhanced transdisciplinary dialogue and cooperation 

Sabine Kasten, Moritz Holtappels, Daniel Müller, Klaus Wallmann, Lucas Porz, Ute Daewel, Wenyan Zhang, Jannis Kuhlmann, Bettina Taylor, and Nadja Zeibarth

As global warming progresses, sedimentary carbon sinks are becoming increasingly important in climate change mitigation measures. Thus, there is a need for in-depth knowledge of both the dynamics and vulnerabilities of the sedimentary carbon sinks, as well as the legal and political options to protect and restore their natural carbon sequestration efficiency. Here, we report on the transdisciplinary research project APOC, which addressed the Anthropogenic impacts on the cycling of Particulate Organic Carbon in the North Sea. Important results of the project include the quantification of sedimentation rates in the accumulation areas of the German Bight and the Skagerrak, assessing the factors that enhance organic carbon burial/storage and the determination of the sources and reactivity of deposited carbon. As major anthropogenic disturbances, the effects of bottom trawling and wind farm construction on benthic carbon storage were investigated and assessed. Bottom trawling in particular was significantly decreasing the benthic carbon storage due to a multitude of coupled physical and ecological effects. However, at the environmental policy level, it became clear that sedimentary deposits are not sufficiently recognized and protected as valuable natural carbon sinks, although their storage capacity is believed to be much higher than that of blue carbon ecosystems at similar latitudes. While the project was staffed mainly with natural scientists, important expertise in environmental policies was provided by the marine conservation office of the BUND, one of the largest environmental NGOs in Germany. As a fully-fledged project partner, BUND made it possible to recognize the relevance of the various project focal points for the environmental policy arena throughout the entire project. In turn, the policy experts were able to distribute the latest scientific findings to the environmental policy committees. In effect, the transdisciplinary cooperation within the project not only produced valuable scientific results, but also numerous expert briefings on environmental policy at all levels, from local authorities to the EU Parliament, emphasizing the importance of protecting natural fine-grained sedimentary carbon sinks for climate change mitigation measures. Key to this outcome was the continuous exchange of scientific findings and practical environmental policy knowledge, which kept all participants focused on the societal relevant objectives that were originally pursued with the project funding. The results of the project APOC can contribute directly to the new EU Nature Restoration Law adopted in June 2024. To this end, measures to strengthen and protect ecosystems both on land and in national coastal waters are to be introduced on 20 % of land and marine areas across the EU, including restoration of at least 30 % of important habitat types in poor condition by 2030.

How to cite: Kasten, S., Holtappels, M., Müller, D., Wallmann, K., Porz, L., Daewel, U., Zhang, W., Kuhlmann, J., Taylor, B., and Zeibarth, N.: Assessing, protecting and restoring the natural carbon storage capacity of marine sediments – the need for enhanced transdisciplinary dialogue and cooperation, EGU General Assembly 2025, Vienna, Austria, 27 Apr–2 May 2025, EGU25-21441, https://doi.org/10.5194/egusphere-egu25-21441, 2025.

EGU25-1593 | ECS | Orals | OS1.13

Evaluation of the interior ocean ventilation of biogeochemical tracers in a global ocean model using observation-based metrics  

Simone Le Chevere, Christopher Danek, Seth Bushinsky, and Judith Hauck

The ocean has absorbed approximately 25% of anthropogenic CO2 emissions since the industrial era, playing a critical role in the global carbon cycle. However, the current ocean carbon sink as simulated by the ocean biogeochemistry models of the Global Carbon Budget shows a spread larger than the European Union’s fossil carbon emissions and mismatches with current observation-based estimates. The prime suspect for this deviation is the poorly constrained transfer of carbon between the surface and the interior ocean. This process is called ventilation and is based on the interior ocean carbon gradients that depend on mixing, advective and biological processes.

To address this, we developed a set of metrics based on the new dataset from biogeochemical Argo floats (BGC-Argo) that offer unprecedented observations from the surface to 2000 m, and the GLODAP bottle data. These metrics are a tool to evaluate and optimize ocean ventilation processes and carbon transport between the surface and the interior in ocean models. They target the stratification and mixing (physical variables) as well as the gradients of tracers such as apparent oxygen utilization, dissolved inorganic carbon or dissolved inorganic nitrate. We compute metrics quantifying these depth gradients averaged across large-scale biomes.

With this methodology, we evaluate the ventilation in the model FESOM-REcoM. Our results identify model-observation differences in terms of absolute values and magnitude of gradient in salinity and in the biogeochemical variables in many biomes. Biases in the gradients of biogeochemical properties can partially be explained by biases in the physical stratification of the water column, especially in biomes with high mixing at higher latitudes.  In other biomes, biases are attributed to an imperfect representation of biogeochemical processes in the model.  We characterize the distribution of biases in FESOM-REcoM, and discuss how to reduce them.

How to cite: Le Chevere, S., Danek, C., Bushinsky, S., and Hauck, J.: Evaluation of the interior ocean ventilation of biogeochemical tracers in a global ocean model using observation-based metrics , EGU General Assembly 2025, Vienna, Austria, 27 Apr–2 May 2025, EGU25-1593, https://doi.org/10.5194/egusphere-egu25-1593, 2025.

EGU25-1977 | Orals | OS1.13

Complex response of marine carbon pumps to global warming impacts atmospheric CO2 on multi-centennial time scales 

Samar Khatiwala, Olivia Strachan, and Andreas Schmittner

The ocean’s capacity to absorb anthropogenic CO2 is predicted to decrease with global warming, contributing to a positive climate-carbon cycle feedback. However, the precise nature of how climate change will impact the ocean’s various carbon pumps and hence atmospheric CO2 remains poorly constrained, especially on multi-centennial time scales. Here, we show that under a high emission scenario, reduced carbon uptake and redistribution of alkalinity leads to ~505 ppm (30%) higher atmospheric CO2 by 2500. Despite compensating changes in biological storage and air-sea disequilibrium, CO2 is still 16% higher due to climate change. These changes are a net response to slowing circulation and increased stratification, which not only reduces carbon uptake but lengthens by hundreds of years the time anthropogenic and biologically-respired CO2 are sequestered in the ocean, with long term implications for climate.

How to cite: Khatiwala, S., Strachan, O., and Schmittner, A.: Complex response of marine carbon pumps to global warming impacts atmospheric CO2 on multi-centennial time scales, EGU General Assembly 2025, Vienna, Austria, 27 Apr–2 May 2025, EGU25-1977, https://doi.org/10.5194/egusphere-egu25-1977, 2025.

EGU25-2675 | Posters on site | OS1.13

Simple Eulerian-Lagrangian approach to solve equations for sinking particulate organic matter in the ocean 

Seongbong Seo, Vladimir Maderich, Igor Brovchenko, Kateryna Kovalets, and Kyonghwan Kwon

A gravitational sinking of the particulate organic matter (POM) is a key mechanism of the vertical transport of carbon in the deep ocean and its subsequent sequestration. The size spectrum of these particles is formed in the euphotic layer by the primary production and various mechanisms including food web consumption. The mass of particles, as they descend, decreases under bacterial decomposition and the influence of grazing by filter feeders which depends on the water temperature and oxygen concentration, particle sinking velocity, age of the organic particles, ballasting and other factors. In this study, we consider the influence of the size and age of particles, temperature and oxygen concentration on their dynamics and degradation processes. The model takes into account feedback between the degradation rate and sinking velocity of particles.  We rely on the known parameterisations, but our Eulerian-Lagrangian approach to analytically and numerically solving the problem differs, allowing the model to be incorporated into biogeochemical global ocean models with relative ease. Two novel analytical solutions of the system of the one-dimensional Eulerian equation for POM concentration and Lagrangian equations for particle mass and position were obtained for constant and age-dependent degradation rates. At a constant rate of particle sinking, they correspond to exponential and power-law profiles of the POM concentration. It was found that feedback between degradation rate and sinking velocity significantly changes POM concentration and POM flux vertical profiles.  The calculations are compared with the available POM concentration and flux measurement data for the latitude band of 20-30oN in the Atlantic and Pacific Oceans and 50-60o in the Southern Ocean. The dependence of the degradation rate on temperature significantly affected the profiles of POM concentration enhancing the degradation of sinking particles in the upper layers of the oceans and suppressing it in the deep layers of the oceans. The influence of oxygen concentration in all cases considered was insignificant compared to the temperature distribution with depth.

How to cite: Seo, S., Maderich, V., Brovchenko, I., Kovalets, K., and Kwon, K.: Simple Eulerian-Lagrangian approach to solve equations for sinking particulate organic matter in the ocean, EGU General Assembly 2025, Vienna, Austria, 27 Apr–2 May 2025, EGU25-2675, https://doi.org/10.5194/egusphere-egu25-2675, 2025.

Upper ocean stirring and mixing strongly affect the nutrient flux into the euphotic zone and therefore ocean primary production. Additionally, besides particle sinking, the export of organic and inorganic matter is hugely determined by advective fluxes imposed by physical flows. Since both production and export play a role in oceanic carbon storage, it is important to re-assess its main drivers in models of increased ocean realism. With spatial dimensions below 25 km, sharp fronts, filaments, strong jets and small eddies, submesoscale motions induce large vertical velocities, adding extra transport to the already large lateral stirring induced by the mesoscale (25 km-200 km) field. The impact of resolved submesoscale flows on some aspects of the south Atlantic Ocean carbon cycle is here studied based on a novel global ocean-biogeochemical simulation integrated with the models ICON-O and HAMOCC using a telescoping grid with a resolution refined to approximately 600 m in the south Atlantic. Tracer budgets are used to quantify the relative importance of physical versus biogeochemical processes in the evolution of ocean carbon, including the uptake at the surface and the export to the deep ocean. A comparison between our submesoscale-resolved ocean and biogeochemical simulations with coarser resolutions (10 km and 40 km) sheds some light on the submesoscale role on tracer evolution and highlights expected differences between current climate and mesoscale models and models including the submesoscale. Despite being limited by the short duration of our simulation, this study suggests that submesoscales shape vertical profiles of carbon and nutrients and thereby affect export fluxes and seasonal dynamics.

How to cite: Serra, N. and Ilyina, T.: Impact of submesoscale flows on primary production and export fluxes of carbon in the South Atlantic Ocean, EGU General Assembly 2025, Vienna, Austria, 27 Apr–2 May 2025, EGU25-4128, https://doi.org/10.5194/egusphere-egu25-4128, 2025.

EGU25-5016 | Posters on site | OS1.13

Parameterization of sinking velocity rates in the Atlantic Ocean 

María Villa-Alfageme, Lucía Melgar, Álvaro López-Rodríguez, Unai Abascal-Ruíz, and Beatriz González-González

Particles sinking on the ocean constitute the vehicles of the Biological Carbon Pump (BCP). As these particles descend, they give form to a complex mixture of biogeochemical materials, each characterised by distinct size, density, porosity, and morphology. Consequently, the velocity of particle sinking (SV) and the flux of particulate organic carbon (POC) exhibit significant variability, influenced by factors such as depth, season, and the characteristics of the ecosystem. The flux of POC and the SV are interconnected parameters; besides, the profile of POC flux attenuation, i.e. the rate at which sinking particles are remineralised and degraded by bacteria and zooplankton, is also strongly dependent on the rate at which the particles sink. Intuitively, faster sinking particles would reach the Twilight Zone in a greater proportion than slow sinking particles; however, this simple correlation is not globally observed in the ocean. Overall, SV is a key variable directly impacting on the strength of the BCP, in spite of that, the methods to estimate particle SV are not standardized and this variable remains poorly measured in the ocean. Therefore, its influence is not properly quantified, nor is how to incorporate this parameter to ocean biogeochemical models.

The utilisation of the disequilibrium between radioactive pairs, 234Th-238U and 210Po-210Pb, allows obtaining both average SV and downward POC flux. In this study, disequilibrium profiles from 15 cruises in the Atlantic and Southern Oceans were examined (including data from COMICS, CUSTARD, APERO and EXPORTS programs), encompassing biogeochemically contrasting sites and various stages of the bloom. This analysis led to a novel compilation of POC flux and SV, coupled with satellite-driven net primary production (NPP) and including export efficiency and transfer efficiency, when available. The objective of this synthesis is to understand the mechanisms associated with the spatial and temporal variation of the SV and to look for patterns in the Biological Carbon Pump efficiency and, ultimately, ocean carbon storage.

How to cite: Villa-Alfageme, M., Melgar, L., López-Rodríguez, Á., Abascal-Ruíz, U., and González-González, B.: Parameterization of sinking velocity rates in the Atlantic Ocean, EGU General Assembly 2025, Vienna, Austria, 27 Apr–2 May 2025, EGU25-5016, https://doi.org/10.5194/egusphere-egu25-5016, 2025.

EGU25-8581 | ECS | Posters on site | OS1.13

Ocean heat uptake and storage during climate stabilization at different global warming levels in GFDL-ESM2M 

Yona Silvy, Friedrich A. Burger, and Thomas L. Frölicher

The ocean is storing the majority of excess heat in the Earth system resulting from the release of anthropogenic greenhouse gases into the atmosphere. This heat uptake will persist even after cessation of greenhouse gas emissions, and it will continue for centuries in scenarios where global warming is limited to levels set by the Paris Agreement. This continued heat uptake has important implications for regional climate, ecosystems and sea level rise. However, the dynamics of ocean heat uptake and the redistribution of this heat under stabilized global warming remain poorly understood, particularly the time scales involved. Here, we apply the Adaptive Emission Reduction Approach to a fully coupled Earth System Model to simulate different levels of stabilized global warming until the year 3000. We reveal significant differences between the transient phase when surface temperatures first reach the targeted warming level, and the near-stabilized state after close to 1000 years at the warming level. We explore non-linearities in the evolution of the ocean circulation and ventilation over these time scales, as well as the sensitivity of heat uptake and storage to different global warming levels. For example, the stabilization simulations reveal long-term differences across global warming levels in the vertical redistribution of heat, with a relatively warmer upper ocean and colder deep ocean with warmer surface temperatures. We also find a threshold effect between 1.5ºC and 2ºC of global warming, where surpassing this threshold triggers irreversible changes that profoundly impact the redistribution of heat in the ocean. Specifically, during the stabilization phase at 2ºC of global warming and above, the subpolar Southern Ocean shows a recovery of deep convection that leads to an export of colder bottom waters than under pre-industrial conditions, that is not present at 1.5ºC.

How to cite: Silvy, Y., Burger, F. A., and Frölicher, T. L.: Ocean heat uptake and storage during climate stabilization at different global warming levels in GFDL-ESM2M, EGU General Assembly 2025, Vienna, Austria, 27 Apr–2 May 2025, EGU25-8581, https://doi.org/10.5194/egusphere-egu25-8581, 2025.

Compelling evidence indicates that ocean circulation is undergoing significant changes due to global warming. These changes include reduced ocean ventilation caused by increased stratification and the weakening of the Atlantic Meridional Overturning Circulation (AMOC). Consequently, this will alter carbon, oxygen, heat and nutrient distribution, and will therefore affect primary production and, by extension, the biological carbon pump. Due to the ocean’s huge capacity for carbon storage, it is imperative that we understand the consequences of these changes.

To examine how ocean ventilation influences the biological carbon pump and overall oceanic carbon storage, two idealised box models of ocean carbon and heat uptake are extended to include biological processes and nutrient cycling. The first model is a one-dimensional box model, with ocean ventilation parameterised by a relaxation timescale that responds to emission-driven warming. The second model is more complex, including a thermocline with a dynamically controlled thickness and meridional overturning circulation, both of which vary with increasing temperatures, determining the extent of ocean ventilation.

These models, previously employed to analyse the ocean’s carbon and thermal response to anthropogenic emissions, are now adapted to explore the effects of changing circulation on the biological carbon pump. A simple nutrient-phytoplankton-zooplankton-detritus (NPZD) biological model is introduced to simulate the role of macronutrient concentrations on phytoplankton and zooplankton growth. Simulations are conducted under scenarios of both constant and changing circulation to investigate the impacts of slower circulation and increased stratification on the biological carbon pump and its contribution to oceanic carbon storage.

How to cite: Baltas, E., Katavouta, A., and Hunt, H.: Exploring the Impact of Changing Ocean Circulation on Carbon Storage due to the Biological Carbon Pump: An Idealised Modelling Approach, EGU General Assembly 2025, Vienna, Austria, 27 Apr–2 May 2025, EGU25-9243, https://doi.org/10.5194/egusphere-egu25-9243, 2025.

EGU25-10777 | ECS | Posters on site | OS1.13

Impact of intermittent volcanic forcing on ocean carbon uptake under climate overshoot 

Katja Labermeyer, Moritz Adam, and Kira Rehfeld

The ocean has absorbed between 20-35% of anthropogenic CO2 emissions, acting as a major carbon sink despite its slower response times compared to the atmosphere and biosphere [1]. However, carbon uptake in the ocean is predicted to decrease in the future, particularly under scenarios that exceed global warming targets, resulting in the uptake rate being close to zero. Volcanic aerosol forcing introduces uncertainty into these projections by altering the Earth's radiation balance, which, in turn, affects ocean carbon fluxes by changing temperature and circulation patterns. Despite that, intermittent forcing is not considered in widely used CMIP or ScenarioMIP simulations.

Here, we leverage Earth system model simulations to explore the impacts of intermittent versus baseline volcanic forcing on the ocean carbon fluxes under a temperature overshoot scenario. We hypothesize that irregular forcing will amplify variability in ocean carbon uptake and we expect stronger responses in ocean basins such as the Atlantic due to AMOC sensitivity and downstream effects of eruptions. Two ensembles, generated with the Max Planck Institute Earth system model (MPI-ESM), are compared [2]. One ensemble is forced with semi-stochastic irregular volcanic events and another with a recurring, median intensity event. We analyze key variables, such as ocean carbon uptake, vertical temperature profiles, Atlantic Meridional Overturning Circulation (AMOC), and thermocline depth, to assess the variability and response timescales under intermittent forcing. To find responses on temporal and spatial scales, we quantify the response and recovery times of the ocean and determine where the strongest responses occur spatially to determine which regions are most or least affected. Our study aims to improve the understanding of the sensitivity of ocean carbon uptake to intermittent forcing and its implications for future projections of the carbon cycle.

[1] S. Khatiwala, F. Primeau, and T. Hall. “Reconstruction of the history of anthropogenic CO2 concentrations in the ocean”. In: Nature 462, pp. 346–349. 2009.
[2] T. Mauritsen et al. “Developments in the MPI-M Earth System Model version 1.2 (MPI-ESM1.2) and Its Response to Increasing CO2”. In: Journal of Advances in Modeling Earth Systems 11.4, pp. 998–1038. 2019.

How to cite: Labermeyer, K., Adam, M., and Rehfeld, K.: Impact of intermittent volcanic forcing on ocean carbon uptake under climate overshoot, EGU General Assembly 2025, Vienna, Austria, 27 Apr–2 May 2025, EGU25-10777, https://doi.org/10.5194/egusphere-egu25-10777, 2025.

The ocean absorbs a quarter of the anthropogenic carbon and 90% of the anthropogenic heat in the Earth system, significantly impacting the climate. On decadal timescales most relevant for climate prediction, the ocean circulation plays a central role in modulating the ocean heat and carbon sinks. It is therefore crucial to understand how these sinks interact with changes in the circulation. We have applied a novel water mass based inverse model, the optimal transformation method (OTM), to study the uptake of heat and carbon by the ocean and its redistribution in the interior by the ocean circulation. The OTM simultaneously calculates budgets of heat, freshwater, and carbon from a combination of observational data products, solving for the air-sea flux and transport and mixing of these tracers in a manner consistent with the available observational data. We apply OTM to a combination of data products: the EN4 objective analysis of temperature and salinity; the ECCO ocean state estimate; our own machine learning reconstruction of ocean interior carbon based on the GLODAP dataset; ERA5 and JRA55 reanalyses of air-sea heat and freshwater fluxes; and air-sea CO2 fluxes from the SeaFlux product. We analyse two decades, estimating global carbon uptake of 2.02 ± 0.22 PgC yr-1 for 1993-2002 and 2.86 ± 0.25 PgC yr-1 for 2003-2012. We find that changes in the carbon uptake between the two decades are dominated by the Southern Ocean (>35°S) and North Pacific (>10°N) basins, and our results also suggest a southwards redistribution of carbon in the Atlantic linked to changes in ocean circulation. Meanwhile, a redistribution of carbon northwards in the Pacific is accompanied by a southwards redistribution of heat.

How to cite: Mackay, N., Ehmen, T., and Watson, A.: Ocean carbon and heat uptake and redistribution diagnosed from observations using a water mass inverse model, EGU General Assembly 2025, Vienna, Austria, 27 Apr–2 May 2025, EGU25-10806, https://doi.org/10.5194/egusphere-egu25-10806, 2025.

EGU25-11039 | ECS | Orals | OS1.13

The long lives of subducted spice and vorticity anomalies in the subtropical oceans 

Cora Hersh, Susan Wijffels, Geoffrey Gebbie, and Gaël Forget

Subtropical cells, which exist in nearly all ocean basins, connect subducting subtropical waters to upwelling sites along the equator. This tight link between the subtropics and the tropics, on a scale of 5-15 years, is well-established in a time-averaged sense by modeling and observations. Recently, evidence has emerged of spice (density-compensated temperature and salinity variations) and potential vorticity anomaly persistence along mean flow pathways on isopycnals. We provide the first global view of subtropical water mass anomaly propagation, using both an observational dataset and the Estimating the Circulation and Climate of the Ocean (ECCO) state estimate Version 4 Release 4. In this global synthesis that complements the existing body of largely regional studies, we find long-lived interannual water mass anomalies that translate along mean advective pathways in all ventilated subtropical gyres. They are detectable over multiple years and several thousand kilometers. Some anomalies are persistent enough to reach both the western boundary and equatorial current systems before being entirely eroded, and thus could form ocean “tunnels” along which heat anomalies could travel to impact remote climate variability. Analysis of ocean tunnel propagation of a passive tracer (spice) and an active tracer (potential vorticity) confirms earlier model results that the active tracer decays more quickly than the passive tracer. Similarities and differences between timing and frequency of the two tracers could provide clues to anomaly formation mechanisms in various subduction regions. The success of ECCO in capturing these phenomena is encouragement to further explore their upstream sources and downstream impacts within this framework.

How to cite: Hersh, C., Wijffels, S., Gebbie, G., and Forget, G.: The long lives of subducted spice and vorticity anomalies in the subtropical oceans, EGU General Assembly 2025, Vienna, Austria, 27 Apr–2 May 2025, EGU25-11039, https://doi.org/10.5194/egusphere-egu25-11039, 2025.

EGU25-12898 | Orals | OS1.13 | Highlight

Physical inconsistencies in the representation of the ocean heat-carbon nexus in simple climate models 

Roland Séférian, Thomas Bossy, Thomas Gasser, Zebedee Nichols, Kalyn Dorheim, Xuanming Su, Junichi Tsutsui, and Yeray Yeray Santana-Falcón

The oceans slow the rate of global warming by absorbing each year about 25% of the anthropogenic CO2 emissions and 90% of the additional heat resulting from the Earth energy imbalance induced by the accumulation of greenhouse gases in the atmosphere. The interplay between the ocean heat and carbon uptake, the “Ocean Heat-Carbon Nexus”, links together the responses of the Earth climate and the global carbon cycle to cumulative CO2 emissions and to net zero CO2 emissions. It results from a suite of processes involving the exchange of heat and carbon across the sea-air interface as well as their storage below the mixed-layer and redistribution by the ocean large-scale circulation. The Ocean Heat and Carbon Nexus is assumed to be consistently represented across two modelling platforms used in the latest IPCC assessments: the Earth System Models (ESMs) and the Simple Climate Models (SCMs). However, our research shows significant deficiencies in state-of-the-art SCMs in replicating the ocean heat-carbon nexus of ESMs due to a crude treatment of the ocean thermal and carbon cycle coupling. With one SCM, we show that a more realistic heat-to-carbon uptake ratio exacerbates the projected warming by 0.1°C in low overshoot scenarios and up to 0.2°C in high overshoot scenarios. It is therefore critical to explore how SCMs' physical inconsistencies, such as the representation of the ocean heat-carbon nexus, can affect future warming projections used in climate assessments, not just by SCMs in Working Group 3 but also by ESMs in Working Group 1 via SCM-driven emission-to-concentration translation.

How to cite: Séférian, R., Bossy, T., Gasser, T., Nichols, Z., Dorheim, K., Su, X., Tsutsui, J., and Yeray Santana-Falcón, Y.: Physical inconsistencies in the representation of the ocean heat-carbon nexus in simple climate models, EGU General Assembly 2025, Vienna, Austria, 27 Apr–2 May 2025, EGU25-12898, https://doi.org/10.5194/egusphere-egu25-12898, 2025.

EGU25-13345 | ECS | Posters on site | OS1.13

Analysis of Export and Transfer Efficiency around the PAP-Site Observatory: an update from the APERO project 

Álvaro López Rodríguez, Bea González González, Santiago Hurtado Bermúdez, Frédéric Le Moigne, Maeva Gesson, and María Villa Alfageme

The biological carbon pump (BCP) plays a key role in the regulation of atmospheric CO2 levels. Export efficiency (Expeff), defined as the proportion of primary production (PP) that is exported as particulate organic carbon (POC) flux below the base of the euphotic zone (EZ), and transfer efficiency (Teff), defined as the ratio of POC flux below the EZ and POC flux attenuated at a given depth in the twilight zone (TZ), are two of the main parameters used as metrics of BCP strength. The objective of this work is to investigate the factors that influence the variability of both parameters at different bloom stages. The APERO cruises aim to investigate the BCP, with emphasis on the TZ (200-1000 m), and were conducted at the PAP site oceanographic observatory during the decline of a spring bloom in June and July 2023. Water and particle profiles (0-1000 m) were collected at five stations and POC fluxes at the base of the EZ were obtained derived from 210Po-210Pb disequilibrium and high depth resolution sediment traps. In addition, data measured from 1989 to 2023 for POC fluxes, at the base of the EZ, derived from 238U-234Th and 210Pb-210Po disequilibrium and at 3000 m depth, derived from moored sediment traps were compiled. Expeff (FluxEz/satellite NPP time-integrated) and Teff (Flux3000m/FluxEz) were quantified, and both values were compared across different years and bloom stages. POC fluxes measured in APERO ranged from 3.1-17 mmol C m⁻² d⁻¹, which agrees well with the value measured in 2021 during the same bloom stage, 13 ± 3 mmol C m⁻² d⁻¹. Expeff  presents significant fluctuations and shows a strong intra-annual variability. It changed during the bloom development, from 5-20% in 1989 to 41% in 2012, from 16-42% in 1989 to 14% in 2021 during the bloom peak, and during the decline of the bloom, it decreased from 26 ± 4 % in 2021 to 2.2-11% during the APERO cruise. Finally, Teff exhibits a strong intra-annual variability as the bloom progresses, changing from 6–23% at the beginning of the bloom in 1989, 16% in 2004, and 12% in 2012, to 5–14% at the peak in 1989, and 16% during the postbloom in 2009.

How to cite: López Rodríguez, Á., González González, B., Hurtado Bermúdez, S., Le Moigne, F., Gesson, M., and Villa Alfageme, M.: Analysis of Export and Transfer Efficiency around the PAP-Site Observatory: an update from the APERO project, EGU General Assembly 2025, Vienna, Austria, 27 Apr–2 May 2025, EGU25-13345, https://doi.org/10.5194/egusphere-egu25-13345, 2025.

EGU25-14150 | ECS | Posters on site | OS1.13

The spatiotemporal evolution of the global interior ocean’s anthropogenic carbon sink: reconstructed through machine learning 

Tobias Ehmen, Neill Mackay, and Andrew Watson

The oceans mitigate climate change by absorbing roughly 25% of the anthropogenic carbon that is released. Past reconstructions of air-sea CO2 flux based on surface pCO2 observations have indicated that this carbon sink exhibits decadal variability, appearing to weaken during the 1990s and strengthen in the 2000s. However, the causes of this variability are unclear, and it is poorly represented in climate models and the future climate projections they generate. It also remains uncertain whether the estimated variability is a product of bias due to the limited availability of biogeochemical observations. To address the challenge posed by sparse data, machine learning techniques have been applied to surface pCO2 as well as interior dissolved inorganic carbon (DIC). However, reconstructions of DIC and anthropogenic carbon for the full depth of the global ocean have not yet been achieved.

Our objective is to determine whether the variability in the ocean carbon sink is real and to understand changes in the interior carbon inventory as part of the carbon budget. To this end, we use neural networks to predict the spatiotemporal distributions of full-depth DIC and C* from the 1990s to the 2010s. C* is a quasi-conservative tracer that corrects DIC for biological activity by applying Redfield stoichiometric ratios. ΔC*, the difference in C* between two time points, has been used as a proxy for added anthropogenic carbon.

The neural network is trained on observations from the GLODAPv2.2023 database. We make predictions of DIC and additional C* components - total alkalinity, oxygen, and nitrate - based on the location, depth, temperature, and salinity from the EN4 reanalysis product and atmospheric CO2. Here, we present findings on the spatiotemporal evolution of full-depth interior carbon in the global ocean, providing a quantification of the anthropogenic carbon sink and its variability over time. The interior carbon inventory changes are then compared with current air-sea CO2 flux products. In further work, the results are being combined with a water mass based inverse method to investigate the drivers of variability.

How to cite: Ehmen, T., Mackay, N., and Watson, A.: The spatiotemporal evolution of the global interior ocean’s anthropogenic carbon sink: reconstructed through machine learning, EGU General Assembly 2025, Vienna, Austria, 27 Apr–2 May 2025, EGU25-14150, https://doi.org/10.5194/egusphere-egu25-14150, 2025.

EGU25-16067 | Posters on site | OS1.13

Enhanced storage of carbon in marine dissolved organic matter in scenarios of global warming 

Takasumi Kurahashi-Nakamura, Thorsten Dittmar, Adam C. Martiny, and Sinikka T. Lennartz

The efficiency of the ocean to store atmospheric CO2 in the coming century strongly depends on the stability of marine carbon reservoirs. Marine dissolved organic carbon (DOC) contains more carbon than all living biomass on Earth combined (660 gigatons C) and is recalcitrant against remineralisation at a decadal to millennial timescale, which offers an additional carbon pump to sequester carbon from active air-sea gas exchange with a millennial-scale stability (microbial carbon pump). However, the fate of this key carbon reservoir in a changing future climate is unknown, because the impact of environmental controls on bacterial remineralisation of DOC to CO2 are not explicitly considered in global Earth System Models.

We developed a dynamical model for dissolved organic matter (DOM) that explicitly depicts the production of DOM through primary production and its degradation by heterotrophic microorganisms, and coupled it interactively to the marine biogeochemistry module of UVic ESCM, an Earth system model of intermediate complexity (EMIC). Being based on present-day simulations with the model, it is revealed that the factor that limits bacterial growth in the model and meta-genomic data indicating bacterial nutrient limitation show a similar pattern in the global ocean. Together with other experimental data, we suggest a strong link between the future developments of DOC and macronutrient cycles.

Our model indicates that an increase in the global DOC pool under global warming ranges from 17 to 42 gigatons C at the end of the 22nd century in a future simulation based on a high-emission scenario (SSP5–8.5). The estimated accumulation rate (2 GtC dec−1) is comparable to the amount of the terrestrial input of DOC to the ocean by rivers, underlining its quantitative relevance for the global DOC budget. Our results suggest that DOM-microbe interactions governed by bacterial nutrient limitation provide negative feedback on the climate state via DOC buildup, reinforcing the growth of DIC sequestration by the conventional biological pump (6 GtC dec−1 for > 1000 m depth) in the same simulation.

How to cite: Kurahashi-Nakamura, T., Dittmar, T., Martiny, A. C., and Lennartz, S. T.: Enhanced storage of carbon in marine dissolved organic matter in scenarios of global warming, EGU General Assembly 2025, Vienna, Austria, 27 Apr–2 May 2025, EGU25-16067, https://doi.org/10.5194/egusphere-egu25-16067, 2025.

EGU25-16169 | ECS | Orals | OS1.13

The role of AMOC in controlling ocean heat uptake in idealized abrupt forcing scenarios 

Chiara Ventrucci, Federico Fabiano, Paolo Davini, Oliver Mehling, and Katinka Bellomo

Over the past 150 years, the ocean has absorbed almost 90% of the excess heat induced by anthropogenic carbon dioxide (CO2) emissions, acting as our planet's main heat reservoir. Multiple mechanisms contribute to ocean heat uptake (OHU) and global heat storage, which redistribute heat from the surface to the deep ocean and across all basins. Nevertheless, a comprehensive picture remains unclear. Within this context, the Atlantic Meridional Overturning Circulation (AMOC) plays a key role in transferring heat to the ocean's deepest layers, with a stronger AMOC related to an increase in global OHU. However, it is difficult to quantify the importance of the AMOC from the analysis of existing simulations from the Coupled Model Intercomparison Project (CMIP), as many processes are simultaneously active. 

In this study, we use the climate model EC-Earth3 to investigate how an AMOC weakening induced by a CO2 increase would influence the heat storage inside the ocean. We compare the CMIP abrupt4xCO2 simulation with an idealized experiment with the same forcing but designed to artificially maintain the AMOC strength at preindustrial levels through a positive salinity anomaly in the North Atlantic.  

We find that a change in the AMOC strength is associated with a change in heat storage, influencing both the vertical and interbasin redistribution. Due to AMOC weakening, less heat accumulates below 750 m, especially in the Atlantic Ocean, while we observe increased heat storage in intermediate layers and further heat transfer toward the Indo-Pacific Ocean. Overall, we notice a small but significant difference between the two simulations in global heat uptake, increasing in a weaker AMOC state. We hypothesize that a reduced role for AMOC-driven OHU is compensated for by an increase in heat diffusion towards the interior at low latitudes, according to recently developed conceptual models of OHU. 

These differences could influence the surface warming pattern and regional sea level rise, with implications for long-term climate changes. 

How to cite: Ventrucci, C., Fabiano, F., Davini, P., Mehling, O., and Bellomo, K.: The role of AMOC in controlling ocean heat uptake in idealized abrupt forcing scenarios, EGU General Assembly 2025, Vienna, Austria, 27 Apr–2 May 2025, EGU25-16169, https://doi.org/10.5194/egusphere-egu25-16169, 2025.

EGU25-17516 | Orals | OS1.13

North Atlantic Carbon Uptake and Variability: The Gulf Stream's Role in Air-Sea CO2 Flux and Storage 

Yohei Takano, Dani Jones, Ric Williams, Gael Forget, Jon Lauderdale, David Munday, and Vassil Roussenov

The North Atlantic Ocean contributes approximately 30% of the global ocean carbon uptake. This region plays a vital role in anthropogenic carbon uptake and hosts a significant natural carbon cycle driven by physical and biogeochemical processes. This study focuses on understanding the inter-annual variability of air-sea CO2 fluxes, anthropogenic carbon storage, and the role of the Gulf Stream in transporting water masses with low anthropogenic carbon concentrations into the subpolar North Atlantic. We present the development and application of our forward and adjoint ocean carbon cycle and biogeochemistry models within the Estimating the Circulation and Climate of the Ocean (ECCOv4) framework (ECCOv4r2-Dissolved Inorganic Carbon (DIC)). The ECCOv4r2-DIC simulation overall captures the inter-annual variability and decadal trends of ocean carbon uptake in the subpolar North Atlantic. The adjoint model for ocean biogeochemistry is a powerful tool that enables us to investigate the sensitivity of ocean carbon uptake to physical and biogeochemical factors under dynamic ocean conditions. Preliminary results from the adjoint biogeochemistry sensitivity simulations indicate that subpolar North Atlantic carbon storage is highly sensitive to dissolved inorganic carbon (DIC) in the Gulf Stream region on inter-annual timescales (e.g., lag of -4 years). This finding suggests that remote advective carbon transport significantly influences inter-annual carbon variability in the subpolar North Atlantic Ocean.

How to cite: Takano, Y., Jones, D., Williams, R., Forget, G., Lauderdale, J., Munday, D., and Roussenov, V.: North Atlantic Carbon Uptake and Variability: The Gulf Stream's Role in Air-Sea CO2 Flux and Storage, EGU General Assembly 2025, Vienna, Austria, 27 Apr–2 May 2025, EGU25-17516, https://doi.org/10.5194/egusphere-egu25-17516, 2025.

EGU25-20100 | Orals | OS1.13

The import & export of carbon & nutrients from the Weddell Gyre. 

David Munday, Graeme MacGilchrist, Kate Hendry, Andrew Styles, Chris Auckland, and Yohei Takano

The physical circulation and biogeochemistry of the Southern Ocean has proved crucial to understanding the sensitivity of global climate. The ventilation of deep water, rich in carbon and nutrients throughout the subpolar Southern Ocean is usually framed in terms of the residual overturning. This places the emphasis on the up- and down-welling of different water masses. However, for the Weddell Gyre it has been proposed that casting the carbon cycle in terms of the horizontal gyre circulation may be more informative (MacGilchrist et al., 2019). This emphasises the role of remineralisation at mid-depth of organic carbon and the differential transport in/out of the Weddell Sea in the longitudinal direction.


Using MITgcm as an idealised two-basin model with a Weddell Sea at the southern boundary of the Atlantic basin, we examine the physical controls of the import/export of carbon & nutrients from the Weddell Sea. The idealised nature of the model allows us to easily change the surface forcing and bathymetry. By perturbing the idealised model's Scotia Ridge and Weddell Sea wind stress curl, we are able to influence the connection between the Weddell Gyre and the rest of the Southern Ocean. Other perturbation experiments, including the diapycnal diffusivity at depth, are used to perturb the overturning circulation. Using simple biogeochemistry and a carbon pump decomposition we are able to see how individual reservoirs are altered and the role of their transport in the overall carbon budget of the Weddell Sea. In particular, we are able to use Reynolds averaging to split the import/export of carbon & nutrients into the Weddell Gyre into components due to overturning and gyre circulations. Our experiments allow us to consider the physical aspects that control the relative strength of these components.

How to cite: Munday, D., MacGilchrist, G., Hendry, K., Styles, A., Auckland, C., and Takano, Y.: The import & export of carbon & nutrients from the Weddell Gyre., EGU General Assembly 2025, Vienna, Austria, 27 Apr–2 May 2025, EGU25-20100, https://doi.org/10.5194/egusphere-egu25-20100, 2025.

EGU25-21738 | Posters on site | OS1.13

The cooling potential of biological pump carbon after temperature overshoot 

Wolfgang Koeve and Ivy Frenger

In the event of insufficient mitigation efforts, net-negative CO2 emissions may be required to return to acceptable limits of climate warming as defined by the Paris Agreement. The ocean is an important carbon sink under increasing atmospheric CO2 levels,when physico-chemical carbon-uptake dominates. However, the processes that govern the marine carbon sink under net-negative CO2-emission regimes are unclear. Recent work with an Earth System model of intermediate complexity has shown that under idealized temperature overshoot scenarios CO2 from physical-chemical uptake was partly lost from the ocean at times of net-negative CO2-emissions, while storage associated with the biological carbon pump (DICremin) continued to increase and may even dominate marine excess CO2 storage on multi-centennial time scales (Koeve et al. 2014, Nature Geosciences, https://doi.org/10.1038/s41561-024-01541-y).

Here we extend this work and estimate, for the first time, the cooling potential associated with CO2-storage attributable to the biological carbon pump on centennial time scales, with a focus of conditions of net-negative CO2-emissions. In our approach we use the UVic Earth System model, complemented with explicit model tracers of DICremin and preformed DIC. Changes of these tracers since preindustrial conditions can be traced to either the biological carbon pump or the physical-chemical uptake of anthropogenic CO2, respectively. We quantify the cooling potential of biological pump carbon based on emission pathways perturbed by the change in DICremin since the preindustrial model state. The warming potential of anthropogenic carbon lost from the ocean during times of negative emissions is quantified from emission pathways perturbed by changes of preformed DIC since preindustrial.

How to cite: Koeve, W. and Frenger, I.: The cooling potential of biological pump carbon after temperature overshoot, EGU General Assembly 2025, Vienna, Austria, 27 Apr–2 May 2025, EGU25-21738, https://doi.org/10.5194/egusphere-egu25-21738, 2025.

EGU25-346 | ECS | Posters on site | OS3.1

BASS Mesocosm Study: trace gas processes during a phytoplankton bloom with extreme slick formation 

Lea Lange, Dennis Booge, Ina Stoltenberg, Hendrik Feil, Hermann W. Bange, and Christa A. Marandino

Short- and long-lived trace gases impact atmospheric chemistry and climate, via processes like hydroxyl radical chemistry, aerosol formation, cloud condensation nuclei formation, or the greenhouse effect. As the oceans serve as sources and sinks for atmospheric trace gases, understanding the drivers of trace gas cycling in surface waters and their release to the atmosphere is crucial for climate predictions. Furthermore, there is a serious lack of information related to trace gas cycling in the uppermost ocean, the Sea surface microlayer (SML). Production and consumption of trace gases was investigated in a five-week mesocosm study with North Sea water at the SURF facility (Wilhelmshaven, Germany), during which an extreme slick formed under a combined diatom and coccolith bloom. In addition to bulk sampling, the glass plate method was used successfully to sample trace gases in the SML. Findings are supported by an extensive set of parameters from other BASS subprojects.

How to cite: Lange, L., Booge, D., Stoltenberg, I., Feil, H., Bange, H. W., and Marandino, C. A.: BASS Mesocosm Study: trace gas processes during a phytoplankton bloom with extreme slick formation, EGU General Assembly 2025, Vienna, Austria, 27 Apr–2 May 2025, EGU25-346, https://doi.org/10.5194/egusphere-egu25-346, 2025.

EGU25-6365 | ECS | Orals | OS3.1

The Effects of Algal Blooms on Oxygen Concentration and Temperature in the Sea Surface Microlayer – a Mesocosm Study 

Carsten Rauch, Edgar Cortés, Leonie Jaeger, and Oliver Wurl

The sea surface microlayer (SML) is of global importance as all exchange processes of heat and gases between the ocean and the atmosphere have to pass through it and are regulated by the features of the SML. These exchanges occur not only permanently between the SML and the atmosphere, but also between the SML and the underlying water (ULW). The properties of the SML are strongly influenced by surface-active substances known as surfactants, which are mostly of biological origin. Events such as algal blooms can produce large amounts of surfactants, thus changing the properties of the SML and the ULW. Obtaining in situ data of the SML proved very difficult in the past, due to its small thickness. Using microsensors gives the opportunity to close this gap by obtaining in situ data of the SML and to directly show the influence an algal bloom has on the SML.

A mesocosm experiment was conducted to obtain a more mechanistic understanding of the effect of an algal bloom on the physicochemical properties of the SML. An algal bloom was artificially induced in a seawater basin and physiochemical changes in the SML and ULW were investigated over time by applying multiple techniques. To directly study changes in temperature and oxygen, very precise microsensors (UNISENSE) were used for continuous in situ profiling, measuring from the air, through the SML, and into the ULW on a scale of tens of micrometers. We conducted the experiment over a continuous 30-day period during the algal bloom, allowing us to gain insights into the boundary layer, including the formation of oxygen and temperature gradients and the thickness of the SML.

The microsensor data showed, that the oxygen gradient in the SML is strongly correlated to the chlorophyll a concentration (r = 0.76, p < 0.01) and thus the algal bloom, while the thickness of the oxygen diffusion boundary layer, however, only shows a weak correlation to the surfactant concentration (r = 0.47, p = 0.01). The oxygen measurements deliver the in situ data to verify previous assumptions on oxygen gradients (-10 – 50 µmol L-1) and the thickness of the oxygen diffusion boundary layer (500 – 1500 µm) at the sea surface. The temperature gradient in the SML and the thickness of the thermal boundary layer were not influenced by the algal bloom, but the in situ measurements also confirm previous assumptions on temperature gradients (0.05 – 0.2 °C) and the thermal boundary layer thickness (750 – 2000 µm).

Obtaining gradients of gases or temperature in the SML and calculating the SML thickness was in the past only possible via indirect methods like measuring gas concentration differences between air and ULW or with computing surface temperatures from the emitted longwave irradiance. The in situ microsensor measurements now enable us to directly investigate processes inside the SML without relying on indirect measurements. Overall, we investigated the effect of an algal bloom on the SML and demonstrated a new in situ approach using microsensors to investigate physicochemical changes in and across the SML.

How to cite: Rauch, C., Cortés, E., Jaeger, L., and Wurl, O.: The Effects of Algal Blooms on Oxygen Concentration and Temperature in the Sea Surface Microlayer – a Mesocosm Study, EGU General Assembly 2025, Vienna, Austria, 27 Apr–2 May 2025, EGU25-6365, https://doi.org/10.5194/egusphere-egu25-6365, 2025.

The sea surface microlayer (SML) refers to the uppermost millimeter of the ocean surface that is in direct contact with the atmosphere. It has physicochemical and biological properties that are distinct from the underlying water and its properties determine air-sea exchange of momentum, mass and energy. Gas transfer velocity is mostly determined by wind forcing, where gas transfer is enhanced at low to moderate wind speeds. However, biological and pollutant enrichment of the SML with surfactants reduces gas transfer by suppressing turbulence and damping waves. Local impacts from surfactants can be significant, reducing air-sea gas transfer by single to double-digit percentages at moderate wind speeds.

I calculate a timeseries of contemporary global air-sea CO2 fluxes using FluxEngine, adjusting the calculation for the presence of biological surfactants. Surfactant suppression of air-sea gas transfer is estimated as a function of total organic carbon concentration, which is in turn estimated using global satellite products of particulate and dissolved organic carbon. Results will be compared to previous regional estimates of surfactant regulation of CO2 fluxes. This approach will produce a novel global estimate of biological surfactants’ regulation of CO2 fluxes across the air-sea interface, supporting further work isolating pollutants’ role in regulation of gas transfer.

How to cite: Kvale, K.: Surfactants’ global regulation of CO2 fluxes across the air-sea interface, EGU General Assembly 2025, Vienna, Austria, 27 Apr–2 May 2025, EGU25-7269, https://doi.org/10.5194/egusphere-egu25-7269, 2025.

EGU25-8521 | Posters on site | OS3.1

Surfactant distribution can impact air-sea exchange in a Tropical Estuarine System in the Caribbean. 

Mariana Ribas-Ribas, Karen Moreno-Polo, Diomer Tobón-Monsalve, Carola Lehners, Oliver Wurl, Wilberto Pacheco, and Lennin Florez-Leiva

The sea surface microlayer (SML), the critical interface between the ocean and atmosphere (≤ 1000 μm thick), plays a vital role in regulating the exchange of climate-relevant gases, such as CO2. This study provides the first evaluation of the SML in a tropical estuarine system, covering over 80 km of the Gulf of Urabá in Caribbean Colombia. It investigates the distribution and influence of surfactants, focusing on the effect of fluvial inputs during the rainy and dry seasons. Samples were collected from fluvial and marine zones, revealing no significant differences in surfactant concentrations or enrichment factors. However, surfactant concentrations were significantly higher during the rainy season (1011.63 ± 745.21 μg Teq L⁻¹, August 2021) than the dry season (428.34 ± 189.44 μg Teq L⁻¹, April 2022). Notably, all sampling stations exhibited surfactant concentrations exceeding 200 μg Teq L⁻¹, a threshold associated with reductions of up to 23% in the rate of ocean-atmosphere CO2 transfer. Approximately 55% of the recorded concentrations represented a high surfactant regime, while 28% corresponded to slick zones. These values and enrichment factors were higher than those reported in other coastal and oceanic studies. Our findings underscore the significant role of surfactants in tropical biogeochemical cycles and provide valuable new insights into the SML in tropical regions where data is scarce. This research highlights the potential impact of surfactants on CO2 exchange in coastal tropical environments, enhancing our understanding of the ocean-atmosphere interface in such regions.

How to cite: Ribas-Ribas, M., Moreno-Polo, K., Tobón-Monsalve, D., Lehners, C., Wurl, O., Pacheco, W., and Florez-Leiva, L.: Surfactant distribution can impact air-sea exchange in a Tropical Estuarine System in the Caribbean., EGU General Assembly 2025, Vienna, Austria, 27 Apr–2 May 2025, EGU25-8521, https://doi.org/10.5194/egusphere-egu25-8521, 2025.

EGU25-8823 | ECS | Orals | OS3.1

Biogeochemical Links in the Sea-Surface Microlayer: A Multidisciplinary Mesocosm Study 

Riaz Bibi, Mariana Ribas-Ribas, Carola Lehners, Leonie Jaeger, Lisa Gassen, Samuel Mintah Ayim, Thomas H. Badewien, Jochen Wollschläger, Claudia Thölen, Thorsten H. Brinkhoff, Isha Athale, Hannelore Waska, Jasper Zöbelein, Rüdiger Röttgers, Michael Novak, Anja Engel, Josefine Karnatz, and Oliver Wurl

The sea-surface microlayer (SML) represents the thin (< 1000 µm) uppermost layer of the ocean. Due to its unique position between ocean and atmosphere, the SML plays a central role in marine biogeochemical cycles. Changes in the phytoplankton biomass and community composition are linked to profound changes in the physical, chemical, and biological properties of the SML. And this influences air-sea interaction such as heat and gas exchange, organic matter composition, and surface-active substances in the SML and underlying water (ULW). Dynamic interactions between the SML and the ULW and the connectivity of the biogeochemical processes in the SML remain unclear. To fill this knowledge gap, we conducted a multidisciplinary mesocosm study. Here we report the general setup in a 17 m3 mesocosm facility, the progression of an induced phytoplankton bloom, and the general description and coupling of the changes in biogeochemical properties of the SML and the ULW.

SML and ULW samples were collected daily to analyze inorganic nutrients (NO3-, NO2-, PO43-, SiO32-), turbidity, solar radiation, phytopigments, surfactants, dissolved and particulate organic carbon (DOC, POC), total dissolved and particulate nitrogen (TDN, PN), phytoplankton and bacterial abundance, and their utilized substrates.

A self-organizing map (SOM) configuration revealed a clear temporal segregation of nutrient samples in SML and ULW. Based on nutrient levels, phytoplankton bloom progression over the time of the mesocosm experiment could be clearly classified into pre-bloom, bloom, and post-bloom phases. During this time, Chla concentrations varied from 1.0 to 11.4 μg L-1 with an average of 7.3 µg L-1. POC and PN exhibited a strongly positive relationship (r = 0.95) and followed the trend of Chla. Turbidity demonstrated a peak during bloom phase, which was associated with a high biological activity. Phytopigment composition data showed that haptophytes were the dominant phytoplankton group, followed by diatoms which could be confirmed by optical methods.

The daily average solar irradiance aligned with the local weather variability. Surfactants were enriched in the SML compared to the ULW. A discrepancy between the onset of increases in phytoplankton biomass and surfactant concentrations was observed with a lag of five days. This mismatch suggests a physiological acclimation of phytoplankton towards less favorable growth conditions, for example, nutrient limitations after the bloom phase. The high surfactant concentrations were also mirrored as DOC and TDN enrichment in the SML compared to ULW. A distinct slick formation with high turbidity was observed, indicating a biofilm-like SML habitat during the bloom and post-bloom phases. This biofilm was characterized by higher bacterial cell counts in SML. Bacterial metabolic profiles assessed by Biolog EcoPlates showed that the bacterial community utilized amino acids as key substrates in both water layers.

The main findings of our study emphasize that changes in biological parameters were linked to changes in chemical and physical parameters in SML. Our study provides deeper insights into the biogeochemical controls of the SML at a mechanistic level. Further spatio-temporal studies are needed to investigate the coupling of biogeochemical processes between the SML and ULW at both regional and global scales.

How to cite: Bibi, R., Ribas-Ribas, M., Lehners, C., Jaeger, L., Gassen, L., Mintah Ayim, S., H. Badewien, T., Wollschläger, J., Thölen, C., H. Brinkhoff, T., Athale, I., Waska, H., Zöbelein, J., Röttgers, R., Novak, M., Engel, A., Karnatz, J., and Wurl, O.: Biogeochemical Links in the Sea-Surface Microlayer: A Multidisciplinary Mesocosm Study, EGU General Assembly 2025, Vienna, Austria, 27 Apr–2 May 2025, EGU25-8823, https://doi.org/10.5194/egusphere-egu25-8823, 2025.

EGU25-8931 | ECS | Orals | OS3.1

Photochemical dynamics of carbonyl compounds in the sea-surface microlayer (SML) based on a mesocosm study 

Olenka Jibaja Valderrama, Thomas Schaefer, Manuela van Pinxteren, and Hartmut Herrmann

The sea-surface microlayer (SML), the thin boundary interface between the ocean and the atmosphere, is of global relevance as oceans are largely assumed to carry an SML. Characterized by its enrichment in organic material and exposure to strong solar radiation, the SML is expected to be a photochemically active zone that plays a critical role in the cycling of organic compounds and that influences air-sea exchange processes. Carbonyl compounds are particularly important as known products of photochemical reactions at the ocean's surface, making their behavior potentially relevant for understanding abiotic reactions and exchanges with the atmosphere. This study investigates the photochemical production and degradation of aldehydes and ketones in both ambient SML and bulk seawater samples. Samples were collected during a mesocosm field campaign at the Sea-surface Facility (SURF), located at the Institute for Chemistry and Biology of the Marine Environment (ICBM) in Wilhelmshaven. To simulate natural conditions, the samples were irradiated for 5 hours using a temperature-controlled aqueous-phase photoreactor equipped with a light source that mimics actinic radiation. The formation and degradation of target carbonyl compounds were analyzed using a derivatization technique with o-(2,3,4,5,6-Pentafluorobenzyl)hydroxylamine (PFBHA), followed by solvent extraction and GC-MS analysis. The findings provide a quantitative evaluation of the formation and degradation dynamics of carbonyl compounds to understand differences between the SML and the underlying bulk seawater. First results suggest the photochemical formation of acetaldehyde and methyl vinyl ketone, and the photochemical degradation of trans-2-hexenal. For other target compounds, including acetophenone, acrolein, butyraldehyde, crotonaldehyde, glyoxal, hexanal, heptanal, hydroxyacetone, methacrolein and propionaldehyde, no consistent trend of formation or degradation was observed. The concentrations of these carbonyl compounds varied significantly depending on the sample, ranging from a few ng L-1 to a few mg L-1. This study contributes to a deeper understanding of the role of the SML as a reactive environment and its implications for biogeochemical cycles and air-sea interactions.

How to cite: Jibaja Valderrama, O., Schaefer, T., van Pinxteren, M., and Herrmann, H.: Photochemical dynamics of carbonyl compounds in the sea-surface microlayer (SML) based on a mesocosm study, EGU General Assembly 2025, Vienna, Austria, 27 Apr–2 May 2025, EGU25-8931, https://doi.org/10.5194/egusphere-egu25-8931, 2025.

EGU25-11560 | ECS | Posters on site | OS3.1

Organic Alkalinity in the Sea-Surface Microlayer: Implications for Ocean Acid-Base Chemistry 

Edgar Cortés, Alisa Rosemarie Ingrid Wüst, Ander Lopez Puertas, Oliver Wurl, José Martín Hernández Ayón, Hannelore Waska, and Mariana Ribas Ribas

The air-sea CO₂ exchange is a critical process in regulating Earth's carbon cycle. At the ocean's surface, the sea-surface microlayer (SML) - a thin, organic-rich layer - serves as the critical interface between the air and sea and acts as a microreactor where unique chemical transformations occur, driven by sunlight, biological activity and surface-active materials. However, its role in air-sea CO₂ exchange is not well explored. In this study, we present the first direct measurements of organic alkalinity (OA) in the SML during a mesocosm experiment simulating a coccolithophore bloom of Emiliania huxleyi, aiming to better understand the contribution of organic matter to the air-sea CO₂ exchange.

Our every third day-resolution data on dissolved inorganic carbon (DIC), total alkalinity (TA), pH, and OA, quantified using back-titration, reveal significant differences between the SML and the underlying water (ULW). OA concentrations in the SML were consistently higher, contributing 8.07% ± 2.60 of TA, 2.58 times higher than the 3.12% ± 1.24 contribution observed in the ULW. This enrichment suggests that the SML serve as a significant reservoir for OA, influencing the overall acid-base balance.

During the coccolithophore bloom phase, we observed that photosynthesis and calcification—the dominant biogeochemical processes—resulted in decreases in both TA and DIC in the SML. Normally, changes in DIC would lead to a decrease in pH (increased acidity), while changes in TA might buffer this effect. However, the observed pH variability could not be explained by DIC and TA alone. Only by considering OA concentrations we can explain the observed pH variability. A strong negative correlation between the OA contribution to TA and pH (r = -0.82, p < 0.05) highlighted OA's role in modulating pH only in the SML. While calcification produces CO₂ and lowers pH through the dissociation of carbonic acid, coccolithophores also release organic acids, including humic-like fluorescent dissolved organic matter (fDOM). These acids may contribute to TA, but their primary effect is to release H⁺ ions, further acidifying the surface layer.

The increased OA in the SML contributes to its buffering capacity, but it does not fully counteract the acidification induced by calcification. These findings underscore the importance of incorporating OA dynamics in studies of the SML, particularly in the context of intense biological activity, such as coccolithophore blooms. Our results suggest that pH changes in the SML cannot be fully explained by TA alone, highlighting the need to consider OA in the analysis of the marine carbon system and the air-sea CO₂ exchange. While the specific organic acids contributing to OA remain unidentified for this work, future research into these compounds will be essential for improving our understanding of OA’s role in modulating the Earth's carbon cycle.

How to cite: Cortés, E., Wüst, A. R. I., Lopez Puertas, A., Wurl, O., Hernández Ayón, J. M., Waska, H., and Ribas Ribas, M.: Organic Alkalinity in the Sea-Surface Microlayer: Implications for Ocean Acid-Base Chemistry, EGU General Assembly 2025, Vienna, Austria, 27 Apr–2 May 2025, EGU25-11560, https://doi.org/10.5194/egusphere-egu25-11560, 2025.

EGU25-11844 | ECS | Posters on site | OS3.1

Effects of a Phytoplankton Bloom and Photobleaching on Colored and Fluorescent Dissolved Organic Matter in the Sea-Surface Microlayer 

Claudia Thölen, Jochen Wollschläger, Michael Novak, Rüdiger Röttgers, and Oliver Zielinski

The effects of a phytoplankton bloom and photobleaching on the colored and fluorescent dissolved organic matter (CDOM and FDOM, respectively) in the sea-surface microlayer (SML) and the underlying water (ULW) were studied in a 33-day mesocosm experiment at the Institute for Chemistry and Biology of the Marine Environment in Wilhelmshaven, Germany. The SML is the thin (< 100 µm) boundary layer between the ocean and the atmosphere and highly relevant to ocean biogeochemistry and climate-related exchange processes. Previous work has shown that when the SML is enriched in organic matter it can hinder gas, light, momentum, and heat exchanges between ocean and atmosphere. However, the underlying processes of organic matter enrichment in the SML are insufficiently understood. Heterogeneity and dynamics in the open sea make it difficult to differentiate between transport processes, environmental drivers, and biogeochemical processes. Hence, the mesocosm study was conducted to gain a deeper understanding of organic matter formation and degradation processes in the SML and ULW. To gain an understanding of different sources and sinks, the hypotheses tested were (1.) phytoplankton blooms result in different FDOM component compositions in the SML and ULW and (2.) photodegradation affects the component composition of the SML and the ULW differently.
Daily SML and ULW samples were collected for spectral fluorometric and photometric analysis, alternately in the morning and afternoon. Supplementary parameters like irradiance, temperature, and chlorophyll-a were also recorded within the mesocosm basin with high temporal resolution (approx. 1 min). Spectral photometric and fluorometric methods, which exhibit high sensitivity and structural specificity with respect to organic matter are used for CDOM and FDOM analysis.
The mesocosm experiment was divided into three phases (bloom onset, peak, and decay). Degradation of larger, complex molecules or production of new organic matter was assessed via the “humification index” and is dependent on the water layer (SML or ULW), the phase of the bloom, and the sampling time. As samples were taken alternatively in the morning and in the afternoon, the exposure time to UV-light and therefore photodegradation as a sink varies differently for SML and ULW. CDOM slope results showed a high variability and generally higher molecular weights and higher molecule aromaticity in the SML compared to the ULW. Protein-like component concentrations increased in both SML and ULW which indicates higher microbial activity towards the peak and decay phase of the experiment. These results suggest that photodegradation and possibly microbial activity have different effects on SML and ULW, verifying hypothesis 2. The affect of higher biological activity during the phytoplankton bloom led to the most pronounced differences between the concentration and composition of organic matter in the SML and ULW, especially in the protein-like components. This finding supports the premises of hypothesis 1.

How to cite: Thölen, C., Wollschläger, J., Novak, M., Röttgers, R., and Zielinski, O.: Effects of a Phytoplankton Bloom and Photobleaching on Colored and Fluorescent Dissolved Organic Matter in the Sea-Surface Microlayer, EGU General Assembly 2025, Vienna, Austria, 27 Apr–2 May 2025, EGU25-11844, https://doi.org/10.5194/egusphere-egu25-11844, 2025.

EGU25-13644 | ECS | Orals | OS3.1

Influence of a Surfactant on Physical Processes Above and Below Wind-Generated Waves in a Wind-Wave Tank  

Camille Tondu, Marc Buckley, and Martin Gade

The air and water flow boundary layers are strongly coupled with the wave field and the physical phenomena involved are essentially based on small submillimeter/millimeter scale features and dynamic processes within the first millimeters above and below the SML (Sea surface Micro Layer). The scale at which these complex feed-back mechanisms operate make their study particularly challenging.

Surfactants at the air-sea interface strongly dampen both the dominant gravity-capillary waves and micro-breaking waves and hence dramatically influence the dynamics and associated air-sea fluxes. Even though the general effect of these monolayers on the waves is well known by the scientific community, their influence on the surface dynamics and air-sea fluxes associated still need to be carefully studied.

A series of experiments were conducted at the 26-m long, 1.5-m high, 1-m wide wind-wave tank of the University of Hamburg (Germany), where a measurement system was developed and installed at a fetch of 15.5m. The system offers the possibility to perform high resolution (33 µm/pixel) PIV (Particle Image Velocimetry) to capture the motion in the air-water flows in the SML’s vicinity, and LIF (Laser Induced Fluorescence) to accurately detect the wavy interface, with a resolution of 55 µm/pixel. Experiments were carried out at a reference wind speed of 4.5 m/s, without and with an insoluble surfactant (oleyl alcohol).

In slick free conditions, high vorticity regions are observed under the wave crests. On the air-side, the viscous sublayer detaches from the crest of most of the observed waves, and is being regenerated on the windward side of the directly following wave. However, thanks to the wide 50-cm field of view, some evidence was found that, under specific conditions, the sheltered region past the airflow separation can overcome a wave, hence strongly affecting its growth. After deployment of oleyl alcohol at the water surface, the dominant gravity-capillary waves are strongly dampened, and the capillaries mostly disappeared. Waves are still sheltering the airflow on their leeward side, but no clear airflow separation is being seen, and the enhanced turbulent regions, which were observed below the crest in slick-free conditions, are thinner, more elongated, and less intense. In the waterside, it has also been noticed that with surfactants, some streaks are being ejected away from the wavy interface.

How to cite: Tondu, C., Buckley, M., and Gade, M.: Influence of a Surfactant on Physical Processes Above and Below Wind-Generated Waves in a Wind-Wave Tank , EGU General Assembly 2025, Vienna, Austria, 27 Apr–2 May 2025, EGU25-13644, https://doi.org/10.5194/egusphere-egu25-13644, 2025.

EGU25-15118 | ECS | Orals | OS3.1

Hydrodynamic Processes and Temperature-Salinity Gradients in Slicks: Insights from Lagrangian Observations in the Near-Surface Layer 

Lisa Deyle, Michelle Albinus, Jens Meyerjürgens, and Thomas H. Badewien

The near-surface ocean is central to exchanging energy, gases, and particles between the atmosphere and the upper ocean. In particular, the interaction processes between the sea surface microlayer and the underlying water are crucial for biogeochemical processes and climate science. An innovative approach using free-floating, minimal-invasive Lagrangian sensor drifters is employed to investigate hydrographic and dynamical processes in the near-surface layer. Each drifter is equipped with a sensor chain containing temperature and salinity sensors, enabling high-resolution vertical measurements down to a depth of 1.8 m.

The Lagrangian measurement method enables the dynamics of a water mass to be recorded in its natural inertial system without external influences such as ship-induced disturbances. During a field campaign in the North Sea near Helgoland in July 2024, temperature and salinity data were collected during slick events associated with algal blooms. Processes inside and outside the slicks, as well as their formation, dispersion and decay processes, were studied to understand the underlying mechanisms. This allows the analysis of horizontal and vertical gradients, as well as the investigation of the spatial and temporal dynamics of slicks, understanding their impact on the exchange processes and quantifying the importance of the sea surface microlayer and the underlying water.

Initial results reveal significant differences in temperature and salinity gradients between slick and non-slick areas. Slicks act as hydrodynamic microhabitats and critical boundaries, influencing vertical convection patterns and current shear in the near-surface layer. These results are confirmed by ADCP backscatter data collected from an autonomous catamaran, providing additional insights into current structures and particle distributions. Horizontal comparisons between multiple sensor-equipped drifters illustrate the variability of processes at small spatial scales.

The presented results demonstrate the potential of Lagrangian drifters as a minimally invasive, innovative and highly accurate method for studying slicks and climate-relevant processes in the near-surface layer. These approaches can significantly improve our understanding of air-sea interaction mechanisms and their role in global biogeochemical cycles.

How to cite: Deyle, L., Albinus, M., Meyerjürgens, J., and Badewien, T. H.: Hydrodynamic Processes and Temperature-Salinity Gradients in Slicks: Insights from Lagrangian Observations in the Near-Surface Layer, EGU General Assembly 2025, Vienna, Austria, 27 Apr–2 May 2025, EGU25-15118, https://doi.org/10.5194/egusphere-egu25-15118, 2025.

EGU25-16057 | Posters on site | OS3.1

Detection and Characterization of Mycosporine-like Amino Acids in the Sea Surface Microlayer of the Baltic Sea during Summer 

Michael Novak, Ruediger Roettgers, Claudia Thoelen, and Jochen Wollschlaeger

The Sea Surface Microlayer (SML) in aquatic environments is a thin layer (1–100 μm) at the air-water boundary, characterized by unique biogeochemical properties distinct from the underlying water. The production of organic biofilms and surfactants within the SML stabilizes the layer, often leading to a "slick-like" environment. The organic matrix within the SML can trap phytoplankton, subjecting them to intense light and ultraviolet (UV) radiation. Mycosporine-like amino acids (MAAs) are pigments produced by certain types of phytoplankton, exhibiting photoprotective absorption bands in UV and visible wavelengths. While numerous studies have documented MAAs in surface waters, particularly in equatorial regions, there is limited documentation of MAAs produced specifically within the SML. Here, we present data collected from the Baltic Sea near the summer solstice under both slick and non-slick conditions. Using High-Performance Liquid Chromatography (HPLC), we detected MAAs in SML samples. Absorption spectra measured from these samples revealed distinct UV absorption peaks characteristic of MAAs. Interestingly, many corresponding subsurface water samples contained either no detectable MAAs or only trace amounts. These findings highlight the unique environment of the SML and the biological acclimations that the neuston undergo to survive under these conditions.

How to cite: Novak, M., Roettgers, R., Thoelen, C., and Wollschlaeger, J.: Detection and Characterization of Mycosporine-like Amino Acids in the Sea Surface Microlayer of the Baltic Sea during Summer, EGU General Assembly 2025, Vienna, Austria, 27 Apr–2 May 2025, EGU25-16057, https://doi.org/10.5194/egusphere-egu25-16057, 2025.

EGU25-18260 | Orals | OS3.1

Effect of Solar Radiation on Presence and Abundance of Surfactant Associated Bacteria in the Sea Surface Microlayer  

Alexander Soloviev, Georgia Parks, and Aurelien Tartar

The sea surface microlayer (SML) is the boundary layer at the surface of the ocean, distinct from the water below and highly variable in space and time. SML is influenced by organisms that aslicks. Slicks are the result of surfactants dampening capillary waves, which can be seen in synthetic aperture radar (SAR) imagery because the smooth surface reflecting backscatter away from the receiver. This experiment investigated the presence and abundance of surfactant-associated bacteria in the SML above a coral reef and in slicks in a coastal seagrass ecosystem. During the experiment in the Florida Keys, 220 SML and subsurface water (SSW) samples were collected above a coral reef area and in slicks above a coastal seagrass ecosystem. During our previous experiments in the Gulf of Mexico samples were collected in the daylight only; while, in the Straits of Florida, in both daylight and nighttime (due to the study of the coral sponging, which however did not happen at the time of the experiment). All SML and SSW samples were sequenced on the Illumina MiSeq, 12 surfactant associated bacteria genera were found. Increasing wind speed had a negative effect on the abundance of these genera, with lower wind speeds showing a more habitable environment. The ratio of abundance of surfactant-associated bacteria between the SML and SSW was found different and affected by the ultraviolet component of solar radiation. Thus, the concentration of bio-surfactants in the SML may be different during the daylight and nighttime with corresponding consequences for the SAR imagery and air-sea interactions.

How to cite: Soloviev, A., Parks, G., and Tartar, A.: Effect of Solar Radiation on Presence and Abundance of Surfactant Associated Bacteria in the Sea Surface Microlayer , EGU General Assembly 2025, Vienna, Austria, 27 Apr–2 May 2025, EGU25-18260, https://doi.org/10.5194/egusphere-egu25-18260, 2025.

EGU25-19728 | ECS | Orals | OS3.1

Spatial and temporal dynamics of dissolved organic matter in the sea surface microlayer during a bloom of coccolithophores 

Jasper Zöbelein, Thorsten Dittmar, and Hannelore Waska

The sea surface microlayer (SML) is a microscopic boundary that covers the ocean’s surface, influences CO2 exchange with the atmosphere, and is often exposed to high levels of UV irradiation. The SML is a unique biome and shelters diverse microbial communities. Bioaggregates, containing carbohydrates, lipids and proteinaceous material accumulate in the SML, affecting gas exchange. Despite its role in the global carbon cycle, the biogeochemical processes controlling the production and turnover of organic matter in the SML are poorly understood. This study is part of the collaborative research unit ’Biogeochemical processes and Air-sea exchange in the Sea-Surface microlayer’ (BASS). Our goal is to decipher the underlaying forces behind the accumulation of dissolved organic matter (DOM) in the SML and its spatial and temporal dynamics. Furthermore, we aim to link the molecular properties of DOM in the SML to the microbial communities living in the SML, to air-sea gas exchange, and to carbonate chemistry. To address these objectives, we conducted a large-scale mesocosm study with coastal seawater from Jade Bay (North Sea, Germany). Following nutrient addition, a bloom of the coccolithophore Emiliania huxleyi occurred. The SML was sampled with a glass plate, and the underlying water (ULW) was sampled with a tube at a depth of 60 cm. Dissolved organic carbon (DOC) was quantified in filtered samples, which were then desalinated and concentrated for molecular analysis of DOM with ultra-high resolution mass spectrometry. In both the SML and ULW, DOC concentrations almost doubled from pre-bloom to post-bloom conditions. Overall, DOC was higher in the SML than in the ULW, and this discrepancy increased after the algal bloom. Furthermore, the ratio of DOC to DON was significantly higher in the SML than in the ULW after the bloom. Molecular indicators of DOM lability increased concurrently with DOC concentrations, reflecting freshly produced DOM in both SML and ULW during the late algal bloom stages. At the same time, the contributions of aromatic fractions in DOM and a photodegradation index decreased, possibly related to UV exposure of the mesocosm. Overall, our results suggest that primary production is likely to drive organic matter accumulation in the SML.

How to cite: Zöbelein, J., Dittmar, T., and Waska, H.: Spatial and temporal dynamics of dissolved organic matter in the sea surface microlayer during a bloom of coccolithophores, EGU General Assembly 2025, Vienna, Austria, 27 Apr–2 May 2025, EGU25-19728, https://doi.org/10.5194/egusphere-egu25-19728, 2025.

EGU25-20162 | ECS | Orals | OS3.1

Enrichment of Dissolved Organic Matter in the Sea Surface Microlayer During a Phytoplankton Bloom – Preliminary Results from a Mesocosm Study 

Josefine Karnatz, Theresa Barthelmess, Mariana Ribas-Ribas, Carola Lehners, Oliver Wurl, and Anja Engel

The ocean's uppermost layer, the sea surface microlayer (SML), significantly influences physical and chemical properties due to the enrichment with dissolved organic matter (DOM). Biomolecules exhibiting amphiphilic properties are referred to as surfactants and preferentially accumulate in the SML. Surfactants were previously shown to significantly damp capillary waves and reduce air-sea gas fluxes. However, their source dynamics and chemical identity remain unknown. Phytoplankton communities are the primary producers of major biomolecule classes such as carbohydrates and amino acids. We explored how phytoplankton bloom development shapes enrichment and composition processes in SML and in relation to surface activity. As part of the “BASS” (Biogeochemical processes and air-sea exchange in the sea surface microlayer) project, an experiment was conducted in the mesocosm facility “SURF” in 2023 to study changes in the SML over the course of a phytoplankton bloom for one month. During the experiment, we collected samples for dissolved amino acids (DAA) and dissolved combined carbohydrates (DCCHO) from the SML and the underlying water (ULW). Overall, concentrations of DAA and DCCHO were enriched in the SML compared to the ULW by a factor of 2.88 ± 1.16 and 2.68 ± 1.47, respectively. The highest enrichment factors for DCCHO and DAA occurred a few days after the peak of the phytoplankton bloom. Particularly high enrichment factors were calculated for the polar amino acids arginine (4.67 ± 2.64), glutamic acid (4.31 ± 2.24), and tyrosine (4.46 ± 2.92). However, nonpolar amino acids leucine and phenylalanine showed enhanced enrichment factors as well. Extremely high enrichment with factors were observed for glucose (8.79 ± 8.30), while other DCCHO only showed slight enrichment. Our results point towards a strong effect on the surface activity of polar and freshly produced, very labile DOM. Investigating variations in the biomolecular composition of the SML in relation to potential source dynamics further enhances our understanding of biogeochemical and climate-relevant processes in the SML, such as air-sea gas exchange.

How to cite: Karnatz, J., Barthelmess, T., Ribas-Ribas, M., Lehners, C., Wurl, O., and Engel, A.: Enrichment of Dissolved Organic Matter in the Sea Surface Microlayer During a Phytoplankton Bloom – Preliminary Results from a Mesocosm Study, EGU General Assembly 2025, Vienna, Austria, 27 Apr–2 May 2025, EGU25-20162, https://doi.org/10.5194/egusphere-egu25-20162, 2025.

EGU25-20597 | ECS | Orals | OS3.1

VSFG Based Surfactant Coverage Index - A Feasible Approach to Assess the Effect of the SML on Air-Sea Gas Exchange? 

Falko Schäfer, Florian-David Lange, Kristian Laß, and Gernot Friedrichs

The sea surface microlayer (SML) acts as a biogeochemical and (photo)chemical reactor. It is enriched with surfactants that modulate the physico-chemical properties of the interface. As such, the SML reduces the formation of capillary waves and thus turbulent air-sea gas exchange.

In recent years, the surface sensitive methods of Vibrational Sum Frequency Generation (VSFG) and Langmuir through compression isotherms (LT) have been used to characterize the state of the SML on the nanoscale. Here, we give a brief overview of the results obtained during the last decade, reporting on a variety of experiments ranging from (i) artificial laboratory experiments with model wet and dry surfactants (Triton X-100 and DPPC), (ii) semi-natural large-scale mesocosm experiments (SURF facility in Wilhelmshaven, Germany, 2023), and (iii) the analysis of natural samples. These include samples from a study targeting slick versus non-slick conditions (near Helgoland island, Germany, 2024), year-long time-series measurements at Boknis Eck Time series Station as well as during the Baltic GasEX campaign (Eckernförde Bay, Germany, 2009-2019). In this context, we have derived a surface coverage index as a proxy parameter to reduce the spectral VSFG information to a single parameter in order to enable correlation with other biogeochemical and physical variables, including surfactant activity based on AC voltammetry and wave damping data from previous studies.

We hypothesize that gas exchange reduction can be constrained by a surfactant coverage threshold. Working out solid correlation of biogeochemical parameters with surfactant coverage would help to better model the influence of the SML on large-scale air-sea gas exchange based on their climatologies.

How to cite: Schäfer, F., Lange, F.-D., Laß, K., and Friedrichs, G.: VSFG Based Surfactant Coverage Index - A Feasible Approach to Assess the Effect of the SML on Air-Sea Gas Exchange?, EGU General Assembly 2025, Vienna, Austria, 27 Apr–2 May 2025, EGU25-20597, https://doi.org/10.5194/egusphere-egu25-20597, 2025.

EGU25-1242 | ECS | Orals | AS2.5

The influence of wave-induced variability on ocean carbon uptake 

Paridhi Rustogi, Laure Resplandy, Enhui Liao, Brandon Reichl, and Luc Deike

Traditional gas transfer velocity formulations for air-sea CO2 fluxes scale solely with wind speed, ignoring wave activity, including wave breaking and bubble-mediated transfers that enhance the rate of gas exchange. Here, we incorporate a wind-wave dependent gas transfer velocity formulation into an ocean general circulation model to quantify the effects of wave-induced spatiotemporal variability on CO2 fluxes and ocean carbon storage. Our results reveal that wave activity introduces a hemispheric asymmetry in ocean carbon storage, with gains in the southern hemisphere, where wave activity is robust year-round, and losses in the northern hemisphere, where continental sheltering reduces carbon uptake. Compared to a traditional wind-dependent formulation, incorporating wave activity yields a modest global increase in ocean carbon storage of 4.3 PgC over 1959-2018 (~4%), but on average, enhances the CO2 gas transfer velocity and flux variability by 5-30% on high-frequency and seasonal timescales in the extratropics and up to 200-300% during storms (>15 m s-1 wind speed). The magnitude of fluxes from wave activity is comparable to expected marine carbon dioxide removal (mCDR) efforts. This underscores the need to incorporate wind-wave variability into modeled fluxes to distinguish natural variability from anthropogenic impacts and ensure accurate mCDR verification and monitoring.

How to cite: Rustogi, P., Resplandy, L., Liao, E., Reichl, B., and Deike, L.: The influence of wave-induced variability on ocean carbon uptake, EGU General Assembly 2025, Vienna, Austria, 27 Apr–2 May 2025, EGU25-1242, https://doi.org/10.5194/egusphere-egu25-1242, 2025.

EGU25-1323 | Posters on site | AS2.5

Organic Compounds in the Tropical Oligotrophic Atlantic Ocean: Insights into Sea-to-Air Transfer and Atmospheric Transformations  

Manuela van Pinxteren, Sebastian Zeppenfeld, Khanneh Wadinga Fomba, Nadja Triesch, Sanja Frka, and Hartmut Herrmann

Carbohydrates, amino acids, and lipids are significant contributors to organic carbon in the marine environment, playing key roles in ocean-atmosphere interactions. To investigate their sea-to-air transfer, enrichment in the sea surface microlayer (SML), and potential transformations during atmospheric transport, we conducted field studies in the tropical Atlantic Ocean at the Cape Verde Atmospheric Observatory. This study links measurements of these compounds in surface seawater, including the SML, with their presence and composition in submicron aerosol particles.

The study found moderate enrichment of lipids and carbohydrates in the SML, while amino acids exhibited higher enrichment, despite their relatively lower surface activity. In aerosol particles, lipids were markedly more enriched compared to amino acids and carbohydrates, likely due to their surface-active and lipophilic nature.

Detailed molecular analyses revealed shifts in the relative abundance of organic compounds during atmospheric transport, particularly for amino acids, suggesting in situ atmospheric transformations via biotic or abiotic processes. On average, 49% of aerosol OC was attributable to specific compound groups, with lipids accounting for the largest fraction. Amines, oxalic acid, and carbonyls contributed around 6%, while carbohydrates and amino acids each represented less than 1% of the total aerosol OC. Notably, carbohydrate-like compounds likely reside in glycolipids within the lipid fraction, underscoring the complexity of organic matter in marine aerosols.

These findings advance our understanding of the processes governing organic carbon transfer from the ocean to the atmosphere, including the roles of the SML and atmospheric processing. This knowledge is crucial for refining models of marine aerosols and their impact on atmospheric chemistry and climate.

The study contributes to the international SOLAS program.

Ref: van Pinxteren, M., Zeppenfeld, S., Fomba, K. W., Triesch, N., Frka, S., and Herrmann, H.: Amino acids, carbohydrates, and lipids in the tropical oligotrophic Atlantic Ocean: sea-to-air transfer and atmospheric in situ formation, Atmos. Chem. Phys., 23, 6571–6590, https://doi.org/10.5194/acp-23-6571-2023, 2023.

How to cite: van Pinxteren, M., Zeppenfeld, S., Fomba, K. W., Triesch, N., Frka, S., and Herrmann, H.: Organic Compounds in the Tropical Oligotrophic Atlantic Ocean: Insights into Sea-to-Air Transfer and Atmospheric Transformations , EGU General Assembly 2025, Vienna, Austria, 27 Apr–2 May 2025, EGU25-1323, https://doi.org/10.5194/egusphere-egu25-1323, 2025.

EGU25-1376 | Posters on site | AS2.5

Impact of wildfires ash deposition on iron binding humic substances concentrations in surface waters: Results from a dissolution experiment 

gabriel Dulaquais, Matthieu Bressac, Eva Ortega-Retuerta, Emmanuelle Uher, Barbara Marie, and Nathan Nault

Wildfires contribute significantly to biomass burning. The deposition of ash from wildfires into surface ocean waters is a source of iron (Fe), namely pyrogenic Fe, and may enhance primary production in Fe-limited domains. However, due to the low solubility of Fe and the operational definition of its dissolved fraction, a portion of the dissolved Fe (DFe) released during ash dissolution may reprecipitate as authigenic inorganic colloids. This process can lead to an overestimation of the bioavailable pyrogenic DFe. To remain in a soluble form, Fe must be complexed with organic ligands capable of undergoing biochemical processes such as bacterial degradation, direct uptake, or photoreduction, leading to potentially bioavailable forms of DFe. Among the diverse range of iron-binding ligands, humic-type ligands (LFeHS) are important. LFeHS are ubiquitous in seawater, soluble, and may lead Fe to a bioavailable form. LFeHS are ubiquitous in seawater, soluble, and keep Fe in a bioavailable form. Here we present results from dissolution experiments. Ash samples collected in 2009 after wildfire events in the Spanish Mediterranean region were put in contact with non-euxinic, filtered Mediterranean surface seawater in a 7-day batch experiment. Four deposition fluxes were tested. The concentrations of DFe, fluorescent dissolved organic matter (FDOM), LFeHS, and the amount of Fe complexed by humic-type ligands were measured. Our results indicate that ash dissolution induces an increase in LFeHS, proportional to the ash concentration in the experimental medium. FDOM measurements confirm a time-dependent increase in humic-type material of terrestrial origin. Additionally, the observed increase in protein-like FDOM (C4) suggests that ash deposition enhances the modification of dissolved organic matter by bacteria. Using a simple kinetic model, we determined the dissolution rate constant for the tested ash. This constant can be incorporated into global oceanic models such as PISCES or REcoM to improve predictions of pyrogenic Fe bioavailability and its impacts on marine ecosystems.

How to cite: Dulaquais, G., Bressac, M., Ortega-Retuerta, E., Uher, E., Marie, B., and Nault, N.: Impact of wildfires ash deposition on iron binding humic substances concentrations in surface waters: Results from a dissolution experiment, EGU General Assembly 2025, Vienna, Austria, 27 Apr–2 May 2025, EGU25-1376, https://doi.org/10.5194/egusphere-egu25-1376, 2025.

EGU25-1665 | ECS | Orals | AS2.5 | Highlight

Surface microlayer ecosystems as platforms for viral adaptation and dispersal in the Central Arctic 

Janina Rahlff, George Westmeijer, Julia Weissenbach, Alfred Antson, and Karin Holmfeldt

In polar regions, aquatic viruses play a pivotal role in shaping microbial communities yet face significant challenges such as low host availability and harsh environmental conditions. During the Synoptic Arctic Survey 2021 aboard the icebreaker Oden (Snoeijs-Leijonmalm, 2022), we investigated viral diversity, survival mechanisms, and host interactions in the Central Arctic's surface microlayer (SML), the uppermost millimeter of the ocean, and compared them with ~60 cm depth from the ocean and a melt pond. This study addresses the knowledge gap surrounding near-atmosphere aquatic ecosystems, highlighting the SML as a critical platform for viral adaptation and dispersal in one of Earth's most extreme environments. Our study uncovered 1154 viral operational taxonomic units (vOTUs) >10 kb in size, two-thirds of which were predicted bacteriophages (viruses that infect bacteria). Flavobacteriales were identified as key hosts, with one dominant melt pond vOTU linked to a Flavobacterium sp. isolate. Melt pond viral communities displayed lower diversity compared to open water, indicating selective pressures in these transient systems. We found that 17.2% of vOTUs carried 87 unique auxiliary metabolic genes (AMGs) involved in pathways such as amino acid, glycan polymer, and porphyrin metabolism, supporting host survival under extreme conditions. Notably, 16 vOTUs encoded glycerol-3-phosphate cytidylyltransferase (tagD), which may function in cryoprotection. While lytic phages could not be found via plaque assays, prophage induction experiments using the bacterial isolate Leeuwenhoekiella aequorea Arc30 and mitomycin C revealed active phages with siphovirus morphology and minimal protein similarity to known phages. Our findings also highlight the SML’s role in viral dispersal, as vOTU abundance correlated with spread across the Arctic via the boundary layer. These sophisticated viral strategies emphasize their ability to thrive in remote, inhospitable, and host-limited environments (Rahlff et al., 2024). These discoveries underscore the importance of viruses in Arctic ecosystem dynamics, influencing microbial communities, and in the broader context, nutrient cycling, gas exchange and resilience to climate change.

References:

Rahlff, J., Westmeijer, G., Weissenbach, J., Antson, A., & Holmfeldt, K. (2024). Surface microlayer-mediated virome dissemination in the Central Arctic. Microbiome, 12(1), 218. https://doi.org/10.1186/s40168-024-01902-0

Snoeijs-Leijonmalm, P. (2022). Expedition Report SWEDARCTIC Synoptic Arctic Survey 2021 with icebreaker Oden. In: Swedish Polar Research Secretariat.

How to cite: Rahlff, J., Westmeijer, G., Weissenbach, J., Antson, A., and Holmfeldt, K.: Surface microlayer ecosystems as platforms for viral adaptation and dispersal in the Central Arctic, EGU General Assembly 2025, Vienna, Austria, 27 Apr–2 May 2025, EGU25-1665, https://doi.org/10.5194/egusphere-egu25-1665, 2025.

EGU25-1770 | Posters on site | AS2.5

Methane distribution, production, and emission in the Western North Pacific 

Guiling Zhang, Haonan Wang, and Ziqiang Zhang

Ocean is a net source of atmospheric methane (CH4), but there are still large uncertainties in the estimations of global oceanic CH4 emission due to sparse data coverage. In this study, we investigated the spatial distribution and influencing factors of CH4 in the Western North Pacific (WNP) during two cruises in 2021 and 2022. High-resolution continuous underway measurements showed that surface CH4 concentrations ranged from 1.95 to 3.92 nM, indicating an obvious spatial gradient with a gradual increase from the south to the north due to the influence of water mixing and primary productivity. Vertically, subsurface CH4 maxima were ubiquitously observed due to in situ production through multiple pathways including MPn degradation and phytoplankton production. Surface water was oversaturated with respect to the atmospheric CH4 with the air-sea CH4fluxes in the tropical Western Pacific (1.28 ± 1.12 μmol/m2/d) higher than those in the Kuroshio Extension region (2021: 0.49 ± 0.89 μmol/m2/d; 2022: 0.37 ± 0.53 μmol/m2/d). Overall CH4 emission from the Western North Pacific is 0.08 Tg/yr, accounting for 13% of the total emission from the open ocean.

How to cite: Zhang, G., Wang, H., and Zhang, Z.: Methane distribution, production, and emission in the Western North Pacific, EGU General Assembly 2025, Vienna, Austria, 27 Apr–2 May 2025, EGU25-1770, https://doi.org/10.5194/egusphere-egu25-1770, 2025.

EGU25-4242 | ECS | Orals | AS2.5

Air-sea ammonia fluxes in the Southern Ocean: Quantifying sources and sinks from surface waters to penguins.  

Simone Louw, Thomas Bell, Jo Browse, Malcolm Woodward, and Mingxi Yang

NH₃ drives nutrient cycling in the surface ocean and contributes to new particle formation in the marine atmospheric boundary layer. Surface ocean NH₃/Ammonium(NH₄⁺) is a vital component of the recycled nutrient pool, and NH₃ air-sea fluxes influence its redistribution. There are significant uncertainties in global NH₃ flux estimates due to a lack of concurrent air-sea measurements and ambiguity surrounding NH₃ sources.  Southern Ocean, a major driver of global climate, is experiencing rapid warming, altering the exchange of climate-relevant aerosols and precursor gases such as NH₃. Models systematically underpredict cloud droplet number concentrations and aerosol production in this region, a bias that arises from poorly captured aerosol precursor sources and lack of detailed microphysical cloud processes. We present atmospheric and seawater NH₃ measurements, along with NH₃ air-sea flux estimates, across the Southern Ocean during November and December 2024. Our study focuses on 1) identifying key NH₃ sources and sinks in the marine polar environment, and 2) quantifying how NH₃ fluxes vary across distinct emission hotspots. Preliminary observations show penguin colonies and volcanic activity drive distinct, localised NH₃ emission hotspots. The open ocean is generally thought to be a source of NH₃, but our data show that the open waters of the Southern Ocean is a sink of NH₃. By quantifying these fluxes, we reveal the variability across NH₃  source/sink regions and their potential to influence regional ocean-atmosphere biogeochemical processes.  

Our findings are crucial for improving the representation of clouds and aerosols in climate models, offering deeper insight into poorly understood aerosol-cloud interactions in this region. Improving these mechanisms will help reduce persistent Southern Ocean biases in model simulations of surface radiation and sea surface temperature and enhance our capacity to model regional and global climate.

How to cite: Louw, S., Bell, T., Browse, J., Woodward, M., and Yang, M.: Air-sea ammonia fluxes in the Southern Ocean: Quantifying sources and sinks from surface waters to penguins. , EGU General Assembly 2025, Vienna, Austria, 27 Apr–2 May 2025, EGU25-4242, https://doi.org/10.5194/egusphere-egu25-4242, 2025.

Increasing atmospheric CO₂ concentrations drives ocean acidification, potentially leading to substantial impacts on marine ecosystems and altering marine nutrient dynamics. Phosphorus (P) availability is a key limiting factor for primary productivity in the oceans. Atmospheric particles, such as wildfire ash, supply the oceans with substantial amounts of nutrients such as P. The solubility of P from aerosol particles, especially from wildfire ash, plays a critical role in oceanic nutrient cycles and may significantly impact the biological carbon pump, a key mechanism for atmospheric CO₂ regulation.

As ocean acidification continues and wildfires are projected to increase in intensity and severity with climate change, understanding how changes in seawater pH influence P release from wildfire ash is essential. This study aims to investigate the effect of past, present, and future seawater pH levels on P solubility from different wildfire ash under controlled laboratory conditions. Specifically, the study aims to examine how elevated CO₂ levels, leading to lower pH (ocean acidification), impact the availability of P in wildfire ash compared to lower CO₂ levels.

Using artificial seawater and ash samples derived from Mediterranean and agricultural vegetation, this research will analyze P release patterns under a range of CO₂ concentrations, encompassing current levels, future projections, and historical baselines.

Preliminary results demonstrated a significant dependence of P release from wildfire ash on pCO₂ concentrations and its influence on the pH. Elevated CO₂ levels of the projected future and of ancient atmosphere enhanced P solubility in both Mediterranean vegetation and agricultural vegetation treatments while reduced levels of the preindustrial and pre-Holocene periods decreased P solubility. These findings are anticipated to shed light on the role of wildfire ash in marine nutrient dynamics and its broader impact on ocean productivity and the global carbon cycle, especially in regions experiencing increasing wildfire activity.

These initial findings lay the groundwork for continued research, where I will investigate the cultivation of microalgae under controlled laboratory conditions at varying atmospheric CO2 concentrations. The research will focus on understanding how P release from wildfire ash, influenced by different CO2 levels, impacts the growth rate of phytoplankton. The experiments will assess the role of wildfire ash as a potential P source for phytoplankton grown in P-depleted water.

How to cite: Naiman, N., Gross, A., and Antler, G.: The Effect of Ocean Acidification on Phosphorus Solubility from Wildfire Ash and its Role in Enhancing the Biological Carbon Pump, EGU General Assembly 2025, Vienna, Austria, 27 Apr–2 May 2025, EGU25-5059, https://doi.org/10.5194/egusphere-egu25-5059, 2025.

EGU25-5221 | ECS | Posters on site | AS2.5

Evaluation of Arctic Ocean surface carbon fluxes from Atmospheric Inverse Analysis   

Jayashree Ghosh, Parvadha Suntharalingam, and Zhaohui Chen

Atmospheric inverse analyses use optimization methods to calculate surface CO2 fluxes using atmospheric transport models in combination with observed gradients in atmospheric CO2 concentration. In our present study we present an inverse estimate of Arctic Ocean air-sea CO2 fluxes using the GEOSChem–LETKF  system; this system has previously been used to derive estimates of regional North Atlantic CO2 fluxes (Chen et al. 2021). Our analysis reports on estimates of Arctic Ocean fluxes  and assesses patterns of spatial and inter-annual variability.  Our results indicate significant spatial variability of air-sea CO2 fluxes in the different regional seas of the Arctic Ocean. The western Arctic Ocean predominantly act as a sink region for atmospheric CO2.  However,  the eastern Arctic Ocean act more as a source of CO2 . We also present results of sensitivity analyses conducted to assess the impact of alternate ocean prior flux specifications.

How to cite: Ghosh, J., Suntharalingam, P., and Chen, Z.: Evaluation of Arctic Ocean surface carbon fluxes from Atmospheric Inverse Analysis  , EGU General Assembly 2025, Vienna, Austria, 27 Apr–2 May 2025, EGU25-5221, https://doi.org/10.5194/egusphere-egu25-5221, 2025.

The equatorial Pacific serves as the largest oceanic source of CO2. The contrasting ocean environment in the eastern (i.e., upwelling) and western (i.e., warm pool) regions makes it difficult to fully characterize the CO2 dynamics with limited in situ observations.  In this study, we addressed this challenge using monthly surface partial pressure of CO2 (pCO2sw) and air–sea CO2 fluxes (FCO2) data products reconstructed from satellite and reanalysis data at spatial resolution of 1°×1° in the period of 1982–2021. We found that, during the very strong El Niño events (1997/1998, 2015/2016), both pCO2sw and FCO2 showed significant decrease of 41–58 μatm and 0.5–0.8 mol m-2 yr-1 in the eastern equatorial Pacific, yet remained at normal levels in the western equatorial Pacific. In contrast, during the very strong La Niña events (1999/2000, 2007/2008, and 2010/2011), both pCO2sw and FCO2 showed strong increase of 40–48 μatm and 1.0–1.4 mol m-2 yr-1 in the western equatorial Pacific, yet with little change in the eastern equatorial Pacific. In the past 40 years, pCO2sw in the eastern equatorial Pacific was increasing at a higher rate (2.32–2.51 μatm yr-1) than that in the western equatorial Pacific (1.75 μatm yr-1), resulting in an accelerating CO2 outgassing (at rate of 0.03 mol m-2 yr-2) in the eastern equatorial Pacific. We comprehensively analyzed the potential effects of different factors such as sea surface temperature, sea surface wind speed, and ΔpCO2 in driving CO2 fluxes in the equatorial Pacific, and found that ΔpCO2 had the highest correlation (R ≥ 0.80, at p ≤ 0.05), highlighting the importance of accurate estimates of pCO2sw from satellites. 

How to cite: Chen, S.: Accelerating CO2 outgassing in the equatorial Pacific from sat-ellite remote sensing, EGU General Assembly 2025, Vienna, Austria, 27 Apr–2 May 2025, EGU25-5360, https://doi.org/10.5194/egusphere-egu25-5360, 2025.

EGU25-7196 | Posters on site | AS2.5

Laboratory simulation of ocean-atmosphere CO2 exchange 

Brian Durham and Christian Pfrang

At EGU2024 we presented initial laboratory results from bubbling a simulated pre-industrial atmosphere through samples of freshwater and seawater across a range of temperatures, making comparison with literature values for the CO2/water partition equilibrium as determined at a higher partial pressures of the gas as reviewed by Carroll et al 1991.

Two changes have been made. Our 2024 results were based on a temperature range of 0.1’C to 16.5’C, and following valued discussion with Raphael Hebert we have brought that range closer to the global average ocean temperature range since the 1940s hockey-stick, i.e. 15’C to 16.5’C. At the same time, in addressing whether last year’s `paradox’ and `slow-release’ were artefacts of laboratory simulation, we test whether changes in CO2 fraction as measured in the headspace have a reciprocal effect in the liquid phase, measured by a continuous-reading conductivity probe in each flask.

Two recent papers are of relevance within this temperature range. Firstly the Universities of Exeter and Plymouth, UK, report transects in the Atlantic Ocean and note that temperature gradients near the ocean surface will affect the proportion of atmospheric CO2 taken into solution (D Ford et al `Enhanced ocean CO2 uptake due to near-surface temperature gradients’, Nature Geoscience (Sept 2024).  They conclude that `accounting for near-surface temperature gradients would increase estimates of global ocean CO2 uptake.’  In parallel the University of East Anglia, UK, finds ‘that process-based models underestimate the amplitude of the decadal variability in the ocean CO2 sink, but that observation-based products on average overestimate the decadal trend in the 2010s. (N Mayot et al `Constraining the trend in the ocean CO2 sink during 2000–2022’ Nature Communications, September 2024)

We understand from Raphael Hebert (pers. comm.) that the Alfred Wegener Institute, Germany, is also investigating this issue using a different approach, hence our interest in confirming the partition constant at relevant partial pressures, as a fourth contribution.

How to cite: Durham, B. and Pfrang, C.: Laboratory simulation of ocean-atmosphere CO2 exchange, EGU General Assembly 2025, Vienna, Austria, 27 Apr–2 May 2025, EGU25-7196, https://doi.org/10.5194/egusphere-egu25-7196, 2025.

EGU25-7519 | Posters on site | AS2.5

Estimation of Arctic Air-Sea CO2 Fluxes by Inverse Methods: Use of OSSEs to Assess Atmospheric Sampling Strategies  

Parvadha Suntharalingam, Jayashree Ghosh, and Zhaohui Chen

Estimates of atmospheric CO2 uptake by the Arctic Ocean over recent decades from multiple methods indicate accelerating regional carbon uptake (Yasunaka et  al. 2024). This trend is  attributed to such factors as regional climate-change impacts and associated sea-ice loss. Yasunaka et al. (2024) also note a significant range of uncertainty among the various model and data analysis methods that were employed to derive regional Arctic Ocean air-sea fluxes (e.g., from surface ocean pCO2 products, ocean biogeochemical models, and atmospheric inversions). This highlights a need for more robust  flux estimation methods  involving expanded observational networks and improved modelling tools to enable more accurate quantification of regional fluxes and an improved prediction capability to estimate future changes in oceanic CO2 uptake in the rapidly evolving Arctic.

In this analysis we employ the GEOSChem-Local Ensemble Transform Kalman Filter  inverse analysis system (Chen et al. 2021) to develop sets of Observing System Sampling Experiments (OSSEs) that assess alternative atmospheric CO2 sampling strategies and observational network extensions towards improved estimates of Arctic Ocean air-sea CO2 fluxes. We assess the performance of individual sampling strategies using a range of metrics applied to the atmospheric inversions; these include regional CO2 flux error reductions  and model concentration biases at sampling sites.

How to cite: Suntharalingam, P., Ghosh, J., and Chen, Z.: Estimation of Arctic Air-Sea CO2 Fluxes by Inverse Methods: Use of OSSEs to Assess Atmospheric Sampling Strategies , EGU General Assembly 2025, Vienna, Austria, 27 Apr–2 May 2025, EGU25-7519, https://doi.org/10.5194/egusphere-egu25-7519, 2025.

EGU25-8419 | ECS | Posters on site | AS2.5

Investigating Volatile Organic Compound Emissions from Ozonolysis of Phytoplankton Cultures 

Charlotte Stapleton, Rebecca Fenselau, Vaishnavi Padaki, Audrey Lyp, Kimberly Halsey, Lucy Carpenter, and Timothy Bertram

The ocean’s surface is covered by the sea-surface microlayer (SML), a distinct boundary layer that plays a critical role in mediating the air-sea exchange of atmospheric trace gases. The oxidation of unsaturated organic material enriched in the SML by ozone is a significant but poorly quantified abiotic mechanism leading to the emission of volatile organic compounds (VOCs) into the marine boundary layer. The properties of these VOCs make them efficient precursors for secondary organic aerosol formation which can alter the oxidative capacity of the atmosphere. 

In this laboratory study, axenic cultures of the model marine diatom Phaeodactylum tricornutum and its coculture with Yoonia bacteria were selected as biologically and chemically relevant proxies for the SML. Ozone-enriched air was passed over the culture medium in a heterogenous flow reactor, and the emitted gas-phase VOCs were monitored using high resolution proton-transfer-reaction time-of-flight mass spectrometry (PTR-ToF-MS). Experiments were conducted on the cultures in both their exponential and stationary growth phases with nonanal, the C5H8H+ peak, and the C6H10H+ peak being identified as major product ions. Ozonolysis-mediated abiotic VOC emissions were greater from cultures in exponential phase compared to stationary phase. Additionally, emissions from the P. tricornutum axenic monoculture were higher than from the P. tricornutum-Yoonia coculture indicating consumption of precursor compounds by the bacteria. The addition of iodide, a well-known reactant with ozone, to axenic P. tricornutum cultures in the exponential phase was associated with a reduction in the VOC emissions. This research provides a deeper insight into the interactions between iodide and organics during ozone uptake to the SML, and the impact of these competing processes on marine atmospheric chemistry. 

How to cite: Stapleton, C., Fenselau, R., Padaki, V., Lyp, A., Halsey, K., Carpenter, L., and Bertram, T.: Investigating Volatile Organic Compound Emissions from Ozonolysis of Phytoplankton Cultures, EGU General Assembly 2025, Vienna, Austria, 27 Apr–2 May 2025, EGU25-8419, https://doi.org/10.5194/egusphere-egu25-8419, 2025.

EGU25-10303 | ECS | Posters on site | AS2.5

Chemical Drivers of Oceanic Ozone Uptake – Iodide vs Surfactants 

Lucy Brown, David Loades, Charlotte Stapleton, Will Drysdale, Matthew Jones, Rosie Chance, Pascale Lakey, Manabu Shiraiwa, Ming-Xi Yang, Tom Bell, Ian Brooks, Andrew Peters, Rod Johnson, Paul Lethaby, Birgit Quack, and Lucy Carpenter

Due to its position at the air-sea interface, the sea-surface microlayer (SML) modulates the exchange of gases, including the deposition of ozone to the ocean. While ozone deposition to the ocean is a large sink of ozone from the troposphere, the processes involved are not well understood. Previous work has focussed on seawater iodide as a driver of ozone uptake to the ocean, however the SML contains a complex mixture of organic material, which could also impact ozone uptake. The contribution of this organic material to ozone uptake remains particularly unclear.

During this project, ozone uptake to seawater was measured by eddy covariance from coastal towers near Penlee Point (Plymouth, UK) and Tudor Hill (Bermuda), and at sea aboard the RV Atlantic Explorer, operating at and around the Bermuda Atlantic Time-series Study site in the Sargasso Sea. Additionally, the chemical component of ozone uptake to seawater was measured using a flow reactor during a trans-Atlantic cruise. This suite of observations has been combined to investigate the driving forces of oceanic ozone uptake. We present data that demonstrate that iodide was not a strong predictor of ozone uptake, despite its fast chemical reaction with ozone and the ubiquitous presence of iodide in the surface ocean.

Organic compounds in the SML are of interest to this work because some organic compounds have ozone-reactive functional groups. An example of this is carbon-carbon double bonds, present in some oceanic fatty acids. By increasing chemical reactivity, organic material can therefore augment ozone uptake to the ocean. The contribution of chemical reactions between ozone and organic material to ozone uptake was investigated using the kinetic multilayer model of surface and bulk chemistry (KM-SUB). A simplified system of a monolayer of an unsaturated fatty acid (oleic acid) over seawater was modelled and demonstrated that a monolayer of ozone-reactive surfactants on the ocean surface could contribute substantially more to ozone uptake, compared to environmental levels of aqueous iodide.

This work indicates that the commonly applied iodide-based parameterisation for ozone uptake to seawater may not accurately represent the chemical processes involved in ozone deposition to the sea surface. This has implications not only for predicted spatial and temporal variations in the magnitude of ozone deposition, but also for the chemical profile of oxidised gases emitted from the sea surface to the remote marine troposphere.

How to cite: Brown, L., Loades, D., Stapleton, C., Drysdale, W., Jones, M., Chance, R., Lakey, P., Shiraiwa, M., Yang, M.-X., Bell, T., Brooks, I., Peters, A., Johnson, R., Lethaby, P., Quack, B., and Carpenter, L.: Chemical Drivers of Oceanic Ozone Uptake – Iodide vs Surfactants, EGU General Assembly 2025, Vienna, Austria, 27 Apr–2 May 2025, EGU25-10303, https://doi.org/10.5194/egusphere-egu25-10303, 2025.

EGU25-10513 | ECS | Posters on site | AS2.5

Evaluating Methane Emissions and Sea-Air Fluxes in the Southern Ocean 

Evelyn Workman, Anna Jones, Rebecca Fisher, James France, Katrin Linse, Ming-Xi Yang, Thomas Bell, Bruno Delille, Freya Squires, and Yuanxu Dong

The ocean is generally thought to be a small source of atmospheric methane. However, the contribution of the Southern Ocean remains poorly quantified due to its remoteness and lack of measurements. In this study we investigate sea-air methane fluxes in the Southern Ocean measured by two different methods, bulk flux and eddy-covariance, to better understand the region's role in global methane emissions. We focus on both on-shelf and off-shelf areas, including regions where methane seeps from the seabed into the water column, using several years of ship-based measurements.

Our results show that coastal and on-shelf regions of the Southern Ocean, including areas with known seabed seeps, act as small sources of methane to the atmosphere. This is possibly driven by methane produced at the seabed reaching the surface or inputs from terrestrial sources, such as subglacial discharge. We also find possible indications of increased methane release from coastal areas compared to previous studies. Given the potential for increased methane release from these regions in the future under a warming climate, our findings emphasise the importance of ongoing monitoring in the Southern Ocean to quantify its contribution to the global methane cycle and track any changes over time.

Open ocean sea-air methane flux measurements in the Scotia and Weddell Seas during consecutive Antarctic summers revealed a source and a sink of methane depending on the method used (bulk flux or eddy-covariance). As these measurements techniques were not deployed simultaneously, a dedicated measurement campaign is necessary to collect parallel data and better understand whether the observed differences reflect measurement technique variability or potential changes in the Southern Ocean system.

How to cite: Workman, E., Jones, A., Fisher, R., France, J., Linse, K., Yang, M.-X., Bell, T., Delille, B., Squires, F., and Dong, Y.: Evaluating Methane Emissions and Sea-Air Fluxes in the Southern Ocean, EGU General Assembly 2025, Vienna, Austria, 27 Apr–2 May 2025, EGU25-10513, https://doi.org/10.5194/egusphere-egu25-10513, 2025.

EGU25-11404 | ECS | Posters on site | AS2.5

North Atlantic fjords are minor sources of nitrous oxide to the atmosphere 

Tobia Politi, Yvonne Y. Y. Yau, Isaac Santos, Alex Cabral, Henry L. S. Cheung, Claudia Majtényi-Hill, Adam Ulfsbo, Anna Wåhlin, and Stefano Bonaglia

Nitrous oxide (N2O) distribution and dynamics in high latitude fjords are relatively unknown. Surface water N2O concentrations were measured in six fjords located in Sweden, Iceland, and Greenland, which represent highly diverse environmental conditions in terms of oxygen, eutrophication and climate. This study provides one of the few high spatial resolution observations of N2O sea-air fluxes currently available in fjords. The two Icelandic fjords showed highest emissions (97.6±10.5 μg N2O m⁻² day⁻¹), likely driven by aquaculture-induced nutrient enrichment and not fully oxygenated subsurface waters. The three Swedish fjords, characterized by inputs from nutrient-rich rivers and by poor water circulation, exhibited relatively high N2O emissions averaging 19.9±19.3 μg N2O m⁻² day⁻¹, with subsurface water anoxia enhancing emissions in By Fjord (64.4±24.0 µg N2O m⁻² day⁻¹). In contrast, the Greenland fjord displayed net N2O uptake (–8.3±7.8 μg N2O m⁻² day⁻¹), likely due to glacier meltwater dilution. Each fjord appeared to be influenced by distinct N2O drivers, including temperature, salinity, chlorophyll, and pH, but no single, unifying driver was found across all fjords. As a preliminary global upscaling effort, we integrated our measured fluxes from six fjords with literature data from thirteen additional fjords. We estimate that global fjords emit 7.9±1.7 Gg N2O yr⁻¹, accounting for 2–13% of global coastal ecosystem emissions and do not significantly offset (3.5%) CO₂ sequestration in fjords. These findings underscore the role of fjords in greenhouse gas dynamics and highlight the need for further spatial and seasonal studies to refine global N2O emissions from coastal ecosystems.

How to cite: Politi, T., Yau, Y. Y. Y., Santos, I., Cabral, A., Cheung, H. L. S., Majtényi-Hill, C., Ulfsbo, A., Wåhlin, A., and Bonaglia, S.: North Atlantic fjords are minor sources of nitrous oxide to the atmosphere, EGU General Assembly 2025, Vienna, Austria, 27 Apr–2 May 2025, EGU25-11404, https://doi.org/10.5194/egusphere-egu25-11404, 2025.

EGU25-12341 | ECS | Posters on site | AS2.5

Greenhouse Gas Dynamics in Coastal Ecosystems: Insights from the Baltic Sea and Auckland, New Zealand 

Julika Zinke, Matthew Salter, Martijn Hermans, Alexis Armando Fonseca Poza, Joakim Hansen, Linda Kumblad, Emil Rydin, Sofia A. Wikström, Alf Norkko, Nicolas-Xavier Geilfus, Anna Villnäs, Simon Thrush, Marc Geibel, and Christoph Humborg

Coastal ecosystems play a significant role in the cycling of greenhouse gases (GHGs), yet they remain understudied compared to open oceans and terrestrial systems. Here, we present measurements of carbon dioxide (CO₂), methane (CH₄), and nitrous oxide (N₂O) concentrations from shallow coastal environments along the Swedish Baltic Sea coast and Auckland, New Zealand, highlighting the variability and drivers of GHG dynamics across diverse habitats.

In the Baltic Sea, we conducted measurements in April and September 2024, utilizing cavity ring-down spectroscopy coupled with a water equilibration system. Our focus was on shallow coastal bays in the wider Stockholm archipelago, including eutrophic and habitat-altered bays. These environments exhibited exceptionally high CH₄ concentrations in the surface water reaching up to 580 nmol L-1, suggesting the potential for significant CH₄ emissions. Notably, CH₄ concentrations below 200 nmol L-1 showed a negative correlation with N₂O, while CH₄ levels above 200 nmol L-1 revealed a distinct shift to a positive correlation with N₂O. We hypothesize that this transition reflects a change in oxygen availability, where hypoxic conditions (0.2< O2 < 2 mL L-1) favor CH₄ production and reoxygenation of euxinic sediments contributes to an additional late-summer N₂O peak. Furthermore, GHG concentrations in the surface seawater were associated with environmental parameters such as water retention time, vegetation coverage, total organic carbon content, turbidity, chlorophyll-a concentration, pH, and total phosphorus levels.

Expanding our investigation to coastal systems in the suburban regions of Auckland, New Zealand, in January 2025 we conducted a spatial survey across a range of coastal habitats, including tidal flats, mangroves and river estuaries. By linking the findings from the Baltic Sea with emerging insights from New Zealand’s coastal systems, we aim to better understand the influence of habitat type, redox conditions, and nutrient dynamics on GHG emissions in coastal zones globally.

Our comparative study underscores the need for integrated approaches to better understand GHG emissions in coastal zones, which are often subject to compounded anthropogenic pressures, such as excessive nutrient inputs and habitat alteration. These findings contribute to the broader understanding of coastal zones as dynamic interfaces in the global carbon and nitrogen cycles and the development of evidence-based policies.

How to cite: Zinke, J., Salter, M., Hermans, M., Fonseca Poza, A. A., Hansen, J., Kumblad, L., Rydin, E., Wikström, S. A., Norkko, A., Geilfus, N.-X., Villnäs, A., Thrush, S., Geibel, M., and Humborg, C.: Greenhouse Gas Dynamics in Coastal Ecosystems: Insights from the Baltic Sea and Auckland, New Zealand, EGU General Assembly 2025, Vienna, Austria, 27 Apr–2 May 2025, EGU25-12341, https://doi.org/10.5194/egusphere-egu25-12341, 2025.

EGU25-12512 | Posters on site | AS2.5

Nitrous oxide from three temperate estuaries discharging in the North Sea: No estuary is like another  

Kirstin Dähnke, Gesa Schulz, Louise Rewrie, Vlad Macovei, Yoana Voynova, Andreas Neumann, and Tina Sanders

Estuaries are potential sources for the important greenhouse gas nitrous oxide (N2O). Estuaries are among the most complex ecosystems in the world with biogeochemical processes occurring on a range of spatial and temporal scales, depending on geomorphology, tides, and discharge patterns. Due to the high spatiotemporal variability and limited data availability, N2O emissions from estuaries are associated with significant uncertainty, presenting a big challenge for the global N2O emission estimates and budgeting of coastal regions.

This study presents N2O measurements from three temperate German estuaries discharging into the North Sea: Ems, Weser and Elbe, which are all heavily affected by anthropogenic impacts. During a cruise in September 2024, N2O dry mole fractions were measured continuously using an analyzer based on off-axis integrated cavity output (Picarro G2508) absorption spectroscopy coupled with an equilibrator system. For calibration and quality control, distinct water samples were taken in 30-min intervals and preserved for later GC analysis. Based on these measurements, we calculated N2O concentrations and fluxes.

Preliminary results showed N2O oversaturation with distinct peaks observed along the salinity gradient of all three estuaries. The N2O concentration in the Weser estuary was nearly double the concentration recorded in the Ems and Elbe estuaries. The high variability in N2O concentration between the three estuaries indicated potential differences in dominating biological and biogeochemical processes that modulate N2O production in each estuary. We suspect that turbidity, organic matter quality and degradation, as well as nutrient availability are responsible for the observed differences between the estuaries, which all are heavily impacted by anthropogenic river alterations. Therefore, we aim to elucidate the impact of human alterations on N2O production and emissions in these temperate estuaries. Overall, our findings highlight the variability of N2O emissions depending on stream morphology and chemistry, emphasizing the urgent need for comprehensive measurement programs to ensure accurate emission estimates.

How to cite: Dähnke, K., Schulz, G., Rewrie, L., Macovei, V., Voynova, Y., Neumann, A., and Sanders, T.: Nitrous oxide from three temperate estuaries discharging in the North Sea: No estuary is like another , EGU General Assembly 2025, Vienna, Austria, 27 Apr–2 May 2025, EGU25-12512, https://doi.org/10.5194/egusphere-egu25-12512, 2025.

EGU25-12549 | ECS | Orals | AS2.5

Physicochemical properties of nascent versus aged sea spray aerosol – A study from the eastern North Atlantic Ocean  

Sneha Aggarwal, Olga Garmash, Julika Zinke, Delaney Kilgour, Jian Wang, Timothy Bertram, Joel Thornton, Matt Salter, Paul Zieger, and Claudia Mohr

Sea spray aerosol (SSA), produced by bubble bursting at the ocean's surface, plays a critical role in climate regulation and atmospheric chemistry. It also provides a unique microenvironment for gas-to-particle partitioning and aqueous-phase reactions. Understanding these processes requires a detailed examination of the physicochemical properties and the transformations of SSA during atmospheric aging. 
Hence, we designed a comprehensive experimental setup comprising a sea spray simulation tank for generating SSA, a chemical ionization mass spectrometer (CIMS) for analyzing molecular-level composition, an oxidation flow reactor (PAM) for simulating atmospheric oxidation, and a differential mobility particle counter (DMPS) for determining particle size distribution. We deployed this setup in May 2022 during the AGENA campaign on Graciosa Island in the Azores, Portugal, a remote marine site. We collected surface ocean water samples from the Atlantic, and generated SSA using a plunging jet. We used DMPS and CIMS to analyze physicochemical properties of SSA present in the tank headspace, and also collected filter samples for offline CIMS analysis. 
Our results revealed significant particle formation in the PAM chamber at an aging period equivalent to 3–3.5 days in the atmosphere. Notably, the increase was primarily restricted to particles below 100 nm, suggesting that new particle formation dominated over condensation in the PAM environment, likely due to high oxidant concentrations. This observation also indicates the presence of numerous volatile organic compounds (VOCs) in the nascent SSA, which may have condensed onto pre-existing particles in natural settings. Further analysis of the VOCs using CIMS showed that nascent SSA contained compounds with longer carbon chains (1–16 carbons) and higher oxidation states, indicating low volatility. In contrast, gases exiting the PAM chamber exhibited shorter carbon chains (1–10 carbons) and lower oxidation levels, suggesting condensation of oxidation products onto newly formed particles within the reactor. Additionally, we identified oxidation products of dimethyl sulfide (DMS), such as dimethyl sulfoxide (DMSO) and methanesulfonic acid (MSA), in both nascent and aged samples. Intriguingly, nascent SSA also exhibited strong signals for fluorinated compounds, including hydrofluoric acid, likely formed from protonation of fluoride ions (F⁻) and other fluoride-containing salts like MgF⁺, CaF⁺, and NaF⁺ found in sea salt. These findings provide valuable insights into the molecular composition and dynamic behaviour of SSA, with implications for understanding its role in atmospheric processes and climate.

How to cite: Aggarwal, S., Garmash, O., Zinke, J., Kilgour, D., Wang, J., Bertram, T., Thornton, J., Salter, M., Zieger, P., and Mohr, C.: Physicochemical properties of nascent versus aged sea spray aerosol – A study from the eastern North Atlantic Ocean , EGU General Assembly 2025, Vienna, Austria, 27 Apr–2 May 2025, EGU25-12549, https://doi.org/10.5194/egusphere-egu25-12549, 2025.

EGU25-12999 | Posters on site | AS2.5

A 25-year record of atmospheric deposition of iron speciation in the East Mediterranean: The impact of pH 

Maria Kanakidou, Maria Tsagkaraki, and Nikolaos Mihalopoulos

A 25-year record of wet deposition has been collected and analysed for Fe(II), soluble iron (DSRFe) and total Iron (Fe) at Finokalia station on Crete island in the East Mediterranean from 1997 to 2022. A significant temporal increase in rain pH values is observed, mainly due to the reduction in sulfur concentrations. Regardless of the pH value of the rain, the Fe(II)/DSRFe ratio appeared to remain always above 50%, indicating that a significant amount of Fe(II), hence bioavailable iron, enters the sea surface via rain. However, Fe(II)/DSRFe ratio gradually decreases from 0.70 to 0.52 with increasing pH until pH 7.0, while from pH 7.0 and above it increases again, reaching an average value of about 0.67 at very basic pH levels. This is related to the general decrease in Fe solubility with increasing pH and the respective association of the forms in which Fe(II) and Fe(III) exist. It is therefore evident that the observed increase in pH in wet deposition affects the amount of dissolved iron deposited in the oceans, particularly Fe(II), that is directly bioavailable to the marine ecosystem, with consequent impacts on marine productivity.

How to cite: Kanakidou, M., Tsagkaraki, M., and Mihalopoulos, N.: A 25-year record of atmospheric deposition of iron speciation in the East Mediterranean: The impact of pH, EGU General Assembly 2025, Vienna, Austria, 27 Apr–2 May 2025, EGU25-12999, https://doi.org/10.5194/egusphere-egu25-12999, 2025.

EGU25-13484 | Orals | AS2.5

Evidence of seasonal carbon dioxide uptake by the Southern Ocean from a 10-year record of atmospheric carbon dioxide, observed from coastal Antarctica.  

Freya Squires, Anna Jones, Tony Phillips, Zsofia Juranyi, Rolf Weller, and James France

The Southern Ocean plays a critical role in modulating excess atmospheric carbon dioxide, accounting for roughly 40% of global ocean anthropogenic CO2 uptake since industrialisation. Given its significance in the global carbon cycle, understanding the Southern Ocean carbon sink is important but studies show high uncertainties in the magnitude and evolution of this carbon sink. The Southern Ocean is a remote and challenging region to measure, and the resulting sparsity of observational data is the main cause of uncertainty in air-sea carbon flux in the region. Long term, high-temporal-frequency data sets especially are rare for the Southern Ocean, but these can give valuable insights into the carbon cycle processes occurring in the region.

This work presents ten years of high-temporal-frequency in situ atmospheric carbon dioxide mixing ratios measured from two coastal Antarctic research stations; Halley, operated by the British Antarctic Survey, and the German research station, Neumayer. The coastal location of these stations means they are ideally placed to explore air-sea CO2 exchange over the Southern Ocean. 

Both the Halley and Neumayer records show short-term fluctuations in CO2 mixing ratios during austral summer, with over ~0.5 ppm decreases in CO2 sometimes observed over the course of a day - about one fifth of the average annual growth rate (~2.4 ppm per year-1 for this 10-year record). Analysis of air mass trajectories reveal that these fluctuations in CO2 occur when the sampled air has spent considerable time in contact with the Southern Ocean, suggesting CO2 uptake has occurred, leading to the reduced CO2 mixing ratios observed.

We present an in-depth analysis of the drivers of the short-term variability observed during austral summer, including the role of mixing height, sea-ice coverage, wind speed and biology. Observational data represent an important tool with which to tease out key factors determining Southern Ocean CO2 uptake, and thus in assessing how uptake may evolve in the future.

How to cite: Squires, F., Jones, A., Phillips, T., Juranyi, Z., Weller, R., and France, J.: Evidence of seasonal carbon dioxide uptake by the Southern Ocean from a 10-year record of atmospheric carbon dioxide, observed from coastal Antarctica. , EGU General Assembly 2025, Vienna, Austria, 27 Apr–2 May 2025, EGU25-13484, https://doi.org/10.5194/egusphere-egu25-13484, 2025.

EGU25-13680 | ECS | Posters on site | AS2.5

Understanding the drivers of the air-sea CO2 flux seasonal variability in the upwelling systems off Peru and Baja California 

Angela Bahamondes Dominguez, Boris Dewitte, Ivonne Montes, Veronique Garçon, Victor Aguilera, Linda Barranco, and Matthew Hammond

The open ocean plays a critical role in mitigating climate change by absorbing approximately 25% of annual anthropogenic carbon dioxide (CO₂). In contrast, Eastern Boundary Upwelling Systems (EBUSs) are net sources of CO2, primarily due to the high concentrations of dissolved inorganic carbon (DIC) from upwelled waters. However, the carbon dynamics in EBUSs exhibit significant variability, both temporally and spatially, with differences between systems. This study focuses on two Pacific Ocean EBUSs with distinct physical characteristics: the upwelling systems off Peru and off Baja California, where the relative contribution of  Ekman transport and pumping, and geostrophic compensation to upwelling differ. Based on seasonal simulations of a regional biogeochemical model configured for the two regions, we characterise the seasonal variability of CO₂ fugacity (FCO₂) in these systems, and identify the processes driving this variability through a Taylor expansion of the flux formulation. Our results show that FCO₂ is highly dynamic and exhibits notable spatial variability. The processes influencing FCO₂ seasonality differ between subregions. Off Peru, the primary drivers of FCO₂ seasonal variability are: the oceanic partial pressure of CO₂ (pCO₂), primarily influenced by changes in DIC, and alongshore winds (Ekman transport). Similarly, off Baja California, changes in pCO₂ are the dominant contributor to the FCO₂ seasonality, with DIC and sea surface temperature (SST) also playing significant roles. This comparative analysis deepens our understanding of how large-scale climate processes shape FCO₂ dynamics, offering valuable insights for interpreting future changes in CO2 fluxes within EBUSs.

How to cite: Bahamondes Dominguez, A., Dewitte, B., Montes, I., Garçon, V., Aguilera, V., Barranco, L., and Hammond, M.: Understanding the drivers of the air-sea CO2 flux seasonal variability in the upwelling systems off Peru and Baja California, EGU General Assembly 2025, Vienna, Austria, 27 Apr–2 May 2025, EGU25-13680, https://doi.org/10.5194/egusphere-egu25-13680, 2025.

EGU25-15135 | ECS | Orals | AS2.5

Global Oceanic Nitrogen Deposition under Future Emission Pathways and Responses to Nitrogen Emission Reductions 

Jialin Deng, Yixin Guo, lin Zhang, Ni Lu, Xingpei Ye, Yuanhong Zhao, Jiayu Xu, and Xiaolin Wang

Oceanic nitrogen deposition influences marine ecosystem eutrophication and the global carbon cycle. Its future global spatiotemporal features still remain unclear driven by changing anthropogenic emissions. Furthermore, existing studies reported air quality and climate benefits of ambitious nitrogen emission reductions, while consequent impacts for global marine ecosystems through atmospheric nitrogen deposition are unexplored. Here we utilize the global atmospheric chemistry transport model GEOS-Chem to evaluate changes in global oceanic nitrogen deposition between 2015 and 2050 under three CMIP6 SSP-RCP emission scenarios and its responses to multiple levels of NH3 and NOx emission reductions. We find that global oceanic nitrogen deposition is projected to change by −24%-+6% between 2015-2050, with a substantially increasing share contributed by NHx-N across all scenarios. Coastal regions respond much more drastically to nitrogen emission reductions than open ocean areas. Ocean carbon sink related to nitrogen-contributed marine primary productivity is projected to decrease from 290 Tg C in 2015 to 222 Tg C (-23%) in SSP1-RCP2.6 scenario in 2050, posing challenges to climate mitigation and affecting global carbon budget. Our findings highlight nitrogen management and the overlooked climate mitigation impacts on marine ecosystems through atmospheric nitrogen deposition and call for increasing attention for holistic assessments of nitrogen management impacts on air, terrestrial and ocean systems.

How to cite: Deng, J., Guo, Y., Zhang, L., Lu, N., Ye, X., Zhao, Y., Xu, J., and Wang, X.: Global Oceanic Nitrogen Deposition under Future Emission Pathways and Responses to Nitrogen Emission Reductions, EGU General Assembly 2025, Vienna, Austria, 27 Apr–2 May 2025, EGU25-15135, https://doi.org/10.5194/egusphere-egu25-15135, 2025.

EGU25-15375 | ECS | Orals | AS2.5

Characterizing marine atmospheric VOC diversity and fluxes using PTR-TOF-MS measurements in the Baltic Sea 

Mehrshad Foroughan, Thomas Holst, Lauri Laakso, Heidi Hellén, Jukka Seppälä, Kaisa Kraft, Ken Stenbäck, Mika Aurela, and Riikka Rinnan

We present continuous measurements of volatile organic compounds (VOCs) and their fluxes in the marine atmospheric boundary layer using proton‐transfer‐reaction time‐of‐flight mass spectrometry (PTR-TOF-MS) coupled with a sonic anemometer for direct eddy covariance measurements at the Utö Atmospheric and Marine Research Station in the Baltic Sea. The measurements, conducted from July to September 2024, identified over 200 distinct masses corresponding to a diverse array of volatile compounds, representing a comprehensive characterization of marine VOC composition. Our experimental setup combines VOC mixing ratio and flux measurements with concurrent monitoring of physical and biogeochemical parameters, providing a unique dataset for understanding air-sea gas exchange processes. Preliminary principal component analysis reveals strong correlations between VOC mixing ratio variability and key parameters including water-side pCO2, dissolved oxygen concentration, and air temperature, suggesting complex biogeochemical controls on VOC emissions. The high temporal resolution and sensitivity of the PTR-TOF-MS, combined with direct flux measurements, enables detailed investigation of both abundant and trace VOC species, their diurnal patterns, and their response to varying environmental conditions. This comprehensive dataset will provide valuable insights into the complexity of VOC emissions in marine environments and their coupling with biological and physical processes in the Baltic Sea region.

How to cite: Foroughan, M., Holst, T., Laakso, L., Hellén, H., Seppälä, J., Kraft, K., Stenbäck, K., Aurela, M., and Rinnan, R.: Characterizing marine atmospheric VOC diversity and fluxes using PTR-TOF-MS measurements in the Baltic Sea, EGU General Assembly 2025, Vienna, Austria, 27 Apr–2 May 2025, EGU25-15375, https://doi.org/10.5194/egusphere-egu25-15375, 2025.

EGU25-15858 | ECS | Orals | AS2.5

Compensatory Mechanisms Reduce ENSO-driven Nitrous Oxide Emission Variability in the Eastern Tropical Pacific 

Jana Härri, Daniel McCoy, Meike Vogt, Daniele Bianchi, and Nicolas Gruber

Nitrous oxide (N2O) is a potent greenhouse gas, with the Eastern Tropical Pacific (ETP) being a hotspot of N2O emissions due to high N2O production in the oxygen minimum zones (OMZs). However, N2O emissions in this region remain poorly constrained due to (i) temporal variability, which is hypothesized to be largely driven by the El Niño-Southern Oscillation (ENSO), and (ii) limited process understanding. To address these shortcomings and improve the quantification of N2O emissions and ENSO-driven variability in the ETP, we run a regional ocean model on a telescopic grid (~4km), spanning the entire Pacific Ocean, from 1979 to 2019. The model includes a biogeochemical model and a novel nitrogen module (NitrOMZ), which explicitly resolves the N2O production via incomplete denitrification and ammonium oxidation and accounts for the different oxygen inhibition thresholds of these biological N2O production pathways. We find that 1 Tg N of N2O is emitted annually in the ETP, and that N2O emissions deviate up to ±0.18 Tg N y-1 from the mean during ENSO events across the entire ETP, with La Niña increasing N2O emissions and El Niño decreasing them. Most of the ENSO-driven N2O emission anomalies can be attributed to variability in incomplete denitrification in the oxyclines of the oxygen minimum zones. Compensatory effects among gross N2O production, consumption, and transport reduce both the total N2O emissions and their interannual variability by an order of magnitude. Our results alleviate previously raised concerns that La Niña events may substantially amplify N2O emissions. Such compensatory mechanisms might also reduce N2O emissions in other OMZs and mitigate the impact of climate change on N2O emissions, provided that compensatory mechanisms remain effective in the future.

How to cite: Härri, J., McCoy, D., Vogt, M., Bianchi, D., and Gruber, N.: Compensatory Mechanisms Reduce ENSO-driven Nitrous Oxide Emission Variability in the Eastern Tropical Pacific, EGU General Assembly 2025, Vienna, Austria, 27 Apr–2 May 2025, EGU25-15858, https://doi.org/10.5194/egusphere-egu25-15858, 2025.

EGU25-17040 | Posters on site | AS2.5

Advancing predictions of Dimethylsulfide emissions and biogenic sulfur aerosol in the Mediterranean region via machine learning 

Matteo Rinaldi, Stefano Decesari, Marco Paglione, Silvia Becagli, and Karam Mansour

Dimethylsulfide (DMS) is the main natural source of atmospheric sulfur and plays a critical role in marine aerosol formation (Mansour et al., 2020b; Mansour et al., 2020a; O'Dowd et al., 2004). It influences cloud radiative forcing, with feedback on regional and global climate (Charlson et al., 1987; Mansour et al., 2022). Despite its importance, the accurate representation of biogenic sulfur emissions in climate models remains a challenge (Mansour et al., 2023; Mansour et al., 2024a). We employed machine learning (ML) based approaches to characterize seawater DMS concentrations, sea-to-air DMS emission flux (FDMS), as well as the atmospheric concentrations of marine biogenic methanesulfonic acid (MSA) and non-sea-salt sulfate (nss-SO42–). This study focuses on the Mediterranean Sea, a warm, oligotrophic marine basin and a climate change hotspot with rapidly increasing temperatures.

In our methodology, a set of ML models (Mansour et al., 2024b) is trained and evaluated using nested cross-validation, forced by high-resolution satellite data (chlorophyll-a, sea surface temperature, photosynthetically available radiation) and Mediterranean physical reanalysis (mixed layer depth and seawater salinity) datasets, combined with in situ DMS measurements. The optimized model generates daily gridded fields of DMS and FDMS at mesoscale resolution (0.083° × 0.083°, ~9 km) spanning 23 years (1998–2020). These high-resolution FDMS estimates align with observational data of MSA and nss-SO42–, secondary aerosol products from DMS oxidation, collected at the Lampedusa monitoring site in the central Mediterranean (Becagli et al., 2013). Compared to existing coarse-resolution global DMS datasets, the reconstructed FDMS fields capture seasonal patterns of biogenic sulfur with much greater accuracy across the Mediterranean Sea.

Furthermore, the FDMS outputs are integrated with high-resolution atmospheric datasets from the Copernicus European Regional Reanalysis (CERRA) to predict atmospheric concentrations of MSA and nss-SO42–. The ML models produce daily time-series predictions over the same 23-year period, achieving finer temporal and spatial coverage than observational datasets alone.

This analysis demonstrates the potential of ML techniques to enhance the estimation of seawater DMS fluxes and associated sulfur aerosol concentrations, achieving outstanding predictive performance. The spatiotemporal dynamics of these variables over the 23 years are analysed to elucidate mesoscale oceanographic variability and its influence on sulfur cycling. Ongoing analyses of long-term trends and interannual variability aim to identify the main drivers of these patterns, with results to be presented and discussed in detail.

Funding:

This work was funded by the European Commission’s EU Horizon 2020 Framework program, project FORCeS (grant no. 821205), and the European Union’s Horizon, project CleanCloud (Grant No. 101137639).

References:

Becagli, et al. (2013), Atmospheric Environment, 79, 681-688, 10.1016/j.atmosenv.2013.07.032.

Charlson, et al. (1987), Nature, 326, 655-661, 10.1038/326655a0.

Mansour, et al. (2023), Science of The Total Environment, 871, 10.1016/j.scitotenv.2023.162123.

Mansour, et al. (2024a), npj Climate and Atmospheric Science, 7, 10.1038/s41612-024-00830-y.

Mansour, et al. (2022), Journal of Geophysical Research-Atmospheres, 127, 10.1029/2021jd036355.

Mansour, et al. (2024b), Earth System Science Data, 16, 2717–2740, 10.5194/essd-16-2717-2024.

Mansour, et al. (2020a), Atmospheric Research, 237, 10.1016/j.atmosres.2019.104837.

Mansour, et al. (2020b), Journal of Geophysical Research-Atmospheres, 125, 10.1029/2019jd032246.

O'Dowd, et al. (2004), Nature, 431, 676-680, 10.1038/nature02959.

How to cite: Rinaldi, M., Decesari, S., Paglione, M., Becagli, S., and Mansour, K.: Advancing predictions of Dimethylsulfide emissions and biogenic sulfur aerosol in the Mediterranean region via machine learning, EGU General Assembly 2025, Vienna, Austria, 27 Apr–2 May 2025, EGU25-17040, https://doi.org/10.5194/egusphere-egu25-17040, 2025.

EGU25-17784 | Orals | AS2.5

Marine emissions of methanethiol increase aerosol cooling in the Southern Ocean 

Julián Villamayor, Charel Wohl, Martí Galí, Anoop S. Mahajan, Rafael P. Fernández, Carlos A. Cuevas, Adriana Bossolasco, Qinyi Li, Anthony J. Kettle, Tara Williams, Roland Sarda-Esteve, Valérie Gros, Rafel Simó, and Alfonso Saiz-Lopez

Ocean-emitted dimethyl sulfide (DMS) is a major source of climate-cooling aerosols. However, most of the marine biogenic sulfur cycling is not routed to DMS but to methanethiol (MeSH), another volatile whose reactivity has hitherto hampered measurements. Therefore, the global emissions and climate impact of MeSH remain unexplored. We compiled a database of seawater MeSH concentrations, identified their statistical predictors, and produced monthly fields of global marine MeSH emissions adding to DMS emissions. Implemented into a global chemistry-climate model, MeSH emissions increase the sulfate aerosol burden by 30 to 70% over the Southern Ocean and enhance the aerosol cooling effect while depleting atmospheric oxidants and increasing DMS lifetime and transport. Accounting for MeSH emissions reduces the radiative bias of current climate models in this climatically relevant region.

How to cite: Villamayor, J., Wohl, C., Galí, M., Mahajan, A. S., Fernández, R. P., Cuevas, C. A., Bossolasco, A., Li, Q., Kettle, A. J., Williams, T., Sarda-Esteve, R., Gros, V., Simó, R., and Saiz-Lopez, A.: Marine emissions of methanethiol increase aerosol cooling in the Southern Ocean, EGU General Assembly 2025, Vienna, Austria, 27 Apr–2 May 2025, EGU25-17784, https://doi.org/10.5194/egusphere-egu25-17784, 2025.

EGU25-17950 | Posters on site | AS2.5

Some Recent Contributions from the Heidelberg Aeolotron to Understanding Air-Sea Gas Exchange 

Bernd Jähne, Kerstin Krall, Dennis Hofmann, and Yuanxu Dong

The lack of knowledge about the parameters controlling the transfer velocity of the exchange of gases and volatile species across the air-sea interface besides the wind speed – such as the sea state (wave age), bubbles, and surfactants - hinders progress of a better estimate of fluxes for all relevant chemical species.

In 2021, a laboratory program was started at the large air-sea interaction facility, the Heidelberg Aeolotron. With four innovative key elements, most disadvantages of previous wind-wave tunnel experiments could be overcome:

  • Because of the infinite fetch of the annular facility, wind waves come into equilibrium with the wind that is more similar to the ocean compared to the linear facility.

  • The clean environment (walls coated with Teflon foil) facilitates experiments with surface films.

  • Two imaging techniques are used to measure transfer velocities locally and instantaneously. In this way, it is also possible to get direct insight into the mechanisms.

  • The whole fetch range and non-stationary conditions could be investigated.

An extensive measuring program finished in September 2024. In this talk, the focus is on some of the first results which are regarded to be the most important contributions concerning the conditions in the field:

  • The dependence of the transfer velocity on the fetch (wave age) seems to be only significant at lower wind speeds with an overshoot at young wind fields by more than a factor of two. This is an important contribution to the large variability of the gas transfer velocity at low wind speeds.

  • Once surface active materials, either soluble or insoluble suppress waves, gas transfer velocities are reduced to the same velocities and are governed by the same mechanisms. The measurements included insoluble films of hexadecanol and olive oil and the soluble surfactants TritonX-100 and Tergitol 15-S-12. At wind speeds larger than 8 m/s, wind waves cannot be suppressed by any films.

  • From a statistical analysis of the spatial-temporal patterns gained by both imaging techniques, it is possible to infer the Schmidt number exponent. This means that no longer multi-tracer experiments are required using tracers with a large difference in the diffusion coefficients.

  • At high wind speeds, breaking of the dominant waves does not play a dominant role. It is a rather fast surface renewal taking place all over the surface at scales of a few centimeters, which is associated with the smaller-scale wind wave field riding on the dominant wave.

  • Simplified forms of the two imaging techniques used in the Aeolotron seem to be suitable also for field measurements. A first experiment is planned for the BASS Baltic Sea cruise in June 2025.

  • It was possible to compare gas transfer measured with flux chambers in the Aeolotron with those gained at the free water surface using imaging thermography. The results clearly show that no useful measurements can be performed by flux chambers as soon as wind-induced effects are dominant, which is already the case at wind speeds as low as 2 m/s.

How to cite: Jähne, B., Krall, K., Hofmann, D., and Dong, Y.: Some Recent Contributions from the Heidelberg Aeolotron to Understanding Air-Sea Gas Exchange, EGU General Assembly 2025, Vienna, Austria, 27 Apr–2 May 2025, EGU25-17950, https://doi.org/10.5194/egusphere-egu25-17950, 2025.

BG5 – Palaeobiogeosciences

The end-Permian event (EPE; c. 252 Ma) resulted in the loss of keystone plant species from humid tropical and high-latitude ecosystems and the extinction of several major insect groups. The subsequent Early to Middle Triassic evinced diminished terrestrial productivity, punctuated by a series of second-order biotic crises that hindered recovery. End-Permian ecosystem collapse resulted in the extirpation of productive wetland ecosystems, the primary carbon sinks on land, represented by the cessation of significant coal formation until the Middle Triassic. The gymnosperm seed fern Dicroidium (Order: Umkomasiales) emerged as the dominant floral component of most known terrestrial ecosystems of the Early Triassic across southern Gondwana and, by the Middle Triassic, was the principal coal-forming plant. Understanding when and how this ecologically important taxon rose to dominance will provide a gauge of ecosystem recovery and carbon sink stabilisation in Gondwana following the worst mass extinction event in Earth’s history.

While there have been many large-scale investigations into Middle Triassic plants and biodiversity, the Early Triassic interval of ecological recovery immediately following the EPE is poorly studied. In addition to examination of the fossil plants themselves, trace fossils of plant–arthropod interactions (PAIs) provide an independent window into assessing terrestrial ecosystem states through geological time. In this context, PAI records can be used for evaluating changes in herbivorous arthropod feeding guilds in the wake of global biotic crises. Here, we investigated three well-preserved early records of Dicroidium from the well-age constrained Lower Triassic strata of the Sydney Basin, Australia (the Skillion, Turimetta Head and Mona Vale). In this study, we: 1, systematically described the Dicroidium species from these localities; 2, interpreted their palaeoenvironmental contexts; 3, compared their diversity and morphological trends over time; and 4, recorded evidence of PAIs.

The floras exhibited a generally low species richness of Dicroidium overall, but an increase in richness and leaf size with increasing time from the EPE. Similarly, Dicroidium leaf fragments from each locality revealed evidence of PAIs (including margin feeding, hole feeding, galling, and oviposition), with the highest proportion of PAIs from the youngest locality. Increasing numbers of PAIs on the dominant plant genus in Gondwanan ecosystems indicate that foundational trophic interactions between plants and arthropods were slowly re-establishing in the early Mesozoic. Given the broadly similar depositional conditions, these changes cannot readily be attributed to differences in local environments. Collectively, our findings evidence the recovery of terrestrial ecosystems and carbon sinks over several millions of years following the worst warming-driven mass extinction in Earth’s history.

How to cite: Turner, H.-A., McLoughlin, S., Sweeney, A., and Mays, C.: Ecosystem recovery after the end-Permian event, Sydney Basin, Australia: Diversity and ecological interactions of the Early Triassic Dicroidium floras, EGU General Assembly 2025, Vienna, Austria, 27 Apr–2 May 2025, EGU25-1062, https://doi.org/10.5194/egusphere-egu25-1062, 2025.

EGU25-1220 | Orals | BG5.3

Tracking the co-evolution of microbial sulfur metabolisms and geodynamics at the Eoarchean - Paleoarchean (3800-3200 Ma) transition 

Stephen J. Mojzsis, Barbara Kremer, Johanna Marin-Carbonne, Paul Tackley, Christoph Heubeck, and Alida Timar-Gabor

Chemolithoautotrophy, free energy from chemical disequilibria in crustal environments, apparently sustained the last universal common ancestors (LUCAs) of all life. If the LUCAs relied on the reductive Acetyl-CoA metabolic pathway via abundant H2 (e- donor) and bicarbonate (e- acceptor), they were confined to hydrogenous (H2-producing) metalliferous (ultra-)magnesian alkaline hydrothermal (>50°C) systems. The later advent of photoautotrophy provided a new plentiful e- donor (Corg) that allowed early life to exploit Sulfur (S) compounds as an energy source. Here, we report new multiple S-isotope (32S, 33S, 34S; Δ33S) data from authigenic sedimentary sulfides in Eoarchean-Paleoarchean sedimentary rocks from Isua (West Greenland) and South Africa (Barberton) to trace this early metabolic evolution. Our aim is to: (i) pinpoint in time and space when life began to influence the marine S cycle; (ii) follow changes in primary (Corg) production; (iii) model commutations to Eoarchean-Paleoarchean geodynamic regimes; and (iv) experimentally test how Corg is altered. Geodynamic scenarios particular to the Eoarchean-Paleoarchean Earth supported early biodynamic environments in both plate tectonics vs. non-plate tectonic contexts. For example, crust production modulates nutrient supply to the oceans which in turn influences the timing and tempo of metabolic innovation. Bio-geo-dynamic changes in the early Archean set the stage for the eventual emergence of the Eukaryotes.

How to cite: Mojzsis, S. J., Kremer, B., Marin-Carbonne, J., Tackley, P., Heubeck, C., and Timar-Gabor, A.: Tracking the co-evolution of microbial sulfur metabolisms and geodynamics at the Eoarchean - Paleoarchean (3800-3200 Ma) transition, EGU General Assembly 2025, Vienna, Austria, 27 Apr–2 May 2025, EGU25-1220, https://doi.org/10.5194/egusphere-egu25-1220, 2025.

Volcanic activity plays a pivotal role in Earth’s material cycling and serves as a crucial mechanism in regulating atmospheric CO2 concentrations. During the Late Ordovician–Early Silurian, global volcanic activity was frequent, exerting substantial influences on paleoclimate, paleoceanographic changes, mass extinctions, and the formation of important hydrocarbon source rocks in the Early Paleozoic era. In this study, Hg content, Zr content, Hf content, and Zr/Cr were used to identify volcanic activity; Cu content, Mo content, TOC content, and carbon isotopes were used to determine primary productivity; U/Th, V/Cr, V/(V+Ni), and Ni/Co were used to analyze the redox conditions of the sedimentary environment; chemical index of alteration, Sr content, and Sr/Cu were used to discriminate paleoclimate; and Sr/Ba to discriminate paleosalinity. In the Katian in the Yangtze region, the water body was highly reducing, and at the beginning of the Rhuddanian, the maximum values of all redox indicators appeared, with the maximum values of U/Th reaching 7.99, V/Cr reaching 25.68, V/(V+Ni) reaching 0.89, and Ni/Co reaching 25.15, which meant that the water body was in the strongest period of reductivity at this time. In the middle and late Rhuddanian, U/Th, V/Cr, V/(V+Ni), and Ni/Co all showed a decreasing trend, indicating that the reductivity of the water body gradually weakened. The trend in marine water's reducibility paralleled that of primary productivity, as indicated by Cu, Mo, and TOC content and the δ13C value increasing from the Katian to the beginning of the Rhuddanian, and then starting to decrease, and reached their maximum values at the beginning of the Rhuddanian. Additionally, the frequency and thickness of the bentonite layers were gradually decreasing and thinning from the Wufeng Formation to the Longmaxi Formation, and indicators of volcanic activity intensity, such as Zr content and Hf content, and Zr/Cr ratio exhibited an overall declining trend from the bottom to the top, aligning with the pattern of volcanic activity and the evolution of the sedimentary environment in the Late Ordovician–Early Silurian. The weathering process of volcanic rocks and volcanic ash brought huge amounts of P to the ocean during the Late Ordovician-Early Silurian, accompanied by inputs of N, Fe, Zn, and other vital elements necessary for biological growth and development, triggering the flourishing of marine organisms in the Yangtze Sea, with a rapid increase in biomass and consumption of more oceanic and atmospheric CO2. The original organic carbon sequestered in the Wufeng-Longmaxi Formation in the Yangtze region is about 4582.493 Gt, and the global total original organic carbon sequestered during this period is at least 16131.135 Gt. Volcanic activity enhanced the biological pumping effect, which resulted in the largest organic carbon sequestration in the Early Paleozoic.

How to cite: Xie, H. and Liang, C.: Late Ordovician-Early Silurian global volcanism triggers biological pumping in the Yangtze region driving ocean and climate change, EGU General Assembly 2025, Vienna, Austria, 27 Apr–2 May 2025, EGU25-1320, https://doi.org/10.5194/egusphere-egu25-1320, 2025.

EGU25-1684 | ECS | Orals | BG5.3

Biodiversification and the Latitudinal Diversity Gradient over deep time: insights from mechanistic models 

Manon Lorcery, Laurent Husson, Tristan Salles, Sébastien Lavergne, Oskar Hagen, and Alexander Skeels

The rise in species richness from the poles to the tropics, known as the latitudinal diversity gradient (LDG), is one of the most widespread patterns in the distribution of modern ecosystems. Although first documented more than 200 years ago, its origins, evolutionary dynamics, and underlying mechanisms remain unresolved. While geological and climatic changes are recognized as key drivers of biodiversity patterns, the precise causal factors shaping the LDG and their relative contributions to species richness gradients are still debated. Here, we explore how spatiotemporal variations in the physical environment influence the LDG by simulating the global diversification of terrestrial mammals over the past 125 million years using a spatially explicit eco-evolutionary model (gen3sis). This approach allows us to investigate both the mechanisms driving the LDG and broader biodiversification processes in dynamic landscapes, integrating changes in geological, climatic, and surface processes. Our findings indicate that the modern LDG is largely shaped by paleoclimatic and paleogeographic factors, with limited influence from surface processes. This gradient has persisted since the Cretaceous, steepening and stabilizing in width from the early Tertiary. Over deep time, LDG drivers demonstrate a strong influence of tectonic activity on speciation rates. The modeled scenarios also support an "out of the tropics" model in which species primarily originate in the tropics and disperse toward the poles without losing their tropical presence. As a result, the tropics are defined not only as a cradle, fostering the origination of new species, but also as a museum, preserving biodiversity over deep time.

How to cite: Lorcery, M., Husson, L., Salles, T., Lavergne, S., Hagen, O., and Skeels, A.: Biodiversification and the Latitudinal Diversity Gradient over deep time: insights from mechanistic models, EGU General Assembly 2025, Vienna, Austria, 27 Apr–2 May 2025, EGU25-1684, https://doi.org/10.5194/egusphere-egu25-1684, 2025.

EGU25-1806 | ECS | Posters on site | BG5.3

Building the eukaryotic planet: a view from marginal marine settings 

Giovanni Mussini

Marginal marine settings – the deltaic, estuarine, and mudflat habitats at the interface of land and sea – offer exceptional taphonomic windows on the rise of eukaryotic ecologies. Organic microfossils from tidally influenced horizons point to pre-Cryogenian origins for major eukaryotic groups, including red algae (Butterfield 2000), putative fungi (Butterfield 2003, 2005), and amoebae (Porter et al. 2003; Dehler et al. 2012). Meanwhile, an absence of comparable records even in those supratidal settings offering exceptional preservation conditions (e.g., in early diagenetic silica) suggests that Precambrian eukaryotes were essentially confined to subaqueous environments. Yet, these windows onto early eukaryotic history are vanishingly rare and temporally restricted. Efforts to place them within a broader record, spanning the Precambrian-Cambrian transition and its Phanerozoic aftermath, have been frustrated by a lack of similar organically preserved biotas from Cambrian marginal marine settings. New ichnofossils and Small Carbonaceous Fossils (SCFs; Butterfield & Harvey, 2012) from mudcracked horizons of the Middle Cambrian Pika Formation (Western Canada) offer a comprehensive view on an early Palaeozoic fauna from a periodically emergent mudflat. The wiwaxiids, priapulids, stem- and crown-annelids, and burrow traces of the Pika biota show that both classic Burgess Shale-type metazoans and ecosystem engineers from modern classes ventured into Cambrian tidally influenced settings, where they coexisted with members of derived living orders. This attests to an early influence of animal ‘pioneer taxa’ on dysoxic, intermittently desiccating marginal habitats. These findings push the limits of metazoan ecological tolerance to dehydration, UV exposure and salinity and redox fluctuations (e.g. Sagasti et al., 2001; Blewett et al., 2022), complementing the Precambrian record to suggest shallow-marine settings as cradles of eukaryotic innovation across the Neoproterozoic-Cambrian boundary.


References

Blewett, T. A., Binning, S. A., Weinrauch, A. M., Ivy, C. M., Rossi, G. S., Borowiec, B. G., ... & Norin, T. (2022). Physiological and behavioural strategies of aquatic animals living in fluctuating environments. Journal of Experimental Biology225(9), jeb242503.

Butterfield, N. J. (2000). Bangiomorpha pubescens n. gen., n. sp.: implications for the evolution of sex, multicellularity, and the Mesoproterozoic/Neoproterozoic radiation of eukaryotes. Paleobiology26(3), 386-404.

Butterfield, N. J. (2005). Probable proterozoic fungi. Paleobiology31(1), 165-182.

Butterfield, N. J. (2005). Reconstructing a complex early Neoproterozoic eukaryote, Wynniatt Formation, arctic Canada. Lethaia38(2), 155-169.

Butterfield, N. J., & Harvey, T. H. P. (2012). Small carbonaceous fossils (SCFs): a new measure of early Paleozoic paleobiology. Geology40(1), 71-74.

Dehler, CM, SM Porter, and JM Timmons (2012) "The Neoproterozoic Earth system revealed from the Chuar Group of Grand Canyon", in JM Timmons and KE Karlstrom, eds., pp. 49–72, Grand Canyon Geology: Two Billion Years of Earth's History. Special Paper no. 489, Geological Society of America, Boulder, Colorado.

Porter, S. M., Meisterfeld, R., & Knoll, A. H. (2003). Vase-shaped microfossils from the Neoproterozoic Chuar Group, Grand Canyon: a classification guided by modern testate amoebae. Journal of Paleontology77(3), 409-429.

Sagasti, A., Schaffner, L. C., & Duffy, J. E. (2001). Effects of periodic hypoxia on mortality, feeding and predation in an estuarine epifaunal community. Journal of Experimental Marine Biology and Ecology258(2), 257-283.

How to cite: Mussini, G.: Building the eukaryotic planet: a view from marginal marine settings, EGU General Assembly 2025, Vienna, Austria, 27 Apr–2 May 2025, EGU25-1806, https://doi.org/10.5194/egusphere-egu25-1806, 2025.

EGU25-2266 | ECS | Posters on site | BG5.3

Development of a biogeodynamical tool for exploratory paleoclimate modelling  

Laure Moinat, Florian Franziskakis, Christian Vérard, Daniel Goldberg, and Maura Brunetti

Exploring the dynamical structure of complex systems like Earth’s climate generally requires run- ning simulations over long time scales and for a wide range of initial conditions [1] following a ‘bio- geodynamical approach’. This means that the simulations need to include interactions among the climatic components (in particular, dynamical atmosphere and ocean as in general circulation models, as well as representations of vegetation, sea and continental ice) under different plate tectonic config- urations for deep time modelling. This is hardly achieved using CMIP-like models, because of their high computational costs.

Here, we describe a recently developed biogeodynamical modelling tool that allows for running simulations over multi-millennial time scales within a reasonable amount of CPU-time. Starting from the MITgcm coupled atmosphere-ocean-sea ice setup, we have developed a global ice-sheet model based on the shallow-ice approximation, where in a first step the surface mass balance is computed as in [2]. In a second step, we will adapt the MITgcm land/snow model to properly compute the surface energy balance. The runoff map is obtained by the hydrological model pysheds [3] and takes into account the ice-sheet isostatic correction. These three components are further coupled with the well- known vegetation model BIOME4 [4] and the paleogeographical reconstruction model PANALESIS [5].

Such a coupled setup permits to investigate nonlinear interactions among the climatic components at the global scale. These interactions evolve and balance differently along Earth’s history under the effect of various types of forcing, leading to a wide range of climatic steady states for different paleogeographical reconstruction times, and potentially revealing the presence of tipping mechanisms. Here, we show a present-day validation of this coupled setup against observations and CMIP6-model results, and how we are planning to apply it to selected time frames in deep time.


References

[1] Brunetti and Ragon, Physical Review E 107, 054214 (2023)

[2] Tsai & Ruan, Journal of Glaciology 64,246 (2018)

[3] Bartos, Matt., pysheds: simple and fast watershed delineation in python. (2020)

[4] Kaplan et al., Journal of Geophysical Research 108, 8171 (2003)

[5] Vérard., Geological Magazine 156, 2 (2019)

How to cite: Moinat, L., Franziskakis, F., Vérard, C., Goldberg, D., and Brunetti, M.: Development of a biogeodynamical tool for exploratory paleoclimate modelling , EGU General Assembly 2025, Vienna, Austria, 27 Apr–2 May 2025, EGU25-2266, https://doi.org/10.5194/egusphere-egu25-2266, 2025.

EGU25-3297 | ECS | Orals | BG5.3

Intense CO2 consumption by pulsed volcano weathering near interglacial peaks in the Azores Archipelago (North Atlantic Region) 

Francisco Hevia-Cruz, Anthony Hildenbrand, Nathan Sheldon, François Chabaux, Fernando O. Marques, and Julie Carlut

The weathering of basaltic rocks, especially on volcanic islands, plays a crucial role in global carbon cycling. In these environments, intense precipitation and frequent exposure of fresh rocks accelerate weathering processes, thus favoring the uptake of atmospheric CO2. While most estimates of weathering rates derive from river chemistry, soils and paleosols –the solid residue of protracted interaction between surface waters and the volcanic substrate– remain underexplored. Developed in contact with the atmosphere and incorporated into the geological record once sealed by volcanic deposits, paleosols record valuable environmental information, including the paleoclimatic conditions under which they were formed. In this study, we investigated the geochemistry of paleosols developed in the Azores Archipelago over the past 1 Myr. Precise geochronology of volcanic units bracketing paleosols revealed pulses of fast soil formation during interglacial peaks, and indicates high soil formation rates (3–180 mm kyr-1), similar to modern soil formation rates in tropical volcanic islands. This suggests periods over which the Azores High-pressure system could have been weakened or centered farther to the south of its current position, allowing humid air masses to reach the Azores region. Geochronological evidence suggests high initial formation rates, rapidly decreasing to near zero after ~35 kyr. This might be attributed to a combination of cation depletion and precipitation of stable minerals. Paleosols have generally developed faster on pyroclastic deposits than on lava flows. However, those formed on lava flows required less vertical development to sustain high cation exports due to their higher density. Based on the geochemistry of paleosols and their parental materials, we estimated cation exports (0–2600 t km-2 yr-1) and associated CO2 uptake (0–35 × 106 Mol km-2 yr-1). These estimates generally exceed previous estimates based on the geochemistry of modern rivers in the Eastern Azores, by a factor of up to tenfold. Our results highlight the criticality of precise geochronological control to estimate past weathering and soil formation rates, and that atmospheric CO2 may have experienced short episodes of intense sequestration during interglacial stages, possibly contributing to subsequent cooling events over the past 1 Myr. A preliminary study of U-series geochronology on paleosols of the Azores provided promising results, consistent with our previous Ar geochronology. This is expected to provide a better understanding of the evolution of past weathering rates and consequent CO2 consumption in the Azores and other volcanic settings.

How to cite: Hevia-Cruz, F., Hildenbrand, A., Sheldon, N., Chabaux, F., Marques, F. O., and Carlut, J.: Intense CO2 consumption by pulsed volcano weathering near interglacial peaks in the Azores Archipelago (North Atlantic Region), EGU General Assembly 2025, Vienna, Austria, 27 Apr–2 May 2025, EGU25-3297, https://doi.org/10.5194/egusphere-egu25-3297, 2025.

Clay mineralogy records provide important climate archives of weathering and hydrology through time, but these paleoclimate signals may be obscured by authigenic or diagenetic overprinting. International Ocean Discovery Program Expedition 396 drilled an expanded Paleocene-Eocene Thermal Maximum (PETM) succession from the Modgunn Vent in the Northeast Atlantic Norwegian Continental Margin. The PETM succession here is marked by frequent occurrence of discrete ash beds (centimetre scale) and by thicker ash-rich deposits. Three major lithological units were identified from the Late Paleocene to the Early Eocene in holes U1568A and U1567B: Late Paleocene bioturbated mudstone (Unit VI), laminated mudstone from the PETM onset and earliest PETM body (Unit V), and ash-rich mudstone in the later PETM body (Unit IV). Smectite is the dominant clay mineral throughout the record, with minor components of illite, kaolinite, and quartz. However, the potential transformation of volcanic ash into authigenic smectite after deposition complicates using clay mineralogy as a proxy for paleoclimate and weathering at this site.

We apply X-ray diffraction (XRD) analyses to quantify the bulk mineralogical composition as well as the clay-sized fraction and electron microscopy (SEM/EDX) to characterise the compositional and morphological changes of the clay-sized fraction. These results enable us to investigate the contribution of volcanism to the clay signal in order to discriminate between continental weathering processes given by clay mineralogy and early diagenesis processes by the input of volcaniclastic material. Morphological analysis of smectites indicate the occurrence of both detrital and authigenic types, but the chemical compositions are clustered by lithological unit rather than type. Detrital smectites in all units are montmorillonite-beidellites, and in Units V and VI authigenic smectites resemble the composition of detrital smectites in the same unit – suggesting a precursory relationship. In Unit IV Mg-rich authigenic smectite (cheto type) makes up >95% of the clay-sized fraction and is associated with enhanced in situ alteration of volcanic ash. This record indicates volcanic ash was relatively well preserved in the latest Paleocene and earliest PETM (Units VI and V) and authigenic smectites were mostly derived from detrital smectite and therefore paleoclimate signals are preserved. In the later PETM, a relative increase in volcanic material to background sedimentation – through increased bioturbation and/or volcanic production – significantly influenced the clay fraction due to the formation of ash-derived authigenic smectite. This process overwhelms the percentage of detrital clay in the XRD record and therefore masked any paleoclimate signals in Unit IV.

How to cite: Turton, N., Xu, W., and Pellenard, P.: Assessing volcanic influence on clay minerals as weathering proxies during the Paleocene-Eocene Thermal Maximum from Modgunn Hydrothermal Vent (IODP Expedition 396), EGU General Assembly 2025, Vienna, Austria, 27 Apr–2 May 2025, EGU25-3510, https://doi.org/10.5194/egusphere-egu25-3510, 2025.

EGU25-3646 | ECS | Orals | BG5.3 | Highlight

How deep-time climate change has influenced the diversity of plants 

Jiaze Li and Iain Colin Prentice

Biodiversity loss and climate change are interlinked crises with global ecological and societal impacts. Common explanations for how climate shapes biodiversity focus either on spatial scale (whereby more extensive and/or isolated climates promote species richness) or on temporal scale (whereby older, or more stable, climates foster biodiversity). However, these hypotheses overlook the intrinsic link between the spatial and temporal dimensions of climate.

We investigated how spatio-temporal climate changes over deep time may have influenced global patterns of plant diversity through the lens of climate analogues. By compiling global occurrence records for 350,864 vascular plant species, we produced the most comprehensive and precise global map of plant diversity to date. We identified analogues of recent (1851–1989) climate conditions across several geohistorical time periods: the Early Eocene (ca. 50 Ma), the Mid-Pliocene (3.3–3.0 Ma), the Last Glacial Maximum (LGM, 22–18 ka) and the Mid-Holocene (ca. 6 ka). We quantified spatial climate change within temporal periods, temporal change across spatial gradients, and the integrated spatio-temporal dynamics of climate. We evaluated the relative contributions of these metrics in explaining global plant diversity variation and examined the correlations between the spatial and temporal dimensions of climate change.

Our findings extend previous hypotheses by showing that species richness is higher in climatic conditions that were historically more extensive and/or isolated and have remained so through time. We also reveal a previously unrecognized mechanism by which climatic conditions that have undergone geographic expansion and slower movement over deep time tend to harbour higher plant diversity. Moreover, the combination of temperature stability and precipitation variability has facilitated species accumulation in low-latitude regions.

Spatial and temporal dimensions of climate change are thus interconnected, with long-term trends and short-term variability influencing the geography and movement of climate analogues, which in turn shape species richness. By incorporating the spatio-temporal climate changes into models, we can almost completely (> 90%) explain the global patterns of plant diversity today.

How to cite: Li, J. and Prentice, I. C.: How deep-time climate change has influenced the diversity of plants, EGU General Assembly 2025, Vienna, Austria, 27 Apr–2 May 2025, EGU25-3646, https://doi.org/10.5194/egusphere-egu25-3646, 2025.

Quick take: We investigate the conditions behind exoplanetary habitability. We compare how different models (complex physics-based vs. parameterized evolution) estimate the climate of Earth-like planets. We identify which planetary properties are critical to assess habitable conditions, and how that impacts the reliability of parameterized modeling.

Estimating whether an exoplanet is habitable is a complex question that goes far beyond calculating its host star Habitable Zone. In addition to incoming radiation from the star, atmosphere composition, planetary rotation, topography, and ocean/continent layout can all affect surface conditions spatial distribution. Simple parameterized models of those exoplanets allow for testing a large parameter space quickly, while physics-based models are more complex and much more time consuming, only allowing for the modelling of more restricted cases. We wish to test how the limitations of both approaches affect our capacity to assess planetary habitability, given the limited characterization available for exoplanets at present and for the foreseeable future.

We use Earth as a reference case, as the only planet where data is available regarding surface conditions evolution. We present new modeling results from the 3D climate General Circulation Model (GCM) ROCKE3D applied to Earth-like planets, based on atmospheric compositions derived from internal thermal histories and outgassing evolution scenarios consistent with Earth observation. We also compare atmospheric compositions and interior/atmosphere evolution scenarios obtained in a parameterized interior approach to the results of the 2D/3D Earth mantle dynamics model StagYY.

The main properties that we have investigated are variations of length of day, continental vs. oceanic coverage, topography and diverse atmospheric compositions consistent with recorded constraints on the Earth.

We compare average surface temperatures, albedos, precipitations, ice and clouds coverage obtained in both simulations. We then evaluate precipitations, sea surface level, and ice coverage obtained in GCM simulations and compare them to the usual criteria for habitability (such as average temperatures above 273-258 K). Finally, we assess the reasons for discrepancies between the models.

The trend of the variations of average temperature through time (and CO2 abundances) is consistent in parameterized vs. GCM models, making parameterized approaches generally efficient for a broad estimate of average surface conditions. However, perturbations around the reference model result in stronger temperature variations in the GCM due to albedo feedback. The albedo variations can be significant in 3D simulations and are not considered in the parameterized approach. Additionally, spatial variations of local surface conditions are found to be large and dependent on properties that cannot be resolved by parameterized models nor observed for exoplanets. Supercontinent setups result in markedly dryer land than the present-day Earth continental layout. Even models with average temperatures below 273-258 K have significant ice-free ground in all continental setups.

How to cite: Gillmann, C.: The habitability of Earth-like (exo)planets: modelling and limitations., EGU General Assembly 2025, Vienna, Austria, 27 Apr–2 May 2025, EGU25-4476, https://doi.org/10.5194/egusphere-egu25-4476, 2025.

EGU25-5049 | ECS | Orals | BG5.3

Hydrological cycles perturbation of continental weathering during the Triassic-Jurassic transition and Toarcian Oceanic Anoxic Event 

Qian He, Sofie Lindström, Stephen Hesselbo, Christian Bjerrum, Mingsong Li, Jianxin Yu, and Jun Shen

The Early Jurassic represents a critical interval in Earth’s history, characterized by significant ecosystem perturbations both on land and in oceans. Huge releases of greenhouse gas (e.g., CO2, CH4) by large scale of volcanic eruptions are generally assumed to cause significant increases in temperature during the Triassic-Jurassic transition (TJT) and Toarcian Oceanic Anoxic Event (T-OAE). However, terrestrial environmental responses to the climate perturbations on land, e.g., type and intensity of continental weathering, during these two hyperthermal events are still unclear. Here, we present a continuous lacustrine succession from the Chuxiong Basin in Yunnan Province, China, through the analysis of an approximately 1800 meter core. By integration of sedimentological, paleontological, geochemical, and astronomical data, we have established a chronology spanning about 21 million years from the Rhaetian (Late Triassic) to the Aalenian (late Early Jurassic), calibrated by the long eccentricity cycles. Distinct negative carbon isotope excursions and peaks in sedimentary Hg abundance, confirm significant volcanism during both the TJT and T-OAE. However, the Chemical Index of Alteration (CIA) and clay mineral data show opposing responses for the two events, indicating increasing and decreasing (or constant) chemical weathering intensity during TJT and T-OAE, respectively. Therefore, we proposed that these event-specific chemical weathering variations imply responses of volcanism-induced hydrological changes at different latitudes during these events.

How to cite: He, Q., Lindström, S., Hesselbo, S., Bjerrum, C., Li, M., Yu, J., and Shen, J.: Hydrological cycles perturbation of continental weathering during the Triassic-Jurassic transition and Toarcian Oceanic Anoxic Event, EGU General Assembly 2025, Vienna, Austria, 27 Apr–2 May 2025, EGU25-5049, https://doi.org/10.5194/egusphere-egu25-5049, 2025.

EGU25-6489 | Posters on site | BG5.3

Unexpected intense weathering during glacial periods in the Central North Atlantic as recorded by paleosols from Flores Island (Azores) 

Anthony Hildenbrand, Francisco Hevia-Cruz, Laura Loiodice, and Nathan Sheldon

Global climate variations (e.g., during glacial-interglacial transitions) induce local climatic effects such as temperature and precipitation changes, significantly impacting the chemical and physical degradation of volcanic islands. Conversely, the weathering of volcanic rock, especially on volcanic islands, consumes CO2, thus impacting its concentration in the atmosphere and consequently the global climate. The Azores Archipelago (Central North Atlantic) is particularly sensitive to climate changes due to its position influenced by regional climatic drivers such as the North Atlantic Oscillation atmospheric system and the oceanic North Atlantic Gyre. Paleosols are key targets to reconstruct paleo-environmental conditions, as they constitute a valuable archive of both paleoclimatic conditions and weathering processes. Recent work on paleosols spanning the past 1 Myr in the Central and Eastern Azores showed pulses of fast soil formation during wet and warm interglacial stages locally promoting intense atmospheric CO2 consumption through weathering. Flores Island, in the Western Azores, is the perfect target to further study rates of weathering and paleosol formation, and document paleoclimate at the regional scale (~600 km separation between Western and Eastern Azores). In this work, K-Ar geochronology of volcanic units under and overlying paleosols was used to precisely constrain their mean ages and formation times. This was complemented with paleoclimatic proxies based on paleosol whole-rock geochemistry, which allowed us to reconstruct Mean Annual Precipitation (MAP) and Mean Annual Air Temperature (MAAT) at the time the paleosols were formed. Our results show two groups of paleosols formed mainly during glacial periods (~ 550 ka, 630-670 ka), in contrast with the Central and Eastern Azores, where paleosols were formed near interglacial peaks. Our MAAT and MAP reconstructions show that mild and wet conditions prevailed in Flores, reaching 21.5°C and 1340 mm yr-1, respectively. These conditions are hotter and drier than current mean annual conditions (17°C and 1716 mm yr-1). However, they show wetter/warmer conditions than those reached around interglacial peaks in the Central and Eastern Azores, consistent with modern climatic differences (wetter/hotter conditions to the west). As paleosol ages between Flores and other Azores islands do not overlap, our data could indicate (1) persistent wet/warm local paleo-conditions in Flores due to its position farther to the north-west compared to the Central and Eastern Azores, closer to the westerlies’ main trend; or (2) a regional warm and wet climate around 550 ka and 650 ka that remains to be investigated in the other parts of the Archipelago and the Atlantic region at a broader scale (e.g., the Canary volcanic archipelago). In any case, our data evidence periods of fast soil formation during glacial stages (10 to 367 mm kyr-1), supposed to be too dry and cold to allow the efficient weathering of the volcanic substrate, according to recent reconstructions in the Central and Eastern Azores. Such intense and fast weathering likely resulted in significant atmospheric CO2 consumption, at least at local scale. Further investigations of paleosols could improve our temporal and spatial resolutions, and consequently our understanding of the feedback between volcanic islands weathering and global climate.

How to cite: Hildenbrand, A., Hevia-Cruz, F., Loiodice, L., and Sheldon, N.: Unexpected intense weathering during glacial periods in the Central North Atlantic as recorded by paleosols from Flores Island (Azores), EGU General Assembly 2025, Vienna, Austria, 27 Apr–2 May 2025, EGU25-6489, https://doi.org/10.5194/egusphere-egu25-6489, 2025.

It is becoming increasingly well understood that the Earth’s interior and surface evolution is intrinsically interrelated with the evolution of its atmosphere, oceans, landscape and life. This understanding lays down principal foundations of Biogeodynamics – an emerging scientific field that explores the interface of geodynamics, geomorphology, climate, ocean and atmosphere sciences, biology and ecology in order to understand how the evolution of the planetary interiors, surface, atmosphere, ocean, climate, and life is coupled. Despite its strong scientific, educational and societal potential, Biogeodynamics has not been yet fully established as a new discipline. An intrinsically cross-disciplinary character of Biogeodynamics creates organizational, educational and scientific challenges due to the necessity of truly collaborative research and education to efficiently combine scientific knowledge, research tools and training approaches from the very different research fields (such as Earth Sciences, Biology, Ecology, Climate Sciences and Planetology), which evolved independently from each other. To address these challenges, recently approved COST Action EUROBIG (https://www.cost.eu/actions/CA23150/) established the first pan-European Biogeodynamics network, which currently includes >100 scientists from 26 countries. The envisaged EUROBIG networking activities will accelerate the development of Biogeodynamics as a discipline in Europe and worldwide by supporting and linking the relevant communities, facilitating interactions to address the important scientific, methodological, educational, networking and funding challenges of this new field. Here, I will present in short the EUROBIG COST Action, which is open for new participants interested in building, advancing and leading the global Biogeodynamics research community. I will also review some recent advances in computational Biogeodynamics to show why and how the unique Earth's global evolution style - plate tectonics – is coupled to biosphere dynamics thereby accelerating life evolution and controlling biodiversity dynamics. Implications from Biogeodynamics for finding habitable Earth-like exoplanets and for the future dynamics and longevity of human civilization will also be discussed.

How to cite: Gerya, T.: Pan-European Biogeodynamics network EUROBIG: outstanding challenges and opportunities, EGU General Assembly 2025, Vienna, Austria, 27 Apr–2 May 2025, EGU25-7005, https://doi.org/10.5194/egusphere-egu25-7005, 2025.

EGU25-8561 | Orals | BG5.3

Climate change-driven Late Miocene to Pliocene rise and fall of C4 vegetation in Anatolia (Türkiye) 

Maud J.M. Meijers, Tamás Mikes, Bora Rojay, H. Evren Çubukçu, Erkan Aydar, Tina Lüdecke, and Andreas Mulch

Since the emergence of life on Earth 2.8 billion years ago, plants have been capitalizing on the C3 photosynthetic pathway. In the world’s grasslands that emerged since the Paleogene, C4 vegetation expanded considerably between 8 and 3 Ma following climatic changes, which heralded profound terrestrial ecosystem changes. However, sparse reconstructions of C4 vegetation in the northeastern Mediterranean region prevent a reconstruction of C3-C4 vegetation dynamics.

We present the first extensive δ13C soil carbonate record for Anatolia (Türkiye) for the last 10 Ma, which we combine with existing records from the Aegean (Greece). Our results show the emergence of C4 vegetation in Anatolian floodplains by 9.9 Ma, which is similar to regions in NW and E Africa. A transition to C4 dominance before ca. 7.1 Ma in Anatolia and potentially the Aegean occurs simultaneous with southern Asia during global Late Miocene Cooling in response to decreasing atmospheric pCO2.However, the patterns of the Anatolian and likely Aegean paleoecosystems are unique due to a rapid and permanent return to C3 dominance at ca. 4.4 Ma. A return to C3 dominance is not observed elsewhere in the world and occurs simultaneously with the disappearance of the open environment-adapted large mammal Pikermian chronofauna. We suggest that a regional warm-to-cold season change in rainfall seasonality toward a Mediterranean-style climate triggered the return of C3 biomass in Anatolia and the vanishing of herbivorous mammal populations of the Old World savannah paleobiome.

How to cite: Meijers, M. J. M., Mikes, T., Rojay, B., Çubukçu, H. E., Aydar, E., Lüdecke, T., and Mulch, A.: Climate change-driven Late Miocene to Pliocene rise and fall of C4 vegetation in Anatolia (Türkiye), EGU General Assembly 2025, Vienna, Austria, 27 Apr–2 May 2025, EGU25-8561, https://doi.org/10.5194/egusphere-egu25-8561, 2025.

The Permian-Triassic transition was marked by severe climatic and environmental disturbances, culminating in the largest mass extinction event since the Phanerozoic era. Volcanic activity, particularly the eruptions associated with the Siberian Traps Large Igneous Province (STLIP), is widely regarded as the primary driver of this ecological crisis. However, it is still unclear about the ecosystem effects by the weathering of the basalt, although the volatile effects by volcanic releasing had been well explored. This study focuses on the Suol section in the Siberian Basin to explore the causal relationship between basalt weathering and climatic-environmental evolution during this critical period, by metal geochemistry, sedimentology, and mineralogical analyses.
Results show that the concentrations of nickel, copper, vanadium, scandium, cobalt, and other metals in sediments near the Permian-Triassic boundary align with the elemental composition of Siberian basalts, confirming that the primary source material originated from basaltic eruptions. Following the volcanic events, the weathering of exposed Siberian basalts continued to influence the metal cycling in the Suol section into the Early Triassic, which yielding higher temperature. Notably, mercury and carbon isotope records recovered swiftly to pre-eruption background levels during the Early Triassic, indicating that volatile components such as mercury and carbon had a short-term impact on the climate and environment. In contrast, the weathering of non-volatile components persisted, resulting in prolonged effects on the regional climate and ecosystem.
These findings highlight a temporal disparity in the release and impact of volatile versus non-volatile components during Siberian volcanic activity. Volatile emissions significantly influenced short-term climatic and environmental conditions, whereas basalt weathering under extremely higher temperature conditions exerted a long-term influence on geochemical cycles and ecosystem dynamics.

How to cite: Zhang, Z. and Shen, J.: Sedimentary records of basalt weathering in the Suol section of Siberia basin during the Permian-Triassic Transition, EGU General Assembly 2025, Vienna, Austria, 27 Apr–2 May 2025, EGU25-9047, https://doi.org/10.5194/egusphere-egu25-9047, 2025.

EGU25-9324 | ECS | Posters on site | BG5.3

Evaluating the Impact of Paleogeographic Reconstructions on Phanerozoic Climate Simulations and Carbon Cycle Dynamics 

Niklas Werner, Christian Vérard, Maura Brunetti, Taras Gerya, and Paul Tackley

Over the course of the Phanerozoic, Earth’s climate has alternated between greenhouse and icehouse regimes, driven in large part by shifts in continental configurations that influence weathering processes and, consequently, the global climate. Geodynamic factors play a critical role in these shifts, and intermediate-complexity Earth System Models provide an effective means of exploring the associated parameter spaces. These models rely on topographic boundary conditions derived from paleogeographic reconstructions, where elevation and slope significantly affect silicate weathering intensities. However, different methodologies for reconstructing paleogeographies can yield markedly different results. Among these, the digital elevation maps by Scotese and Wright (2018) are widely used, despite notable discrepancies compared to alternative reconstructions.

To evaluate the impact of paleogeographic reconstructions on climate model simulations, we compared the outcomes of PlaSim-GENIE simulations for 45 time slices across the Phanerozoic, using both Paleomap and PANALESIS (Vérard, 2019) digital elevation models (DEMs). These simulations, covering pCO2 levels from 0.25 to 16 times pre-industrial atmospheric concentrations (280 ppm), were used to generate lookup tables for the spatially resolved global carbon cycle model SCION (Mills et al., 2022). This approach allowed us to investigate a broad parameter space of potential drivers for climatic shifts throughout the Phanerozoic.

Preliminary results indicate that incorporating degassing forcing from the PANALESIS paleogeography enables even simple inorganic carbon cycle box models to more closely replicate atmospheric CO2 variations inferred from proxy records. Furthermore, climate simulations using PANALESIS paleogeography within SCION more successfully capture the Hirnantian Glaciation, whereas simulations constrained by PaleoMap reconstructions produce pCO2 levels that are too high to align with the observed glaciation during this period. The identified differences may be related to a more robust treatment of plate boundaries evolution in PANALESIS, which is based on plate tectonic rules.

References

Mills, B. J., Donnadieu, Y., & Goddéris, Y. (2021). Spatial continuous integration of Phanerozoic global biogeochemistry and climate. Gondwana Research, 100, 73-86.

Scotese, C. R., & Wright, N. (2018). PALEOMAP paleodigital elevation models (PaleoDEMS) for the Phanerozoic. Paleomap Proj.

Vérard C. (2019.b). PANALESIS: Towards global synthetic palæogeographies using integration and coupling of manifold models. Geological Magazine, 156 (2), 320-330; doi:10.1017/S0016756817001042.

How to cite: Werner, N., Vérard, C., Brunetti, M., Gerya, T., and Tackley, P.: Evaluating the Impact of Paleogeographic Reconstructions on Phanerozoic Climate Simulations and Carbon Cycle Dynamics, EGU General Assembly 2025, Vienna, Austria, 27 Apr–2 May 2025, EGU25-9324, https://doi.org/10.5194/egusphere-egu25-9324, 2025.

EGU25-9334 | ECS | Posters on site | BG5.3

Low chemical weathering intensity in the Vøring Basin during the Paleocene-Eocene Thermal Maximum 

Anjana Gireesh Sandhya, Katharina Pahnke, Jack Longman, Joost Frieling, and Morgan T. Jones

The Paleocene Eocene thermal Maximum (PETM) was a rapid global warming event, which occurred ~ 56 million years ago and lasted for ~200 ka. It is characterized by a massive rapid input of 13C-depleted carbon into the atmosphere and ocean, causing a 2-7‰ negative carbon isotope excursion (CIE). As a result of high atmospheric CO2 levels, high temperatures, and an enhanced hydrological cycle during the PETM, increases in physical and chemical weathering intensity have previously been reconstructed across the globe. Chemical weathering of silicate rocks predominates in humid climates and significantly influences the major and trace element composition of resulting sediments. Numerous studies  suggest that the intensified chemical weathering of silicate rocks occurred during the PETM, driven by the warm conditions and enhanced hydrological cycle.

Here we present the first results of elemental geochemical analysis of sediment samples collected from the mid-Norwegian margin during IODP Expedition 396. Our initial results focus on variations in chemical weathering across the PETM as inferred from geochemical proxies.

In the samples examined here, chemical index of alteration (CIA), a proxy for chemical weathering intensity, values show a sharp drop from pre-PETM to mid-PETM. In contrast to other locations, these observations suggest a shift in the intensity of weathering from intermediate to weak and indicates chemical weathering was not intensified during the PETM in our study region. As this is opposite to previous studies, we consider whether changes in sediment provenance may explain these data. However, the provenance discrimination plots (La-Th-Sc ternary diagram Th/Co vs. La/Sc bivariate plot) shows mixed source with no clustering regardless of the time period. This indicates that the sediment source of the Vøring basin did not change at the PETM onset and we suggest that our CIA data truly represent a decrease in the intensity of chemical weathering during the PETM in the Vøring Basin.


How to cite: Sandhya, A. G., Pahnke, K., Longman, J., Frieling, J., and Jones, M. T.: Low chemical weathering intensity in the Vøring Basin during the Paleocene-Eocene Thermal Maximum, EGU General Assembly 2025, Vienna, Austria, 27 Apr–2 May 2025, EGU25-9334, https://doi.org/10.5194/egusphere-egu25-9334, 2025.

EGU25-9519 | Orals | BG5.3

Geodynamics of synconvergent extension on Venus and earth 

Oğuz Hakan Göğüş, Oğuzcan Karagöz, Ömer Bodur, Açelya Ballı Çetiner, and Özge Dinç Göğüş

Revealing the characteristics and origins of surface deformation in planetary bodies is fundamental to understanding the biogeodynamic cycle. Investigating how mountains and basins (topography) as well as magmatism (carbon cycling) develop with or without subduction—and therefore, plate tectonics—provides critical insights into the habitability and climate stability of a planet. This study aims to identify tectonic deformation on Venus, specifically describing extensional and shortening features. High-resolution, scaled laboratory experiments combined with structural observations suggest that lithospheric drips (sinking plumes) influence strain distribution and the geometric characteristics of various coronae. Notably, the linear shortening structures observed at the centers of coronae appear to form above downwelling regions, while material pulling results in crustal stretching at the topographic rims. These findings support the hypothesis that multiple geodynamic processes may collectively control coronae formation, with lithospheric drips often overlooked due to the prevalence of plume models. Ultimately, the coexistence of crustal extension/rifting and plate shortening (fold and thrust belt) by lithospheric instabilities offers a possible explanation for clarifying deformation patterns on Venus and earth.

How to cite: Göğüş, O. H., Karagöz, O., Bodur, Ö., Ballı Çetiner, A., and Dinç Göğüş, Ö.: Geodynamics of synconvergent extension on Venus and earth, EGU General Assembly 2025, Vienna, Austria, 27 Apr–2 May 2025, EGU25-9519, https://doi.org/10.5194/egusphere-egu25-9519, 2025.

The spatial-temporal climate and environmental effects triggered by the weathering of basaltic magmas after a large igneous province (LIP) eruption are not well known. Here, we present geochemical data from numerous sedimentary sites with a near-global distribution to explore the effects of juvenile basalt weathering of the low-latitude Emeishan large igneous province (E-LIP, ~260 Ma). These data show the weathering of basalt dominantly contributed to siliciclastic materials in proximal basins (> 6 × 10⁶ km2) at a timescale of up to ten million years. Our data thus provide evidence that, besides the gases released during the eruption, release of (metal) elements via weathering of basalt at low latitudes plays a significant role in surface geochemical cycling. The release of these elements likely facilitated the flourishing of tropical wetland flora in southwestern China during the Late Permian, resulting in the widespread formation of coal seams. Moreover, increased erosion rates, sharply reduced Chemical Index of Alteration (CIA), and exponentially increased bulk accumulation rates suggest a shift in the weathering regime of basaltic landscapes under the extreme climate conditions of the Early Triassic. This shift, characterized by intensified physical weathering, enhanced erosion in source areas but limited sediment transport, potentially resulting in the rapid disappearance of basalt weathering records in southwestern China.

How to cite: Ouyang, Q., Shen, J., and Longman, J.: Long-term provenance supply records of the Emeishan large igneous province: implications for the extreme climate of the Early Triassic, EGU General Assembly 2025, Vienna, Austria, 27 Apr–2 May 2025, EGU25-9529, https://doi.org/10.5194/egusphere-egu25-9529, 2025.

EGU25-10211 | Orals | BG5.3

Tectonic Control of Global Plant Biodiversity 

Sean D. Willett, Ao Luo, Yanyan Wang, Zhiheng Wang, and Loïc Pellissier

The distribution of plant species richness on earth suggests that tectonic mountain-building and its interaction with climate exert a defining control on species distributions and diversification rates. The two main pathways identified to increase species richness are, first, the broadening of environmental heterogeneity through the creation of new habitats formed by tectonic topography and, second, the disruption of existing landscapes by tectono-geomorphic processes, leading to time-dependent habitat fragmentation and increased allopatric speciation. Here, we resolve the contribution of these two pathways to explain global plant species richness. We build a model for environmental heterogeneity at the 100 km scale based on local richness at the 100 meter scale, which we take to be a function of local climate, and community turnover between 100 m cells based on environmental distance, which we take to be a global function. Each of these functions is calibrated to local field data. These two models can be combined to provide a prediction of species richness due to environmental heterogeneity at the 100 kilometer scale using global topography and climate data. Differencing this prediction from observed richness provides an estimate of the excess richness, which we argue is dominated by tectonic and geomorphic enhancement of allopatric speciation rates. We find that this excess component of richness is nearly always positive and is locally a factor of up to ten above that expected by environmental gradients alone. We conduct a categorical analysis, comparing the excess richness to active tectonic and geomorphic domains and find a close correspondence between the patterns of excess richness and recent tectonic and geomorphic activity. We conclude that high richness areas (biodiversity hotspots) overwhelmingly fall in areas of tectono-geomorphic activity, even after accounting for environmental heterogeneity, supporting the hypothesis that transient, tectono-geomorphic disruption is an important control on speciation rates and the distribution of biodiversity.

How to cite: Willett, S. D., Luo, A., Wang, Y., Wang, Z., and Pellissier, L.: Tectonic Control of Global Plant Biodiversity, EGU General Assembly 2025, Vienna, Austria, 27 Apr–2 May 2025, EGU25-10211, https://doi.org/10.5194/egusphere-egu25-10211, 2025.

EGU25-10843 | Orals | BG5.3

‘rgplates’: R Interface to Plate Tectonic Models in GPlates 

Ádám T. Kocsis, John Cannon, Xiaodong Qin, Dietmar Müller, Nussaibah B. Raja, Simon Williams, Sabin Zahirovic, and Elizabeth M. Dowding

Researching large-scale responses of organisms and ecosystems to deep-time perturbations requires a paleogeographic reconstruction of ancient Earth. Deep-time paleogeographic reconstruction rests on the foundations of tectonic modelling. The GPlates suite offers a continuously-developed, open-source solution for the development and interrogation of global tectonic models. These allow the implementation of key components of deep-time ecological research, such as the analysis of geographic ranges, the study of bioregionalization, the spatiotemporal analysis of diversity dynamics, and ecological niche modelling, to mention a few. However, the difficulty of using tectonic models and making fossil occurrence record data interact with them in the R environment, the standard scripting environment for paleoecological research, has been limiting the integration of paleogeographic and paleontological research.

Here we present the R extension package 'rgplates', which provides access to the calculations implemented in the GPlates Web Service and the GPlates desktop application via its command-line interface. Besides the reconstructions of point paleocoordinates, the package allows the access and manipulation of more complex vector features with the popular 'sf' extension. We present the basic feature set of the package and provide examples demonstrating their relevance to paleoecological calculations using occurrence records from the Paleobiology Database, as well as derived reconstruction products, such as digital elevation models and paleoclimatic models. In short, 'rgplates' enables the exploration of various tectonic models and the assessment of how their disagreements propagate to paleoecological inference.

How to cite: Kocsis, Á. T., Cannon, J., Qin, X., Müller, D., Raja, N. B., Williams, S., Zahirovic, S., and Dowding, E. M.: ‘rgplates’: R Interface to Plate Tectonic Models in GPlates, EGU General Assembly 2025, Vienna, Austria, 27 Apr–2 May 2025, EGU25-10843, https://doi.org/10.5194/egusphere-egu25-10843, 2025.

EGU25-11019 | ECS | Orals | BG5.3

Implementing plant evolution into a dynamic vegetation model and its impact on the Phanerozoic biosphere 

Khushboo Gurung, Alexander J. Hetherington, and Benjamin J.W. Mills

Land plants are a major contributor towards global terrestrial biomass which influences atmospheric CO2 and O2 however the amplitude of their contribution has fluctuated throughout the Phanerozoic; partly due to the evolution of plant features and strategies. An extended rise of atmospheric O2 over the Carboniferous and Permian coincides with the rise of large vascular plants which is thought to have increased organic carbon burial rates1. Here, we present one of the first dynamic climate-biogeochemical-vegetation model that allows the assessment of how plant evolution may have played a key role in the rise of the Late Paleozoic oxygen level. We implement a simple rooting evolution parameter and a high net primary productivity strategy of lycophyte paleotropical trees2 to the existing SCION-FLORA model3. The evolution of roots amplifies continental weathering processes and increases overall biomass while the lycophyte tree strategy allows for accelerated biomass accumulation. The two strategies contribute towards the increase of organic carbon burial which leads to a rise in oxygen with lycophyte tree forests playing a much greater role. Without the evolution of lycophyte tree forests, Paleozoic O2 levels cannot be reached suggesting that a quicker accumulation of biomass compared to present day forests was essential.

1. Berner RA. 1999 DOI: 10.1073/pnas.96.20.10955.

2. Cleal CJ, Thomas BA. 2005 Geobiology. DOI: 0.1111/j.1472-4669.2005.00043.x

3. Gurung K, Field KJ et al. 2024 Nat Comms. DOI: 10.1038/s41467-024-46105-1

How to cite: Gurung, K., Hetherington, A. J., and Mills, B. J. W.: Implementing plant evolution into a dynamic vegetation model and its impact on the Phanerozoic biosphere, EGU General Assembly 2025, Vienna, Austria, 27 Apr–2 May 2025, EGU25-11019, https://doi.org/10.5194/egusphere-egu25-11019, 2025.

EGU25-12000 | ECS | Posters on site | BG5.3

Range and radiation of Cambrian Trilobites 

Elizabeth Dowding, Harriet Drage, Adriane Lam, James Holmes, Stephen Pates, Katherine Jordan, Luis Collantes, Jorge Esteve, Lukáš Laibl, Kelsey Lucas, Mark Nikolic, Alexis Rojas, Fernanda Serra, and María Gabriela Suárez

Revealing the patterns and drivers of diversity in the Cambrian requires an understanding of distribution. On a dynamic Earth with uncertain palaeogeography, the understanding of range and diversity requires novel methodology and approaches. Trilobites, an extremely diverse group of arthropods, underwent important shifts in diversity and morphology throughout the Cambrian. However, the mechanisms driving their global dispersal and diversification during the early Palaeozoic remain inadequately understood. Persistent issues in studying the facilitators of distribution include morphological and life history constraints, e.g. the impact of benthic or pelagic larval stages. This uncertainty is compounded by the limitations of current palaeogeographical reconstructions. To address these issues, the Trilobite Biogeography and Ecology working group (TRiBE) applied  a novel approach to geography and reconstructed trilobite biogeographical patterns associated with their initial global radiation from throughout the Cambrian. Using phylobiogeographic methods, with the Paterson et al (2019) phylogeny, we took three approaches to area establishment and compared the resulting patterns. The results, strengthened through robust comparison of area establishment, provide insights into Cambrian trilobite ancestral geographical ranges, the frequency and type of allopatric speciation events, and the connectivity between different regions during this critical phase of euarthropod evolution. Comparison between palaeogeography, climate, and marine connectivity are examined as facilitators of a global trilobite distribution and the specialisation of the group throughout the Cambrian. This study aims to both make comment on the evolutionary success of early euarthropods, but also to highlight the influence of geographical assumptions on interpretation. 

How to cite: Dowding, E., Drage, H., Lam, A., Holmes, J., Pates, S., Jordan, K., Collantes, L., Esteve, J., Laibl, L., Lucas, K., Nikolic, M., Rojas, A., Serra, F., and Gabriela Suárez, M.: Range and radiation of Cambrian Trilobites, EGU General Assembly 2025, Vienna, Austria, 27 Apr–2 May 2025, EGU25-12000, https://doi.org/10.5194/egusphere-egu25-12000, 2025.

EGU25-12998 | Orals | BG5.3

Volcanic glass shards as a substrate for early life 

Barbara Kremer, Ewa Słaby, Richard Wirth, Owocki Krzysztof, Bąbel Maciej, Witkowski Marcin, Królikowska Agata, Schreiber Anja, Kempe Stephan, and Kaźmierczak Jozef

Explosive volcanoes eject large amounts of ashes in the form of fine-grained glass fragments (shards) during eruption. Depending on their size, degree of vesicularity and composition, pyroclastic glass shards have chemically reactive catalytic surfaces with high surface-to-volume ratios. They are able to adsorb organics, metals, and phosphates, as well as create microenvironments attractive for microbial growth. Pyroclastic material – deposited in both aquatic and terrestrial environments – was abundant on early Earth and some of the first habitats for life may have been glass-rich. Our new sedimentological, geomicrobiological and geochemical-petrological comparative studies (LAICPMS, EMPA, TEM, Raman) aim at evaluating the significance of volcanic glass shards as a substrate and source of nutrients for microbes and as a medium for preservation of biosignatures in the geological record.

Here we show that modern (Holocene) and Paleoarchean volcanic glass shards deposited in aqueous settings (hyaloclasts) preserve evidence of alteration by microbial activity. For example, sub-recent (ca. 0.37 ka; Kaźmierczak & Kempe 2006) shards of island arc basalt composition (containing phenocrysts of the early crystallization process i.e., forsterite olivine, spinel, plagioclase-bytownite, pyroxene) are documented from the alkaline caldera lake Vai Lahi on Niuafo’ou Island, Tonga (Kempe & Kaźmierczak 2012). Analyses by 3D Raman spectroscopy (depth profiling) reveal aragonite and calcite in the entire shard volume with associated carbonaceous matter, as well as spectra of anorthite and olivine.

Most Niuafoʻou shards are coated with a laminated envelope of alternating aragonitic and silicate layers resembling oncoids cortex. Open vesicles and external faces of the shards host an organic matter and mineral assemblage texturally identical to that of the laminated envelope. Two types of alterations are identified in the Niuafo’ou shards: i) pit-like etchings; and, ii) alveolar-spongy textures. Transmission electron microscopy reveals etch-like alterations (weathering or microbial activity?) on shard surfaces to a depth of ca. 2 µm. Elemental compositions of the altered layer point to a mixture of glass and the carbonate-silicate envelope.

Niuafo’ou shards were deposited in water of increased alkalinity that favored silica dissolution and carbonate precipitation. In turn, this leads to the growth of aragonite coatings as well as sizeable stromatolites in the lake. Such habitat is ideal for alkalophilic cyanobacteria that form biofilms and participate in the precipitation of mineral envelopes. Coated by carbonate-silicate, such glass shards can effectively preserve biosignatures even as far back as the Paleoarchean (<3.5 Ga) geologic record.

Kazmierczak, J. & Kempe, S. (2006)  Naturwissenschaften 93, 119- 126.

Kempe, S. & Kazmierczak, J. (2012) Life on Earth and Other Planetary Bodies, Springer, 197-234.


How to cite: Kremer, B., Słaby, E., Wirth, R., Krzysztof, O., Maciej, B., Marcin, W., Agata, K., Anja, S., Stephan, K., and Jozef, K.: Volcanic glass shards as a substrate for early life, EGU General Assembly 2025, Vienna, Austria, 27 Apr–2 May 2025, EGU25-12998, https://doi.org/10.5194/egusphere-egu25-12998, 2025.

EGU25-13043 | ECS | Posters on site | BG5.3

Contrasting vegetation and climate regulation at the Permian-Triassic and Triassic-Jurassic hyperthermals 

Zhen Xu, Khushboo Gurung, Alexander Farnsworth, Paul Wignall, Jason Hilton, Andrew Merdith, Stephen Hunter, Alexander Krause, Yuxuan Wang, Jianxin Yu, and Benjamin Mills

The Permian-Triassic (PTME, ~251.9 Ma) and Triassic-Jurassic (TJME, ~201.3 Ma) mass extinctions, both triggered by large igneous province (LIP) activity, represent two of the most significant extinction events in Earth’s history. Despite this similarity, there were contrasting impacts on land plants. Here, we compile global macrofossil records of Triassic-Jurassic flora and integrate them with lithological climate proxies, the HadCM3L climate model, and vegetation model FLORA to reconstruct vegetation dynamics across the TJME. Our findings suggest that, unlike the significant low latitude plant extinction during the PTME, the TJME coincides with floral compositional turnover and enhanced productivity, particularly in mid- to high- latitudes. High-resolution chemical weathering index, mercury, and plant biomarker records further suggest that global vegetation productivity and biotic weathering was enhanced after the TJME, stabilizing Earth’s temperature and facilitating rapid post-extinction cooling once LIP emissions ceased. This contrasts with the PTME when widespread deforestation trapped the Earth in a prolonged super-greenhouse climate. This study underscores the critical role of vegetation in modulating long-term climate and highlights plant thermal response and adaption as a key control on Earth's sensitivity to warming.

How to cite: Xu, Z., Gurung, K., Farnsworth, A., Wignall, P., Hilton, J., Merdith, A., Hunter, S., Krause, A., Wang, Y., Yu, J., and Mills, B.: Contrasting vegetation and climate regulation at the Permian-Triassic and Triassic-Jurassic hyperthermals, EGU General Assembly 2025, Vienna, Austria, 27 Apr–2 May 2025, EGU25-13043, https://doi.org/10.5194/egusphere-egu25-13043, 2025.

EGU25-14396 | ECS | Posters on site | BG5.3

Supraglacial biological niches as a solution to the Sturtian oxygenation problem 

Charlotte Minsky, Robin Wordsworth, and David Johnston

Understanding how climate and biology changed during and after Snowball Earth events - global glaciations which coincided with major shifts in the ocean-atmosphere state - is critical for understanding the evolution of life on Earth. New observations of the Neoproterozoic Sturtian glaciation pose challenges to the Snowball paradigm. Precision geochronology shows that the Sturtian lasted ~56 Myr, and the lack of sulfur-MIF signals observed indicates that the atmosphere remained oxygenated throughout. A source of O2 is required to maintain an oxygenated atmosphere for ~56 Myr, but in the canonical Snowball scenario, primary production shuts down completely. Here, we model the carbon and oxygen cycles during the Snowball to investigate this challenge. We propose that photosynthesis in melt holes on the equatorial glacier surface was sufficiently productive to provide the missing O2 source, and that accumulation of aeolian dust sustained these melt holes and supplied them with nutrients. We argue that primary production was limited by phosphorus availability and photosynthetically active surface area, and show that only a dust-supported supraglacial ecosystem could satisfy both conditions.

How to cite: Minsky, C., Wordsworth, R., and Johnston, D.: Supraglacial biological niches as a solution to the Sturtian oxygenation problem, EGU General Assembly 2025, Vienna, Austria, 27 Apr–2 May 2025, EGU25-14396, https://doi.org/10.5194/egusphere-egu25-14396, 2025.

EGU25-14655 | Posters on site | BG5.3

Volcanic impact on terrestrial sulphur cycling during the Carboniferous‒Permian in an alkaline lake in the Junggar Basin, NW China 

Xinping Liang, Andrey Yu Bychkov, Qingbin Xie, Bo Wang, and Rukai Zhu

The sulphur (S) cycle is important for determining paleoenvironmental evolution and organic matter enrichment. Compared with research on marine facies, studies on the terrestrial sulphur cycle and its relationship with key geological events, such as volcanic activity or hydrothermal fluids, are more limited. The Fengcheng Formation in the Mahu Sag of the Junggar Basin in northwestern China, which deposited approximately 360m during the Carboniferous to early Permian in an alkaline lake, is an ideal research object for studying the relationship between the terrestrial sulphur cycle and geological events. Therefore, in this work, we identified volcanic activity during the deposition of the Fengcheng Formation and established a link between volcanic activity and the lacustrine alkaline carbon‒sulphur cycle during the Carboniferous‒Permian through petrologic, geochemical, and geophysical data from the MY1 Well in the Mahu Sag. The results revealed that (1) multiple volcanic episodes occurred during the deposition of the Fengcheng Formation, as evidenced by high mercury (Hg) concentrations, high Hg/S ratios, increased sulphate concentrations and large negative pyrite sulphur isotope (δ34Spy) values (ranging to -20.52‰); (2) long-term ferruginous bottom water conditions may have been conducive to the preservation of organic matter; however, sulphate from volcanic activity promoted bacterial sulphate reduction, resulting in intermittent alternating euxinic conditions, as evidenced by iron speciation, molybdenum concentrations, and framboid and euhedral pyrite morphologies, which may have resulted in some consumption of organic matter; and (3) after volcanic activity, the sulphate in the lake water was depleted, and the bottom water system gradually closed and was continuously enriched with δ34Spy. Therefore, volcanic activity appears to have been the key factor controlling the sulphur cycle and organic matter enrichment through increased sulphate fluctuations in the oldest alkaline lake during the deposition of the Fengcheng Formation. This study sheds new light on the sulphur cycle of ancient alkaline lakes and can serve as a reference for organic matter enrichment under different mechanisms in shale.

How to cite: Liang, X., Bychkov, A. Y., Xie, Q., Wang, B., and Zhu, R.: Volcanic impact on terrestrial sulphur cycling during the Carboniferous‒Permian in an alkaline lake in the Junggar Basin, NW China, EGU General Assembly 2025, Vienna, Austria, 27 Apr–2 May 2025, EGU25-14655, https://doi.org/10.5194/egusphere-egu25-14655, 2025.

EGU25-14800 | ECS | Posters on site | BG5.3

Early Cambrian volcanic and palaeoenvironmental evolution of eastern Australia  

Suwijai Jatupohnkhongchai, Stacey Curtis, Jack Castle-Jones, Justin Payne, John R. Paterson, Glenn A. Brock, Luke Milan, and Marissa J. Betts

Early Cambrian tectonics of eastern Australia was characterised by the transition from a passive margin to a convergent regime with associated development of a volcanic arc system. This interval coincided with the Cambrian Explosion—the geologically sudden appearance of all major animal body plans. In South Australia, lower Cambrian successions in the Stansbury and Arrowie basins are stratigraphic archives that preserve evidence for diverse fossil faunas that flourished along the eastern margin of Gondwana, and the dynamic palaeoenvironments they inhabited. Sandwiched within these marine and marginal marine successions are distal volcanics—key for mapping the tectonically-driven palaeoenvironmental and palaeogeographic evolution of this region.

Proximal and distal volcanics from South Australia (SA) and western New South Wales (NSW) have been CA-TIMS dated to establish precise marker horizons. These dates link distal volcanics with their likely proximal equivalents in South Australia and the Gnalta Shelf in western NSW. In SA, a tuff from the lower part of the Parara Limestone in the SYC 101 drill core in the western Stansbury Basin has been dated to 517.5±0.2 Ma (Castle-Jones et al., in review) which is within error of a CA-TIMS date of 517.41±0.15 Ma from the Marne River Volcanics in the eastern part of the basin (Curtis, in prep.). Tuffs from the Mernmerna Formation in the Arrowie Basin have been dated to 515.38 ± 0.13 Ma (Big Green Tuff), 514.56 ± 0.13 Ma (Third Plain Creek Member), and 514.46 ± 0.13 Ma (Paralana 1B DW1 drill core) (Betts et al., 2018). These ages correspond closely to the 514.96 ±0.14 Ma tuff from Cymbric Vale Formation, western NSW (Betts et al., 2024). The Billy Creek Formation tuff in the Arrowie Basin, dated to 511.87 ±0.14 Ma (Betts et al., 2018), is slightly younger than the Ma Mooracoochie Volcanics in the Warburton Basin to the north (Curtis, in prep.).

Changes in volcanic regime over time accompanied profound changes in basinal palaeogeography, sedimentation and faunal composition in eastern Australia during the early Cambrian. This study shows how geochronology, accompanied by rigorous petrographic, biostratigraphic and geochemical data are important for resolving how tectonic evolution impacted nascent ecosystems along the early Cambrian margin of eastern Australia.

References

Betts, M.J., et al. 2024. First multi-proxy chronostratigraphy of the lower Cambrian Byrd Group, Transantarctic Mountains and correlation within East Gondwana. Gondwana Research 136, 126-141.

Betts, M.J., et al. 2018. Early Cambrian chronostratigraphy and geochronology of South Australia. Earth-Science Reviews 185, 498-543.

Castle-Jones, J., et al. in review. Integrated biostratigraphy, chemostratigraphy and geochronology of the lower Cambrian succession in the western Stansbury Basin, South Australia. Australian Journal of Earth Sciences.

Curtis, S., in prep. The Delamerian Orogen: Insights into a rapidly evolving convergent continental margin from the timing and petrogenesis of igneous rocks. PhD thesis. University of South Australia

How to cite: Jatupohnkhongchai, S., Curtis, S., Castle-Jones, J., Payne, J., R. Paterson, J., A. Brock, G., Milan, L., and J. Betts, M.: Early Cambrian volcanic and palaeoenvironmental evolution of eastern Australia , EGU General Assembly 2025, Vienna, Austria, 27 Apr–2 May 2025, EGU25-14800, https://doi.org/10.5194/egusphere-egu25-14800, 2025.

EGU25-15785 | ECS | Orals | BG5.3

Detecting signatures of life on terrestrial and Martian rocks: contribution of microbial mats in the biogeomorphological responses of desiccated sediments 

Liza Alexandra Fernandez, Dov Corenblit, Florent Arrignon, Stéphanie Boulêtreau, Neil S. Davies, Jessica Ferriol, Frédéric Julien, Joséphine Leflaive, Thierry Otto, Erwan Roussel, Jean-Pierre Toumazet, and Johannes Steiger

Detecting signatures of life in sedimentary rocks lies in the difficulty of distinguishing them from abiotic signals and interpreting their formational conditions, particularly when working on planetary systems that are different from Earth, such as Mars (Corenblit et al., 2023). Research in this field is booming, thanks to the development and deployment of detection tools either in orbit or on the surface. Mars is of great interest due to its early history comparable to Earth during the Noachian period > 3.7 Ga (Lapôtre, 2022). In addition, traces of favourable environmental conditions for the potential development of life have been found for this period, for example in Gale Crater (Rapin et al., 2023). Among the candidates for searching potential signatures of life, Microbially Induced Sedimentary Structures (MISS, Nora Noffke in 1996) have become a target. MISS are characteristic structures resulting from surface sediment disturbances induced by microbial mats (Schieber et al., 2007; Noffke, 2010). Their formational environments may correlate with early Mars conditions, and their terrestrial study is enriched by their representation in both fossil and modern records (Noffke 2015, 2021). The analogy between two planetary systems relates to the principle of abductive inference, which posits that similar (bio)geomorphological processes will result in similar (bio)geomorphological structures (Corenblit et al., 2019). Therefore, it is crucial to develop a clear conceptual framework for processing observations of modern and fossilized textures, forms, and patterns and for discussing the gradient of distinction between abiotic and biotic modalities (Davies et al., 2016).

Here, we focused on one type of MISS known as “mat cracks”, the biotic equivalent of abiotic structures “mud cracks” (Noffke, 2010). These are well-represented in the field in both fossil and modern records, and they are robustly repeatable under controlled laboratory conditions. They may correspond to ancient Martian environmental systems as attested by polygonal ridges in Gale Crater, which are characteristic of sustained wet/dry cycles (Rapin et al., 2023). The methodology is based on the visual distinction of biotic and abiotic classes of texture, form, and pattern using different visualisation methods such as photogrammetry and expert visual observations, statistical tools and classification with convolutional neural networks (CNNs). For an initial exploration of the mud crack variability, we set up an ex-situ experiment to produce mud cracks with three types of biofilms and three biomass levels according to variables observed in the field, and using 3D picture dataset of the resulting mud cracks. We have demonstrated significant differences between abiotic and biotic classes and between strain and biomass classes. CNN models outperformed the human-blinded classification by refining the diversity of criteria used and observations such as the textures of the sandy matrix. These significant distinctions and the finesse of the classification provided by artificial intelligence allow us to discuss the interest of the information gain in distinguishing potential textures, forms and patterns that are characteristic of MISS in the field where noise, alteration and erosion can be a problem in identifying the origin of signatures, particularly on Mars.

How to cite: Fernandez, L. A., Corenblit, D., Arrignon, F., Boulêtreau, S., Davies, N. S., Ferriol, J., Julien, F., Leflaive, J., Otto, T., Roussel, E., Toumazet, J.-P., and Steiger, J.: Detecting signatures of life on terrestrial and Martian rocks: contribution of microbial mats in the biogeomorphological responses of desiccated sediments, EGU General Assembly 2025, Vienna, Austria, 27 Apr–2 May 2025, EGU25-15785, https://doi.org/10.5194/egusphere-egu25-15785, 2025.

EGU25-15990 | ECS | Posters on site | BG5.3

Expanded aerobic iron biogeochemical cycle in the Paleoproterozoic oceans during the ca. 2.22-2.06 Ga Lomagundi Event 

Abdulwaris Ajagunjeun, Frantz Ossa Ossa, Ilka C. Kleinhanns, Johanna Marin-Carbonne, Axel Hofmann, Aisha Al Suwaidi, and Ronny Schoenberg

The variability of iron (Fe) isotopes during the Paleoproterozoic is a topic of debate due to the complex pathways involved in isotopic fractionation. Similarly, the expansion of ocean oxygenation during the late part of the Great Oxygenation Event (GOE)―the ∼2.22–2.06 Ga Lomagundi Event (LE) that represents Earth’s most pronounced and longest-lived carbon isotope excursion―remains controversial. Here, we present new Fe isotope data on bulk samples from a range of lithologies of the Francevillian Group, Gabon, including marine carbonates, black shales, thin sedimentary pyrite beds, early diagenetic pyrite and carbonate nodules. We also analyse pyritized Francevillian biota that were further combined with data obtained from in situ Fe isotope analyses on early diagenetic pyrite nodules (pyritized Francevillian biota and non-fossil pyrite). The δ56Fe values from this study vary from highly positive values, up to +1.71‰, in non-fossil pyrite nodules, to highly negative values, down to –3.14‰, in pyritized Francevillian biota. The near-to-zero δ56Fe values notably characterize primary carbonates, black shale, thin pyrite beds and carbonate concretions. The near-to-zero δ56Fe values are interpreted to reflect complete oxidation and quantitative removal of dissolved Fe2+ from seawater, in the Paleoproterozoic oceans, followed by complete reduction of Fe3+ in the sediments akin to previously described modern-like Fe biogeochemical cycle which is proposed to have kicked off only from ca. 1.7 Ga. In contrast, positive δ56Fe values are linked to equilibrium isotope fractionation, favoured by the high S/C ratios during early diagenesis, while the negative values reflect the kinetic isotope effect driven by a high organic carbon content of the Francevillian biota. The Francevillian Group massive manganese deposition is devoid of concomitant and significant Fe precipitation in the Francevillian shelf environments which is in stark contrast to early GOE Mn-ore deposits in southern Africa. The data thus suggests that the marine Fe2+ reservoir was already exhausted in the Paleoproterozoic oceans during the late part of the GOE. In this scenario, and considering the observation of Fe-lean Mn deposits, the Paleoproterozoic oceans were likely oxygenated enough to quantitatively oxidize and remove Fe2+ from seawater during the LE. However, extensive oxidation of Fe2+ may have been an important O2 buffer that contributed to maintaining low redox thresholds (e.g., low Eh) in the deep Paleoproterozoic oceans, which ultimately prevented it from reaching oxidizing conditions that require the stability of Mn (oxyhydr)oxides and other elements of similar redox thresholds, i.e., nitrate and selenate. Oxidizing conditions to quantitatively oxidize Mn2+ or to significantly build up a pool of oxyanions stable at much higher redox thresholds (e.g., nitrate and selenate) were only reached in the photic zone where the rate of oxygenic photosynthesis was significantly enhanced as a consequence of intense oxidative weathering during the LE. The findings highlight moderately oxygenated Paleoproterozoic oceans with habitats capable of sustaining complex aerobic ecosystems only restricted in shelf environments during the immediate aftermaths of the GOE.

How to cite: Ajagunjeun, A., Ossa Ossa, F., Kleinhanns, I. C., Marin-Carbonne, J., Hofmann, A., Al Suwaidi, A., and Schoenberg, R.: Expanded aerobic iron biogeochemical cycle in the Paleoproterozoic oceans during the ca. 2.22-2.06 Ga Lomagundi Event, EGU General Assembly 2025, Vienna, Austria, 27 Apr–2 May 2025, EGU25-15990, https://doi.org/10.5194/egusphere-egu25-15990, 2025.

EGU25-18229 | Orals | BG5.3

Deep time climatic oscillations regulated by shallow-water carbonates 

Laurent Husson and Tristan Salles

The long-term climate depend on continental weathering, hydrothermal fluxes, and carbonate sequestration in the oceans, but a coherent explanation is missing. Here, we investigate the role of neritic carbonate accumulation, by plugging a macro-ecological model for shallow-water carbonates onto a combined set of state-of-the-art tectonic, climatic and physiographic reconstructions. Our model introduces and quantifies neritic habitability as a primordial climatic control. Our model confirms the role of deep ocean carbonate habitability -when carbon sources exceed the accumulation capacity of warm water carbonates, expanding carbon storage to the abyss- as a cooling factor, and reveals an unidentified alternative warm regime, controlled by the exceeding capacity of warm-water carbonates to capture Ca2+ and alkalinity fluxes. This regime depletes the oceans of its alkalinity, shoals the carbonate compensation depth, and releases carbon from the deep ocean to the atmosphere. These contrasted regimes, that we refer to as habitability-limited and calcium-limited, largely explain longterm climatic excursions, as revealed by the geological archive.

How to cite: Husson, L. and Salles, T.: Deep time climatic oscillations regulated by shallow-water carbonates, EGU General Assembly 2025, Vienna, Austria, 27 Apr–2 May 2025, EGU25-18229, https://doi.org/10.5194/egusphere-egu25-18229, 2025.

EGU25-18533 | ECS | Orals | BG5.3

Influence of orbital cycles on chemical weathering and marine redox conditions under greenhouse climates 

Chiara Krewer, Stephen Hunter, Simon W. Poulton, Robert J. Newton, and Benjamin J. W. Mills

Cretaceous Oceanic Anoxic Event 2 (OAE2) coincided with the emplacement of several large igneous provinces. The rapid exhalation of volcanic CO2 intensified the global climate and accelerated the hydrological cycle. Cyclic variations in marine redox conditions linked to weathering are documented in OAE2 successions, indicating an orbital control on global weathering rates, and thus, marine nutrient availability. However, the impact of the cyclicity varies in intensity, particularly at the end of OAE2, which is characterized by dampened weathering variability. In this conceptual approach, we assess the influence of orbital forcing on global chemical weathering rates under different atmospheric CO2 concentrations and orbital configurations using HadCM3L. We find that with increasing pCO2, chemical weathering rates significantly increase and the influence of changes in obliquity is amplified. This suggests a strong coupling between orbital cyclicity and global weathering fluxes under hot climates, with significant influence on the carbon cycle driven by weathering-derived nutrients.

How to cite: Krewer, C., Hunter, S., Poulton, S. W., Newton, R. J., and Mills, B. J. W.: Influence of orbital cycles on chemical weathering and marine redox conditions under greenhouse climates, EGU General Assembly 2025, Vienna, Austria, 27 Apr–2 May 2025, EGU25-18533, https://doi.org/10.5194/egusphere-egu25-18533, 2025.

EGU25-19148 | Posters on site | BG5.3

Investigating warm climatic conditions through bulk and clay mineralogy in the AlanoSection (Neo-Tethys) during the Middle Eocene Climatic Optimum (MECO, ~40 Ma) 

Giuseppe Cruciani, Silvia Sigismondi, Luca Giusberti, and Valeria Luciani

The middle Eocene was marked by long-term global cooling trend, interrupted by a notable
warming event lasting ~500 kyr, the Middle Eocene Climatic Optimum (MECO, ~40 Ma),
characterized by a 4–6°C increase in surface and temperatures, accompanied by a transient rise in
atmospheric pCO2. The MECO event is attracting increasing scientific interest, as it records
temperatures and pCO2 levels that Earth could reach by the end of this century if anthropogenic
greenhouse gas emissions are not reduced. Continental weathering plays a critical role during warm
phases, as it contributes to carbon removal from the atmosphere through silicate hydrolysis.
Analyzing clay and bulk mineralogy in the stratigraphic archives offers valuable insight into past
environmental conditions. The preservation of clay minerals allows for the reconstruction of the
conditions under which they formed, providing clues about continental weathering and geochemical
conditions in the water columns or pore waters (neoformed or transformed) of the sedimentary
environment during climate events. However, bulk and clay mineralogy data that characterize
paleoenvironmental conditions during the MECO, are still insufficiently explored. This study
presents an integrated approach to assess changes in weathering regimes through bulk and clay
mineralogy from the Alano di Piave section, a Neo-Tethys bathyal succession located in NE Italy.
This section, the GSSP of the Bartonian/Priabonian boundary, offers a continuous and well-
preserved record of the MECO interval, well constrained by stable isotope record, making it an
ideal location to study paleoclimatic conditions of this crucial warming event, especially in relation
to continental weathering. Changes in mineralogical assemblages observed in this study reflect the
regional climatic expression of the MECO global warming event. In addition, climatic variations as
derived by our analyses can provide significant information on the marked biotic changes recorded
from this section.

How to cite: Cruciani, G., Sigismondi, S., Giusberti, L., and Luciani, V.: Investigating warm climatic conditions through bulk and clay mineralogy in the AlanoSection (Neo-Tethys) during the Middle Eocene Climatic Optimum (MECO, ~40 Ma), EGU General Assembly 2025, Vienna, Austria, 27 Apr–2 May 2025, EGU25-19148, https://doi.org/10.5194/egusphere-egu25-19148, 2025.

EGU25-19755 | Posters on site | BG5.3

Global impacts of evaporite deposition during the Messinian Salinity Crisis in transient Earth system model simulations  

Benjamin Mills, Markus Adloff, Fanny Monteiro, and Rachel Flecker

The Messinian Salinity Crisis (MSC, 5.9-5.3 Ma) is recognised as a period of dramatic regional environmental change but it is rarely considered in the interpretation of global environmental change in the late Miocene. Following Shields & Mills (2021), who showed that evaporite deposition has the potential to perturb the global carbon cycle, we investigate the temporal and spatial patterns of global environmental change resulting from the precession-paced extraction of the gypsum preserved until today in the Mediterranean basin in the 3D Earth system model cGENIE. The prescribed evaporite deposition causes a transient atmospheric CO2 draw-down of ~80 ppm and swings in the carbonate saturation state which causes sedimentary dissolution near the carbonate compensation depth, especially in the Pacific and Indian ocean. We compare the simulated model response to proxy records of late Miocene environmental change to test whether the fingerprint of the MCS evaporite deposition can be identified or whether additional buffer mechanisms need to be invoked to explain a more stable carbonate system.


References

Shields, G.A. and Mills, B.J., 2021. Evaporite weathering and deposition as a long-term climate forcing mechanism. Geology, 49(3), pp.299-303.

How to cite: Mills, B., Adloff, M., Monteiro, F., and Flecker, R.: Global impacts of evaporite deposition during the Messinian Salinity Crisis in transient Earth system model simulations , EGU General Assembly 2025, Vienna, Austria, 27 Apr–2 May 2025, EGU25-19755, https://doi.org/10.5194/egusphere-egu25-19755, 2025.

EGU25-504 | ECS | Orals | CL1.2.12

Plio-Pleistocene CO2 drawdown related to wildfire-induced terrestrial organic carbon burial 

Thamizharasan Sakthivel, Prosenjit Ghosh, Sajid Ali, and Mohd Munazir Chauhan

The Plio-Pleistocene transition (1.5–3 million years ago) was marked by a significant drop in the atmospheric CO2 level by approximately 140 ppm, driving global cooling and amplifying glacial-interglacial cycles [1,2]. While glaciation-induced continental erosion and terrestrially derived organic carbon (OC) burial are typical factors considered key drivers, these processes do not fully explain the causal mechanism in driving the CO2 drawdown without including regions near mid- and low-latitudes [3]. The ecosystem responses to wildfires and post-fire storms can help elucidate these changes. Here, we investigate the impact of wildfires on OC burial rates at regional and global scales from 4 to 1.5 Ma. Regionally, we reconstructed wildfire activity across South Asia using stable nitrogen isotopes of fixed ammonium in clay minerals and pyrogenic carbon abundances. Our study focused on sedimentary records from the Kashmir Siwalik sedimentary succession and the Nicobar Fan sediments from IODP Expedition 362, Site U1480, which provide insights into processes associated with the Andaman-Nicobar accretionary prism and the Indo-Myanmar ranges. The findings reveal a significant intensification of wildfire activity during the Plio-Pleistocene transition (1.5–3.0 Ma), accompanied by a 2.9- and 2.4-fold increase in continental erosion rates and organic carbon burial flux compared to the early Pliocene (3.0–4.0 Ma). We compiled a comprehensive wildfire dataset on a global scale, integrating 20 proxy records from continental and marine sediments. By combining sediment OC content and Mass Accumulation Rate data from 23 ODP/IODP sites worldwide, we quantified the global rate of OC burial. Our findings reveal a dramatic 4.8-fold increase in wildfire activity and a 1.5-fold rise in global OC burial rates, from 2.29 ± 0.48 Mt C per year during the early Pliocene to 3.52 ± 0.80 Mt C per year at the Plio-Pleistocene transition. These results highlight the significant role of fire-driven processes in atmospheric CO2 drawdown, a mechanism that previous studies have largely overlooked.

References:

[1] Hönisch et al., 2023. Science, 382(6675), p.eadi5177.

[2] Hansen et al., 2013. Philos. Trans. R. Soc. A Math. Phys. Eng. Sci. 371(2001), p.20120294.

[3] Herman et al., 2013. Nature, 504(7480), pp.423-426.

How to cite: Sakthivel, T., Ghosh, P., Ali, S., and Munazir Chauhan, M.: Plio-Pleistocene CO2 drawdown related to wildfire-induced terrestrial organic carbon burial, EGU General Assembly 2025, Vienna, Austria, 27 Apr–2 May 2025, EGU25-504, https://doi.org/10.5194/egusphere-egu25-504, 2025.

Fire regimes have distinct global controls, and how burnt area, wildfire size and wildfire intensity independently respond to changes in climate, vegetation, and human activity remains challenging to quantify. Here, we use robust empirical models of burnt area, fire size and a measure of intensity to explore the global sensitivity of fire regimes to changes in climate, atmospheric CO2 and human activity under contrasting climate states, specifically at the end of the century under two climate change mitigation scenarios and at the Last Glacial Maximum. Our simulations show a global shift in wildfire patterns by 2100 CE under both low- and high-mitigation scenarios with reduced burnt area in tropical regions but larger and more intense wildfires in extra-tropical regions. Under low mitigation, increases in burnt area worldwide overwhelm the current human-driven declining trend, with fire size and intensity increasingly limited by dryness and vegetation fragmentation. Under different future conditions burnt area continues to increase due to changes fuel availability and dryness, fire intensity is increasingly limited by fuel build-up, and fire size by fuel continuity. These trends differ from those shown in simulations at the last Glacial Maximum, which show decreased burnt area, alongside increased fire size and intensity compared to present, consistent with sedimentary charcoal evidence. The decoupling between different fire properties occurs because of the different temporal and spatial scales on which the controls of burnt area, fire size and fire intensity operate. Under future conditions, the effect of a warming climate and increasing atmospheric CO2 amplify each other, whereas in cold climate with low atmospheric CO2, they dampen each other. These findings have immediate implications for the improvement of process-based fire models, which currently do not take the distinctions between these fire properties into account. They also suggest that the current observed patterns of fire regimes today may not hold constant under changing conditions.

How to cite: Haas, O., Prentice, C., and P. Harrison, S.: Assessing the sensitivity of fire regimes to climate, atmospheric CO2 and human activity under past and future conditions , EGU General Assembly 2025, Vienna, Austria, 27 Apr–2 May 2025, EGU25-1704, https://doi.org/10.5194/egusphere-egu25-1704, 2025.

EGU25-1823 | Orals | CL1.2.12

Pyrogenic Compounds in Tropical Australian Stalagmites Record Changes in Bushfire-Climate Relationships Coincident with the Arrival of European Pastoralists 

Rhawn Denniston, Stefania Ondei, Elena Argiriadis, Emma Rowe, David Bowman, John Cugley, David Woods, Robert Kershaw, Magdalena Lee, Veronica Schuchart, Todd Carter, and Kathryn Allen

Australia has long been recognized as one of the world’s fire hotspots, but the Black Summer of 2019-2020, when 97,000 km2 were scorched across southeastern Australia, and the larger fires of northern Australia’s savanna and desert in 2023, may indicate a shift toward a higher level of fire activity. Placing these events in context requires developing precisely-dated, high resolution records of bushfire through periods with different climate and land use mean states. We reconstructed bushfire activity for the period 1110-2009 CE using polycyclic aromatic hydrocarbons (PAH) in three precisely-dated, fast-growing, and partially overlapping aragonite stalagmites from cave KNI-51, located in the central Australian tropical savanna. PAH molecular weights are tied to combustion temperature (i.e., low molecular weights form in lower temperature fires), and thus our record preserves evidence of both the timing and intensity of bushfire over the majority of the last millennium.

Comparisons of burn scar satellite imagery with temporal changes in PAH abundances in recently deposited stalagmite suggest that airfall (smoke and ash) from fires within a 5 km radius is primarily responsible for transmitting PAH to the land surface over the cave, a finding supported by our recent controlled burn and irrigation experiment. The rapid growth rate of KNI-51 stalagmites (1-2 mm yr-1), coupled with the extremely thin soils above the cave, appear to allow for transmission and preservation of multi-annual paleofire signals.

To investigate the effects of external forcing on bushfire activity over the last millennium, we applied linear mixed-effect regression to the PAH data, and also included monsoon rainfall (using oxygen isotope ratios from the same stalagmites), annual surface air temperature (using output from the CESM-Last Millennium Ensemble), antecedent fire (using the same stalagmite PAH record), and timing with respect to the arrival of European pastoralists (EP) and their cattle in the 1880s.

The model reveals significant differences prior to and following the arrival of EP. Most notably, prior to the arrival of EP, rainfall was significantly correlated with low and medium intensity fires, but not high intensity ones. After the arrival of EP, the correlation between rainfall and fire activity decreased markedly, and showed no statistically significant correlation to any fire intensity. Similarly, prior to the arrival of EP, antecedent fire activity (determined as the sum of PAH within the previous 5 years) was correlated with all levels of fire intensity, but after EP arrival, only high intensity fires are correlated with such antecedent burning. Our findings thus suggest that fire activity following the arrival of EP in the eastern Kimberley has been distinct from any other extended period of the last nine centuries.

How to cite: Denniston, R., Ondei, S., Argiriadis, E., Rowe, E., Bowman, D., Cugley, J., Woods, D., Kershaw, R., Lee, M., Schuchart, V., Carter, T., and Allen, K.: Pyrogenic Compounds in Tropical Australian Stalagmites Record Changes in Bushfire-Climate Relationships Coincident with the Arrival of European Pastoralists, EGU General Assembly 2025, Vienna, Austria, 27 Apr–2 May 2025, EGU25-1823, https://doi.org/10.5194/egusphere-egu25-1823, 2025.

EGU25-2611 | Posters on site | CL1.2.12

Increasing spring dryness accelerates transitions toward pyrogenic vegetation in eastern boreal North America 

Martin Girardin, Adam A Ali, Dorian Gaboriau, Jonathan Lesven, Cécile Remy, Victor Danneyrolles, Hugo Asselin, Etienne Boucher, Dominique Arseneault, Fabio Gennaretti, Pierre Grondin, Michelle Garneau, Gabriel Magnan, Sylvie Gauthier, Bianca Fréchette, and Yves Bergeron

Ongoing climate change is increasing vegetation flammability, intensifying fire activity in the boreal forests of eastern North America. This situation suggests a potential tipping point in fire regimes, raising critical questions about their impact on the biodiversity and structure of these ecosystems. To gain a deeper understanding of landscape dynamics and ongoing environmental changes, it is essential to understand how this climate, vegetation and fire linkages operate across various temporal and spatial scales. By integrating paleo-datasets (charcoal, pollen, chironomids, and testate amoebae) with model simulations of vapor pressure deficit (VPD) and plant-available soil water (ASW) over the past 8,000 years, we show that drier spring conditions over the last 3,000 years led to fewer but larger and more severe fire episodes, peaking within the last 250 years. This shift in fire regimes promoted an increase in fire-adapted conifer species, particularly Pinus banksiana, across the landscape. These findings challenge previous projections of increased dominance by thermophilous species under climate change scenarios and instead suggest an expansion of pyrophilous vegetation. Such ecological transitions are set to drive significant environmental and socio-economic consequences.

How to cite: Girardin, M., Ali, A. A., Gaboriau, D., Lesven, J., Remy, C., Danneyrolles, V., Asselin, H., Boucher, E., Arseneault, D., Gennaretti, F., Grondin, P., Garneau, M., Magnan, G., Gauthier, S., Fréchette, B., and Bergeron, Y.: Increasing spring dryness accelerates transitions toward pyrogenic vegetation in eastern boreal North America, EGU General Assembly 2025, Vienna, Austria, 27 Apr–2 May 2025, EGU25-2611, https://doi.org/10.5194/egusphere-egu25-2611, 2025.

EGU25-2651 | ECS | Orals | CL1.2.12

Afromontane Fire is a Novel, Transformative, and Human-driven Disturbance 

Andrea Mason, Eleanor Pereboom, James Russell, Sarah Ivory, Richard Vachula, Sloane Garelick, and Bob Nakileza

Tropical alpine environments are some of the most sensitive areas in the world to climate change. The effects of climate change are already apparent in African montane environments as glaciers have significantly retreated and recent droughts, fires, and floods have impacted local communities and ecosystems. The short duration of observational records limits our ability to test whether these disturbances result from natural climate variability or human activity. We used lake sediment cores spanning the last 12 ka from the Rwenzori Mountains, Uganda-D.R.C., to test relationships between fire regimes, vegetation, and climate at two distinct elevations. At mid-elevations, fire activity is suppressed during the warm, wet African Humid Period, but increases with drying and cooling over the late Holocene. At 2 ka, fire abruptly increases triggering a sudden shift to a grass dominated ecosystem, most likely as a result of human ignitions associated with the Iron Age in Africa. At high elevations, despite recent large-scale destructive fires, there is no evidence for local fire over the last 12 ka until the 21st century, implying that fire is novel disturbance in the afroalpine zone. Our results show humans, rather than climate, are a major driver of afromontane fire likely through their control on ignition and as result, changes in fire regimes can cause dramatic ecosystem transformation. Thus, the creation of management plans for these unique ecosystems which focus on prevention of human ignitions are critical for these unique ecosystems, especially in the context of future climate change.

How to cite: Mason, A., Pereboom, E., Russell, J., Ivory, S., Vachula, R., Garelick, S., and Nakileza, B.: Afromontane Fire is a Novel, Transformative, and Human-driven Disturbance, EGU General Assembly 2025, Vienna, Austria, 27 Apr–2 May 2025, EGU25-2651, https://doi.org/10.5194/egusphere-egu25-2651, 2025.

EGU25-5787 | ECS | Posters on site | CL1.2.12

Evaluating proxy-based vegetation reconstructions against model-based approaches: A case study from Europe during the late Last Glacial period 

Oliver A. Kern, Philipp Schlüter, Andreas Maier, and Nikki Vercauteren

In recent years, there have been considerable improvements in reconstructing past environments. However, the majority of studies focuses either on the Holocene period (ca. 12 ka BP until present) or the Last Glacial Maximum (LGM, ca. 21 ka BP). Since going further back in time encompasses additional challenges, we aim to assess the capabilities and robustness of methods that are currently in use to reconstruct the paleovegetation during the late Last Glacial period (ca. 60–20 ka BP). We compare four different methods of reconstructing past vegetation cover in Europe during the Last Glacial and highlight the strengths and limitations of each method: 1) The classical biomisation approach using fossil pollen data that assigns taxa into plant functional types (PFTs) and PFTs into biomes based on ecological traits and climatic preferences. 2) The REVEALS (Regional Vegetation Abundance from Large Sites) algorithm, which utilizes fossil pollen data in conjunction with taxon-specific parameters (e.g., relative pollen productivity) to estimate the regional plant cover. 3) The dominant biomes derived from the Biome4 global vegetation model using bioclimatic variables from a global climate model output (HadAMH3 and HadCM3). 4) A dedicated vegetation model that statistically reconstructs land-cover from the output of a global climate model (HadAMH3 and HadCM3) using the present climate-vegetation relationship and a CO2 correction factor. Our results show that all methods reconstruct a glacial vegetation dominated by open landscapes (e.g., tundra and steppes) and coniferous forests to various degrees. The existence of transient local patches of mixed and temperate forests is consistent with the general interpretation of glacial landscapes in Europe in the literature. However, regional and chronological discrepancies as well methodological challenges render it difficult to decipher which method most closely represents the actual paleovegetation. Nonetheless, exhausting qualitative and quantitative comparisons across different methods using different approaches allow us to limit the ecological range of the potential vegetation. Such a better comprehension of glacial environments has major implications for our understanding of human (Neanderthals and anatomically modern humans) and faunal population dynamics of in Europe, particularly in response to climatic transitions.

How to cite: Kern, O. A., Schlüter, P., Maier, A., and Vercauteren, N.: Evaluating proxy-based vegetation reconstructions against model-based approaches: A case study from Europe during the late Last Glacial period, EGU General Assembly 2025, Vienna, Austria, 27 Apr–2 May 2025, EGU25-5787, https://doi.org/10.5194/egusphere-egu25-5787, 2025.

To unravel which processes are responsible for changes in atmospheric CO2 the carbon isotopes are useful helpers widely applied in the past. This study helps to better understand long-term changes in 13C, which has also consequences for the interpretation of atmospheric δ13CO2 measured together with CO2 in ice cores. 

The 13C cycle of the Plio-Pleistocene, as recorded in δ13C of benthic foraminifera, has power in periodicities related to the long eccentricity cycle of 405-kyr that is missing in corresponding climate records (e.g. δ18O). Using a global carbon cycle model I show that the long eccentricity cycle in δ13C might have been caused by variations in the isotopic signature of geological sources, namely of the weathered carbonate rock (δ13Crock) or of volcanically released CO213Cv). This closure of the 13C cycle in these peridicities also explains the offset in atmospheric δ13CO2 seen between the penultimate and the last glacial maximum. The necessary isotopic signatures in δ13Crock or δ13Cv which align my simulations with reconstructions of the 13C cycle on orbital timscales have most power in the obliquity band (41-kyr) suggesting that land ice dynamics are the ultimate cause for these suggested variations. Since the Asian monsoon as reconstructed from speleothems has also an obliquity-related component it is possible that these proposed changes in weathering are indeed, at least partly, connected to the monsoon as previously suggested. Alternatively, the suggested impact of land ice or sea level on volcanic activity might also be influential for the 13C cycle. This indirect influence of ice sheets on the long eccentricity cycle in δ13C implies that these processes might not have been responsible for the 405-kyr periodicity found in ice-free times of the pre-Pliocene parts of the Cenozoic.

See preprint (https://doi.org/10.5194/cp-2024-63) for details.

How to cite: Köhler, P.: Closing the Plio-Pleistocene 13C cycle in the 405-kyr periodicity by isotopic signatures of geological sources , EGU General Assembly 2025, Vienna, Austria, 27 Apr–2 May 2025, EGU25-5934, https://doi.org/10.5194/egusphere-egu25-5934, 2025.

EGU25-6454 | ECS | Posters on site | CL1.2.12

Sustained deep-water formation in the Nordic Seas during Marine Isotope Stages 5 and 4 and implications for carbon storage in the North Atlantic 

Tim Stobbe, Henning Bauch, Daniel Frick, Jimin Yu, and Julia Gottschalk

Changes in the formation of North Atlantic Deep Water (NADW) and the expansion of southern-sourced waters in the Atlantic Ocean are linked to enhanced marine carbon storage during glacial and stadial periods, explaining late Pleistocene atmospheric CO2 variations. However, the role of deep-water formation in the Nordic Seas, a key NADW source, and its influence on Atlantic overturning remains unclear, especially after the last glacial maximum. In this study, we present high-resolution reconstructions of bottom water [CO32-] from Cibicidoides wuellerstorfi, along with stable isotopes and aragonitic pteropod abundances in marine sediment core PS1243 from the deep Norwegian Sea, to explore past deep-water dynamics and their impact on carbon cycling. Our data suggest continuous formation of dense, well-ventilated deep waters during Marine Isotope Stages 5 and 4, with a deepening of the aragonite compensation depth during the MIS 5b-to-4 transition. MIS 5e indicates resilience of Nordic Seas overturning in spite of a warmer North Atlantic and suggested summer Arctic sea ice reduction. A compilation of Atlantic [CO32-] records suggests that dense waters from the Nordic Seas expanded into the western North Atlantic, reducing its carbon storage capacity during MIS 4 and stadial MIS 5. Our study highlights differences in the sensitivity of Atlantic and Nordic Seas overturning to past climate conditions, with implications for the Atlantic's role in atmospheric CO2 variations.

How to cite: Stobbe, T., Bauch, H., Frick, D., Yu, J., and Gottschalk, J.: Sustained deep-water formation in the Nordic Seas during Marine Isotope Stages 5 and 4 and implications for carbon storage in the North Atlantic, EGU General Assembly 2025, Vienna, Austria, 27 Apr–2 May 2025, EGU25-6454, https://doi.org/10.5194/egusphere-egu25-6454, 2025.

EGU25-7116 | Posters on site | CL1.2.12

Radiocarbon ages of western Pacific intermediate waters during the past 25 kyrs: Implications for global carbon cycling 

Martina Hollstein, Markus Kienast, Gema Martínez-Méndez, Lowell Stott, Stephan Steinke, Ricardo De Pol-Holz, John Southon, and Mahyar Mohtadi

The rapid increase of atmospheric carbon dioxide (CO2) and the concurrent decline in Δ14C during the last deglaciation were mainly ascribed to the release of old, 14C-depleted CO2 from an abyssal ocean reservoir, specifically the Southern Ocean, or the deep Pacific Ocean via intermediate waters. In support of this hypothesis, several records from intermediate waters around the globe depict a drop in Δ14C during the deglaciation. However, other records closer to the source regions of intermediate waters do not depict this anomaly and thus, question the hypothesis. Alternative scenarios include the release of 14C-depleted CO2 by hydrothermal vents, volcanoes and pockmarks. An ideal region to test the hypothesized scenarios is the western equatorial Pacific Ocean (WEP), where intermediate waters of southern and northern origin converge.

We present paired planktic and benthic foraminiferal 14C ages from a depth transect (404 – 2210 m) of seven gravity cores from the WEP that cover the past 25 kyrs. Our records do not show any discernible Δ14C anomaly during the Last Glacial Maximum and initial deglaciation making the WEP an unlikely candidate for the release and ventilation of oceanic CO2 to the atmosphere. However, the intermediate-depth records consistently show anomalously low benthic Δ14C values during the final stage of the deglaciation and early Holocene. This Δ14C variability will be discussed in the context of potential sources and mechanisms.

How to cite: Hollstein, M., Kienast, M., Martínez-Méndez, G., Stott, L., Steinke, S., De Pol-Holz, R., Southon, J., and Mohtadi, M.: Radiocarbon ages of western Pacific intermediate waters during the past 25 kyrs: Implications for global carbon cycling, EGU General Assembly 2025, Vienna, Austria, 27 Apr–2 May 2025, EGU25-7116, https://doi.org/10.5194/egusphere-egu25-7116, 2025.

EGU25-8309 | ECS | Posters on site | CL1.2.12

Quantifying carbon burial on the Northwest Australian shelf: Connections with Late Pleistocene climatic patterns  

Arianna V. Del Gaudio, Or M. Bialik, Gerald Auer, and David De Vleeschouwer

The Pleistocene is characterized by substantial variations in ice volume and pronounced climatic oscillations. Over the last 1 million years, glacial-interglacial climate cycles are marked by increasing amplitude and by a pronounced decrease in pCO₂ levels during glacial intervals. The mechanisms driving this carbon cycle reorganization, and a full quantification of oceanic and sedimentary carbon sinks during glacials, remain unresolved. To address this question, we measure organic and inorganic δ13C, as well as the total organic carbon (TOC) to quantify export productivity and organic carbon burial changes on the NW Shelf of Australia.

Bulk carbonate sediments from IODP Expedition 356 Site U1460 (27°22′S, 112°55′E), collected at a water depth of 214.5 mbsf, are the focus of this study. This site, located on the outer North West Shelf of Australia, is influenced by the competition between the southward flowing oligotrophic Leeuwin Current and the colder norward flowing West Australian Current. During glacial intervals, the West Australian Current is dominant, facilitating enhanced productivity through wind driven upwelling. These dynamics suggest that the region could have acted as a significant organic carbon sink during Late Pleistocene glacials, with high rates of organic carbon accumulation on the western Australian shelf and continental slopes. Here, we present preliminary results from δ¹³C and TOC analyses spanning the last ~600,000 years. These data provide insights into the variability of organic carbon burial and its contribution to the global carbon cycle in the Mid- to Late Pleistocene, advancing our understanding of carbon storage mechanisms in response to climatic shifts.

How to cite: V. Del Gaudio, A., M. Bialik, O., Auer, G., and De Vleeschouwer, D.: Quantifying carbon burial on the Northwest Australian shelf: Connections with Late Pleistocene climatic patterns , EGU General Assembly 2025, Vienna, Austria, 27 Apr–2 May 2025, EGU25-8309, https://doi.org/10.5194/egusphere-egu25-8309, 2025.

EGU25-8406 | Orals | CL1.2.12

Southern Ocean contribution to glacial atmospheric CO2 decline across the mid-Pleistocene transition 

Julia Gottschalk, Adam P. Hasenfratz, Jennifer L. Middleton, Jesse R. Farmer, Elisabeth Michel, Chandranath Basak, Jean E. Hanley, Carol A. Knudson, Samuel L. Jaccard, Frank Lamy, and Gisela Winckler

The mid-Pleistocene transition (MPT) is arguably the most enigmatic long-term climate shift of the Quaternary and is characterized by increasingly severe glacial conditions about 1.2 to 0.6 million years ago. Although the MPT was suggested to be linked with a continuous lowering of glacial atmospheric CO2 (CO2,atm) levels, the processes underlying this CO2,atm decline are incompletely understood. Here we compare two new benthic foraminiferal (Cibicidoides/Cibicides sp.) δ13C records reflecting Circumpolar Deep Water (CDW), from central South Pacific International Ocean Discovery Program Site U1541 (54.2°S, 125.4°W, 3606 m water depth) and Southeast Atlantic Ocean Drilling Program Site 1094 (53.2°S, 05.1°E, 2807 m water depth), with similar records from the global ocean to identify possible reorganizations in the oceanic respired carbon pool over the past 2 million years that may explain CO2,atm changes across the MPT. We show a good agreement between lower CDW δ13C signatures in the central South Pacific and in the Southeast Atlantic, and a wide-spread glacial decline in CDW δ13C signatures across five Southern Ocean sites during the MPT. This points at a contribution from reduced glacial CDW ventilation and increased glacial respired carbon storage in the Southern Ocean to the glacial CO2,atm decline across the MPT. We also highlight an Atlantic-Pacific Southern Ocean-wide increase in the magnitude of deglacial CDW δ13C shifts during the MPT, which coincides with an amplitude increase in glacial-interglacial Antarctic Circumpolar Current flow strength variations (Lamy et al., 2024). This highlights that not only an increased Southern Ocean respired carbon storage might have driven CO2,atm variations across the MPT but also more efficient outgassing of that carbon during deglacial phases post-MPT. We will address potential linkages of glacial respired carbon storage and deglacial outgassing to changes in Antarctic ice sheet dynamics and southern hemisphere westerlies across the MPT.

References:
Lamy, F., Winckler, G., Arz, H., Farmer, J., Gottschalk, J., Lembke-Jene, L., Middleton, J.L., et al., 2024. Five million years of Antarctic Circumpolar Current strength variability. Nature 627, 789–796. doi: 10.1038/s41586-024-07143-3

How to cite: Gottschalk, J., Hasenfratz, A. P., Middleton, J. L., Farmer, J. R., Michel, E., Basak, C., Hanley, J. E., Knudson, C. A., Jaccard, S. L., Lamy, F., and Winckler, G.: Southern Ocean contribution to glacial atmospheric CO2 decline across the mid-Pleistocene transition, EGU General Assembly 2025, Vienna, Austria, 27 Apr–2 May 2025, EGU25-8406, https://doi.org/10.5194/egusphere-egu25-8406, 2025.

EGU25-8759 | Orals | CL1.2.12

Challenges and insights in comparing simulated tree cover changes over the last 20,000 years with reconstructions for the Northern Hemisphere 

Anne Dallmeyer, Laura Schild, Martin Claussen, Thomas Kleinen, and Ulrike Herzschuh

Pollen records are the most widespread archive for past climate and vegetation changes, offering valuable insights into Earth’s environmental history. These records provide a unique opportunity to evaluate Earth System Models. In recent years, the availability of quantitative plant cover reconstructions on a continental scale has increased, exemplified by the consistent dataset of REVEALS-based reconstructions provided by Schild et al. (2024) for the entire Northern Hemisphere.

We use this data set for comparison with the changes in tree cover simulated by the Max Planck Institute Earth System Model (MPI-ESM) for the last 20,000 years. While the overall agreement between model and data is promising, there are significant regional discrepancies. Notable differences emerge in boreal regions such as Alaska/Western Canada and Siberia, where the model predicts a delayed and weaker tree cover increase during the deglaciation. Conversely, in temperate forest-steppe transition zones, the model shows an earlier and stronger tree cover expansion, balancing out the Northern Hemispheric mean change.

However, systematic biases complicate the interpretation of this comparison. For instance, the model tends to simulate excessively cold conditions in boreal latitudes, while the reconstructions likely overestimate tree cover in these regions. As a result, the agreement in vegetation history remains uncertain leaving the comparison of absolute values between reconstructions and model results questionable. An EOF analysis highlights common modes of vegetation changes over the last 20,000 years in MPI-ESM and reconstructions, deepening our understanding despite these uncertainties.

References:  Schild, L., Ewald, P., Li, C., Hébert, R., Laepple, T., and Herzschuh, U.: LegacyVegetation 1.0: Global reconstruction of vegetation composition and forest cover from pollen archives of the last 50 ka, Earth Syst. Sci. Data Discuss. [preprint], https://doi.org/10.5194/essd-2023-486, in review, 2024

How to cite: Dallmeyer, A., Schild, L., Claussen, M., Kleinen, T., and Herzschuh, U.: Challenges and insights in comparing simulated tree cover changes over the last 20,000 years with reconstructions for the Northern Hemisphere, EGU General Assembly 2025, Vienna, Austria, 27 Apr–2 May 2025, EGU25-8759, https://doi.org/10.5194/egusphere-egu25-8759, 2025.

EGU25-10783 | Posters on site | CL1.2.12

Reconstruction of Post-Wildfire Soil Erosion Using Lake Archives (1975-2024): a French Mediterranean case study 

Romain Ducruet, Olivier Evrard, and Anthony Foucher

Wildfires are among the main disturbances affecting Mediterranean ecosystems. These extreme events significantly impact erosion dynamics over long periods and can affect environmental systems by causing excessive sediment transfers downstream. Traditional methods for studying soil erosion in post-wildfire contexts generally focus on short temporal scales, such as months or a few years after wildfire events. 

However, this temporal framework does not allow to capture the dynamics, trajectory, and resilience of erosion processes over a longer time scale (e.g. 20 years). In this context, the study of sedimentary archives provides a powerful resource for reconstructing the resilience of ecosystems to such disturbances.

This study is based on the analysis of sediment cores collected in a small reservoir draining the Peguière headwater catchment (Var, 0.18 km², south-east France), which was completely affected by a historic wildfire in 2003. These sediment cores were dated using natural and artificial radionuclides (210Pbxs, 137Cs), and their physical and chemical properties were characterized using a range of techniques, including high-resolution geochemical elemental analysis (XRF), tomography scanning, and the characterization of  organic matter properties.

Initial results show that this wildfire caused significant changes in geochemical properties of sediment. Certain elements, especially manganese, became more abundant during the post-fire period, which was also observed for radionuclides such as 137Cs. The post-fire period was also characterized by a change in the properties of organic matter and an acceleration of sediment inputs into the reservoir.

These post-fire processes affect the reservoir water quality and highlight the consequences of fire damage on long-term soil stabilization, plant cover and regeneration.

These retrospective and multi-proxy approaches provide a comprehensive understanding of the resilience of post-fire erosion dynamics. Understanding these processes over extended timescales will improve landscape management and the implementation of environmental protection measures to fight against the detrimental effects of wildfire on the degradation of soil and water resources.

How to cite: Ducruet, R., Evrard, O., and Foucher, A.: Reconstruction of Post-Wildfire Soil Erosion Using Lake Archives (1975-2024): a French Mediterranean case study, EGU General Assembly 2025, Vienna, Austria, 27 Apr–2 May 2025, EGU25-10783, https://doi.org/10.5194/egusphere-egu25-10783, 2025.

EGU25-12616 | Orals | CL1.2.12

Silicic acid leakage during Last Glacial Maximum and glacial termination 

Ying Ye, Peter Köhler, Martin Butzin, and Christoph Völker

Changes in the marine biological carbon pump during glacial times have been supposed to contribute to the glacial CO2 drawdown. One particular hypothesis that received attention during last two decades is the Silicic Acid Leakage Hypothesis (SALH), which proposed the Si leakage during glacial times from the Southern Ocean (SO) was transported towards lower latitudes and then contributed to enhanced biological productivity there and thus to global cooling by lowering atmospheric pCO2.

Thanks to the flexible stoichiometry (C:N:Si:Chl ratios) implemented in the biogeochemistry model REcoM (used with AWIESM2), we are able to study Si leakage based on changes in diatom physiology and its effect on nutrient supply to low-latitude surface waters. Our simulations show a significant increase of Si:N ratios in surface seawater in the SO and southern-sourced mode waters at Last Glacial Maximum (LGM) when compared to pre-industrial, confirming the first part of SALH. However, due to stronger stratification and weaker upwelling during LGM, these Si-enriched waters cannot be transported to the low-latitude surface to induce higher diatom growth, arguing against the second part of SALH but in agreement with reconstructions of marine opal accumulation rates. Instead, the simulation of the beginning of the glacial termination reveals that Si leakage during deglaciation drives a low-latitude productivity increase, supporting the more recent Silicic Acid Ventilation Hypothesis (SAVH). The effect of increased biological carbon uptake is more than compensated by intense CO2 outgassing through stronger ventilation, resulting in a rapid CO2 rise during deglaciation.

How to cite: Ye, Y., Köhler, P., Butzin, M., and Völker, C.: Silicic acid leakage during Last Glacial Maximum and glacial termination, EGU General Assembly 2025, Vienna, Austria, 27 Apr–2 May 2025, EGU25-12616, https://doi.org/10.5194/egusphere-egu25-12616, 2025.

EGU25-12867 | ECS | Posters on site | CL1.2.12

Carbonate counter pump strength and its impact on atmospheric pCO2 over the past 800 ka: evidence from Southern Ocean micropaleontological and geochemical data  

Nicolas Pige, Yu Wang, Stéphanie Duchamp-Alphonse, Sophie Sépulcre, Vishnu Thuruttath Unnikrishnan, Margaux Brandon, Amaëlle Landais, and Elisabeth Michel

During the glacial-interglacial transitions of the past 800 000 years (800 ka), commonly referred to as “glacial terminations”, atmospheric CO2 concentrations (pCO2) rose by 50-100 ppm. Biological productivity from the Southern Ocean (SO) significantly impacted these variations through changes in the Biological Carbon Pump strength, which includes the Soft Tissue Pump (STP) i.e., the net downward flux of phytoplanktonic organic carbon, and the Carbonate Counter Pump (CCP) i.e., the export of planktonic calcium carbonates increasing the surface-to-depth alkalinity gradient. Both modulate ocean-atmosphere exchanges as they respectively decrease and increase CO2 concentrations in the surface ocean and hence the atmosphere. Paleoclimate studies focusing on the SO highlight decreasing STP from the Subantarctic as a potential driver of increasing pCO2 during glacial terminations. A few studies have demonstrated the probable impact of CCP on pCO2 over specific glacial terminations (Duchamp-Alphonse et al., 2018; Brandon et al., 2022; Anderson et al., 2024) but very little is known about CCP patterns over the past 800 ka.  

This study aims to reconstruct changes in CCP strength over the past 800 ka and assess their impacts on pCO2. Following the exact same strategy as the one developed by Brandon et al., (2022), we performed micropaleontological (coccolith and foraminifera abundances and morphometrics) and geochemical analyses (CaCO3, CaXRF, d13CN. pachyderma, d18ON. pachyderma) on sediment core MD97-2115 (43°10,84S, 171°48,55W), retrieved in the Pacific sector of the Subantarctic Zone. Preliminary results show that the carbonate fine fraction (< 20µm) of the sediment is mainly composed of coccoliths (Emiliania huxleyi and Gephyrocapsa morphotypes; Coccolithus pelagicus; Calcidiscus leptoporus) and might be used as a CCP signal.  


Anderson, H. J. et al. Millennial-Scale Carbon Flux Variability in the Subantarctic Pacific During Marine Isotope Stage 3 (57–29 ka). Paleoceanography and Paleoclimatology 39, e2023PA004776 (2024).

Brandon, M. et al. Enhanced Carbonate Counter Pump and upwelling strengths in the Indian sector of the Southern Ocean during MIS 11. Quaternary Science Reviews 287, 107556 (2022).

Duchamp-Alphonse, S. et al. Enhanced ocean-atmosphere carbon partitioning via the carbonate counter pump during the last deglacial. Nature Communications 9, 1–10 (2018).

How to cite: Pige, N., Wang, Y., Duchamp-Alphonse, S., Sépulcre, S., Thuruttath Unnikrishnan, V., Brandon, M., Landais, A., and Michel, E.: Carbonate counter pump strength and its impact on atmospheric pCO2 over the past 800 ka: evidence from Southern Ocean micropaleontological and geochemical data , EGU General Assembly 2025, Vienna, Austria, 27 Apr–2 May 2025, EGU25-12867, https://doi.org/10.5194/egusphere-egu25-12867, 2025.

Understanding the roles of human land use and climate in shaping past fire regimes is key to predicting future landscape fires and informing effective management decisions. This is especially true for southeast Australia, which has some of the most flammable vegetation on the planet and faces the ongoing impacts of mega wildfires. There is also an ongoing debate on the need for a cultural approach to fire management. Using the Bass Strait Islands as a case study, this talk explores vegetation, fire regimes, Aboriginal land use, and climate change during the Holocene. It provides insights into how the interplay between cultural burning practices and climate influenced fire regimes and shaped the landscape, which has implications for effective future fire management in the region.

How to cite: Adeleye, M.: The impact of cultural burning and climate change on landscape fires, EGU General Assembly 2025, Vienna, Austria, 27 Apr–2 May 2025, EGU25-13287, https://doi.org/10.5194/egusphere-egu25-13287, 2025.

EGU25-13359 | Orals | CL1.2.12 | Highlight

Impact of Southern Ocean processes on atmospheric CO2 concentration 

Laurie Menviel, Paul Spence, Andrew Kiss, Matthew Chamberlain, Hakase Hayashida, Darryn Waugh, Matthew England, Himadri Saini, and Katrin Meissner

The Southern Ocean (SO) is believed to play a pivotal role in modulating atmospheric CO2 concentrations, both across glacial/interglacial cycles and during abrupt climate shifts. Previous studies using coarse-resolution Earth system models have suggested that stronger southern hemisphere westerly winds enhance the upwelling of deep waters, which in turn increases CO2 outgassing. However, mesoscale processes have a significant impact on Southern Ocean circulation. To better capture these dynamics, we assess the effects of changes in the position and strength of the southern hemisphere westerlies through a series of numerical simulations using the eddy-rich and eddy-permitting ocean, sea-ice, and carbon cycle model, ACCESS-OM2. Our results show that a 10% increase in southern hemispheric westerly wind stress leads to a 0.13 GtC/yr increase in Southern Ocean CO2 outgassing. We also find that a poleward shift of the SH westerlies enhances CO2 outgassing, with a sensitivity of 0.08 GtC/yr for a 5-degree poleward shift. 
We further compare the impact and timescale of the Southern Ocean carbon cycle changes driven by dynamic wind variations with those resulting from changes in Antarctic Bottom Water transport and iron fertilisation.

How to cite: Menviel, L., Spence, P., Kiss, A., Chamberlain, M., Hayashida, H., Waugh, D., England, M., Saini, H., and Meissner, K.: Impact of Southern Ocean processes on atmospheric CO2 concentration, EGU General Assembly 2025, Vienna, Austria, 27 Apr–2 May 2025, EGU25-13359, https://doi.org/10.5194/egusphere-egu25-13359, 2025.

EGU25-13361 | ECS | Posters on site | CL1.2.12

Interglacial climate, wildfire, and vegetation dynamics in southeastern Siberia over the last 580,000 years 

Jade Margerum, Julia Homann, Stuart Umbo, Maria Box, Gernot Nehrke, Jasper Wassenburg, Thorsten Hoffmann, Anton Vaks, Aleksandr Kononov, Alexander Osintsev, Alena Giesche, Andrew Mason, Franziska A. Lechleitner, Gideon M. Henderson, Ola Kwiecien, and Sebastian F.M. Breitenbach

Wildfires are a rapidly increasing threat to boreal forests. Our current understanding of the drivers behind wildfires and their environmental impact, while growing, is based mostly on data that is limited to the observational period. 

Our most crucial findings reveal that both the LIG and MIS 11 had levoglucosan levels more than double the average observed in other interglacials, indicating a high frequency of wildfire occurrence. Despite similarities in climatic background conditions and a shift from more hardwood (i.e., deciduous) forests to denser softwood-dominated (i.e., coniferous) forests toward the end of each interglacial, the wildfire behaviour differed significantly: both MIS 11 and the Last Interglacial exhibit overall high wildfire activity, but MIS 11 shows a declining trend in wildfires towards its end, while the Last Interglacial experiences a sharp increase in wildfire activity during its final stages. We hypothesise that consistently warmer, more humid conditions throughout MIS 11 allowed for emergence of stable forest ecosystems with a lower susceptibility to wildfires, resulting in lower wildfire vulnerability with declining temperatures closer to the end of the interglacial compared to the LIG. The LIG, especially towards the end, is characterised by shifts towards open forests composed of fire-prone species, which prompted increased wildfire activity additionally boosted by drier and cooler conditions.

Our reconstruction provides a framework for understanding long-term interactions between climate and biosphere. By linking interglacial wildfire dynamics with vegetation changes, we highlight how climatic variability modulates ecological resilience and fire susceptibility in boreal regions. This study offers insights into the potential responses of contemporary taiga ecosystems to ongoing anthropogenic climate change, where rising temperatures and shifting precipitation patterns alter biomes and may amplify fire activity.

How to cite: Margerum, J., Homann, J., Umbo, S., Box, M., Nehrke, G., Wassenburg, J., Hoffmann, T., Vaks, A., Kononov, A., Osintsev, A., Giesche, A., Mason, A., A. Lechleitner, F., M. Henderson, G., Kwiecien, O., and F.M. Breitenbach, S.: Interglacial climate, wildfire, and vegetation dynamics in southeastern Siberia over the last 580,000 years, EGU General Assembly 2025, Vienna, Austria, 27 Apr–2 May 2025, EGU25-13361, https://doi.org/10.5194/egusphere-egu25-13361, 2025.

The advent of large, open-access databases such as Neotoma has revolutionized the field of paleoecology, providing unprecedented opportunities to conduct large-scale analyses of past environmental change. These databases allow for the integration of thousands of fossil pollen records, enabling a more comprehensive understanding of spatial and temporal variability across ecosystems. By combining these data with advanced numerical methods and/or other proxies, we can refine our understanding of how past climatic changes influenced biodiversity. This integrated approach holds the potential to push paleoecology into exciting new directions, with implications for forecasting future climate and biodiversity changes.

Our work explores innovative uses of fossil pollen datasets, particularly large-scale compilations of Late Quaternary records, to investigate long-term vegetation dynamics and climate change. We apply novel spatio-temporal techniques to gain new insights into biodiversity change. This approach has enabled us to uncover global patterns of vegetation change and deepen our understanding of climate-vegetation interactions (Mottl et al. 2021a). By quantifying rates of ecological change (Mottl et al. 2021b), we demonstrated that vegetation rates of change began accelerating globally between three to four thousand years ago, and that recent rates of change now are even higher than those associated with the end of the last ice age. Our follow-up comparative study comparing our results with other proxies across the Amazon, provided a much-needed interdisciplinary framework to examine past environmental conditions in this region (Albert et al. 2023), showing that rates of change in both geological and paleoecological records are exceptionally high over recent geological times.

When handling such large, heterogeneous datasets (e.g., fossil pollen compilations) for advancing paleoecological research, reproducibility is essential. The integration of open-access databases like Neotoma into research workflows must be accompanied by rigorous, transparent procedures for data sourcing, cleaning, filtering, and analysis. The establishment of reproducible workflows ensures that the entire process, from dataset compilation to final analysis, is transparent, reliable, and accessible for future researchers. In all our work, we emphasize the importance of standardized data preparation and validation steps, using our newly developed FOSSILPOL workflow (Flantua et al. 2023; FOSSILPOL website). This not only facilitates the synthesis of complex datasets but also fosters interdisciplinary collaboration. By ensuring that the analysis of paleoecological data is fully reproducible, we can reduce biases, improve the quality of results, and build a robust foundation for further interdisciplinary climate and biodiversity studies.

REFERENCES

Albert, J. S. et al. (2023). Human impacts outpace natural processes in the Amazon. Science, 379(6630), eabo5003. 

Flantua et al. (2023). A guide to the processing and standardization of global palaeoecological data for large‐scale syntheses using fossil pollen. Global Ecology and Biogeography, 32(8), 1377–1394.

Fossilpol website: https://hope-uib-bio.github.io/FOSSILPOL-website/index.html

Mottl et al. (2021a). Global acceleration in rates of vegetation change over the past 18,000 years. Science, 372(6544), 860–864.

Mottl et al (2021b). Rate-of-change analysis in paleoecology revisited: A new approach. Review of Palaeobotany and Palynology, 293, 104483.


How to cite: Flantua, S., Mottl, O., and Felde, V.: Advancing understanding of past environmental dynamics: Reproducible analytical workflows with large-scale fossil pollen compilations, EGU General Assembly 2025, Vienna, Austria, 27 Apr–2 May 2025, EGU25-17582, https://doi.org/10.5194/egusphere-egu25-17582, 2025.

EGU25-20051 | Posters on site | CL1.2.12

Reconstructing Holocene Vegetation, Fire, and Climate Interactions in the Mediterranean Using Speleothem Archives 

Nicolò Ardenghi, Andrea Columbu, Rhawn Denniston, Giovanni Zanchetta, Ilaria Isola, and Elena Argiriadis

Understanding the long-term interactions among vegetation, fire, and climate is critical for interpreting ecosystem responses to climatic perturbations. Project Prometheus investigates Holocene paleofire dynamics, vegetation shifts, and climate variability in the Mediterranean, using speleothem records from caves in Italy (Alps, Apennines, Sardinia) and the Balkans. By integrating multiple proxies, including polycyclic aromatic hydrocarbons (PAHs) as fire markers and n-alkanes as a proxy for vegetation composition and terrigenous input, this project aims to provide insights into the environmental drivers of fire activity from millennial to sub-centennial timescales, thus creating a high resolution fire history for the Mediterranean region.

Speleothems offer a novel paleoenvironmental archive, and we apply an advanced hydrocarbon extraction protocol adapted from a study on Australian stalagmites1. This method, which includes slow acid dissolution in a clean-room setting to minimize contamination and maximize compound yields, has significantly improved the detection limits and expanded the range of PAHs identified2. Uranium-thorium (U-Th) dating ensures a precise chronological framework, enabling robust correlation between fire, vegetation, and climate proxies.

Here we present results from the initial phase of the project, analyizing a dozen archives from Italy, Greece, and Northern Macedonia, at low resolution (millennial- and sub-millennial-scale). Preliminary results, will provide a first indication of technique effectiveness, archive quality, and regional historical variations (if any) in paleofire regimes. Comparative studies with paleofire data from lake sediments in Italy, where shifts in fire regimes have been previously documented, as well as with modern fire data derived from registries and satellite observations, will help contextualizing our findings within broader regional fire histories.

This research advances our understanding of vegetation-wildfire-climate interactions in the Mediterranean by contributing high-resolution, multi-proxy reconstructions from an understudied archive. By linking past fire and vegetation responses to climatic variability, it provides critical context for assessing future ecosystem resilience and informing land management policies under changing climate conditions.

How to cite: Ardenghi, N., Columbu, A., Denniston, R., Zanchetta, G., Isola, I., and Argiriadis, E.: Reconstructing Holocene Vegetation, Fire, and Climate Interactions in the Mediterranean Using Speleothem Archives, EGU General Assembly 2025, Vienna, Austria, 27 Apr–2 May 2025, EGU25-20051, https://doi.org/10.5194/egusphere-egu25-20051, 2025.

EGU25-896 | ECS | Posters on site | CL1.2.3

A Multiproxy Approach to study Vegetation and Temperature Changes since the Last Glacial in Central Vietnam. 

Chloe Snowling, Annabel Wolf, Sebastian F M Breitenbach, James Bendle, Alfredo Martínez-García, Johanna Schäfer, David McGee, Adam B Jost, Deb Limbert, and Vasile Ersek

Speleothems are invaluable archives of past climate variability and offer important insights into monsoon dynamics across Southeast Asia. Different isotope systems have been employed to characterise autumn monsoon in this region, but multiple influencing factors render the interpretation of isotope proxy records ambiguous. To gain novel insights into regional vegetation and temperature changes, novel proxies are required. Here, we combine traditional speleothem stable isotopes (δ¹⁸O and δ¹³C) with speleothem thermometry (TEX86) and lignin oxidation products (LOP) analyses, to provide a more comprehensive understanding of past environmental changes in Central Vietnam. Specifically, we aim to:

1. Reconstruct cave air temperature variations using TEX86.

2. Assess vegetation and environmental changes through LOP analysis.

3. Evaluate the response of these proxies to known climate forcing mechanisms, including Northern Hemisphere summer insolation, sea surface temperature anomalies, and shifts in the Intertropical Convergence Zone.

A stalagmite record from Central Vietnam, spanning the last glacial and onset of the Holocene (35 – 10 ka BP), provides a unique opportunity to reconstruct glacial to Holocene temperature changes and the response of regional hydroclimate and vegetation. Preliminary TEX86 results suggest a temperature shift of at least 2°C from fully glacial to Holocene conditions. LOP results suggest that the vegetation in Central Vietnam changed from hardwood deciduous vegetation types (0.37 S/V, 0.33 C/V) to an increase in softwood vegetation types (0.1 S/V, 0.11 C/V), respectively.  Our findings have implications beyond Southeast Asia's paleoclimate. Validating these novel biomarker systems (TEX86 and LOP) against more traditional stable isotope ratios (δ¹⁸O and δ¹³C), we aim to elucidate changes in moisture budget and sources, and seasonality.

How to cite: Snowling, C., Wolf, A., Breitenbach, S. F. M., Bendle, J., Martínez-García, A., Schäfer, J., McGee, D., Jost, A. B., Limbert, D., and Ersek, V.: A Multiproxy Approach to study Vegetation and Temperature Changes since the Last Glacial in Central Vietnam., EGU General Assembly 2025, Vienna, Austria, 27 Apr–2 May 2025, EGU25-896, https://doi.org/10.5194/egusphere-egu25-896, 2025.

The caves of the eastern part of the Yorkshire Dales karst in northern England have received little scientific attention as compared to the classic karst of the Three Peaks area to the west. This is especially true of the valley of Nidderdale, which has no through road, and as much of the area was purchased in the nineteenth century in order to provide water for the growing city of Bradford has been relatively little visited. The Manchester Hole/Goyden Pot/Nidd Heads cave system has developed beneath a cover of clastic strata with only very limited outcrop of limestone occurring in the valley bottom. U-series dates from Goyden Pot show cave development occurred prior to Marine Isotope Stage 3. The presence of detrital thorium, in the speleothem samples, probably due to the nature of the catchment, limits precision however; this study confirms there is a long history of cave development in the area.

The curious nature of the speleothem in the system has been commented upon since the earliest days of cave exploration. They appear to be undergoing re-dissolution because of the chemically aggressive nature of the water in the valley although one early explorer made an alternative suggestion of it being due to animal wastes leaking in from the farm above. The chemically aggressive nature of the water may also account, at least in part, for the very large passage size in the system – being some of the largest stream passage development in the region. Such a situation of very chemically aggressive waters entering the limestone aquifer at discrete points where the limestone was first exposed due to valley incision may account for the very large size of some of the relict passage fragments found at very high altitudes within the Great Scar Limestone of the Yorkshire karst. 

How to cite: Murphy, P.: U-series and Urine – understanding cave development in Nidderdale, North Yorkshire, UK, EGU General Assembly 2025, Vienna, Austria, 27 Apr–2 May 2025, EGU25-1116, https://doi.org/10.5194/egusphere-egu25-1116, 2025.

EGU25-5196 | ECS | Orals | CL1.2.3

Late Holocene climate variability and cultural transitions in the southeastern Iberian Peninsula recorded by speleothems 

Elvira Ruíz-Caballero, Fernando Gázquez, Andrea Columbu, Ángel Fernández-Cortés, Eneko Iriarte, Hu Hsun-Ming, Shen Chuan-Chou, Giovanni Zanchetta, and José María Calaforra

Speleothems serve as valuable archives for paleoclimate reconstructions; however, high-resolution stalagmite records from the southern Iberian Peninsula remain limited. We investigate two stalagmites from Larga Cave (Sierra de los Filabres range, Almería, 1980 m a.s.l.) using geochronology (U-Th dating), stable isotope analysis (δ¹⁸O and δ¹³C), trace element composition, micromorphology, and petrography. Additionally, environmental monitoring of the cave and modern calcite farming on glass substrates have been ongoing since November 2022, to obtain a better understanding of the cave's ventilation dynamics and how the climatic signal is recorded in the speleothems.

The ages of stalagmites CL-1 and CL-3 span from approximately 5,000 to 1,000 years BP, encompassing the late phase of the Los Millares culture and the rise and fall of the El Argar civilization in southeastern Iberia. Stalagmite CL-1 contains fragments of macroscopic endolithic charcoal, which have also been identified at various locations within the cave. Radiocarbon dating of this charcoal indicates an age of 3,900 calibrated years BP, suggesting that the cave was occupied either permanently or temporarily during the Early to Middle Bronze Age.

The decline of the El Argar civilization appears to coincide with a relatively drier period, as indicated by shifts in δ¹⁸O and δ¹³C values. This stage is further characterized by successive speleothem layers exhibiting retraction patterns, typically associated with reduced drip rates. Further geochemical analyses of these and other speleothems from Larga Cave will provide deeper insights into the extent to which ancient civilizations in southeastern Iberia were influenced by climatic conditions.

How to cite: Ruíz-Caballero, E., Gázquez, F., Columbu, A., Fernández-Cortés, Á., Iriarte, E., Hsun-Ming, H., Chuan-Chou, S., Zanchetta, G., and Calaforra, J. M.: Late Holocene climate variability and cultural transitions in the southeastern Iberian Peninsula recorded by speleothems, EGU General Assembly 2025, Vienna, Austria, 27 Apr–2 May 2025, EGU25-5196, https://doi.org/10.5194/egusphere-egu25-5196, 2025.

EGU25-7077 | ECS | Posters on site | CL1.2.3

Cavern pearls of the Lluis Auroux's Collection: geochemical and mineralogical characterization on caves from the Geoparc Orígens (Catalan Pyrenees) 

Mercè Cisneros, Jordi Ibáñez-Insa, Josep Roqué, Abigail Jiménez, Soledad Álvarez, Lluís Auroux, and Santiago Giralt

The unequivocal global warming of the climate system and the clear influence of human activities underscore the urgency of addressing the current challenge of Earth's warming. Not only many ecosystems but the whole Earth System is being affected, and in some cases, knowledge about the impact of climate change remains limited. A good example of this are the cave pearls, which are highly interesting due to their particular geochemical fingerprint and also from the perspective of natural heritage.

The mountain regions of the Catalan Pyrenees are experiencing more pronounced temperature increases than the rest of the territory, which intensifies the impacts of climate change in this area. Regarding precipitation, and as is the case throughout the rest of Catalonia, all projections seem to indicate a significant reduction in the annual number of days with light precipitation (20 fewer days) and an increase in the maximum duration of dry spells (20 more days). In this context, one might wonder how this 'new hydroclimatic variability' is altering the environmental conditions of karst cavities. Frequent observations by speleologists reveal a widespread trend toward drier conditions inside caves. More intense droughts could lead to a reduction in the water level of the gours where the pearls grow, a reduction that could significantly hinder their growth.

Cave pearls, technically known as pisolites or oolites depending on their size, represent a type of speleothem growth that is much less known than stalagmites and stalactites. They form rare, difficult-to-find deposits that are still poorly studied and are located on the floors of certain underground cavities. Unlike other stone formations, they are not attached to the rock due to the vibration of the water in the basin where they are found, a vibration caused by the dripping that sustains it. These are complex processes, highly sensitive to environmental variations. As such, they present a potential vulnerability, yet still unknown, to situations arising from the current climate emergency, drought, and human access. The scientific understanding of this heritage (particularly as a record of climate change) and its dissemination must contribute to preserving them from the current irreversible damage and mass spoliation.

This study aims to carry out a geochemical and mineralogical characterization of cave pearls from 15 cavities located within the Orígens Geopark, in the Catalan Pyrennes (NE Spain). The cavities are made of different lithologies (limestones, conglomerates, and sandstones) and include various geomorphological units. The methodology incorporates elemental and mineralogical analyses at both macro and micro scales using XRF, SEM-EDS, XRD, and Raman Spectroscopy, alongside crystallography, X-ray tomography, and advanced 3D imaging techniques. Innovative approaches to imaging and microanalysis will also be utilized.

Our data and analysis show the high richness and geochemical variability of cave pearls in the Orígens Geopark, with high potential to extract useful information about the impact of climate change on karstic systems.

How to cite: Cisneros, M., Ibáñez-Insa, J., Roqué, J., Jiménez, A., Álvarez, S., Auroux, L., and Giralt, S.: Cavern pearls of the Lluis Auroux's Collection: geochemical and mineralogical characterization on caves from the Geoparc Orígens (Catalan Pyrenees), EGU General Assembly 2025, Vienna, Austria, 27 Apr–2 May 2025, EGU25-7077, https://doi.org/10.5194/egusphere-egu25-7077, 2025.

We present a high–resolution record of unstable hydro-climate conditions in the last interglacial MIS5e (~131-116 ka) in the southern Levant by analyzing the simultaneous behavior of Sr, C, and O isotopes in a stalagmite from the Har Nof cave in Jerusalem, Israel [1]. These data are compared and integrated with data from other surrounding speleothems and the contemporaneous charcoal, fungal spores, and pollen data retrieved from the ICDP Dead Sea deep drill core.

The following environmental patterns are observed during MIS5e:

  • During early MIS5e (~131-125 ka) on the rising flank of the northern hemisphere (33 N and 65 N) insolation curves, Jerusalem and the Judea Hills were experiencing a moderate Mediterranean-like climate. Desert dust accumulated in the vicinity of the cave. Salt deposition was occurring in the Dead Sea basin.
  • Approaching the peak northern hemisphere insolation, and during the interval of peak insolation and Sapropel event S5 (127.5-122 ka), temperatures rose and rains arrived to the region from both Mediterranean and tropical sources. The end of this period was characterized by widespread fires, loss of C3 vegetation, fungal proliferation, and complete soil removal from hill-slopes. Savannah-like C4 grasses penetrated to soil-accumulation sites in the valleys. The main rainfall season appears to have shifted from winter to summer.
  • At 122-120.5 ka, high 87Sr/86Sr ratios indicate contributions of sea salts. Extremely high δ13C values indicate no vegetation above the cave, suggesting an arid environment.
  • At 5-118 ka, on the declining flank of the insolation curve, the area was under unstable conditions with occasional storms, and high-intensity rainfall accompanied by sea salt. Soil was formed and savannah-like C4 vegetation developed.
  • At ~118-116 ka, the sedimentation rate of Har Nof AF12 stalagmite is extremely low. The region was characterized by arid conditions and major salt deposition was occurring in the Dead Sea. Still, occasional floods reached the Dead Sea with some moisture coming mainly from southern sources.

This detailed record of environmental changes shows that the northward expansion of climatic belts over the southern Levant during MIS5e caused dramatic environmental changes, crossing a tipping point threshold, and was associated with a major ecologic disruption. Such abrupt changes are characterized by nonlinear, threshold-type responses at rates that are large relative to background variability and forcing.

The evidence from the caves and Dead Sea sediments presented here for the MIS5e period suggests that global warming can be associated with periods of increased instability in the south Levant, an area lying at the desert fringe. The tipping point threshold manifested in MIS 5e of the Levant include complete loss of vegetation and soil, devastating fires and a shift of precipitation from winter to summer. These extreme events send a warning message that elevated greenhouse gases may increase desertification and instability of Levant climate.

[1] Frumkin, A., Stein, M. and Goldstein, S.L., Palaeogeography, Palaeoclimatology, Palaeoecology 586, 110761, 2022. 

How to cite: Frumkin, A. and Stein, M.: The last interglacial (MIS5e) in Jerusalem, Israel from speleothem Sr, C and O isotopes , EGU General Assembly 2025, Vienna, Austria, 27 Apr–2 May 2025, EGU25-7795, https://doi.org/10.5194/egusphere-egu25-7795, 2025.

EGU25-8705 | Posters on site | CL1.2.3

Hydroclimate Variations in Southeastern China During the Last Glacial Period: Insights from Multi-Proxy Stalagmite Records 

Miaomiao Wang, Haiwei Zhang, Xiaomei Zhang, and Hai Cheng

During the Last Glacial Period, millennial-scale abrupt climate events were closely linked to the weakening of the Atlantic Meridional Overturning Circulation (AMOC). This weakening is also significantly associated with the increasing frequency of modern extreme climate events in the context of global warming. However, geological records detailing regional climate responses in southeastern China during these events, particularly the Heinrich cold events, remain limited. In this study, we analyze climate characteristics during the Heinrich Stadials (HS1-HS4) using multiple proxies from the stalagmite YXG01, which was collected from Yindi Cave in Huangshi City, Hubei Province (located in the lower reaches of the Yangtze River). The proxies include δ¹³C, δ¹⁸O, Mg/Ca, Sr/Ca, and Ba/Ca, and the dating spans from 47.47 to 11.92 ka BP. Our results show that during HS1-HS4, δ¹⁸O values in the stalagmite exhibit significant positive excursions, indicating a weakening of the East Asian summer monsoon (EASM). In contrast, δ¹³C, Mg/Ca, Sr/Ca, and Ba/Ca ratios show negative excursions. Furthermore, stalagmite growth rates significantly increased during these stadials, reflecting more favorable hydroclimatic conditions. On the orbital timescale, our δ¹⁸O variations also show inverse relationships with δ¹³C, Mg/Ca, Sr/Ca, and Ba/Ca ratios, suggesting that the stalagmite δ¹⁸O variations are anticorrelated with changes in rainfall in southeastern China. These findings support the hypothesis of a "tripole precipitation pattern" in monsoonal China, where stronger EASM periods correspond to more precipitation in North and South China and less in Central-East China, while weaker EASM periods show the opposite pattern. Nevertheless, during the Last Glacial Period, both on the orbital timescale and during Heinrich Stadials (HSs), the robustness of the tripole precipitation pattern in monsoonal China still needs to be further validated through the use of well-dated and reliable precipitation proxies.

How to cite: Wang, M., Zhang, H., Zhang, X., and Cheng, H.: Hydroclimate Variations in Southeastern China During the Last Glacial Period: Insights from Multi-Proxy Stalagmite Records, EGU General Assembly 2025, Vienna, Austria, 27 Apr–2 May 2025, EGU25-8705, https://doi.org/10.5194/egusphere-egu25-8705, 2025.

EGU25-8706 | Posters on site | CL1.2.3

The 2.8 ka abrupt climate event in East Asian Monsoon region: High-resolution stalagmite records from southern China 

Xiaomei Zhang, Haiwei Zhang, Miaomiao Wang, and Hai Cheng

Using 15 230Th dating of a stalagmite (SN33) from Shennong Cave, Jiangxi Province, southeastern China, along with 140 δ18O results, we reconstructed the evolution of the East Asian Summer Monsoon (EASM) during the Late Holocene between 3.2 and 2.5 ka B.P., with an average resolution of 4 yrs. During this interval, a pronounced positive δ18O excursion was observed between 2.97 and 2.68 ka B.P., marking the occurrence of the 2.8 ka weak monsoon event in southeastern China. This event began at 2965 ± 13 a B.P. and ended at 2677 ± 47 a B.P., characterized by an asymmetric "double-plunging" structure. Through centennial-scale variations in δ13C, trace elements, δ234U, and growth rate of stalagmite SN33, we infer that southeastern China was in a wetter state during 2.8 ka event. Comparison with other geological records further supports that, while southeastern China indeed experienced humid conditions during this period, other regions were in a state of drought. The 2.8 ka B.P. climatic anomaly had profound impacts on agriculture, population migration, and cultural transitions in the East Asian monsoon region. In China, populations migrated to the warmer and more humid region in southeastern of lower reaches of the Yangtze River Valley (YRV), facilitating the development of agriculture and culture in this region. Meanwhile, the collapse of the Zhou Dynasty in China and the decline of the Songguk-ri culture in Korea were also responses to the cooler and drier climate conditions during the 2.8 ka event.This precipitation pattern may have been influenced by a strengthened westerly jet stream and the Western Pacific Subtropical High (WPSH) during 2.8 ka B.P..  The internal dynamics and transitional characteristics between the 2.8 ka and 8.2 ka events suggest that both weak monsoon events in the Holocene may have been driven by a common mechanism, likely associated with a weakening of the Atlantic Meridional Overturning Circulation (AMOC). Additionally, the significant decline in solar activity during the latter phase of the 2.8 ka event indicates that centennial-scale variations in East Asian monsoon circulation were likely co-driven by solar activity and high-latitude climatic changes in the Northern Hemisphere.

How to cite: Zhang, X., Zhang, H., Wang, M., and Cheng, H.: The 2.8 ka abrupt climate event in East Asian Monsoon region: High-resolution stalagmite records from southern China, EGU General Assembly 2025, Vienna, Austria, 27 Apr–2 May 2025, EGU25-8706, https://doi.org/10.5194/egusphere-egu25-8706, 2025.

EGU25-8924 | ECS | Orals | CL1.2.3

Palaeoclimate reconstruction using high-resolution proxy data from Holocene stalagmites from the Kingdom of Tonga 

Hesam Zareh Parvar Ghoochani Nejad, Andrea Borsato, Danielle Verdon-Kidd, Silvia Frisia, Dan Sinclair, Pauline C. Treble, Hai Cheng, and Russell Drysdale

Insufficient palaeoclimate data from the South Pacific lead to conflicting theories regarding the region's responses to Holocene climate fluctuations. To address this gap in knowledge we present preliminary results from five stalagmites collected from two different caves in the Kingdom of Tonga.

Despite their vicinity, Ana Hulu (on Tongatapu Island) and Ana Maui (on ‘Eua Island) caves differ significantly in their microclimatic settings. Ana Hulu is a warm (24.2 °C) and shallow coastal cave, whereas Ana Maui is a deep and relatively cooler cave opening deep in the forest at 188 m above sea level. These differences are likely underpinned in the formation of the well-laminated and coloured stalagmites retrieved from Ana Hulu and the colourless, faint-laminated stalagmites from Ana Maui.

The set of U-series dated stalagmites provides an almost continuous record spanning the entire Holocene up to the end of the Younger Dryas (ca. 12,500 years ago). The stalagmites show different growth rates varying from 50 to 300 µm/year. The high-resolution chronology can offer the potential for annually resolved records of infiltration (rainfall) variability, which are likely to be related to shifts of the South Pacific Convergence Zone (SPCZ), the most important tropical South Pacific cloud belt..

However, an interpretation of SPCZ shifts based solely on speleothem δ13C and δ18O values is challenging. The potential influence of enhanced evaporation and degassing effects, which may arise from warm temperatures and low cave air pCO2, must be accounted for. A multi-proxy approach on coeval stalagmites has been shown to provide critical information about the role of local hydrology. Thus, we combined the stable isotope ratios values time-series with petrographic observations, high-resolution LA-ICP-MS trace elements data, and synchrotron-radiation XRF elemental mapping. This multi-proxy approach, along with an assessment of crystallization pathways leading to fabrics, is expected to enable robust reconstructions of coeval changes in infiltration regimes and hydroclimate dynamics across the South Pacific.

How to cite: Zareh Parvar Ghoochani Nejad, H., Borsato, A., Verdon-Kidd, D., Frisia, S., Sinclair, D., C. Treble, P., Cheng, H., and Drysdale, R.: Palaeoclimate reconstruction using high-resolution proxy data from Holocene stalagmites from the Kingdom of Tonga, EGU General Assembly 2025, Vienna, Austria, 27 Apr–2 May 2025, EGU25-8924, https://doi.org/10.5194/egusphere-egu25-8924, 2025.

EGU25-9236 | Orals | CL1.2.3

Absolute paleotemperatures during the Laschamps geomagnetic excursion 

Eric Font, Stéphane Affolter, Elisa Sanchez-Moreno, Yusuke Yokoyama, Claude Hillaire-Marcel, and Dominik Fleitmann

The link between geomagnetic excursions and climate is an exciting but still unresolved topic. The idea reposes on the increased solar and cosmic ray radiation in response to the weakened magnetic field during the transitional fields accompanying a geomagnetic reversal or excursion. However, a direct climate response to the variations of the Earth magnetic field is not yet demonstrated in the geological record. A major limitation resides in the fact that paleomagnetic data are usually extracted from igneous or sedimentary rocks, which usually provide no or poor-quality paleoclimate information. Recent advances in speleothem magnetism fill this gap and open a new door to investigate the link between climate and the variation of the Earth magnetic field in the same geological archive. Here we document absolute paleotemperatures based on water isotopes in fluid inclusions from a Portuguese stalagmite that recorded the Laschamps geomagnetic excursion (~42 kyrs). The stalagmite was dated by radiocarbon method. Paleomagnetic data show the complete record of the Laschamps geomagnetic excursion, with paleomagnetic poles moving from the north pole down to the south pole and returning to the original position in ~3000 kyrs. Paleointensity data show a weakened magnetic field associated with the migration of the paleomagnetic pole. Absolute paleotemperatures were calculated using the fluid inclusion hydrogen isotope (d2H) and the calcite-water isotope fractionation paleothermometer on 19 samples encompassing the Laschamps event. The data show increased absolute temperatures just before and during the Laschamps. However, a strong correlation is noted between the absolute temperature calculated here and the oxygen isotope composition of the NGRIP ice core. Although the relation between paleotemperatures and the Laschamps event is not yet fully demonstrated in this case, the combination of paleomagnetic techniques coupled to isotope composition in speleothems offers new and promising perspectives to investigate the relationship between climate and the Earth magnetic field.


This project is funded by Portuguese Fundação para a Ciência e Tecnologia, FCT, I.P./MCTES through national funds (PIDDAC): UID/50019/2025, UIDB/50019/2020 (https://doi.org/10.54499/UIDB/50019/2020), LA/P/0068/2020 (https://doi.org/10.54499/LA/P/0068/2020), and PTDC/CTA-GEO/0125/2021.

How to cite: Font, E., Affolter, S., Sanchez-Moreno, E., Yokoyama, Y., Hillaire-Marcel, C., and Fleitmann, D.: Absolute paleotemperatures during the Laschamps geomagnetic excursion, EGU General Assembly 2025, Vienna, Austria, 27 Apr–2 May 2025, EGU25-9236, https://doi.org/10.5194/egusphere-egu25-9236, 2025.

EGU25-10612 | ECS | Orals | CL1.2.3

Calibration of stalagmite trace elements with instrumental rainfall record from the Australian tropics 

Andrei Munteanu, Marco Roman, Mara Bortolini, Elena Argiriadis, and Rhawn F. Denniston

Stalagmites serve as valuable archives that significantly enhance our understanding of past climate and environmental changes. The trace element records preserved within stalagmites have been used to reconstruct past rainfall patterns at regional scale [1]. However, interpreting these geochemical proxies is challenging, as the functioning of the cave system, within its specific climatological and geological context, must be taken into account. Comparing instrumental climate measurements with these proxies from stalagmites that grew during the 20th century provides an opportunity to investigate how stalagmite geochemistry responds to variations in rainfall.

In this study, we present results from a stalagmite collected from cave KNI-51, located in the Kimberley region of northeast Western Australia. Previous uranium–thorium disequilibrium dating of the stalagmite has yielded a high-precision age model (2 sd errors of ±1–2 years over much of the last century) and revealed rapid growth (1–2 mm/yr) [2], allowing for nearly annual resolution of geochemical records. We examined trace element variations related to historical annual rainfall fluctuations, retrieved from five stations near the cave area between 1915 and 2007. Comprehensive statistical analyses, accounting for stationarity and autocorrelation in the time series data, revealed significant correlations when comparing certain trace elements to both total annual rainfall and the rainfall recorded during the monsoon season (December to March). Notably, some trace elements exhibited a stronger response to rainfall occurring during the monsoon period. Furthermore, we applied rolling window correlation to assess the evolution and stability of these correlations over time, identifying intervals where the relationship between the time series appeared weaker or stronger.

The multi-annual calibration provided critical insights into how the stalagmite recorded rainfall variability through trace elements fluctuations and represents a key step in defining the response times of the cave and stalagmite "recording systems" to changes in climate and water balance in the Kimberley region. The disclosed correspondence between the instrumental rainfall record and the trace element signals encoded in the stalagmite demonstrates that rainfall time series can be successfully reconstructed from stalagmites. This marks an important milestone in the development of a calibrated trace element–rainfall transfer function, which can be applied to past stalagmite geochemical records.

[1]         S. F. Warken et al., “Reconstruction of late Holocene autumn/winter precipitation variability in SW Romania from a high-resolution speleothem trace element record,” Earth Planet. Sci. Lett., vol. 499, pp. 122–133, 2018, doi: https://doi.org/10.1016/j.epsl.2018.07.027.

[2]         R. F. Denniston et al., “Expansion and contraction of the indo-pacific tropical rain belt over the last three millennia,” Sci. Rep., vol. 6, pp. 1–9, 2016, doi: 10.1038/srep34485.

How to cite: Munteanu, A., Roman, M., Bortolini, M., Argiriadis, E., and Denniston, R. F.: Calibration of stalagmite trace elements with instrumental rainfall record from the Australian tropics, EGU General Assembly 2025, Vienna, Austria, 27 Apr–2 May 2025, EGU25-10612, https://doi.org/10.5194/egusphere-egu25-10612, 2025.

EGU25-11210 | ECS | Posters on site | CL1.2.3

A seasonally resolved late Holocene paleoclimate record from Sofular Cave, Northern Türkiye. 

Alice Paine, Frederick Held, Hai Cheng, and Dominik Fleitmann

Understanding how climate change manifests across the Mediterranean basin is critical for predicting the impacts of future climate change. The Black Sea region (BSR) is one of the most vulnerable areas of the Mediterranean climate change hotspot, owing to its high sensitivity to both local and global-scale climate feedbacks1. However, few paleoclimate records exist with sufficient resolution, and length, to fully assess significance of these feedbacks on timescales exceeding the window of instrumental observation2. Here, we present a ~230-year-long, seasonally-resolved stable isotope record record of effective moisture and temperature variability from stalagmite So-11, which grew in Sofular Cave (Northern Türkiye) between 1779 and 2008 CE. The sample contains 229 continuous, well-developed laminae couplets with a mean wavelength of ~0.95 mm a-1, suggesting that each dark-to-light couplet corresponds to one calendar year. This assumption is supported by two U-Th ages, which show good agreement with the layer-counted chronology generated using the date of collection (2008 CE) as an upper anchor point. Minima in δ13C closely track the dense, dark, compact calcite layers, and are typically followed by a distinct δ13C peak in conjunction with formation of white, porous calcite layers. We interpret these oscillations as seasonal changes in effective moisture, with the lowest δ13C values corresponding to high drip rates, lower CO2 degassing, and weaker fractionation during winter months – reflecting the high responsivity of the Sofular Cave system to transient changes in local precipitation3,4. Marked changes in the geochemistry of So-11 also coincide with the Little Ice Age (1850 to 1870 CE), and the progressive increase in global atmospheric CO2 in response to increased fossil fuel combustion during the 20th and 21st centuries5. Our results underscore how high-resolution, speleothem-based paleoclimate reconstructions can provide important context not only for constraint of global circulation model (GCM) simulations, but also closer examination of human-climate-environment interactions during the Late Holocene. 

~~

1Giorgi, F. (2006) Geophysical Research Letters 33(8):  L08707
2Burstyn, Y. et al. (2019) Quaternary 2:16
3Göktürk et al. (2011) Quaternary Science Reviews 30: 2433-2445
4Rudzka, D. et al. (2011) Geochimica et. Cosmochimica Acta 75 : 4321–4339
5Bauska, T. K. et al. (2015) Nature Geoscience 8: 383–387

How to cite: Paine, A., Held, F., Cheng, H., and Fleitmann, D.: A seasonally resolved late Holocene paleoclimate record from Sofular Cave, Northern Türkiye., EGU General Assembly 2025, Vienna, Austria, 27 Apr–2 May 2025, EGU25-11210, https://doi.org/10.5194/egusphere-egu25-11210, 2025.

EGU25-11557 | Orals | CL1.2.3

Investigation of the Global Meteoric Water Line in the past using speleothem fluid inclusions 

Stéphane Affolter and Dominik Fleitmann

The paleoclimate role of speleothem fluid inclusions – and namely its direct link to past precipitation – has been recognized since decades (Affolter et al., 2025). Water isotopes contained in speleothem fluid inclusions offer a unique opportunity to reconstruct and study the past water cycle. The analyses of water extracted from the speleothem calcite matrix allow a precise determination of its hydrogen (δ2H) and oxygen (δ18O) isotopes. The relationship between δ2H and δ18O isotope ratios in meteoric waters is called the Global Meteoric Water Line (GMWL). Here, we explore this relationship in the past based on speleothem fluid inclusion water.

Based on a compilation of existing data covering essentially mid- to low-latitude area, as well as new data, we developed a Global Meteoric Water Line for the past (paleo-GMWL). Results show a remarkable similarity between the paleo-GMWL inferred from the speleothem fluid inclusion water in the past, and the present-day GMWL. This demonstrates the long-term GMWL stability, at least during temperate periods when speleothems at mid- and high-latitudes grew, i.e. when mean annual air temperatures and cave air temperatures were above the freezing point.

Similarly, we analyzed the spatial distribution of δ2H by comparing speleothem fluid inclusion and recent rainfall δ2H isotope values. Results show the suitability of fluid inclusion water isotopes for the reconstruction of a global network of isotopes in precipitation in the past. However, challenges such as temporal and spatial gaps in the speleothem record remain in many regions of the world.  Nevertheless, our study highlights the high potential of speleothem fluid inclusions to investigate the spatial and temporal variability of water isotopes in the past. The fact that speleothem fluid inclusion water isotopes fall on the GMWL delineates the quality of this proxy and its ability to reconstruct the past water cycle.


Affolter, S., Kipfer, T., Hofmeister, E., Leuenberger, M. and Fleitmann, D., 2025. Paleoclimatic significance of water isotopes in speleothem fluid inclusions. Earth-Science Reviews, 261: 105026.


How to cite: Affolter, S. and Fleitmann, D.: Investigation of the Global Meteoric Water Line in the past using speleothem fluid inclusions, EGU General Assembly 2025, Vienna, Austria, 27 Apr–2 May 2025, EGU25-11557, https://doi.org/10.5194/egusphere-egu25-11557, 2025.

EGU25-14105 | ECS | Posters on site | CL1.2.3

Interhemispheric monsoon response to bipolar forcing during Heinrich Stadial 4 

Rui Zhang, Haiwei Zhang, Xiyu Dong, Christoph Spötl, Carlos Pérez-Mejíasa, Francisco W. Cruz, and Hai Cheng

Heinrich Stadial 4 (HS4) the most prominent iceberg collapse event of the Last Glacial is marked by significant changes in both high- and low-latitude records, making it a key example for studying millennial-scale events. Based on an improved chronological, we present high-resolution, annually laminated speleothem record from southeastern China, spanning the HS4, which allows us to quantify the temporal relationship of Heinrich Event 4 (HE4) with unprecedented age precision across the Asian Monsoon region, South American Monsoon region, and polar regions. Our data suggests that during the onset of HS4, the East Asian Summer Monsoon (EASM) and northern high-latitude climate experienced two rapid stages of change, tightly coupled by the rapid southward migration of the Intertropical Convergence Zone over the Pacific. In contrast, controlled by low temperatures in Antarctica, the strengthened cross-equatorial flow led to a gradual weakening of the Indian Summer Monsoon (ISM). Our records precisely date the onset of HE4 at 39.70 ± 0.06 ka BP, significantly narrowing the uncertainty in Greenland ice cores (GISP2 and GRIP) for this period. Following HE4 onset, northern high-latitude cooling and EASM weakening occurred, followed by a marked strengthening of the South American Summer Monsoon and a rapid increase in atmospheric methane about 100 years later. Atmospheric CO2 rises and Antarctic warming after HE4 caused a weakening of the cross-equatorial flow, eventually triggering a significant decline in ISM.

How to cite: Zhang, R., Zhang, H., Dong, X., Spötl, C., Pérez-Mejíasa, C., W. Cruz, F., and Cheng, H.: Interhemispheric monsoon response to bipolar forcing during Heinrich Stadial 4, EGU General Assembly 2025, Vienna, Austria, 27 Apr–2 May 2025, EGU25-14105, https://doi.org/10.5194/egusphere-egu25-14105, 2025.

EGU25-14953 | Posters on site | CL1.2.3

Quantifying evaporation during fluid inclusion isotope analysis in speleothem samples 

Jasper A. Wassenburg, Hubert B. Vonhof, Sayak Basu, Daniel M. Cleary, Yun Seok Yang, Yuna Oh, Hai Cheng, and Christoph Spoetl

Speleothem fluid inclusion isotope analysis provides the oxygen and hydrogen isotope compositions of the parent water from which the carbonate was precipitated. In contrast to the carbonate isotopes, it is not affected by kinetic isotope effects or cave air temperature. However, in-cave evaporation has been identified as a potential control on drip water isotopes if drip rates are slow and or relative humidity in the cave is low.

Rainfall isotope compositions generally plot close to the global meteoric water line (GMWL) in a plot of d2Hversus d18O that can be described by the following regression equation: d2H = 8*d18O + 10. A lower deuterium excess (d-excess) value indicates post-condensation evaporation, and different fractions of evaporation typically result in so-called evaporation lines with shallower slopes. Recently it was shown that in-crusher evaporation results in water loss during analysis, which may significantly affect the speleothem fluid inclusion isotope composition. For fluid inclusion isotope compositions that have low d-excess values, it is thus key to find out where evaporation took place.

In this study, we examine the effect of analytical evaporation by quantifying the water loss during analysis. We target two layers with different calcite fabrics from a flowstone of Touhami Cave (GTOF2), Morocco, as well as a speleothem from Scladina Cave, Belgium. The Moroccan fluid inclusion isotope data agree well with the drip water isotope composition from a cave nearby. The white opaque layer from GTOF2 has high water contents of 3.4 µl/g, whereas the second transparent layer has only 0.12 µl/g. The speleothem from Scladina Cave yielded 2.0 µl/g. We observed that all replicates lose water up to 39% by evaporation, but only the Scladina speleothem shows a clear relationship between fractional water loss and d-excess. The replicates of the low water content layer in GTOF2 plot on an evaporation line, but the slope is steeper compared to the evaporation line from the Scladina speleothem. We suggest that the Touhami Cave flowstone may have been affected by in-cave evaporation.

How to cite: Wassenburg, J. A., Vonhof, H. B., Basu, S., Cleary, D. M., Yang, Y. S., Oh, Y., Cheng, H., and Spoetl, C.: Quantifying evaporation during fluid inclusion isotope analysis in speleothem samples, EGU General Assembly 2025, Vienna, Austria, 27 Apr–2 May 2025, EGU25-14953, https://doi.org/10.5194/egusphere-egu25-14953, 2025.

EGU25-15460 | Posters on site | CL1.2.3

Radiocarbon evidence for aged speleothem organic matter: what does this mean for the interpretation of speleothem biomarker records? 

Franziska Lechleitner, Rowan Sarah, Gang Xue, Tim Huber, Marc Luetscher, Giulia Guidobaldi, Negar Haghipour, Laura Endres, Heather Stoll, Aurea C. Chiaia-Hernández, and Sergio Cirelli

The application of organic carbon-based proxies, particularly biomarkers, to speleothem archives has greatly increased due to methodological and analytical advances. These reconstructions rely on the critical assumption that the analyzed proxy shares the same age as the surrounding archive matrix, as direct measurement of the biomarker age remains challenging due to very low concentrations.

We have developed a dataset of globally distributed bulk organic carbon radiocarbon ages from speleothems. Comparison with coupled carbonate radiocarbon ages, and where applicable, U-Th ages, shows that the speleothem organic carbon fraction is predominantly older than the depositional age (by 600 - 15,000 years). This discrepancy seems largely unaffected by climate conditions and ecosystem type, suggesting that aging of organic matter through storage and reworking is a widely occurring feature of karst systems.

Radiocarbon measurements of drip water organic carbon in a temperate karst system in Switzerland confirm that dissolved organic carbon ages in the karst system (and is not, for example, related to processes during incorporation into the speleothem carbonate matrix), with a strong influence of hydrology. Fluorescence and high resolution mass spectrometry allow us to investigate the processing and transformation of organic matter in the subsurface.

Our results remain so far constrained to the bulk organic carbon phase, and therefore we can only infer on how different biomarkers are affected by pre-aging in the karst system. Nevertheless, we highlight the complexity of carbon transport and transformation in the karst subsurface, underscoring the need for careful screening of samples and biomarkers used for paleoenvironmental reconstructions from speleothem organic matter.

How to cite: Lechleitner, F., Sarah, R., Xue, G., Huber, T., Luetscher, M., Guidobaldi, G., Haghipour, N., Endres, L., Stoll, H., Chiaia-Hernández, A. C., and Cirelli, S.: Radiocarbon evidence for aged speleothem organic matter: what does this mean for the interpretation of speleothem biomarker records?, EGU General Assembly 2025, Vienna, Austria, 27 Apr–2 May 2025, EGU25-15460, https://doi.org/10.5194/egusphere-egu25-15460, 2025.

EGU25-16094 | ECS | Orals | CL1.2.3 | Highlight

A six-million-year speleothem derived clumped isotope temperature record of continental Eurasia 

Stuart Umbo, Sevasti Modestou, Thomas Opel, Franziska Lechleitner, Anton Vaks, Tzahi Golan, Andrew Mason, Jade Margerum, Ola Kwiecien, Alexandr Osintsev, and Sebastian Breitenbach

Our understanding of global temperature in the recent geological past is predominantly derived from oceanic proxies and modelling reconstructions1–3. Terrestrial proxy data, particularly in continental environments, is sparse and based largely on palaeobotanical and palaeozoological data which can be difficult to accurately date4.

We present approximately 30 temperature reconstructions over a six-million-year interval from Botovskaya Cave (N 55.3°, E 105.3°) in Siberia, ca. 300 km west of Lake Baikal. We provide chronological constraint with U-series techniques5 and multi-annual absolute temperature estimates from clumped isotope analyses of speleothems (carbonate cave deposits, e.g. stalagmites and flowstones). Clumped isotope analysis directly infers quantitative paleotemperature estimates, overcoming difficulties associated with conventional stable isotope (δ18O) techniques which require knowledge of the isotopic composition of carbonate precipitation waters – which is often unknown. By targeting subaqueous material, we overcome dis-equilibrium effects which have hindered widespread application of clumped isotopes to speleothems6,7.

Our record is the longest palaeotemperature timeseries from continental Eurasia and suggests a ca. 4 – 5°C temperature drop between the Messinian (7.24 – 5.33 Ma) and the present day, coincident with declining atmospheric carbon dioxide8, and in agreement with existing estimates of global temperature over the same interval9,10.

References

1. Clark, P. U. et al, Global and Regional Temperature Change over the Past 4.5 Million Years. Science (2024).

2. Herbert, T. D. et al. Late Miocene global cooling and the rise of modern ecosystems. Nat Geosci (2016).

3. Judd, E. J. et al. A 485-million-year history of Earth’s surface temperature. Science, (2024).

4. Bradshaw, C. D. et al. The relative roles of CO2 and palaeogeography in determining late Miocene climate: Results from a terrestrial model-data comparison. Climate of the Past (2012).

5. Mason, A. J. et al, Simplified isotope dilution approach for the U-Pb dating of speleogenic and other low-232Th carbonates by multi-collector ICP-MS. Geochronology (2022).

6. Daëron, M. et al. 13C18O clumping in speleothems: Observations from natural caves and precipitation experiments. Geochim Cosmochim Acta (2011).

7. Affek, H. P. et al, Glacial/interglacial temperature variations in Soreq cave speleothems as recorded by ‘clumped isotope’ thermometry. Geochim Cosmochim Acta (2008).

8. Rae, J. W. B., et al. Atmospheric CO2 over the past 66 million years from marine archives. Annual Review of Earth and Planetary Sciences. (2021).

9. Westerhold, T. et al. An astronomically dated record of Earth’s climate and its predictability over the last 66 million years. Science (2020).

10. Pound, M. J. et al, Global vegetation dynamics and latitudinal temperature gradients during the Mid to Late Miocene (15.97-5.33Ma). Earth-Science Reviews (2012).

How to cite: Umbo, S., Modestou, S., Opel, T., Lechleitner, F., Vaks, A., Golan, T., Mason, A., Margerum, J., Kwiecien, O., Osintsev, A., and Breitenbach, S.: A six-million-year speleothem derived clumped isotope temperature record of continental Eurasia, EGU General Assembly 2025, Vienna, Austria, 27 Apr–2 May 2025, EGU25-16094, https://doi.org/10.5194/egusphere-egu25-16094, 2025.

EGU25-16788 | Posters on site | CL1.2.3

Unveiling the biogeochemical role of bat guano in shaping cave morphology in the Madingou region, Republic of the Congo 

Pascale Lahogue, Nicy Bazebizonza, Sophie Verheyden, Mathieu Boudin, Florent Boudzoumou, and Imen Arfaoui

The research investigated cave deposits and stalagmites in two caves within the karst area of the Madingou region, Republic of the Congo, with a focus on biocorrosion features and guano deposits prevalent in these sites. A systematic inventory of biocorrosion features in the studied caves was complemented by geochemical analyses of sediments and corroded speleothems, providing valuable insights into the underlying processes. To monitor environmental conditions, a seasonally based approach was employed, involving temperature recording, punctual CO₂ measurements, and in-situ parameter monitoring during each sampling period. These efforts contribute to a detailed understanding of speleogenesis processes, particularly the influence of bat guano-induced corrosion.

Field studies revealed remarkable observations of cave morphology, highlighting intriguing biocorrosion features such as cupolas, guano-holes in the ground, and bell holes in the roof. These features closely resemble similar formations documented in other regions, including France and Slovakia. The observed elements have sparked reflections on their significance in the late morphological evolution of caves. Understanding the role of bat guano in shapingmorphology could shed light on the broader processes influencing cave evolution in various contexts.

Two samples were collected from the dark-colored superficial sediments, along with two core samples from monitored stalagmites and one sample from a corroded speleothem, all from two bordering caves in the Madingou region. These samples underwent elementary chemical analysis, revealing that the sediments contained 11% CaO and 24% P₂O₅, while the corroded speleothem exhibited 55% CaO and 47% P₂O₅. The high phosphate (P₂O₅) and calcium oxide (CaO) concentrations, confirm the direct impact of biocorrosion driven by bat guano on the evolution of cave features.

The process of biocorrosion is further supported by environmental parameters, including an elevated CO₂ concentration that vary between 480 and 500 ppm, higher than the atmospheric average (~400 ppm), and cave temperatures ranging between 19°C and 25°C. These conditions, which are ideal for microbial activity, accelerate the decomposition of bat guano and promote the formation of phosphoric acid and carbonic acid. These acids enhance carbonate dissolution and the precipitation of phosphate minerals, leading to significant chemical and structural alterations in the cave system over time. The impact of bat guano on cave evolution is also temporally contextualized by C-14 dating, which places the deposition of the superficial sediment layer at 1956 ± 28 BP. This dating aligns with a period of guano accumulation and biocorrosion activity, highlighting the longstanding influence of bat colonies on the cave's geochemical environment.

In summary, the high phosphate content within sediment and speleothems, carbonate corrosion, coupled with the radiocarbon-dated guano deposits, suggest that biocorrosion induced by bat guano decomposition has been a primary driver of recent cave morphology evolution in the Madingou region for at least two millennia. This biogeochemical activity reflects a dynamic interplay of biological and chemical processes under specific environmental conditions, resulting in both chemical modification and structural caves features reshaping.

How to cite: Lahogue, P., Bazebizonza, N., Verheyden, S., Boudin, M., Boudzoumou, F., and Arfaoui, I.: Unveiling the biogeochemical role of bat guano in shaping cave morphology in the Madingou region, Republic of the Congo, EGU General Assembly 2025, Vienna, Austria, 27 Apr–2 May 2025, EGU25-16788, https://doi.org/10.5194/egusphere-egu25-16788, 2025.

EGU25-17008 | Posters on site | CL1.2.3

Comparing climate variability with historical datasets from Cyprus: significance, strengths and limitations  

Carole Nehme and the ANR HIGH-PASM project

Comparing long-term climate variability with documentary data for the last millennium is challenging in regions where well-resolved natural records are lacking. In Cyprus, historical data of famine outbreaks, plagues and locust waves were retrieved from a variety of historical documents. These events are considered as societal indicators as they reflect the vulnerability of the Cypriot society towards environmental and climatic change from the late Lusignan’s to the Early British colonial period. The aim of this study within the HIGH-PASM project is to explore the relationship between local climate variability and locust waves, plagues and famine outbreaks.

An 8 cm-high actively growing stalagmite was collected from Hot cave in the Kyrenia range (Cyprus). U-Th dating and lamina counting were combined to produce an age model of the last ~700 years. We applied high-resolution stable isotopic (ẟ18O, ẟ13C) and trace element (Mg, Sr) analyses to establish climate proxy records and compare them to historical records and observational data. First, statistical analyses (normalization, volatility) were conducted on the isotope time-series to evaluate the intensity of humid/dry peaks and to identify periods with strong/weak fluctuations. Second, 875 recorded events were compiled from various historical sources (primary, secondary, compilations) and homogenized. Third, both natural (continuous) time-series and historical (discrete) data were compared using several statistical methods. 

The comparison between the occurrence of these three types of historical events shows that 36% of locust waves and famines occurred within the same year and a similar synchronicity was found between famines and plague outbreaks. Plagues and locust waves, however, did not occur significantly synchronously. Statistical analyses between the ẟ13C volatility index and the number of locust waves, plagues, and famines show whether certain combinations of dry/wet and volatile/non-volatile conditions promote any of the three different disasters. Early results show that all three types of events occurred during wet and non-volatile (low signal oscillation) periods. This is consistent with the ecological niches of Dociostaurus maroccanus (locust specie) and Yersinina pestis (zoonotic bacterium that causes plague) which require a slightly wet climate to proliferate. However, this applies less to famines, as many famines also occurred during dry periods (e.g., in the 19th century).

How to cite: Nehme, C. and the ANR HIGH-PASM project: Comparing climate variability with historical datasets from Cyprus: significance, strengths and limitations , EGU General Assembly 2025, Vienna, Austria, 27 Apr–2 May 2025, EGU25-17008, https://doi.org/10.5194/egusphere-egu25-17008, 2025.

EGU25-17146 | Posters on site | CL1.2.3

Constraining the climate of the Western Caucasus from the Late Pleistocene to Holocene through isotopic analysis of speleothems 

Manuel Rührer, Thomas Schneck, Olga Chervyatsova, Roman Dbar, Evgeniy Zakharov, Yuri Dublyansky, Christoph Spötl, and Jonathan Baker

Global climate evolution since the Last Glacial Maximum is well understood but large areas of continental Eurasia are still underrepresented, masking regional disparities. While some regions have high-resolution paleoclimate records, there are significant spatial and seasonal differences in reconstructed trends, particularly with regard to Early Holocene temperature. The Western Caucasus region of the Eastern Black Sea margin, comprising modern Russia and Georgia, is of high historical and archeological significance with abundant Paleolithic sites. It served as a corridor for migration and settlement of early modern humans and Neanderthal alike, influencing the development of agriculture and major cultural achievements. Although the abundance of limestone caves within the rich karst terrain provides ample opportunity for paleoclimatic reconstruction from speleothem analysis, this approach has scarcely been utilized. Here we present novel speleothem records from three caves—Vorontsovskaya, Novoafonskaya, and Abrskil—that collectively span the last 34,000 years with minor hiatuses.

By analyzing high-resolution stable isotope data (δ¹⁸O, δ¹³C) from speleothems in these caves, we aim to evaluate the regional response to major climate events from the Late Pleistocene to the Holocene. Our approach involves high-precision Uranium-Thorium dating and micromilling for isotopic analysis corresponding to multidecadal resolution. Preliminary results indicate semi-continuous data, which will allow us to identify key perturbations and trends, such as the Younger Dryas, Heinrich, and Dansgaard-Oeschger events. These will be correlated with other regional and global data sources to provide a clearer picture of past regional climate dynamics and their connection to global climate trends. Understanding the climatic conditions and moisture sources—such as influences from the Black Sea via westerly wind systems, Mediterranean, and continental sources—may help clarify the susceptibility of regional agriculture to drought while contributing to a better understanding of global climate evolution. Additionally, identifying the link between regional climate processes and larger-scale climatic shifts can provide valuable insights for predicting future climate scenarios in the region.

How to cite: Rührer, M., Schneck, T., Chervyatsova, O., Dbar, R., Zakharov, E., Dublyansky, Y., Spötl, C., and Baker, J.: Constraining the climate of the Western Caucasus from the Late Pleistocene to Holocene through isotopic analysis of speleothems, EGU General Assembly 2025, Vienna, Austria, 27 Apr–2 May 2025, EGU25-17146, https://doi.org/10.5194/egusphere-egu25-17146, 2025.

EGU25-17668 | Posters on site | CL1.2.3

Floods and water availability reconstructions from speleothems through Laser-induced break down spectrometry (LIBS) with implications for archaeological work and citizen engagement in the UNESCO global geopark Famenne-Ardenne.  

Sophie Verheyden, Christian Burlet, Serge Delaby, Hai Cheng, Xue Jia, Possum Pincé, Koen Deforce, Christophe Snoeck, Philippe Crombé, Hans Vandendriessche, Hannah Leonard, Giacomo Capuzzo, Matthieu Boudin, and Marine Wojcieszak

Our work on a speleothem in the Hotton cave reveals a 5000-year record of past floods in the Hotton cave through deposition of detrital layers in a flowstone covered by mud during the exceptional 2021 flood. The palaeorecord reveals other such exceptional floods around 1550 CE (Common Era), 30 CE and 350 BCE (Before Common Era). Further down, a period between 3.3 BCE and 2.6 BCE shows ‘dirty calcite’ with several smaller detrital layers indicating a period with much more regular floods. In the frame of the Leap Project (learning from the past - The impact of abrupt climate changes on society and environment in Belgium - www.leap-belgium.be), we investigate possible relations between the environmental  changes and past human activities. In order to construct high resolution trace element curves as a proxy for past water availability, a procedure for LIBS analysis of speleothems is set up at the Institute of Natural Sciences in Brussels, Belgium. A 2D spectral image of a few millimeters broad is taken along the growth axis of the speleothem. A curve is constructed by averaging the data along horizontal lines of the 2D analysis. It is a rapid and minimal destructive method to obtain trace elemental curves of Mg, Sr, Ba, and other elements such as Pb, Cu, Zn,.. Up to now the method is rather qualitative, but a semi-quantitative analysis is in progress.

The interest of these climate and environmental related data, is that they are very visual, concrete traces of past climate changes. Speleothems and their records of floods are a strong educational tool for citizens that feel not concerned about climate change. The dissemination of our results through events organized by the UNESCO Global Geopark Famenne-Ardenne aims at engaging inhabitants with climate science and awareness.

How to cite: Verheyden, S., Burlet, C., Delaby, S., Cheng, H., Jia, X., Pincé, P., Deforce, K., Snoeck, C., Crombé, P., Vandendriessche, H., Leonard, H., Capuzzo, G., Boudin, M., and Wojcieszak, M.: Floods and water availability reconstructions from speleothems through Laser-induced break down spectrometry (LIBS) with implications for archaeological work and citizen engagement in the UNESCO global geopark Famenne-Ardenne. , EGU General Assembly 2025, Vienna, Austria, 27 Apr–2 May 2025, EGU25-17668, https://doi.org/10.5194/egusphere-egu25-17668, 2025.

EGU25-18074 | Posters on site | CL1.2.3

Cryogenic carbonate synthesis by controlled solution freezing 

Péter Németh, Attila Demény, Anett Lázár, Gabriella Koltai, Yuri Dublyansky, and Christoph Spötl

Cave carbonates offer insights into past environmental and climate change. A unique type of these deposits, cryogenic cave carbonates (CCCs), form by a mechanism known as cryogenic crystallization. CCCs may form through: (1) rapid freezing of thin water films on ice surfaces, creating small crystals (typically, <1 mm), and (2) slow freezing of water in pools, creating larger crystals (up to several cm in size). These two types of CCC show distinct stable isotope compositions. From a paleoclimatological point of view, CCCs of the second type are an indicator of past permafrost conditions1. However, the details of their formation are still not fully understood, as no actively forming CCCs of this type have been observed in nature.

To study how the freezing proceeds and how it influences the geochemical signature and morphology of the cryogenic crystallization products, we employed several methods for forming cryogenic carbonates under controlled conditions in the laboratory. (1) Cryogenic carbonates were produced via bottom-up solution freezing, by lowering a plastic bottle filled with a Ca-bicarbonate solution into a -15 °C medium. The freezing times for the bottom and top layers varied between three and ten hours. (2) Cryogenic carbonates were also precipitated from a saturated Ca-bicarbonate solution via slow (several days) and uniform freezing at -2 °C in a freezer. To control the direction of freezing and enhance the top-down freezing process, the flask containing the bicarbonate solution was placed in an insulated box. After the experiments, the first- and last-formed carbonates were separated by sampling of the formed ice. Marked differences in the crystal size and the oxygen and carbon isotope compositions of the first- and last-formed carbonates were observed. The δ13C and δ18O values of synthetic cryogenic carbonates align with the field of the fast-forming natural CCCs. However, when compared with parent solutions, they are closer to the values of the field of CCCs² forming in freezing pools. The results highlight the importance of knowing the C isotopic composition of the solution’s dissolved inorganic carbon in isotope-based classification of CCCs, and are relevant for understanding the environment in which CCCs form.

We acknowledge the financial support of the NKFIH ANN141894 grant.

References:

1 Žák, K., Onac, B.P., Kadebskaya, O., Filippi, M., Dublyansky, Y., Luetscher, M. (2018): Cryogenic mineral formation in caves, in: Perşoiu, A., Lauritzen, S.-E. (Eds.), Ice Caves, 123-162, Elsevier, Amsterdam.

2 Spötl, C., Koltai G. & Dublyansky Y. (2023) Mode of formation of cryogenic cave carbonates: Experimental evidence from an Alpine ice cave. Chemical Geology, 638, 121712. DOI: 10.1016/j.chemgeo.2023.121712.

How to cite: Németh, P., Demény, A., Lázár, A., Koltai, G., Dublyansky, Y., and Spötl, C.: Cryogenic carbonate synthesis by controlled solution freezing, EGU General Assembly 2025, Vienna, Austria, 27 Apr–2 May 2025, EGU25-18074, https://doi.org/10.5194/egusphere-egu25-18074, 2025.

EGU25-18153 | ECS | Posters on site | CL1.2.3

Sterol Biomarkers for Paleoenvironmental and Anthropogenic Tracing in Speleothems 

Johanna Schäfer and Thorsten Hoffmann

Speleothems, renowned for their potential as continuous paleoenvironmental archives spanning thousands of years, are particularly valuable due to reliable age determination via the 230Th/U230Th/U-method. The closed-system nature of cave environments and the chemical stability of speleothems allow for the preservation and analysis of organic substances alongside traditional proxies such as stable isotopes and trace elements. Among organic compounds, sterols emerge as promising biomarkers owing to their chemical stability in oxygen-limited environments, and distinct origins from plants, animals, and microbial processes.

Cholesterol and sitosterol, representing sterols derived from animals and plants, respectively, are precursors to stanols, which are microbially reduced sterols, often traceable to faecal inputs. Notably, coprostanol serves as a key marker for human activity due to its predominance in human faeces. Despite the widespread application of sterol-based biomarkers in soil and sediment studies, their use in speleothem research remains nascent, largely due to the challenges posed by the complex mineral matrix and low concentrations of organic analytes.

To overcome these obstacles, a method combining stir bar sorptive extraction (SBSE) with a polydimethylsiloxane (PDMS) phase was developed, following acid dissolution of speleothem samples. Subsequent analysis was performed using high-performance liquid chromatography coupled with atmospheric pressure chemical ionization high-resolution orbitrap mass spectrometry (HPLC-APCI-HRMS), which provides exceptional resolution and sensitivity. This novel methodology not only enhances the extraction and analysis of sterols from speleothems but also establishes a pathway for expanding their use in paleoenvironmental and anthropogenic reconstructions.

How to cite: Schäfer, J. and Hoffmann, T.: Sterol Biomarkers for Paleoenvironmental and Anthropogenic Tracing in Speleothems, EGU General Assembly 2025, Vienna, Austria, 27 Apr–2 May 2025, EGU25-18153, https://doi.org/10.5194/egusphere-egu25-18153, 2025.

Calcium isotopes (δ44Ca) in speleothems are thought to solely record changes in prior carbonate precipitation (PCP) along the seepage water flowpath. This unique sensitivity makes  d44Ca a useful tool for both reconstructing past hydroclimate and exploring the influence of PCP on other proxies where it can be one of several influences. Here we present δ44Ca records for two partially coeval stalagmites from Lake Shasta Caverns (LSC) in northern California that grew between 37,000 and 14,000 years BP. Both δ44Ca records display similar mean values and temporal variations, and significant positive correlations with δ13C (r = 0.74, 0.73) and δ18O (r =0.49, 0.77), suggesting PCP also influences these traditional stable isotope proxies. However, neither stalagmite displays significant correlations between d44Ca and trace element proxies (Mg/Ca, Sr/Ca, Ba/Ca) indicating these do not solely reflect PCP at this site.

LSC sits on the boundary between two hydroclimate regimes in the northwestern and southwestern United States (US). Stalagmite δ44Ca and δ13C suggest wetter conditions during warm Dansgaard-Oeschger interstadials, similar to paleoclimate archives from the Pacific northwest. However, LSC proxies also indicate wet conditions during colder Heinrich Stadials, similar to archives from the US southwest. Values for the fraction of Ca remaining in solution after PCP (f) calculated using a Rayleigh fractionation model for δ44Ca calibrated with modern monitoring data indicate that 0 to ~60% of dissolved Ca is lost to PCP. We compare stalagmite f values with modern PCP rates and measured rainfall to generate quantitative estimates of past rainfall. However, unreasonable f values during the wettest intervals indicate that the calcite-water calcium isotopic fractionation factor may have varied in the past, particularly during intervals of faster stalagmite growth. Using calculated f values, we estimate the δ13C of dissolved inorganic carbon prior to PCP which agrees with modern dripwater values. Notably, these δ13C estimates are higher during wetter warm interstadials and cold Heinrich Stadials, when PCP is lowest. This suggests that during wet intervals, seepage water has little time to equilibrate with soil CO2 leading to lower carbonate saturation and less PCP, likely a result of sparse soils and steep terrane above LSC. 

How to cite: Oster, J., Scarpitti, E., de Wet, C., and Griffith, E.: Calcium isotope ratios (δ44Ca) in coeval California stalagmites record hydroclimate shifts and reveal soil-to-cave carbon transformations during the last glacial period, EGU General Assembly 2025, Vienna, Austria, 27 Apr–2 May 2025, EGU25-20160, https://doi.org/10.5194/egusphere-egu25-20160, 2025.

EGU25-20167 | Posters on site | CL1.2.3

Novel proxy constraints on subglacial speleothem growth in the Northern Alps bounding the MIS-11 Interglacial 

Jonathan Baker, Gina Moseley, Alexandre Honiat, Peter Wynn, R. Lawrence Edwards, and Christoph Spötl

Late Pleistocene climate of the European Alps was characterized by orbitally forced, high-magnitude oscillations in temperature and glacial ice extent. Beyond the Last Glacial Maximum, however, the geographic extent of continental glaciation is notably difficult to constrain, due to the erosion and reworking of associated surficial deposits. Subglacial speleothem growth occurs when warm-based ice sheets cover karst terrain, providing a thermal buffer to ground temperature and a source of liquid water infiltration. In place of carbonic-acid dissolution from the soil zone, the oxidation of sulfide minerals provides a source of acidity to facilitate carbonate dissolution and vadose-zone precipitation. The proxy identification of subglacial processes can therefore serve to constrain ice-sheet evolution from absolutely dated speleothems, but these techniques have yet to be systematically developed. Herein we present a novel composite record of climatic change across MIS-12, -11, and -10 from three stalagmites in Klaus Cramer Cave, a high-elevation site located in the northern Alps of western Austria. Stable-isotope values of oxygen (carbon) are low (high) during glacial episodes that bound the MIS-11 interglacial. When warm-based ice is likely to be present above the cave, δ13C exceeds +4‰, signaling that sulfuric-acid dissolution became dominant in the epikarst. To investigate this process further, we measured δ34S and δ18O in speleothem sulfate, which confirm that pyrite was the primary sulfur source and elucidate redox conditions in both subglacial and soil-dominated systems. Glacial periods also exhibit abrupt and dramatic contrasts to MIS-11 with regard to major- and trace-element concentrations, including a ~20-fold increase in sulfur concomitant with elevated Mg and Sr. This pattern is consistent with a marked increase in prior calcite precipitation associated with sulfuric-acid dissolution that would have elevated initial Ca2+ in the system. Finally, we assess trace elements in the context of provenance analysis as a potential indicator of enhanced glacial weathering at the ice-rock interface. Collectively, this suite of geochemical proxies can identify precisely when warm-based ice advanced or retreated across the specific location and elevation of Klaus Cramer Cave in the total absence of evidence from conventional glacial geomorphology.

How to cite: Baker, J., Moseley, G., Honiat, A., Wynn, P., Edwards, R. L., and Spötl, C.: Novel proxy constraints on subglacial speleothem growth in the Northern Alps bounding the MIS-11 Interglacial, EGU General Assembly 2025, Vienna, Austria, 27 Apr–2 May 2025, EGU25-20167, https://doi.org/10.5194/egusphere-egu25-20167, 2025.

EGU25-20198 | ECS | Orals | CL1.2.3

Climate instability in the European Alps across MIS 10 and 11 

Alexandre Honiat, Jonathan Baker, Martin Trüssel, R. Lawrence Edwards, and Christoph Spötl

The MIS 10 glacial period was characterized by vast ice sheets and cold climates, but reconstructing its history is challenging due to erosion and burial under modern glaciers. In contrast, the preceding MIS 11 interglacial lacks clear markers for some substages, despite its well-defined peak. As MIS 11 is often considered a partial analogue to the Holocene, understanding its transition into MIS 10 could provide valuable insights into future climate scenarios.

Research on MIS 10 and MIS 11a/b is limited by their temporal remoteness and the scarcity of well-preserved records. While studies tend to focus on more recent ice ages, terrestrial data such as lake sediments and loess sequences are rare. Although ice cores offer detailed records, they primarily cover younger periods. Subglacial speleothems, however, have emerged as a valuable alternative, providing high-resolution, U/Th dated archives even for older glacial climates.

This study examines subglacial speleothems from the Schratten karst in Switzerland’s Melchsee-Frutt region. Stable-isotope data reveal distinct patterns: stable signals during warm interglacial periods and unstable signals during colder phases, linked to moisture sources from the North Atlantic. These findings provide the first high-resolution reconstruction of MIS 10 and MIS 11a/b climate events for this region.

The study highlights the underexplored potential of subglacial speleothems as critical tools for studying glacial-interglacial transitions and improving our understanding of ancient climates, with implications for future scenarios.

How to cite: Honiat, A., Baker, J., Trüssel, M., Edwards, R. L., and Spötl, C.: Climate instability in the European Alps across MIS 10 and 11, EGU General Assembly 2025, Vienna, Austria, 27 Apr–2 May 2025, EGU25-20198, https://doi.org/10.5194/egusphere-egu25-20198, 2025.

EGU25-1067 | ECS | Orals | SSP3.8

Multiproxy evaluation of the Paleohydrology of the Sakarya River during the Last Milennium, NW Anatolia 

Hilal Okur, Mehmet Korhan Erturaç, Meltem Çelen, Eren Şahiner, Zeki Bora Ön, Sena Akçer Ön, Nesibe Köse, Hüseyin Tuncay Güner, Nurgül Karlıoğlu Kılıç, and Mehmet Salim Öncel

Paleohydrology studies are an emerging field of research linked to paleoclimatology and hazard estimation studies. Understanding the patterns of extreme events in the context of global change is of great importance, especially for regions where extreme events are an integral part of the hydrological regime, due to their social (e.g., vulnerability) and political (resilience and adaptation) implications. For many regions of the world where the instrumental record is very short and there are no historical records of hydrological events. These instrumental records can be extended by hundreds to thousands of years by reconstructing especially paleoflood events using fluvial archives.

We present the first detailed paleohydrology study in Anatolia. Our research focuses on the lower reaches of the Sakarya River at Adapazarı Basin, NW Anatolia, Türkiye. Here, the due unique tectonic setting controlled by the North Anatolian Fault, deposition of a 4.5-meter-thick fine-grained floodplain sediment since CE 1350 was possible. This timing constraint corresponds to the reign of the Ottoman Empire as well as to the Little Ice Age (LIA), an intermitted period(s) of cold and dry climate defined for the northern Europe. The characterization of past flow regimes of the river and the detailed identification of paleohydrology events within the studied section have been facilitated through a multidisciplinary and multi-proxy approach (grain size, mineralogy, geochemistry). All identified events have been precisely dated using age-depth model based on dendrochronology, radiocarbon, luminescence, and event-based dating techniques.

The focus sedimentary record revealed that the Sakarya River experienced distinct long-duration regular flow and drought episodes with intermittent flooding events for the last 600 years. Within this time frame, with intervals of uncertainty, three dry and three regular hydrological regimes have been identified from the year CE 1350 to 1950. Within these hydrological regimes, 9 periods of extreme drought and 10 flood events have been identified. These episodes are closely comparable with the published local and regional paleo-climatic record.

How to cite: Okur, H., Erturaç, M. K., Çelen, M., Şahiner, E., Ön, Z. B., Akçer Ön, S., Köse, N., Güner, H. T., Karlıoğlu Kılıç, N., and Öncel, M. S.: Multiproxy evaluation of the Paleohydrology of the Sakarya River during the Last Milennium, NW Anatolia, EGU General Assembly 2025, Vienna, Austria, 27 Apr–2 May 2025, EGU25-1067, https://doi.org/10.5194/egusphere-egu25-1067, 2025.

EGU25-1438 | Posters on site | SSP3.8

Climatic versus Anthropogenic Influences on Sediment Delivery to the Gulf of Mexico Marginal Sea since 5000 y BP 

Peter Clift, Bailey Wycoff, Andrew Carter, Samuel Mũnoz, and Tammy Rittenouer

We present a compilation of provenance data derived from the lower reaches of the Mississippi river showing how the source of sediment supplied to the lower reaches has changed through time in the recent geologic past. We integrate data from a late Holocene point bar, its associated oxbow lake (False River) and the channel plug that infilled since ~500 y BP, as well as another oxbow located upstream at Lake St John. Another finer grained sediment record was derived from coring close to the Mississippi south of New Orleans. The sediments were analysed for an array of major elements, Sr and Nd isotopes, as well as detrital zircon U-Pb geochronology. Grain size is a critical factor in controlling the provenance because suspended sediment is transported rapidly through the river compared to coarse-grained material which travels more slowly as bedload. The radiogenic isotope signature of the fine-grained sediment shows a long-term shift since 4.5 ka towards more radiogenic signatures indicative of more erosion from ancient continental crust, likely the Appalachians and Mid Continent rather than the Rocky Mountain foreland, although this remains the dominant source of material supplied to the Gulf of Mexico. While some of this shift may be anthropogenic, the trend suggests long-term drying of the continental interior and reduced erosion of the foreland. Nonetheless, sand-silt sized zircon U-Pb ages indicate that between 1600 and ~1920 CE flood sediments were dominated by supply from the Missouri River, which is largely sourced from the Rocky Mountain foreland. From 500 BCE until 1600 CE supply was more skewed to the Upper Mississippi and Red River, and with some input from the Arkansas River, also derived from the west. Coarse grained sediments deposited in the lower reaches during the last 10 years show a high degree of variability which we interpret to reflect reduced sediment buffering driven by the inability of the lower reaches to meander and recycle flood sediments in the way expected prior to the installation of levees. The modern tributaries all carry sediment that is much more altered than was true in the recent geological past and reflects heightened soil erosion driven by agriculture. The modern Mississippi is a poor analogue for the natural state of the river when compared to ancient geological deposits.

How to cite: Clift, P., Wycoff, B., Carter, A., Mũnoz, S., and Rittenouer, T.: Climatic versus Anthropogenic Influences on Sediment Delivery to the Gulf of Mexico Marginal Sea since 5000 y BP, EGU General Assembly 2025, Vienna, Austria, 27 Apr–2 May 2025, EGU25-1438, https://doi.org/10.5194/egusphere-egu25-1438, 2025.

EGU25-1688 | ECS | Posters on site | SSP3.8

Sedimentary and diagenetic processes at the origin of the 3D architecture of heterogeneous lacustrine and palustrine limestones. 

Thibaut Jamey, Simon Andrieu, Céline Mallet, Gautier Laurent, Eglantine Husson, and Mohamed Azaroual

Lacustrine and palustrine carbonates form in lakes and swamps of various shapes and sizes. They can accumulate through chemical or biological processes and are constantly under the influence of external alteration sources such as meteoric waters, vegetation or fauna. Thus, there are the result of a complex primary fabric later modified by early and late diagenesis processes which makes them highly heterogeneous.

Their study is mainly motivated by their ability to act as a reservoir for underground water or for Carbon Capture & Storage (CCS), which both require a precise understanding of their structure and variability of permeable bodies.

The 3D architecture and the scale of heterogeneity of such carbonates remains a question as depositional and alteration processes can occur on centimetre scales or less (e.g., roots), to metre and kilometre scale (e.g., subaerial exposure). This variability cannot be assessed without any large, pluri-directional outcrop or without a high density of cored boreholes.

The O-ZNS platform (“Observatoire des transferts dans la Zone Non-Saturée”) located near Orleans, France, is an observatory of the vadose zone of the Beauce aquifer. The host rocks are aquitanian lacustrine and palustrine limestones (the Beauce Limestones formation).

The observatory offers an exceptional 20 m deep and 6 m diameter well surrounded by eight cored boreholes (20-25 m deep) within a radius of 30 m, which were described at a centimetric scale (1:6).

Our study focuses on the control of the 3D architecture of the sedimentary facies by understanding the chronology of the successive depositional environments. Also, it aims to consider the diagenetic overprint of the Beauce Limestones to decipher what is the impact of the primary fabric on secondary processes that finally lead to the heterogeneities we observe today.

This contribution will present: (1) How the 16 sedimentary facies distributed in 4 depositional environments (lake, lake margins, external palustrine, internal palustrine) vary at a decametric scale, (2) the paleo-environmental evolution of the site, located at the transition between lacustrine and palustrine settings, built thanks to the correlation of 8 transgressive-regressive cycles, and (3) the link between sedimentary facies, diagenesis and petrophysical properties (porosity, permeability).

How to cite: Jamey, T., Andrieu, S., Mallet, C., Laurent, G., Husson, E., and Azaroual, M.: Sedimentary and diagenetic processes at the origin of the 3D architecture of heterogeneous lacustrine and palustrine limestones., EGU General Assembly 2025, Vienna, Austria, 27 Apr–2 May 2025, EGU25-1688, https://doi.org/10.5194/egusphere-egu25-1688, 2025.

International Ocean Discovery Program (IODP) Site U1417, located in the Surveyor Fan (Gulf of Alaska), preserves hemi-pelagic sediments influenced by glacial and fluvi­al depositional processes from the Cordilleran Ice Sheet in the Chugach–St. Elias Mountains and Coastal Mountains. A total of 441 samples from the late Miocene to early Pleistocene were used to measure the biogenic opal content and calculate its flux to trace the degree of diatom productivity in surface water and depositional history. In general, the biogenic opal content confirms the division of the lithostratigraphic units and subunits: diatom-bearing clay-rich intervals versus clast-rich terrigenous intervals. Despite large fluctuations from the late Miocene to early Pleistocene, the variation of biogenic opal content and deposition of biogenic opal flux might have been controlled by global climate change, such as the high levels during the Late Miocene Biogenic Bloom (LMBB) and mid-Pliocene Warmth (MPW) and its abrupt decline at the Northern Hemisphere Glaciation (NHG). These variations of surface water productivity may be attributed to the basin-to-basin redistribution of nutrients by global thermohaline circulation and the related Pacific Ocean ventilation in response to global climate change.

How to cite: Khim, B.-K., Kim, S., and Asahi, H.: Biogenic opal deposition in the Surveyor Fan (IODP Site U1417) of the North Pacific during the late Miocene to early Pleistocene, EGU General Assembly 2025, Vienna, Austria, 27 Apr–2 May 2025, EGU25-1739, https://doi.org/10.5194/egusphere-egu25-1739, 2025.

East Asian summer monsoon (EASM) played key role in controlling the hydroclimate of East Asia continent regions. However, the Late Holocene changes of EASM in its northern margins are still unclear, which urgently needs to be revealed in the field of climate research. Here we systematically analyze the grain size of peat ash from core ZB-7 in the Zhibian peatland and core DFHN-2 in the Dongfanghongnan peatland to address this issue. Results show that the silt fraction occupies the most component of peat ash in cores ZB-7 and DFHN-2. The grain size distribution curves of peat ash of two cores display single peak pattern. The probability cumulative curves of two cores exhibit as two-sections mode. Three end-members (EMs) displaying single peak are identified in cores ZB-7 and DFHN-2. The EM2 of core ZB-7 and EM1 of core DFHN-2 represent the contributions of surface runoff. The EM2 of core ZB-7 demonstrates a series of periodicities, such as 1000a, 500a, 210a, 110a, 88a and 66a during the Late Holocene. The correlation relationship analyses indicate that the EM2 of core ZB-7 and total solar insolation (TSI) show opposite phase with El Niño-Southern Oscillation (ENSO) activities. Furthermore, five evolutionary stages of the EASM in northern margins were identified. Less ENSO activities and declined TSI regulated the decreased precipitation during stage 1 (4338-3479 cal. yr BP). The frequent ENSO activities and declined TSI induced low precipitation in stage 2 (3479-2297 cal. yr BP). In stage 3 (2297-949 cal. yr BP), the continuously decreasing ENSO activities resulted in high precipitation. Frequent ENSO activities and low TSI induced low precipitation during stage 4 (949-231 cal. yr BP). While the increase in TSI and decrease in ENSO activities regulated increased precipitation during stage 5 (231 cal. yr BP-Present). This study would expand our predictions on the future hydroclimate changes in monsoon northern margins.

How to cite: Zhang, M.: Late Holocene variations and driving mechanisms of the East Asian summer monsoon in northern margins: Evidence from peat ash grain size, EGU General Assembly 2025, Vienna, Austria, 27 Apr–2 May 2025, EGU25-2109, https://doi.org/10.5194/egusphere-egu25-2109, 2025.

EGU25-2703 | ECS | Orals | SSP3.8

Bedding-parallel fibrous calcite veins in Permian carbonate, central Thailand 

Tindikorn Kanta and Piyaphong Chenrai

Bedding-parallel fibrous calcite veins (BPCVs) are prevalent in sedimentary basins and typically formed in petroleum source rock. This study examines the development of BPCVs in the Permian carbonate of the Khao Khwang Formation in central Thailand using petrographic, geochemical, and isotopic investigations, as well as total organic carbon (TOC) evaluation. Five rock specimens, comprising ten veins and five host rocks, were examined. The findings indicate that BPCVs display cone-in-cone and beef structures, categorizing them as unitaxial veins. The geochemical analyses and stable isotope compositions indicate that local fluid sources derived from inorganic carbonates and diagenetic formation fluids in the microbial methanogenic zone. Oxygen isotope analysis indicates that vein development occurred at late diagenetic stage. In situ U-Pb dating reveals that fibrous calcite veins originated from the Early to Middle Permian. The development of BPCVs linked to petroleum source rock provides critical insights into the history of fluids and petroleum generation within sedimentary basins.

How to cite: Kanta, T. and Chenrai, P.: Bedding-parallel fibrous calcite veins in Permian carbonate, central Thailand, EGU General Assembly 2025, Vienna, Austria, 27 Apr–2 May 2025, EGU25-2703, https://doi.org/10.5194/egusphere-egu25-2703, 2025.

EGU25-4791 | ECS | Posters on site | SSP3.8

Modern Sedimentary Mechanisms and Evolution of Extreme Event Layers Offshore Southwestern Taiwan 

Bo-Hong Wang and Chih-Chieh Su

Taiwan is located in the western Pacific typhoon corridor and the Pacific Ring of Fire, where typhoons and earthquakes frequently happen, making submarine geohazards prone to occur. As the second longest river in Taiwan, the annual sediment load of the Gaoping River averages approximately 35.61 million tons, making it the dominant contributor of terrestrial sediments offshore southwestern Taiwan. Su et al. (2018) pointed out that the sedimentation rate in most areas offshore southwestern Taiwan is less than 0.5 cm/year, and the upper continental slope in the northern part is relatively more stable compared to the southern part. Natural disasters significantly influence sediment distribution and sedimentation processes off the southwestern Taiwan. In 2005, Typhoon Haitang caused heavy rainfall, leading to the rapid transport of large amounts of suspended materials from the Gaoping River to the offshore area of southwestern Taiwan. Based on the radionuclides data published by Huh et al. (2009), a distinct Typhoon Haitang event layer can be observed, and the high-activity layer associated with the 1963 global fallout can also be identified. In this study, we intend to integrate the findings of Huh et al. (2009) regarding the application of radionuclides with 13 box core samples collected in 2023 from the same locations (the shelf and slope areas on the northern and southern sides of the Gaoping Canyon). We aim to utilize the multi-tracer approach and grain size distribution to assess modern sedimentary event records, sediment transport pathways, and potential disaster risks offshore southwestern Taiwan. Additionally, we plan to analyze the correlation of sedimentary sequences across different coring sites, as well as their temporal variations in sedimentary records at the same site. The current results indicate a positive correlation between sediment porosity and water depth. Grain size analysis shows that the median grain size and sorting decrease as water depth increases. The higher sand content observed on the northern shelf is due to northward coastal currents and overflow effects at the canyon head. Future research will focus on investigating hydrodynamic differences across various layers to better understand sedimentary dynamics over the past two decades. This study will further examine how bioturbation affects radioactive dating results, which will help to establish a more accurate chronological model for sedimentary records.


References

Chih-An Huh, Hui-Ling Lin, Saulwood Lin, Ya-Wen Huang, Modern     accumulation rates and a budget of sediment off the Gaoping (Kaoping) River, SW Taiwan: A tidal and flood dominated depositional environment around a submarine canyon, Journal of Marine Systems, Volume 76, Issue 4, 2009, Pages 405-416, ISSN 0924-7963, https://doi.org/10.1016/j.jmarsys.2007.07.009

Su, C.-C., S.-T. Hsu, H.-H. Hsu, J.-Y. Lin, and J.-J. Dong, 2018: Sedimentological characteristics and seafloor failure offshore SW Taiwan. Terr. Atmos. Ocean. Sci., 29, 65-76, doi: 10.3319/TAO.2017.06.21.01

How to cite: Wang, B.-H. and Su, C.-C.: Modern Sedimentary Mechanisms and Evolution of Extreme Event Layers Offshore Southwestern Taiwan, EGU General Assembly 2025, Vienna, Austria, 27 Apr–2 May 2025, EGU25-4791, https://doi.org/10.5194/egusphere-egu25-4791, 2025.

EGU25-5284 | ECS | Posters on site | SSP3.8

Study on the long-term shoreline extraction and analysis method on the east coast of Korea using Python toolkit 

Ho-Jun Yoo, Tae-Soon Kang, Dong-Soo Hur, and Sung-Soon Yoon

  In recent years, with the development of computer vision analysis and the free release of satellite images, it has become possible to observe and evaluate coastal and shoreline changes through satellite images. However, the shorelines obtained by satellite detection are instantaneous at the time of satellite capture, and some correction processes are required to validate them with actual monitoring data and ensure their reliability.

  In this study, Landsat and Sentinel-2 satellite images, along with a Python toolkit, were used to analyze shoreline data over a 40-year period on the east coast of Korea. Validation was performed using national research monitoring data collected bi-quarterly over approximately 10 years for 9 sites. Data containing changes greater than the standard deviation and errors in the data itself were removed from the shoreline results. The accuracy of the shoreline data was corrected by comparing it with monitoring data and reflecting the conditions of offshore external forces.

  All of the shoreline changes over the past 40 years have shown a relatively stable change of less than 3m per year. However, there has been rapid continuous change over the past 10 years. This is likely due to recent coastal development, including direct and indirect impacts from artificial structures, nourishment effects, and natural erosion.

  Continuous collection and analysis of shoreline change data are necessary to ensure the stability and management of coastal buffer zones, including coastal hinterlands and sandy beaches, long-term equilibrium, and continuous shoreline changes caused by extreme typhoons, human impacts, and changes in artificial structures. Ensuring coastal resilience and stability through satellite data and analysis methods is crucial. We plan to detect continuous shoreline changes on both the east and west coasts of Korea. Furthermore, research will be needed on digital twin-based data display to ensure convenience for stakeholders and respond effectively to coastal erosion.

How to cite: Yoo, H.-J., Kang, T.-S., Hur, D.-S., and Yoon, S.-S.: Study on the long-term shoreline extraction and analysis method on the east coast of Korea using Python toolkit, EGU General Assembly 2025, Vienna, Austria, 27 Apr–2 May 2025, EGU25-5284, https://doi.org/10.5194/egusphere-egu25-5284, 2025.

       The Dangerous Grounds, located along the southern margin of the South China Sea, has undergone substantial tectonic and paleogeographic changes during the Cenozoic, spanning three distinct evolutionary stages: continental rifting, breakup from South China and southward drift, and collision with Borneo. This study utilized a robust dataset comprising 67 seismic reflection profiles, complemented by drilling and dredging data, to quantitatively reconstruct the sedimentary filling history of the Dangerous Grounds. By correlating sediment budget outcomes with the spatial distribution characteristics of sediment thickness, we have gained valuable insights into the region’ s geological evolution.

       Our findings reveal a progressive increase in sediment budgets across the three tectonic stages, despite relatively stable sediment budgets during the southward drift stage associated with seafloor spreading. Spatial analysis of sediment distribution, as revealed by sediment isopath maps, shows a continued decrease in the north and expansion in the south and west, suggesting the influence of regional tectonic transitions and variations in paleogeographic environment. By integrating the temporal and spatial distribution of depocenters with drilling results and sediment provenance geochemical analyses, we provides a comprehensive regional perspective on the factors controlling sediment budget trends, including regional tectonic transitions, variations in paleogeographic environment (such as climate, sea level, and sedimentary facies, and the evolution of local river systems).

       The sedimentary inputs to the Dangerous Grounds have shifted over time, with Paleocene-Eocene sediments primarily originating from the north. From the Oligocene to the Early Miocene, northern sediment supply progressively declined, while inputs from the southwest, transported through river systems originating in the Indochina and Malay Peninsulas, gradually increased. Since the Mid-Miocene, the collision with Borneo has led to enhanced sediment supply from the south, with sediments predominantly accumulating along slope edges, channel outlets, and within the Nansha Trough.

How to cite: Wang, F. and Ding, W.: Impacts of Tectonic-Paleogeographic Transitions on Cenozoic Sedimentary Distribution in the Dangerous Grounds, South China Sea, EGU General Assembly 2025, Vienna, Austria, 27 Apr–2 May 2025, EGU25-5567, https://doi.org/10.5194/egusphere-egu25-5567, 2025.

Grain-size of clastic sediment is generally considered to be the result mainly of physical processes active during transport and deposition (e.g. grain-size sorting by dimension/density, sediment by-pass); less importance is generally given to other factors, such as the parent rock lithology. In this work, we investigate the control exerted by the parent rock lithology on the grain-size of daughter sediments. Our approach combines fieldwork-based sediment characterization (in-situ grain-size measurements and petrographic analysis of pebbles > 2 cm), laboratory analyses (sieving, measurement and petrographic point counting at the microscope on grains < 2 cm) and geospatial statistics of the source area.

To do so, we selected as study site a sandy-gravelly bar of the Avisio River, located in Valle di Fassa (Dolomites, Italy) which is sourced by a relatively small catchment area made by very different parent rocks. This allows us to disregard the effect of sediment transport from the source to the sampled depositional site, i.e. to consider the analysed samples representative of the sediment produced at the source by the studied catchment. The lithologies exposed in the catchment area are mainly represented by (i) dolostones, (ii) mafic to intermediate volcanics and (iii) limestones and sandstones, which all outcrop in similar proportions. From the fluvial bar, we collected sand and gravel samples analysing their dimensional (pebble measurements and grain-sizes sieving) and compositional properties (rock identification and sedimentary petrography). We analysed both the overall grain-size and composition of the collected samples and the composition of each grain-size fraction between 16 cm and 0.075 mm contained in each sample. Moreover, we performed a GIS-based geospatial analysis of the sediments source area to quantify the rock type distribution and have the true geology of the source region to be compared with its image provided by its daughter sediments.

Our results show a significant relationship between grain-size and sediment composition: gravels are mainly made by dolostone pebbles, while sands are mainly composed of volcanic grains. This trend persists across the separated grain-size portions: sediment fractions > 1 mm are richer in dolostone grains, while sediments fractions < 1 mm are richer in volcanic grains, and proves that dolostone and volcanic rocks feed at the source daughter sediments with dramatically different grain-size curves. Moreover, none of the samples shows the same proportion of the compositional distribution derived from the GIS-based geospatial analysis (i.e., similar proportion between the three lithologies considered).

These findings indicate that since their origin, sediment grain-size is strongly controlled by different weathering effects on the diverse parent rocks and therefore distinct grain-sizes provide very different geologic scenarios for the same source rock geology. This, while often overlooked, significantly impact provenance studies aimed to paleo-geologic reconstructions and must be also carefully considered in facies tract models, challenging the assumption that grain-size variations along depositional systems are solely due to physical processes acting on sediments having at the origin a simple grain-size distribution.

How to cite: Pezzoli, S., Menegoni, N., and Di Giulio, A.: Parent rocks control on grain-size of daughter sediments and implications for provenance studies: insights from the Avisio River (Dolomites, Italy), EGU General Assembly 2025, Vienna, Austria, 27 Apr–2 May 2025, EGU25-6440, https://doi.org/10.5194/egusphere-egu25-6440, 2025.

EGU25-6880 | Orals | SSP3.8

Ayeyarwady-Thanlwin Rivers Shelf Sediment Dispersal: A High-Discharge Tidally-Dominated Monsoon-Influenced Tectonically-Active Setting 

Steven Kuehl, Evan Flynn, Day Wa Aung, Ko Yi Hla, and Courtney Harris

The Ayeyarwady-Thanlwin rank among the world’s top three river systems in terms of sediment load, and discharge into the energetic shelf environment of the Northern Andaman Sea.  The fate of this material has been investigated through a range of interdisciplinary studies since a 2017 field campaign to the present, and here we synthesize the resulting findings based on a combination of sedimentological, geochemical and oceanographic insights.  With no dams along the mainstems, this system has remained in a relatively steady-state condition during the past century, despite increasing human pressure, primarily from land-use changes and river sand mining. Tectonic setting plays a first-order control on the fate of the rivers’ sediment, with the formation of a mid-shelf pull-apart basin, the Martaban Depression, that serves as the major depocenter for this system.  Oceanographic conditions conspire to feed the rivers’ sediment into the Depression through the action of tides, waves and monsoon-driven circulation.  Extreme tides up to 7 m in amplitude keep sediment in suspension in an extensive shallow embayment, the Gulf of Martaban, before this material is released to the offshore Depression, likely because of some combination of spring-neap excursions, near-bed turbidity flows, or rapid offshore transport during cyclones.  Monsoon winds drive circulation toward the east during the SW Monsoon, coincident with the period of highest river discharge, further focusing sediment discharged from the numerous western Ayeyarwady distributaries into the Gulf.  Modeling results suggest surface and bottom net transport toward the Gulf may occur throughout the year.

Seabed geochemistry contributes much toward our understanding of shelf circulation and sediment dispersal patterns, and the preservation of the immense sediment-associated terrestrial organic carbon discharged by the rivers.  Core-scanning XRF elemental ratios show pronounced east-west trends that are attributed to three distinct sources: the Ayeyarwady, Thanlwin, and small rivers draining the Indo-Burman Range (IBR).  Distinct geochemical signatures on the shelf fronting the IBR suggest that sediment dispersal from the Ayeyarwady-Thanlwin is largely constrained to the Andaman Sea shelf. Downcore profiles of stable carbon isotopes from the Northern Andaman Sea show remarkably uniform values during the past century, suggesting that land-use changes evident in the catchment, especially during the past 50 years, are not preserved in the offshore record.  We suggest that extensive tidal reworking in the Gulf efficiently mutes such signals in the downcore record. Organic carbon studies further suggest that very little remineralization of terrestrial organic matter occurs during transport from the Gulf to the Depression, despite reworking and consequent oxidation in the Gulf.  Based on geochemical budgets of particle-reactive radionuclides scavenged from seawater, we estimate that significant onshore flow of open ocean water must occur, along with the substantial input of marine organic matter.  The absence of an observed “sediment priming” effect reflets the recalcitrant nature of this carbon pool.  The Ayeyarwady-Thanlwin system represents an end member within the family of such systems, and underscores the role of tectonic and oceanographic conditions in determining sediment dispersal and accumulation patterns in the marine environment.

How to cite: Kuehl, S., Flynn, E., Wa Aung, D., Yi Hla, K., and Harris, C.: Ayeyarwady-Thanlwin Rivers Shelf Sediment Dispersal: A High-Discharge Tidally-Dominated Monsoon-Influenced Tectonically-Active Setting, EGU General Assembly 2025, Vienna, Austria, 27 Apr–2 May 2025, EGU25-6880, https://doi.org/10.5194/egusphere-egu25-6880, 2025.

EGU25-7363 | Orals | SSP3.8

Continental input and its relationship with biological sedimentary constituents over the MIS 6 to MIS 1 in the SW Gulf of Mexico 

Elsa Arellano-Torres, Sandra M. Villafuerte-Bazaldua, Priyadarsi Roy, and Juan José Kasper-Zubillaga

To unveil the relationship between reconstructed paleoclimatic and paleoceanographic changes based on geochemical proxies, we analyzed the marine sediment Core RC10-265PC retrieved from the Gulf of Mexico (GoM). The core spans the interval from Marine Isotope Stage (MIS)-6 to MIS-1 at a glacial to interglacial scale resolution. We studied the relationship between changes in biogenic constituents as proxies of primary productivity and those in continental terrigenous contributions as a source of micronutrients. The core constituents were identified and described by determining carbon content, the elemental concentration by X-ray fluorescence (XRF), and the mineral phases by X-ray diffraction (XRD). The biological constituents include total organic carbon (TOC) and calcium carbonate (CaCO3), whereas terrigenous constituents mainly include the major elements Si, Fe, K, Al, and Ti. In the core, we observed four ash deposits with high Si, K, and Zr concentrations but low in Al, Fe and Ca. Although they were a few cm thick, they did not contribute to increasing primary production. The XRD analysis in the bulk sediments shows that the most abundant mineral phases are calcite, phyllosilicates, quartz, feldspar, and pyroxene. Overall, increases in terrigenous components occurred during the early MIS-6, from MIS-5e to MIS-2, and during MIS-1. In parallel, a decrease in CaCO3 occurred, sometimes coincident with TOC increases. The former suggests a dilution of calcareous by terrigenous components that possibly arrived at the basin by riverine inputs. Such an input increase is not in tune with the latitudinal displacement of the Intertropical Convergence Zone nor with orbital periodicities. However, neighbouring evidence suggests moisture and runoff increase at the regional level, revealing that the oligotrophic oceanographic conditions in the GoM have remained for approximately 180 ka. Such findings expose several ecological implications if eutrophic conditions emerge under modern climate change.

How to cite: Arellano-Torres, E., Villafuerte-Bazaldua, S. M., Roy, P., and Kasper-Zubillaga, J. J.: Continental input and its relationship with biological sedimentary constituents over the MIS 6 to MIS 1 in the SW Gulf of Mexico, EGU General Assembly 2025, Vienna, Austria, 27 Apr–2 May 2025, EGU25-7363, https://doi.org/10.5194/egusphere-egu25-7363, 2025.

The Ayeyarwady and Thanlwin Rivers deliver ~485 Mt of sediment/year to the northern Andaman Sea. The Ayeyarwady river mouths empty via the Ayeyarwady Delta, while the Thanlwin empties into the Gulf of Martaban located east of the delta. The Gulf of Martaban is a macrotidal, shallow embayment, and the abundant sediment supply and tidal energy make it one the world’s largest perennially turbid zones. Seasonal monsoons bring high precipitation during summer when winds are energetic and from the southwest (SW), and dry during winter when winds are moderate and from the northeast (NE). Surface circulation implies that sediment would be trapped in the northern Andaman Sea during SW monsoon and exported to the Bay of Bengal during the NE monsoon. A clinoform depocenter has been found seaward of the Gulf, and a second depocenter on the northwest side of the delta in the Bay of Bengal. The phasing and timing of sediment delivery to these depocenters has relevance for sediment budget, event preservation, and carbon cycling, however, the sediment delivery mechanisms to these depocenters remain a question.

To address this, a coupled hydrodynamic and sediment transport numerical model was used to quantify suspended sediment dispersal offshore of the Ayeyarwady delta and within the Gulf of Martaban. Based on the Regional Ocean Modeling System (ROMS), it accounted for suspended sediment fluxes and used SWAN (Shallow Waves Nearshore) for waves. Open boundary and atmospheric conditions were derived from available global model products to account for larger scale ocean conditions and winds. The model has been run using different versions of initial sediment bed grain size distributions, based on either simple assumptions or historical and recent grain size observations. The magnitude of suspended sediment flux shows sensitivity to the initial grain size distribution, but the overall seasonal and tidal trends are less sensitive.

Model applications to date have focused on quantifying the variability of suspended sediment flux over tidal and seasonal timescales. The model has been run for two one-month cases: one each representative of the winter and the summer monsoon. Results indicated that offshore of the delta, surface currents flowed eastward during the summer monsoon and westward during the winter monsoon. The bottom currents offshore of the delta, however, showed less dependence on seasonal signals and were westward on average for both the summer and winter model runs. Within the macrotidal Gulf of Martaban, turbidity was maintained by asymmetric tidal trapping. Sediment export from the Gulf primarily directed toward the Martaban Depression Clinoform, with very little sediment delivered westward to the Bay of Bengal.  Sediment export was larger during the summer than the winter monsoon, and especially high during spring tides that extended the turbid area to the vicinity of the clinoform.  

How to cite: Harris, C. and Du, Z.: Seasonal and tidal variability in suspended sediment dispersal offshore of the Ayeyarwady delta, Myanmar: results from a numerical model, EGU General Assembly 2025, Vienna, Austria, 27 Apr–2 May 2025, EGU25-7518, https://doi.org/10.5194/egusphere-egu25-7518, 2025.

EGU25-7649 | Orals | SSP3.8

Sediment source to sink process and controlling mechanism from the Bengal Bay to the East Siberian Sea of Asian continental margin  

Xuefa Shi, Shuqing Qiao, Shengfa Liu, Jianjun Zou, Yanguang Liu, Zhengquan Yao, Kunshan Wang, Limin Hu, and Jingrui Li

The Asian continental margin is located at the convergence and collision boundary of the Eurasian, Pacific and Indo-Australian plates, and is subjected to the strongest land-sea interactions and the most frequent exchanges of material and energy. The rivers in the Asian continental margin contributes about two-thirds of the global sediments from rivers to the ocean, which has a great impact on the sedimentation, biogeochemical processes and marine ecology of the marginal seas and the global oceans. Through international cooperation, we have studied the sediment source to sink system and paleoenvironment in the Asian continental margin from the East Siberian shelf in the north to the Bay of Bengal in the south. We compiled a serial of sediment type map with different scales of the Asian continental margin, and elaborated the distribution pattern of the sediments; We established a set of effective provenance tracing index system to elucidate the properties of fluvial sediments, identified the sediments provenance in Bay of Bengal, east China seas, Sea of Japan, and East Siberian Sea, described the transport and deposition processes of the fluvial sediment in the sea, and established the sedimentation model for the key areas; The source, input mode and burial of organic carbon on the shelf at different latitudes and their response to natural processes and human activities have been quantitatively evaluated; The controlling mechanism of sediment source-sink process impacted by the Asian monsoon, sea level change, uplift of Tibetan Plateau, sea current and sea ice variations has been revealed.

How to cite: Shi, X., Qiao, S., Liu, S., Zou, J., Liu, Y., Yao, Z., Wang, K., Hu, L., and Li, J.: Sediment source to sink process and controlling mechanism from the Bengal Bay to the East Siberian Sea of Asian continental margin , EGU General Assembly 2025, Vienna, Austria, 27 Apr–2 May 2025, EGU25-7649, https://doi.org/10.5194/egusphere-egu25-7649, 2025.

EGU25-8410 | ECS | Orals | SSP3.8 | Highlight

Sedimentary Signatures of Typhoon: Insight from Core Record in the South China Sea 

Yu-Huang Chen, Chih-Chieh Su, Pai-Sen Yu, Tai-Wei Hsu, Sheng-Ting Hsu, Hsing-Chien Juan, and Yuan-Pin Chang

Sedimentary records of event deposits are crucial for regional natural disaster risk assessments and hazard history reconstructions. This study aims to identify deep-sea typhoon deposits through immediate post-event sampling following super typhoon Haiyan (2013) and typhoon Morakot (2009). After super typhoon Haiyan passed through the South China Sea in 2013, five gravity cores were collected along the typhoon path in the southern South China Sea Basin (>3800 mbsl). The results showed that Super Typhoon Haiyan deposits with clear graded bedding are preserved at the top of all cores. The thickness of the typhoon layers ranges from 20 to 240 cm and is related to changes in typhoon intensity. The lack of river-connected submarine canyon systems limited the transportation of terrestrial sediments from land to sea. Super Typhoon Haiyan-induced large surface waves played an important role in carrying suspended sediment from the Philippines. A distinctive feature is that Mn-rich layers were found at the bottom of the typhoon layers, potentially linked to the soil and rock composition of the Palawan region, which experienced tsunami-like storm surges caused by super typhoon Haiyan. Similar Mn-rich layer characteristics were also observed in the typhoon Morakot (2009) layer in the sediment cores from the lower reach of Gaoping submarine canyon. These Mn-rich layers may serve as a proxy for sediment export from large-scale extreme terrigenous events. This study provides the first sedimentary record of extreme typhoon events in the deep basin of South China Sea, which may shed light on reconstructing regional hazard history.

How to cite: Chen, Y.-H., Su, C.-C., Yu, P.-S., Hsu, T.-W., Hsu, S.-T., Juan, H.-C., and Chang, Y.-P.: Sedimentary Signatures of Typhoon: Insight from Core Record in the South China Sea, EGU General Assembly 2025, Vienna, Austria, 27 Apr–2 May 2025, EGU25-8410, https://doi.org/10.5194/egusphere-egu25-8410, 2025.

EGU25-8426 | ECS | Orals | SSP3.8

Relative influence of allogenic forcings on shallow-marine sedimentary archives, Taiwan Western Foreland Basin 

Amy I. Hsieh, Romain Vaucher, James A. MacEachern, Christian Zeeden, Chuqiao Huang, Andrew T. Lin, Ludvig Löwemark, and Shahin E. Dashtgard

An analysis of allogenic forcing on shallow-marine strata of the Miocene–Pliocene Kueichulin Formation in the Taiwan Western Foreland Basin shows that changes in the sedimentary record were predominantly driven by: 1) orogenesis and basin subsidence, 2) precession-driven changes in hydroclimate, and 3) obliquity-driven changes in atmospheric and ocean circulation.

The transition from a wave-dominated open shelf to a tide-dominated shallow-marine deltaic environment was influenced by a combination of basin subsidence and the denudation of Taiwan. The rapid deepening of the Western Foreland Basin near 5400 Ka and low sedimentation rates resulted in the formation of lower offshore to distal delta front environments, characterized by limited fluvial and storm influences. Shallow-marine deltaic environments formed as sediment from Taiwan filled the Western Foreland Basin, as a result of accelerated uplift after 4920 Ka, and rapid erosion of the orogen by tropical cyclone precipitation intensified. Tidal currents also intensified as the paleo-Taiwan Strait became shallower and narrower with continued uplift and southwest migration of Taiwan. The sedimentary record also shows a strong link between sedimentation and hydroclimate, driven by eccentricity-modulated precession. Tropical cyclone deposition corresponds to precession maxima, with amalgamated beds that form during periods of sea-level minima. Periods of high obliquity and associated changes in atmospheric and ocean circulation also resulted in a strengthening of tidal currents, recorded as a prevalence of tidal beds in the stratal record.

The findings of this study demonstrate the effectiveness of shallow-marine strata as a paleoenvironmental archive with the potential to resolve the influence of competing allogenic controls on sedimentary systems, which is crucial for understanding how depositional systems responded to climate change, tectonic activity, and sea-level fluctuations throughout Earth’s history.

How to cite: Hsieh, A. I., Vaucher, R., MacEachern, J. A., Zeeden, C., Huang, C., Lin, A. T., Löwemark, L., and Dashtgard, S. E.: Relative influence of allogenic forcings on shallow-marine sedimentary archives, Taiwan Western Foreland Basin, EGU General Assembly 2025, Vienna, Austria, 27 Apr–2 May 2025, EGU25-8426, https://doi.org/10.5194/egusphere-egu25-8426, 2025.

EGU25-8616 | ECS | Orals | SSP3.8

Controls on sedimentary deposits in the coastal environments of the Paris Basin at the Eocene-Oligocene transition. 

Mathilde Beernaert, Laurence Le Callonnec, Fabrice Minoletti, Hugues Bauer, Didier Merle, Jean-Paul Baut, and Bertrand Génault

The Eocene-Oligocene Transition (‘EOT’) marks a global deterioration in climate associated with the establishment of the Antarctic polar ice cap, but is poorly constrained in continental areas. In Europe, a marked seasonality and a major replacement of European flora and fauna by Asian species (the ‘Grande Coupure’ described by Stehlin, 1909) were recorded during this period. Deposits at the ocean-continent interface are recorded in the Paris Basin at the EOT, from the lagoon-marine to the lacustrine domains. Lithology and facies distribution are therefore controlled by mechanisms on a global and local scale (tectono and glacio-eustatism, climate, tectonic), which need to be differentiated and highlighted. We present a mineralogical, elemental and isotopic geochemistry record of three Upper Priabonian to Upper Rupelian sections located in the northern Paris basin (Cormeilles-en-Parisis, Le Pin-Villeparisis and Saint-Soupplets), near the Bray anticline. Cormeilles-en-Parisis, the westernmost, is located in the Saint-Denis synclinal and shows the most complete sedimentary sequence, more clayey and carbonaceous. It is fossiliferous but not very diverse. The Saint-Soupplets section, located on the eastern flank of the perianticlinal end of the Bray, shows the same sequence of formations as the Cormeilles-en-Parisis section, but is characterised by sandier deposits with current and erosive figures. The Le Pin-Villeparisis section, located on the western flank of the Bray anticline and between the two other sections, is truncated in its upper part and relatively condensed. It is essentially clayey and mostly barren of fossils.

In the Upper Priabonian, the sedimentary record shows a tectonic pulse at the origin of terrigenous inputs and the creation of positive topography, then the Late Eocene regression and the decrease of the tectonic activity inducing the progradation of continental deposits. In the Lower Rupelian, the long-term increase in detrital terrigenous deposits and the environmental changes suggested by floral and faunal data are probably due to the combination of tectonics and eustatism. To the west (Cormeilles-en-Parisis section), a few evaporitic levels show a lagoonal environment that is almost always submerged. To the east, the sections are incomplete (erosive levels and missing formations), influenced by the structure of the anticline, which forms a topographic barrier and a positive relief. The absence of certain formations and the presence of a clearly lacustrine formation at the top of the Le Pin-Villeparisis section show the proximity of the coastline, which is more prone to emersion when subjected to tectonic uplift. 


Reference: 

Stehlin, H., 1909. Remarque sur les faunules de mammifères des couches éocènes et oligocènes du Bassin de Paris. Bull. Société Géologique Fr. 19, 488–520.

How to cite: Beernaert, M., Le Callonnec, L., Minoletti, F., Bauer, H., Merle, D., Baut, J.-P., and Génault, B.: Controls on sedimentary deposits in the coastal environments of the Paris Basin at the Eocene-Oligocene transition., EGU General Assembly 2025, Vienna, Austria, 27 Apr–2 May 2025, EGU25-8616, https://doi.org/10.5194/egusphere-egu25-8616, 2025.

EGU25-9213 | Orals | SSP3.8

Interstitial soluble salts in Dead Sea lakes sediments as monitors of the East Mediterranean-Levant hydroclimate during the past ~ 100 kyr 

Mordechai Stein, Omri Khalifa, Pamela Schimmer, Amitai Katz, and Boaz Lazar

Temporal variations in the Na/Cl, Mg/Cl, Br/Cl, Br/Mg ratios of deep brines that filled the Dead Sea Basin during the past ~100 kyr were retrieved from soluble salts within the lake’s sediments. The soluble salts were extracted from cores drilled in the Dead Sea floor and sediments of the last glacial from the high margins of the Dead Sea. The variations in these elemental ratios (e.g., declining/rising Na/Cl ratios) reflect processes of halite precipitation/dissolution during arid/wet periods in the drainage basin, respectively, and exchanges between the epilimnion and hypolimnion brine. Ions of Na+ and Cl- were mainly supplied to the brines by the dissolution of the Mount Sedom salt diapir and halite deposits at the lake’s margins (e.g., halite which precipitated during arid periods of the last interglacial). The main observations are: (1) Between ~100-30 ka the deep lake’s hypolimnion evolved through a steady “enrichment” by Na+ and Cl- ions, due to continuous dissolution of marginal halite and/or from the Mt. Sedom salt diapir. Towards the end of this period, between ~43-30 ka, the Amiaz plain, a marginal basin, that comprised a semi-isolated water body, witnessed frequent episodes of halite precipitation/dissolution with temporal patterns that resemble millennial temperature (δ18O) variations in the Greenland ice core; (2) Between ~30-18 ka (MIS 2), when Lake Lisan reached its highest stands and maximum spatial expansion, the soluble salts indicate on frequent changes in the composition of the hypolimnion, reflecting centennial dissolution cycles of the Mt. Sedom salt diapir; (3) Between ~18-9 ka, when the lake declined to low levels, the variations in the elemental ratios reveal several episodes of enhanced supply of freshwater to the shrinking lake, causing massive halite dissolution and supply of Na+ and Cl- to the hypolimnion. The long-term (~100 kyr) pattern in the elemental ratios of the hypolimnion resembles global CO2 concentrations and sea temperature trends, while the short-term fluctuations in these ratios are correlated with short warm/cold cycles in the Greenland ice core δ18O data, indicating a strong impact of the global climate engines on the regional hydro-climate in long and short time scales.

How to cite: Stein, M., Khalifa, O., Schimmer, P., Katz, A., and Lazar, B.: Interstitial soluble salts in Dead Sea lakes sediments as monitors of the East Mediterranean-Levant hydroclimate during the past ~ 100 kyr, EGU General Assembly 2025, Vienna, Austria, 27 Apr–2 May 2025, EGU25-9213, https://doi.org/10.5194/egusphere-egu25-9213, 2025.

EGU25-9273 | ECS | Orals | SSP3.8

Elementome trajectories: a framework for studying ecosystem biogeochemical shifts in paleoenvironmental records. 

Javier de la Casa Sánchez, Josep Peñuelas, Miquel de Cáceres, Jordi Sardans, Sergi Pla-Rabés, Mario Benavente, Santiago Giralt, Armand Hernández, Pedro Raposeiro, Álvaro Castilla-Beltrán, Lea de Nascimento, and Sandra Nogué

X-ray fluorescence (XRF) and other advanced analytical techniques provide detailed information on geochemical composition in chronologically dated sedimentary sequences. These methods yield high-resolution data on elemental concentrations and ratios, enabling the reconstruction of past environmental conditions. In this contribution, we introduce a novel approach that uses multivariate analysis of all available biogeochemical and geochemical data (elementome) to characterize the trajectories of elemental composition over time and link them to drivers of environmental change. Our analysis of records from Atlantic islands, characterizing the magnitude, graduality and direction of biogeochemical shifts in paleoecological records from several archipelagos, shed light to a potential modern-time shift towards organic-dominated elementomes; and on the effect of human arrival and climate changes on the stability of ecosystem elementomes. Moving ahead, elementome trajectories hold promise as descriptive tools for paleoecology, but also in the interpretation of biogeochemical shifts at any timescale.

How to cite: de la Casa Sánchez, J., Peñuelas, J., de Cáceres, M., Sardans, J., Pla-Rabés, S., Benavente, M., Giralt, S., Hernández, A., Raposeiro, P., Castilla-Beltrán, Á., de Nascimento, L., and Nogué, S.: Elementome trajectories: a framework for studying ecosystem biogeochemical shifts in paleoenvironmental records., EGU General Assembly 2025, Vienna, Austria, 27 Apr–2 May 2025, EGU25-9273, https://doi.org/10.5194/egusphere-egu25-9273, 2025.

EGU25-9382 | ECS | Orals | SSP3.8

Sediment recycling in the South Pyrenean Foreland Basin: impact of grain size and source rock distribution on compositional signatures 

Marta Roigé, David Gómez-Gras, Xavier Coll, Daniel Stockli, Antonio Teixell, Salvador Boya, and Miquel Poyatos-Moré

Sedimentary provenance studies have long played a crucial role in elucidating source-to-sink processes across various tectonic settings throughout geological time. Foreland basins, in particular, record the erosional and exhumation history of their source areas, offering valuable insights into the chronology of deformation and the evolution of drainage areas. However, detrital signatures do not always fairly represent the composition of their drainage areas. Therefore, efforts are needed to better understand the factors controlling signal propagation from primary sources to ultimate sinks. The Jaca-Pamplona basin in the southern Pyrenees provides an excellent opportunity to explore the propagation and distribution of provenance signals in a setting with multiple source areas. We present combined data from detrital zircon U-Pb dating, sandstone petrography, and pebble point counting which allow us to infer the source area composition, its evolution, and the controls on provenance signal propagation. Our results indicate that alluvial fans had a source area composed of the North Pyrenean Zone and earlier, deep-marine synorogenic deposits, as evidenced by the overwhelming presence of recycled turbidite clasts. However, detrital zircon U-Pb age data from these alluvial fan deposits show a dominant Cadomian signature, while the turbidites exhibit a dominant Variscan signature, highlighting the complexity introduced by sediment recycling. We propose that the areal distribution of source rocks in the drainage area, transport distance, and differential weathering processes can explain this compositional effect. This is further supported by the clear grain-size dependence of the petrographic detrital modes, which show a positive correlation between grain size and the amount of recycled grains. Therefore, this study underscores the importance of integrating various provenance techniques to improve provenance reconstructions and to identify the intrinsic factors controlling the propagation and representativity of sediment sources.

How to cite: Roigé, M., Gómez-Gras, D., Coll, X., Stockli, D., Teixell, A., Boya, S., and Poyatos-Moré, M.: Sediment recycling in the South Pyrenean Foreland Basin: impact of grain size and source rock distribution on compositional signatures, EGU General Assembly 2025, Vienna, Austria, 27 Apr–2 May 2025, EGU25-9382, https://doi.org/10.5194/egusphere-egu25-9382, 2025.

EGU25-9822 | ECS | Posters on site | SSP3.8

A multi-proxy reconstruction of past erosion dynamics based on lake sediments from the northern Ecuadorian Andes 

Bjarne Heyer, Lisa Feist, Volker Karius, Agnieszka Halaś, Michal Słowiński, Liseth Pérez, Patricia Mothes, Elizabeth Velarde-Cruz, Alejandra Valdés-Uribe, Ana Mariscal Chávez, and Elisabeth Dietze

Lake sediments in mountain areas worldwide have been analysed to reconstruct erosion dynamics on local to regional scales. In the tropical Andes, an area of globally-relevant biodiversity hotspots and carbon sinks, long-term erosion patterns in response to climate and land use change are poorly known. In this study we examine the local erosion history as archived in a high-elevation (<3,700m asl) caldera lake north of Ecuador’s capital Quito. A multi-proxy approach was conducted on a 72 cm-long lake sediment core retrieved from Caricocha in the Mojanda Lake Region, including visual core description, X-ray fluorescence (XRF) core-scanning, magnetic susceptibility (MS), C/N and grain-size analyses. Two radiocarbon dates were combined with tephra-stratigraphy to derive a viable timeframe for sediment accumulation. Data obtained from XRF, MS, C/N and grain-size analyses were evaluated using multivariate statistical methods. Results from cluster and principal component analysis revealed at least 3 stratigraphic units alternating with at least 8 tephra layers. We will discuss a multi-proxy approach to identify different sedimentary environments, sources of material and underlying patterns in this volcanically active region. Including log-transformed element ratios of the XRF data we report on the challenges to disentangle proxies for past erosion dynamics from further palaeoenvironmental conditions, of relevance for future land use under climate change.

How to cite: Heyer, B., Feist, L., Karius, V., Halaś, A., Słowiński, M., Pérez, L., Mothes, P., Velarde-Cruz, E., Valdés-Uribe, A., Mariscal Chávez, A., and Dietze, E.: A multi-proxy reconstruction of past erosion dynamics based on lake sediments from the northern Ecuadorian Andes, EGU General Assembly 2025, Vienna, Austria, 27 Apr–2 May 2025, EGU25-9822, https://doi.org/10.5194/egusphere-egu25-9822, 2025.

EGU25-11379 | ECS | Posters on site | SSP3.8

Superposition and Intra-Stratal Bedding: Comparing the effects of different diagenetic models on stratigraphy. 

Theresa Nohl, Axel Munnecke, and V. Paul Wright

The principles of stratigraphy, rooted in the foundational works of Nicolaus Steno, William Smith, and Johannes Walther, assert that sedimentary layers are deposited sequentially and preserve a temporal and environmental record. While these principles have guided stratigraphic interpretation for centuries, carbonate successions challenge their straightforward application due to the impact of diagenetic processes. This was clear to earlier work on diagenetic bedding by e.g. Robin Bathurst or Werner Ricken, who discussed the implications for their models. More recent work on early diagenetic transformations, including dissolution, cementation, and differential compaction, can modify or completely obscure primary depositional features, resulting as well in a specific type of secondary “diagenetic bedding,” introducing intra-stratal lithological patterns that mimic primary bedding but are unrelated to depositional events.

Here we compare the mechanisms behind a variety of types of diagenetic bedding, with a focus on their implications for stratigraphy, paleoenvironmental reconstruction, and geochronology. We demonstrate how secondary features can disrupt traditional stratigraphic assumptions, obscure temporal resolution by combining distinct depositional layers into single beds or splitting original layers into multiple diagenetic units, and explore how differential preservation of aragonitic and calcitic components introduces spatial and temporal variability in fossil records, potentially disrupting correlations across stratigraphic sections. We summarise for the individual diagenetic models the key features to identify diagenetic bedding and the potential implications for stratigraphic applications.

How to cite: Nohl, T., Munnecke, A., and Wright, V. P.: Superposition and Intra-Stratal Bedding: Comparing the effects of different diagenetic models on stratigraphy., EGU General Assembly 2025, Vienna, Austria, 27 Apr–2 May 2025, EGU25-11379, https://doi.org/10.5194/egusphere-egu25-11379, 2025.

EGU25-11785 | Posters on site | SSP3.8

Facies modeling of Cenozoic successions in the Gunsan Basin using statistical methods 

Changyoon Lee and Sun Young Park

The Gunsan Basin is located between the eastern Chinese coast and the Korean Peninsula. The basin originated during the Cretaceous due to tectonic activity. After several rifting events, the final rift occurred during the Oligocene. Since the Miocene, the postrift phase has been ongoing to the present day. This study focuses on the interval of the final rifting event of the Cenozoic. The Gunsan Basin remains a frontier basin for hydrocarbon exploration, with only five wells drilled between 1975 and 1991. The study area is located in the eastern sag, known as the East Subbasin, approximately 26 km from the nearest well. Typically, more than 10 wells are needed near a reservoir to predict sand bodies effectively. In this study, we employed geostatistics to generate facies models. The Sequential Indicator Simulation (SIS), one of the stochastic methods, is particularly effective for modeling facies in areas with sparse well data. The pixel-based SIS approach is using trend maps, especially when lateral information is unavailable. These trend maps, derived from the RMS (Root Mean Square) attribute, are based on amplitude and help delineate facies. During the Miocene, the paleoenvironments in the depocenter and margin were lacustrine and littoral, respectively, and the lithology was interpreted as mudstone and sandstone. The transition from littoral to lacustrine environments is attributed to thermal subsidence. Through attribute analysis, we indirectly infer the rift system and the associated facies changes.

How to cite: Lee, C. and Park, S. Y.: Facies modeling of Cenozoic successions in the Gunsan Basin using statistical methods, EGU General Assembly 2025, Vienna, Austria, 27 Apr–2 May 2025, EGU25-11785, https://doi.org/10.5194/egusphere-egu25-11785, 2025.

EGU25-11902 | ECS | Orals | SSP3.8

Spatial and temporal evolution of tidal channels' submarine geomorphology in the northern Venice Lagoon, Italy 

Taha Lahami, Irene Guarneri, Daphnie Galvez, Antonio Petrizzo, Mariacristina Prampolini, Valentina Grande, Giorgio Castellan, Federica Rizzetto, Federica Foglini, and Fantina Madricardo

Tidal environments are highly dynamic systems whose evolution is shaped by a complex interplay of natural and anthropogenic factors. These systems respond to intricate hydrodynamic processes such as tidal asymmetry, sedimentation, and channel morphodynamics. These environments are characterised by the presence of tidal channels, which are critical for ecosystem functioning as they facilitate the exchange of water, sediments, and nutrients. Despite their importance, the spatial and temporal evolution of tidal channels remains insufficiently studied, particularly in terms of their morphological and sedimentological characteristics. Information on their evolution is particularly relevant in densely populated areas, where natural processes are closely connected with anthropogenic pressures.

This study aims to explore the tidal channel seafloor characteristics and spatiotemporal evolution focussing on a case study from the northern Venice Lagoon.

With this aim, high-resolution MultiBeam Echo-Sounder (MBES) bathymetry and backscatter data were acquired over an eight-year period, in 2013 and 2021. Ground truth sediment samples and seabed video footage were collected to characterize the substrate and validate the maps produced from the MBES acoustic data. Morphological features were analyzed in a GIS environment using bathymetric data.  The analysis identified both erosional and depositional features, finding depositional features dominating the study area. A seafloor sediment map was generated by classifying backscatter data using the unsupervised Jenks Natural Breaks algorithm. To assess changes over time, data from 2013 were compared to those gathered in 2021. Our findings suggest that deposition processes were predominant, with an overall net sediment accumulation of 542.7 · 10³ m³, strongly influenced by anthropogenic activity, related to the recent operation of mobile barriers at the lagoon inlets and salt marsh restauration efforts in the area.

In the context of rising mean sea levels and associated adaptation measures, this work not only enhances understanding of highly valuable and vulnerable transitional environments but also helps to assess the long-term impact of anthropogenic interventions.

Aknowledgements

This work was partially carried out within the Research Program Venezia 2021, with the contribution of the Provveditorato for the Public Works of Veneto, Trentino Alto Adige and Friuli Venezia Giulia, provided through the concessionary of State Consorzio Venezia Nuova and coordinated by CORILA. The authors acknowledge the facilities of the International Centre for Advanced Studies on River-Sea Systems DANUBIUS-RI (https://www.danubius-ri.eu/ ) in undertaking this research.

How to cite: Lahami, T., Guarneri, I., Galvez, D., Petrizzo, A., Prampolini, M., Grande, V., Castellan, G., Rizzetto, F., Foglini, F., and Madricardo, F.: Spatial and temporal evolution of tidal channels' submarine geomorphology in the northern Venice Lagoon, Italy, EGU General Assembly 2025, Vienna, Austria, 27 Apr–2 May 2025, EGU25-11902, https://doi.org/10.5194/egusphere-egu25-11902, 2025.

EGU25-11989 | ECS | Posters on site | SSP3.8

Tephrochronological analysis of the Plio-Pleistocene Chemeron Formation, Baringo Basin, Kenya: Refining stratigraphy and constraining chronology of vertebrate fossil sites 

Adeera Batlay, Catherine Beck, John Kingston, Emma Mbua, Matthew M. Skinner, Tracy Kivell, and Habiba Chirchir

Tephrochronology provides a stratigraphic approach to correlating geologic and paleoenvironmental events using volcanic ash layers. Stratigraphic correlation, especially over local and regional scales, plays a vital role in tracing the evolutionary trajectory of our hominin relatives across space and time in eastern Africa. The goal of this study is to employ tephrochronology to distinguish tephra layers within the Chemeron Formation at the site of Sinibo, Kenya. The Chemeron Formation is a sequence of Plio-Pleistocene sediments spanning the 5.3 to 1.6 Ma interval in the eastern foothills of the Tugen Hills — a fault block in the Baringo Basin of the Kenyan Rift Valley. This formation is an ideal site for the application of tephrochronology, as it comprises multiple tuff units interbedded with fluvial and lacustrine deposits that yield mammalian fossils, including hominins. In this project tephra layers from the Sinibo section are differentiated by analysing the geochemistry of volcanic glass shards from the tephra and establishing potential isochronous volcanic events in the stratigraphic record. Tephra samples analysed in this study were collected in the field and analysed for major element geochemistry using an Electron Microprobe. Distinct tephras were reconfirmed, including the Lokochot and Tulu Bor tuffs that are found broadly across eastern Africa. Ultimately, the tephra sequence from the relatively continuous section at Sinibo will be used to constrain the chronostratigraphy of fossil sites in structurally disrupted sequences in the Chemeron Formation. This work builds upon previous analyses (Namwamba, 1993) and is integrated with existing stratigraphy.

How to cite: Batlay, A., Beck, C., Kingston, J., Mbua, E., Skinner, M. M., Kivell, T., and Chirchir, H.: Tephrochronological analysis of the Plio-Pleistocene Chemeron Formation, Baringo Basin, Kenya: Refining stratigraphy and constraining chronology of vertebrate fossil sites, EGU General Assembly 2025, Vienna, Austria, 27 Apr–2 May 2025, EGU25-11989, https://doi.org/10.5194/egusphere-egu25-11989, 2025.

The relationship between depositional environments and transportation processes associated with the general properties of formed siliciclastic sediments has greatly interested researchers. The grain shape properties of the sediments reflect the transport mechanisms of different geomorphological and sedimentary environments. The spread of new, high-resolution analytical methods has made it possible to quickly examine the grain shape properties of a large number of individual mineral grains. We investigated three sediment types from different environments (aeolian, fluvial, glacial, [n=27]) using automated image analysis (Malvern Morphologi G3-ID). During the analysis and data processing (e.g. Kruskal-Wallis, MANOVA, PCA) we examined four variables related to grain shape, which were the following: HS circularity (form, roundness), convexity (surface texture), solidity (roundness) and elongation (form). Our vital aim was to determine the key variables that can help to distinguish certain geomorphological environments and define the possible limits and boundaries of each granulometric feature of the medium sand fraction (250-500 µm). Five groups were distinguished according to the three types of environment (p<0.001; α=0.05). The grains from the aeolian and glacial sediments each formed a separate group, while the grains from the fluvial environments were classified into three groups. HS circularity was the most effective attribute, and the elongation variable proved to be the least influential parameter in differentiating sedimentary environments. However, the high values (mean: 0.24-0.3) of the elongation variable indicate a very fresh state of grains from glacial and certain fluvial samples. The HS circularity value changes slowly over time, and a large amount of energy is needed to increase the roundness value, but relatively less time and presumably shorter distance are required to decrease the surface roughness. We tried to interpret the results by comparing the granulometric properties of recent sediment grains with paleo sediments (aeolian and fluvial, n=15). One additional group was formed containing the highest granulometric values of the investigated samples, and the other sediments were classified into the recent fluvial and aeolian groups. Although according to their stratigraphic position, they should have been classified into the opposite sediment groups, indicating that the paleo-aeolian sediments bear the transport features of the fluvial medium and vice versa. By increasing the number of samples and documentation of grains in various geomorphological environments makes it possible to delineate preliminary grain shape boundaries (e.g. for solidity glacial-fluvial: 0.95; fluvial-aeolian: 0.97). However, this may also have a hindering effect, as the grouping methods hide the differences in some parameters within the classified sediments. Presumably, for example, the aeolian environments may be as diverse as the fluvial ones and need to be studied separately. It is important to note that the presented granulometric fingerprinting method can only provide comprehensive and detailed insights into the depositional environment of the mineral particles when applied together with other proxies.

Support of the National Research, Development and Innovation Office (Hungary) under contract NKFIH FK138692 is gratefully acknowledged.

How to cite: Gresina, F., Farkas, B., Magyar, G., Szalai, Z., and Varga, G.: Comparison of recent sediments from different geomorphological environments using automated static image analysis with insight into its applicability to paleo archives, EGU General Assembly 2025, Vienna, Austria, 27 Apr–2 May 2025, EGU25-12819, https://doi.org/10.5194/egusphere-egu25-12819, 2025.

Alum Shale is a finely laminated organic-rich sedimentary rock which has recorded an anoxic-euxinic period which lasted for more than 20 My during tthe Cambrian and early Ordovician in the current-day Scandinavian region. A younger section (Tremadocian) of Alum Shale formation is located in Estonia, eastern part of the Baltic Paleobasin.

A 10-meter section of Alum Shale (black shale) and associated sediments (glauconitic sandstone, grey shale, sandstone) were scanned in core PED-403 with a Geotek XRF analyser, attached to automated Geotek-MSCL workstation. The concentrations of Mo, U, Ti, Al, S, and Si were analysed and corrected by measuring in-house reference samples.

Mo and U mostly co-vary in the sediments, but certain sections indicate a preferential uptake of Mo instead of U, indicating periods where particulate shuttle was active during slightly more oxic periods. Fine laminae also contain very low Mo and U enrichments, pointing to short-lived oxygenated conditions instead of prevailing perennial oxygen minium zone conditions on the shelf. Suble redox changes do not correlate with sedimentary textures described in the core. Systematic cyclicity was detected in the case of Ti, Al and Si. Sørensen et. Al. (2020) have demonstrated that astronomically forced climate cycles have been recorded in Cambrian-age Scandinavian Alum Shale cores. With follow-up analyses we wish to reveal whether cycles detected in the Estonian core have similar forcings.

This study was supported by EGT-TWINN project (GA no 101079459).

How to cite: Vind, J., Plado, J., and Põldsaar, K.: Millimeter-scale scanning of redox-sensitive elements in Tremadocian Alum Shale for revealing subtle redox variations and cyclicity, northwestern Estonia, Baltic Palaeobasin, EGU General Assembly 2025, Vienna, Austria, 27 Apr–2 May 2025, EGU25-13006, https://doi.org/10.5194/egusphere-egu25-13006, 2025.

EGU25-14906 | ECS | Posters on site | SSP3.8

Subsurface dissection of Holocene inter-reef Halimeda bioherms: morphology, facies and latitudinal variations in the northern Great Barrier Reef 

Zsanett Szilagyi, Luke Nothdurft, Jody Webster, Mardi McNeil, Juan Carlos Braga, Trevor Graham, Bethany C. Behrens, Yusuke Yokoyama, Robin Beamen, Victorien Paumard, Jeffrey Shragge, Sarah Goh, Jacquelin Reeves, Lara Picton, and Helen Bostock

Halimeda, calcareous green algae, bioherms are among the largest inter-reef biogenic structures in the Great Barrier Reef, spanning over >6000 km2 of the continental shelf – an area exceeding the adjacent coral reefs at equivalent latitudes1. Previous studies have shown the peculiar circular to reticulate shapes, the internal structure and volume of these accumulations, underscoring their significant contribution to the global neritic carbonate factory throughout the Holocene2,3. However, a comprehensive understanding of the formation and development of these uniquely shaped bioherms has been hindered by the absence of densely spaced core samples that target bioherm morphologies.

This study presents new data from the 2022 RV Investigator voyage IN2022_V07 “Halimeda bioherms: Origins, function and fate in the northern Great Barrier Reef (HALO)”. Forty-two densely spaced vibrocores were collected (up to 6 m length) over 3 inter-reef sites between lat 15⁰ 48’ 45” S and lat 13⁰ 21’ 11” S. Core locations to target bioherm morphotypes were collected with the aid of 50 cm resolution multibeam bathymetry data, and closely spaced sub-bottom profiles collected during the voyage. A total of almost 200 m of cores have been scanned with high-resolution CT, 50 m of core have been split, logged, scanned with multi-sensor core logger (magnetic susceptibility, spectrophotometer, X-ray fluorescence) and subsampled for grain size, composition and microfossil analysis to show a variety of facies ranging from estuarine to coral-rich deposits. Selected cores have been sub-sampled for radiocarbon dating of Halimeda grains, benthic foraminifers, and organic rich mud (23 samples), spanning from 12 ka to present, aligning with previous findings3. Initial observations revealed further facies complexity than previously thought in morphotypes, including Halimeda floatstone-rudstone and Foraminiferal wackestone-packstone facies in the south, while having facies minor mud matrix and richer in coral, mollusc, rhodolith and lithified clumps abundance towards north. This new dataset significantly advances our understanding of Halimeda bioherm morphology, development, and regional influences, providing new insights into their formation processes and ecological significance.


References:

  • McNeil, M. A., Webster, J. M., Beaman, R. J., and Graham, T. L., 2016, New constraints on the spatial distribution and morphology of the Halimeda bioherms of the Great Barrier Reef, Australia: Coral Reefs, v. 35, no. 4, p. 1343-1355. doi: 10.1007/s00338-016-1492-2
  • McNeil, M., Nothdurft, L. D., Dyriw, N. J., Webster, J. M., and Beaman, R. J., 2021, Morphotype differentiation in the Great Barrier Reef Halimeda bioherm carbonate factory: Internal architecture and surface geomorphometrics: The Depositional Record, v. 7, p. 176– 199. doi: https://doi.org/10.1002/dep2.122
  • McNeil, M., Nothdurft, L. D., Hua, Q., Webster, J. M., and Moss, P., 2022, Evolution of the inter-reef Halimeda carbonate factory in response to Holocene sea-level and environmental change in the Great Barrier Reef: Quaternary Science Reviews, v. 277. doi: 10.1016/j.quascirev.2021.107347

How to cite: Szilagyi, Z., Nothdurft, L., Webster, J., McNeil, M., Braga, J. C., Graham, T., Behrens, B. C., Yokoyama, Y., Beamen, R., Paumard, V., Shragge, J., Goh, S., Reeves, J., Picton, L., and Bostock, H.: Subsurface dissection of Holocene inter-reef Halimeda bioherms: morphology, facies and latitudinal variations in the northern Great Barrier Reef, EGU General Assembly 2025, Vienna, Austria, 27 Apr–2 May 2025, EGU25-14906, https://doi.org/10.5194/egusphere-egu25-14906, 2025.

EGU25-15355 | ECS | Orals | SSP3.8

Luminescence dating of core DLC70-2 from the North Yellow Sea in China and its implication for late Quaternary transgressions 

Nan Tang, Zhongbo Wang, Penghui Lin, Yuexin Liu, Zonghui Wu, Haozheng Tian, Xi Mei, Jun Sun, Jianghao Qi, Rihui Li, Shuyu Wu, Hongxian Chu, and Zhongping Lai

Reliable chronology is crucial for reconstructing the sedimentary history and sea level fluctuations. However, the lack of robust ages for late Quaternary deposits on the North Yellow Sea (NYS) shelf hampered our understanding of its sedimentary processes. In this study, quartz optically stimulated luminescence (OSL) and feldspar post-infrared infrared stimulated luminescence (post-IR IRSL) dating protocol were utilized to establish a detailed chronostratigraphy for the upmost 30 m of core DLC70-2 from the central NYS. Based on lithology features and dating results, three transgressive layers (hereafter referred as T1, T2 and T3, respectively from top to bottom) were identified. The consistency between two OSL dates (10.3-6.7 ka) and six radiocarbon (14C) dates (10.4-4.9 cal ka BP) indicates that the T1 layer deposited during MIS 1. Five quartz samples yielded saturation ages of >53 ka, combined with one feldspar pIRIR290 age of 76±7 ka from the top of the T2, suggested that the T2 layer should have formed no later than MIS 5. For T3 layer, two saturated quartz ages of >71 ka and a feldspar corrected age (191±17 ka) revealed that the T3 layer has formed at least during MIS 7. 
Based on the renewed chronostratigraphy of core DLC70-2, we reconstruct a comprehensive late Quaternary stratigraphy using ten previously published cores from the Bohai Sea and Yellow Sea. The occurrence of cold-water species Buccella frigida and Protelphidium tuberculatum during MIS 5 indicates there existed a cold-water mass (cyclonic eddy) similar to present-day marine circulation. Additionally, the late Quaternary stratigraphic correlation is supported by the previously chronostratigraphic reconstruction of coastal loess. These findings will enhance our comprehending on the sedimentary processes and their paleo-environment changes on the eastern Chinese shelves during late Quaternary.
Key words: luminescence dating; North Yellow Sea; late Quaternary; stratigraphic construction; transgressive deposits; core DLC70-2

How to cite: Tang, N., Wang, Z., Lin, P., Liu, Y., Wu, Z., Tian, H., Mei, X., Sun, J., Qi, J., Li, R., Wu, S., Chu, H., and Lai, Z.: Luminescence dating of core DLC70-2 from the North Yellow Sea in China and its implication for late Quaternary transgressions, EGU General Assembly 2025, Vienna, Austria, 27 Apr–2 May 2025, EGU25-15355, https://doi.org/10.5194/egusphere-egu25-15355, 2025.

High-resolution (millennial-scale) chronology is becoming more and more important in sedimentary process reconstruction, which could uncover unexpected events, in particular hiatus. It is assumed that sediments in  endorheic basin should be continuous. However, Our large luminescence chronology data revealed that, since late Quaternary, hiatus were common in the cores of the endorheic Qaidam Basin in the Tibetan Plateau, especially in the Last Glaciation Maximum (LGM) during which the endorheic lakes dried up and then the wind erosion was dominant.

Our large dataset of luminescence dating in deltas/fluvial-plains also displayed similar discontinuous pattern in core sediments, demonstrating unexpected hiatus which was omitted by previous studies, as well as the impacts of human activities revealed by changes of sedimentation rate.

It is strongly recommended the wider application of high-resolution chronostratigraphic methods in sedimentary research, and dense sampling for optically stimulated luminescence (OSL) dating. The combination of Single Aliquot Regeneration (SAR) protocol (Murray and Wintle, 2003) and Standardized Growth Curve (SGC) protocol (Roberts and Duller, 2004; Lai, 2006), SAR-SGC (Lai and Ou, 2013), routine used in our laboratory, will be of great help in this regard, which could save machine measurement time for at least 70%.

Key words: Luminescence chronology; high resolution; hiatus; sedimentary process.


References

Lai, Z.P., 2006, Testing the use of an OSL standardized growth curve (SGC) for determination on quartz from the Chinese Loess Plateau: Radiation Measurements, 41, 9–16, doi:10.1016/j.radmeas.2005.06.031.

Lai, Z.P, Ou, X.J., 2013. Basic procedures of optically stimulated luminescence (OSL) dating. Progress in Geograpgy, 32, 683-693 (in Chinese with English abstract).

Murray, A.S., and Wintle, A.G., 2003, The single aliquot regenerative dose protocol: potential for improvements in reliability: Radiation Measurements, 37, 377–381, doi:10.1016/S1350-4487(03)00053-2.

Roberts, H.M., and Duller, G.A.T., 2004, Standardised growth curves for optical dating of sediment using multiple-grain aliquots: Radiation Measurements, 38, 241–252, doi:10.1016/j.radmeas.2003.10.001.

How to cite: Lai, Z.: Chronological data is the best proxy in sedimentary process reconstruction, EGU General Assembly 2025, Vienna, Austria, 27 Apr–2 May 2025, EGU25-15450, https://doi.org/10.5194/egusphere-egu25-15450, 2025.

EGU25-15862 | Orals | SSP3.8

Submarine geomorphology of tidal channels in the northern Venice Lagoon, Italy 

Mariacristina Prampolini, Taha Lahami, Giorgio Castellan, Daphnie Galvez, Antonio Petrizzo, Valentina Grande, Christian Ferrarin, Federica Foglini, Federica Rizzetto, and Fantina Madricardo

The morphodynamics of coastal tidal wetlands and salt marshes are closely tied to the tidal channel networks that link these ecosystems to the sea. Tidal channels, shaped by strong currents and dynamic bathymetry, are vital for sediment transport and key ecological functions in coastal environments. They act as pathways for sediment, nutrients, and organic matter, supporting the health and resilience of tidal wetlands. These networks provide essential ecosystem services, including erosion control and habitats for fish and shellfish, which are crucial for biodiversity and fisheries.

However, tidal wetlands face growing threats from human activities. Dredging disrupts sediment transport and alters flow patterns, leading to habitat loss. Increased navigation accelerates bank erosion and raises water turbidity, degrading habitat quality. Coastal infrastructure, such as seawalls and dikes, further fragments these ecosystems, disrupting natural hydrological processes. Climate change exacerbates these pressures through rising sea levels and more frequent storms, accelerating wetland degradation.

Understanding the geomorphology and sediment dynamics of tidal channels is critical for managing these ecosystems, to mitigate natural and human-induced changes, enhance biodiversity, and promote sustainable management. Geomorphological studies often rely on satellite imagery and aerial surveys to analyze channel morphology and path changes. Seismic surveys and laboratory experiments contribute to understanding large-scale and fine-scale geomorphic processes. However, few studies employ high-resolution multibeam echosounder systems to document the detailed underwater morphology of tidal channels, with limited work on their three-dimensional structures.

This study aims to deliver a detailed 3D mapping of the seafloor morphology and sediment distribution in the tidal channels of the northern Venice Lagoon (Italy), one of the most studied coastal lagoons globally. While many studies have explored the migration and evolution of Venetian tidal channels, fewer have focused on high-resolution 3D mapping of their underwater features. We conducted morphometric analyses and classified channel substrates by means of high-resolution multibeam echosounder data validated with grab samples and video footage. The approach integrated bathymetric derivatives, expert geomorphic interpretation, and supervised classification of acoustic backscatter to produce a comprehensive understanding of tidal channel features.

The findings reveal fine-scale details of tidal channel seafloor geomorphology, providing new insights into their structure and functioning. This research enhances our understanding of tidal channel dynamics and offers valuable information for preserving and managing these critical ecosystems effectively.

How to cite: Prampolini, M., Lahami, T., Castellan, G., Galvez, D., Petrizzo, A., Grande, V., Ferrarin, C., Foglini, F., Rizzetto, F., and Madricardo, F.: Submarine geomorphology of tidal channels in the northern Venice Lagoon, Italy, EGU General Assembly 2025, Vienna, Austria, 27 Apr–2 May 2025, EGU25-15862, https://doi.org/10.5194/egusphere-egu25-15862, 2025.

EGU25-18440 | ECS | Posters on site | SSP3.8

A new sediment mobility and seabed disturbance geo-spatial toolbox (Sed-mob-bed Tool) 

Shauna Creane, Aelita Totska, and Mark Coughlan

On continental shelf seas, the spatial and temporal interaction between hydrodynamic processes and seabed substrate impacts seabed evolution and sediment distribution. For instance, when the magnitude of bed shear stress, induced by waves and/or currents, is greater than the threshold of movement, sediment is mobilised, giving rise to a range of dynamic bedforms and intricate local and regional sediment transport systems. These processes have direct implications for a wide range of offshore economic exploits (e.g., siting renewable energy and telecommunication infrastructure).

This area of research is currently at the forefront of policy and society due to the ongoing climate crisis. For instance, the Renewable Energy Directive (Directive (EU) 2023/2413) sets the European Union renewable energy target to at least 42.5 % by 2030. With offshore renewables playing a key role in reaching this objective (111 GW by 2030), the demand on the seabed is increasing. A common challenge in exploiting such offshore resources is characterising and monitoring Europe’s variable and dynamic seabed which poses significant risks to the siting and installation of engineering structures. The fiscal implications of poor background knowledge of geological and geotechnical risk before construction onset are well demonstrated by previous projects in Europe. To promote the growth of this sector in a sustainable and economically efficient manner, alongside other existing and prospective industries, the development of integrated geo-spatial tools that facilitate the interrogation of key oceanographic and geological datasets to generate standardised indicators are paramount.

To date, the characterisation and description of sediment mobilisation and seabed disturbance has been carried out using a labour and expertise intensive process. This Project will develop a ‘Sediment mobility and seabed disturbance geo-spatial toolbox (Sed-mob-bed Tool)’, a time-saving, reliable and repeatable means of qualifying and quantifying sediment mobility for a range of sediment types. This novel Sed-mob-bed Tool will facilitate the interrogation of spatial oceanographic and sedimentological datasets to produce a set of standardised sediment mobility and seabed disturbance indices (e.g., Mobilisation Frequency Index (MFI), Seabed Disturbance Index (SDI) and Sediment Mobility Index (SMI)) applicable to international end-users. Several research questions will be addressed, including:

  • What are the key physical processes, sedimentological characteristics and parameters critical to sediment mobility?
  • What are the most effective geospatial tools to garner this information?
  • Can this be applied in a way that is geostatisically robust?
  • How well do these approaches perform (i) in differing seabed morphological settings, and (ii) at scale?

The developed tool will be tested under several different environmental and seabed conditions. This includes an application to Irish Waters as a case study, leveraging the wealth of existing national and European level datasets (e.g., INFOMAR, EPA, EMODnet, GSI, Marine Institute). The results of which will be of particular interest to a cross-disciplinary group of practitioners including marine archaeologists, oceanographers, marine geoscientists, and engineers. The methodology and results from this work will ultimately provide a scientific knowledge base for the sustainable growth of the marine economy.

How to cite: Creane, S., Totska, A., and Coughlan, M.: A new sediment mobility and seabed disturbance geo-spatial toolbox (Sed-mob-bed Tool), EGU General Assembly 2025, Vienna, Austria, 27 Apr–2 May 2025, EGU25-18440, https://doi.org/10.5194/egusphere-egu25-18440, 2025.

Purpose: The Bonan Sag is located in the Bohai Bay Basin in eastern China, where the chlorite content is high in the lower part of the fourth member of the Shahejie Formation. In this paper, the genesis of chlorite in the study area was analyzed by means of casting thin section observation, scanning electron microscope, EPMA and LA-ICP-MS, and its influence on reservoir was discussed.

Experimental samples and analysis methods: In this paper, several samples of Well H1 and Well H2 in the lower part of the fourth member of Shahejie Formation in Bonan sag are selected. Firstly, the morphology and size of chlorite in the sample were observed and described in detail by casting thin sections and scanning electron microscopy. Then, the thin sections were polished, and the different forms of chlorite were subjected to electron probe and laser ablation with the assistance of scanning electron microscopy. The elemental composition of chlorite was measured and analyzed.

Result: Well H1 is mostly coated chlorite, attached to the edge of the particles, inhibiting the secondary enlargement and cementation of quartz and other particles, which is conducive to pore development. The H2 well is mostly rose-like chlorite, which is mainly filled in the middle of the pores, plugging the pores and reducing the porosity and permeability of the reservoir.

The Fe/(Fe + Mg) values of chlorite are generally 0.3-0.7, but they can be clearly divided into two categories: one category has an average value of 0.37, which is significantly smaller than the standard chlorite, and most of them are coated chlorite (relatively rich in Si); the average value of the other type is 0.66, which is significantly larger than that of the standard chlorite, often showing a rose-like (relatively rich in Fe).

Conclusion: The content of quartz and feldspar in well H1 is high, which is coated chlorite rich in Si. It is formed by the dissolution of feldspar and quartz during diagenesis, which has a positive effect on reservoir physical properties. The content of magmatic rock debris and metamorphic rock debris in well H2 is higher, which is Fe-rich in rose chlorite. It is formed by the alteration of magmatic rock and metamorphic rock debris during diagenesis, which has a negative effect on reservoir physical properties.

Keywords: Bonan Sag; Tight sandstone; Reservoir; Chlorite genesis;


How to cite: Zhang, H., Liu, G., Liu, K., Chen, J., and Wang, S.: The genesis of chlorite in tight sandstone reservoirs and its influence on reservoir properties: A case study of the lower fourth member of Shahejie Formation in Bonan Sag, EGU General Assembly 2025, Vienna, Austria, 27 Apr–2 May 2025, EGU25-25, https://doi.org/10.5194/egusphere-egu25-25, 2025.

Focusing on the shale oil reservoirs of the second member of the Kongdian Formation in Cangdong Sag, eastern China, this study explores the origin and distribution of analcime, aligns the fluid evolution stage with different analcime types, and constructs a new micron-scale water-rock reaction sequence. The study identifies six types of analcime based on occurrence characteristics (occurring as laminae, lens, fracture filling, bioshell filling, vein marginal crystal and cement). The above six types of analcime is further classified into hydrothermal fluid origin analcime (HFOA: include analcime cement, vein marginal crystal, lens, fracture filling and bioshell filling) and connate fluid origin analcime (CFOA: analcime laminae) based on major elemental indicators (Si/Al and 10K/(10K + Na)). HFOA has lower ∑REE (rare earth element) and strong positive correlation between ∑REE and LILEs (large ionic lithophilic elements); while CFOA has higher ∑REE and weak positive correlation between ∑REE and LILEs. Different analcime types correlate with varying fluid properties and transport stages. HFOA forms during magmatic hydrothermal fluid (MHF) upwelling. After the MHF entering and mixing with the lake water, thermal repulsions between the crystal particles made it move to form fine grained sedimentary layer, the connate fluid trapped in pores directly precipitate to form CFOA, or form CFOA by modifying clay minerals and feldspars. Through this study, we systematically analyzed the fluid evolution and activity characteristics of the faulted lake basin by using analcime distributed in micron-scale laminae and fractures, hoping to provide new perspectives for the study of diagenetic processes in sedimentary basins.

How to cite: Wang, J., Liang, C., Cao, Y., and Liu, K.: Fluid evolution and tracing at micron-scale of shales in faulted lake basin: A new perspective based on analcime, EGU General Assembly 2025, Vienna, Austria, 27 Apr–2 May 2025, EGU25-189, https://doi.org/10.5194/egusphere-egu25-189, 2025.

Late Archean Banded Iron Formations (BIFs) serve as exceptional reservoirs of primordial aquatic precipitates, offering a valuable window into the ancient ocean water chemistry and biogeochemical cycles that operated prior to the Great Oxygenation Event (GOE) around 2.4 Ga. It is generally believed that the primordial mineralogy of these BIFs was dramatically modified to Fe-oxides (magnetite and/or hematite) during subsequent hydrothermal and metamorphic episodes. While the earlier consensus does not clearly support an authigenic to early diagenetic origin for magnetite, some experimental studies suggest its stability within microbially influenced primary authigenic to early diagenetic environments. Despite being affected by several post-diagenetic alteration events, the central part of the Chitradurga Schist Belt (CSB) in the Western Dharwar Craton (WDC), particularly around the Chitradurga district, adequately preserves a wide array of primary mineral assemblages, with locally developed dispersed magnetite grains. Detailed petrographic observations supported by SEM-EDS analysis of the cherty Banded Iron Formation (BIF), stratigraphically positioned atop the shallow-water unstable shelf association of the Vanivilas Formation within the Chitradurga Group (3.0–2.6 Ga), offer a valuable opportunity to investigate the origin of these magnetite grains, their association with primary mineral assemblages, and their diagenetic modifications.

The primary mineral assemblages are present as submicron-scale lump-like structures (10–50 µm) embedded within silica (SiO₂) matrix, intervened by a network of silica-filled shrinkage cracks. Based on mineralogy and texture, three microfacies have been identified: a) silicate-carbonate-phosphate-bearing green lumpy microfacies (greenalite + siderite + apatite ± magnetite), b) silicate-oxide-bearing red lumpy microfacies (greenalite + hematite ± siderite), and c) silicate-sulphide-bearing black lumpy microfacies (greenalite + pyrite). Magnetite occasionally appears as a primary lump-forming mineral in the first microfacies, whereas in the second variety, it develops along the periphery of associated Fe³⁺-bearing mineral phases. The coexistence of euhedral-shaped, submicron-sized magnetite (1–5 µm) within these primary lumps, along with greenalite, suggests their origin through the reduction of a primary Fe³⁺-bearing oxy-hydroxide phase, formed in near-surface `oases' of O₂-rich seawater through cyanobacterial oxidation of hydrothermally sourced Fe²⁺. The reduction of this Fe³⁺-bearing oxy-hydroxide phase to form a metastable Fe²⁺-bearing hydrous green clay (greenalite) and more stable magnetite can occur either during settling through the water column or during authigenic to early diagenetic stages via dissimilatory iron reduction (DIR) at the sediment-water interface.

The possibility of DIR is further supported by textural evidence within silicate-oxide-bearing microfacies, where subhedral to anhedral magnetite is present along the periphery of these Fe³⁺-bearing lumps. The presence of Fe³⁺-bearing phases in the core reflects the signature of an incomplete reaction involving Fe³⁺ oxy-hydroxides and organic matter to form magnetite. Our findings reevaluate the debate over the origin of magnetite in Late Archean BIFs, suggesting that magnetite can form within biologically influenced microenvironments, even during authigenesis and/or early diagenetic stages.

How to cite: Bose, S., Sen, A., Samanta, P., and Mukhopadhyay, S.: Possible origin of authigenic to early diagenetic magnetite through ‘Dissimilatory Iron Reduction’ (DIR) within Late Archean Banded Iron Formation from Chitradurga Schist Belt (CSB), Western Dharwar Craton (WDC), India, EGU General Assembly 2025, Vienna, Austria, 27 Apr–2 May 2025, EGU25-671, https://doi.org/10.5194/egusphere-egu25-671, 2025.

EGU25-682 | ECS | Orals | SSP3.4

Role of syn-sedimentary biogenic and epigenetic hydrothermal uranium enrichment in the formation of sediment-hosted uranium mineralization: evidence from the Neoproterozoic Badami Group, Southern India 

Arunava Sen, Dipak C. Pal, Pradip Samanta, Eva E. Stüeken, Soumyadeep Bose, Nipun Ghosh, and Soumik Mukhopadhyay

This study investigates sedimentary and hydrothermal uranium (U) mineralization in the Neoproterozoic Cave-Temple Arenite Member of the Kerur Formation, Badami Group, Karnataka, within the South Indian Shield (SIS). The studied succession comprises three fluvio-alluvial depositional cycles, with the middle cycle recording evidence of marine sedimentation. Uranium enrichment occurs across the fluvial sediments of the 1st and 2nd cycles, as well as the marine sediments of the 2nd cycle. The higher grade of mineralization, however, is restricted to the lowermost fluvio-alluvial segment of the 1st cycle, where significant hydrothermal enrichment is evident.

Three distinct modes of U-mineralization have been identified. The first one (the primary mode) represents syn-depositional, microbially induced sedimentary uranium accumulation within organic matter (OM)-rich clay laminae of marine shales, siltstones, and fine sandstones of the 2nd cycle. This mode is characterized by microcrystalline uranium-(calcium)-phosphosilicate (UPS) phases, often intermingled with uranium titanates, and is associated with microcrystalline sedimentary pyrites, often clustered as framboidal aggregates, and kerogenous OM. Provenance analyses and petrography of U-bearing sedimentary rocks suggest U-sourcing from the Archean-Palaeoproterozoic granitic and felsic basement rock suites of the Dharwar Craton. A positive correlation (r = +0.8, ρ < 0.01; n = 26) is observed between bulk rock OM content (TOC%) and uranium enrichment in the primary mode. Micro-RAMAN spectroscopy confirms the association of UPS phases and sedimentary pyrites with OM-rich matrices and clay-rich organic laminae, while the carbon and sulfur isotopic analyses of the bulk reinforce the biogenicity of the host sediment. The enrichment of redox-sensitive trace elements like V, Mo, Cu, Co, Ni, and As within the clay- and OM-rich sedimentary rocks further indicates the presence of active redox cycling along with biogeochemical and paleoproductivity processes during the syn-to-meta-depositional phases.

The remaining two modes correspond to secondary, post-depositional hydrothermal uranium enrichment within the fluvial sandstones of the 1st cycle and the fluvio-marine sedimentary rocks of the 2nd cycle. These modes manifest as uranium phosphosilicate and uranium silicate phases, associated with hydrothermal pyrites in fractures, micro-veinlets, or intergranular patches. Unlike the primary, syn-sedimentary mode, the hydrothermal mineralization does not show any distinct correlation between uranium concentration and TOC%. Isocon mass balance further suggests that uranium, iron, and high field strength elements (HFSEs) were mobilized from these sediments hosting the primary mode, likely facilitated by organometallic ligands, such as siderophores associated with OM, during the epigenetic hydrothermal process under oxygenated hydrothermal conditions. Mobilized uranium was subsequently trapped by pyrites in hydrothermal fractures, forming the secondary modes of U-mineralization.

This dual mechanism highlights an initial microbially mediated, OM-induced uranium accumulation, acting as a vast, low-grade source for later hydrothermal remobilization and enrichment. The findings emphasize the interplay of depositional environments, microbial activity, and hydrothermal remobilization of biogenic accumulation in uranium mineralization, with implications for sediment-hosted uranium exploration.

How to cite: Sen, A., Pal, D. C., Samanta, P., Stüeken, E. E., Bose, S., Ghosh, N., and Mukhopadhyay, S.: Role of syn-sedimentary biogenic and epigenetic hydrothermal uranium enrichment in the formation of sediment-hosted uranium mineralization: evidence from the Neoproterozoic Badami Group, Southern India, EGU General Assembly 2025, Vienna, Austria, 27 Apr–2 May 2025, EGU25-682, https://doi.org/10.5194/egusphere-egu25-682, 2025.

The Proterozoic millimeter-sized ministromatolites have been recognized for their potential biological origin, yet concrete biotic proof has been elusive, which has sparked debates about their possible chemical origins. Recently, unique ministromatolites were identified in a microbial dolostone layer within the Mesoproterozoic Wumishan Formation at Lingyuan in Northern China. Examination of thin sections of these ministromatolites has uncovered a wealth of coccoidal microfossils, measuring 10 to 30 micrometers in size. Petrofabric analysis indicates that these ministromatolites underwent three episodes of diagenetic silicification, with the microfossils being exclusively preserved in early diagenetic chert. This finding supports the hypothesis that silicification occurring concurrently with mat development is crucial for the exceptional preservation of microfossils, which suggests that the scarcity of microfossils in most Precambrian carbonate stromatolites may be attributed to the absence of hydrochemical conditions conducive to early silicification. While chemically-formed fibrous carbonate minerals predominate in these ministromatolites, the abundance of microfossils suggests that the contribution of microorganisms to the formation of ministromatolites was previously underestimated. Consequently, this study proposes that Mesoproterozoic ministromatolites are not merely chemical byproducts but rather intricate mixtures of both biological and chemical components.

How to cite: Wang, T. and Xiong, W.: Fossil evidence provides new insights into the origin of the Mesoproterozoic ministromatolites, EGU General Assembly 2025, Vienna, Austria, 27 Apr–2 May 2025, EGU25-845, https://doi.org/10.5194/egusphere-egu25-845, 2025.

EGU25-1153 | ECS | Orals | SSP3.4

Dolomite Crystal Morphology as an Effective Indicator of Microbial Origins: Evidence from Experimental Simulations and Sedimentary Records 

Yanyang Zhao, Zuozhen Han, Chao Han, Zhaopeng Wang, and Xiao Gao

Dolomite formation remains one of the most intriguing puzzles in sedimentary geology, often referred to as the “dolomite problem” . Growing evidence suggests that microbial mediation plays a critical role in overcoming kinetic barriers to dolomite precipitation. This study explores the potential of dolomite crystal morphology as a diagnostic tool for identifying microbial contributions, integrating findings from laboratory simulations and sedimentary records.

Controlled experiments reveal that microbial processes produce distinct proto-dolomite crystal morphologies under varying environmental conditions. Cyanobacterium Leptolyngbya boryana induces proto-dolomite precipitation in brackish water, forming characteristic “double-spherical” crystals with hollow interiors and organic inclusions. In contrast, the halophilic bacterium Vibrio harveyi promotes the formation of single-spherical proto-dolomite crystals with unique "pinhole" features on their surfaces, indicative of microbial residue. These results highlight the species-specific influence of microbes on crystal morphology and the critical role of environmental conditions such as Mg/Ca ratios in shaping these mineralization pathways. Sedimentary dolomites from the SG-1 borehole in the Qaidam Basin (NE Tibetan Plateau) predominantly exhibit single-spherical morphologies with surface pinholes, closely resembling those produced by Vibrio harveyi in the laboratory. Although cyanobacterial fossils are present in the sediments, the observed dolomite features strongly suggest that halophilic bacteria were the primary mediators of dolomite precipitation in this system.

This study demonstrates that dolomite crystal morphology can serve as a proxy for microbial mediation in carbonate systems. By integrating experimental and sedimentary evidence, these findings advance our understanding of biogenic dolomite genesis and provide insights into reconstructing paleoenvironmental and biogeochemical conditions.


How to cite: Zhao, Y., Han, Z., Han, C., Wang, Z., and Gao, X.: Dolomite Crystal Morphology as an Effective Indicator of Microbial Origins: Evidence from Experimental Simulations and Sedimentary Records, EGU General Assembly 2025, Vienna, Austria, 27 Apr–2 May 2025, EGU25-1153, https://doi.org/10.5194/egusphere-egu25-1153, 2025.

EGU25-2823 | Orals | SSP3.4

Characterization and genesis of authigenic calcite in multiple diagenetic stages of shales 

Yuegang Wang, Yingchang Cao, Junran Wang, and Chao Liang

  Authigenic calcite abundantly forms during various diagenesis stages of shales. It meticulously records information on diagenetic fluid (organic/inorganic) migration and fluid-rock interactions, is important for understanding the burial diagenetic evolution, tectonic history, burial history, hydrocarbon generation and accumulation in sedimentary basins. During early burial diagenesis, the sulfate-methane transition zone maintains high porewater alkalinity through anaerobic oxidation of methane, promoting calcite nodule formation. Upon entering the hydrocarbon generation window, periodic opening and closing of fractures occur at lamina interfaces due to overpressure from hydrocarbon phase transitions and crystallization forces. In these fractures, calcite solubility decreases with fluid pressure reduction, leading to fibrous vein precipitation under strong overpressure conditions and bladed or equant crystal formation under weak overpressure conditions. Recrystallization processes controlled by the Ostwald mechanism. Additionally, authigenic calcite preserves characteristics reflecting multiple sources and distinct evolution stages, resulting in notable isotope fractionation features, the carbon isotope features represent cumulative results of various processes. Utilizing physical and numerical simulations based on burial conditions aids in analyzing authigenic calcite genesis and reconstructing the diagenetic environment in which it formed.

How to cite: Wang, Y., Cao, Y., Wang, J., and Liang, C.: Characterization and genesis of authigenic calcite in multiple diagenetic stages of shales, EGU General Assembly 2025, Vienna, Austria, 27 Apr–2 May 2025, EGU25-2823, https://doi.org/10.5194/egusphere-egu25-2823, 2025.

EGU25-3102 | ECS | Orals | SSP3.4

Chitin detected in 1.0 Ga old acritarch-like fossils from Lakhanda Lagerstätte and its implication for skeleton biomineralization 

Neha Mehta, Andrey Bekker, Jehan Waeytens, Victor Podkovyrov, Louise Conrad, Kitty Baert, and Steeve Bonneville

The co-evolution of life and minerals has profoundly shaped Earth's biological and geological history, with skeletal biomineralization emerging in eukaryotes over 800 Ma. Chitin, a key organic scaffold in modern biomineralization, was previously identified in fossils as old as the Cambrian (~505 Ma). Here, we extend this record by demonstrating the presence of fossilized chitin in 1-Ga acritarch-like fossils from the Lakhanda Lagerstätte, Siberia. These large spherical fossils (100–200 µm) align with the characteristics of acritarchs, organic-walled microfossils interpreted as cysts of planktonic protists. Spectroscopic analyses using nano-infrared spectroscopy of acritarch-like fossils showed molecular features diagnostic of chitin, including amide I and II bands and polysaccharide-related bands. These findings push back the timeline for chitin utilization in protists by 500 Ma, demonstrating its role in early biomineralization processes. This discovery highlights the significance of chitin in early protist evolution and its role in shaping biomineralization pathways. It also underscores the potential of advanced spectroscopy techniques to reveal the chemical and biological signatures of ancient life with unprecedented precision.

How to cite: Mehta, N., Bekker, A., Waeytens, J., Podkovyrov, V., Conrad, L., Baert, K., and Bonneville, S.: Chitin detected in 1.0 Ga old acritarch-like fossils from Lakhanda Lagerstätte and its implication for skeleton biomineralization, EGU General Assembly 2025, Vienna, Austria, 27 Apr–2 May 2025, EGU25-3102, https://doi.org/10.5194/egusphere-egu25-3102, 2025.

EGU25-3153 | ECS | Orals | SSP3.4

Geochemical and Petrographic characterization of dolomitized carbonates in Kawagarh Formation, Northern Pakistan  

Saif Ur Rehman, Muhammad Jawad Munawar, and Naveed Ahsan

Late Cretaceous Kawagarh Formation, from Hazara Basin of northern Pakistan, exhibit extensive diagenesis including dolomitization, which significantly impacts its reservoir potential. In this study we investigated the processes that drove dolomitization in Kawagarh Formation through integration of petrographic analysis and carbon-oxygen isotope geochemistry. Thin sections optical microscopy revealed various dolomite textures, including planar-euhedral and non-planar-anhedral crystals, as well as evidence of recrystallization and porosity enhancement. Multiple textural indicated the multiple phases of dolomitization associated with variable diagenetic conditions.

Carbon (δ¹³C ) and oxygen (δ¹⁸O) isotope analysis of dolomite showed the distinct geochemical signatures indicative of dolomitizing fluid sources. These isotopes suggested a mixed origin, involving marine and meteoric fluids, with potential contributions from hypersaline brines during burial diagenesis. The spatial and isotopic variability suggested that dolomitization was influenced by tectonic activity and stratigraphic controls, which resulted in highly heterogeneous in porosity and permeability.

The findings from this study provided new insights into the diagenetic history of the Kawagarh Formation and enriched our conception of dolomitization mechanisms in analogous settings. The study highlighted the critical role of integrated petrographic and isotopic approaches in unraveling complex diagenetic processes, with implications for reservoir characterization and hydrocarbon exploration.

How to cite: Rehman, S. U., Munawar, M. J., and Ahsan, N.: Geochemical and Petrographic characterization of dolomitized carbonates in Kawagarh Formation, Northern Pakistan , EGU General Assembly 2025, Vienna, Austria, 27 Apr–2 May 2025, EGU25-3153, https://doi.org/10.5194/egusphere-egu25-3153, 2025.

The reconstruction of the burial depth experienced by sedimentary successions before their uplift is crucial for various geological applications, such as thermal history analysis, subsidence reconstruction in sedimentary basins, reservoir quality prediction and, more in general, the tectonic evolution of fold-and-thrust belts. A commonly used method for addressing this problem in clastic sequences is low-temperature thermochronology (LTT), including techniques such as (U-Th)/He and fission-track analysis (AFT) on apatite grains, or organic matter maturity indices. However, these methods have two main limitations: 1) they are T-dependent, requiring knowledge or, more commonly, assumptions about the geothermal gradient for the studied sedimentary sequence over the considered time span, which can be challenging for deep-time analysis; and 2) these techniques are most effective at temperature higher than 60°-80° for (U-Th)/He and 120° for AFT. This means that for regions with a normal geothermal gradient of 30°C/km or lower (e.g., foreland basins), low-T thermochronology is less reliable for determining burial depth of less than 2-4 km experienced by rocks before exhumation.

In this contribution we aim to address these limitations by filling the “blind window” of LTT and avoiding uncertainties related to the past geothermal gradient. We do this by using the degree of compaction in sand-sized clastic rocks (COPL-CEPL indexes analysis) as a proxy to estimate the minimum burial depth experienced by exhumed clastic sequences. We apply a compaction-driven approach coupled with diagenetic modelling to estimate the burial depth of clastic units exposed in the eastern Tertiary Piedmont Basin (TPB) which occupies an episutural position on the tectonic junction between the Alps and the Northern Apennines collisional belts. Due to its complex tectonic setting, the studied sedimentary succession has undergone a largely unknown post-depositional history, making it possible to test several regional burial/exhumation scenarios for the Eocene-lower Miocene sequence. Our results suggests that the eastern part of the TPB underwent to more burial than previously expected; this implies that it continued to subside and accumulate sediment until the end of the Miocene, with uplift and erosion likely beginning at the end of Miocene due to the combined effects of Northern Apennines contractional tectonic phase and the Messinian Salinity Crisis. Overall, this case of study demonstrates that the quantitative study of the degree of compaction coupled with diagenetic modelling can be a reliable tool for maximum burial reconstruction in the depth-temperature window where current low-T thermochronological methods hardly work.

How to cite: Stendardi, F., Tamburelli, S., and Di Giulio, A.: Reconstructing the burial history of uplifted clastic sequences using compactional indices and diagenetic modeling (a northern Italy case of study) , EGU General Assembly 2025, Vienna, Austria, 27 Apr–2 May 2025, EGU25-3679, https://doi.org/10.5194/egusphere-egu25-3679, 2025.

EGU25-4473 | ECS | Posters on site | SSP3.4

Leaching of Legacy Paper mill Sludge promotes Lithification through cementation of fluvial sediments 

Md Jahangir Alam and John M. MacDonald

This study explores the formation of anthropogenic conglomeratic rock caused by the lithification of fluvial sediment through calcium leaching from historical paper mill sludge (PMS) deposits near Penicuik, Scotland. Calcium-rich waste generated by historic paper mill activities accumulated along the stream bank, resulting in localized cementation of sediment. Field observations identified lithified stream bed deposits beneath the PMS heaps, where natural sedimentary clasts were bound by calcium carbonate (CaCO₃). Microstructural analysis using Scanning Electron Microscopy (SEM) and Energy-Dispersive X-ray Spectroscopy (EDX) revealed that the cementing material is predominantly calcite. This was further corroborated by X-ray Diffraction (XRD), confirming a calcite-rich mineralogical composition. Stable isotope analysis (δ¹³C and δ¹⁸O) suggested a mixed carbon source, with approximately 40% derived from atmospheric CO₂ and 60% from lithogenic origins, highlighting complex geochemical processes. The results demonstrate that calcium ions (Ca²⁺) leached from PMS dissolved into pore water, subsequently migrating into adjacent fluvial sediments. This facilitated the precipitation of calcite, binding sediment grains into a cohesive structure and forming an anthropogenic conglomerate. This process mimics natural lithification mechanisms but occurs at the Earth's surface over significantly shorter timescales, bridging natural and anthropogenic geological systems. This anthropogenic lithification challenges conventional sedimentary rock classifications and has broader implications for waste management, pollutant immobilization, and carbon sequestration. By illustrating the interaction of industrial waste with natural sedimentary environments, the study emphasizes human influence on geological processes and provides insights into the evolving role of industrial byproducts in shaping modern sedimentary systems.

How to cite: Alam, M. J. and MacDonald, J. M.: Leaching of Legacy Paper mill Sludge promotes Lithification through cementation of fluvial sediments, EGU General Assembly 2025, Vienna, Austria, 27 Apr–2 May 2025, EGU25-4473, https://doi.org/10.5194/egusphere-egu25-4473, 2025.

EGU25-4528 | ECS | Posters on site | SSP3.4

The impact of fault-controlled hydrothermal silicification on the petrophysical properties of sandstones: insights from the Kornos-Aghios Ioannis Normal Fault (Lemnos Island, Greece) 

Luigi Berio, Fabrizio Balsamo, Fabrizio Storti, Francisco Hilario Bezerra, Marcio Fernando Brito, and Marcos Allyson Felipe Rodrigues

Circulation of silica-bearing hydrothermal fluids along faults affects petrophysical and mechanical properties of fault-related rocks by modifying their texture and mineralogy, with strong implications on geofluid storage and seismicity in the shallow crust. However, in the subsurface, it is extremely difficult to predict the geometry of silicified rock volumes along and around fault zones as well as their petrophysical properties and, therefore, outcrop analogues can provide important insights. The Kornos-Aghios Ioannis Fault (KAIF) on Lemnos Island (Greece) is a silicified extensional fault system active at shallow depth (<1 km) that is well exposed over 10 km length and juxtaposes volcanic rocks against turbidite sandstones. In this study, we investigate the distribution, petrophysics and mineralogy of silicified rocks along two across-fault transects through a multi-analytical approach that combines data from X-ray diffraction analysis, Hg-intrusion porosimeter, digital image analysis, X-ray micro-computed tomography and unsteady-state gas permeameter. The permeability of silicified fault cores (i.e. breccias, cataclasites, ultracataclasites), characterized by quartz contents >70 wt. %, decayed of 3 orders of magnitude (from 100 to 10-3 mD) with respect to pristine host rocks as pore space was occluded by silica cements. In fault damage zones, porosity of massively silicified sandstones strongly varies in the range 2-13% because of the presence of dissolution intragranular and intercrystalline pores whose formation is strongly controlled by the mineralogy (i.e. microcrystalline silica, sulphides and feldspars are preferentially dissolved). However, permeability of these massively silicified rocks remains low (<0.01 mD), regardless of their porosity, due to the low connectivity of the pore network. In the silicified volume characterized by reduced permeability, that extends 100’s of meters from the master fault plane being locally greater than the damage zone, the permeability drop produced by cementation is partially counterbalanced by higher fracture density and connectivity because of increased rock brittleness (UCS increases up to 30% compared to pristine host rocks). Moreover, all the samples analyzed show that porosity values are sensitive to pressure and strongly decrease with increasing confining pressure (up to 17 MPa). Our results show that hydrothermal silicification along faults may strongly degrade the reservoir quality in the surrounding area (100’s of meters from the master fault plane) where its effect is only locally counterbalanced by an excess permeability produced by dissolution, fractures and subsidiary faults. However, the intensity and extension of silicification are heterogeneous along-fault strike and fault segments not affected by hydrothermal silicification can interrupt the along-strike continuity of low-permeability silicified fault rocks.

How to cite: Berio, L., Balsamo, F., Storti, F., Bezerra, F. H., Brito, M. F., and Rodrigues, M. A. F.: The impact of fault-controlled hydrothermal silicification on the petrophysical properties of sandstones: insights from the Kornos-Aghios Ioannis Normal Fault (Lemnos Island, Greece), EGU General Assembly 2025, Vienna, Austria, 27 Apr–2 May 2025, EGU25-4528, https://doi.org/10.5194/egusphere-egu25-4528, 2025.

Carbonates are ubiquitous in Earth surface systems, such as sediments and cements. Contents of minor cations in carbonates can be considered as proxies of environment of formation involving stages of nucleation, growth and transformation. Thermodynamic models of carbonate solid solutions can help with this, also setting reference levels for kinetics and for interpreting the measurable variations of their composition (Rd values of metals) in time (growth rate) and in space (zoning). This message is illustrated on a few topics from my past studies facilitated by GEMS codes (https://gems.web.psi.ch).

Authigenic rhodochrosites in anoxic sediments of Baltic Sea deeps [1]. A (Mn, Ca, Mg, Sr, Ba, Fe)CO3 solid solution model was refined using the sediment profiles data and Gibbs Energy Minimization (GEM) “dual thermodynamic” (DualTG) approach to estimate all binary regular interaction parameters, consistent with the  predictions in (Lippmann 1980). In the underlying thermodynamic model, porewater pH, pe, alkalinity, dissolved Mn, Fe, and S levels were controlled by equilibrium with rhodochrosite-mackinawite-greigite mineral buffer. The model matched well the observed porewater- and carbonate composition, predicting its non-linear response to variations in Mn loading, alkalinity and salinity of the sediment-porewater system.

EuIII coprecipitation in calcite under widely different conditions (Rd datasets for high pCO2; normal seawater; high-pH solutions) [2]. No binary solid solution with any of seven EuIII endmember candidates could reproduce all three datasets. This was only possible with a ternary EuH(CO3)2 – EuO(OH) – CaCO3 ideal solid solution constructed with DualTG approach, and consistent with TRLFS data.

Sr in calcite and Ca in strontianite [3]. (Ca,Sr)CO3 solid solution system with non-isostructural endmembers was investigated in a stepwise approach from atomistic to thermodynamic modelling. Binary solid solution phases with calcite- or aragonite structure have nearly symmetric moderate non-ideality. However, calculations of equilibria including both phases resulted in strongly asymmetric ‘‘miscibility gap” with ~0.3% Sr in calcite and ~3.0% Ca in strontianite. The same picture was obtained using a DQF binary solid solution model in GEM calculations of Lippmann diagrams.

Growth rate dependence of uptake of divalent ions (Rd) in calcite [4]. These facts cannot be explained by equilibrium aqueous – solid solution partitioning, and need to consider intricate relations between speciation, particle growth, adsorption, surface entrapment, and solid solution formation. Two existing Growth Surface Entrapment- (Watson 2004) and Surface Reaction Kinetics (DePaolo 2011) models could be merged into a simple Unified Uptake Kinetics equation implemented and used in GEMS.

These studies benefited from DualTG calculations that use capabilities of GEM to compute chemical potentials of elements in (meta)stable systems [5]. Aspects of DualTG “streamlining” to obtain saturation index SI of solid solutions are discussed.

References

[1] Kulik D.A., Kersten M., Heiser, U., Neumann T. (2000): Aquat. Geochem. 6, 147-199.

[2] Curti E., Kulik D.A., Tits J. (2005): Geoch. Cosmoch. Acta 69, 1721-1737.

[3] Kulik D.A., Vinograd V.L., Paulsen N., Winkler B. (2010): Phys. Chem. Earth 35, 217-232.

[4] Thien B.M.J., Kulik D.A., Curti E. (2014): Appl. Geochem. 41, 135-150.

[5] Kulik D.A. (2006): Chem. Geol. 225, 189 – 212.


How to cite: Kulik, D.: Carbonates as (meta)stable solid solutions: Thermodynamic and kinetic insights , EGU General Assembly 2025, Vienna, Austria, 27 Apr–2 May 2025, EGU25-6064, https://doi.org/10.5194/egusphere-egu25-6064, 2025.

Jurassic Shaximiao Formation is an important tight gas reservoir in southwest Sichuan. In this study, thin section identification, scanning electron microscopy (SEM), X-ray diffraction (XRD), Cathodolumines- cence(CL), electron probe analysis, fluid inclusions and isotopic analysis were used to investigate the characteristics of the reservoir and the influence of diagenesis on the reservoir. And the following research results are obtained.First, the reservoir rock types of Shaximiao Formation in this area are primarily feldspathic sandstone and lithic feldspathic sandstone and secondarily lithic sandstone and feldspathic lithic sandstone. Second, the reservoir performance of feldspathic sandstones is much better than that of lithic sandstones. Feldspathic sandstones are mainly vertically distributed in the first and second sub-members of the second Member of Shaximiao Formation and laterally the most developed in the eastern area.Third, the reservoir Spaces in southwest Sichuan are mainly primary intergranular pores and secondary intergranular pores. Compaction plays a dominant role in the reduction of porosity, and due to the protective effect of chlorite coating, the porosity in southwest Sichuan is reduced by 23.45%. Cementation played a secondary role in the reduction of porosity, which reduced the porosity of southwest Sichuan by 12.4% respectively. On the contrary, dissolution plays a positive role in the increase of porosity, which increases the porosity of southwest Sichuan by 4.52%.In conclusion, Compaction and cementation lead to reservoir densification in Shaximiaoformation. Chlorite cementation protects the primary porosity to a certain extent, and dissolution is the main factor to increase the porosity.

How to cite: Li, J. and Qiu, L.: The influence of sandstone diagenesis on reservoir of Shaximiao Formation in southwest Sichuan, EGU General Assembly 2025, Vienna, Austria, 27 Apr–2 May 2025, EGU25-6530, https://doi.org/10.5194/egusphere-egu25-6530, 2025.

EGU25-6901 | Posters on site | SSP3.4

 Ostwald’s step rule: rule of thumb or strict physical law? 

Patrick Meister

In his 1897 article, Friedrich Wilhelm Ostwald wrote that “during departure from any state, and the transition to a more stable one, not the under given circumstances most stable state is reached, but the nearest one“. The word “nearest” essentially gave rise to the widespread interpretation that during a phase transition not the thermodynamically most stable but a metastable phase forms first, which is usually referred to as Ostwald’s step rule. It is considered a general rule rather than strict physical law, although its precise physical basis seems not fully understood on a mechanistic level, despite its potential importance for mineral formation under Earth’s surface conditions.

While Ostwald’s step rule is commonly explained through the classical nucleation theory, there are several inconsistencies that are not explained by this theory. One is that a transition to the stable phase cannot be forced by strongly increasing the driving force (supersaturation), and also adding seed crystals may not help. This conundrum particularly applies to the two most abundant minerals in Earth’s sedimentary record, dolomite and quartz (Meister et al., 2014), which are observed not to precipitate directly from aqueous solution as long as the solution remains supersaturated with respect to one of their metastable polymorphs.

Here, an alternative concept is proposed that would be consistent with Ostwald’s (1897) original formulation and with several observations from natural environments and laboratory experiments. The difference lies in the translation of the word “nearest”, not in a thermodynamic sense as “having a similar Gibbs energy”, but kinetically as “having the smallest energy barrier”. In the latter case, Ostwald’s step rule would become an actual physical law, equivalent to the Arrhenius law. This goes along with the concept that not the thermodynamic barrier of nucleation but some kinetic barrier, not affected by supersaturation, is responsible for the efficient inhibition of the phase. Inhibition (giving rise to Ostwald’s step rule) would then not be a matter of nucleation but of growth.

Meister et al. (2014) Early diagenetic quartz formation at a deep iron oxidation front in the Eastern Equatorial Pacific. GCA 137, 188–207.


How to cite: Meister, P.:  Ostwald’s step rule: rule of thumb or strict physical law?, EGU General Assembly 2025, Vienna, Austria, 27 Apr–2 May 2025, EGU25-6901, https://doi.org/10.5194/egusphere-egu25-6901, 2025.

Two areas in Sweden are currently being investigated by the Swedish geological survey as possible sites for geological storage of CO2. One of them is in the Baltic Basin south of Gotland, where Cambrian sandstone from the Faludden Member (Borgholm Formation) has been recognized as a suitable storage reservoir. The Faludden reservoir is a well-sorted, fine- and medium-grained quartz arenite with high porosity and permeability. Here, we report new results obtained from scanning electron microscope analyses of the secondary mineralogy of the Faludden sandstone and implications for its CO2 storage potential. Our study shows that there are several phases of secondary mineralization in the sandstone, which to a varying degree affects the interaction with injection and storage of CO2. The results provide information on the diagenetic history of the reservoir and assessment of depth-related P-T mineralizations. The most common secondary mineralization is a patchy carbonate cement. The patches, embedding several detrital grains, are round to irregular with individual diameters of up to 5 mm. The carbonate is mostly dolomite with microscale variations towards more Mn- and Fe-rich compositions. Calcite is also present, especially in connection to occasional microfractures. In general, patchy cementation is favorable for CO2 storage since it can prevent compaction, while still allowing a relatively high porosity and permeability. Quartz cement in the Faludden sandstone is limited to scattered occurrences of fringed overgrowths at the edges of detrital quartz grains. However, we observe that the amount of secondary quartz is increasing with depth in the Baltic Basin. Subcropping lower Cambrian sandstone beds, such as the När and Viklau sandstone members are often more or less completely cemented with quartz. Thus, the process of secondary quartz mineralization is an important factor to consider when assessing the optimal depth range for CO2 storage in the basin. Other secondary minerals in the Faludden sandstone include pyrite, apatite, iron(titanium)oxides and small amounts of clay minerals (illite and kaolinite). In some samples there is evidence of dissolution of both quartz cement and dolomite, introducing a secondary microporosity. This study confirms that the sandstone from the Faludden Member is a suitable reservoir rock for CO2 storage. A thorough understanding of geological processes, including reservoir diagenesis, is essential for predicting the physiochemical interactions between the injected CO2 and the reservoir rock.

How to cite: Lindgren, P., Erlström, M., and Lindström, S.: Impact of diagenesis on the suitability of reservoir rocks for CO2 storage - Examples from a Cambrian sandstone in the Baltic Sea, EGU General Assembly 2025, Vienna, Austria, 27 Apr–2 May 2025, EGU25-10495, https://doi.org/10.5194/egusphere-egu25-10495, 2025.

EGU25-11167 | ECS | Orals | SSP3.4

Zoned spherical concretions from Atsuta Formation, Japan: a record of rapid geochemical shifts in early diagenesis 

Alvin Praet, Hidekazu Yoshida, Yusuke Muramiya, Akihiro Kano, Taro Kido, Nagayoshi Katsuta, and Ayako Umemura

Introduction

Carbonate concretions form at shallow burial depths (Raiswell, 1971), with most bicarbonate ions derived from the anaerobic oxidation of organic matter (Claypool and Kaplan, 1974). Specifically, spherical carbonate concretions are proposed to grow concentrically through the diffusion-driven outward migration of the carbonate supersaturation front (Yoshida et al., 2018). Consequently, the center-to-edge isotopic and geochemical profiles of spherical carbonate concretions provide valuable records of pore-water evolution. Zoned spherical concretions, which exhibit distinct zonation, can potentially preserve traces of multiple diagenetic processes. This presents a unique opportunity to reconstruct the temporal and spatial evolution of the pore-water environment at higher resolution. This study presents a detailed analysis of zoned spherical concretions from the Miocene marine sediments of the Atsuta Formation, Japan, to elucidate their formation processes.

Results and Discussion

Well-preserved zoned spherical concretions from the Atsuta Formation are subdivided into two distinct zones: a spherical nucleus (Inner-Concretion) and an outer crust (Outer-Concretion) (Fig. 1). Its spherical shape and the presence of fossilized mud shrimp claws at the center suggest a concentric growth mode. Both the Inner- and Outer-Concretion are inferred to have formed rapidly at shallow burial depths, based on the following evidence:

  • Fossilized fecal pellets and mud shrimp claws were found in both the Inner- and Outer-Concretions, exhibiting no signs of compaction.
  • The carbonate content was 83.0 ± 0.5 wt% in the Inner-Concretion and 79.4 ± 0.1 wt% in the Outer-Concretion, indicating precipitation within porous sediments prior to significant compaction.
  • The average stable oxygen isotope ratios (δ18O) were +0.63 ± 0.77‰ (n = 76) in the Inner-Concretion and +0.92 ± 0.48‰ (n = 44) in the Outer-Concretion, suggesting the absence of isotopic fractionation effects related to burial depth.

Detailed measurements of stable carbon isotope ratios (δ13C) (n = 129) revealed characteristic trends in each zone, with abrupt changes at their boundaries. The δ13C values in the Inner-Concretion steadily increased from -15‰ near the center to +10‰ toward the edge, reflecting isotopic fractionation associated with enhanced methanogenesis. In contrast, δ13C in the Outer-Concretion was approximately -15‰ and relatively constant. The presence of pyrite throughout the concretion suggests that at least the Outer-Concretion formed within the sulfate reduction zone.

These findings collectively indicate a shift in dominant organic matter degradation processes from methanogenesis to sulfate reduction, a trend that deviates from the classical geochemical sequence of sedimentary environments (Berner, 1981). A plausible hypothesis is that methanogenesis occurred entirely within the sulfate reduction zone, potentially as a localized microenvironment around organic matter during the formation of the Inner-Concretion.

How to cite: Praet, A., Yoshida, H., Muramiya, Y., Kano, A., Kido, T., Katsuta, N., and Umemura, A.: Zoned spherical concretions from Atsuta Formation, Japan: a record of rapid geochemical shifts in early diagenesis, EGU General Assembly 2025, Vienna, Austria, 27 Apr–2 May 2025, EGU25-11167, https://doi.org/10.5194/egusphere-egu25-11167, 2025.

EGU25-12855 | ECS | Posters on site | SSP3.4

The Role of Dolomitization and Clay Rims in Shaping Sandstone Evolution: Insights from the Groningen Gas Field 

Sebastian Mulder and Johannes Miocic

The Groningen gas field, Europe’s largest onshore gas reservoir, has undergone extensive compaction due to prolonged gas extraction, leading to surface subsidence and seismicity. Understanding the diagenetic processes controlling reservoir quality is essential for managing these risks. This study investigates the role of dolomitization and associated diagenetic alterations in shaping the petrophysical and geomechanical properties of the Rotliegend sandstones. Detailed petrographic analysis, incorporating optical and scanning electron microscopy, reveals that early dolomite cementation significantly reduced primary porosity while preserving intergranular volume (IGV) and enhancing mechanical stability by inhibiting grain rearrangement and compaction during burial. Dolomite cementation was particularly prominent in zones proximal to mudstone interbeds, indicating its strong depositional and diagenetic control. Authigenic clays, including illite, smectite, and chlorite, were found to inhibit late-stage quartz cementation, preserving reservoir quality in specific zones. Burial depth and prolonged thermal exposure intensified quartz overgrowths and illite development, particularly in deeper sections of the reservoir. Clustering patterns among authigenic minerals revealed strong positive and negative associations: Illite, illite-smectite, and chlorite frequently co-occur in fine-grained sandstones, particularly in northern wells, where their abundance reduces pore space and permeability. Conversely, high dolomite content negatively correlates with clay minerals and quartz cement, reflecting the inhibitory role of early dolomitization on subsequent diagenetic mineral development. Quartz cementation plays a minor role in compaction due to shallow burial conditions and the presence of clay rims around grains, which limited growth of quartz cements. Mechanical compaction primarily affected sandstones lacking dolomite, where authigenic clay content and quartz cementation are higher, correlating with higher porosity and permeability than sandstones that are dolomitized. This study highlights the interplay between depositional setting, diagenetic timing, and burial history in shaping reservoir quality and stability. By linking petrographic trends to geomechanical behavior, these findings provide critical insights into mitigating subsurface risks associated with gas extraction in Groningen and analogous reservoirs worldwide.

How to cite: Mulder, S. and Miocic, J.: The Role of Dolomitization and Clay Rims in Shaping Sandstone Evolution: Insights from the Groningen Gas Field, EGU General Assembly 2025, Vienna, Austria, 27 Apr–2 May 2025, EGU25-12855, https://doi.org/10.5194/egusphere-egu25-12855, 2025.

EGU25-13621 | ECS | Orals | SSP3.4

Investigating the Water Organization at the Calcite (10.4)-Water Interface at High pH 

Tobias Dickbreder, Frank Heberling, and Ellen Backus

Calcite, the most abundant carbonate mineral in Earth’s crust, is at the heart of many environmental and technological processes. As part of the geological carbonate-silicate cycle, calcite dissolution and precipitation are central for the regulation of atmospheric carbon dioxide levels on geological timescales. Moreover, calcite is involved in buffering of sea- and freshwater pH values and biomineralization of marine organisms. Important technological applications of calcite are the use in concrete and as a storage material for anthropogenic carbon. Since most processes on calcite take place in an aqueous environment, they are governed by the structure and properties of the calcite-water interface. Consequently, there has been a large body of research establishing a detailed understanding of the interface between the most-stable calcite (10.4) surface and water. This includes the development of so-called surface complexation models describing the surface speciation and properties of the calcite-water interface in thermodynamic equilibrium with aqueous solutions of varying composition. An important part of these models is the description of the species at the interface, which heavily depends on the protonation and deprotonation of surface-bound water and interfacial carbonate groups. However, the de-/protonation of calcite is difficult to quantify experimentally due to calcite dissolution and carbonate buffering. Here, we apply interface-sensitive vibrational sum frequency generation (SFG) spectroscopy to directly assess the water species present at the calcite-water interface at high pH. With SFG spectroscopy, we can measure the vibrational spectrum of interfacial species, providing insights into the molecular organization and chemical environment at the interface. We aim to quantify the change of hydroxyl species present at the interface with increasing pH to quantify the deprotonation constant of surface-bound water contributing to the development of more-accurate surface complexation models.

How to cite: Dickbreder, T., Heberling, F., and Backus, E.: Investigating the Water Organization at the Calcite (10.4)-Water Interface at High pH, EGU General Assembly 2025, Vienna, Austria, 27 Apr–2 May 2025, EGU25-13621, https://doi.org/10.5194/egusphere-egu25-13621, 2025.

Marine carbonates are archives of geochemical proxies, such as e.g. Sr and U-Pb isotopes, which potentially can be utilized in the reconstruction of past climate conditions, ancient seawater composition and/or their alteration during burial and fluid interaction, if interpreted accurately. The ability to confidently reconstruct environmental conditions in the past times is of great importance since they can be linked with changes in the biosphere. For example, the Ediacaran-Cambrian transition was a period where significant evolutionary change modified the biosphere towards appearance of extant animal clades and the establishment of metazoan-dominated ecosystems. Any contribution towards an intact, continuous record of environmental conditions through multiple proxies will help to understand better the timing, nature and sequence of events that preceded or accompanied such changes in biodiversity. However, carbonate rocks are susceptible to numerous post-depositional processes (such as: oxidative weathering, diagenesis, burial, lithification, deformation, dissolution and reprecipitation), which may alter the geochemical record. Additionally, detrital components may increase the complexity of the geochemical signature and the carbonate composition, particularly in shallow marine settings with variable continental run-off.

Thus, we have to understand and identify the presence or absence of such processes, before extracting meaningful geological information from these archives. Laser Ablation – Inductively Coupled Plasma – Mass Spectrometry (LA-ICP-MS), is a tool that offers spatial resolution when performing geochemical analyses, which may help to interpret the geochemical data more confidently. In this work, we combine observations from Sr and U-Pb isotopic systematics supported by trace element abundances to identify domains that are indicative of post-depositional processes, over protracted time and variable in their extent. The sample material is taken from drill cores in Namibia, obtained within the frame of the GRIND project, which aims to investigate the late Edicaran period. Situated in the south of Namibia, the Gariep belt was geologically active during the Pan African orogenesis and possibly affected by the Atlantic Ocean opening.  

How to cite: Paul, A. N., Gerdes, A., Cantine, M., and Ovtcharova, M.: Progress in the evaluation of U-Pb dates of late Ediacaran carbonate rock from drill cores through simultaneous Sr isotope analysis (Laser Ablation – Split Stream – Inductively Coupled Plasma – Mass Spectrometry), EGU General Assembly 2025, Vienna, Austria, 27 Apr–2 May 2025, EGU25-15410, https://doi.org/10.5194/egusphere-egu25-15410, 2025.

EGU25-15488 | Orals | SSP3.4

Fluid flow history and paragenesis along a syn-rift basin bounding fault: the Helmsdale Fault (NE Scotland) 

Matteo Demurtas, Ian Sharp, Leonardo Pasqualetto, Yves Stephan Krüger, Kerstin Drost, Anna Nele Meckler, and Atle Rotevatn

Within syn-rift basinal settings, the juxtaposition of rift-related clastic deposits in the hanging wall of basin-bounding normal faults against a footwall of crystalline basement is a recurrent structural setting where plays for hydrocarbon exploration or carbon storage can be found. Here, fault-controlled fluid flow can significantly influence and change the petrophysical properties of the fault zone and host rocks over time by means of mineralization and cementation, ultimately controlling fluid pathways. Investigating the timing and extent of fluid flow along major faults permits us to better understand the host rock properties and if these can potentially be favourable for subsurface extraction and storage.

Here, we present a detailed investigation of the timing and paragenesis of fluid flow along the well exposed Helmsdale Fault in NE Scotland. The Helmsdale Fault is a major tectonic feature that bounds the western side of the Inner Moray Firth Basin, which developed during rifting in the Late Jurassic. The hanging wall consists of the Late Jurassic (Kimmeridgian-Tithonian) Helmsdale Boulder Beds that are made of alternating debris flow to fault scarp deposits, whereas the footwall is composed of the Helmsdale Granite (Silurian-Devonian). There is ample evidence of paleo-fluid flow along the Helmsdale Fault in the form of calcite cementation and widespread calcite veining in both the hanging wall and in the footwall, locally making up to 5 m thick fault cores of stacked crack-seal veins. U-Pb calcite dating of fossils, veins and cements shows an initial fluid flow event that quickly follows diagenesis in the hanging wall and spans from 147 to 113 Ma, followed by a later reactivation of the fault system between 86-60 Ma. The spatial distribution of the dated calcite veins shows a clear localization over time of fluid flow along the main faults within the footwall.

Carbonate stable isotope analysis, combined with the salinity of the fluid inclusions in the calcite veins, has revealed a marine fluid composition of the calcite vein network over time, irrespective of the structural domain within the fault zone. Furthermore, clumped isotope thermometry shows a gradual temperature increase towards the footwall (35 to 65 °C), but fluid inclusion microthermometry on secondary fluid inclusions also reveals that these fluids could originally have been much hotter (up to c. 80 °C). The variability in the data suggests that two fluid pathways were active at different moments in time, with one being locally sourced in the hanging wall sediments, and the second percolating upwards along the main faults within the Helmsdale Granite. Occurrence of calcite veins derived from meteoric fluids is documented in the youngest dated vein network (60 Ma) and likely related to the later stages of regional uplift.

Our results suggest that the evolution over time of the petrophysical properties of the hanging wall with progressive mineralization and cementation exert a critical control on future fluid pathways as well as localization and style of subsequent fault deformation.

How to cite: Demurtas, M., Sharp, I., Pasqualetto, L., Krüger, Y. S., Drost, K., Meckler, A. N., and Rotevatn, A.: Fluid flow history and paragenesis along a syn-rift basin bounding fault: the Helmsdale Fault (NE Scotland), EGU General Assembly 2025, Vienna, Austria, 27 Apr–2 May 2025, EGU25-15488, https://doi.org/10.5194/egusphere-egu25-15488, 2025.

EGU25-16523 | ECS | Posters on site | SSP3.4

Arsenic — an indicator for post-depositional water exchange in sediments at neutral to alkaline conditions 

Donjá Aßbichler, Natalie Weichselgartner, Natalie Diesner, Melvin Kayalar, Carolin Otte, Maria Kellner, Helia Henning, and Saskia Tautenhahn

Sediment archives are invaluable for reconstructing past environmental conditions. Clastic sediments are formed through physical processes, such as weathering of rocks, during which minerals are released from the parent material, transported, and eventually deposited. However, both transport and depositional processes—such as abrasion, mixing, or chemical dissolution—can alter the original signals preserved in the sediment. Water plays a central role in these transformations by promoting processes like dissolution and recrystallization of minerals. This is particularly relevant for sediments deposited in stagnant waters such as lakes or marine basins. Similarly, infiltration of surface water flows into sediments, enhances chemical reactions and facilitates the transformation of minerals. Fine-grained sediments, such as sands or clays, are especially reactive due to their large specific surface area, which increases their interaction with fluids.

To determine the original composition, isotopic signatures, or depositional and source age of the sediment and the contained minerals, it is crucial to know whether, and to what extent, chemical alterations have occurred during and after the deposition. A critical factor in the analysis is whether the sediment layer represents a closed or open system. In closed systems, the original chemical signatures are preserved, as no significant element exchange occurs with the surrounding environment. In contrast, in open systems, interactions with water can lead to the loss or accumulation of elements, which can alter the sediment's original composition at the time of deposition, making it difficult to interpret its geochemical and mineralogical history.

In a comprehensive mineralogical and geochemical study combined with field observations, we analyzed solids and eluates of 250 sediment samples from the Miocene the Northern Alpine Foreland basin. Additionally, we separated and analyzed the mineral chemistry of over 30 samples (also clay fraction) using SEM. We examined the mineral textures with high-resolution microscopy. Furthermore, we performed extensive leaching experiments to study the mobilization behavior of the contained elements under “open system conditions”.

The results of this study revealed the following: 1) A significant proportion of the minerals in the sediments are newly formed. 2) Experiments showed that processes like dissolution and precipitation can proceed very quickly (within hours to days), depending on factors such as pH, Eh and concentration of dissolved elements. However, these processes can be halted when the sediment runs dry or when chemical equilibrium in the system is achieved. 3) In open-system sediment profiles, water infiltration causes the leaching of elements that are transported to deeper stratigraphic layers, where they precipitate and form new mineral phases.

A key observation is the elution behavior of arsenic: In sediments known to represent open systems, arsenate is not mobilized in the elution tests, because it is fixed in the mineral phases or is already desorbed during the water exchange. In closed systems, elevated arsenic concentrations in the eluate indicate that these sediments have not undergone significant post-depositional water exchanges. The analysis demonstrated that arsenic is predominantly adsorbed on phyllosilicates. Accordingly, an elution test is a reliable indicator of water exchange in sediments after their deposit.

How to cite: Aßbichler, D., Weichselgartner, N., Diesner, N., Kayalar, M., Otte, C., Kellner, M., Henning, H., and Tautenhahn, S.: Arsenic — an indicator for post-depositional water exchange in sediments at neutral to alkaline conditions, EGU General Assembly 2025, Vienna, Austria, 27 Apr–2 May 2025, EGU25-16523, https://doi.org/10.5194/egusphere-egu25-16523, 2025.

EGU25-16554 | Posters on site | SSP3.4

Heterogeneous cementation and compaction in a sandstone and the role of temperature – an example from the Etjo Formation, Namibia 

Eric Salomon, Harald Stollhofen, Luca Caracciolo, Linda M. Bonnell, and Robert H. Lander

Diagenetic processes alter petrophysical properties, such as porosity and permeability, of clastic sediments. An understanding of these processes is therefore pivotal for any reservoir quality assessments. Thermal exposure is among the crucial factors influencing diagenesis and can vary significantly in widespread formations, e.g. due to regional variations of the burial history. Especially quartz overgrowth is controlled by temperature and we here demonstrate the effect of spatial thermal exposure variability on the degree of cementation. Our field example is from the aeolian Jurassic Etjo sandstone that was buried by the Lower Cretaceous Paraná-Etendeka Large Igneous Province in Namibia and we show data from outcrops lying >100 km apart from each other – named Waterberg, Mt. Etjo, and Gamsberg. 

Our petrographic analysis shows significant differences in the degree of compaction and cementation between the localities (Salomon et al., 2024). Waterberg samples have a mean quartz cement volume of 6.5 % and intergranular volume (IGV) of 23.7 %. Mt. Etjo samples have a higher quartz cement volume (15.4 %), but lower IGV (19.7 %). As Waterberg samples had an on average 72 % larger nucleation surface area available for quartz cement growth than samples from Mt. Etjo, we argue that the latter locality has experienced a higher thermal exposure. This is supported by a kaolinite-to-illite transformation that only occurs at Mt. Etjo. We attribute the temperature differences to the localities’ position underneath the volcanic cover with Mt. Etjo being closer to the volcanic center than Waterberg. Gamsberg samples have a very high mean IGV of 30.7 % and very high mean quartz cement volumes of 24.3 %. Here, two quartz growth generations are evident and separated by an exhumation period of the sandstone. The origin of the first generation is yet unclear, whereas the second one is also attributed to the Etendeka burial. 

Our case study serves as a prime example for the variability in diagenetic character within a sandstone formation, depending on its geographic position. It underscores the importance of understanding spatial variabilities in the burial/temperature history when predicting the diagenetic properties of a reservoir rock. 

Reference: Salomon, E., Stollhofen, H., Caracciolo, L., Bonnell, L.M., Lander, R.H., Kittel, M., 2024. Burial of a sand sea: Heterogeneous compaction and cementation of the jurassic Etjo Formation, Namibia and what it tells. Marine and Petroleum Geology, 168, 107044.

How to cite: Salomon, E., Stollhofen, H., Caracciolo, L., Bonnell, L. M., and Lander, R. H.: Heterogeneous cementation and compaction in a sandstone and the role of temperature – an example from the Etjo Formation, Namibia, EGU General Assembly 2025, Vienna, Austria, 27 Apr–2 May 2025, EGU25-16554, https://doi.org/10.5194/egusphere-egu25-16554, 2025.

EGU25-17405 | Orals | SSP3.4

Authigenic carbonate and native sulfur formation in Messinian (upper Miocene) marine sediments 

Marcello Natalicchio, Daniel Birgel, Stefano Giunti, Laetitia Guibourdenche, Luca Pellegrino, Giovanni Aloisi, Jörn Peckmann, and Francesco Dela Pierre

Carbonate concretions accompanied by elemental sulfur are found in many upper Miocene marine successions across the Mediterranean area (e.g. SE-Spain, Sicily, Apennine, Cyprus). Most of these rocks are characterized by molds of evaporitic minerals (mostly gypsum) suggesting an early (syngenetic) or late (epigenetic) diagenetic origin. In contrast to these findings, a case study from the Ripa dello Zolfo area in northern Italy lacks evidence of carbonate and sulfur replacement of preexisting sulfate minerals. An integrated approach including sedimentological, petrographical, stable isotope (carbon, oxygen, and multiple sulfur isotopes), and lipid biomarker analyses was used for the study of three main lithofacies: a) laminated lithofacies representing aphotic carbonate stromatolites enclosing fossils of filamentous sulfide-oxidizing bacteria; b) brecciated lithofacies deriving from the brecciation of carbonate stromatolites by mud injections; c) sulfur-bearing lithofacies deriving from the precipitation of thin laminae of elemental sulfur at or close to the sediment-water interface. The δ13C and δ18O values of authigenic carbonate minerals and δ13C of lipid biomarkers indicate that the initial formation of the laminated lithofacies was favored by organoclastic sulfate reduction in the shallow subsurface close to the sediment-water interface, producing sulfide that sustained dense microbial mats of sulfide-oxidizing bacteria at the seafloor. Calcification of the mats and consequent formation of stromatolites were possibly favored by nitrate-driven sulfide oxidation at the seafloor. The subsequent brecciation of the stromatolites was apparently the consequence of sulfate-driven anaerobic oxidation of methane (SD-AOM) in an underlying sulfate-methane transition zone (SMTZ). Focused fluid flow from a deeper zone was not only causing the brecciation of the stromatolites, but also delivered bicarbonate ions for the subsequent precipitation of additional, 13C-depleted calcite (δ13C values as low as -52‰). Along with bicarbonate, also hydrogen sulfide was produced by SD-AOM within an SMTZ in a zone below the stromatolites and was transported upwards. The oxidation of hydrogen sulfide at or close to the seafloor promoted the formation of elemental sulfur characterized by δ34S and Δ33S values close to coeval seawater sulfate. This study highlights that a multi-proxy approach has great potential for the reconstruction of spatially and temporarily separated biogeochemical processes in the shallow subsurface or at the seafloor (i.e., anaerobic oxidation of methane, sulfate reduction, sulfide oxidation) – processes that may induce the syngenetic formation of authigenic carbonate and sulfur deposits in marine sediments.

How to cite: Natalicchio, M., Birgel, D., Giunti, S., Guibourdenche, L., Pellegrino, L., Aloisi, G., Peckmann, J., and Dela Pierre, F.: Authigenic carbonate and native sulfur formation in Messinian (upper Miocene) marine sediments, EGU General Assembly 2025, Vienna, Austria, 27 Apr–2 May 2025, EGU25-17405, https://doi.org/10.5194/egusphere-egu25-17405, 2025.

EGU25-17872 | Orals | SSP3.4

Controls on barite precipitation and preservation in Mediterranean sediments: from sapropel deposition to modern sedimentation 

Francisca Martinez-Ruiz, Ricardo Monedero-Contreras, Luis Monasterio-Guillot, Adina Paytan, and Crisogono Vasconcelos

Mediterranean sediments have registered some of the most exceptional Ba records in marine basins. Although Organic Rich Layers (ORLs) are less well studied, both sapropels and ORLs are characterized by marked increases in Ba content in response to productivity oscillations, as demonstrated by numerous data sets and sediment records. During sapropel deposition, barite was abundantly produced in the water column due to increased productivity and associated microbial processes involved in organic matter degradation. In this scenario, bacterial activity and extracellular polymeric substances (EPS) have been shown to be the main control of barite precipitation in the water column, which is further supported by experimental work and observations from microenvironments of intense organic matter mineralization in the ocean water column. Once accumulated in marine sediments, barite tends to be well preserved in both eastern and western Mediterranean basins, where the availability of sulphate in pore waters prevented dissolution. Thus, differences in barite abundance in sapropels compared to ORLs support differences in productivity rates, and also differences in primary producers and microbial processes. Indeed, differences in productivity types between modern eastern and western basins also support that such differences over time may have led to spatial differences in barite formation. The general decline in productivity, and hence microbial activity, across the Mediterranean basins during the Holocene is indicated by the remarkably low Ba content in recent sediments. Dissolution of barite through the water column is also important in modern environments and is still poorly understood in the past. Overall, a better understanding of the microbial processes involved in barite production and the factors controlling its preservation is required to further constrain the information captured by Ba proxies.

How to cite: Martinez-Ruiz, F., Monedero-Contreras, R., Monasterio-Guillot, L., Paytan, A., and Vasconcelos, C.: Controls on barite precipitation and preservation in Mediterranean sediments: from sapropel deposition to modern sedimentation, EGU General Assembly 2025, Vienna, Austria, 27 Apr–2 May 2025, EGU25-17872, https://doi.org/10.5194/egusphere-egu25-17872, 2025.

EGU25-18386 | ECS | Posters on site | SSP3.4

Tight Reservoir Potential of the Early Eocene Bou Dabbous Formation in Northwestern Tunisia 

Imen Arfaoui, Hamdi Omar, Ajendra Singh, Mouna Rachdi, Mabrouk Montacer, François Baudin, Frédéric Collin, and Frédéric Boulvain

Early Eocene limestones in Tunisia exhibit notable variations in facies and thickness, indicative of a depositional environment primarily within a platform setting. Most planktonic-rich microfacies are deposited in slope-basin areas conducive to preserving organic matter. This study focuses on the Bou Dabbous Formation, a known source-rock explored in various wells across Tunisia. It aims to evaluate its potential as a tight reservoir through a comprehensive analysis of core samples from two outcrop analogs: Oued Kasseb (OK) and Ragoubet Tassera (TS) sections in northwestern Tunisia.

Rock-Eval pyrolysis of 42 samples revealed variable organic richness, with higher Total Organic Carbon (TOC) in the OK section (max TOC = 2.75 wt.%) compared to the TS section (max TOC = 1.11 wt.%). Tmax values ranged from 433°C to 454°C, indicating a predominantly mature to marginally mature stage of hydrocarbon generation. Hydrogen Index (HI) values classified the organic matter primarily as Type II, with some Type II/III, suggesting a planktonic marine origin under anoxic to suboxic conditions.

Inorganic analysis, including XRF and XRD analyses, showed significant lithological variations between massive limestone and marly limestone layers. Major oxides such as MgO and SiO2 varied notably, with silica-rich layers prominent in the TS section and magnesian limestones in the OK section. Trace elements like Sr and S highlighted diagenetic processes and variations in paleoclimate, suggesting semi-humid conditions during deposition. The presence of pyrite, influenced by anoxic conditions and diagenesis, further supports these findings. The complex diagenetic processes affecting the Bou Dabbous limestones impact their petrophysical properties, including fractures, silicification, and cementation.

The region's significant tectonic activity has resulted in a complex fracture network, as observed in field studies and thin-section analyses. These fractures, partially filled with calcite and asphaltene, are attributed to compaction and tectonic stresses. Stylolites, formed by chemical compaction and bitumen-filled fractures, indicate the circulation of acidic solutions related to petroleum generation processes. These processes altered the primary pore system by either enhancing reservoir properties (such as fracturing and oxidation) or reducing and destroying porosity through cementation, mechanical and chemical compaction, and the precipitation of asphaltene, phosphate, and pyrite. This emphasizes the complexity of diagenetic controls on the porosity evolution. The brittleness index (BI) for the Bou Dabbous Formation, determined based on carbonate fractions, detrital content, and TOC percentages, was high, ranging from 0.84 to 0.98. This suggests a high fracturing sensitivity among the studied area's rocks.

Overall, the findings indicate that the Bou Dabbous limestones have potential as a tight reservoir with favorable conditions for unconventional hydrocarbon exploration, influenced by its significant organic content, mature hydrocarbon generation, and brittleness characteristics. These results underscore the formation's importance in regional petroleum exploration and development. Further investigations should be conducted on borehole cuttings, along with rigorous fracturing simulations, to realistically evaluate the potential of the Bou Dabbous Formation in Tunisia as an unconventional hydrocarbon reservoir within the explored petroleum system.

How to cite: Arfaoui, I., Omar, H., Singh, A., Rachdi, M., Montacer, M., Baudin, F., Collin, F., and Boulvain, F.: Tight Reservoir Potential of the Early Eocene Bou Dabbous Formation in Northwestern Tunisia, EGU General Assembly 2025, Vienna, Austria, 27 Apr–2 May 2025, EGU25-18386, https://doi.org/10.5194/egusphere-egu25-18386, 2025.

EGU25-19852 | ECS | Posters on site | SSP3.4

Characteristics of ferromanganese micronodules in surface sediments of the tropical North Pacific Ocean 

Huan Zhang, Yanhui Dong, Yuan Peng, Junming Zhou, and Fengyou Chu

In addition to the widely acknowledged marine ferromanganese deposits, i.e., polymetallic nodules and cobalt-rich crusts, Fe-Mn (oxyhydr)oxides ubiquitously precipitate as micronodules in the oxic aquatic environments. Due to their micrometer-scale or even smaller size, ferromanganese micronodules have received limited attention until they were found to be one of the important rare earth elements and yttrium (REY)-holding phases in the deep-sea REY-rich mud, and noteworthily estimated to preserved a ~1.28-7.62 Tt Mn budget, exceeding that of nodules and crusts by at least two orders of magnitude. Combined with the increasing demands for critical elements in high-tech industries, the economic and scientific potential of micronodules, which could strongly scavenge trace elements from ambient environments, deserve to be revised.

In our study, Fe-Mn micronodules were hand-picked from surface sediments of the North-Western (NW) Pacific and the North-Eastern (NE) Pacific Clarion-Clipperton Fracture Zone (CCFZ) for morphological and in-situ geochemical analyses with field-emission scanning electron microscope (SEM), electron probe microanalyzer (EPMA) and laser ablation (LA) inductively coupled plasma mass spectrometry (ICP-MS). The characteristic microbial-like mineralization structures, including the irregular aggregates of rod microbial-like particulates, biofilm, and the phalanxes of ellipsoid microorganisms, were commonly observed in micronodules. Their Mn/Fe ratios most frequently fall in the range of < 10 (46.1%), with a maximum value (reaching 698) that is much higher than the published EMPA data of polymetallic nodules. Unlike the continuous variation of elemental contents in nodules, the concentrations of some elements in micronodules, such as Al, Ca, K, Co, Ni, Cu, Sr, Mo and REYs other than Ce, showed a mutative tendency, being slowed down or even reversed, with the increase of Mn/Fe ratio in the ranges of Mn/Fe < 10 and Mn/Fe > 10. Whereas, the declining tendencies in Ce contents and Ce anomaly remained generally stable.

Considering the loose structure of Fe-Mn (oxyhydr)oxides, and after multiple comparisons, Mn/Fe < 5 is used here to distinguish hydrogenetic and mixed hydrogenetic-early diagenetic type (grouped into hydrogenetic type hereafter) from diagenetic type. Amounts of geochemical data of hydrogenetic Fe-Mn deposits (including micronodules, (macro)nodules and crusts) were collected. Comparative analyses reveal that both the hydrogenetic crusts (n = 289) and nodules (n = 159) have weaker positive Ce anomalies (avg. 2.23 and 2.97, respectively) than our hydrogenetic micronodules (n = 204, avg. 6.27). Combined with the similar Ce content in all three hydrogenetic ferromanganese deposit types, and the lower concentrations of other REYs in hydrogenetic micronodules, the migration of REYs (except for Ce) from micronodules to porewater is indicated.

All these findings demonstrated that the precipitation and aggregation of micronodules were predominantly controlled by the redox state of ambient pore water, even in surface sediments, and were largely influenced by microbial activities. The potential of ferromanganese micronodules to serve as a buffer in the enrichment of REYs and critical elements in pelagic sediments and an archive of the ambient redox conditions enhanced their value of further comprehensive and in-depth studies.

How to cite: Zhang, H., Dong, Y., Peng, Y., Zhou, J., and Chu, F.: Characteristics of ferromanganese micronodules in surface sediments of the tropical North Pacific Ocean, EGU General Assembly 2025, Vienna, Austria, 27 Apr–2 May 2025, EGU25-19852, https://doi.org/10.5194/egusphere-egu25-19852, 2025.

EGU25-20419 | ECS | Posters on site | SSP3.4

Minerals & microorganisms, a possible relationship: an awareness project of GEOMICROBIology 

Luca Pellegrino, Marcello Natalicchio, Giorgio Carnevale, Simona Cavagna, Francesco Dela Pierre, Francesca Lozar, Enrico Nallino, Linda Pastero, Cristina Varese, and Jules Danis Walter

The growing awareness of the relationships between minerals and microorganisms has deeply impacted the geosciences in the last decades. Microorganisms have been recognized to play a critical role in element cycles, resulting in the precipitation of minerals and in the formation of peculiar rocks (e.g. stromatolites and thrombolites) that punctuate the geological record. Moreover, the Earth history was characterized by episodes of massive accumulation of mineralized remains of microorganisms on the ocean floors, resulting in the formation of biogenous oozes that represent natural archives of past climatic and oceanographic variability. Finally, the rapid growth of minerals can act as a trap for microorganisms that can be perfectly preserved within the crystal lattice or fluid inclusions for millions of years. Such strict connections between the geosphere and the biosphere are mostly unknown to the general audience, although the impact of microbial (microorganisms) and nanoscopic (viruses) life on our society is emerging more and more. The project “Minerals & Microbes, a possible relationship: GEOMICROBIology for dummies” aims at showing the microbial life enclosed in minerals and rocks. Improving people awareness about the role of microorganisms in shaping the Earth will contribute to understand the importance of life as a “geological force”. The project GEOMICROBI aspires to raise such awareness throughout imaging (mostly by SEM high-definition photomicrographs) the "invisible life" hidden within minerals and rocks. Main target of the project is the creation of a photographic exhibition accompanied by informative conferences on the theme "Minerals & Microorganisms". This poster is intended to attract the attention of the international sedimentological community showing the first results of this dissemination initiative on mineral-microorganism interactions.

How to cite: Pellegrino, L., Natalicchio, M., Carnevale, G., Cavagna, S., Dela Pierre, F., Lozar, F., Nallino, E., Pastero, L., Varese, C., and Walter, J. D.: Minerals & microorganisms, a possible relationship: an awareness project of GEOMICROBIology, EGU General Assembly 2025, Vienna, Austria, 27 Apr–2 May 2025, EGU25-20419, https://doi.org/10.5194/egusphere-egu25-20419, 2025.

EGU25-224 | ECS | Orals | SSP4.1

Glacial-deglacial bloom of giant diatoms in the tropical western Pacific through utilization of subsurface nutrients 

Wenqin Cai, Enqing Huang, Shuangquan Liu, and Jun Tian

During the Pleistocene epoch, diatom mat blooming occurred in the global ocean for serval times, particularly during several glacial periods (MIS 14, 12, 6, 4, 2). One intriguing phenomenon related to these blooming is the deposition of Ethmodiscus rex diatom mats in tropical-subtropical oligotrophic marine zones. However, the causal mechanism of this occurrence, known as the " Ethmodiscus rex problem " remains under debate and it is crucial to understand this mechanism. This study investigates the diatom mat core GT01, which was enriched in E. rex and retrieved from the Mariana Trench’s Challenger Deep in the Western equatorial Pacific Ocean. We aim to determine the geological age of the diatom blooming event through AMS 14C dating and to explore the nitrogen source of the diatom bloom using δ13C, δ15Norg, and other proxies, and conduct a semi quantitative assessment of the sea surface productivity status during that period.


By comparing the nitrogen isotope signals and considering the isotopic fractionation effects of diatom biology and remineralization, it is suggested that the main source of nitrogen nutrients for E. rex diatom bursts is subsurface nitrate rather than the "new nitrogen". This viewpoint aligns with the findings of previous biological studies on Ethmodiscus species. Based on the nitrogen nutrient source, there is a further hypothesis that E. rex diatoms may also uptake nutrients such as phosphate concurrently with subsurface nitrate. The carbon isotope signal indicates a significant increase in marine primary productivity during the flourishing of E. rex diatoms. The extensive remineralization of organic matter during deposition, along with the substantial production of respired carbon, may have contributed to the reduction of atmospheric CO2 concentration during glacial periods.


As primary producer in the ocean, diatoms are crucial in coupling nitrogen and carbon cycles in marine ecosystems. Investigating the nutrient sources and productivity of diatom mats is vital for gaining insights into the oceanic carbon and nitrogen cycles. These findings enhance our understanding of global biogeochemical cycles and their broader implications for past marine productivity and climate regulation.

How to cite: Cai, W., Huang, E., Liu, S., and Tian, J.: Glacial-deglacial bloom of giant diatoms in the tropical western Pacific through utilization of subsurface nutrients, EGU General Assembly 2025, Vienna, Austria, 27 Apr–2 May 2025, EGU25-224, https://doi.org/10.5194/egusphere-egu25-224, 2025.

EGU25-247 | Orals | SSP4.1

Radiolarian Microfossils as a Tool for Reconstructing Sea Surface Temperature of the past in the Northwest Pacific 

Kenji Matsuzaki, Takuya Itaki, Yoshimi Kubota, Kyung Eun Lee, Isao Motoyama, Takuya Sagawa, Keiji Horikawa, Masafumi Murayama, and Hajime Obata

We investigate the suitability of radiolarian species as palaeoceanographic proxies in the Northwest Pacific Ocean using 33 new core-top samples collected since 2021 during Joint Usage/Research Center for Atmosphere and Ocean Science (JURCAOS, Japan), combined with existing datasets published by authors of this study. The main target of this study is to review the suitability of radiolarian species as a paleoceanographic proxy and to develop a robust methodology to estimate past Sea Surface Temperature based on radiolarian species abundances. For this purpose, we compiled our new data from the East China Sea and Central Northwest Pacific with previous datasets obtained in the same area, Japanese coast, and Japan Sea. Our analysis revealed considerable differences between Sea of Japan and Northwest Pacific radiolarian assemblages, suggesting different responses of biota to environmental changes in this marginal sea; thus, we excluded Sea of Japan data from Northwest Pacific Sea Surface Temperature (SST) reconstructions. Factor Analysis identified four radiolarian assemblages in the Northwest Pacific and East China Sea, each associated with specific water masses and SST ranges: Subtropical, Sea of Okhotsk-related subarctic, Oyashio Current to transitional zone-related, and coastal water assemblages. Warm-water species (e.g., Tetrapyle circularis/fruticosa, Dictyocoryne tetrathalamus) showed strong correlation with temperatures above 24°C, while cold-water species (e.g., Lithomelissa setosa, Ceratospyris borealis) were linked to temperatures below 14°C. Literature review suggests these radiolarian-based SST reconstructions primarily reflect summer conditions. Using weighted averaging partial least squares analysis, we reconstructed past summer SSTs at IODP Site U1429 in the northern East China Sea with high precision (R²=0.97, ±1.4°C). These reconstructions align well with Globigerinoides ruber Mg/Ca-based summer SSTs, despite minor glacial period discrepancies, while showing consistent offsets from alkenone-based estimates, likely due to seasonal biases.

How to cite: Matsuzaki, K., Itaki, T., Kubota, Y., Lee, K. E., Motoyama, I., Sagawa, T., Horikawa, K., Murayama, M., and Obata, H.: Radiolarian Microfossils as a Tool for Reconstructing Sea Surface Temperature of the past in the Northwest Pacific, EGU General Assembly 2025, Vienna, Austria, 27 Apr–2 May 2025, EGU25-247, https://doi.org/10.5194/egusphere-egu25-247, 2025.

Eocene is one of the most eventful epochs of Earth’s geologic history, ranging from a series of global warming events in the early Eocene (~56-47 Ma) to an icehouse transition at the end of Eocene to Oligocene. Kutch, a pericratonic rift basin at the western boundary of India, hosts thick sedimentary strata with intervening marine deposits of Eocene with hiatus at Lutetian (~47-42 Ma) and Priabonian (~37-33 Ma). Given Kutch's equatorial paleolatitudinal position (~10°S-10°N) during the Eocene, it is particularly interesting to investigate the basin's response to global climatic perturbations. Bulk sediment samples from Naredi (Ypresian), Harudi, and Fulra Limestone (Bartonian) formations are collected at 0.5-meter intervals or at lithological changes, whichever provided a finer resolution. Stable isotope analyses of organic carbon (δ¹³Corg) from the samples are performed. A pronounced negative δ¹³Corg excursion indicative of Eocene Thermal Maximum (ETM2) is recorded from the first fossil-bearing shale beds with the occurrence of larger benthic foraminifera (LBF). The Assilina Limestone Unit, the topmost fossiliferous bed of the Naredi Formation, records the Early Eocene Climatic Optimum (EECO). The top of Naredi and basal Harudi Formation has relatively lower δ¹³Corg values in the range of -24 to -26‰ (VPDB). δ¹³Corg values are relatively higher from the overlying coquina shell beds, and another negative excursion (~1.5‰ VPDB) has been observed concurrently to the Nummulites obtusus bed. This negative excursion is likely linked to the Middle Eocene Climatic Optimum (MECO) warming event. An abundance of other LBFs like Nummulites spectabilis and Nummulites vredenburgi have been noticed at this level. No major shift in the δ¹³Corg profile has been noticed in the overlying carbonate platform deposit of the Fulra Limestone Formation. The limestone is highly fossiliferous, dominated by diverse species of LBF such as Discocyclina, Assilina and Nummulites. This investigation indicates a correlation between sea-level rise and global warming events during the Eocene epoch in the paleo-equatorial Kutch Basin. Elevated temperatures and increased nutrient input during the EECO and MECO fostered the growth and diversification of LBF like Nummulites and Assilina. These warm, nutrient-rich conditions enabled LBF to achieve high diversity, abundance, larger sizes, and an expanded latitudinal range in the middle Eocene, demonstrating their adaptability to global warming. The observed negative δ¹³C excursion in the Naredi and Harudi formations is likely linked to sea-level fluctuations and changes in terrestrial carbon input to the marine environment. This study contributes to a better understanding of the complex interplay between climate change, sea-level fluctuations, and carbon cycling at the Kutch Basin during the Eocene.

How to cite: Chaudhuri, S., Mitra, A., and Claeys, P.: Paleoclimate and paleoenvironmental reconstructions of the Kutch Basin, India, during the Eocene: Insights from geochemical and micropaleontological signatures, EGU General Assembly 2025, Vienna, Austria, 27 Apr–2 May 2025, EGU25-690, https://doi.org/10.5194/egusphere-egu25-690, 2025.

This study examines the sedimentation of the calcified microbes in the late Miaolingian and Furongian microbialites in response to relative sea-level changes. The microbialites mainly bulge out as undifferentiated microbial boundstones observed as leiolitic bioherms in the upper reaches of four third-order depositional sequences, as recognized through the Gushan, Changshan and Fengshan formations. A flat-bedded biostromal thrombolite also developed in the lower Furongian strata, with a variety of poorly-preserved calcimicrobes. In geologic record, the variety of microbialites is widely attributed to the microbial mats of diverse size and bionetwork. The cyanobacteria are believed to predominate other mat-building microorganisms in mediating a sophisticated in-situ carbonate precipitation across the Miaolingian-Furongian boundary interval. A rapid shift in the microbialite microfabric from Miaolingian to Furongian is observed in the study area, which is marked by a substantial increase in the diversity and abundance of calcified microbes. The Miaolingian leiolitic bioherms hold abundant crust-forming structures in the mixed ground mass of micrite and microspar. With reduced occurrence, these possible microbial structures with uncertain biological affinity extend upward across Miaolingian-Furongian boundary. The Furongian leiolitic bioherms are unique as they developed in response to forced regression during third-order relative sea level fall. The well-preserved calcimicrobes recovered from these bioherms include Girvanella, Subtifloria, Epiphyton and Renalcis confirm the recovery phase of microbial carbonate abundance and the intense cyanobacteria calcification episode of Cambrian-Early Ordovician. The recovery of Epiphyton from the Furongian microbialites in the study area contradicts the possible decline in Epiphyton abundance at the end of Miaolingian series, as reported from other parts of the North China Platform. This study offers significant implications towards the sedimentation pattern in the shallow skeleton-deficient sea during Furongian before the metazoan radiation of the middle Ordovician.

How to cite: Latif, K., Riaz, M., and Xiao, E.: Late Miaolingian to Furongian Transition in Calcified Microbes from the North China Platform (Shanxi Province): Implications for Microbialite Development, EGU General Assembly 2025, Vienna, Austria, 27 Apr–2 May 2025, EGU25-937, https://doi.org/10.5194/egusphere-egu25-937, 2025.

EGU25-1398 | ECS | Posters on site | SSP4.1

An Analysis of Floridian Foraminifera in Past Hurricane Sediment. 

Savannah Watson, Christopher Dellapena, and Timothy Dellapenna

Foraminifera are benthic microorganisms that are used as environmental proxies due to their sensitivity to changes in their surrounding living conditions. This study focuses on shifts in species abundance and diversity of foraminiferal assemblages from western Florida. This research has explored how Floridian hurricane activity and other related factors, including resuspended sediment contaminants, influenced these shifts. Samples were taken from vibracore PR-30, a sediment core taken along a barrier island, a location particularly vulnerable to hurricane events. These factors have all been analyzed in a comprehensive survey of the foraminifera present and XRF scans of potential contaminants in the sediment. We hypothesized that foraminiferal assemblages would decline in abundance and diversity in response to these factors. The preliminary data from a few of the samples has proven to be consistent in diversity and abundance with small variations between samples. This could suggest a strong resilience and ability to recover in Flordian ecosystems or that this period of time in the sediment had not yet experienced a severe weather event, leaving little data. More data collection and analysis will be necessary to achieve a comprehensive understanding of the vibracore foraminifera and the effects of hurricanes on marine ecosystems. The results of this study will help create a strengthened understanding of ecosystem resilience and recovery. As climatic events intensify, a strong understanding of the resilience of marine ecosystems will be key to understanding the long lasting effects caused by severe weather events. 

How to cite: Watson, S., Dellapena, C., and Dellapenna, T.: An Analysis of Floridian Foraminifera in Past Hurricane Sediment., EGU General Assembly 2025, Vienna, Austria, 27 Apr–2 May 2025, EGU25-1398, https://doi.org/10.5194/egusphere-egu25-1398, 2025.

EGU25-2258 | ECS | Orals | SSP4.1

Global sea level controlled the deep low-salinity pool evolution in the Japan Sea since the last glacial period 

Zhi Dong, Xuefa Shi, Jianjun Zou, Shizhu Wang, Yanguang Liu, and Xinqing Zou

Understanding past changes in oceanic circulation and the corresponding heat, salt delivery variations are essential for assessing the climatic roles of ocean dynamic processes since the last glacial period. Unravelling salinity budget variation in the North Pacific and its controls is important to better understand the North Pacific Intermediate/Deep Water formation and associated climate impacts. The Tsushima Warm Current (TWC), the northernmost Kuroshio branch entering the semi-closed Japan Sea through the shallow strait, is regarded as a fundamental component for oceanographic changes in the Japan Sea.

To obtain a comprehensive history of the Japan Sea salinity budget, this study reconstructed the evolution history of the TWC inflow by compiling paleo-hydrographic records in the Japan Sea, including the radiolarian, diatom, coccolithophore, and planktonic foraminiferal assemblages. Following a persistent but weakened TWC inflow during Marine Isotope Stage 3, radiolarian assemblage data revealed that the TWC taxa disappeared since ~30 thousand years ago (ka). The synchronous onset of the low salinity anomaly event was in response to the cutoff of saline TWC inflow due to the rapid fall in global sea level at 30 ka. Extreme restriction of seawater exchange caused a persistent freshening of the glacial Japan Sea and formed a low-salinity water mass in the upper ocean. The compiled microfossil data confirmed that the Japan Sea accumulated excess freshwater during the glacial sea-level lowstands and the low-salinity pool extended downward to ~900 m depths. Coinciding with the peak of the low salinity anomaly event (minimum values of ∼20 psu), re-emerging TWC inflow after 19 ka reflected the reconnection of the open ocean to the Japan Sea. The persistent TWC inflow mainly drove the reduction in magnitude of the deep low-salinity pool during the last deglaciation. As a large and isolated freshwater sink for the glacial North Pacific, the deep low-salinity pool evolution could potentially have strong impacts on the North Pacific salinity budget and subsequent large-scale circulation.

How to cite: Dong, Z., Shi, X., Zou, J., Wang, S., Liu, Y., and Zou, X.: Global sea level controlled the deep low-salinity pool evolution in the Japan Sea since the last glacial period, EGU General Assembly 2025, Vienna, Austria, 27 Apr–2 May 2025, EGU25-2258, https://doi.org/10.5194/egusphere-egu25-2258, 2025.

In 2023, Plymouth City Council created the Plymouth Sound National Marine Park. While this declaration carries no conservation status, it is based on the European recognition of the area as a Special Area of Conservation in 2005 by Natural England. Marine Research Plymouth, in collaboration with Plymouth City Council, is promoting research into the development of Plymouth Sound since the Last Glacial Maximum. In 1988, two boreholes were drilled into the palaeo-channel of the River Tamar in the middle of Plymouth Sound. The buried channel, which had been located during a geophysical survey, recorded a succession of gravels, saltmarsh, inter-tidal mud flats and open marine sands: all of which contain diagnostic microfossil assemblages. A comparable succession has been recorded near Jersey in another series of marine boreholes in the base of which there is a peat that has been carbon dated as 8300 years b.p.

The Plymouth Sound and Jersey data record the Holocene rise in sea-level following the Last Glacial Maximum (LGM) (20,000–18,000 years b.p.) when the British-Irish ice sheet extended as far south as the north coast of Cornwall. At the LGM, sea level was 125–130 m below the present day and the coastline was almost at the edge of the Continental Shelf. The amelioration in climate and the Holocene sea-level rise generated the present sub-environments of Plymouth Sound and the other rias in South-West England. The present glacial/interglacial cycle is, however, only the latest of a series of climate cycles, numbering perhaps 20+ over the last 2 million years.

Before, and after, the LGM – when permafrost was extensive in South-West England – the caves of South Devon hosted both a significant megafauna and hominin remains and the combination of this terrestrial palaeontology and the marine (foraminiferal) record makes the area of great significance in understanding the Late Pleistocene and Holocene.

How to cite: Hart, M. and Smart, C.: Plymouth Sound Boreholes: a record of sea level rise in the Plymouth Sound National Marine Park (South-West England, U.K.) since the Last Glacial Maximum, EGU General Assembly 2025, Vienna, Austria, 27 Apr–2 May 2025, EGU25-2883, https://doi.org/10.5194/egusphere-egu25-2883, 2025.

The ocean productivity plays a crucial role in the ocean carbon cycle by influencing atmospheric CO2 levels. Although upper water column mixing associated with East Asian monsoon and terrestrial weathering input are the primary sources of surface water nutrients in the northern South China Sea (SCS), their contributions to paleo-productivity changes in the northern SCS during the late Pleistocene remains contentious. This study reconstructs paleo-productivity, East Asian monsoon dynamics, and terrestrial nutrient matter inputs over the past 350kyr, using multiple proxies, including the relative abundance of planktonic foraminifer Globigerina bulloides, sediment TOC content, TOC/TN ratio, the ratio of mixed-layer species to thermocline species, the thermal gradient of the upper water column and δ18Oresidual from International Ocean Discovery Program (IODP) Site U1505. The results reveal a distinct glacial-interglacial cyclicity with higher paleo-productivity attributed to increased terrestrial nutrient inputs and intensified East Asian winter monsoon during glacial lowstands. Furthermore, paleo-productivity exhibits a pronounced ~23 kyr cyclicity and is coupled with enhanced East Asian summer monsoon intensity during periods of low-latitude insolation maximum, suggesting a precession forcing on paleo-productivity via East Asian summer monsoon intensity and insolation maximum.

How to cite: Xu, Y., Li, B.-H., and Cui, Q.: Planktonic Foraminifera Reveal Late Pleistocene Paleo-Productivity Changes in the Northern South China Sea, EGU General Assembly 2025, Vienna, Austria, 27 Apr–2 May 2025, EGU25-2985, https://doi.org/10.5194/egusphere-egu25-2985, 2025.

Charophytes, a group of green algae, are one of the main components found in continental carbonate microfacies. The combination of the palaeontologic (taxonomic and taphonomic) study with the sedimentologic analysis has demonstrates that the charophyte microfacies are highly diverse, representing a broad diversity of environments. However, the integration of these palaeoecological data with geochemical proxies (stable isotopes and elementary geochemistry) has not been poorly explored

Sixty-three thin sections from different levels were obtained along the 50 m-thick carbonate section of La Pedrera de MeiàKonservat-Lagerstätte (Southern Pyrenees, Spain). Two thin sections were obtained from charophyte-rich beds, which is demonstrated as useful to study charophytes in thin sections. A combined sedimentological study and taphonomic analysis of the fossils was performed to make palaeoecological inferences. The results were latter integrated with the palaeoenvironmental proxies, mainly elementary geochemistry and δ18O previously described in the same facies with the objective of refining the palaeoenvironmental reconstruction of the lake.

According to the palaeoecologial analysis, two communities are distinguished. Monospecific Echinochara sp.-Charaxis spicatus meadows solely occurred in temporary lakes formed during the early stages of the infilling. These meadows were associated to high Al, K, Fe and Ti concentrations, which suggests that the infilling of these lakes was associated to meteoric waters. The δ18O indicates intermittent periods of evaporation, which favoured the formation of cyanobacterial crusts around charophyte remains and the formation of mud-cracks visible in thin sections under the microscope.

The second charophyte assemblage coincides with the last stage of the lake infilling and was characterized by having two distinct communities, freshwater and brackish. The freshwater community as composed of mixed meadows with Atopochara-Clavatoraxis, Clavatoroidae utricles -Clavatoraxis, and Ascidiella-Favargerella plants while the meadows of brackish settings were composed of Porocharacean – Charaxis sp. and Echinochara sp.-Charaxis spicatus plants. This latter flora was associated to miliolids and broken dasycladaleans, suggesting brackish conditions. The Sr/Ba ratios are high suggesting marine influence, but REE+Y concentrations, and δ18O values previously reported for these lacustrine carbonates suggest predominantly freshwater conditions. These geochemical results suggest the establishment of dominantly freshwater environments with rare brackish to marine influence. This interpretation aligns with the presence of distinct brackish and freshwater charophyte assemblages, along with organisms exhibiting marine affinities, such as miliolids and dasycladaleans.

The present work demonstrates the value of cross-validation between geochemical and palaeontological and palaeoecological data of lacustrine settings that contain benthic organisms, such as charophytes and ostracods. In addition, this work also provides insights to understand the palaeoenvironmental conditions necessary for the thriving of these organisms in fossil lakes.

How to cite: Perez-Cano, J., Gil-Delgado, A., Oms, O., and Mercedes-Martín, R.: Integrating Charophyte Paleoecology and Geochemical Proxies in the La Pedrera de Meià Konservat-Lagerstätte (Southern Pyrenees, Spain): A Tool for better understanding fossil lacustrine settings, EGU General Assembly 2025, Vienna, Austria, 27 Apr–2 May 2025, EGU25-4519, https://doi.org/10.5194/egusphere-egu25-4519, 2025.

The Late Pleistocene Szekou Formation in southern Taiwan preserves an exceptional fossil assemblage that includes marine vertebrates, mollusks, and microfossils, which offers a unique peek into the paleo-lagoon environment during a period of rapid tectonic uplift and sea-level fluctuations. Previous studies utilizing sedimentological and lithofacies analyses, fossil assemblages, and stable isotope analyses, suggests a semi-open to open lagoonal system surrounded by barrier islands that provide partial isolation from the open ocean. However, the stratigraphic complexities, inconsistent sampling, and limited dating methods have led to contradictory interpretations and coarse age estimates, with the stratigraphic age roughly constrained between 30,000 and 260,000 years.

Recently, the National Museum of Natural Science's discovery of numerous in-situ preserved cetacean fossils, combined with new core data from the Geological Survey and Mining Management Agency, has provided new chronological evidence to further clarify the paleoenvironmental conditions. We integrated GNSS-based sampling location and elevation data to ensure accuracy. Carbon isotope ratio (δ13C) range from -22‰ to -25‰, while organic carbon-to-total nitrogen ratios (C/N) range between 7 and 29, suggesting C3 terrestrial plants or marine dissolved organic carbon as primary organic matter source(s). Additionally, foraminiferal assemblages indicate that the lagoon's water depth (60 meter) exceeded earlier estimates of 20 meters.

By integrating stratigraphically continuous core materials, stable isotope ratios and foraminifera data, this study reconciles prior discrepancies in paleoenvironmental interpretations of the Szekou formation. It reconstructs the sequential evolution of the Szekou lagoon, from its initial formation to later stages of development, emphasizing the influence of rapid uplift and sea level fluctuations on lagoon-ocean connectivity. Ultimately, this research seeks to contribute to broader understanding of evolution of coastal lagoons during the Late Pleistocene in southern Taiwan.

How to cite: Chen, Z.-D., Yang, T.-R., and Löwemark, L.: Integrating Microfossil and Geochemical Evidence to Refine our understanding of the Paleoenvironmental Evolution of the Szekou Formation, EGU General Assembly 2025, Vienna, Austria, 27 Apr–2 May 2025, EGU25-4797, https://doi.org/10.5194/egusphere-egu25-4797, 2025.

Calcareous nannofossils are essential tools for reconstructing palaeoenvironmental conditions and understanding evolutionary trends in plankton organisms during the Late Cretaceous. This study presents a comparative morphometric analysis of the Aspidolithus enormis - parcus group from the Lower Campanian and distant sections of the deep-water Rhenodanubian Supergroup (Loibichl, Eastern Alps, Austria) and the pelagic Smoky Hill Member of the Niobrara Formation (Western Interior Seaway, Kansas, USA). The aim is to refine our understanding of the evolutionary trends within this group, particularly in response to changing palaeoceanographic and climatic conditions.

Morphometric analysis of Aspidolithus taxa in both sections reveals that A. enormis (“small A. parcus”) can be clearly distinguished from A. parcus based on the total length of the coccolith, with a threshold of approximately 8.5 µm. A. enormis consistently exhibits a smaller coccolith size (< 8.5 µm), while A. parcus is characterized by a larger size (> 8.5 µm). However, despite clear size differences between A. enormis and A. parcus, statistical differentiation between the subspecies of A. parcus (A. parcus parcus, A. parcus expansus, and A. parcus constrictus) based on the ratio of central area width to external ring width (b/a) was not observed in either of the studied sections.

Interestingly, both the sections exhibit a similar pattern in which size variation in the b/a ratio correlates with sea surface temperature, with larger central areas associated with higher temperatures.

These findings reinforce the hypothesis that the Aspidolithus group exhibits regional consistency in response to environmental fluctuations, highlighting the applicability of nannofossil morphometry for palaeoenvironmental reconstructions and stratigraphic correlation.

How to cite: Granero Ordóñez, P., Wagreich, M., and Wierzbicki, A.: Morphometric and Palaeoenvironmental Analysis of Aspidolithus (Calcareous Nannofossils): Rhenodanubian Flysch Zone (Eastern Alps, Austria) vs. Niobrara Formation (Kansas, USA), EGU General Assembly 2025, Vienna, Austria, 27 Apr–2 May 2025, EGU25-5844, https://doi.org/10.5194/egusphere-egu25-5844, 2025.

EGU25-6742 | Orals | SSP4.1

A novel method for improved estimates of absolute microfossil abundance: A big step towards a deep-time terrestrial productivity proxy 

Chris Mays, Michael Hren, Marcos Amores, Richard Tyson, and Anthony Mays

A holy grail of both palaeoecology and biogeochemistry has been an accurate proxy of past biological productivity. Such a metric would offer a way to identify and quantify Earth’s deep-time ecosystem and carbon cycle function (and dysfunction). Plants have been the principal contributors to the terrestrial carbon cycle for hundreds of millions of years. We hypothesise that their absolute abundances in the fossil record can indicate ecosystem-mediated changes in carbon sequestration rates (='terrestrial net ecosystem productivity').

Many key parameters of biological systems—e.g., productivity, population sizes, biomass—are best expressed as absolute values. Unlike proportional data (e.g., percentages), absolute values provide standardized metrics for comparing the functioning of organisms, species and ecosystems across time and space. Since it is generally impractical to count entire populations, statistically significant abundance estimates require an accurate and precise sampling method. These typically entail more data collection effort (or time) than proportional data.

Firstly, we present a new method for precise estimates of microfossil concentrations: the ‘field-of-view subsampling’ (FOVS) method. It applies ecological quadrat sampling principles to microfossil samples spiked with exotic markers (e.g., Lycopodium spores). We tested the new FOVS method against the traditional ‘linear method’ with two case studies: 1, computer simulations; and 2, observational data of terrestrial organic microfossils from the end-Permian event (EPE; c. 252 Ma) records of eastern Australia. Four output parameters were measured: 1, absolute abundance (measured as specimens per unit sample size [e.g., sediment mass]); 2, accuracy (measured as variance from an idealised data set); 3, precision (measured as statistical error); and 4, data collection effort (measured as time). The FOVS method consistently provided estimates with greater accuracy, and higher precision and/or reduced effort under almost all conditions.

Secondly, we assessed the potential application of this method (and others) for gauging palaeoproductivity. As a result of this review, we: 1, identified the factors that influence the preservation of land-derived organic carbon in the fossil record; 2, adapted and applied a framework of modern ecosystem productivity to prehistoric settings by incorporating post-burial impacts; and 3, explored the conditions under which terrestrial organic microfossil concentrations may provide valid estimates of relative changes in palaeoproductivity.

Lastly, we demonstrate how refined estimates of deep-time terrestrial productivity may be achieved in the future. This would lead to more precise land carbon cycle models since the emergence of large land plants >360 million years ago.

Although we have explored a narrow application of the new method to palaeoproductivity, the range of potential applications is far broader. In the microfossil realm, the method can be immediately applied to any study using exotic markers (e.g., Lycopodium spores) for absolute abundances. Given its demonstrable increased efficiency, we recommend the FOVS method as the new standard for such absolute abundance estimates.

How to cite: Mays, C., Hren, M., Amores, M., Tyson, R., and Mays, A.: A novel method for improved estimates of absolute microfossil abundance: A big step towards a deep-time terrestrial productivity proxy, EGU General Assembly 2025, Vienna, Austria, 27 Apr–2 May 2025, EGU25-6742, https://doi.org/10.5194/egusphere-egu25-6742, 2025.

EGU25-6986 | ECS | Posters on site | SSP4.1

Abyssal record of Eocene warming in the Tasman Sea 

Irene Peñalver Clavel, Elisa Laita, Edoardo Dallanave, Rupert Sutherland, Thomas Westerhold, Gerald R. Dickens, Blanca Bauluz, and Laia Alegret

The Middle Eocene Climatic Optimum (MECO) was a global warming period that interrupted the gradual cooling trend of the middle-late Eocene at around 40 Ma. It is characterized by high temperatures, increased pCO2 levels in the atmosphere, and marine carbonate dissolution. Its gradual onset, rapid termination, long duration (500 kyr), and the lack of a global negative carbon isotope excursion clearly differentiate the MECO from other Eocene hyperthermals, making its study of utmost interest to understand the effects of warming on the carbon cycle. Herein, we present the first record of the benthic foraminiferal response to the MECO at abyssal depths, and we reconstruct the paleoenvironmental impact. The Eocene sediment samples from International Ocean Discovery Program Site U1511 in the Tasman Abyssal Plain (Southwest Pacific Ocean) were deposited below the CCD and contain well-preserved agglutinated benthic foraminifera. The foraminiferal assemblages show low diversity values across the whole study interval. The MECO is characterized by the dominance of the opportunistic species Spiroplectammina spectabilis, which points to environmental instability and changes in food availability, likely linked to water column stratification associated with warming. Mineralogical analyses show an increase in smectite content during the MECO, suggesting changes in deep-water sources. These findings are consistent with previously documented changes in ocean circulation and nutrient dynamics in the region during the MECO.

How to cite: Peñalver Clavel, I., Laita, E., Dallanave, E., Sutherland, R., Westerhold, T., Dickens, G. R., Bauluz, B., and Alegret, L.: Abyssal record of Eocene warming in the Tasman Sea, EGU General Assembly 2025, Vienna, Austria, 27 Apr–2 May 2025, EGU25-6986, https://doi.org/10.5194/egusphere-egu25-6986, 2025.

EGU25-7355 | ECS | Orals | SSP4.1

A comparative study of lacustrine ostracods and mollusks of the Dinarides and Serbian Lake Systems 

Katja Mužek, Oleg Mandic, Valentina Hajek-Tadesse, Nevena Andrić-Tomašević, and Ljupko Rundić

Intramontane basins serve as exceptional archives of long-term climate, depositional and environmental changes. Additionally, these basins are biodiversity hotspots, harboring freshwater lacustrine fauna, making them invaluable for studying the interplay between paleoenvironmental dynamics and evolutionary processes.

During Miocene, a multitude of intramontane basins emerged within the Dinarides mountain range. The basins were filled with a series of long-lived lakes, hosting endemic lacustrine fauna significant for understanding Neogene paleoenvironments and paleogeography. Two freshwater systems, representing distinct paleobiogeographic entities, occupied areas corresponding to present-day Croatia and Bosnia and Herzegovina (Dinarides Lake System, DLS) and Serbia, Kosovo, and North Macedonia (Serbian Lake System, SLS). Faunal samples were collected from various localities within the DLS and a single locality in the SLS. Within the DLS, key sites include the Kupres, Livno, and Tomislavgrad basins in Bosnia and Herzegovina, whereas the samples retrieved from the SLS belong to the Valjevo-Mionica Basin in western Serbia.

This research aims to comprehensively revise and provide detailed taxonomic descriptions of the freshwater benthic assemblages from both the DLS and SLS. Comparative analysis of ostracod and mollusk compositions has been used to investigate evolutionary connections between species in these intramontane lacustrine systems. The ostracod fauna is of particular interest due to the absence of in-depth descriptions and detailed figures. In contrast, mollusk assemblages have been thoroughly revised and described in previous publications. Correlation within the DLS is based on ostracod and mollusk samples from the Table section (Livno Basin), the Kongora section (Tomislavgrad Basin), and the Fatelj section (Kupres Basin). A taxonomic analysis was conducted using samples from the Ribnica section of the Valjevo-Mionica Basin to compare this fauna with that of the SLS.

The future direction of this research involves expanding comparative taxonomic analyses with other Neogene long-lived lakes, aiming to provide deeper insights into evolutionary patterns and further our understanding of faunal developments.

How to cite: Mužek, K., Mandic, O., Hajek-Tadesse, V., Andrić-Tomašević, N., and Rundić, L.: A comparative study of lacustrine ostracods and mollusks of the Dinarides and Serbian Lake Systems, EGU General Assembly 2025, Vienna, Austria, 27 Apr–2 May 2025, EGU25-7355, https://doi.org/10.5194/egusphere-egu25-7355, 2025.

EGU25-8064 | ECS | Posters on site | SSP4.1

Micropaleontological insight into the Badenian Sea from the North Croatian Basin 

Monika Milošević, Viktória Baranyi, Vlasta Ćosović, Valentina Hajek-Tadesse, Ines Galović, and Mirjana Miknić

During the Badenian (Langhian-early Serravallian), a diverse biocenosis inhabited the warm marine environments of the epicontinental Central Paratethys Sea. The investigated site in the southeastern part of the Pannonian Basin (North Croatian Basin) provides a unique insight into the palaeoenvironmental evolution of that part of the sea, including changes in water depth, salinity, oxygen, and nutrient levels. A multi-micropaleontological study integrated benthic and planktonic foraminifera, ostracods, calcareous nannoplankton, palynological assemblages, and diversity proxies. This approach encompasses biostratigraphic dating and detailed paleoenvironmental reconstruction.

The studied sediments described a transition from an oligotrophic deeper marine environment, frequently influenced by terrigenous input  (river discharge) to shallow marine habitats. A short-lived eutrophication event, likely triggered by high nutrient activity and transport into the marine basin, occurred slightly above the volcanoclastic layer, correlative to dated tuff in the vicinity (14.4 ± 0.03 Ma, Marković et al., 2021). Following the overall shallowing trend, the environment stabilized into a shallow, oligotrophic state.

This research contributes to a refined understanding of the Miocene environmental history of the southern Pannonian Basin, adding more pieces to  the puzzle called the evolutionary history of the  Central Paratethys. By integrated multiple proxy groups, we aimed to elucidate the timing and character of key environmental changes within this region.


Marković, F.; Kuiper, K.; Ćorić, S.; Hajek-Tadesse, V.; Kučenjak, M.H.; Bakrač, K.; Pezelj, Đ. & Kovačić, M. (2021): Middle Miocene marine flooding: New 40Ar/39Ar age constraints with integrated biostratigraphy on tuffs from the North Croatian Basin. Geologia Croatica, 74(3), 237–252. 


ACKNOWLEDGMENTS

This research was conducted in the scope of the internal research project „RAMPA - Development of Miocene paleoenvironments in Croatia and their connection with global events“at the Croatian Geological Survey, funded by the National Recovery and Resilience Plan 2021–2026 of the European Union – NextGenerationEU, and monitored by the Ministry of Science and Education of the Republic of Croatia.

Partly this research was also supported by the internal research project WEGETA – Weathering and vegetation intertwined-multiproxy approach to understand the fate of terrestrial ecosystems in times of global climate change“ at the Croatian Geological Survey, funded by the National Recovery and Resilience Plan 2021–2026 of the European Union – NextGenerationEU, and monitored by the Ministry of Science and Education of the Republic of Croatia and „PYROSKA – Miocene syn-rift evolution of the North Croatian Basin (Carpathian-Pannonian Region): a multi-proxy approach, correlation and integration of sedimentary and volcanic record“ at the Croatian Geological Survey, funded by Croatian Science Foundation, Installation Research projects (UIO-2019-04-7761).


How to cite: Milošević, M., Baranyi, V., Ćosović, V., Hajek-Tadesse, V., Galović, I., and Miknić, M.: Micropaleontological insight into the Badenian Sea from the North Croatian Basin, EGU General Assembly 2025, Vienna, Austria, 27 Apr–2 May 2025, EGU25-8064, https://doi.org/10.5194/egusphere-egu25-8064, 2025.

EGU25-8192 | ECS | Orals | SSP4.1

Deciphering continental and oceanic climate signals in early Pliocene sediments from the Iberian Margin  

Laura Martín García, Francisco J. Jiménez-Espejo, Diana Ochoa, Timothy Helbert, William Clark, and José-Abel Flores

The Iberian Margin, including the Portugal Shelf, is a distinctive area in our planet, characterized by a narrow continental shelf where detrital sediments transported by rivers record continental climate patterns. Ocean dynamics in this region are strongly influenced by the Mediterranean Outflow Water (MOW), and the North Atlantic subtropical gyre, both key components of the Atlantic Meridional Overturning Circulation (AMOC) and essential for understanding climate dynamics.

Past research has demonstrated that sedimentary processes from this region are driven by astronomically-forced climatic mechanisms. This study assesses the interaction of continental and oceanic processes along the Iberian Margin during the early Pliocene, an interval of significant palaeoceanographic interest marked by the reestablishment of the MOW after the Messinian Salinity Crisis.

For this, a high-resolution study of calcareous nannofossils assemblages and X-ray fluorescence (XRF) analyses were carried out on sedimentary material retrieved from the 397 IODP expedition (site 1587, southwestern Iberian Margin). Calcareous nannofossils assemblages reveal changes in paleoenvironmental parameters such as productivity and sea surface temperatures, while XRF data indicate changes in continental input.

Based on spectral and wavelet analyses of the XRF data, we identify a robust astronomical signal of precessional origin in the sediments. Moreover, the abundance of Reticulofenestra minuta and Reticulofenestra pseudoumbilicus larger than 7 µm correlates with eccentricity-driven orbital changes. In contrast, Reticulofenestra producta, R. haqii y R. minutula exhibit declining abundance at the base of the Pliocene, suggesting modulation by oceanic mechanisms independent of astronomical forcing. These findings thus evidence the role of orbital-driven climate processes (eccentricity and precession) shaping the continental input. Furthermore, the calcareous nannofossil association reflects distinct ocean dynamics associated to the North Atlantic and processes that determine variability in productivity in the region.

How to cite: Martín García, L., Jiménez-Espejo, F. J., Ochoa, D., Helbert, T., Clark, W., and Flores, J.-A.: Deciphering continental and oceanic climate signals in early Pliocene sediments from the Iberian Margin , EGU General Assembly 2025, Vienna, Austria, 27 Apr–2 May 2025, EGU25-8192, https://doi.org/10.5194/egusphere-egu25-8192, 2025.

EGU25-8200 | ECS | Orals | SSP4.1

Coccolithophore paleoproductivity variability as a proxy of ocean surface dynamics and climate variability in the Gulf of Cadiz during the Mid-Brunhes Event (MIS 12-11) 

María González-Martín, Andrés Salvador Rigual-Hernández, Alba González-Lanchas, Bárbara Balestra, and José Abel Flores

This study focuses on high-resolution analyses of coccolithophore assemblages from a sediment core retrieved at IODP Site U1386, located in the Gulf of Cádiz. This area plays a crucial role in studying the Atlantic-Mediterranean water exchange. Our samples span the Termination V period (MIS 12-11, 434-404 kyr) that roughly corresponds with Mid-Brunhes Event, a major global climatic shift in glacial-interglacial cycles during the Quaternary. The main objective is to reconstruct coccolithophore paleoproductivity variations and use it as an indicator of surface ocean dynamics and environmental conditions during this critical interval of global environmental change.

Our results reveal higher paleoproductivity during the interglacial period (MIS 11), with an average of 8.33 × 10⁹ coccoliths/g, compared to lower paleoproductivity during the glacial period (MIS 12), with an average of 4.23 × 10⁹ coccoliths/g. This difference is also reflected in nannoplankton assemblage composition: with cold-water species such as Coccolithus pelagicus subsp. pelagicus dominating during the glacial, and an increase in warm-water species during the interglacial. These patterns are consistent with a cooling in sea surface temperatures (SST) during the glacial period and warming during the interglacial, and with benthic δ¹⁸O values, which were higher in the glacial and lower in the interglacial, reflecting an increase in Northern Hemisphere ice cover during the cold period. Our data, along with previous studies, suggest that MIS 12 in the study region was characterized by severe climatic conditions, with intensified circulation of subpolar surface water masses into the study region and a potential southward migration of the polar front. In contrast, during MIS 11, the climate was warmer, with intensified influence from subtropical surface water masses. Additionally, we observe a significant decrease in paleoproductivity around 430 kyr, coincident with severe SST cooling and peaks in ice-rafted debris (IRD), which could correlate with Heinrich type Event 4 (Ht-4), previously observed in the Iberian margin.

How to cite: González-Martín, M., Rigual-Hernández, A. S., González-Lanchas, A., Balestra, B., and Flores, J. A.: Coccolithophore paleoproductivity variability as a proxy of ocean surface dynamics and climate variability in the Gulf of Cadiz during the Mid-Brunhes Event (MIS 12-11), EGU General Assembly 2025, Vienna, Austria, 27 Apr–2 May 2025, EGU25-8200, https://doi.org/10.5194/egusphere-egu25-8200, 2025.

EGU25-8820 | Orals | SSP4.1

A Miocene Climatic Optimum Tropical Barrier Reef: Combining biomarker and facies analysis to understand conditions of reef survival.  

Benjamin Petrick, Lars Reuning, Lorenz Schwark, Or Bialik, and Miriam Pfeiffer

One of the key questions is how and if large complex reef systems can survive under future climate change scenarios. It is known that during the Middle Miocene, there were extensive reefs across the Indo-Pacific. Since the Middle Miocene was a time of global temperatures and CO2 similar to end-of-century predictions, this is an ideal time interval to study. However, there has been a lack of multi-million-year proxy records from these ecosystems for the Miocene. For the first time, we present an SST record from a site (IODP U1464) near the large Miocene Barrier Reef on the NW Shelf of Australia. In this study, we use biomarkers to reconstruct oceanic conditions and look at the changing environments from a carbonate facies perspective. Our research shows that the reef system might have initiated at temperatures that were close to modern summer values in the region. However, during the height of the Miocene Climatic Optimum, when summer temperatures reached 34°C, the reef system was at its maximum extent. Arid conditions, heat-tolerant corals, and a low local subsidence rate allowed the barrier reef to tolerate the hot summer conditions. When the sea level dropped, and sabkhas covered the site during the Middle Miocene climate transition, cooler SSTs allowed for faster reef growth. However, starting at 12 Ma, higher summer SSTs and increased local subsidence led to the end of the barrier system and the continuous collapse of the reef between 11-7 Ma. This suggests that a reduction in stressing conditions is critical for reef survival in a warmer world. Predictions for rapidly changing oceanic conditions coupled with sea-level rise indicate that future climate change will harm modern large complex reefs, much like during the Late Miocene.

How to cite: Petrick, B., Reuning, L., Schwark, L., Bialik, O., and Pfeiffer, M.: A Miocene Climatic Optimum Tropical Barrier Reef: Combining biomarker and facies analysis to understand conditions of reef survival. , EGU General Assembly 2025, Vienna, Austria, 27 Apr–2 May 2025, EGU25-8820, https://doi.org/10.5194/egusphere-egu25-8820, 2025.

EGU25-8949 | Orals | SSP4.1

Contrasting changes in phytoplankton assemblage and size to environmental shifts in the Mediterranean Sea using novel deep-learning protocols 

Camille Godbillot, Baptiste Pesenti, Karine Leblanc, Luc Beaufort, Cristele Chevalier, Julien Di Pane, Xavier Durrieu de Madron, and Thibault de Garidel-Thoron

Understanding the spatial and temporal changes in phytoplankton assemblages is essential in the context of climate change, due to their impact on carbon burial and the marine food web. Here we investigate the effects of environmental shifts in the Mediterranean Sea on phytoplankton taxonomy and size structure using an AI-based approach. We analyzed two sediment trap series from the northwestern Mediterranean Sea between 2010 and 2018: one in the oligotrophic Ligurian Sea and the other in the Gulf of Lion, a region where deep convection occurs regularly in the winter. We used novel deep-learning protocols for image analysis to generate data for phytoplankton particle fluxes, size distributions, and relative assemblages, with a focus on coccolithophores and diatoms. This automated approach enabled the rapid, high-throughput processing of microscope images, producing a standardized dataset across both time series. Our results show a general decline of phytoplankton fluxes towards the seafloor, mirroring the decrease in vertical mixing that affects the water column. Both sites show a shift towards phytoplankton species associated with stratified and nutrient-depleted conditions, but with contrasting patterns despite their proximity: In the Ligurian Sea, deep-dwelling coccolithophore species become increasingly dominant, while in the Gulf of Lion, summer-associated siliceous species, including large diatoms and silicoflagellates, show an increase. These contrasting trends likely result from differences in nutrient inputs and surface pH changes between the sites. We find that the increasing dominance of smaller phytoplankton in the Ligurian Sea leads to a reduction in carbon burial efficiency, while in the Gulf of Lion, the enhanced contribution of larger diatoms may sustain relatively higher export and burial rates in the future. These findings highlight the heterogeneous responses of phytoplankton communities to the increasing surface temperatures and stratification in the Mediterranean Sea, and their contrasting impact on carbon burial. 

How to cite: Godbillot, C., Pesenti, B., Leblanc, K., Beaufort, L., Chevalier, C., Di Pane, J., Durrieu de Madron, X., and de Garidel-Thoron, T.: Contrasting changes in phytoplankton assemblage and size to environmental shifts in the Mediterranean Sea using novel deep-learning protocols, EGU General Assembly 2025, Vienna, Austria, 27 Apr–2 May 2025, EGU25-8949, https://doi.org/10.5194/egusphere-egu25-8949, 2025.

This study examines the paleoenvironmental evolution of the Qom Formation using biostratigraphy and petrography within a sequence stratigraphic framework to figure out spatial and temporal distribution of the depositional characteristics. The upper part of the Qom Formation (members e and f) was deposited in the northern branch of the Tethyan Seaway in the Central Iran Basin, and investigated along the Dochah and Jujukzar sections. Calcareous nannofossils and large benthic foraminifera indicate the succession was deposited during the early to middle Burdigalian in the Central Iran Basin. According to nannofossil assemblages two biozones NN2 (Discoaster Druggii zone) and lower part of NN4 (Sphenolithus heteromorphus zone) of Burdigalian age are identified in both members of the Qom succession. With respect to nannofossil zones, a hiatus (NN3, ca. 19-18 Ma) is recognized, related to erosion. Based on large benthic foraminifera, SBZ25 biozone including Borelis melo curdica (Burdigalian) is recognized in the member f of the Qom Formation. Based on petrography, ten depositional facies were deposited in four facies belts including lagoon, shoal, mid ramp, and basin, propagated in a ramp-type platform in the Qom Basin. Regarding stacking pattern of facies, three 3rd-orderdepositional sequences were formed at the time, driven by relative sea-level changes. Regarding the sequence stratigraphic context, the upper part of the member e and member f are stratigraphically equivalent as evident by biostratigraphic and sedimentary evidence, which has not been investigated in previous studies. This study underscores and evaluates the sequence stratigraphy and sedimentary model of the Qom Basin in a high-resolution scale.

Key words: Qom Formation, Biostratigraphy, Sequence stratigraphy, Tethyan Seaway

How to cite: Sharifi-Yazdi, M., Ćorić, S., and Wagreich, M.: Biostratigraphy and depositional characteristics of the northern part of the Tethyan Seaway (Burdigalian, Central Iran) in a sequence stratigraphic framework, EGU General Assembly 2025, Vienna, Austria, 27 Apr–2 May 2025, EGU25-9166, https://doi.org/10.5194/egusphere-egu25-9166, 2025.

EGU25-9838 | Orals | SSP4.1

Calcareous nannoplankton response to Oceanic Anoxic Event 2 (Cenomanian-Turonian, Late Cretaceous) 

Cinzia Bottini, Edna Tungo, Elisabetta Erba, and Gerson Fauth

The Cenomanian/Turonian boundary interval was marked by an extreme environmental change coinciding with Oceanic Anoxic Event 2 (OAE 2; ~94 Ma) characterized by global warming, accelerated hydrological cycle, enhanced production and bu­rial of organic matter and high concentrations of CO2. The causes are linked to Large Igneous Provinces (LIPs) activity, which released vast amounts of greenhouse gases into the ocean-atmosphere system as well as toxic metals responsible of altered chemistry and structure of the oceans. Also, the OAE 2 experienced a significant brief period of cooling (ca. 40 kyr) occurred known as the Plenus Cold Event (PCE), firstly identified and described in the Eastbourne section (Sussex, England). In its complex, the OAE 2 represents a key case study to understand the dynamics of oceanic process as well as the response of biota to climate change.

In this work we present data on calcareous nannofossils from the Eastbourne section, which is a reference section for OAE 2, with the general aim to implement our understanding of the effects of OAE 2 perturbation on calcareous nannoplankton. Specifically, 44 samples were analysed for morphometry of Eprolithus floralis and assemblage composition. For each sample nannofossil temperature and nutrient indices were also calculated.

We selected Eprolithus floralis because is a nannolith taxon, heavily calcified and with a reconstructed preference of cooler waters. Previous morphometric investigations focused on coccolith taxa (i.e. Biscutum constans, Discorhabdus ignotus, Zeugrhabdotus erectus and Watznaueria barnesiae) predominantly associated with fertility fluctuations in surface waters.

Results show that E. floralis underwent significant size variations across OAE 2 with a decrease in the total diameter during OAE 2 of ca. 0.5 μm. Minimum sizes are reached in the latest part of OAE 2 (chemostratigraphic peak B), with specimens ca. 1 μm smaller than in pre- and post-OAE 2 intervals.

Two distinct E. floralis morphotypes were separated, one with spiky and one with rounded elements. The latter morphogroup, more abundant during OAE 2, has a relatively smaller (ca. 0.2 μm) total average diameter.

The diaphragm diameter also shows size changes but with opposite trends, thus specimens have larger diameter during OAE 2 except for peak B which is characterized by the smallest values.

Our findings indicate that morphometric fluctuations are unrelated to abundance. Moreover, although E. floralis is as a cold-water species, its abiundance is unrelated to temperature fluctuations across OAE 2, including the PCE.

The main size patterns of E. floralis are partially similar to those of B. constans, D. ignotus and Z. erectus possibly suggesting that common environmental stressors affected all these species. We speculate that also E. floralis used the strategy to reduce the average size to cope with excess CO2 and/or toxic metals. Moreover, we do see a change in the dominance of the morphotypes probably suggesting that those with rounded shape and smaller size were better adaptable to/ less stressed by the OAE 2 perturbation.

How to cite: Bottini, C., Tungo, E., Erba, E., and Fauth, G.: Calcareous nannoplankton response to Oceanic Anoxic Event 2 (Cenomanian-Turonian, Late Cretaceous), EGU General Assembly 2025, Vienna, Austria, 27 Apr–2 May 2025, EGU25-9838, https://doi.org/10.5194/egusphere-egu25-9838, 2025.

Foraminifera's diverse reproductive strategies contribute greatly to their capacity for evolutionary change and their remarkable success throughout Earth's history. This includes sexual reproduction (where genetic material from two individuals is combined), asexual reproduction (where offspring are produced from a single parent) and multiple fission events, giving them the ability to evolve and thrive over time, and the potential to adapt to new environments, develop new traits and diversify into new species. Previous laboratory studies have consistently shown that foraminifera can each produce a large number of offspring from a single reproductive event, but finding foraminifera during their reproductive phase in nature is a rarity.


Here we report on symbiont-bearing foraminifera of the genus Peneroplis in a reproductive state from two natural sites in the Pacific Ocean that are in the process of releasing their juveniles. Findings of adult Peneroplis parent shells with pre-emergent juveniles contained within the test provided a rare opportunity to examine the range of morphologic variability within a single brood of offspring resulting. The adult specimens were complete and contained numerous calcified megalospheric juveniles. We examined the parental test and the megalospheric juveniles by high-resolution Scanning Electron Microscopy to document the quantity, morphology, and size range of the juveniles and to provide novel insight into the reproductive biology and ontogenetic constraints of P. pertusus. The juveniles are non-uniform and highly heterogenous, varying in size, ornamentation, position of the flexostyle, and extent of test deformations. We also report on morphological features in normal and deformed juvenile tests as displayed in the proloculus and the flexostyle. To test whether the juvenile test deformations are expressed in adults, more than 100 specimens of P. pertusus were examined. Previous studies suggested that juvenile test deformities can be carried through into the adult. Our study shows, however, that test abnormalities among juveniles are not expressed in adults of natural population, indicating that they are either transitioning to normal growth forms or are not viable. The small juveniles ultimately become the proloculus and associated juvenile chamber(s) of adults, features that are used in the taxonomy of some larger foraminifera. Morphological features of juveniles and prolocular size across contemporary populations and among populations through time may be used to infer ecological and paleoecological conditions. Results of this study inform such investigations.

How to cite: Langer, M. R., Trubin, I., Tian, S. Y., and Goldstein, S. T.: Size range, morphotypes, and test deformations in juvenile megalospheres of the symbiont-bearing foraminifer Peneroplis: Windows on evolutionary processes and past environments, EGU General Assembly 2025, Vienna, Austria, 27 Apr–2 May 2025, EGU25-9929, https://doi.org/10.5194/egusphere-egu25-9929, 2025.

EGU25-10620 | ECS | Orals | SSP4.1

South eastern Indian Ocean (ODP Site 752) paleoceanographic conditions during the Middle to Late Miocene based on calcareous nannofossils assemblages 

Xabier Puentes Jorge, Arianna V. Del Gaudio, Werner E. Piller, David De Vleeschower, Tamara Hechemer, Jing Lyu, and Gerald Auer

The Middle to Late Miocene represents an important time interval on a global scale. Due to continental reorganisation in the Indian Ocean (IO) a near-modern monsoonal wind system was established, a series of climatic changes linked to the Middle Miocene Climatic Transition occurred and the subsequent shift of the region dominated by the Westerlies to the north took place during the Late Miocene. However, how these processes and forcing mechanisms interact and affect the surface ocean dynamics in the southern subtropical IO is poorly understood. In this regard, Ocean Drilling Program (ODP) Site 752, located on the west flank of Broken Ridge (30° 53.475ˈS/93° 34.652ˈE), represents a key location to study how the above-mentioned processes may have affected the surface currents in the eastern sector of the subtropical IO during the Middle to Late Miocene.

In order to ascertain changes in the surface ocean conditions and their connection to surface currents dynamics between 7.31 and 16.06 Ma, we evaluated the overall changes in the calcareous nannofossil assemblage at Site 752. For this purpose, we performed a quantitative study on 122 calcareous nannofossil samples (with a temporal resolution of ~60 kyr) and performed statistical analyses to observe variations in the assemblage composition. The UPGMA (Bray-Curtis) clustering ordination analyses revealed a total of 5 clusters (Cluster 1-5), defined at a cut-off distance of ~0.76 and a cophenetic correlation coefficient of 0.75. Additionally, Cluster 5 was divided into two sub-clusters (Cluster 5a-5b), at a cut-off distance of ~0.77.

Cluster 1 indicates high nutrient availability due to the abundance of Reticulofenestra minuta. Cluster 2 also indicates high nutrient supply in the region, as per the high abundance of R. minuta, differing from Cluster 1 by the presence of Calcidiscus leptoporus and Coccolithus pelagicus, both indicative of cold surface waters with a deep mixed layer. Cluster 3 is characterised by the concomitant presence of species typical of warm/cold stratified/mixed regions, such as Discoaster spp., C. pelagicus and R. pseudoumbilicus. Cluster 4 is dominated by Reticulofenestra haqii and Reticulofenestra producta, which thrive in warm and oligo/mesotrophic conditions. Reticulofenestra producta is also abundant in Cluster 5a. However, the high abundances of Reticulofenestra perplexa and R. pseudoumbilicus indicate more moderate nutrient conditions with relatively cold surface waters compared to Clusters 1 to 4. Lastly, Cluster 5b is characterised by an increase in the abundance of R. pseudoumbilicus and the common presence of R. haqii, indicating warmer surface water conditions compared with Cluster 5a.

Temporal progression from Cluster 4 to Cluster 2 over our study interval reflects a distinct shift to higher nutrient palaeoceanographic conditions at the Broken Ridge between 15–8 Ma. This change in surface water nutrient availability can be linked to an invigoration of the Antarctic Circumpolar Current and the Southern Indian Ocean Current at ODP Site 752. These shifts indicate the impact of the Middle to Late Miocene northward migration of the Westerlies (from 40 to 30º S) on mid-latitude paleoceanographic conditions and confirm the proposed shift in global nutrient cycling around 11 Ma ago.

How to cite: Puentes Jorge, X., V. Del Gaudio, A., E. Piller, W., De Vleeschower, D., Hechemer, T., Lyu, J., and Auer, G.: South eastern Indian Ocean (ODP Site 752) paleoceanographic conditions during the Middle to Late Miocene based on calcareous nannofossils assemblages, EGU General Assembly 2025, Vienna, Austria, 27 Apr–2 May 2025, EGU25-10620, https://doi.org/10.5194/egusphere-egu25-10620, 2025.

EGU25-10717 | Orals | SSP4.1

Coccolithophore calcite production from nannofossil records  

Alba González-Lanchas, Baumann Karl-Heinz, Stoll Heather M., Flores José-Abel, Fuertes Miguel Angel, and Rickaby Rosalind E.M.

The production, export and accumulation of calcite (CaCO3) are key components of the marine carbon system and the global carbon cycle. Coccolithophores are responsible for ~20-80% of the open ocean CaCO3 production. Over geological timescales, their activity significantly influences the global carbon cycle, impacting long-term climate evolution. Despite the critical importance of this group, an integrated understanding of the environmental factors that control their CaCO3 production remains incomplete. This uncertainty arises from difficulties extrapolating laboratory-based findings to natural settings and challenges interpreting fossil records. We present new profiles of the distribution of key coccolithophore species and groups in the modern Atlantic Ocean alongside detailed morphometric analyses at the individual coccolith level. Applying a suite of advanced micropaleontological and morphometric techniques on well-preserved surface sediment materials, we explore different pathways for reconstructing coccolithophore physiology and CaCO3 production from nannofossil records. This research provides new insights into the dominant environmental controls over coccolithophore CaCO3 production in response to natural oceanic forcing. Relationships between coccolithophore assemblage structure, group-specific physiology, morphometric variability and CaCO3 production with the environment contribute to the understanding of the role of coccolithophores in the marine carbon cycle and provide a basis for a novel application of nannofossil assemblages for the reconstruction of past oceanic physicochemical conditions.

How to cite: González-Lanchas, A., Karl-Heinz, B., Heather M., S., José-Abel, F., Miguel Angel, F., and Rosalind E.M., R.: Coccolithophore calcite production from nannofossil records , EGU General Assembly 2025, Vienna, Austria, 27 Apr–2 May 2025, EGU25-10717, https://doi.org/10.5194/egusphere-egu25-10717, 2025.

EGU25-10772 | ECS | Posters on site | SSP4.1

Micro X-ray CT Scanning of planktonic foraminifera tests (Globigerina bulloides) for Paleoceanographic reconstructions of ocean carbonate chemistry 

Saran Lee-Takeda, Shinya Iwasaki, Katsunori Kimoto, Naomi Harada, and IODP Expedition 395 Science Party

The carbonate ion concentration ([CO₃²⁻]) in the deep ocean is a key parameter for reconstructing ocean carbonate chemistry and understanding its role in the global carbon cycle. The dissolution of planktonic foraminiferal tests has long been used as a proxy for past deep ocean [CO₃²⁻] variability (Lohmann, 1995; Broecker and Clark, 2001a,b, 2003). However, traditional dissolution proxies, such as size-normalized weight (SNW), have inherent limitations in quantitatively constraining past fluctuations in deep-sea carbonate chemistry. For instance, fossil tests are often filled with sediments, making it difficult to clean them without damaging the original shell. Additionally, the initial size-normalized weight (SNW) values are influenced by ambient environmental conditions (such as the surface water [CO₃²⁻]) during calcification (Barker and Elderfield, 2002; Broecker and Clark, 2004).

  To address these limitations, a new quantitative approach has been developed to reconstruct bottom water saturation with respect to calcite (Δ[CO₃²⁻]) using micro X-ray computed tomography (MXCT) to separately evaluate the density of the test surface and interior. This method has been employed to reconstruct ocean carbon storage during the Last Glacial Period (Iwasaki et al., 2022). Δ[CO₃²⁻] represents the difference between the carbonate ion concentration at saturation and the in situ carbonate ion concentration, providing an effective method for reconstructing past carbonate ion levels. This technique enables high-resolution, non-destructive three-dimensional analysis of foraminiferal test microstructures, offering more precise constraints on past ocean carbonate chemistry (Iwasaki et al., 2023; Kimoto et al., 2023).

  In this study, we applied MXCT technology at the Japan Agency for Marine-Earth Science and Technology (JAMSTEC) to investigate foraminiferal test dissolution patterns in the North Atlantic on orbital timescales. We constructed three-dimensional models of Globigerina bulloides to examine its dissolution processes from the Pliocene to the Pleistocene. Previous dissolution experiments have shown that the inner calcite of G. bulloides dissolves selectively, and dissolution intensity can be evaluated using CT histogram patterns (Iwasaki et al., 2015). Our research results are consistent with previous studies showing that as shell dissolution progresses, the shape of the CT value histogram shifts toward a bimodal distribution. These findings contribute to improving alternative dissolution-based proxies and enhancing our understanding of the oceanic carbonate system’s response to climatic and oceanographic changes.

How to cite: Lee-Takeda, S., Iwasaki, S., Kimoto, K., Harada, N., and 395 Science Party, I. E.: Micro X-ray CT Scanning of planktonic foraminifera tests (Globigerina bulloides) for Paleoceanographic reconstructions of ocean carbonate chemistry, EGU General Assembly 2025, Vienna, Austria, 27 Apr–2 May 2025, EGU25-10772, https://doi.org/10.5194/egusphere-egu25-10772, 2025.

EGU25-11038 | ECS | Orals | SSP4.1

Benthic foraminiferal assemblage response to the Early-Middle Pleistocene sea-level variations in the south-eastern Indian Ocean 

Anna Arrigoni, Werner E. Piller, Briony Mamo, Benjamin Petrick, and Gerald Auer

One of the most studied and debated time intervals in our planet‘s recent climate history is the Early-Middle-Pleistocene Transition (EMPT). It represents a significant reorganization in the global climate system between 1.2-0.7 Ma, without any considerable variation in the orbital parameters controlling Earth’s insolation. This climate rearrangement is exemplified by a strengthening of ice ages and a switch in the periodicity of the glacial/interglacial changes from 41 kyr to a quasi-100 kyr cyclicity. The causes of the onset of this global climatic transition remain unclear, and its impact on equatorial to mid-latitude shelf areas is, to date, scarcely investigated.

IODP Site U1460 (27°22.4949′S, 112°55.4296′E; 214.5 mbsl) is located in the south-eastern Indian Ocean, on the uppermost slope of the Carnarvon Ramp. The study area is of particular interest, as it allowed the recovery of an expanded EMPT section and appears to have never been exposed to sub-aerial conditions during the sea-level lowstands during the glacial phases. Therefore, it is well-suited to assess the sensitivity of the western Australian carbonatic platform at high resolution to the EMPT sea level fluctuations.

The studied sedimentary sequence represents a time interval between 639.91 and 1092.34 ka, from marine isotope stage (MIS) 16 to MIS 32. For this period, we reconstructed the plankton/benthos (P/B) ratio to qualitatively establish the eustatic fluctuations in the region, as highstand and lowstand stages correspond to higher and lower values of the P/B ratio, respectively.

The P/B ratio has been coupled with a benthic foraminiferal assemblage study to ascertain the ecological variations in the area and their link to the glacial-interglacial-induced sea level oscillations. Benthic foraminiferal assemblages revealed a polyspecific and highly diversified assemblage. Specifically, within the studied interval, we recorded more than 318 species, most of which are represented by <1% abundance. Preliminary data allowed to distinguish a first part of the record (MIS 27-23) dominated by Cibicidoides spp., Heterolepa spp., Trifarina bradyi, and nodosarids, from the most recent interval (MIS 22-16), which recorded abundant agglutinated tests (e.g., Gaudryina spp., Textularia spp., Spirotextularia spp.), Cibicidoides spp., Heterolepa spp., Siphogenerina spp., uvigerinids and bolivinids. Other common taxa are Lenticulina spp., Nuttallides umbonifer, cassidulinids and lagenids.

Benthic assemblage analysis revealed that diversity remains high throughout the record (average Shannon H´ = 4.24) but tends to decrease during interglacial intervals (average Shannon H´ = 4.001). Such a diversity decrease supports the persistence of warmer, more tropical conditions during interglacials at the study Site. Agglutinated tests’ abundance increases towards the most recent part of the record, but no significant changes in their abundance are noticeable at the glacial-interglacial turns. Conversely, the increase of dominance during the interglacial phases (MIS 17, MIS 19 and MIS 21) in the youngest part of the record seems to be linked to an increase in the uvigerinids abundance and a concomitant decrease in Cibicides/Cibicidoides abundance. The oldest part of the record (between 1092.34-755.59 ka) registered an important decline in the number of uvigerinids and a contemporary increase in the abundance of Trifarina bradyi and cassidulinids.

How to cite: Arrigoni, A., Piller, W. E., Mamo, B., Petrick, B., and Auer, G.: Benthic foraminiferal assemblage response to the Early-Middle Pleistocene sea-level variations in the south-eastern Indian Ocean, EGU General Assembly 2025, Vienna, Austria, 27 Apr–2 May 2025, EGU25-11038, https://doi.org/10.5194/egusphere-egu25-11038, 2025.

EGU25-11634 | Orals | SSP4.1

The Laboratory of Historical Geology and Biogeosciences (National and Kapodistrian University of Athens) Micropaleontology collection: a first glance 

Maria Triantaphyllou, Vasiliki-Grigoria Dimou, Elisavet Skampa, Katerina Kouli, Theodora Tsourou, George Kontakiotis, Eva Besiou, Margarita Dimiza, Elizabeth Stathopoulou, Hara Drinia, and Assimina Antonarakou

 
The curation of Micropaleontology collection at the Laboratory of Historical Geology and Biogeosciences (HG-BioGeoSci), National and Kapodistrian University of Athens (NKUA), undergoes the auspices of the newly introduced MSc programme in Industrial and Environmental Applications in Micropaleontology (IdEA-M, https://idea-m.com/) at the Department of Geology and Geoenvironment. Originated as ‘Laboratory of Geology and Paleontology’ in 1906, HG-BioGeoSci incorporated micropaleontological collections mainly since the mid ’70s, when Professor Michael D. Dermitzakis established Micropaleontology as an educational discipline in the Greek academic domain. The scope of this project is to create a free access database of all micropaleontological objects stored in the HG-BioGeoSci, not only for educational purposes but also benefiting all interested parties to visit and study the collections. The Micropaleontology collection comprises the main microfossil groups/proxies (nannofossils and coccolithophores, foraminifera, pollen, dinoflagellates and other palynomorphs, ostracods, siliceous microfossils etc.), dated from the Paleozoic to the present day. In terms of geographic distribution, the majority of the micropaleontological items comes from the Greek territory and the broader Mediterranean area as also other locations worldwide, including samples collected by the global deep-sea drilling programs (DSDP, ODP, IODP, ICDP). The material mostly refers to microscope slides, isolated specimens or species assemblages, thin sections, mounted SEM stubs and filtered water samples. Except from the microfossil content, the raw material comprising rock samples, marine and terrestrial core records, surface sediments, sediment traps, as well as sample residues is also documented in a digital database. The database displays a 2 level classification where all different types of microfossils are documented, labeled with a unique Laboratory code and linked to all available data, i.e., lithology/material type, sampling date and methods, preparation date and analysis techniques, biozone/ biostratigraphic assignment, applied biozonal scheme, age, paleoenvironment type, owner, analyst, references list, repository and notes (e.g., field notes, photos, original drawings, derived publications etc.).
Up to now, more than 8.000 calcareous nannoplankton preparations have been entered associated with more than 20.000 entries of sample residues and raw samples, while it is estimated that the total amount of the Micropaleontology collection at HG-BioGeoSci will exceed 130.000 entities.

How to cite: Triantaphyllou, M., Dimou, V.-G., Skampa, E., Kouli, K., Tsourou, T., Kontakiotis, G., Besiou, E., Dimiza, M., Stathopoulou, E., Drinia, H., and Antonarakou, A.: The Laboratory of Historical Geology and Biogeosciences (National and Kapodistrian University of Athens) Micropaleontology collection: a first glance, EGU General Assembly 2025, Vienna, Austria, 27 Apr–2 May 2025, EGU25-11634, https://doi.org/10.5194/egusphere-egu25-11634, 2025.

EGU25-12328 | Orals | SSP4.1

Phytoplankton Communities across the Eocene-Oligocene Transition: A Paleo-Atlantic Meridional Transect 

Jorijntje Henderiks, Manuela Bordiga, and Steve M. Bohaty

Marine phytoplankton play a fundamental role in marine ecosystems and are sensitive to changes in ocean temperature and associated ocean properties (such as dissolved CO2 and nutrient availability). Fossil time series recovered from the deep-sea are unique archives of the long-term adaptation and evolution of marine algae with mineralized parts, such as coccolithophores and diatoms. For example, ample evidence exists for long-term compositional overturn and extinctions in marine plankton communities across the Eocene Oligocene transition (EOT; ~34.5-33.7 Ma), when a globally warm and largely ice-free climate shifted to an overall cooler state with major ice sheets on Antarctica. Early studies already highlighted how coccolithophore species compositions and their latitudinal contrasts drastically changed from the late Eocene to the early Oligocene. Here, we revisit these meridional gradients in species composition across a north-south transect in the Atlantic and Southern Ocean, in order to detail the cell size distribution of ancient coccolithophores and to determine the timing of phytoplankton community shifts on a common age scale. Calcareous nannofossil census counts confirm the existence of distinct regional signatures and ecological gradients between sites. Coccolithophore communities in the Southern Ocean stood out with lowest species richness and largest cells, whereas the Atlantic sites hosted more species with smaller cells. A decrease in mean cell size across the EOT was most pronounced in the Southern Ocean, where communities became dominated by medium-sized Reticulofenestra daviesii during the early Oligocene. In the Atlantic, phylogenetically related taxa (small Reticulofenestra spp. and Cyclicargolithus floridanus) increased in prominence in the cooler and glaciated world. The compositional changes and decrease in mean cell size of common taxa are consistent with increased cellular growth rates, major changes in the mixed layer depth and (seasonally) increased nutrient entrainment into the upper photic zone. This is supported by regional gradients in δ13C between surface- and deep-sea carbonates (indicating alleviation of nutrient-limitation) and abrupt increases in siliceous microfossils in the Southern Ocean and equatorial Atlantic sedimentary archives, although the latter may relate to changes in seafloor preservation of silica because of changes in deep water mass properties.

How to cite: Henderiks, J., Bordiga, M., and Bohaty, S. M.: Phytoplankton Communities across the Eocene-Oligocene Transition: A Paleo-Atlantic Meridional Transect, EGU General Assembly 2025, Vienna, Austria, 27 Apr–2 May 2025, EGU25-12328, https://doi.org/10.5194/egusphere-egu25-12328, 2025.

During the Cenomanian, one of the largest transgressions took place in the southern Tethys, where huge sequences of calcareous sediments were deposited on a wide platform. In Israel, the Cretaceous Judea Group is the most lithologically diverse and least studied in terms of the calcareous nannofossils. Three sections of the Kefar Shaul Fm. in the Judea Mts and CT2 borehole in Mt Carmel area were selected for the palaeocological reconstruction of the Albian-Cenomanian basin.

The 237.6 m deep borehole CT2 (32.7°N 34.98°E) penetrates the Yagur (dolomite), Isfiye (dolomitised chalk), Tavasim Tuff and Arqan (micritic carbonates, chalk) formations, which have been probed at 2 m intervals, with 97 samples for palaeoecological analysis. The Kefar Shaul sections (31°44'42"N 35°08'13"E; 31°45'12"N 35°07'16"E; 31°35'23"N 35°23'56"E) are represented by soft light yellowish very clayey marls and argillaceous limestones (~30 m); 40 samples for biostratigraphic and palaeoecological analysis have been taken at 0.3–1 m intervals.

The entire succession of borehole CT2 belongs to (sub)zones NC9b, UC0a–b (all Upper Albian), UC0c (Upper Albian – Lower Cenomanian), UC1, UC2 (Lower Cenomanian), and UC3 (Middle – Upper Cenomanian).

In the combined Kefar Shaul section of the Jerusalem Area, Subzone UC3d (Upper Cenomanian), undivided interval of Subzone UC3e – Zone UC4 (Upper Cenomanian) and Subzone UC5a (Upper Cenomanian) are recognized.

The quantitative analysis of nannofossils suggests that the general dominance of Watznaueria spp. throughout the whole successions in the Carmel and Jerusalem areas points to quite warm, open marine or coastal, generally oligotrophic conditions. Due to poor nutrient supply, the productivity of the calcareous nannoplankton was quite low. Low values of the Shannon index, Evenness and Species richness can be interpreted as reflecting unstable environment.

In the Carmel area, the Upper Albian Isfiye Fm. accumulated under temperate, oligotrophic conditions. The lower part of the Arqan Fm. (Upper Albian) was deposited under temperate climate but mesotrophic conditions. The higher (Lower Cenomanian) part of the Arqan Fm. was deposited in oligotrophic waters and relatively warm climate. The uppermost (Middle–Upper Cenomanian) part of the Arqan Fm. was accumulated during a progressively cooling period, yet characterized by alternating warming and cooling phases and oligotrophic conditions.

In borehole CT2, the Oceanic Anoxic Event 1d is recorded in the Isfiye Fm. and Middle Cenomanian Event I is detected in the Arqan Fm.; both datums corroborate well with the globally recorded carbon isotopic anomalies. The oxygen isotope analysis suggests temperate (~26°C) conditions during the Late Albian–Early Cenomanian followed by warming in the late Early Cenomanian, with temperatures gradually increasing to ~32°C towards the Middle Cenomanian.

The Kefar Shaul Fm. corresponds to the upper part (Middle–Upper Cenomanian) of the Arqan Fm. in the Carmel area and reflects oligotrophic conditions with mesotrophic phases, during a progressively warming period with episodes of cooling. The oxygen isotope data indicate approximate temperatures of 29–33℃ for the Late Cenomanian. The Kefar Shaul Fm. probably represents the deepest open marine facies of the Judea Group.

The project is supported by the Israel Ministry of National Infrastructure.

How to cite: Ovechkina, M.: Calcareous nannofossils and stable isotopes as proxies for understanding paleoenvironmental evolution of the Levant Basin during the Albian–Cenomanian, EGU General Assembly 2025, Vienna, Austria, 27 Apr–2 May 2025, EGU25-12449, https://doi.org/10.5194/egusphere-egu25-12449, 2025.

EGU25-14574 | ECS | Posters on site | SSP4.1

Linking foraminiferal distribution to coastal dynamics in Singapore 

Yu Ting Yan, Stephen Chua, Abang Nugraha, Isaac Lai, Koi Siek, Benjamin Horton, and Adam Switzer

Singapore is a highly urbanized country, where much of its natural coastline has been modified to protect against erosion and rising sea levels. While coastal developments play a crucial role to safeguard against sea level changes, they can significantly affect the coastal dynamics and ecological health of the coastal environments. To assess and monitor the impact of urbanization and environmental changes on these coastal systems, foraminifera serve as valuable environmental indicators. Here, we collected 20 surface sediment samples over a year period from five study sites of Singapore and Johor Straits to characterise the foraminiferal assemblages and sediment composition of different coastal environments (e.g., highly engineered coastlines, sandy beach). Foraminiferal assemblages show strong relationship with sediment type and organic content. In the Johor Strait, where sediments are predominantly muddy with higher organic content, there is a low diversity assemblage dominated by agglutinated taxa (e.g., Ammobaculites sp.). Conversely in the Singapore Strait, where sediments are generally coarser with lower organic content, there is a high diversity assemblage dominated by calcareous taxa (e.g., Elphidium sp.). This study presents important baseline data to understand the coastal dynamics and for environmental monitoring in Singapore, and therefore, help provide a framework for interpreting past coastal and climatic changes and inform coastal management decisions in the face of urbanization and warming climate.

How to cite: Yan, Y. T., Chua, S., Nugraha, A., Lai, I., Siek, K., Horton, B., and Switzer, A.: Linking foraminiferal distribution to coastal dynamics in Singapore, EGU General Assembly 2025, Vienna, Austria, 27 Apr–2 May 2025, EGU25-14574, https://doi.org/10.5194/egusphere-egu25-14574, 2025.

EGU25-14824 | ECS | Posters on site | SSP4.1

Holocene climate fluctuations and vegetation dynamics in northeastern Taiwan reconstructed through pollen analysis from Shenmihu Lake 

Xin-An Chen, Ludvig Löwemark, and Liang-Chi Wang

Shenmihu is a lake in northeastern Taiwan at an elevation of approximately 1100 meters, marking the boundary between broadleaf and coniferous forests. Pasania currently dominates the surrounding vegetation. This study aims to reconstruct environmental changes in the Shenmihu catchment over the past 10000 years during the Holocene through pollen analysis. Because plants produce pollen, which is often preserved in sediments, pollen analysis is a crucial proxy for investigating how vegetation distributions have responded to shifts in climate and human agricultural activities.

The results show that, although Pasania generally dominates the region, Alnus populations increased between 4900 and 900 cal BP, becoming the main species from 3500 to 1400 cal BP. This shift was likely driven by cooler climates and significant disturbances, such as typhoons that triggered landslides. These findings underscore the importance of climate fluctuations and extreme weather events in shaping local vegetation over time. Additionally, human agricultural activities likely played a role in altering plant communities, illustrating the complex interplay between natural and anthropogenic factors.

To understand broader regional trends, pollen data from Shenmihu were compared with records from Cuifeng Lake and Retreat Lake, both located in northeastern Taiwan. Through this comparative approach, the study aims to document past climate fluctuations in northeastern Taiwan and assess how vegetation distribution evolved throughout the Holocene.

How to cite: Chen, X.-A., Löwemark, L., and Wang, L.-C.: Holocene climate fluctuations and vegetation dynamics in northeastern Taiwan reconstructed through pollen analysis from Shenmihu Lake, EGU General Assembly 2025, Vienna, Austria, 27 Apr–2 May 2025, EGU25-14824, https://doi.org/10.5194/egusphere-egu25-14824, 2025.

EGU25-15159 | ECS | Posters on site | SSP4.1

Benthic foraminifera as paleoceanographic tracers in the southeastern Indian Ocean during the Middle to Late Miocene: New insights from ODP Site 752 

Tamara Hechemer, Werner E. Piller, Xabier Puentes-Jorge, Christoph Hauzenberger, Jassin Petersen, Patrick Grunert, Arianna V. Del Gaudio, David De Vleeschouwer, Or M. Bialik, Anna Joy Drury, Beth Christensen, Jing Lyu, and Gerald Auer

The Miocene Climatic Optimum (MCO) represents a climate period characterized by lower ice volumes and temperatures that were 3-4°C warmer than today. Indian Ocean Sub-Antarctic Mode Water (SAMW) is primarily formed south of 30°S and is the main return path for deep waters to the surface, migrating and intermixing northwards at Intermediate Water (IW) depths. The modern SAMW transports nutrients into the lower latitudes, strongly impacting mid- and low latitude productivity. During warmer climates, decreasing sea ice may increase nutrient trapping in the Southern Ocean, reducing the nutrient flux through SAMW into the lower latitudes. To better understand trajectories of nutrient fluxes in future climate change scenarios studies in past warm climate analogues of the near future – such as the MCO – are necessary. Thus, we use Ocean Drilling Project (ODP) Site 752, located on Broken Ridge in the southeastern Indian Ocean at a water depth of 1086.3 m, as a key location for understanding changes in IW conditions.                                               

This study aims to reconstruct paleoenvironmental conditions and bottom-water oxygenation at ODP Site 752 during the Middle to Late Miocene (15-8 Ma) using benthic foraminifera assemblages as a proxy for bottom-water-oxygenation and the enhanced Benthic Foraminifera Oxygen Index (eBFOI) for calculating dissolved oxygen content. We combine these assemblage data with Mg/Ca ratios of Cibicidoides wuellerstorfi and Cibicidoides mundulus as a proxy for bottom water temperatures (BWT). For reconstructing sea surface temperatures (SST), and temperatures from the open ocean thermocline, the Mg/Ca data were additionally gathered on the foraminifera species Globigerina bulloides (SST) and Globorotalia menardii (thermocline). We aim to analyze temperature variability through the water column to investigate influxes from cooler water bodies by increasing SAMW intensity and compare our new temperature data with our benthic foraminiferal assemblages. Therefore, we  provide novel insights into Late Miocene IW circulation changes and deep water mass variation with the progressive northward shift of the Subantarctic Tropical Front (SAF).

We present a high-resolution record of benthic foraminifera, tracing paleoenvironmental changes in deep water masses in addition to IW variation in the southeastern Indian Ocean. After the MCO, benthic foraminifera assemblages, and respectively the eBFOI indicate a relatively high oxic environment.  Starting around 11 Ma, we first detect an increase of dysoxic conditions and deep infaunal foraminifera, e.g. the genus Bolivina spp., with minimal variation in the dissolved oxygen content of the bottom water. Such an assemblage shift is contemporary with increased current winnowing following the northward migration of the SAF. Furthermore, the higher abundance of epiphytic species Cibicidoides wuellerstorfi and Lobatula lobatula, and also Vulvulina pennatula as an elevated epifauna, support an increase in bottom current energy at Broken Ridge from 15 to 11 Ma. Combined, our assemblages and Mg/Ca paleotemperature data suggest that the strengthening of the SAMW and Antarctic Intermediate Water formation in the Late Miocene, since about 11 Ma, resulted in notable changes in bottom water conditions at Broken Ridge, including the increase of current winnowing.

How to cite: Hechemer, T., E. Piller, W., Puentes-Jorge, X., Hauzenberger, C., Petersen, J., Grunert, P., V. Del Gaudio, A., De Vleeschouwer, D., M. Bialik, O., Drury, A. J., Christensen, B., Lyu, J., and Auer, G.: Benthic foraminifera as paleoceanographic tracers in the southeastern Indian Ocean during the Middle to Late Miocene: New insights from ODP Site 752, EGU General Assembly 2025, Vienna, Austria, 27 Apr–2 May 2025, EGU25-15159, https://doi.org/10.5194/egusphere-egu25-15159, 2025.

EGU25-15553 | ECS | Orals | SSP4.1

A Late Miocene paleobotanical record from the Peruvian Pisco Formation 

Diana Ochoa, Juan-Felipe Montenegro, Rodolfo Salas-Gismondi, Matthieu Carre, and Jose-Abel Flores

Coastal xeric ecosystems face a major threat under the current global warming trend. Changes in water availability and precipitation patterns can contribute to the development of new landscapes and affect existing biotic interactions. The late Miocene, characterized by warm climates and comparable pCO2 values (∼400 ppm), presents an opportunity to understand future warming scenarios for dry coastal ecosystems. In this study, we present the first-known late Miocene paleobotanical record from the Peruvian coast (15ºS), where a non-vegetated desert is found today. Recalibrated leaf-based precipitation estimates indicate that coastal rainfall values were 4 times higher than today; while significant wetter conditions compared to the present existed on the western slopes during the austral summer. The combined paleobotanical record reveals a diverse community dominated by elements typical of modern dry forests rather than desert-like habitats, including a mixture of lowland and Andean wooded taxa. These findings suggest a substantial shift in the ecosystem that allowed the development of a greener woodland landscape along the central Peruvian coastal region during the warmth of the late Miocene. Although the sources of extra humidity remain uncertain, warmer sea surface temperatures in the eastern Pacific and local convection may have contributed to the additional moisture. Moreover, intensified or even a permanent El-Niño state during the warmer late Miocene could have potentially served as an additional moisture source. Regardless of the mechanism, our results provide compelling evidence of reduced aridity, leading to a greening of the coastal Peruvian desert and large-scale biome and landscape changes in response to the Miocene greenhouse climate.

How to cite: Ochoa, D., Montenegro, J.-F., Salas-Gismondi, R., Carre, M., and Flores, J.-A.: A Late Miocene paleobotanical record from the Peruvian Pisco Formation, EGU General Assembly 2025, Vienna, Austria, 27 Apr–2 May 2025, EGU25-15553, https://doi.org/10.5194/egusphere-egu25-15553, 2025.

The Ross Sea is a globally significant annual atmospheric CO2 sink and hosts the largest phytoplankton bloom. It is characterized by a shallow carbonate compensation depth (CCD) and crucial water mass transformations. This study investigates the distribution of calcareous foraminifera and microtektites to evaluate carbonate preservation in surface sediments approximately 0.8 million years old.

In the western Ross Sea (WRS), pale-yellow microtektites originating from northern Victoria Land are distributed along the pathway of cold shelf water (SW), influenced by terrestrial input from the Victoria Land shelf. Calcareous benthic and pelagic foraminifera dominate in the central and eastern Ross Sea (CRS and ERS), following the pathways of warm Modified Circumpolar Deep Water (MCDW) and/or Circumpolar Deep Water (CDW). Surface sediments in these regions contain few diatoms and a higher proportion of >125 μm sediment fractions.

In the CRS, foraminiferal assemblages are dominated by Trifarina earlandi, with common occurrences of Ehrenbergina glabra, Globocassidulina biora, and Cibicides spp., along with abundant Neogloboquadrina pachyderma. In the ERS, G. biora dominates, accompanied by E. glabra and N. pachyderma. The Ross Sea’s shallow CCD, ranging from 350–400 m to 500–550 m, coexists with calcareous foraminiferal assemblages in sediments at depths of 400–600 m, suggesting that CCD depth is not the primary factor governing carbonate preservation.

The distribution of calcareous foraminifera aligns with water current pathways, highlighting water temperature as the key determinant of their survival. The temperature of MCDW, modulated by mixing with cold SW, plays a critical role in carbonate preservation.

How to cite: Wang, X.: Interactions Between Water Masses and Carbonate Preservation in the Ross Sea: Evidence from Foraminiferal and Microtektite Distribution, EGU General Assembly 2025, Vienna, Austria, 27 Apr–2 May 2025, EGU25-15615, https://doi.org/10.5194/egusphere-egu25-15615, 2025.

EGU25-16502 | Orals | SSP4.1

East China Sea climate and Kuroshio variability since the Last Glacial Maximum 

Stephen Obrochta, Yoshiya Hatakeyama, Sochichiro Oda, Soma Sato, Anjalia Wardani, Rizkysafira Ishendriati, Seira Izawa, Yuri Miyakoshi, Takahiro Inanobe, Yuto Kujiraoka, Yoshimi Kubota, Takuya Sagawa, Hideko Takayanagi, Yusuke Yokoyama, and Yosuke Miyairi

The Kuroshio is crucial in transporting heat and materials poleward. Its variability interacts with the global climate system and affects local and regional climates. However, long-term Kuroshio variability remains poorly understood, especially during the last glacial time. Here, we use a depth sediment cores recovered from the northern Okinawa Trough to investigate past Kuroshio variability. Radiocarbon results indicate that the recovered cores range in age from modern to ~50 ka. Bottom water temperature on the eastern edge of the trough at a relatively shallow site (~300 mbsl) was stable during the past 12 ka, with little increase during the Holocene. We estimate that this site experience ~60 m sea level rise. Based on World Ocean Atlas data for the site, an increase in depth of 60 m corresponds roughly to a 2˚C temperature decrease. Thus, Holocene warming was likely offset by rising sea level. The results further suggest that the vertical temperature gradient and thus the temperature structure was similar at 12 ka to the late Holocene, probably related to the existence of the Kuroshio main axis since that time.

How to cite: Obrochta, S., Hatakeyama, Y., Oda, S., Sato, S., Wardani, A., Ishendriati, R., Izawa, S., Miyakoshi, Y., Inanobe, T., Kujiraoka, Y., Kubota, Y., Sagawa, T., Takayanagi, H., Yokoyama, Y., and Miyairi, Y.: East China Sea climate and Kuroshio variability since the Last Glacial Maximum, EGU General Assembly 2025, Vienna, Austria, 27 Apr–2 May 2025, EGU25-16502, https://doi.org/10.5194/egusphere-egu25-16502, 2025.

The Fergana Basin, one of the largest depressions in Central Asia, is situated within the intermountain range of the southwestern Tien Shan. The final stage of marine sedimentation in the basin, represented by middle Eocene layers, marks the onset of the Asian aridification. This shift in paleoenvironmental conditions coincided with significant global changes, including the restriction of the Peri-Tethys, the isolation of Asian realms, and alterations in oceanographic and climatic systems. Microfossil assemblages provide important information about changes in the palaeoenvironment. Despite the abundance and importance of foraminifera and ostracods in the Fergana Basin, the paleoenvironmental conditions, species diversity, and paleobiogeography remain poorly understood, largely due to the outdated literature, most of which is in Russian. The present study focuses on foraminiferal and ostracod assemblages to gain new insights into environmental changes within the Fergana Basin and its connections to other marine basins during the middle Eocene. The material analyzed in this study comprises foraminifera and ostracods collected from the Sauk-Tanga section (40° 2'50.82"N, 70°15'42.70"E) and the Chamangul section (40° 1'50.34"N, 70°26'7.82"E), both located in the southern part of the Fergana Basin. The study site is located within the Madygen Geopark in the Batken Region of Kyrgyzstan, and the sections comprise an expanded middle Eocene clay sequence.

A total of 17 foraminiferal species and 11 ostracod species were identified. The foraminiferal community is characterized by three distinct assemblages: one dominated by Cribroelphidium, one comprising a combination of Ammonia, Cribroelphidium, and Nonion, and another dominated solely by Nonion. A comprehensive analysis of the micropaleontological assemblages indicates that conditions were shallow and fully marine during the Middle Eocene epoch. The environmental conditions are marked by elevated oxygen levels within the water column, extending from the intertidal zone to the high subtidal regions, in contrast to the low oxygen conditions prevalent within the sediments. The microfauna recovered is comparable to faunal communities in Europe and western Siberia, as well as neighboring regions such as the Tajik and Tarim basins. However, it differs significantly from the microfauna of the Turan Basin. The findings indicate that the Fergana Basin functioned as a transitional zone between the western Peri-Tethys and the easternmost realms, contradicting previous hypothesis that it merely served as a gulf. This novel perspective contributes to a more comprehensive understanding of the region's paleogeography and its significance in broader paleoenvironmental changes.

How to cite: Trubin, Y., Winkler, A., and Langer, M.: Paleoenvironmental reconstruction and transitional role of the Fergana Sea (Central Asia) during the middle Eocene through the lens of Micropaleontology, EGU General Assembly 2025, Vienna, Austria, 27 Apr–2 May 2025, EGU25-17334, https://doi.org/10.5194/egusphere-egu25-17334, 2025.

EGU25-17546 | ECS | Posters on site | SSP4.1

Orbitally driven nannoplankton evidence of surface ocean cooling and productivity in the Late Cretaceous greenhouse world  

Deborah Tangunan, Paul R. Bown, Andrew S. Gale, Maria Rose Petrizzo, James D. Witts, and Richard J. Twitchett

The Mid-Cenomanian Event (MCE) was a period of significant climatic and oceanographic perturbation, marked by a global carbon isotope excursion (CIE) and ecological shifts in marine systems. Current evidence from macrofauna and neodymium isotopes highlights increased Boreal influences in northwest European epicontinental seas during this interval. Here we use calcareous nannoplankton from the Lydden Spout section (Dover, east Kent, United Kingdom) to reconstruct the surface water conditions and evaluate their response to MCE. We found a notable increase in the high productivity taxa Biscutum constans and small Zeugrhabdotus spp., coinciding with the double-peaked CIE that characterises the MCE. The most significant changes in the productivity and stratification indices also occur at these CIE levels, suggesting enhanced nutrient availability, possibly driven by intensified upwelling or terrestrial nutrient runoff. A relative decline in the generalist taxon Watznaureia barnesiae underscores reduced water column stratification. This change in surface water nutrient dynamics and stratification is also evident in planktonic foraminifera, which show the disappearance of thermocline-dwelling oligotrophic rotaliporids for the duration of the CIE and emergence of meso-eutrophic taxa (Petrizzo and Gale, 2023).

The nannofossil temperature indices indicate transient warming maxima immediately preceding and midway through the MCE (between the two CIE peaks), a short cooling interval just above the MCE onset and a step down to cooler conditions from the upper MCE.  The cold-water species Repagulum parvidentatum increased to higher levels and then peak values coincident with the two CIE maxima, and a second cold water/high latitude specialist, Seribiscutum primitivum has a consistent first appearance coincident with the lower CIE peak and persists until just after the event termination. This surface water cooling is also indicated by bulk sediment δ¹⁸O records showing episodes of cooler sea surface temperatures (SSTs; Petrizzo and Gale, 2023), which coincide with precession-paced high-amplitude cooling cycles during the low to mid-MCE. Additionally, the occurrences of Boreal-affiliated macrofossil taxa, such as the belemnite Praectinocamax and the bivalves Chlamys arlesiensis and Oxytoma seminudum, are interpreted as marking the incursion of cooler Boreal waters into the proto-Atlantic during this interval (Gale and Kennedy, 2022).

Our analysis suggests that orbital forcing, and particularly precession and eccentricity cycles, played a significant role in modulating climatic and oceanographic conditions during the MCE. Orbital forcing, particularly 100 kyr and 405 kyr eccentricity cycles, modulated carbon cycle, climatic, and ecological changes, with precession-driven variations influencing terrigenous input and productivity. The interplay between orbital forcing and nannoplankton diversity further supports the influence of orbital pacing on the carbon cycle. The 405 kyr eccentricity maxima correspond with minima in nannoplankton diversity and communities indicative of cooler SSTs and higher productivity.  This suggests that eccentricity maxima were associated with enhanced nutrient availability, fostering increased primary productivity and communities dominated by fewer opportunistic taxa, resulting in lower overall diversity. These findings highlight the complexity of climatic and oceanographic dynamics during the MCE, revealing transient cooling episodes that disrupt the predominantly warm conditions of the Cenomanian.

How to cite: Tangunan, D., Bown, P. R., Gale, A. S., Petrizzo, M. R., Witts, J. D., and Twitchett, R. J.: Orbitally driven nannoplankton evidence of surface ocean cooling and productivity in the Late Cretaceous greenhouse world , EGU General Assembly 2025, Vienna, Austria, 27 Apr–2 May 2025, EGU25-17546, https://doi.org/10.5194/egusphere-egu25-17546, 2025.

EGU25-18723 | ECS | Posters on site | SSP4.1

The reversal of valve overlap in Cyprideis (Ostracoda, Crustacea) as a mechanism for sympatric speciation in the Pebas System (Miocene) of Western Amazonia  

Andres Salazar Rios, Martin Gross, Maria Belen Zamudio, and Werner E. Piller

During the Miocene, a huge (~1 million km2), long-lived (~10 myr) aquatic environment, the so-called Pebas System (Hoorn et al., 2010), existed in Western Amazonia, which is known for its highly diverse and endemic mollusk and ostracod faunas (Gross et al., 2014; Nuttall, 1990; Purper, 1979; Wesselingh, 2006). In the latter group, the asymmetrical-shelled genus Cyprideis is the most relevant, both in terms of abundance and number of endemic taxa, generating a flock of species in the Pebas System (Gross et al., 2014; Whatley et al., 1998). Although the understanding of certain aspects of this flock, such as taxonomy, has improved in recent years, the mechanisms responsible for this speciation remain elusive. In this study, we focus on a peculiar feature of the Cyprideis species flock, as about one-third of its species have a ‘reversed’ hinge and valve overlap compared to what is typical for the genus.

Several outcrops (Marañón Basin, Peru) and boreholes (Solimões Basin, Brazil) yielded abundant and well-preserved material of some little known species (Cyprideis caraionae Purper & Pinto, 1985, Cyprideis krsticae Purper & Pinto, 1985 and Cyprideis retrobispinosa Purper & Pinto, 1983) with complete ‘populations’ (males, females and juvenile stages) within the samples, allowing us to understand the variation of these species over a broad temporal span (~16-13 Ma). Our analyses demonstrate that the development of a shell reversal from previous ‘normal’ shelled Cyprideis species is an effective mechanism for reproductive isolation of the populations, and hence, of sympatric speciation in the Pebas biome.

How to cite: Salazar Rios, A., Gross, M., Zamudio, M. B., and Piller, W. E.: The reversal of valve overlap in Cyprideis (Ostracoda, Crustacea) as a mechanism for sympatric speciation in the Pebas System (Miocene) of Western Amazonia , EGU General Assembly 2025, Vienna, Austria, 27 Apr–2 May 2025, EGU25-18723, https://doi.org/10.5194/egusphere-egu25-18723, 2025.

EGU25-20071 | ECS | Posters on site | SSP4.1

Palaeoenvironment of the Sarmatian-Pannonian boundary in the Vienna Basin 

Niklas Schmied, Christopher Berndt, Martin Maslo, and Petra Heinz

Ostracods and foraminifers are often used as proxies to reconstruct paleoenvironments and their changes through time. In this study, they are utilized to give insights on the environmental transitions at the Sarmatian-Pannonian-boundary of the Vienna Basin at which various layers of accumulated ascidian spiculae were previously observed.
A drill core was taken during the expansion of the subway network in Vienna. It originates from the depth range of 38-42 meters below surface which is suggested to represent the transition from the Sarmatian to the Pannonian stages at this location. Selected 5cm segments were extracted from the core and processed. The preparation included wet sieving with 125 and 250µm mesh size. After oven-drying, the remaining sediment was split, and the microfossils were picked. Ostracods and foraminifers were identified using literature and paleoenvironmental changes were inferred based on variations in their assemblages along the core.
Preliminary results reveal distinct patterns in the assemblages of ostracods and foraminifers. At 42m below surface no ostracods and very few foraminifers are present indicating high sedimentation rates. At 40,5m below surface the identified ostracods species belong to Loxoconchidae and Leptocytheridae families and foraminifers belong to the families Elphidiidae and Miliolidae. At 38m below surface no foraminifers are present, and the ostracods belong to Candonidae families which are associated with lacustrine waters.

How to cite: Schmied, N., Berndt, C., Maslo, M., and Heinz, P.: Palaeoenvironment of the Sarmatian-Pannonian boundary in the Vienna Basin, EGU General Assembly 2025, Vienna, Austria, 27 Apr–2 May 2025, EGU25-20071, https://doi.org/10.5194/egusphere-egu25-20071, 2025.

Moyano strongly pointed out that the origins and evolutionary history of the Bryozoa both Antarctica and magellanic South America could not be understood without reference to the still  poorly known but very  extensive Paleocene and Lower Miocene  faunas of Patagonia (see Moyano, 1983.

The taxonomic studies with the extensive use of SEM of more than 110 bryozoan specimens of the Early Paleocene (Danian) and the Lower Miocene of the southern South America  (Patagonia) from the Canu’s collections (1908-1911) at the Bernardino Rivadavia Museum have revealed that cyclostomes and cheilostomes  have their taxonomical  counterparts among the late Early Eocene fauna of Seymour Island, Antarctic Peninsula (Hara, 2008). One of the example is the  anascan  microporoidean  represented by austral Aspidostoma Hincks, 1881 genus, known from the Paleogene and the Neogene strata of the triangle Antarctica-South America-Australia-New Zealand. It shows their  earliest  fossil record in the Lower Danian of Patagonia, therefore Patagonia should be  consider as an important place of origin and migration route of this genus. A rich occurrence of Aspidostoma  has been also described from the late Early Eocene, clastic sediments of the La Meseta Fm. on Seymour Island  (Hara 2001).  Other bryozoans such as umbonulomorph (lepraliellids) represented by  multilaminar, massive Celleporaria  Lamouroux, 1821  occur also in the shallow-water Roca Fm. of Patagonia and predated  the rich  occurrence of this genus from the late Early Eocene of the La Meseta Fm. (Seymour Island). Particularly important for taxonomy and closest biogeographical connection of South America-Antarctic during the Early Paleocene up to the Lower Miocene has the  common occurrence of several  globular, multilaminar cyclostomes of CerioporaReptomulticava, as well as reticulate colonies of Reticresis, branched microporidean Aspidostoma, and nodular multilaminar umbonulomorphs of Celleporaria and  Osthimosia.

Biogeographical  comparision of the southern South America  bryozan fauna  of the Early Paleocene age is interesting because  the Canu’s collections contains important  information  that some of the taxa have the earliest  fossil records in the Patagonian  shallow-water  Roca Fm., which predated  the younger New Zealand and Antarctic  bryozans ranging from the latest Paleocene- Early Eocene.

The Southern Ocean  bryozoans seems to be a product of the long period of evolution in situ, possibly streaching back to late Cretaceous, therefore the reconstruction of the Cenozoic ecosystem,  possible migration routes and  paleobiogeography  of the Weddellian Province of the southern hemisphere should be refer to the Antarctic fauna, possibly of the Createous age. 

Hara U., 2001 – Bryozoa from the Eocene of Seymour Island, Antarctic Peninsula. Palaeontologia Polonica. In: Palaeontological Results of the Polish Antarctic Expeditions, Part III, 60: 33–156.

Hara U., 2008. Biogeographical relationship of the Cenozoic South America -Antarctic  bryozoan biota: an example  of austral Aspidostoma genus in Antarctica: a Keystone in Changing  World – Online Proceedings of the 10th ISEAS, edited  by A. K. Cooper and C.R.Raymond et al. USGS open File Report 2007-xxx, Extended Abstract yyy, 1-5.

Moyano, G.H.,I., 1983. Southern Pacific  Bryozoa : a general view with emphasis on Chilian species. Gayana, Zoologia, 46, 1-45.


How to cite: Hara, U.: Biogeographical links of the South American-Antarctic bryozoan biota in Cenozoic (Early Paleocene-Miocene), EGU General Assembly 2025, Vienna, Austria, 27 Apr–2 May 2025, EGU25-20474, https://doi.org/10.5194/egusphere-egu25-20474, 2025.

EGU25-21237 | ECS | Orals | SSP4.1 | Highlight

High-latitude paleoecological response to early Eocene warming events 

Heather L. Jones, Bryan Niederbockstruck, Denise K. Kulhanek, and Ursula Röhl

As atmospheric carbon dioxide continues to rise at unprecedented rates, it is imperative that we better understand the potential long-term effects of warming on marine communities. Calcareous nannoplankton are likely particularly sensitive to the effects of rising CO2, and as one of the most important groups of mineralizing phytoplankton, their response to climatic change will have a knock-on effect on both marine food web dynamics and biogeochemical cycling.

As calcareous nannoplankton have a rich global fossil record spanning the last ~220 million years of Earth history, it is possible to examine how they were affected by high CO2 conditions in the geological past. These data can then be fed into Earth System Models, allowing for better predictions as to how modern communities might be affected by – and recover from – current global climate change. The earliest Eocene ca. 52 - 56 million years ago (Ma) is an excellent case study as to how the Earth system might respond to ‘worst-case’ climate scenarios. Additionally, as the high CO2 world of the early Eocene was punctuated by transient warming events of different magnitudes and durations, it is possible to examine potential threshold paleoecological responses to warming, as well as the recovery rates following individual events.

Here, we present new high-resolution data documenting changes in early Eocene calcareous nannoplankton community composition from two high-latitude International Ocean Discovery Program (IODP) sites (Site U1553 and Site U1514) in the historically understudied Southern Hemisphere. As well as elucidating how climatically sensitive, high-latitude communities were affected by high CO2 conditions, direct comparison of our data with published lower latitude records will reveal any ocean basin- or region-specific responses to warming.

How to cite: Jones, H. L., Niederbockstruck, B., Kulhanek, D. K., and Röhl, U.: High-latitude paleoecological response to early Eocene warming events, EGU General Assembly 2025, Vienna, Austria, 27 Apr–2 May 2025, EGU25-21237, https://doi.org/10.5194/egusphere-egu25-21237, 2025.

EGU25-646 | ECS | Posters on site | CL5.1

Progress exploring the characteristics of yellow stimulated luminescence on potassium feldspar  

Gwynlyn Buchanan, Frank Preusser, Kathryn Fitzsimmons, and Tobias Lauer

We investigate the characteristics of low-temperature yellow stimulated luminescence (YSL), to compare its utility for dating with infrared stimulated luminescence (IRSL) stimulated at 50 °C (IR50), post-IR50 yellow stimulated luminescence (pIR-YSL) and pIRIR290. Altogether, eleven samples from a range of depositional environments and known ages were tested. Thermal stability, bleachability, dose recovery, fading tests and equivalent dose estimation were undertaken. The pIR-YSL signal is stable up to 150 °C but susceptible to thermal transfer at higher temperatures and both the pIR-YSL and YSL50 signals bleach out at a rate and extent that is similar to the IR50 signal. Dose recovery tests on four of the young intermediate samples illustrate that the pIR-YSL signal can be both recovered and fully reset. Fading tests show that all three signals suffer from significant fading and equivalent dose estimations of the saturated samples IR50, IR-YSL and YSL50 signals significantly underestimate relative to the pIRIR290 signal. Elevated temperature signal combinations are additionally evaluated with the aim of further understanding the effect of elevated temperatures on the fading rate and ultimately the utility of YSL signals for dating.

How to cite: Buchanan, G., Preusser, F., Fitzsimmons, K., and Lauer, T.: Progress exploring the characteristics of yellow stimulated luminescence on potassium feldspar , EGU General Assembly 2025, Vienna, Austria, 27 Apr–2 May 2025, EGU25-646, https://doi.org/10.5194/egusphere-egu25-646, 2025.

EGU25-1384 | ECS | Posters on site | CL5.1

Optically Stimulated Luminescence and in situ 10Be / 26Al cosmogenic dating of the Upper and Lower Units from ‘La Falaise de la Mine d'Or’ at Pénestin (SW Brittany, France) within the cron-BRET Project. 

Carlos Arce Chamorro, Benjamin Sautter, Guillaume Guérin, François Guillocheau, Steven Binnie, Tibor Dunai, and David Menier

The sedimentary units overlying the so-called ‘Falaise de la Mine d'Or’ on the South-East coast of Brittany (France) have been studied for decades to reconstruct the evolution of fossil fluvial valleys in Brittany during the Pliocene and Quaternary (Guillocheau et al., 1998; Menier et al., 2006). However, published numerical ages are insufficient to provide a precise age of each of the units described, whose chronology relies on correlations with ESR dating of fluvial sediments from the interior of Central Brittany (Laurent et al., 1996). Thanks to the cron-BRET Project of the MSCA-Bienvenüe Bretagne Programme carried out by the Geo-Ocean Laboratory of the Université de Bretagne Sud in collaboration with the Cosmogenic Nuclide Laboratory of the University of Cologne (Germany), it has been possible to date the lower unit (U1), mainly composed of quartzite gravels and pebbles. In situ 10Be and 26Al concentrations produced within the quartz of these clasts become controlled by differential rates of decay when shielded from production at the surface (Dunai, 2010). The fact that the sediments are buried under a sedimentary shield of more than three metres, allows for the calculation of a burial age from the concentration of 10Be and 26Al by using the isochron method (Balco and Rovey, 2008; Granger et al., 2022). Preliminary results provide numerical data that place the formation of this unit 2.72 ± 0.19 million years ago, at the Plio-Quaternary boundary. Our study also includes the dating of the upper unit (U3) mainly composed of sand-sized materials (90-2000 µm), by analysis of the optically stimulated luminescence (OSL) signal of quartz (Murray et al., 2021) at the RenDaL Luminescence Laboratory (Géosciences- Univ. Rennes). The calculation of the palaeodose using Bayesian procedures (BayLum; Philippe et al., 2019) and of the natural dose rate from high-resolution gamma spectrometry (HRGs) measurements provides a burial age range between 263 and 408 ky. These data will be complemented by the dating of the materials composing unit U2 by analysing the infrared stimulated luminescence signal (IRSL) of potassium feldspar to extend the available dates and the knowledge of the landscape evolution of this coastal area linked to glacioeustatic oscillations and neotectonics during the Pleistocene.

How to cite: Arce Chamorro, C., Sautter, B., Guérin, G., Guillocheau, F., Binnie, S., Dunai, T., and Menier, D.: Optically Stimulated Luminescence and in situ 10Be / 26Al cosmogenic dating of the Upper and Lower Units from ‘La Falaise de la Mine d'Or’ at Pénestin (SW Brittany, France) within the cron-BRET Project., EGU General Assembly 2025, Vienna, Austria, 27 Apr–2 May 2025, EGU25-1384, https://doi.org/10.5194/egusphere-egu25-1384, 2025.

EGU25-1725 | ECS | Posters on site | CL5.1

Volcanogenic CO2 emissions affect radiocarbon dating in a case study from the Laacher See crater lake, Germany 

Lola Claeys, Stijn Albers, Irka Hajdas, and Marc De Batist

Lake sediments form a valuable and often continuous record for reconstructing past climate and the occurrence and impact of natural hazards. The interpretation of this record, however, relies heavily on a robust chronology formed by age-dating the sediments. For recent (i.e. Quaternary) lake sediments, radiocarbon dating of organic material is a fundamental dating technique. However, constructing a lake sediment chronology can be challenging, since the use of radiocarbon dating is dependent on many factors, including the type of material to be dated, depositional circumstances and possible contamination of 14C. Volcanogenic CO2, for instance, is depleted in 14C. This implies that in regions with surface exhalations of volcanic CO2 the concentration of 14C in the surrounding atmosphere is diluted. For this study, the effect of volcanogenic CO2 gas emissions on the use of radiocarbon dating was investigated in the Laacher See volcanic crater in western Germany. This crater was formed after the eruption of the Laacher See Volcano around 13 ka BP. It contains multiple degassing vents emitting CO2 of magmatic origin, in the form of underwater bubble seeps in the lake (“wet mofettes”) and onshore soil degassing (“dry mofettes”). Living plant material, i.e. leaves of Taraxacum genus plants, were sampled in several locations in the crater and dated to examine their range in radiocarbon ages and spatial variability. Additionally, a > 4 m long sediment core taken in the lake was sampled for organic material and bulk sediment to assess the offset of radiocarbon ages to their true or expected ages. Our results show that all dated samples exceed their true or expected ages, with the Taraxacum samples giving variable radiocarbon ages of up to 9000 a BP. Along a transect of sampled Taraxacum plants, the radiocarbon ages decrease with an increasing distance from the degassing vents along the lake shore. The radiocarbon ages of the sediment core samples show that organic material deposited in the lake is also affected by volcanogenic CO2 emissions, with some radiocarbon ages exceeding the age of the Laacher See eruption that formed the crater, although no regular offset could be determined for these samples with regard to their depth in the core. Furthermore, the radiocarbon ages do not correspond to a 210Pb/137Cs age-depth model that was established for the top of the core. Radiocarbon dating is shown to not provide reliable results for establishing a chronology for the sedimentary infill of Laacher See. Further research is required to better understand the influence of volcanogenic CO2 on organic material, such as effects of temporal and spatial variations in CO2 flux. In the case of Laacher See, other age-dating techniques should be considered to establish an age-depth model with reliable, non-14C dependent ages.

How to cite: Claeys, L., Albers, S., Hajdas, I., and De Batist, M.: Volcanogenic CO2 emissions affect radiocarbon dating in a case study from the Laacher See crater lake, Germany, EGU General Assembly 2025, Vienna, Austria, 27 Apr–2 May 2025, EGU25-1725, https://doi.org/10.5194/egusphere-egu25-1725, 2025.

EGU25-1998 | Orals | CL5.1

Chronology and environmental changes from a sediment core spanning the last 487 kafrom Lake Acıgöl (SW Anatolia) 

Hüseyin Çaldırak, Zeki Bora Ön, Serkan Akkiraz, M. Namık Çağatay, Bassam Ghaleb, Sabine Wulf, K. Kadir Eriş, Dursun Acar, Jerome Kaiser, and Sena Akçer Ön

This study details the construction of an age-depth model for the uppermost 128 meters of the 600 m long Acıgöl2009-B03 sediment core, retrieved from hypersaline Lake Acıgöl in southwestern Anatolia. The model matches the arboreal pollen record from Acıgöl2009-B03 with the LR04 benthic δ18O stack marine oxygen isotope record. Initial correlation employs the Dynamic Time Warping algorithm, refined through manual tuning. Validation of the model's accuracy incorporates multiple chronological constraints, including three radiocarbon dates, three U/Th dates, and the Kos Plateau Tuff, dated at 161.3 ± 0.1 ka. According to this model, the upper 128 meters of the Acıgöl2009-B03 sequence spans approximately the last 487,000 years, encompassing Marine Isotope Stages (MIS) 1 to 12 and part of MIS 13. Our model serves as an update to the previously published, linearly constructed, age model as being used more anchor point and an efficient algorithm for similarity measurements which lies on a robust statistical foundation. In this period, arboreal pollen data suggest increasing (decreasing) arboreal vegetation input during interglacial (glacial) periods.

How to cite: Çaldırak, H., Ön, Z. B., Akkiraz, S., Çağatay, M. N., Ghaleb, B., Wulf, S., Eriş, K. K., Acar, D., Kaiser, J., and Akçer Ön, S.: Chronology and environmental changes from a sediment core spanning the last 487 kafrom Lake Acıgöl (SW Anatolia), EGU General Assembly 2025, Vienna, Austria, 27 Apr–2 May 2025, EGU25-1998, https://doi.org/10.5194/egusphere-egu25-1998, 2025.

EGU25-2273 | ECS | Posters on site | CL5.1

Luminescence dating of feldspar using a novel infra-red photoluminescence signal – first dating results from loess samples 

Janina J. Nett, Tony Reimann, and Svenja Riedesel

Luminescence dating has long been used for dating sediments both in geological as well as archaeological context. Following numerous advances in feldspar and quartz luminescence dating in recent decades, a new method for feldspar dating is currently under development: Infrared photoluminescence (IRPL) is a novel technique, which allows the direct and non-destructive measurement of luminescence emitted by trapped electrons in feldspars (Prasad et al., 2017). IRPL arises from radiative excited state to ground state relaxation of trapped electrons within the principal trap in feldspar.

IRPL measurements enable the investigation of two emissions, one at 880 nm and another one at 955 nm (Kumar et al., 2018, 2021). Whilst most research on IRPL has focussed on understanding the physical processes leading to the IRPL emission in feldspars, yet little is known with regard to the application of IRPL as a dating technique. We build upon a first measurement protocol for sediment dating developed by Kumar et al. (2021) and combine the IRPL measurements with a modified post-IR IRSL protocol (pIRIR225 with IR stimulation at 50°C, 90°C, 225°C), which allows a comparison of the IRPL signals with three IRSL signals. This integration of the IRPL measurements in a pIRIR protocol might possibly reduce fading to a negligible level due to the successive IRSL and IRPL measurement steps.

First promising results on loess samples with known (independent) age from the Balta Alba Kurgan loess-paleosol sequence in Romania (Scheidt et al., 2021) will be presented. We conducted dose recovery tests, bleaching experiments and equivalent dose measurements using different test doses and will show first results of fading measurements. The dose recovery tests are within 10% of unity for most of the measurements suggesting sufficient performance of our novel IRPL/pIRIR protocol. However, IRPL equivalent doses seem to slightly underestimate previously measured pIRIR290 equivalent doses. Possible reasons will be discussed within the EGU presentation.


References

Kumar, R., Kook, M., Murray, A.S. & Jain, M. (2021). Towards direct measurement of electrons in metastable states in K-feldspar: Do infrared-photoluminescence and radioluminescence probe the same trap? Radiation Measurements 120, P. 7-13.

Kumar, R., Kook, M., & Jain, M. (2021). Sediment dating using infrared photoluminescence. Quaternary Geochronology 62, 101147.

Prasad, A.K., Poolton, N.R.J., Kook, M. et al. (2017) Optical dating in a new light: A direct, non-destructive probe of trapped electrons. Sci Rep 7, 12097.

Scheidt, S., Berg, S., Hambach, U., Klasen, N., Pötter, S., Stolz, A., ... & Nett, J. J. (2021). Chronological assessment of the Balta Alba Kurgan loess-paleosol section (Romania)–a comparative study on different dating methods for a robust and precise age model. Frontiers in Earth Science, 8, 598448.

How to cite: Nett, J. J., Reimann, T., and Riedesel, S.: Luminescence dating of feldspar using a novel infra-red photoluminescence signal – first dating results from loess samples, EGU General Assembly 2025, Vienna, Austria, 27 Apr–2 May 2025, EGU25-2273, https://doi.org/10.5194/egusphere-egu25-2273, 2025.

EGU25-3717 | Posters on site | CL5.1

Rock Luminescence Dating Method for Studying the Temporal and Spatial Evolution of the Maying River, Qilian Mountains 

Furong Cui, Huiping Zhang, Jinfeng Liu, and Jintang Qin

    Fluvial depositional systems are critical for understanding the interplay between tectonics and climate. Accurately determining the ages of these formations is essential for exploring the spatial and temporal evolution of river deposits. In arid and semi-arid regions, these systems predominantly consist of coarse materials and cobbles. Traditional age determination methods often focus on well-sorted fine sediments, while dating poorly sorted cobble layers presents a significant challenge. Recently, optically stimulation luminescence (OSL) is increasingly are used to determine the burial age of rocks. This new method relies on resetting of the latent geological OSL signals with depth into the rock surface, and the re-accumulation of new signals after the burial (Sohbati et al.,2015).

     This study aims to investigate buried cobbles from terrace and alluvial gravel profiles along the Maying River, located at the foothills of the Qilian Mountains. We will utilize a Risø Luminescence Imager, complemented by in-situ measurement techniques (Sellwood et al.,2022). This integrated methodology will enhance our understanding of luminescence signal bleaching characteristics on rock surfaces, allowing for the rapid and accurate selection of samples for age dating. This approach not only mitigates the limitations of cobble dating across millennial to hundred-thousand-year timescales, but also provides novel insights into the late Quaternary geomorphology and tectonic evolution of rivers at the front of the Qilian Mountains.

Key words: Rock surface luminescence dating, Risø Luminescence Imager, Buried age

References

  • Sohbati, R., Murray, A.S., Porat, N., Jain, M., Avner, U., 2015. Age of a prehistoric “Rodedian” cult site constrained by sediment and rock surface luminescence dating techniques. Quat. Geochronol. 30, 90-99.
  • Sellwood, E. L., Kook, M., Jain, M., 2022, A 2D imaging system for mapping luminescence-depth profiles for rock surface dating. Radiat. Meas. 150, 106697.


How to cite: Cui, F., Zhang, H., Liu, J., and Qin, J.: Rock Luminescence Dating Method for Studying the Temporal and Spatial Evolution of the Maying River, Qilian Mountains, EGU General Assembly 2025, Vienna, Austria, 27 Apr–2 May 2025, EGU25-3717, https://doi.org/10.5194/egusphere-egu25-3717, 2025.

EGU25-4772 | Orals | CL5.1

Reconstructing dike history using luminescence dating 

Chang Huang, Roy van Beek, Elizabeth Chamberlain, Jakob Wallinga, Jelle Moree, Frédéric Cruz, Pieter Laloo, and Eric Norde

Dikes are among the most significant ancient human-made earthworks for flood control, land reclamation, and water management for millennia. However, determining the age of dike construction and development based on traditional dating methods (e.g., historical documents, archaeological find materials, and radiocarbon dating), is challenging, due to the paucity of materials and historical records. Luminescence dating may provide an alternative as it uses ubiquitous quartz or feldspar minerals to directly determine the burial age of sediments. In this study, we applied quartz optically stimulated luminescence (OSL) and feldspar single-grain post-infrared infrared stimulated luminescence (pIRIR) dating on two dikes: the Waal dike (near Wolferen-Sprok) in the Netherlands and the Scheldt dike (near Bornem) in Belgium. Our results confirm that luminescence dating provides reliable age estimates, consistent with other independent proxy data such as radiocarbon dating, archaeological artifacts, and historical evidence, and may refine site chronologies. Based on the age results, the history of dike construction and evolution was reconstructed. Additionally, the well-reset OSL signals for dike-related sediments suggest that fresh flood deposits were used for construction. This study highlights the potential of luminescence dating as a robust tool for reconstructing the history of dike construction and understanding ancient engineering.

How to cite: Huang, C., van Beek, R., Chamberlain, E., Wallinga, J., Moree, J., Cruz, F., Laloo, P., and Norde, E.: Reconstructing dike history using luminescence dating, EGU General Assembly 2025, Vienna, Austria, 27 Apr–2 May 2025, EGU25-4772, https://doi.org/10.5194/egusphere-egu25-4772, 2025.

EGU25-5262 | Orals | CL5.1

Cosmogenic exposure dating the Pre-Columbian archaeological structures at Tiwanaku, Bolivia  

David Fink, Vladimir Levchenko, and Toshiyuki Fujioka

We use in-situ cosmogenic 10Be in an attempt to date the construction of the Kalasasaya Platform temple at the UNESCO Heritage archaeological site at the ancient city of Tiwanaku, Bolivia. The unique site is located within the altiplano valley of Tiwanaku at 3870 masl near the southern shores of Lake Titicaca. The monuments at Tiwanaku were constructed as ceremonial and civic buildings of exceptional precision and quality by an Andean civilization, who were precursors of the Inca Empire. The date of construction of Tiwanaku is unknown. Earliest settlement is believed to be at least ~3,000 years ago and archeological evidence supports a drought-based empire collapse in the first half of the 12th century. Radiocarbon dating of construction material and other debris range from 300 to 950 AD (ie 1700 to 1050 years ago). At its apogee Tiwanaku is estimated to have extended over an area of as much as 6km2 and to have housed between 70,000 and 125,000 inhabitants.We gained permission to sample the very tops of 3 of the Kalasasaya pillars, and multi-meter sized excavated sandstone blocks and adjacent unmodified bedrock outcrop at a known quarry site which was used for sourcing material for Tiwanaku construction.  The pillars, ~5 meters tall and of square meter section, frame the outer perimeter wall of the 120m square Kalasasaya Platform and are made of andesite and sandstone. Samples at the quarry site, about 15 km distant and at 4300 masl,   were taken from  surfaces of the cavity from where blocks originated, select faces from the extracted blocks and  unmodified  bedrock outcrop. We were able to re-orient extracted blocks back into their original excavated cavity and thus determine pre-excavated buried and post-excavated exposed faces which allowed us to measure how long ago the block was carved out of bedrock and rotated in the process. Our results show that the cosmogenic signal in platform pillar tops is dominated by inheritance but that blocks had been quarried as recently as 1500-3000 tears ago, the age range depending on choice of attenuation length and estimating shielding. Details of sampling, site descriptions and 10Be-age calculations will be presented.

How to cite: Fink, D., Levchenko, V., and Fujioka, T.: Cosmogenic exposure dating the Pre-Columbian archaeological structures at Tiwanaku, Bolivia , EGU General Assembly 2025, Vienna, Austria, 27 Apr–2 May 2025, EGU25-5262, https://doi.org/10.5194/egusphere-egu25-5262, 2025.

EGU25-6277 | Orals | CL5.1

Optimized U-Th Chronometry for Carbonates Using MC-ICP-MS: Advancements in Precision and Applications 

Altug Hasözbek, Ali Pourmand, Arash Sharifi, Ana Isabel Ortega, Josep Parés Casanova, Josep Vallverdú Poch, and Silviu Constantin

U-Th geochronology is a key tool in Quaternary geology, widely applied to carbonate matrices with significant advancements achieved through MC-ICP-MS technology. However, 230Th dating remains challenging for samples with low-uranium concentrations and high-detrital thorium content which often reflecting open-system behavior. These factors increase uncertainties in age calculations. This study introduces an optimized U-Th dating methodology that integrates refined wet chemistry protocols and 10¹³-ohm amplifiers, significantly reducing expanded uncertainties.

The study employs a four-step validation process: i) testing 10¹³-ohm amplifiers using the NBL U-reference material (CRM 112A), and Th-reference material (IRMM035) of IRMM, ii) application to low-U (10–15 ppb) speleothem samples from the Cueva Fantasma (Atapuerca paleontological-archeological site, Burgos, Spain), iii) analysis of open-system shell samples from Turkey, iv) analysis of the internal speleothem standard (BSS2) of CENIEH.

Initial results using CRM 112A and IRMM035 reveal a tenfold improvement in signal-to-noise ratios with the 10¹³-ohm amplifiers. This configuration enables the use of Faraday cups instead of SEM detectors for U and Th-standard analyses, even at very low intensities (0.002–0.007V), a critical improvement for minimizing uncertainty budgets during bracketing sequences in U-Th dating. Comparative analyses of real samples from Atapuerca, Turkey, and the CENIEH speleothem standard (BSS2) show that the refined methodology reduces U-Th age uncertainties from 2–3% to 0.5–1%.

Beyond improved precision for younger, low-U samples, the method reduces the required sample size from ~100-150 mg to 40–50 mg, substantially lowering the influence of detrital Th contamination. The broader significance of this optimized approach lies in its application to environmental reconstruction during the Quaternary, offering robust tools for deciphering climate archives, paleoenvironments, and archaeological contexts.

How to cite: Hasözbek, A., Pourmand, A., Sharifi, A., Isabel Ortega, A., Parés Casanova, J., Vallverdú Poch, J., and Constantin, S.: Optimized U-Th Chronometry for Carbonates Using MC-ICP-MS: Advancements in Precision and Applications, EGU General Assembly 2025, Vienna, Austria, 27 Apr–2 May 2025, EGU25-6277, https://doi.org/10.5194/egusphere-egu25-6277, 2025.

EGU25-6728 | Orals | CL5.1

The Paleochrono-1.1 probabilistic model to derive a common age model for several paleoclimatic sites using absolute and relative dating constraints 

Frédéric Parrenin, Bouchet Marie, Buizert Christo, Capron Emilie, Corrick Ellen, Russell Drysdale, Kenji Kawamura, Amaëlle Landais, Robert Mulvaney, Ikumi Oyabu, and Sune Rasmussen

Past climate and environmental changes can be reconstructed using paleoclimate archives such as ice cores, lake and marine sediment cores, speleothems, tree rings and corals. The dating of these natural archives is crucial for deciphering the temporal sequence of events and rates of change during past climate changes. It is also essential to provide quantified estimates of the absolute and relative errors associated with the inferred chronologies. However, this task is complex since it involves combining different dating approaches at different paleoclimatic sites and often on different types of archives. Here we present Paleochrono-1.1, a new probabilistic model to derive a common and optimised chronology for several paleoclimatic sites with potentially different types of archives. Paleochrono-1.1 is based on the inversion of an archiving model: a varying deposition rate (also named growth rate, sedimentation rate or accumulation rate) and also, for ice cores, a lock-in-depth of air (since, in the absence of significant surface melt, the air is trapped in the ice at about 50-120 m below the surface) and a thinning function (since glacier ice undergoes flow). Paleochrono-1.1 integrates several types of chronological information: prior knowledge of the archiving process, independently dated horizons, depth intervals of known duration, undated stratigraphic links between records, and, for ice cores, Δdepth observations (depth differences between events recorded synchronously in the gas and solid phases of a certain core). The optimization is formulated as a least-squares problem, assuming that all probability densities are near-Gaussian and that the model is nearly linear in the vicinity of the best solution. Paleochrono-1.1 is the successor of IceChrono, which produces common and optimized chronologies for ice-cores. Paleochrono-1.1 outperforms IceChrono in terms of computational efficiency, ease of use, and accuracy. We demonstrate the ability of Paleochrono-1.1 in an experiment involving only the MSL speleothem in Hulu Cave (China) and compare the resulting age model with the SISALv2 age models. We then demonstrate the multi-archive capabilities of Paleochrono in a new ice-core–speleothem dating experiment, which  combines the Antarctic Ice Core Chronology 2023 dating experiment, based on records from five polar ice cores, with data from two speleothems from Hulu Cave dated using uranium/thorium radiometric techniques. We analyse the performance of Paleochrono-1.1 in terms of computing time and memory usage in various dating experiments. Paleochrono-1.1 is freely available under the MIT open-source license.

How to cite: Parrenin, F., Marie, B., Christo, B., Emilie, C., Ellen, C., Drysdale, R., Kawamura, K., Landais, A., Mulvaney, R., Oyabu, I., and Rasmussen, S.: The Paleochrono-1.1 probabilistic model to derive a common age model for several paleoclimatic sites using absolute and relative dating constraints, EGU General Assembly 2025, Vienna, Austria, 27 Apr–2 May 2025, EGU25-6728, https://doi.org/10.5194/egusphere-egu25-6728, 2025.

EGU25-8761 | Orals | CL5.1

Using OTOR(X) fit functions to improve estimation of high natural luminescence doses 

Barbara Mauz, Sebastian Kreutzer, and John L. Lawless

While highly desired, it remains a challenge for luminescence dating to determine high doses, hence high ages (e.g., >300 ka). The challenge is to project a natural dose close to saturation to a dose-response curve generated with high laboratory doses. The single saturating exponential (SSE) function mostly delivers poor fits to this type of dose responses. Other functions, e.g., the single saturating exponential plus linear function, are then often employed, but these include constants that have no direct physical meaning. Such an approach is inconsistent with the OSL/IRSL measurement parameters (e.g. detection wavelength) by which the signal from a dosimeter’s specific trap-hole pair is targeted out of a broad light spectrum. It is therefore beneficial to employ a physically based model that allows to interpret observations obtained from high laboratory dose responses.

Here we employ the analytical expression, Lambert W, developed by Pagonis et al. (2020) which is an exact solution of the well-studied OTOR (one trap one recombination centre) model, and extended by Lawless and Timar-Gabor (2024) to the OTORX model. We compare results obtained from SSE fits, in particular the characteristic saturation dose (“D0”) parameter, with those obtained from the OTOR(X) functions. Well-bleached fine-grained polymineral samples irradiated up to ~5000 Gy were used and measured using the pIRIR225 protocol.

For the SSE function the results point to the 80% rule of thumb: at ca 80% of the saturation dose the SSE-fitted dose response tend to underestimate the natural dose. The OTOR(X) functions reveal that this is due to the ratio of trapping rate versus recombination rate of free electrons which changes as the regenerated dose response approaches saturation. Consequently, the shape of the dose response curve flattens out in a way that the SSE function is unable to predict. We show here how the change of shape affects the dose interpolation point and how the accuracy of dose estimate is tested using the 63% (D0) and 80% dose values. We conclude that the OTOR(X) functions provide accurate estimates of natural doses close to saturation.

How to cite: Mauz, B., Kreutzer, S., and Lawless, J. L.: Using OTOR(X) fit functions to improve estimation of high natural luminescence doses, EGU General Assembly 2025, Vienna, Austria, 27 Apr–2 May 2025, EGU25-8761, https://doi.org/10.5194/egusphere-egu25-8761, 2025.

EGU25-12582 | Orals | CL5.1

Reconstructing Late Glacial–Early Holocene dune formation and wildfire dynamics using radiocarbon and OSL dating: Łaskarzew, Poland 

Natalia Piotrowska, Piotr Moska, Robert J. Sokołowski, Grzegorz Poręba, Paweł Zieliński, Przemysław Mroczek, Michał Łopuch, Zdzisław Jary, Alicja Ustrzycka, Andrzej Wojtalak, Agnieszka Szymak, Konrad Tudyka, Jerzy Raczyk, Marcin Krawczyk, Grzegorz Adamiec, and Jacek Skurzyński

The chronology of Late Glacial and Early Holocene dune formation and wildfire activity at the Łaskarzew site, eastern Poland, was established using AMS radiocarbon (14C) and optically stimulated luminescence (OSL) dating. Situated within the European Sand Belt, the profile preserves 13 aeolian-soil cycles characterised by alternating phases of aeolian deposition, soil formation, and wildfire episodes, demonstrating the dynamic response of aeolian systems to short-term climatic oscillations. A total of 26 charcoal samples, collected from palaeosols and charcoal layers, were radiocarbon-dated, and cross-referenced with OSL ages of quartz grains, resulting in a robust chronological framework. Dune formation began during the Oldest Dryas, with intensified aeolian activity and four wildfire events recorded during the Allerød interstadial, a period marked by rapid vegetation regeneration and recurring fire episodes. The absence of Younger Dryas sediments reflects extreme environmental conditions, including aridity, limited vegetation, and intensified aeolian erosion. The Holocene sequence, enriched with charcoal-rich deposits, records nine independent wildfire episodes over approximately 4500 years, linked to warm climatic conditions that favoured the expansion of fire-prone pine forests and shaped dune environments. Aeolian activity persisted through this period, accumulating approximately three metres of sediment, before ceasing around 7 ka BP as vegetation stabilised the landscape. The integration of radiocarbon and luminescence dating techniques provided a detailed Late Quaternary chronology, offering valuable insights into the interplay of fire, vegetation, and aeolian processes within the European Sand Belt.

How to cite: Piotrowska, N., Moska, P., Sokołowski, R. J., Poręba, G., Zieliński, P., Mroczek, P., Łopuch, M., Jary, Z., Ustrzycka, A., Wojtalak, A., Szymak, A., Tudyka, K., Raczyk, J., Krawczyk, M., Adamiec, G., and Skurzyński, J.: Reconstructing Late Glacial–Early Holocene dune formation and wildfire dynamics using radiocarbon and OSL dating: Łaskarzew, Poland, EGU General Assembly 2025, Vienna, Austria, 27 Apr–2 May 2025, EGU25-12582, https://doi.org/10.5194/egusphere-egu25-12582, 2025.

EGU25-12656 | ECS | Posters on site | CL5.1

Investigating the cyclicity of Neanderthal occupations at Chez-Pinaud, SW France, using high-resolution OSL dating and Bayesian analysis. 

Elaine Sellwood, Hugues Malservet, and Guillaume Guérin

The Middle Palaeolithic site of Chez-Pinaud in Jonzac (SW France) provides an unparalleled insight into the hunting and butchering behaviour of Neanderthals from ~60 ka 1 ago. Excavations in the late 1990’s and early 2000’s uncovered a 6-meter sedimentary sequence comprising apparently alternating thin sterile layers and artefact-rich deposits, hosting densely packed accumulations of large ungulate bone fragments and lithics of the Quina Mousterian industry 2 . These periodic deposits suggest repeated occupation and abandonment of the site, where Neanderthals were not inhabiting for long periods.  Despite these observations we are still limited in a obtaining a full occupational history of the site, predominantly due to limitations in existing dating methods.

In this study a novel sampling approach was applied to improve the chronological resolution of this site, combining high-resolution Optically stimulated luminescence (OSL) dating and Bayesian modelling. A 40 x 40 x 40 cm sediment block was removed from the main Quina-bearing layer (Layer 22 2). Under controlled orange light at the RenDaL OSL laboratory at Université de Rennes, the block was carefully excavated by scraping away sediment in horizontal layers. Coordinates of artefacts were recorded and samples for OSL dating were collected at ~1 cm intervals down the block.  Single-grain quartz OSL data were analysed using the BayLum R package 3, incorporating Bayesian statistical modelling to reduce age uncertainties and to investigate the models capacity to handle OSL ages in close temporal and spatial distribution.

Our results indicate that the top of the section represents more modern deposits (~2 ka), which are void of bone fragments. These ages suggest sediment mixing from surface disturbances such as collapsing limestone or anthropogenic activities. Beyond this modern layer, two artefact-rich occupational layers separated by a thin sterile layer are identified through plotting the 3D distribution of the artefacts. The corresponding Bayesian ages for these layers vary between 58 – 80 ka, and do not increase linearly with depth and are thus difficult to correlate directly with the individual artefact bearing layers. These varying ages raise questions over dose rates when we consider the complexity of the heterogeneous sediments in the block. Continuing modelling will be conducted with BayLum as well as further investigation into the dose rate of the samples in attempts to further investigate and increase precision of the ages.

This work underscores the value of combining precise excavation methods with Bayesian analytical approaches for OSL data to construct precise chronologies, especially in important prehistoric archaeological contexts which host well preserved and challenging chronologies.


References:

1 Richter, D. et al. Thermoluminescence dates for the Middle Palaeolithic site of Chez-Pinaud Jonzac (France). Journal of Archaeological Science 40, 1176–1185 (2013).

2 Airvaux, J. & Soressi, M. Le site paléolithique de chez-Pinaud à Jonzac, Charente-Maritime. Prehistoire du Sud-Ouest 8, (2004).

3 Philippe, A., Guérin, G. & Kreutzer, S. BayLum - An R package for Bayesian analysis of OSL ages: An introduction. Quaternary Geochronology 49, 16–24 (2019).

How to cite: Sellwood, E., Malservet, H., and Guérin, G.: Investigating the cyclicity of Neanderthal occupations at Chez-Pinaud, SW France, using high-resolution OSL dating and Bayesian analysis., EGU General Assembly 2025, Vienna, Austria, 27 Apr–2 May 2025, EGU25-12656, https://doi.org/10.5194/egusphere-egu25-12656, 2025.

EGU25-12755 | ECS | Posters on site | CL5.1

Sediment provenance and erosion rates in the Andes-Amazon fluvial system: a study using luminescence and cosmogenic nuclides technics 

Gabriella Brandino de Campos, Carolina Barbosa Leite Cruz, Priscila Emerich Souza, Anarda Luísa Souza Simões, Caio Breda, Renan Cassimiro Brito, Bodo Bookhagen, Andre Oliveira Sawakuchi, and Fabiano Nascimento Pupim

Continental sedimentary deposits are essential geological records for understanding landscape evolution over time. In this context, the “modern analog” approach is employed in the Andes-Amazon system to deepen the understanding of past changes and the factors influencing them. This methodology involves studying contemporary fluvial deposits using advanced techniques and methods to identify how natural processes shape the current landscape. The main objective of this study is to determine the spatial variability and environmental controls of the sediment provenance and the erosion rates in modern deposits of the Ucayali, Maranõn, Napo, Madre de Dios, Huallaga, and Solimões rivers in the Andes-Amazon fluvial system. This approach will involve luminescence sensitivity signatures of quartz and feldspar grains, which can indicate grain source and transport process; the latitudinal gradient of erosion rates using in situ cosmogenic nuclides; the relationship between sedimentary variability and tectonic, topographic, lithologic, and climatic controls using Geographic Information Systems (GIS). The new cosmogenic nuclide and luminescence data will be used together to evaluate the compatibility of these methods in analyzing sediment provenance and erosion rates. This comparison will assess whether these methods and approaches can be consistently integrated, contributing to a more comprehensive understanding of sedimentary and erosive processes in the Andes-Amazon fluvial system. (FAPESP #2023/16318-1)

How to cite: Brandino de Campos, G., Barbosa Leite Cruz, C., Emerich Souza, P., Luísa Souza Simões, A., Breda, C., Cassimiro Brito, R., Bookhagen, B., Oliveira Sawakuchi, A., and Nascimento Pupim, F.: Sediment provenance and erosion rates in the Andes-Amazon fluvial system: a study using luminescence and cosmogenic nuclides technics, EGU General Assembly 2025, Vienna, Austria, 27 Apr–2 May 2025, EGU25-12755, https://doi.org/10.5194/egusphere-egu25-12755, 2025.

EGU25-12806 | Posters on site | CL5.1

Different 14C ages for various fractions of peat 

Irka Hajdas, Jochem Braakhekke, Giovanni Monegato, Franco Gianotti, Marcus Christl, and Susan Ivy Ochs

Since the 19th century, various authors have assigned the glacial landforms in the lower valleys of northern Italy to different ice ages (Penck and Brückner 1909). This study was part of a project that involved a broad geomorphological analysis and the first-time absolute in-situ exposure dating of erratic boulders using 10Be and 36Cl (Braakhekke et al. 2020). In addition to the cosmogenic analysis, seven radiocarbon samples were taken from a fluvial terrace outcropping 6 meters high along the Ticino River. Where possible, the samples were sieved to separate a bulk fraction (<125 μm) from the undefined organic fragments. Some samples were partly dissolved during the subsequent ABA preparation of all fractions. This way, we obtained up to four ages per initial sample: one each for the insoluble bulk fraction, the humic acid of the bulk, the organic fragments, and the humic acid of the organic fragments. The obtained radiocarbon ages vary significantly, with the extreme being thousands of 14C years between the insoluble bulk fraction and the organic fragments for the same sample. For all samples, radiocarbon analysis of the bulk fractions gave much younger ages than the hand-selected macro remains. Here, we discuss the age differences and possible sources of old and young carbon found in samples. The ages of the organic fragments showed the most consistency over the whole profile, and these fragments are least likely contaminated by younger material. Based on our results obtained on macro remains, this deposit is dated to MIS3 age. About 3 meters of fine-grained sediment were deposited here during ca. 8 ky. This could tell us more about the sediment budgets during some of the (Greenland) stadial-interstadial oscillations at the outlet of a major lake (e.g., Lake Maggiore) and the erosive power of glaciers during a phase preceding the global Last Glacial Maximum.

References

Braakhekke J, Ivy‐Ochs S, Monegato G, Gianotti F, Martin S, Casale S, and Christl M. 2020. Timing and flow pattern of the Orta glacier (European Alps) during the last glacial maximum. Boreas 49: 315-332.

Penck A, and Brückner E. 1909. "Die alpen im Eiszeitalter." Tauchnitz.

How to cite: Hajdas, I., Braakhekke, J., Monegato, G., Gianotti, F., Christl, M., and Ivy Ochs, S.: Different 14C ages for various fractions of peat, EGU General Assembly 2025, Vienna, Austria, 27 Apr–2 May 2025, EGU25-12806, https://doi.org/10.5194/egusphere-egu25-12806, 2025.

Anthropogenic carbonates such as lime mortars and plasters have been receiving growing attention as they are an invaluable source of information for archaeologists, conservators, and restorers of cultural heritage. Taking into account the production process, the age of mortars reflects the age of the building. Two physical dating methods currently enable us to date mortars: radiocarbon (14C) dating and optically stimulated luminescence (OSL). Fast development in 14C and OSL mortar dating naturally widens the scope of performed analysis, and promotes the search for different methods which may be applied to these materials. In this study we present the analysis of historical lime mortars in order to assess the possibility of future dating by Electron Spin Resonance (ESR) spectroscopy. ESR dating has been applied to various geological and archaeological materials, but there are virtually no examples of dating carbonates younger than 10 000 years. Since carbonate crystals are formed during the mortar production, this moment can be regarded as the zero point for the accumulation of trapped charges, and their concentration in a measured sample should reflect the age of the mortar.

Our previous works on samples from Sveta Petka church in Budinjak, Croatia, and an ancient settlement Hippos, Israel, show the growth of signals related to the paramagnetic centres with the dose of laboratory radiation. However, in order to obtain the age of the samples the natural material should exhibit measurable ESR signals of the centres suitable for dating. In the relatively young (as far as ESR dating is concerned) materials the signals are very weak, however detailed analyses showed presence of such signals in several investigated mortar samples. In this work we investigate ESR signals in natural and laboratory-irradiated carbonate lime binders from several different archaeological sites, with ages ranging from about 2000 to 500 years old. The samples have been previously dated by 14C method, which means they had undergone extensive characterisation and preparation, ensuring the selection of binder, which reflects the true age of the mortar. We analyse the spectra with the aid of ESR simulations in order to identify the paramagnetic centres present in the samples, and compare them to the centres commonly found in carbonates and used for ESR dating. The goal of this work is a qualitative analysis of the natural signals found in a variety of mortars, assessing their potential suitability for ESR dating. This study is a first part of the ongoing project focused on establishing ESR as a method of dating anthropogenic carbonates in a form of lime mortars, and comprises the preliminary analysis of the subject, which will be followed by future in-depth studies.

How to cite: Kabacińska, Z. and Michalska, D.: Towards Electron Spin Resonance dating of anthropogenic carbonates: ESR signals of 14C-dated historical lime mortars, EGU General Assembly 2025, Vienna, Austria, 27 Apr–2 May 2025, EGU25-13244, https://doi.org/10.5194/egusphere-egu25-13244, 2025.

EGU25-13277 | ECS | Posters on site | CL5.1

High resolution luminescence dating of the Khovaling Loess Plateau sites (Tajikistan) 

Natalia Taratunina, Jan-Pieter Buylaert, Amélie Challier, Andrew Murray, Peter Sosin, and Redzhep Kurbanov

We have studied the loess-palaeosol sequences of the Khovaling Loess Plateau in Tajikistan, which form the most complete record of subaerial sedimentation in Central Asia. Studied sections contain several layers with Early and Middle Palaeolithic tools, and therefore record some of the earliest events of hominin dispersal into Central Asia.

As part of a major NordForsk funded project ‘Timing and Ecology of the Human Occupation in Central Asia’ (THOCA; www.thoca.org), we applied high-resolution luminescence dating to the upper parts of three sections of Khovaling loess plateau (Khonako-II, Kuldara, and Obi-Mazar) in order to: (1) provide an independent timescale for palaeoclimatic studies; (2) assess the completeness of the sedimentary record; and (3) investigate the main stages of dust accumulation over this interval.

The luminescence chronology extends back to ~250 ka and reveals distinct erosional hiatuses ranging in duration from ~7 ka to a full glacial-interglacial cycle (~100 ka). Some of these breaks were not identifiable in the field. These discontinuities had not been previously recognized, potentially leading to significant errors in palaeosol identification and, consequently, in the presumed chronology. Now, we have a better understanding of the aeolian sedimentation in the region and the stages of loess/palaeosol formation. The new chronology provides a reliable correlation of regional features with global events and relates them to climate change, soil cover development, and the evolution of Early and Middle Paleolithic.

How to cite: Taratunina, N., Buylaert, J.-P., Challier, A., Murray, A., Sosin, P., and Kurbanov, R.: High resolution luminescence dating of the Khovaling Loess Plateau sites (Tajikistan), EGU General Assembly 2025, Vienna, Austria, 27 Apr–2 May 2025, EGU25-13277, https://doi.org/10.5194/egusphere-egu25-13277, 2025.

EGU25-14514 | Orals | CL5.1

“Ice carbon” as a possible source of apparent age in paleosol dating 

Elya Zazovskaya, Nikita Mergelov, Andrey Dolgikh, Sofiia Turchinskaia, Alexandr Dobryanskiy, and Maria Bronnikova

Surface and buried paleosols are a significant archive of information about environmental change and are widely used in paleogeographic reconstructions. Soil features and their profiles change over time as a result of environmental change. The soil memory is the palimpsest-like, as opposed to the book-like, sedimentary record (Targulian and Goryachkin, 2004). The palimpsest-like memory of the soil requires informed and well-adapted strategies for deciphering and interpreting the information it contains. The question of soil age and its synchronization with reconstructed events remains one of the most controversial issues in paleosol interpretations. The complexity of the interpretation of obtained radiocarbon dates is related to the heterogeneous and heterochronous of soil organic matter (SOM). At present, there are many approaches to dating SOM, but for the paleosol for paleogeographic reconstructions, 14C dating is most often performed on total organic carbon (bulk carbon). This choice of dating fraction is usually related to the poor preservation of SOM and its low carbon concentration in paleosols. Dates obtained for SOM in buried soils are based on the assumption that SOM was formed "in situ". However, due to various natural processes, paleosols can contain carbon from a number of potential sources.
For buried soils formed in periglacial landscapes, a significant source of carbon is the supraglacial material: cryoconites and other organo-mineral formations that form on the surface and in the body of the glacier and enter the landscape during glacial melting. Our studies on glaciers and in periglacial landscapes of different natural zones (Svalbard, Franz Josef Land Archipelago, Polar Urals, Altai, Kamchatka) have shown that supraglacial material can have a radiocarbon age ranging from modern to very ancient (several thousand, sometimes tens of thousands of years). The largest dataset we have obtained for supraglacial objects is represented by carbon pools aged 1000 to 10,000 radiocarbon years, BP and >10,000 radiocarbon years, BP. The pool with an age of >10,000 radiocarbon years is associated with the presence of a "dead carbon" source near the studied glacier. Dates in the range of 10,000-20,000 radiocarbon years may also reflect the age of soils and sediments formed during the last deglaciation and buried within the body of the glacier as it advanced. Soils formed in the periglacial zone inherit the isotopic composition of SOM from supraglacial material and become carriers of "apparent" / inherited 14C age. The presence of cryoconite material in buried paleosols can be diagnosed by studying their micromorphology and identifying morphological structures characteristic of cryoconites. We have shown this for soils formed on cryoconite material in Svalbard and for lenses of buried fine-grained material in marginal glacial formations (Keiva) on the Koly Peninsula.  When 14C dating paleosol series (traditional paleoarchives are studied in foothills and mountainous areas), it is necessary to consider the ice-carbon contribution to SOM in order to make correct paleo-reconstruction.

How to cite: Zazovskaya, E., Mergelov, N., Dolgikh, A., Turchinskaia, S., Dobryanskiy, A., and Bronnikova, M.: “Ice carbon” as a possible source of apparent age in paleosol dating, EGU General Assembly 2025, Vienna, Austria, 27 Apr–2 May 2025, EGU25-14514, https://doi.org/10.5194/egusphere-egu25-14514, 2025.

EGU25-15342 | ECS | Orals | CL5.1

Performance of SAR-SGC method for equivalent dose determination of quartz OSL 

Xiaojun Zhou, Yuexin Liu, Xinqi Feng, and Zhongping Lai

Abstract: The SAR-SGC method, integrating single aliquot regenerative (SAR) and standardised growth curve (SGC) protocols with advantages of saving machine measurement time. It has gained widespread application in recent years over diverse sediment types, including glacial, aeolian, fluvial, lacustrine, deltaic, and marine sediments. The method constructs inter-aliquot SGCs using conventional SAR measurements and determines SGC Des by inserting the LN/TN values of additional aliquots into the SGC. The final SAR-SGC De is obtained by calculating the arithmetic mean of the SAR Des and SGC Des. However, the optimal number of SAR and SGC aliquots for reducing machine time while retaining precision, is still ambiguous. To address this issue, we systematically investigated how varying the number of SAR aliquots and additional LN/TN​ measurements influences the stability and consistency of equivalent dose derived from SAR-SGC method with SAR protocol. We examined the minimal SAR-SGC combinations for three samples (JNZK01-G09, MW10-G16 and XBG06-G07, with an equivalent dose of ~44 Gy (with largest scatter in inter-aliquot SAR growth curves), ~46Gy and ~55Gy (with marginal scatter in inter-aliquot SAR growth curves) in the lower Yellow River plain, utilizing a Risø TL/OSL-DA-20 reader with a 90Sr/90Y beta source. Through extensive statistical evaluations, SAR-SGC estimation of the equivalent dose obtained with differing aliquot combinations shows that equivalent dose could be accurately estimated within acceptable uncertainty (<10%) using 6–15 SAR aliquots and additional 12–30 LN/TN aliquots. For samples with dispersed growth curves, we recommend a minimum of 6 SAR and 12 LN/TN aliquots for reliable age determination. And samples with concentrated growth curves may suffice with 4 SAR and 10 LN/TN aliquots. This study demonstrates that the combined SAR-SGC method significantly reduces machine time (at least 70%) compared to the SAR protocol alone while maintaining acceptable precision. These findings provide valuable guidance for luminescence dating laboratories and researchers in optimizing instrument usage under time constraints.

Key words: SAR-SGC method; Standardized growth curve; Single aliquot regenerative protocol; Equivalent dose; Luminescence dating; Statistical analysis; Machine time optimization

How to cite: Zhou, X., Liu, Y., Feng, X., and Lai, Z.: Performance of SAR-SGC method for equivalent dose determination of quartz OSL, EGU General Assembly 2025, Vienna, Austria, 27 Apr–2 May 2025, EGU25-15342, https://doi.org/10.5194/egusphere-egu25-15342, 2025.

EGU25-19154 | ECS | Posters on site | CL5.1

A way to date stone fish weirs ? Some perspectives. 

Arthur Jumaucourt, Guillaume Guérin, Daniel Le Bris, Pierre Stephan, Iness Bernier, and Yvan Pailler

Stone fish traps and weirs are the most common archaeological remains in fluvial and coastal environments. In Brittany, almost 800 of them were identified by Daire and Langouët (2014). Usually, these are made of numerous erected stones, that more or less precisely outline an alignment. Dating these remains represents a real archaeological issue, since stone fish traps have been raised for millennia, presumably from the early Neolithic to the Middle Ages. However, it is also a challenge as there is no organic matter preserved in the core of these structures.


In this presentation, we assess the age of fish weirs found in Brittany by comparing their altitude with the sea-level rise estimation curve since the last glaciation 20 000 years ago. A software named CHRONOE was developed in R in order to improve the reliability of the data, among which tidal curves (García-Artola et al. 2018). Statistical analysis – using the R package ArchaeoPhases (Philippe and Vibet 2020) – of the ages determined by CHRONOE for a corpus of    diverse stone fishing weirs, identifies periods of intensification and rarefaction of fishing using such structures. Thus, it is possible to discuss the evolution of fishing practices in human societies along the coasts of Brittany.


This work is the first step of a PhD Thesis; it will be followed by direct dating of stone fish traps. Indeed, rock surface luminescence dating \autocite{soh12} has been shown to reliably estimate the last time a rock surface was exposed to light (Sohbati et al. 2012) has been shown to reliably estimate the last time a rock surface was exposed to light (Freiesleben et al. 2015). Therefore, it will be applied to a few of these structures, after careful selection based on their presumed age. The bottom surface of sampled rocks from fish weirs will be sampled for OSL intensity profiling and burial dating. The numerical absolute ages given by obtained with OSL will then be compared to those assessed with CHRONOE, to discuss the reliability of the underlying assumptions and refine the model. Eventually, CHRONOE may hold the potential to date any submerged object whose utility (or existence) is linked with the intertidal zone.

Keywords : geochronology, OSL, archaeology, fish weirs.


References

Daire, M.-Y., & Langouët, L. (2014). Se nourrir le long des côtes bretonnes : Réflexions à partir d'une analyse diachronique des barrages de pêcheries. Actes des congrès nationaux des sociétés historiques et scientifiques, 138 (2), 105133.

Freiesleben, T., et al. (2015). Mathematical model quantifies multiple daylight exposure and burial events for rock surfaces using luminescence dating. Radiation Measurements, 81, 1622.

García-Artola, A., et al. (2018). Holocene sea-level database from the atlantic coast of europe. Quaternary Science Reviews, 196, 177192.

Philippe, A., & Vibet, M.-A. (2020). Analysis of archaeological phases using the R package ArchaeoPhases. Journal of Statistical Software, 93, 125.

Sohbati, R., et al. (2012). Optically stimulated luminescence (OSL) as a chronometer for surface exposure dating. Journal of Geophysical Research: Solid Earth, 117, 2012JB009383.

How to cite: Jumaucourt, A., Guérin, G., Le Bris, D., Stephan, P., Bernier, I., and Pailler, Y.: A way to date stone fish weirs ? Some perspectives., EGU General Assembly 2025, Vienna, Austria, 27 Apr–2 May 2025, EGU25-19154, https://doi.org/10.5194/egusphere-egu25-19154, 2025.

EGU25-21256 | ECS | Posters on site | CL5.1

Applying portable OSL to obtain a detailed chronology of littoral sedimentary sequences from the northern shore of Lake Schweriner See, Germany 

Maksim Ruchkin, Sebastian Lorenz, Marie-Luise Adolph, and Torsten Haberzettl

Holocene sedimentary sequences lacking organic remnants or containing redeposited organic material pose a challenge for detailed chronological investigations, as radiocarbon dating is unsuitable. Optically stimulated luminescence (OSL) can be used instead, but high-resolution OSL is costly. A more cost-effective and efficient approach involves the combination of low-resolution OSL dating with portable OSL (pOSL) profiling in 5–10 cm increments (e.g. Sanderson and Murphy, 2010; Brill et al. 2016). This method has been employed in the analysis of cored lacustrine sedimentary sequences from the northern shore of Lake Schweriner See, Germany.

In well-bleached Holocene sediments, quartz equivalent doses and portable post-infrared blue-light stimulated luminescence signals (further pOSL) from the polymineral fraction are linearly correlated (e.g. Brill et al., 2016). We used the obtained linear functions to estimate equivalent doses (Des) in quartz for each pOSL signal. The dose rates were then interpolated between full OSL samples, and the ages were calculated by dividing the Des by the corresponding dose rates. Finally, both the quartz full OSL ages and the ages derived from the pOSL signals were incorporated into a Bayesian age-depth model to obtain a continuous chronology.

The pOSL-to-De ratio is also a useful tool in the identification of incompletely bleached samples. Poorly bleached sediments exhibit a higher pOSL-to-De ratio in comparison to well bleached sediments because pOSL is a composite of signals from quartz and feldspars, which require a greater exposure time for complete bleaching than OSL from pure quartz (e.g. Murray et al., 2012). In the littoral sequences studied, elevated pOSL-to-De ratios were found to correspond with high quartz Deoverdispersion (OD), which is another indicator of poor bleaching. One particular sample was observed to exhibit a high pOSL-to-De ratio yet low OD (15%), which may be attributed to distinct OSL sensitivity linked to a specific sediment source.

Our results demonstrate that the proposed approach suits littoral sediments and improves chronological frameworks for lacustrine sequences. A potential avenue for further refinement of age-depth models lies in the measurement of dose rates for all pOSL samples, as opposed to their estimation through interpolation.

References

Brill, D., Jankaew, K., & Brückner, H. (2016). Towards increasing the spatial resolution of luminescence chronologies – Portable luminescence reader measurements and standardized growth curves applied to a beach-ridge plain (Phra Thong, Thailand). Quaternary Geochronology, 36, 134–147.

Murray, A. S., Thomsen, K. J., Masuda, N., Buylaert, J.-P., & Jain, M. (2012). Identifying well-bleached quartz using the different bleaching rates of quartz and feldspar luminescence signals. Radiation Measurements, 47(9), 688–695.

Sanderson, D. C. W., & Murphy, S. (2010). Using simple portable OSL measurements and laboratory characterisation to help understand complex and heterogeneous sediment sequences for luminescence dating. Quaternary Geochronology, 5(2–3), 299–305.

How to cite: Ruchkin, M., Lorenz, S., Adolph, M.-L., and Haberzettl, T.: Applying portable OSL to obtain a detailed chronology of littoral sedimentary sequences from the northern shore of Lake Schweriner See, Germany, EGU General Assembly 2025, Vienna, Austria, 27 Apr–2 May 2025, EGU25-21256, https://doi.org/10.5194/egusphere-egu25-21256, 2025.

As the terminal zone for marine sulfate reduction, the sulfate-methane transition zone (SMTZ) facilitates anaerobic oxidation of methane coupled with sulfate reduction (AOM-SR), integrating the biogeochemical cycles of carbon and sulfur. This process indirectly influences the redox balance of surface geological environments. To investigate the biogeochemical characteristics within paleo-SMTZs, we examined two representative nodules from the Early Silurian, South China. The diagenetic barite and 34S-enriched euhedral pyrite within these nodules indicate a close association with SMTZ. The sedimentary microtextural evidence of the authigenic growth sequence of framboidal pyrite and pronounced heterogeneity δ34Spyr suggests a multi-stage genesis of nodules. In Type-1 nodules, δ34Spyr at the edges are as low as 8.6‰. significantly less than the 18.8‰ observed at the centers. At the grain scale, the δ34S within individual pyrite grain ranges from -1.9‰ to 29.1‰. We propose that the formation of Type-1 nodules occurred in three stages: (1) nodule embryos with 34S-depleted pyrite edges formed in the sulfate reduction zone based on a diffusion-precipitation model; (2) within the SMTZ, barite dissolution and reprecipitation promote nodule growth, forming 34S-enriched euhedral pyrite and causing strong heterogeneity in the sulfur isotope distribution within some pyrite grains.; and (3) below the SMTZ, sulfate depletion leads to extensive replacement of barite by other minerals. The pronounced concentric structure in Type-2 nodules indicates multiple formation episodes; the initial stage aligns with that of Type-1 nodules, while needle-shaped minerals at the edges formed in response to vertical spatial shifts within SMTZ. Additionally, calcite, typically associated with SMTZs, is notably rare within these nodules. Instead, quartz replaces calcite as the nodule matrix and commonly undergoes pseudomorphic replacement of barite. We suggest that the substantial enrichment of quartz over calcite within nodules results from microbial activity altering pore water pH and alkalinity, serving as a petrographic fingerprint of organoclastic sulfate reduction within paleo-SMTZs.

How to cite: Tang, Q., Liang, C., Ji, S., Cao, Y., and Liu, K.: Lithofacies and in-situ sulfur isotope characteristics of nodules across the Ordovician-Silurian boundary marine shale in South China: Indicative significance for sedimentary environment, EGU General Assembly 2025, Vienna, Austria, 27 Apr–2 May 2025, EGU25-107, https://doi.org/10.5194/egusphere-egu25-107, 2025.

EGU25-116 | ECS | Posters on site | CL1.1.1

Lower CO2 consumption from chemical weathering during warmer climates in North New Guinea 

Yifan Du and Peter D. Clift

New Guinea represents an important potential influence over the consumption of atmospheric CO2 and global climate because of its large size, rapid erosion and strongly mafic composition. A new sediment record documenting erosion in northern New Guinea since 350 ka shows that stronger rain during interglacial times erodes more accreted continental crust than mafic arc crust. Although sediment is altered more during interglacials, this change in provenance results in a greater impact on the amount of CO2 consumed per unit weight. Thus silicate weathering is less efficient at removing CO2 when global climate is warmer, leaving more greenhouse gas in the atmosphere. New Guinea’s climatically modulated erosion thus acts as an amplifier of global climate variations on orbital timescales.

How to cite: Du, Y. and Clift, P. D.: Lower CO2 consumption from chemical weathering during warmer climates in North New Guinea, EGU General Assembly 2025, Vienna, Austria, 27 Apr–2 May 2025, EGU25-116, https://doi.org/10.5194/egusphere-egu25-116, 2025.

EGU25-1205 | ECS | Posters on site | CL1.1.1

Orbitally-paced climate change and organic carbon burial during the late Ordovician-early Silurian 

Jixuan Wang, Guanghui Yuan, Zhonggui Hu, Jiuzhen Hu, and Quansheng Cai

Climate change and organic carbon burial events in the Late Ordovician-Early Silurian are well-documented, yet the mechanisms driving these events remain debated. Through high-resolution gamma-ray logging (GR) and trace element records, we establish a 12.6 Myr astronomical timescale for the Late Ordovician-Early Silurian Wufeng-Longmaxi Formation in the Sichuan Basin. Million-year-scale sea level fluctuations are reconstructed by modeling sedimentary noise in the 405 kyr-tuned GR series. Energy decomposition analysis of astronomical orbital parameters suggests that changes in land-sea water exchange, driven by enhanced tropical water vapor and heat within a ~2.1 Myr eccentricity-modulated gyre, likely served as the primary driver of seawater deposition. Maxima in total organic carbon coincides with peaks in the long-term 1.1 Myr obliquity modulation cycle, with the long-term 2.1 Myr eccentricity cycle occurring at a maximum or minimum. This long-term trajectory may have driven carbon cycle perturbations and differential organic matter enrichment by influencing various climate-related factors. During the Late Ordovician-Early Silurian, a new resonance state emerged, characterized by ~2.1 Myr eccentricity and ~1.1–1.0 Myr inclination, likely associated with long-term Earth-Mars resonance and potentially constraining the chaotic evolution of the solar system over geological timescales.

How to cite: Wang, J., Yuan, G., Hu, Z., Hu, J., and Cai, Q.: Orbitally-paced climate change and organic carbon burial during the late Ordovician-early Silurian, EGU General Assembly 2025, Vienna, Austria, 27 Apr–2 May 2025, EGU25-1205, https://doi.org/10.5194/egusphere-egu25-1205, 2025.

EGU25-1207 | ECS | Posters on site | CL1.1.1

Evidence for the enhancement of east–west climatic contrast in northern China under past global warming: paleovegetation records and numerical simulations 

Xiaofang Huang, Shiling Yang, Wenying Jiang, Minghu Ding, Yongda Wang, Minmin Sun, and Shihao Zhang

The response of vegetation to past global warming, as revealed by geological records, can provide insights into future changes. We used pollen records to reconstruct spatial changes in the boundary between steppe and forest/forest-steppe for the Last Glacial Maximum (LGM), mid-Holocene, Last Interglacial (LIG), and mid-Pliocene, representing major changes in global temperature. The results showed that in the region east of 110° E, the trend of the boundary between steppe and forest/forest-steppe rotated anticlockwise by around 30°, 5° and 10°, during the warm periods of the mid-Holocene, LIG, and mid-Pliocene, relative to the LGM, mid-Holocene, and LIG, respectively. However, in the region west of 110° E, the boundary remained stationary during the mid-Holocene compared with the LGM, while it shifted northward during the LIG relative to the mid-Holocene, and it shifted southward during the mid-Pliocene relative to the LIG. Overall, our results indicate an enhanced east-west climatic contrast in northern China under past global warming. Climate simulation results showed that the warming-induced northward shift and westward extension of the western Pacific subtropical high promoted the northwestward displacement of the East-Asian monsoon rainfall belt. This suggests that in the future, under a warmer climate, the eastern region of northern China will become wetter, and that the extent of sandy desert will decrease. 

How to cite: Huang, X., Yang, S., Jiang, W., Ding, M., Wang, Y., Sun, M., and Zhang, S.: Evidence for the enhancement of east–west climatic contrast in northern China under past global warming: paleovegetation records and numerical simulations, EGU General Assembly 2025, Vienna, Austria, 27 Apr–2 May 2025, EGU25-1207, https://doi.org/10.5194/egusphere-egu25-1207, 2025.

EGU25-1269 | ECS | Orals | CL1.1.1

 The late Eocene rise of eastern Tibet and its impact on climate and biodiversity  

Zhongyu Xiong, Lin Ding, Alexander Farnsworth, Chenyuan Zhao, and Xiaolong Tian

The rise of the Tibet Plateau played a significant role in Asian climate evolution, especially the eastern Tibet which forms the transitional area where the South Asian Monsoon and East Asian Monsoon systems interact, and the formation of modern high-relief topography of eastern Tibet potentially makes its the cradle of Hengduan Mountain biodiversity hotspot.

We reconstruct the uplifting history of the eastern Tibet in three Cenozoic basins, including Gonjo, Relu and Markam basins based on multiple proxies. These basins are NW-SE directed basins with an elevation of ~4000 m at present. Today, the climate in these basins is semi-humid monsoonal with a mean annual air temperature of 0-5 ℃ and annual precipitation of 400-600 mm/yr. Aeolian deposits are pervasively developed at the bottom of the eastern Tibet Cenozoic basins before early Eocene (>50 Ma), especially in the Gonjo and Relu basins. Fluvial and lacustrine strata were deposited in the middle part of Gonjo Basin and the lower part of Relu Basin (50-45 Ma). Large number of lacustrine sediments (45-34 Ma) exists in the middle of the Relu Basin and the top of the Markam Basin. Oxygen and clumped isotopes from the Gonjo Basin suggested an earlier uplift from 0.7 km to 3.8 km during the middle Eocene (50-40 Ma; Xiong et al., 2020). The CLAMP and clumped isotope results for the Relu Basin indicated a rise in elevation from 0.6 km to 3.7 km between 45 to 34 Ma (He et al., 2022). The Markam Basin remained at a moderate elevation of 2.6 km between 42 to 39 Ma, then rose rapidly to 3.8 km by 36 Ma as indicated by CLAMP and oxygen isotope paleoaltimetry (Zhao et al., 2023). Combined with published paleoelevation results, the elevational history of eastern Tibet revealed as: During the early Eocene, it remained as lowland, and then underwent moderate to quick rise in the middle Eocene, approached to near present elevations by the latest Eocene of ~35 Ma.

The rise of the eastern Tibet during warm-house period significantly changed the climate as well as the biodiversity within and around Tibet. Before the rise of eastern Tibet, the climate was dry with typical intermountain desert system. Accompany with the rise of eastern Tibet, a Mediterranean climate developed in eastern Tibet characterized by bi-modal precipitation with two peaks during the spring (MAM) and autumn (SON) seasons, and a lower precipitation in the summer (JJA) seasons (He et al., 2022; Chen et al., 2023). Another line of evidence that supports the Mediterranean-like climate comes from the plant fossils. A typical semi-arid or arid flora that includes Palm, Eucalyptus, Palibinia and Quercus shows some similarity to Mediterranean vegetation. This flora co-evolved with the rise of eastern Tibet in the Relu and Markam basins, and even dispersed to the southeastern China. The high-relief topography, coupled with this distinctive Mediterranean climate system, significantly contributes to the development of the highly diversified species.

How to cite: Xiong, Z., Ding, L., Farnsworth, A., Zhao, C., and Tian, X.:  The late Eocene rise of eastern Tibet and its impact on climate and biodiversity , EGU General Assembly 2025, Vienna, Austria, 27 Apr–2 May 2025, EGU25-1269, https://doi.org/10.5194/egusphere-egu25-1269, 2025.

EGU25-1919 | ECS | Posters on site | CL1.1.1

CRETACEOUS OCEAN RED BEDS (CORBe) AND OXYGENATION: UNVEILING THE UPPER APTIAN AND UPPER ALBIAN PALEOCLIMATE AND PALEOCEANOGRAPHY 

Stephanie Leone, Manoel Damaceno, Martino Giorgioni, and Luigi Jovane

Cretaceous Oceanic Red Beds (CORBs) represent important archives of paleoceanographic and paleoclimatic conditions during Earth’s greenhouse intervals. In this study, we focus on Upper Aptian and Upper Albian CORBs from the Trento Plateau (Southern Alps, NE Italy), integrating geochemical (ICP-OES, ICP-MS), rare earth element (REE), and thermomagnetic analyses to elucidate local and global factors controlling their deposition. Aptian CORBs exhibit higher and more variable oxygenation, favoring hematite formation and enrichment in light rare earth elements (LREEs), whereas Albian CORBs reflect slightly lower O2 levels and greater climatic stability. The absence of redox-sensitive elements such as Mo and Cr confirms that anoxia was not a limiting factor in either interval. Thermomagnetic data reveal incomplete magnetite oxidation in both Aptian and Albian samples, indicative of reduced oxygen availability during deposition. These depositional differences are linked to local tectonic subsidence of the Trento Plateau, which influenced sedimentation rates, as well as global climatic shifts following major Oceanic Anoxic Events (OAEs). Our multi-proxy approach highlights that, despite contrasting oxygenation histories, both intervals maintained sufficiently oxic bottom waters—whether through higher dissolved O2 or lower sedimentation rates—to enable the formation of CORBs. Our findings advance the understanding of mid-Cretaceous paleoceanography, demonstrating that CORBs can form under varying yet consistently oxic conditions, shaped by the interplay of tectonics, sediment supply, and climate feedbacks.


How to cite: Leone, S., Damaceno, M., Giorgioni, M., and Jovane, L.: CRETACEOUS OCEAN RED BEDS (CORBe) AND OXYGENATION: UNVEILING THE UPPER APTIAN AND UPPER ALBIAN PALEOCLIMATE AND PALEOCEANOGRAPHY, EGU General Assembly 2025, Vienna, Austria, 27 Apr–2 May 2025, EGU25-1919, https://doi.org/10.5194/egusphere-egu25-1919, 2025.

EGU25-2832 | ECS | Posters on site | CL1.1.1

Paleogeography and boundary condition sensitivities in mid-Miocene climate simulations with CESM1.2 

Martin Renoult and Agatha de Boer

The Langhian (15.98–13.82 Ma) was a stage of the mid-Miocene characterized by atmospheric CO2 levels higher than those of the present day and significantly warmer surface temperatures. Growing interest in the mid-Miocene arises from its potential as an analog for future climate scenarios. In this study, we conducted Langhian simulations using the climate model CESM1.2 and a new and unpublished geography, comparing them to simulations submitted for the Miocene Modeling Intercomparison Project Phase 1 (MioMIP), which utilizes the geography of Burls et al. (2021). The global mean surface temperature anomaly is similar for both geographies, averaging +5.5°C relative to pre-industrial levels, but exhibits strong local differences due to variations in ice sheets, topography, and bathymetry. A notable feature of our simulations is significant cooling in the northern Atlantic Ocean, driven by a collapse of the Atlantic meridional overturning circulation. Conversely, a strong Pacific meridional overturning circulation emerges, a phenomenon less commonly observed in other Miocene simulations. We further explore the sensitivity of the Langhian climate by varying CO2 concentrations, removing the Antarctic ice sheet, adjusting cloud parametrization, and incorporating dynamic vegetation. This study reveals a wide range of climate responses, emphasizing the critical influence of geography and other uncertain boundary conditions in achieving realistic Miocene climate simulations and improving data-model comparisons.

How to cite: Renoult, M. and de Boer, A.: Paleogeography and boundary condition sensitivities in mid-Miocene climate simulations with CESM1.2, EGU General Assembly 2025, Vienna, Austria, 27 Apr–2 May 2025, EGU25-2832, https://doi.org/10.5194/egusphere-egu25-2832, 2025.

EGU25-3420 | ECS | Posters on site | CL1.1.1

Elucidating the mechanisms of 400-kyr tropical hydroclimate variability during the Plio-Pleistocene 

Jyoti Jadhav, Axel Timmermann, Nitesh Sinha, and Kyung-Sook Yun

The control of the eccentricity on annual mean insolation is minimal. Yet, substantial variability in eccentricity timescales, especially the 400-kyr cycle, has been observed in tropical hydroclimate records. As suggested, this variability may have been significantly driven by long-term carbon cycle changes during the Plio-Pleistocene.

We present results from well-dated high-resolution paleoclimate proxies during the Plio-Pleistocene and an unprecedented transient climate simulation conducted with NCAR’s realistic Community Earth System Model version 1.2; the latter covers the climate history of the past 3Myr. The analyses of existing carbon isotope records (i.e., planktic and benthic δ13C) from deep marine sediment cores and other paleoclimatic (terrigenous dust flux) archives from the tropical ocean during the Pliocene and early Pleistocene (>1.5 Myr) reveal clear 400-kyr climate signals, suggesting eccentricity-paced changes in the long-term carbon cycle. Our model simulates 400-kyr variability in tropical hydroclimate. However, the climatic control on the robust feature of the carbon cycle (i.e., the 400-kyr oscillation) and its role and dynamics during the Plio-Pleistocene needs to be better understood. Our study investigates the interaction processes between various paleoenvironmental records and further focuses on different hypotheses following the antiphase relation of marine δ13C with the eccentricity cycle. First, we provide a combined perspective on the role of atmospheric circulation and, thus, dust in the dynamic of the carbon cycle and productivity. Also, come up with causes and links with the pacing of the carbon cycle and the ocean’s role. Second, assess the ecosystem response (vegetation) to changes in precipitation in connection with changes in atmospheric CO2.

How to cite: Jadhav, J., Timmermann, A., Sinha, N., and Yun, K.-S.: Elucidating the mechanisms of 400-kyr tropical hydroclimate variability during the Plio-Pleistocene, EGU General Assembly 2025, Vienna, Austria, 27 Apr–2 May 2025, EGU25-3420, https://doi.org/10.5194/egusphere-egu25-3420, 2025.

EGU25-4630 | ECS | Orals | CL1.1.1

Hydroclimatic change at the immediate start of the Carnian Pluvial Episode (Late Triassic) 

Yizhou Huang, Jacopo Dal Corso, Piero Gianolla, Daniel Lunt, Alexander Farnsworth, Guido Roghi, Yuhang Wang, David Naafs, Xinyue Dang, Michael Benton, and Richard Pancost

The Carnian Pluvial Episode was marked by episodic climate perturbations and multiple negative carbon isotope excursions (NCIEs) in (in)organic carbon. Its onset (NCIE-1) corresponds to an extended period of climate disruption, including global warming and an intensified hydrological cycle, as evidenced by increased siliciclastic inputs into marine basins and hygrophytic palynological assemblages. To investigate climatic/biotic changes of NCIE-1, we analyzed plant, algal, and bacterial lipid biomarkers and δ2H of leaf-wax n-alkanes from the Dolomites (Italy) in northwestern Tethys. Coeval δ2H reductions in n-alkanes by up to ca. 40‰ align with NCIE-1, indicating increased rainfall and altered hydroclimate in this initial carbon cycle perturbation. Concurrently, elevated biomarker concentrations reveal enhanced terrestrial inputs and marine primary production, with shifts in land plant communities via n-alkane distributions and alterations in marine algal communities by sterane assemblages. The biomarker dataset emphasizes the immediate impact of the NCIE-1 on both the terrestrial and marine ecosystems. Such a hydroclimate-biotic change in Dolomites suggests a complicated interaction amongst carbon and hydrological cycle via atmospheric-ocean dynamics during Carnian urgent to be investigated.

How to cite: Huang, Y., Dal Corso, J., Gianolla, P., Lunt, D., Farnsworth, A., Roghi, G., Wang, Y., Naafs, D., Dang, X., Benton, M., and Pancost, R.: Hydroclimatic change at the immediate start of the Carnian Pluvial Episode (Late Triassic), EGU General Assembly 2025, Vienna, Austria, 27 Apr–2 May 2025, EGU25-4630, https://doi.org/10.5194/egusphere-egu25-4630, 2025.

EGU25-4792 | Orals | CL1.1.1

Persistently active El Niño–Southern Oscillation since the Mesozoic 

Yongyun Hu, Xiang Li, Shineng Hu, and Wenju Cai

 The El Niño–Southern Oscillation (ENSO), originating in the central and eastern equatorial Pacific, is a defining mode of interannual climate variability with profound impact on global climate and ecosystems. However, an understanding of how the ENSO might have evolved over geological timescales is still lacking, despite a well-accepted recognition that such an understanding has direct implications for constraining human-induced future ENSO changes. Here, using climate simulations, we show that ENSO has been a leading mode of tropical sea surface temperature (SST) variability in the past 250 My but with substantial variations in amplitude across geological periods. We show this result by performing and analyzing a series of coupled time-slice climate simulations forced by paleogeography, atmospheric CO2 concentrations, and solar radiation for the past 250 My, in 10-My intervals. The variations in ENSO amplitude across geological periods are little related to mean equatorial zonal SST gradient or global mean surface temperature of the respective periods but are primarily determined by interperiod difference in the background thermocline depth, according to a linear stability analysis. In addition, variations in atmospheric noise serve as an independent contributing factor to ENSO variations across intergeological periods. The two factors together explain about 76% of the interperiod variations in ENSO amplitude over the past 250 My. Our findings support the importance of changing ocean vertical thermal structure and atmospheric noise in influencing projected future ENSO change and its uncertainty.

How to cite: Hu, Y., Li, X., Hu, S., and Cai, W.: Persistently active El Niño–Southern Oscillation since the Mesozoic, EGU General Assembly 2025, Vienna, Austria, 27 Apr–2 May 2025, EGU25-4792, https://doi.org/10.5194/egusphere-egu25-4792, 2025.

EGU25-5667 | Orals | CL1.1.1

High-resolution records of the mid-Pleistocene Transition in pelagic sediments of the western Pacific 

Haifeng Wang, Liang Yi, Yong Yang, and Gaowen He

The Mid-Pleistocene Transition (MPT), which occurred approximately 1.25 to 0.85 million years ago, marks a critical geological period characterized by a shift in Earth's glacial cycles from a roughly 41 kyr periodicity to a 100 kyr periodicity. However, the stratigraphic framework is constrained by low sedimentation rates, the absence of high-resolution isotope stratigraphy, and low-resolution or absent biostratigraphic control. In this study, we examined four piston cores collected from the western-central Pacific to more accurately determine the geochronology of the surficial sediments in the deep sea. Through integrated magnetostratigraphy, a proposed chronology since the Pliocene was established, and astronomical tuning was also conducted in one of the four cores. In conjunction with XRF scanning, the geochemical properties were studied to reveal regional changes since the MPT. Our findings indicate the following paleoceanographic evolution: concurrent with global cooling and aridification in Asia, there has been an increase in wind and dust flux in the western Pacific, an enhancement in biological productivity, and a reduction in the degree of seabed redox post the MPT. Additionally, we also found that throughout the MPT (approximately 1.2 to 0.7 Ma), the deep-sea paleoceanographic environment of the Western Pacific has maintained relative stability.

How to cite: Wang, H., Yi, L., Yang, Y., and He, G.: High-resolution records of the mid-Pleistocene Transition in pelagic sediments of the western Pacific, EGU General Assembly 2025, Vienna, Austria, 27 Apr–2 May 2025, EGU25-5667, https://doi.org/10.5194/egusphere-egu25-5667, 2025.

EGU25-5818 | ECS | Orals | CL1.1.1

Late Paleozoic climate transition from a long-term climate modelling perspective  

Chloé Marcilly, Trond H. Torsvik, and Morgan T. Jones

The Late Paleozoic Ice Age (LPIA) represents Earth's longest icehouse period in the Phanerozoic and the only recorded greenhouse–icehouse–greenhouse cycle on a vegetated Earth. Sedimentary archives provide evidence of glaciation events, but the mechanisms driving the LPIA's onset (~330 Ma) and end (~260 Ma) remain debated. Here we investigate the climatic transitions associated with the LPIA using both non-dimensional (COPSE) and spatially resolved climate models, emphasizing the interplay between paleogeography, silicate weathering, and solid Earth degassing. By integrating new paleogeographic reconstructions constrained by fossil and lithological climatic paleo-indicators, we identify high-weatherability zones and assess their evolving influence on carbon fluxes. Additionally, the Variscan orogeny's role is examined to evaluate how physical erosion enhances chemical weathering and CO₂ drawdown.

Simulations highlight that maintaining icehouse conditions required not only a decrease in solid Earth degassing but also an enhancement in silicate weathering driven by the combined effects of increased topography and runoff. These processes amplified the consumption of CO2, supporting the initiation of a widespread glaciation. In contrast, the transition back to greenhouse conditions appears driven by a progressive decrease in exposed land for high intensity weathering. Climate sensitivity played a significant role in modulating these transitions, and model adjustments to this parameter improved alignment with CO₂ proxy data.

Our findings provide new insights into the interactions between tectonics, paleogeography, and biogeochemical processes in shaping Earth's climatic history. By leveraging geological evidence to refine long-term carbon cycle models, this work underscores the critical importance of accurately representing the paleogeography to understand ancient climate transitions and inform projections of future climate change.

How to cite: Marcilly, C., Torsvik, T. H., and Jones, M. T.: Late Paleozoic climate transition from a long-term climate modelling perspective , EGU General Assembly 2025, Vienna, Austria, 27 Apr–2 May 2025, EGU25-5818, https://doi.org/10.5194/egusphere-egu25-5818, 2025.

EGU25-5831 | Orals | CL1.1.1 | Highlight

Carbon-cycle modelling and Phanerozoic climate change 

Trond Torsvik, Dana Royer, Chloe Marcilly, and Stephanie Werner

Greenhouse gases trap heat in the Earth’s atmosphere and warm our planet and on geological time-scales CO2 is the most influential greenhouse gas in modulating atmospheric temperature. During most of the Phanerozoic (past 540 million years), our planet was warmer than today, and a greenhouse-dominated climate (80%) was only interrupted by three periods of cold glacial conditions during the end-Ordovician (Hirnantian) glaciation, the Permo-Carboniferous (~330-260 Ma) and the second half of the Cenozoic (34-0 Ma). Icehouses are characterized by lower CO2 concentrations and temperatures, and a modern CO2 threshold for continental-scale glacial inception is estimated to 500 ppm. But with a fainter sun, the glacial inception threshold during the Hirnantian (445 Ma) glaciation was probably closer to 1000 ppm.

CO2 concentrations cannot be measured in deep time, and we therefore must rely on proxies, or models. For the past 450 million years, CO2 proxies during greenhouse climates average ~1100 ppm whilst the Phanerozoic icehouse intervals average ~480 ppm. But a proxy-based picture of CO2 concentrations before 450 Ma is lacking and thus CO2 levels for most of Earth’s history must be estimated from carbon-cycle models. Models are also important for capturing the processes (sources and sinks) that can explain shifting greenhouse and icehouse climates and can loosely be classified as inverse or forward models, pending on whether isotopic proxy data are parametrized or predicted from the model, respectively. Both model types, however, incorporate several biological and geological/tectonic forcing parameters that should be similar in all models.

Carbon-cycle models predict very different atmospheric CO2 levels for large of the Phanerozoic, differing by more than 4000 ppm and model-proxy differences can exceed 5000 ppm. Many of the relatively large, modelled differences in atmospheric CO2 are arguable caused by differences in time-dependent parametrization of plate tectonic degassing and silicate weathering, and benchmarking of carbon-cycle models are urgently required. In this contribution we focus on carbon-cycle modelling with GEOCARB_NET — a user-friendly version of the GEOCARB model. In GEOCARB_NET input parameters can easily be changed, tested, and compared with other models (e.g., COPSE, SCION and GEOCLIM). The system also contains databases for CO2 proxies and temperatures that be visualized together with CO2 predictions. We highlight how key input parameters can seriously affect reconstructed CO2 levels but also how models and proxies can better be reconciled.

How to cite: Torsvik, T., Royer, D., Marcilly, C., and Werner, S.: Carbon-cycle modelling and Phanerozoic climate change, EGU General Assembly 2025, Vienna, Austria, 27 Apr–2 May 2025, EGU25-5831, https://doi.org/10.5194/egusphere-egu25-5831, 2025.

The Approximate Partial Radiative Perturbation (APRP) method is a powerful tool for investigating the effects of changes in cloud characteristics, driven by increased CO2 levels, on planetary albedo. The northern polar region is particularly sensitive to climate change. However, the summer temperature rise over the Arctic Ocean is relatively mild, and the mechanisms that suppress temperature increases are not fully understood.

We apply the APRP method to an ensemble of models participating in the Eocene Deep-Time Model Intercomparison Project (DeepMIP) and compare the effects of summer cloud feedback changes in the polar region to CO2 level increases from 1× pre-industrial (PI) level to 3/4× PI for both Eocene and modern conditions across the ensemble.

Our results reveal a wide range of results, both in magnitude and in sign (warming/cooling) of radiative changes, between models and even within the same models across different timeslices. Changes in cloud scattering are the primary contributors to the inter-model spread of cumulative APRP cloud effects. This spread is further amplified by differences in the sign of APRP cloud absorption effects.

In contrast, the models provide relatively consistent results for APRP cloud fraction effects, with most simulating modest positive feedback from cloud fraction changes due to CO2 increases. Nevertheless, the cumulative APRP cloud effects are minor compared to the net ocean-atmosphere energy flux changes over an ice-free Arctic Ocean. These fluxes might play a dominant role in inhibiting summer temperature increases in the polar region under elevated CO2 levels.

How to cite: Niezgodzki, I., Knorr, G., Lunt, D., and Lohmann, G.: Comparison of APRP cloud feedbacks to CO2 level rise on the summer Arctic climate across the Eocene Deep-Time Model Intercomparison Project ensemble, EGU General Assembly 2025, Vienna, Austria, 27 Apr–2 May 2025, EGU25-6251, https://doi.org/10.5194/egusphere-egu25-6251, 2025.

EGU25-6438 | ECS | Posters on site | CL1.1.1

The Eocene-Oligocene Transition in Central Anatolia: lake retreats and increased aridity 

Paul Botté, Alexis Licht, Leny Montheil, Anne-Lise Jourdan, François Demory, Mustafa Kaya, Faruk Ocakoğlu, Mehmet Serkan Akkiraz, Deniz İbilioğlu, Pauline Coster, Grégoire Métais, Benjamin Raynaud, and K. Christopher Beard

The Eocene-Oligocene Transition (EOT; ~34 Ma) is one of the most significant climate shifts of the Cenozoic era, representing the transition from the last warmhouse state to a coolhouse state. The EOT had a significant impact on terrestrial ecosystems and was synchronous with the "Grande Coupure", a major episode of faunal turnover in western Europe associated with the influx of multiple clades of Asian tetrapods. The impact of the EOT displays considerable regional variability in sedimentary records, and its role in the opening of dispersal corridors for the Grande Coupure remains unclear.

In this study, we use sedimentology, magnetostratigraphy, biostratigraphy, and U-Pb geochronology to date a section comprising the EOT in the Çiçekdağı Basin, in central Anatolia, a region that sits on Balkanatolia, a biogeographic province proposed as a secondary dispersal pathway for the Grande Coupure that remains largely understudied. We then analyze stable and clumped isotopes from pedogenic carbonates to investigate the local paleoenvironmental evolution through the EOT.

Our record captures a fluvio-lacustrine system spanning the Priabonian and the lower Rupelian, including the Oi-1 glaciation (~33.65Ma). Our sedimentological analyses reveal significant paleoenvironmental changes, including a major sedimentary unconformity in the latest Priabonian interpreted as a lake retreat related to a regional increase in aridity. This event also marks the onset of a long-term aridity trend in our stable isotope data. Furthermore, the stable and clumped isotopes analysis provide preliminary surface temperature estimates (Δ₄₇)discuss the implications of these paleoclimatic findings for understanding the environmental drivers behind faunal dispersals of the Grande Coupure.


Keywords: Paleogene, EOT, Pedogenic carbonates, Anatolia, Clumped isotopes, Stable isotopes, Dispersals.

How to cite: Botté, P., Licht, A., Montheil, L., Jourdan, A.-L., Demory, F., Kaya, M., Ocakoğlu, F., Akkiraz, M. S., İbilioğlu, D., Coster, P., Métais, G., Raynaud, B., and Beard, K. C.: The Eocene-Oligocene Transition in Central Anatolia: lake retreats and increased aridity, EGU General Assembly 2025, Vienna, Austria, 27 Apr–2 May 2025, EGU25-6438, https://doi.org/10.5194/egusphere-egu25-6438, 2025.

The surface productivity variations are still unclear through the Ordovician-Silurian crisis, which is belong to one of the “Big Five” extinction. Here, we present barium (Ba) concentration and isotope data from organic matter-enriched anoxic siliceous sediments of various facies (X sites from proximal to distal regions) during the OST from South China. Our data show that both raw Ba and ratios of Ba to aluminum (Ba/Al) are higher than that in numerous ancient black shales and modern high productivity area, document elevated Ba accumulations during this interval. Besides, a larger gradient (~ 1 ‰) of Ba isotope (138Ba) gradient between the shallow-water to deep-water sites, additional support higher marine productivity was the reason of the higher Ba burial in these sediments. These data provide evidence that elevated organic carbon fluxes from the surface ocean (other than redox conditions) was likely the main control on accumulation of these organic matter-enriched sediments, and thus provide the sources of “shale gas” during this interval.

How to cite: Shen, J.: The oceanic primary productivity variations during the Ordovician and Silurian transtion, EGU General Assembly 2025, Vienna, Austria, 27 Apr–2 May 2025, EGU25-7465, https://doi.org/10.5194/egusphere-egu25-7465, 2025.

The South China Craton experienced large changes in climate, eustasy and environmental conditions during the Late Ordovician Hirnantian Ice Age, but their impact on the watermass architecture of the Yangtze Sea has not yet been thoroughly evaluated. Here, we reconstruct the salinity-redox structure of the Yangtze Sea based on five Upper Ordovician-Lower Silurian shale successions representing a lateral transect from a deep-water area of the Inner Yangtze Sea (IYS; Shuanghe section) across the shallow Hunan-Hubei Arch (Pengye, Jiaoye and Qiliao sections) to the relatively deep-water Outer Yangtze Sea (OYS; Wangjiawan Section). Carbon isotope (13Corg) profiles show that the Guanyinqiao Bed (recording the peak Hirnantian glaciation) thins and is less completely preserved at sites on the flanks of the Hunan-Hubei Arch than in deeper water areas to the SW and NE, reflecting bathymetric influences. Watermass salinities were mainly marine at Shuanghe and brackish at the other four study sites, with little variation among Interval I (pre-glaciation), Interval II (Hirnantian glaciation) and Interval III (post-glaciation). Redox proxies document mainly euxinia at Shuanghe and Wangjiawan and suboxia at the other sites during Interval I, with shifts towards more reducing (mostly euxinic) conditions at most sites during Intervals II and III, which shows that all the study sections were deep enough to remain below the redoxcline during the glacio-eustatic lowstand. Two features of the Shuanghe section mark it as being unusual: it alone exhibits fully marine salinities implying greater proximity to the open ocean than the other four sites, and it exhibits an especially large shift towards more reducing conditions during Interval III (i.e. the post-Hirnantian transgression), implying greater water depths. These features are difficult to reconcile with the standard palaeogeographical model for the Ordovician-Silurian South China Craton, which is characterized by a geographically enclosed and restricted IYS and a more open OYS, arguing instead for the SW end of the IYS to have been connected to the global ocean and the OYS to have been a restricted oceanic cul-de-sac. A review of sedimentological and facies data for the IYS region suggests that our re-interpretation of the Ordovician-Silurian palaeogeography of the South China Craton is viable, although further vetting of this hypothesis is needed.

How to cite: Wang, X., Liu, Z., and Shen, J.: Watermass architecture of the Ordovician-Silurian Yangtze Sea (South China) and its palaeogeographical implications, EGU General Assembly 2025, Vienna, Austria, 27 Apr–2 May 2025, EGU25-7655, https://doi.org/10.5194/egusphere-egu25-7655, 2025.

EGU25-7762 | Orals | CL1.1.1

Carbon-Climate Coupling Dynamics Revealed by Decadal-Resolution Middle Miocene Records 

Yige Zhang, Daianne Starr, Qin Leng, Duo Chan, Jeffrey Sachnik, Jiaqi Liang, Hong Yang, Yangyang Xu, Bumsoo Kim, Ruoxia Shen, Ran Feng, and Ann Pearson

Contemporary global warming is known to lag behind the rapid increase in atmospheric CO2 levels. This delay, largely due to heat uptake and storage in the vast ocean interior, remains one of the key uncertainties in projecting climate change in future decades. Here, we present decadal-resolution paleoclimate reconstructions of atmospheric CO2 and temperature to evaluate the carbon-climate coupling dynamics over an approximately 700-year time window of the middle Miocene, 16 million years ago. The middle Miocene is characterized by perturbations in the global carbon cycle caused by volcanic degassing, and global warming of about 6ºC relative to today. By analyzing fossil leaves and lipid biomarkers from the annually-varved Clarkia Lake deposit in Idaho, USA, we establish concurrent and continuous CO2 and temperature records that capture short-term fluctuations superimposed on long-term warming and CO2 increasing trends. Statistical analysis shows that CO2 consistently lead temperature variation on a multi-decadal scale. Climate model emulators further confirm the role of ocean heat storage in shaping this delayed transient response. High temporal resolution reconstructions can provide constraints on Earth’s climate changes from a distant greenhouse world yet on societally relevant time scales, offering critical insights to improve our understanding of carbon-climate coupling dynamics. Such paleoclimate constraints are crucial for reducing uncertainties in projecting the near-term climate change under increasing CO2 levels.

How to cite: Zhang, Y., Starr, D., Leng, Q., Chan, D., Sachnik, J., Liang, J., Yang, H., Xu, Y., Kim, B., Shen, R., Feng, R., and Pearson, A.: Carbon-Climate Coupling Dynamics Revealed by Decadal-Resolution Middle Miocene Records, EGU General Assembly 2025, Vienna, Austria, 27 Apr–2 May 2025, EGU25-7762, https://doi.org/10.5194/egusphere-egu25-7762, 2025.

EGU25-7951 | Posters on site | CL1.1.1

Carbonate Compensation Depth and Carbonate Carbon Flux in the Indian Ocean over the Cenozoic  

Faranak Dalvand, Adriana Dutkiewicz, Nicky M. Wright, and R. Dietmar Müller

The Indian Ocean, a crucial component of the global thermohaline circulation with a carbonate saturation state intermediate between the Atlantic and Pacific oceans, plays a vital role in climate variability. It serves as a major sink for atmospheric carbon dioxide (CO₂), sequestering approximately 20% of the world's anthropogenic carbon. However, a major gap exists in understanding the deep carbon cycle of the Indian Ocean because the evolution of deep-sea carbonate carbon reservoirs, as a key contributor to the long-term global carbon cycle, remains unknown across this ocean over the Cenozoic. Here, we present new regional carbonate compensation depth (CCD) reconstructions incorporating dynamic topography and eustasy impacts to quantify the storage and fluxes of carbonate carbon to the Indian seafloor since the early Cenozoic. The CCD is defined as the water depth at which carbonate supply from the surface is balanced with its dissolution, leading to the absence of carbonate components below the CCD. Due to the complexity of carbonate distribution across the Indian Ocean, we model the Cenozoic CCD across six regions: western North Indian, western and eastern equatorial Indian, western and eastern South Indian, and the Indian sector of the Southern Ocean. Utilizing updated age models and backtracking with lithology-specific decompaction from 118 deep-sea drill sites (DSDP, ODP, and IODP expeditions), we compute the CCD through a linear reduced major-axis regression of the carbonate accumulation rate (CAR) versus paleo-water depth. The regression analysis is carried out in 0.5 My time intervals. Our results illustrate distinct CCD patterns across the Indian Ocean, fluctuating regionally by ~1.5–2.5 km over the Cenozoic. The western equatorial Indian shows a long-term deepening trend from ~2.7 km at 44 Ma to ~4.9 at present, while the eastern equatorial maintains a deep CCD fluctuating between ~4.2 km and ~4.8 km since 19 Ma. The relatively shallow CCD of the Indian sector of the Southern Ocean, between ~2–4 km since 43 Ma, experiences pronounced variability across the Indian Ocean, indicating significant oceanographic changes and the complexity of diverse factors influencing the carbonate system in this high-latitude region. The highly variable CCDs across the Indian Ocean result in substantial regional heterogeneity in carbonate carbon flux corresponding to distinct oceanography characteristics such as deep-water carbonate chemistry and gradients of carbonate rain rate. The regional CCD models for the Indian Ocean are utilized to estimate the evolution of deep-sea carbonate carbon reservoir across the entire Indian during the Cenozoic in the context of the long-term global carbon cycle.

How to cite: Dalvand, F., Dutkiewicz, A., Wright, N. M., and Müller, R. D.: Carbonate Compensation Depth and Carbonate Carbon Flux in the Indian Ocean over the Cenozoic , EGU General Assembly 2025, Vienna, Austria, 27 Apr–2 May 2025, EGU25-7951, https://doi.org/10.5194/egusphere-egu25-7951, 2025.

Two prominent forcing factors occurring during the Cenozoic are the Indian Asian collision and the atmospheric drawdown of carbon dioxide concentration from 4 to 1 PAL. Both of them have been intensively studied, but only a few studies were devoted to disantengling them and to explore their impact on the meridional ocean circulation. Indeed, there are some interactions between these two factors and other important features occurred during this period, especially concerning the geometry of straits (Tan et al., GRL 2022). In this study, we simulate, with a coupled GCM model (CESM version 1.0.5), the response to both of these factors with idealized boundary conditions. Using four long-lasting simulations with two different values of pCO2 (4 and 1 PAL) mixed with the presence or absence of TP, we demonstrate that the ocean heat transport in North Pacific and Atlantic ocean is differently impacted by the uplift of the TP. Such a response has been pointed out by Su et al., Climate of the Past 2018 and depicts a large increase of AMOC and decrease of PMOC from Eocene to present-day, but in this study, they only used a pCO2 of 1 PAL.

This last feature was a severe limitation to compare these simulations to data. Moreover, the sea-ice response played an important role, which would be undoubtedly reduced at a CO2 concentration of 4 PAL. In this new study, we disentangle the effect of the pCO2 decrease from 4 to 1 PAL and the uplift of the Tibetan Plateau. We pin-point the important result that, even with 4 PAL CO2, the Tibetan Plateau uplift led to major changes of the meridional ocean circulation, including pronounced differences in North Pacific and North Atlantic.

Moreover, our simulation with present-day TP and 1 PAL corresponding to the pre-industrial and the other extreme simulation, no TP and 4 PAL corresponding to the early Eocene, can be, therefore, compared to data, especially over the northern hemisphere, for which the Pacific and Atlantic ocean model response is largely different. Thanks to the availability of data over North Atlantic, it is possible to show that the simulated cooling is in agreement with these reconstructions using different marine proxies. In contrast, over North Pacific, not enough sea surface temperature reconstructions (SST) are yet available over 30°N to assess the SST cooling inferred by the simulation. (Hollis, GMD 2019 ;   Lunt et al., Climate of the Past 2021).

In summary, this study claims for more data in North Pacific during the early Eocene. More importantly, it pin-points the important role of the Tibetan Plateau uplift on building a modern circulation in North Atlantic.

How to cite: Ramstein, G., Su, B., Phan, C., and Tremblin, M.: Disentangling the role of two prominent climate forcing factors in the large decrease of temperatures since the Eocene : a pCO2 drawdown and the Tibetan Plateau uplift, EGU General Assembly 2025, Vienna, Austria, 27 Apr–2 May 2025, EGU25-8270, https://doi.org/10.5194/egusphere-egu25-8270, 2025.

The late Miocene was an important stage for the formation of modern-like ecological and environmental patterns. Proxy data from the middle to late Miocene reveal that large-scale cooling and drying occurred, however, the reasons for this climate transition remain unclear. Through a compilation of proxy data and climate simulations, our results indicate that atmospheric CO2 decline markedly decreased the temperature and reduced the precipitation in most of the land area, while the paleogeographic changes enhanced cooling at northern high latitudes and increased precipitation in East Asia, East Africa and South America. In comparison, vegetation changes accelerated cooling at northern high latitudes and modulated precipitation at low- and mid-latitude continents. This deepens the understanding of the mechanism of the late Miocene climate transition.

How to cite: Zhang, R.: The role of vegetation feedback during the late Miocene climate transition, EGU General Assembly 2025, Vienna, Austria, 27 Apr–2 May 2025, EGU25-8336, https://doi.org/10.5194/egusphere-egu25-8336, 2025.

EGU25-8497 | ECS | Posters on site | CL1.1.1

Input and output fluxes of surface CO2 throughout the lower Cenozoic 

Luca Castrogiovanni, Pietro Sternai, Claudia Pasquero, Nicola Piana Agostinetti, Bram Vaes, and Jack Longman

Long-term Cenozoic climate trends result from changes in the geological carbon cycle and associated surface input and output CO2 fluxes largely due to magmatic emissions and weathering of silicate minerals (Berner & Lasaga, 1989). Proxy records allow to detect absolute values of CO2 in different reservoirs to define major Cenozoic climatic events (e.g., PETM, EECO or MECO). However, interpreting the proxy-based time history of surface CO2 budget in terms of input and output CO2 fluxes is critical to assess the responsible processes behind the surface-deep carbon exchange and associated long term climate trends. Here, we use a newly developed technique (Castrogiovanni et al., 2024) based on a reversible-jump Markov chain Monte Carlo algorithm (rj-McMC) to invert the CO2 time series from the Proxy Integration Project (CENCO2PIP) (Hönisch et al., 2023) and obtain estimates of the surface input and output CO2 fluxes throughout the lower Cenozoic. We base the inversion on a general formulation of the geological carbon cycle and use the temperature time history from Hansen et al., 2023 as a further constraint to the inversion scheme. Results indicate a marked peak in the emission rate of CO2 at ˜56 Ma (PETM), enhanced CO2 emissions between 54-50 Ma (EECO) and at ˜40 Ma (MECO), whereas the output CO2 term associated to weathering responds to such variations of the input CO2 term. We conclude that magmatic CO2 emissions related to the closure of the Neo-Tethyan ocean and opening of the Nort-East Atlantic Ocean played a key role in driving lower Cenozoic climate trends.


References

Berner, R. A., & Lasaga, A. C. (1989). Modeling the Geochemical Carbon Cycle. 260(3), 74–81. https://doi.org/10.2307/24987179

Castrogiovanni, L., Sternai, P., Piana Agostinetti, N., & Pasquero, C. (2024). A reversible-jump Markov chain Monte Carlo algorithm to estimate paleo surface CO2 fluxes linking temperature to atmospheric CO2 concentration time series. Computers & Geosciences, 105838. https://doi.org/10.1016/J.CAGEO.2024.105838

Hansen, J. E., Sato, M., Simons, L., Nazarenko, L. S., Sangha, I., Kharecha, P., Zachos, J. C., von Schuckmann, K., Loeb, N. G., Osman, M. B., Jin, Q., Tselioudis, G., Jeong, E., Lacis, A., Ruedy, R., Russell, G., Cao, J., & Li, J. (2023). Global warming in the pipeline. Oxford Open Climate Change, 3 (1). https://doi.org/10.1093/OXFCLM/KGAD008

Hönisch, B., Royer, D. L., Breecker, D. O., Polissar, P. J., Bowen, G. J., Henehan, M. J., Cui, Y., Steinthorsdottir, M., McElwain, J. C., Kohn, M. J., Pearson, A., Phelps, S. R., Uno, K. T., Ridgwell, A., Anagnostou, E., Austermann, J., Badger, M. P. S., Barclay, R. S., Bijl, P. K., … Zhang, L. (2023). Toward a Cenozoic history of atmospheric CO2. Science, 382 (6675). https://doi.org/10.1126/SCIENCE.ADI5177/SUPPL_FILE/SCIENCE.ADI5177_SM.PDF


How to cite: Castrogiovanni, L., Sternai, P., Pasquero, C., Piana Agostinetti, N., Vaes, B., and Longman, J.: Input and output fluxes of surface CO2 throughout the lower Cenozoic, EGU General Assembly 2025, Vienna, Austria, 27 Apr–2 May 2025, EGU25-8497, https://doi.org/10.5194/egusphere-egu25-8497, 2025.

EGU25-10515 | Orals | CL1.1.1

Spatial patterns and mechanisms of the temperature response in East Asia to mid-Piacenzian warming 

Haibin Wu, Lixin Chen, Yong Sun, Wenchao Zhang, Yanyan Yu, and Chunxia Zhang

The mid-Piacenzian (3.264–3.025 Ma) is regarded as being the most recent warm period with atmospheric CO2 levels comparable to those of the present-day, thus reconstruction of corresponding climate change provides a good reference for our understanding the current and future global warming. In this study, we undertook climate reconstructions for East Asia using the modern analogue technique, based on fossil pollen records. The results show significant spatial variations in paleoclimate, with a warmer zone in the northwest and a colder zone in the eastern monsoonal regional. To better understand the data–model discrepancies, particularly with respect to the overall warming trend indicated by the simulations, we decomposed the physical processes in the simulation based on the surface energy budget equation. Our findings suggest that the cooling effects of cloud radiative forcing, non-surface albedo feedbacks induced by clear-sky shortwave radiation, and latent heat flux contributed to the cooling trend in the eastern zone. In contrast, the warming observed in the northwestern zone was driven primarily by increased clear-sky downward longwave radiation. These results highlight the complex responses of different regions to climatic change and the key role of cloud and radiation processes in controlling regional climate.

How to cite: Wu, H., Chen, L., Sun, Y., Zhang, W., Yu, Y., and Zhang, C.: Spatial patterns and mechanisms of the temperature response in East Asia to mid-Piacenzian warming, EGU General Assembly 2025, Vienna, Austria, 27 Apr–2 May 2025, EGU25-10515, https://doi.org/10.5194/egusphere-egu25-10515, 2025.

EGU25-11732 | ECS | Orals | CL1.1.1

The effect of land distribution on Neo-Archean atmospheric circulation and surface climate 

Anya Taylor, Stephen Thomson, Sophie-Berenice Wilmes, Nathan Mayne, and Mattias Green

The continental distribution and surface conditions of a planet strongly impact its climate. Continents on Earth are believed to have emerged above sea level in the Archean Eon, although the exact timing and emerged surface area are widely debated. We use the Isca climate model, a framework for the modelling of idealised planetary atmospheres, to explore the climatic impact of various land-ocean configurations on a 2.7 Ga Archean Earth. We find that the addition of land consistently produces a global cooling and introduces hemispheric asymmetry to the large-scale atmospheric circulation and equator-to-pole temperature gradient. The magnitude of the climate response increases with overall land fraction, while the degree of hemispheric asymmetry is more sensitive to the difference in land fraction between hemispheres. These effects are driven by changes in the surface energy balance, which are caused by the distribution of land and associated changes in albedo and the availability of water for evaporation. These results are comparable to similar work on tidally-locked exoplanets, and further highlight the importance of including land in climate simulations for Archean Earth and Earth-like exoplanets, particularly if the goal is an assessment of a planet’s habitability.

How to cite: Taylor, A., Thomson, S., Wilmes, S.-B., Mayne, N., and Green, M.: The effect of land distribution on Neo-Archean atmospheric circulation and surface climate, EGU General Assembly 2025, Vienna, Austria, 27 Apr–2 May 2025, EGU25-11732, https://doi.org/10.5194/egusphere-egu25-11732, 2025.

EGU25-13232 | ECS | Orals | CL1.1.1

Lipid biomarker chemostratigraphy in Arctic Canada: Evaluating microbiology ecology and carbon cycling during Hirnantian cooling 

Nathan Marshall, Chris Holmden, Michael Melchin, and Gordon Love

The Late Ordovician Mass Extinction (LOME) event is one of the most well-known climatic and environmental transition events in the Phanerozoic Eon. The Hirnantian glaciation and associated cooling during the latest Ordovician is widely considered to be the key driver for the major mass extinction event as well as changes in the climate and oceanographic systems1. Evidence from sedimentological, faunal, and geochemical data from around the globe has demonstrated that the transition from pre-glacial, to glacial, and post-glacial times was associated changes in carbon cycling, a large drop in eustatic sea level, and a series of extinction pulses2. The extinction patterns of marine fauna and perturbations to the carbon cycle have been well documented. However, the effects on the microbial communities that underpin marine food webs and mediate essential biogeochemical cycles are poorly constrained. New pristine outcrop samples have provided an opportunity for a detailed microbial lipid biomarker and stable isotope investigation on a succession that spans the Late Ordovician (Katian Stage) to Early Silurian (Rhudanian stage) time interval3. Here, we investigate how the significant environmental changes associated with the LOME and HICE affected the microbial communities.

Lipid biomarker and stable isotope (δ13Corganic, δ13Ccarbonate, δ15Ntotal) stratigraphic records were acquired from a 10-m interval of outcrop section from Cornwallis Island, Nunavut, Canada. Rock extracts were analyzed for a suite of branched and polycyclic hydrocarbon biomarkers utilizing the sensitivity and selectivity of Metastable Reaction Monitoring-Gas Chromatography-Mass Spectrometry (MRM-GC-MS). Baseline conditions, prior to the HICE, exhibit typical Ordovician marine biomarker characteristics which have been observed from various lithologies and different Ordovician marine depositional settings. These characteristics include low hopane/sterane (H/St) ratios, high relative abundance of C29 steranes from green algae, and high abundances of 3-methylhopanes (many times the Phanerozoic average), likely sourced from methanotrophic bacteria4. The rising and falling limbs of the HICE locally at our site are associated with a significant increase in total organic carbon (TOC) content (<9.5 wt.%) and are concomitant with an increase in the absolute abundances of regular steranes from marine algae. The observed jump in algal productivity and increased TOC content coincides with facies and biofacies indicators of a brief rise and then fall of global sea level documented in number of other sections, globally. By contrast, the biomarkers in the peak interval of the HICE locally, is associated with bacterial dominated productivity in an oligotrophic marine setting as indicated by high H/St ratios and low TOC content (≥0.3 wt.%). Low TOC content is a hallmark of the sea level low stand interval in many other sections, globally. These findings support and advance findings from earlier studies that Hirnantian climate and oceanographic changes caused major structural changes to marine food webs, particularly in low latitude regions where most of the graptolite extinctions have been documented.

1Finnegan, S. et al. Science (2011)

2Finnegan, S. et al. PNAS (2012)

3Melchin, M. J. & Holmden, C. Palaeogeography, Palaeoclimatology, Palaeoecology (2006)

4Rohrssen, M. et al. Geology (2013)

How to cite: Marshall, N., Holmden, C., Melchin, M., and Love, G.: Lipid biomarker chemostratigraphy in Arctic Canada: Evaluating microbiology ecology and carbon cycling during Hirnantian cooling, EGU General Assembly 2025, Vienna, Austria, 27 Apr–2 May 2025, EGU25-13232, https://doi.org/10.5194/egusphere-egu25-13232, 2025.

EGU25-13510 | ECS | Orals | CL1.1.1

Vegetation response to varying CO2 conditions during the Mid-Pliocene Warm Period. 

Elke Zeller, Sophia Macarewich, Jed O. Kaplan, Anta-Clarisse Sarr, Feng Zhu, Jiang Zhu, Bette Otto-Bliesner, Maya E. Tessler, Dan Amrhein, Jane W. Baldwin, Dervla Meegan-Kumar, Christopher J. Poulsen, and Jessica E. Tierney

The Mid-Pliocene Warm Period (mPWP) provides a valuable analog for near-future climate warming with an estimated global mean temperature  2.5–4°C higher than today and atmospheric CO₂ concentrations ranging from 360 to 420 ppm. Vegetation changes during the mPWP were significant, playing a crucial role in the climate through feedback mechanisms. Studying the climate-vegetation interactions provides insights into their strength, temporal dynamics, and their role in extreme events. We plan to investigate these interactions by examining vegetation changes under various climate scenarios, including distinct vegetation configurations. As a first step in this research, we will develop a set of vegetation scenarios from exploratory model runs which will then be used as boundary conditions in future runs—in combination with other varying conditions such as varying GHG levels, paleogeography, orbital configurations, and aerosol emissions— to incorporate vegetation dynamics in the mPWP experiments.

Here, we present preliminary results regarding the changes in spatial coverage of different vegetation during mPWP scenario runs and our proposed vegetation scenarios. The vegetation scenarios are developed from mPWP simulations with varying atmospheric CO₂ concentrations of 350 ppm, 400 ppm, and 490 ppm. These simulations were performed with the Community Earth System Model version 1.2, a fully coupled climate model, and Biome4, an offline equilibrium vegetation model. We will show the responses of paleo vegetation to climates under different CO₂ levels and quantify the stability of vegetation around the globe within the different scenarios. Based on these results, we will propose a set of vegetation scenarios for use in future studies.

How to cite: Zeller, E., Macarewich, S., Kaplan, J. O., Sarr, A.-C., Zhu, F., Zhu, J., Otto-Bliesner, B., Tessler, M. E., Amrhein, D., Baldwin, J. W., Meegan-Kumar, D., Poulsen, C. J., and Tierney, J. E.: Vegetation response to varying CO2 conditions during the Mid-Pliocene Warm Period., EGU General Assembly 2025, Vienna, Austria, 27 Apr–2 May 2025, EGU25-13510, https://doi.org/10.5194/egusphere-egu25-13510, 2025.

EGU25-14215 | ECS | Posters on site | CL1.1.1

Enhanced acidification of intermediate water in the South China Sea during the Pliocene-Pleistocene transition 

Man Zhao, Jiantao Cao, and Guodong Jia

Ocean interior acidification is predicted to exacerbate in the future due to persistent emissions of anthropogenic carbon dioxide (CO₂), which may excert disastrous impact on marine ecosystems. However, whether this trend is ubiquitous in the global oceans is not well understood. In this study, we reconstruct the pH changes of intermediate water in the northern South China Sea (SCS) since the Pliocene using bacterial branched glycerol dialkyl glycerol tetraethers. The results indicate a significant decline in pH during the Pliocene-Pleistocene transition, when atmospheric CO₂ was decreasing and thus not conductive to pH drop. We examined the controlling factors and found that weakened vertical mixing between intermediate and deep waters during this period played a crucial role in the decrease of intermediate water pH, rather than the influence by changes in atmospheric CO₂. Our findings highlight the effect of stratification of the ocean interior on the balance of the carbonate system in the SCS, which has been overlooked in modern observations and projections.

How to cite: Zhao, M., Cao, J., and Jia, G.: Enhanced acidification of intermediate water in the South China Sea during the Pliocene-Pleistocene transition, EGU General Assembly 2025, Vienna, Austria, 27 Apr–2 May 2025, EGU25-14215, https://doi.org/10.5194/egusphere-egu25-14215, 2025.

EGU25-14249 | ECS | Orals | CL1.1.1

The origin of the modern-like East Asian Monsoon: insights from new data synthesis and climate modelling 

Zhilin He, Zhongshi Zhang, Zhengtang Guo, Ning Tan, Zijian Zhang, Chunxia Zhang, Haibin Wu, and Chenglong Deng

It is debated as to whether the modern-like East Asian monsoon formed during the late Oligocene–early Miocene or the Eocene. To resolve this dispute requires a comprehensive and updated synthesis of the available geological records and a reliable modelling study. Here, we investigate Cenozoic climate patterns over East Asia by compiling geological records and conducting climate modelling for key geological periods based on our improved paleogeographies. Geological records suggest that a zonal (semi-)arid climate pattern was dominant over tectonic timescales during most of the Paleogene in large areas of East Asia, with marked fluctuations between dry and wet conditions over orbital timescales, and a modern-like monsoon-dominated climate pattern has formed since the late Oligocene–early Miocene (ca. 28–22 Ma). Our simulations show that a zonal dry belt extended across East Asia during the late Eocene, and a monsoon-dominated pattern had already formed over East Asia by the early Miocene. In addition, our simulations further indicate a strong sensitivity of East Asian rainfall to orbital forcing, which can explain the seemingly unstable character (i.e., wet–dry fluctuations) of the dry belt across East Asia during the Eocene. Furthermore, our results suggest that paleogeographic changes, particularly uplift of the Tibetan Plateau to moderate–high elevations and its paleolatitude approaching present-day location during the late Oligocene–early Miocene, rather than atmospheric CO2 levels, played a crucial role in the establishment of the modern-like East Asian monsoon.

How to cite: He, Z., Zhang, Z., Guo, Z., Tan, N., Zhang, Z., Zhang, C., Wu, H., and Deng, C.: The origin of the modern-like East Asian Monsoon: insights from new data synthesis and climate modelling, EGU General Assembly 2025, Vienna, Austria, 27 Apr–2 May 2025, EGU25-14249, https://doi.org/10.5194/egusphere-egu25-14249, 2025.

EGU25-14653 | ECS | Orals | CL1.1.1

Continental Rigidity in the Tropics Shapes Earth’s Climate state 

Feng Cheng, Andrew Zuza, Zhangjun Li, Yiduo Liu, Marc Jolivet, Zhaojie Guo, and Wenjiao Xiao

Global pCO₂ levels have fluctuated significantly throughout the Phanerozoic, closely aligning with Earth’s warm, ice-free periods and cold, glacial climates. However, the extent to which these variations in pCO₂ are linked to weathering processes remains a topic of active debate. In this study, we quantify the effective elastic thickness of all major modern terrains and reconstruct their paleogeographic positions over the past 250 million years. We then estimate the weighted average continental effective elastic thickness within the tropics (e.g., within 10°, 15°, and 20° of the equator) and compare these values to global pCO₂ levels over time. Our analysis reveals a strong positive correlation between global pCO₂ levels and the weighted average continental effective elastic thickness in the tropics. We propose that variations in the mechanical strength of continents at low latitudes are linked to transitions between cold and warm climatic states. Specifically, when non-rigid continents drift into tropical regions, weakened and deformed rocks become more susceptible to exhumation and erosion in the warm, wet tropics, thereby enhancing Earth’s capacity for carbon sequestration through chemical weathering. Conversely, when rigid continents dominate the tropics, exhumation and erosion are inhibited, leading to relatively high atmospheric pCO₂ levels. If validated, we apply this correlation between continental rigidity and global pCO₂ to project future pCO₂ levels based on the assembly of the next supercontinent. Our findings suggest that, excluding human influence, global pCO₂ levels could increase fivefold over the next 250 million years. This underscores the critical role of continental strength, beyond just lithology or rock composition, in the tropics in driving physical and chemical weathering processes that shape Earth's climate state.

How to cite: Cheng, F., Zuza, A., Li, Z., Liu, Y., Jolivet, M., Guo, Z., and Xiao, W.: Continental Rigidity in the Tropics Shapes Earth’s Climate state, EGU General Assembly 2025, Vienna, Austria, 27 Apr–2 May 2025, EGU25-14653, https://doi.org/10.5194/egusphere-egu25-14653, 2025.

EGU25-15065 | ECS | Orals | CL1.1.1

Loss of vegetation-mediated carbon sequestration during the Paleocene-Eocene Thermal Maximum 

Julian Rogger, Vera Korasidis, Gabriel Bowen, Christine Shields, Taras Gerya, and Loïc Pellissier

The Paleocene-Eocene Thermal Maximum (PETM) around 56 million years ago was a 5-6°C global warming event, representing one of the most important geologic analogues to present-day climate change. Considering that the carbon release rate that triggered the PETM was likely around a magnitude lower than current anthropogenic carbon emissions, it is of major importance to identify the climatic, geologic and biological factors that drove the severity and 200 kyr long duration of the PETM hyperthermal. Based on carbon isotope records of the period, it was suggested that a loss and a 70-100 kyr lagged regrowth of biospheric organic carbon stocks may have contributed to the long duration of the carbon cycle perturbation. In this work, we aim to identify the biological mechanisms that could explain such a sustained loss of vegetation-mediated carbon sequestration on land, and whether these dynamics can be expected under current anthropogenic carbon release. We developed a new, eco-evolutionary vegetation model, grounded in principles of eco-evolutionary optimality, to simulate changes in vegetation structures and traits, organic carbon sequestration and vegetation-mediated silicate weathering enhancement throughout the PETM climatic excursion. By comparing modelled vegetation dynamics with vegetation reconstructions derived from palynofloral records, we show that the PETM warming may have exceeded the capacity of vegetation systems to respond to the environmental changes through evolutionary adaptation of functional traits and climatic tolerances, resulting in reduced fitness and functioning. The magnitude of the warming and the creation of previously non-existent climatic environments during the period further resulted in a limited capacity of plants to avoid the warming-induced stress through dispersal and migration. Our results show that a global warming of similar magnitude as during the PETM could result in a long-lasting loss of vegetation-mediated carbon sequestration and a reduction in the efficiency of the Earth system to regulate perturbations.

How to cite: Rogger, J., Korasidis, V., Bowen, G., Shields, C., Gerya, T., and Pellissier, L.: Loss of vegetation-mediated carbon sequestration during the Paleocene-Eocene Thermal Maximum, EGU General Assembly 2025, Vienna, Austria, 27 Apr–2 May 2025, EGU25-15065, https://doi.org/10.5194/egusphere-egu25-15065, 2025.

EGU25-15107 | Orals | CL1.1.1

Late Ordovician and early Silurian warming sustained by enhanced clay formation  

Yanfang Li, Hui Tian, He Sun, Peng Cheng, Tengfei Li, and Haitao Gao

The Ordovician–Silurian transition (O-S) was a period of dramatic climatic, environmental, and biological changes marked by severe mass extinction, glaciation, intense volcanism, marine anoxia, and widespread deposition of organic-rich shale. Silicate weathering has been proposed as a potential driver for the extreme climate change and invoked as a driver for marine anoxia during this time. However, the changes in chemical weathering across O-S transition are poorly constrained. Here, we present high-resolution Li isotope (δ7Li) records of marine shales from South China, spanning the Upper Ordovician to Lower Silurian to track changes in continental weathering across the O-S transition. We find significant positive δ7Li excursions in the Late Ordovician (Katian stage) and early Silurian (Rhuddanian stage), reflecting a shift to incongruent weathering, associated with secondary clay formation. Clay formation can retain cations on the continents, resulting in inefficient atmospheric CO2 consumption through silicate weathering. We therefore propose that enhanced clay formation may have sustained the long-term greenhouse conditions during Early Silurian, although volcanic degassing may have acted as a trigger. The greenhouse conditions would have reduced the thermohaline circulation and oxygen solubility, facilitating the development of prolonged anoxia throughout the Early Silurian and delayed the biotic recovery of marine ecosystems during this period. Marina anoxia could enhance the burial of huge amounts of organic matter in the sedimentary record as globally distributed organic-rich black shales, which ultimately caused the drawdown of atmospheric CO2 and allowed the climate recovery.

How to cite: Li, Y., Tian, H., Sun, H., Cheng, P., Li, T., and Gao, H.: Late Ordovician and early Silurian warming sustained by enhanced clay formation , EGU General Assembly 2025, Vienna, Austria, 27 Apr–2 May 2025, EGU25-15107, https://doi.org/10.5194/egusphere-egu25-15107, 2025.

During the Ordovician-Silurian boundary interval, the Hirnantian Glaciation and the first major biodiversity crisis of the Phanerozoic, the Late Ordovician Mass Extinction (LOME), occurred. As one of the Phanerozoic “Big Five” extinction events, LOME is widely regarded as being closely linked to environmental changes such as anoxia induced by the Hirnantian Glaciation. However, due to the lack of high temporal resolution data in most previous studies, evolutionary patterns of different clades remain unclear. Trilobites, one of the most diverse clades during the Paleozoic, suffered catastrophic losses during this event, never recovering to the same level of dominance in the marine ecosystem and ultimately disappearing during the end-Permian Mass Extinction. Although previous studies (stage- or biozone-level, generally ~1-3 Myr) based on individual or limited number of stratigraphic sections suggested marine anoxia as the driver of benthic extinctions or the main cause of biodiversity decline, the vast morphological and occurrence data of trilobites have not been fully utilized to depict the morphological evolution of marine life due to technical constraints, hindering our understanding of the evolutionary history of life during this critical interval.

Here we compiled global trilobite fossil records and morphological descriptions spanning LOME from literature. Using the newly developed quantitative stratigraphic method, HORSE, we analyzed tens of thousands of fossil records to generate a global high-resolution trilobite diversity curve (~25 kyr as imputed temporal resolution) which has never been achieved before. The manual, labor-intensive annotation hindered the development of image-based large-scale annotated fossil datasets, thereby limiting large-scale morphological data analysis. However, high-dimensional embeddings extracted from morphological descriptions with large language models (LLMs) quantified global trilobite morphological similarities and allowed the generation of a high-resolution morphological disparity curve. Comparison between these two curves revealed that, while severe biodiversity losses are a defining feature of mass extinction events, its impacts on morphological disparity are more complicated. Although greater morphological disparity typically indicates higher ecological or functional diversity, the coupled diversity and disparity dynamics during the glaciation could be explained by either the intensity of extinctions or strong internal constraints. This study aims to reveal in significant detail the connections between marine biodiversity changes and morphological evolution during the Hirnantian Glaciation and LOME, as well as the relationships between these biotic changes and abiotic factors, thereby enhancing our understanding of the patterns and underlying mechanisms of the Late Ordovician Mass Extinction.

How to cite: Shen, H., Chu, T., and Fan, J.: AI-Powered Analysis of Global Trilobite Diversity and Morphology During the Late Ordovician Mass Extinction, EGU General Assembly 2025, Vienna, Austria, 27 Apr–2 May 2025, EGU25-15140, https://doi.org/10.5194/egusphere-egu25-15140, 2025.

EGU25-16029 | ECS | Orals | CL1.1.1

Impact of marine gateways on oceanic circulation and carbon cycle in the Late Eocene 

Emma Fabre, Jean-Baptiste Ladant, Pierre Sepulchre, and Yannick Donnadieu

The Late Eocene is a period of global cooling and high-latitude tectonic changes culminating in the Eocene Oligocene Transition (34 Ma ago), one of the major climatic shifts of the Cenozoic. Across the Late Eocene, the Earth went from a largely ice-free greenhouse during the early Eocene climatic optimum to an icehouse with the ice sheet inception over Antarctica. This long-term cooling happened simultaneously with a decrease in the atmospheric content in carbon dioxide whose causes are still unclear. During the same period, marine gateways surrounding Antarctica (Drake Passage and Tasman Gateway) opened and deepened and Atlantic-Artic gateways changed configurations, thereby allowing the onset of oceanic currents such as the circumpolar current isolating Antarctica.

Here, we investigate how coupled changes in the configuration of these gateways impact the oceanic circulation and carbon cycle, in particular the distribution of δ13C. Applying for the first time the carbon isotopes-enabled version of PISCES (Buchanan et al. 2021) to the Late Eocene,  we present and analyze a set of experiments with different gateways configurations with a specific focus on the reorganization of ocean circulation and its consequence on carbon isotopes distribution and gradients. We then compare our model results to available proxy data and discuss hypotheses regarding Late Eocene δ13C changes.

How to cite: Fabre, E., Ladant, J.-B., Sepulchre, P., and Donnadieu, Y.: Impact of marine gateways on oceanic circulation and carbon cycle in the Late Eocene, EGU General Assembly 2025, Vienna, Austria, 27 Apr–2 May 2025, EGU25-16029, https://doi.org/10.5194/egusphere-egu25-16029, 2025.

EGU25-16077 | ECS | Orals | CL1.1.1

The impact of paleogeographic boundary conditions on early Cenozoic climate simulations 

Bram Vaes, Pietro Sternai, Alexis Licht, Pierre Maffre, Thomas Chalk, Erwan Pineau, and Yannick Donnadieu

Studying warm climates of the geological past is essential to improving our understanding of the Earth’s climate and carbon cycle under elevated atmospheric CO2 levels. A major challenge in simulating past climates lies in the accurate reconstruction of the paleogeography ­– the spatial distribution of land, mountains, oceans, and their bathymetry. However, the impact of paleogeography and its uncertainty on modelled paleoclimates and model-data misfits is poorly quantified. Here, we quantify the impact of paleogeographic boundary conditions on the simulation of early Cenozoic climates (66 to 34 million years ago) using the IPSL-CM5A2 Earth System Model. We performed a series of paleoclimate simulations for key time slices, such as the early and middle Eocene climatic optima (EECO and MECO), using the most recent paleogeographic reconstructions and with varying atmospheric CO2 concentrations. We tested alternative paleogeographic scenarios, with particular focus on the different reconstructions of the Neo-Tethyan region and the India-Asia collision. In addition, we evaluate the impact of using different global reference frames, including the latest paleomagnetic reference frame of Vaes et al. (2023, Earth-Science Reviews). We show that the choice of reference frame and paleogeographic reconstruction can significantly impact global ocean circulation as well as regional temperature and precipitation patterns. To assess how paleogeography affects model-data comparisons, we compared model predictions against available paleoclimate proxy records. We find that changes in paleogeographic boundary conditions lead to notable differences in the reconstructed position of proxy sites. This may affect interpretations of past climates based on proxy records, such as reconstructions of latitudinal temperature gradients or climate sensitivity calculations. Our findings highlight the importance of paleogeography for paleoclimate modelling, and we discuss how future improvement of paleogeographic reconstructions may contribute to advancing our understanding of past climates and the carbon cycle.

How to cite: Vaes, B., Sternai, P., Licht, A., Maffre, P., Chalk, T., Pineau, E., and Donnadieu, Y.: The impact of paleogeographic boundary conditions on early Cenozoic climate simulations, EGU General Assembly 2025, Vienna, Austria, 27 Apr–2 May 2025, EGU25-16077, https://doi.org/10.5194/egusphere-egu25-16077, 2025.

EGU25-16102 | ECS | Posters on site | CL1.1.1

80-Million-Year Atmospheric CO2 Record from the Late Palaeozoic Ice Age 

Hana Jurikova, Claudio Garbelli, Ross Whiteford, Theodore Reeves, Gemma Laker, Volker Liebetrau, Marcus Gutjahr, Anton Eisenhauer, Kotryna Savickaite, Melanie Leng, Dawid Adam Iurino, Marco Viaretti, Adam Tomašových, Yuchen Zhang, Wen-qian Wang, Guang Rong Shi, Shu-zhong Shen, James Rae, and Lucia Angiolini

Atmospheric CO2 is thought to play a fundamental role in Earth’s climate regulation. Yet, for much of Earth’s deep geological past, atmospheric CO2 has been poorly constrained, hindering our understanding of transitions between cool and warm climates. Beginning ~370 million years ago in the Late Devonian and ending ~260 million years ago in the Permian, the Late Palaeozoic Ice Age was the last major glaciation preceding the current Late Cenozoic Ice Age and possibly the most intense glaciation witnessed by complex lifeforms. From the onset of the main phase of the Late Palaeozoic Ice Age in the mid-Mississippian ~330 million years ago, the Earth is thought to have sustained glacial conditions, with continental ice accumulating in high to mid-latitudes. However, open questions remain about the role of CO2 and nature of Earth’s climate during the onset and demise of glacial conditions.

This presentation will showcase an 80-million-year-long boron isotope record within a proxy framework for robust quantification of CO2, paired with new strontium, carbon and oxygen isotope records. Our records reveal that the main phase of the Late Palaeozoic Ice Age glaciation was maintained by prolonged low CO2, unprecedented in Earth’s history. About 294 million years ago, atmospheric CO2 rose abruptly (4-fold), releasing the Earth from its penultimate ice age and transforming the Early Permian into a warmer world. Our findings demonstrate the central role of CO2 in driving Earth’ geological climatic and environmental transitions [1].

[1] Jurikova H., Garbelli C., Whiteford R., Reeves T., Laker G.M., Liebetrau V., Gutjahr M., Eisenhauer A., Savickaite K., Leng M.J., Iurino D.A., Viaretti M., Tomašových A., Zhang Y., Wang W., Shi G.R., Shen S., Rae J.W.B., Angiolini L. (2025) Rapid rise in atmospheric CO2 marked the end of the Late Palaeozoic Ice Age. Nature Geosci., https://doi.org/10.1038/s41561-024-01610-2.

How to cite: Jurikova, H., Garbelli, C., Whiteford, R., Reeves, T., Laker, G., Liebetrau, V., Gutjahr, M., Eisenhauer, A., Savickaite, K., Leng, M., Iurino, D. A., Viaretti, M., Tomašových, A., Zhang, Y., Wang, W., Shi, G. R., Shen, S., Rae, J., and Angiolini, L.: 80-Million-Year Atmospheric CO2 Record from the Late Palaeozoic Ice Age, EGU General Assembly 2025, Vienna, Austria, 27 Apr–2 May 2025, EGU25-16102, https://doi.org/10.5194/egusphere-egu25-16102, 2025.

EGU25-16228 | ECS | Orals | CL1.1.1

Global vegetation of the warm Early Eocene: insights from a model - data comparison 

Julia Brugger, Nick Thompson, Ulrich Salzmann, Torsten Utescher, Matthew Forrest, Daniel J. Lunt, Kira Rehfeld, and Thomas Hickler

The Early Eocene, with CO2 levels exceeding 800 ppm, is a well-suited period for studying the effects of elevated atmospheric CO2 concentrations on climate, vegetation and their interplay. Here, we present insights from a model – data comparison using simulations with a dynamic global vegetation model (LPJ-GUESS) and a comprehensive global paleobotanical data set. The vegetation model is driven by climate input from four climate models of the Deep-Time Model Intercomparison Project Phase 1 (DeepMIP 1) under varying CO2 concentrations. Using climate input from two models with CO2 concentrations between three to six times pre-industrial CO2, we successfully replicate the extension of tropical, sub-tropical and temperate forests into higher latitudes, consistent with the paleobotanical record. Notably, tropical forest extent as suggested by paleobotanical data is also captured at CO2 concentrations exceeding four times pre-industrial CO2, contrasting with previous modeling results. However, input from the other two climate models produce excessively dry conditions in subtropical regions, misaligning with the paleobotanical evidence. Our vegetation distribution results will inform the next phase of the DeepMIP (DeepMIP 2). In addition, our comparison provides insights into the performance of climate and vegetation models under high CO2 concentrations, with implications for simulating future climate change and its impacts.

How to cite: Brugger, J., Thompson, N., Salzmann, U., Utescher, T., Forrest, M., Lunt, D. J., Rehfeld, K., and Hickler, T.: Global vegetation of the warm Early Eocene: insights from a model - data comparison, EGU General Assembly 2025, Vienna, Austria, 27 Apr–2 May 2025, EGU25-16228, https://doi.org/10.5194/egusphere-egu25-16228, 2025.

EGU25-16652 | ECS | Posters on site | CL1.1.1

Quantifying net carbon cycle feedbacks across the Paleocene-Eocene Thermal Maximum 

Pam Vervoort, Daniel Doherty, Sarah E. Greene, Stephen M. Jones, Tom Dunkley Jones, Daniel Gaskell, and Andy Ridgwell

The Paleocene-Eocene Thermal Maximum (PETM, 56 Ma) is perhaps the most extensively studied paleoclimate event of massive carbon release because the intense global warming and widespread ocean acidification bear resemblance to the predicted worst-case near-future Earth conditions. While emission rate and carbon source were different from today’s perturbation, valuable lessons can be learned from studying the PETM. For instance, whether climate or carbon cycle feedbacks amplify or mitigate the environmental disruption, and what feedback processes contributed to the global climate response. In this study, we quantify the magnitude and sign of ‘net’ carbon cycle feedbacks by integrating: (1) estimates of volcanic carbon emissions from the North Atlantic Igneous Province (active ~56 Ma and considered a major source of carbon release), and (2) the net global environmental response recorded in paleoclimate records such as δ18O (temperature), δ11B (ocean pH), and δ13C (carbon cycle). The difference between the environmental response to volcanic emissions alone and the recorded global response is attributed to feedback processes. Our Earth system model results suggest that carbon release from positive carbon cycle feedbacks (e.g. non-volcanic) likely approached or exceeded volcanic emission rates at the onset of the PETM, raising pCO2 by 1330 ppm and the global temperature by 4.4°C. The ‘net’ feedback emissions are negative during the PETM recovery. Carbon isotopes indicate that a sustained low emission flux of isotopically light carbon is required to slow down the δ13C recovery driven by organic carbon burial, potentially pointing to additional thermogenic or biogenic methane release during the recovery phase.

How to cite: Vervoort, P., Doherty, D., Greene, S. E., Jones, S. M., Dunkley Jones, T., Gaskell, D., and Ridgwell, A.: Quantifying net carbon cycle feedbacks across the Paleocene-Eocene Thermal Maximum, EGU General Assembly 2025, Vienna, Austria, 27 Apr–2 May 2025, EGU25-16652, https://doi.org/10.5194/egusphere-egu25-16652, 2025.

The Late Paleocene – Early Eocene period is characterised by several short-term warming episodes superimposed on already high temperatures and CO2 levels. These hyperthermal events are associated with negative carbon isotope excursions, which are thought to represent significant changes in the carbon cycle through input of isotopically light carbon into the exogenic carbon pool. Next to carbon release from melting permafrost, one large-scale carbon reservoir that might have been the source of this disturbance is marine methane hydrates. To study the potential role of this carbon reservoir in more detail, we expand the carbon cycle box model LOSCAR to include a methane hydrate reservoir. By adapting the carbon cycling parameterisations in the original LOSCAR ocean boxes to allow for organic carbon burial, and by determining a temperature-dependent gas hydrate stability zone in the sediment, we model the time-varying volume of marine methane gas hydrates. In order to investigate the dynamic response between methane hydrates and temperature fluctuations in the Eocene, we run simulations using the Early Eocene as a background state and orbital solutions plus noise as forcing, shedding new light on the role of methane hydrates in late Paleocene – early Eocene climate fluctuations.

How to cite: Elbertsen, M. and Cramwinckel, M.: Assessing the role of methane hydrates in the Late Paleocene – Early Eocene hyperthermals using a carbon cycle box model, EGU General Assembly 2025, Vienna, Austria, 27 Apr–2 May 2025, EGU25-17767, https://doi.org/10.5194/egusphere-egu25-17767, 2025.

EGU25-20307 | ECS | Orals | CL1.1.1

Enhanced continental weathering and carbon-cycle perturbations linked to volcanism during the P1 Glaciation of the Late Paleozoic Ice Age 

Luojing Wang, Dawei Lv, Junlin Li, Zhihui Zhang, John Isbell, Munira Raji, Wenxu Du, Zekuan Li, and Dongxu Jiang

The late Paleozoic ice age (LPIA) was the longest-lived glaciation of the Phanerozoic, and the demise of LPIA is the Earth’s only recorded transition from an icehouse to a greenhouse state. The P1 glaciation (Asselian-Sakmarian) was the most extensive phase of the LPIA, characterized by rapid climate change and several significant events, including widespread aridification in the low latitudes of Pangaea, episodic glacial expansion in Gondwana, and considerable fluctuations in CO2 concentrations. This study investigates the early Asselian warming event and its connection to volcanic activity during the Early Permian, using data from two stratigraphic sections in the North China Craton (NCC). We analyzed organic carbon isotopes (δ13Corg), total organic carbon (TOC), total sulfur (TS), aluminum, mercury content, and chemical weathering indices to track climate and carbon isotope changes during P1 Glaciation of the LPIA. Our results suggest that the early Asselian climate warming may have been driven by volcanic activity through the release of greenhouse gases. This study also contributes to understanding the correlation between volcanism and carbon perturbations during the LPIA.

How to cite: Wang, L., Lv, D., Li, J., Zhang, Z., Isbell, J., Raji, M., Du, W., Li, Z., and Jiang, D.: Enhanced continental weathering and carbon-cycle perturbations linked to volcanism during the P1 Glaciation of the Late Paleozoic Ice Age, EGU General Assembly 2025, Vienna, Austria, 27 Apr–2 May 2025, EGU25-20307, https://doi.org/10.5194/egusphere-egu25-20307, 2025.

The bauxite is a critical paleoclimatic proxy, and it is also the main material for refining aluminum. Therefore, it is of great scientific, economic and strategic significance to study the mineralization of bauxites. The formation of bauxites is largely affected by intense chemical weathering, closely related to temperature, precipitation and vegetation cover. In paleoclimatic studies, bauxites are used to qualitatively indicate warm, humid and vegetated environmental conditions, but how bauxites in the deep time were quantitatively related to temperature and precipitation has not been established, which limits the paleoenvironmental indication of bauxites and the metallogenic prediction. Here, we combine geological records with climate simulations to establish the quantitative relationships of bauxites with temperature and precipitation since the Mesozoic era. The Earth system model CESM1.2.2 and the vegetation model BIOME4 were combined to simulate the climate and vegetation distribution. Then the environmental information of the paleo-locations of bauxites is extracted, and the quantitative relationships between bauxites, and temperature, precipitation and vegetation are established. We show that bauxites formed with an annual mean temperature of 24.8 °C and precipitation of 1097 mm y-1 after 250 Ma. The climatic variations of bauxites are due to land distribution, climate states, and vegetation coverage. Our research results provide a new understanding of the mineralization of bauxites, and also offer a reference for the exploration of bauxites.

How to cite: Bao, X.: Quantitative constraints on the environmental conditions of bauxite formation since Mesozoic , EGU General Assembly 2025, Vienna, Austria, 27 Apr–2 May 2025, EGU25-20484, https://doi.org/10.5194/egusphere-egu25-20484, 2025.

EGU25-20768 | ECS | Orals | CL1.1.1

Late Carboniferous ice sheets in a coupled Earth-system model 

Julius Eberhard, Georg Feulner, Matteo Willeit, Hannah Sophia Davies, Benoît Bovy, Jean Braun, and Stefan Petri

The Late Paleozoic Ice Age (LPIA) was the latest phase of widespread glaciation on Earth before the current Late Cenozoic Ice Age. At its peak around 300 million years ago, ice sheets in southern Pangea reached their maximal extents. This knowledge comes from a plethora of geological evidence but has so far not been explored by fully three-dimensional coupled models of land ice and climate. Here we present results from the first peak-LPIA simulations with interactive ice sheets using CLIMBER-X, a fast coupled Earth-system model featuring a statistical–dynamical atmosphere and a frictional–geostrophic ocean. For a range of likely greenhouse-gas concentrations, we investigate how orbital geometry, topography, and the initialization of ice sheets affect the growth and distribution of land ice during the late Carboniferous. We find an especially distinct dependency on orbital geometry, with ice covering almost whole Gondwana in one case and being limited to the South American part in another, while keeping the greenhouse gases constant. We then plan to use the precipitation and ice-sheet cover output from the climate model to calibrate landscape evolution modeling with Fastscape and thereby obtain estimates of the global sediment flux during the LPIA. 

How to cite: Eberhard, J., Feulner, G., Willeit, M., Davies, H. S., Bovy, B., Braun, J., and Petri, S.: Late Carboniferous ice sheets in a coupled Earth-system model, EGU General Assembly 2025, Vienna, Austria, 27 Apr–2 May 2025, EGU25-20768, https://doi.org/10.5194/egusphere-egu25-20768, 2025.

The Ordovician-Silurian transition was a time of marked upheaval in global climate, ocean oxygenation and marine biodiversity. Geochemical and sedimentary evidence for anoxia in the late Hirnantian and Rhuddanian has led to the coining of a Hirnantian oceanic anoxic event, linked to globally widespread organic carbon burial and potentially a second pulse of the Late Ordovician Mass Extinction. Evidence from stable uranium isotopes indicates that a late Hirnantian shift towards more expanded anoxic marine conditions was global in nature, supporting widespread sedimentological data. However, how stable was the inferred early-middle Hirnantian background state of near-modern ocean oxygenation? If the late Katian was in fact characterised by a warm climate and expanded anoxic marine conditions (as hinted at by geochemical data), should we actually be reframing our discussion of late Ordovician ocean oxygenation and discussing a late Ordovician oceanic oxygenation event (or OOE) similar to those discussed in the late Neoproterozoic?


We integrate an updated synthesis of geochemical data across the Ordovician-Silurian with a new stage-by-stage series of 3D biogeochemical models to provide an updated perspective on the end-Ordovician Earth system. Our intermediate complexity Earth system modelling framework builds on global circulation and long-term carbon cycle modelling by coupling cGENIE to existing SCION and HADCM3L simulations. This enables us to present new reconstructions of 3D ocean biogeochemistry over key intervals of the Phanerozoic, including dissolved oxygen in shelf environments, volume of oxygen minimum zones and seafloor redox. Here, we find that circulation in icehouse climates has a dramatic impact on reconstructed ocean oxygenation. We further integrate this series with a sensitivity analysis interrogating the importance of Earth system boundary conditions to these predictions of non-linear climatic drivers of ocean oxygenation. Finally, we place this experimental analysis in the context of our knowledge of the Ordovician-Silurian Earth system and highlight future directions to reconcile data and model perspectives.

How to cite: Stockey, R.: Reconsidering the Hirnantian oceanic anoxic event – exploring the evidence for and implications of a late Ordovician oceanic oxygenation event, EGU General Assembly 2025, Vienna, Austria, 27 Apr–2 May 2025, EGU25-21433, https://doi.org/10.5194/egusphere-egu25-21433, 2025.

EGU25-21799 | Orals | CL1.1.1

Palaeogeographic reconstructions shape understanding of deep-time climate change 

Xiaoli Ma, Lewis A. Jones, Kilian Eichenseer, and Junxuan Fan

Oxygen isotope compositions (δ18O) have been widely used to reconstruct deep-time climate dynamics, which have been shown to vary through time and space. Reconstruction of the spatial pattern of these records relies on robust estimates of palaeolocations derived from Global Plate Models (GPMs). However, several different GPMs exist which vary in their palaeogeographic reconstruction, potentially impacting estimates of deep-time latitudinal temperature gradients and latitudinal-band temperatures. Since global mean temperatures are calculated as the sum of area-weighted latitudinal-band temperatures, variations in GPMs may also influence global mean temperature estimates. Here, we tested whether GPM choice impacts reconstructions of Early Palaeozoic climate by analysing an extensive Ordovician δ18O dataset compiled from bulk rocks, brachiopods, and conodonts. Using four open-access GPMs to reconstruct the paleogeographic distribution of sampled localities from our Ordovician δ18O dataset, we quantified discrepancies in palaeolatitudinal-band temperatures and global mean temperatures. Our results indicate that variations in GPM palaeogeographic reconstructions alone can lead to large differences (3–3.5°C) in palaeolatitudinal-band temperature and global-mean temperature estimates. Our findings suggest that GPM choice can substantially impact reconstructions of deep-time climate dynamics and careful consideration of the differences in palaeogeographic reconstructions between GPMs is required.

How to cite: Ma, X., Jones, L. A., Eichenseer, K., and Fan, J.: Palaeogeographic reconstructions shape understanding of deep-time climate change, EGU General Assembly 2025, Vienna, Austria, 27 Apr–2 May 2025, EGU25-21799, https://doi.org/10.5194/egusphere-egu25-21799, 2025.

EGU25-21897 | ECS | Orals | CL1.1.1

Assessing the Impact of Vegetation Data on HadCM3L Phanerozoic Climate Simulations 

Tianyi Chu, Daniel J. Lunt, and Junxuan Fan

Climate-model simulations are important tools for testing hypotheses about the drivers of shifts in climate and ecosystem distributions throughout the Phanerozoic. Initial simulations of Phanerozoic climates have been carried out using the HadCM3L climate model, with 109 time slices across the 540 million years. Each time slice represents a distinct stage, with CO2 concentrations prescribed to align the modeled global mean surface temperatures (GMST) with estimates of past GMST.

However, these simulations utilized modern plant functional types (PFT) and globally homogeneous surface properties across all Phanerozoic timescales. In reality, vegetation has evolved through time. So, use of modern PFT may introduce significant errors in climatically relevant variables (e.g., albedo). Consequently, the estimated values of modeled temperatures through time may be inaccurate.

The aim of this project is to implement more realistic representations of vegetation in the simulations, by utilizing PFTs that are appropriate for each time slice. For example, the early Ordovician would be characterized by low-lying, sparse vegetation dominated by bryophyte-like plants, which likely exhibited simple anatomy and physiology, were restricted to moist lowland habitats, and lacked deep anchoring structures.

As a first step towards this aim, we have set up a series of simulations that are simple continuations of the existing simulations, run for 110 years, but including more vegetation-specific outputs. Our analysis included visualizations of the Phanerozoic vegetation fraction, which pointed out clear inaccuracies, such as the unrealistic representation of vegetation during the early Phanerozoic. These findings emphasize the limitations of the original model’s assumptions about vegetation. Furthermore, we demonstrated that vegetation significantly influences surface temperature and found strong relationships between climate variables (such as precipitation and surface air temperature) and vegetation distribution. Our results underscore the need to make realistic adjustments to vegetation parameters in HadCM3L simulations.

How to cite: Chu, T., Lunt, D. J., and Fan, J.: Assessing the Impact of Vegetation Data on HadCM3L Phanerozoic Climate Simulations, EGU General Assembly 2025, Vienna, Austria, 27 Apr–2 May 2025, EGU25-21897, https://doi.org/10.5194/egusphere-egu25-21897, 2025.

EGU25-234 | ECS | Orals | SSP4.2

Oyster shells reveal low seasonality with winter precipitation in Bartonian India 

Aniket Mitra, Inigo A. Müller, Niels J. de Winter, Philippe Claeys, Béatrice A. Ledésert, and Kalyan Halder

A long-term cooling trend from middle Lutetian onwards (~44 Ma) was briefly interrupted by a short-lived warming event in the early Bartonian (~41 Ma), known as the Middle Eocene Climatic Optimum (MECO). At this stage, the Himalayan orogenesis was ongoing, and the mountain had not yet attained its current elevation, which now plays a crucial role in shaping Asia's seasonality and monsoon patterns. The Indian Subcontinent reached tropical latitudes in Eocene during its long voyage from the southern to the northern hemisphere, after its disjunction from Gondwanaland in the Early Jurassic. Given that seasonal temperature variation is relatively small at the tropics in the modern climate, exploring seasonality and monsoon patterns in the ice-free world of the early Bartonian can teach us about the response of seasonal variability to warming.

Kutch, a pericratonic rift basin located along the western margin of the Indian subcontinent, was at 6–7°N during the early Bartonian. The Harudi and Fulra Limestone formations, two successive Bartonian stratigraphic units (corresponding to SBZ 17), preserve sedimentary deposits with a moderate diversity of bivalves. Two oyster species—Flemingostrea sp. from upper Harudi Formation, and Pycnodonte sp. from basal Fulra Limestone—have been utilised to reconstruct the Bartonian climate and seasonality.

Dorso-ventral cross-sections of the shells underwent μXRF mapping, revealing the resilifers as the most pristine regions of the shells. High-resolution (25 µm) quantitative trace element profiles, conducted on the resilifers, show low concentrations of Mn and Fe indicative of good shell preservation. Incrementally sampled stable isotope (δ¹⁸Ocarb and δ¹³Ccarb) profiles display a sinusoidal pattern indicative of seasonal fluctuations throughout the oysters' growth. Subsamples corresponding to two of the lowest and highest δ¹⁸Ocarb values from each shell were further analysed for clumped isotopes (Δ47).

Clumped isotope thermometry, combined with δ¹⁸O records indicates that tropics experienced minimal seasonal temperature fluctuations (~3°C on average) in a range of 29±3°C to 36±2.8°C (95% Cl) in the early Bartonian. The oxygen isotope composition of the prevailing water body shows evidence for increased freshwater input during colder months.

This study suggests that early Bartonian seasonality range at tropical latitudes was similar than the modern one, but at a roughly 4 degree warmer level, with eventually higher precipitation during the colder season.  

How to cite: Mitra, A., Müller, I. A., de Winter, N. J., Claeys, P., Ledésert, B. A., and Halder, K.: Oyster shells reveal low seasonality with winter precipitation in Bartonian India, EGU General Assembly 2025, Vienna, Austria, 27 Apr–2 May 2025, EGU25-234, https://doi.org/10.5194/egusphere-egu25-234, 2025.

EGU25-1076 | ECS | Posters on site | SSP4.2

Interaction between depositional environment and associated taphonomic conservation of the Upper Jurassic bivalves of Kutch, Gujarat, India 

Ranita Saha, Shubhabrata Paul, Shiladri Shekhar Das, Subhendu Bardhan, Debattam Sarkar, Debarati Chattopadhyay, Arkaprava Mukhopadhyay, Arghya Poddar, Akash Char, Rudranil Basak, and Adrish Mahata

Kutch, a pericratonic basin at the western margin of India, provides a unique opportunity for paleontologists to study the interaction between depositional environments and taphonomic preservation of the bivalve shells, which prevail an enigmatic story in the true sense. Kutch holds thick marine sediments of approximately 3000 meters ranging from the Middle Jurassic to the Early Cretaceous period. However, this study represents a case study showing the relationship between the change in depositional environment and taphonomic preservation at the temporal scale from spatially distant two areas of Kutch, Wagad Uplift, and Lakhapar. Bharodiya and Kakarva, two localities of eastern Wagad Uplift and Lakhapar of the Kutch Mainland, preserve two differentially preserved bivalve shells regarding the depositional environment and associated energy conditions at different temporal intervals. The Kimmeridgian rocks from the Wagad Uplift show a convex upward-oriented shell, high degree of fragmentation and disarticulation, and size sorting, and suggest a transgressive lag deposit that has been reworked and deposited in a high energy condition. The taphonomic features of the Lakhapar area display a high diversity of bivalve fauna, a low degree of disarticulation and fragmentation, and a lack of any preferred orientation, indicating a maximum flooding zone sequence with low energy sediment starved offshore depositional environment. These two changes in deposition environment from the Kimmeridgian to the Tithonian period resulted in an inverse relationship between species richness and energy condition. The high-energy environment preferred to preserve large thick shelled bivalves and the low-energy condition preserved the small-sized taxa with more diverse compositions. Hence, the paleontological signals can be disentangled with the help of the preservation potential and taphonomic signatures.                

How to cite: Saha, R., Paul, S., Das, S. S., Bardhan, S., Sarkar, D., Chattopadhyay, D., Mukhopadhyay, A., Poddar, A., Char, A., Basak, R., and Mahata, A.: Interaction between depositional environment and associated taphonomic conservation of the Upper Jurassic bivalves of Kutch, Gujarat, India, EGU General Assembly 2025, Vienna, Austria, 27 Apr–2 May 2025, EGU25-1076, https://doi.org/10.5194/egusphere-egu25-1076, 2025.

EGU25-2932 | Orals | SSP4.2

Oxygen isotopes in tooth enamel: Strengthening the foundation of a foundational proxy method 

Gabriel Bowen, Kirsten Verostick, Benjamin Rivera, and Chris Stantis

Oxygen isotopes measured in the phosphate or carbonate groups of tooth enamel hydroxyapatite have been used as proxies for paleo-climate, seasonality, and migration throughout more than a half-century of research. Despite many successful applications, the fundamental relationships between enamel isotope ratios and environmental forcing factors remain relatively poorly documented and sometimes ambiguous. We revisit these relationships in the context of a new large-scale study of tooth enamel from modern humans. We reaffirm that geographic variation in the oxygen isotope ratio of environmental (drinking) water is the primary driver of variation in tooth enamel carbonate δ18O values and quantitatively predicts a large fraction (~70%) of the isotopic variance among individual USA residents. This is true regardless of whether individuals resided in a single or multiple locations during the period of tooth growth. We also highlight results from meta-analysis and new experimental work that demonstrate how inconsistencies in experimental and laboratory procedures can substantially obscure the relationship between tooth enamel and environmental δ18O. Collectively, these results suggest substantial promise for the future utility of enamel oxygen isotope data in modern and paleo- context, but emphasize that mindful sample selection and preparation are required to derive robust inferences from these data.

How to cite: Bowen, G., Verostick, K., Rivera, B., and Stantis, C.: Oxygen isotopes in tooth enamel: Strengthening the foundation of a foundational proxy method, EGU General Assembly 2025, Vienna, Austria, 27 Apr–2 May 2025, EGU25-2932, https://doi.org/10.5194/egusphere-egu25-2932, 2025.

EGU25-3025 | Posters on site | SSP4.2

Calibrating Greenland coralline algal proxies with high-resolution in situ water temperature 

Steffen Hetzinger, Jochen Halfar, and Alexandra Tsay

Geochemical paleoproxies from marine archives are typically calibrated with temperatures from satellite- or ship-based observations that are spatially averaged over large areas, or with temperature data measured at a distance to the sampling site. These observations do not necessarily reflect local conditions and averaging effects potentially reduce variability. However, this is often the only viable option as no other direct observations are available in most settings. In subarctic and arctic regions in situ observations are even rarer and the availability of subannual-resolution surface ocean climate archives is very limited as well, especially when compared to the tropics. Encrusting coralline algae are important shallow-marine calcifiers that provide high-resolution archives of past ocean and environmental variability, but only few calibration studies of algal proxies exist from the climatically important high-latitude regions. At the same time these regions have experienced the most drastic changes in recent decades, e.g. Arctic surface temperature warming is more than twice as large as the global average.

Here, we present results from calibrating subannual-resolution coralline algal proxies with four years of continuous in situ measured temperature in Disko Bay, Greenland. Sensors were deployed in summer 2019 at sites of sample collection, recording water temperature in hourly resolution, providing data from the same water depth where the corallines grow. Coralline algal samples (Clathromorphum compactum) were retrieved together with sensors in summer of 2023. Temperature cycles are matched to coralline growth increments and geochemical data analyzed by Laser Ablation ICP-MS. The four year overlap makes our record the longest continuous calibration interval for coralline algae from high-latitudes. We align element/Ca-ratios with sclerochronological results and compare temperature measurements and proxies to high-resolution satellite observations and reanalysis data. Pairing of sub-seasonal resolution element/Ca-ratio time series measured in the uppermost years of algal growth with high-resolution in situ temperature allows us to directly connect individual short-time variability and warming/cooling recorded in the algal record to real-time observations. Water temperature plays a major role in controlling underlying processes in recently observed regional and large-scale Arctic and Greenland Ice Sheet (GIS) change. Coralline algal samples resolve ultra-high-resolution Disko Bay environmental variability in close proximity to Jakobshavn Glavier, one of the largest GIS glaciers, which delivers a significant amount of freshwater to the coastal West-Greenland surface ocean. Our study is testing proxy-temperature relationships on multiple algal samples, facilitating intra- and intersample comparisons, and thus helps to improve calibration of long-term algal proxy records used for paleo-reconstructions.


How to cite: Hetzinger, S., Halfar, J., and Tsay, A.: Calibrating Greenland coralline algal proxies with high-resolution in situ water temperature, EGU General Assembly 2025, Vienna, Austria, 27 Apr–2 May 2025, EGU25-3025, https://doi.org/10.5194/egusphere-egu25-3025, 2025.

EGU25-4215 | Orals | SSP4.2

Nature of the Beast? Resolving the paleoecological history of the wolf (Canis lupus L., 1758)  

Angela Lamb, Fabienne Pigière, Diksha Bista, Amanda Burtt, and Danielle Schreve

The wolf (Canis lupus L. 1758) was a keystone predator throughout the Pleistocene in Europe and is a prime candidate for exploring past carnivore community and herbivore interactions, having persisted through multiple climatic cycles during the Quaternary. Wolves play a vital role in maintaining biodiversity, particularly in keeping mammalian herbivore and medium-sized carnivore numbers in check and thereby limiting over-browsing on vegetation and over-predation on small vertebrates respectively. Wolves further exert important indirect controls on ecosystem structure, riparian environments and the activities of foundation species such as beaver, as well as subduing mesocarnivore numbers, with associated benefits for birds and small mammals. The ripples from their activity can therefore be felt in diverse positive ways throughout the ecosystem but serious concerns exist as to the viability of European wolf populations under different scenarios of environmental and climate change. Although predatory behaviour is well documented in modern wolves, the short time scales (years to decades) of neoecological studies do not allow longer term patterns and any ensuing morphological responses to be captured. A continuous chronological perspective is therefore essential to progress our understanding. Our current project combines the study of diet and morphology in modern European wolves with that of British Pleistocene wolves, where a rich fossil record offers a chronologically well-resolved series of specimens spanning tens to hundreds of thousands of years. A key goal is therefore to understand how wolves have adapted to changing circumstances so that current and future conservation policy can be appropriately tailored. Here, we present variation in British fossil wolf diets to assess the impact of forcing factors such as changes in climate, environment, prey community and carnivore competition on feeding behaviour and the rates of change at which these occur. A multiproxy and multiscalar approach is adopted, combining direct measurement of wolf paleodiet through stable isotope analysis and dental microwear texture analysis. A more comprehensive understanding of carnivore community ecology and interactions in Pleistocene Britain will contribute to scientific understanding of the practicalities of re-wilding using extirpated, native large carnivores.

How to cite: Lamb, A., Pigière, F., Bista, D., Burtt, A., and Schreve, D.: Nature of the Beast? Resolving the paleoecological history of the wolf (Canis lupus L., 1758) , EGU General Assembly 2025, Vienna, Austria, 27 Apr–2 May 2025, EGU25-4215, https://doi.org/10.5194/egusphere-egu25-4215, 2025.

EGU25-4520 | ECS | Posters on site | SSP4.2

Using data assimilation to combine model outcomes and reconstructions of seasonality during past warm periods 

Niels de Winter, Barbara Goudsmit-Harzevoort, Brendan Oerlemans, Rob Witbaard, Pepijn Bakker, Julia Tindall, Alexander Farnsworth, and Martin Ziegler

Anthropogenic global change necessitates the improvement of our understanding of the dynamics of warmer climates in the past. Combining information from Earth’s climate history with numerical simulations of past climate helps us to identify gaps in our knowledge of climate mechanisms and improves projections for future climate1,2. Data assimilation is a valuable tool to reconcile information from climate reconstructions and models in a consistent statistical framework3. These data assimilation efforts have focused mostly on climate variability on geological timescales (thousands to millions of years). However, seasonal changes in climate parameters such as temperature and precipitation are a defining characteristic of climate zones and have a dominant impact on the impact of climate on nature and human society4.

This work lays the foundations for applying data assimilation techniques to compare and combine reconstructions and model information on a seasonal scale. We use seasonal-scale temperature reconstructions from incrementally grown fossil mollusc shells which record seasonality in their living environment during modern5, Pliocene4 and Cretaceous periods6. We combine these data with model outcomes from the same periods to arrive at a combined estimate of seasonal temperature variability and discuss the methodological choices that lead to this result. Using this data analysis product allows us to more easily interrogate the outcomes from climate models with various boundary conditions using proxy-based information on select climate variables. The aim is to lay the foundation for data assimilation for estimating short-term climate variability in the geological past from skeletal carbonate archives and comparing model and reconstruction outcomes.


References

  • Hakim, G. J. et al. The last millennium climate reanalysis project: Framework and first results. Journal of Geophysical Research: Atmospheres 121, 6745–6764 (2016).
  • Tierney, J. E. et al. Past climates inform our future. Science 370, (2020).
  • Dirren, S. & Hakim, G. J. Toward the assimilation of time-averaged observations. Geophysical Research Letters 32, (2005).
  • de Winter, N. J. et al. Amplified seasonality in western Europe in a warmer world. Science Advances 10, eadl6717 (2024).
  • Caldarescu, D. E. et al. Clumped isotope thermometry in bivalve shells: A tool for reconstructing seasonal upwelling. Geochimica et Cosmochimica Acta 294, 174–191 (2021).
  • de Winter, N. J. et al. Absolute seasonal temperature estimates from clumped isotopes in bivalve shells suggest warm and variable greenhouse climate. Commun Earth Environ 2, 1–8 (2021).

How to cite: de Winter, N., Goudsmit-Harzevoort, B., Oerlemans, B., Witbaard, R., Bakker, P., Tindall, J., Farnsworth, A., and Ziegler, M.: Using data assimilation to combine model outcomes and reconstructions of seasonality during past warm periods, EGU General Assembly 2025, Vienna, Austria, 27 Apr–2 May 2025, EGU25-4520, https://doi.org/10.5194/egusphere-egu25-4520, 2025.

EGU25-4571 | ECS | Orals | SSP4.2

Spatial patterns of trematode-induced pits on bivalve skeletons: Challenges and prospects for research on parasite-host dynamics 

Alexis Rojas-Briceno, John Warren Huntley, and Daniele Scarponi

Interactions between the parasitic larvae of digenean trematodes (mainly gymnophallids) and bivalves often result in characteristic shell malformations, i.e., pit-like traces. Tracking these traces through the Holocene and modern marine death assemblages has made studying parasite-host responses to natural and anthropogenic environmental change possible (e.g., Fitzgerald et al., 2024). Despite major breakthroughs, empirical explorations of parasite-host dynamics in the geological record are primarily based on trace occurrence data, overlooking that trace spatial patterns on the host skeleton could carry ecological information and potentially document different aspects of the parasite-host interactions (e.g., infective behavior, association with specific host anatomy, spatial relationships of traces with different qualitative properties such as size class, etc.). The Spatial Point Pattern Analysis of Traces (SPPAT) (Rojas et al. 2020) has been increasingly employed to overcome similar challenges in studying predatory traces on bivalve prey. Although this approach holds considerable promise for research on trematode–host dynamics, several assumptions and caveats need to be considered (e.g., the number of traces required to capture the parasite-host dynamics accurately, the reliability of point patterns constructed from multiple host skeletons in describing parasite interactions). Here, we introduce a spatially explicit framework for extracting information from spatial patterns of trematode-induced pits on bivalve shells using SPPAT, address methodological questions involved in assembling a point pattern of traces from multiple host specimens, and discuss critical issues related to drawing inferences from pooled point data. We illustrate our approach using a case study on late Holocene samples of the commercially relevant bivalve Chamelea gallina from the northern Adriatic of Italy. This species holds high commercial value in the seafood industry and is increasingly used in climate change research. The C. gallina case study reveals that trematode-induced malformations on bivalve shells are not random; they show an aggregated pattern for metacercaria traces of the same size, while an independent pattern arises when examining metacercaria-related traces of two distinct size classes. Our case study demonstrates the value of spatial information from parasite-induced traces, enhancing our understanding of parasite-host dynamics over time.

Rojas A, Dietl GP, Kowalewski M, Portell RW, Hendy A, Blackburn JK. 2020 Spatial point pattern analysis of traces (SPPAT): An approach for visualizing and quantifying site-selectivity patterns of drilling predators. Paleobiology 46, 259–271. https://doi.org/10.1017/pab.2020.15

Fitzgerald, E., Ryan, D., Scarponi, D., and Huntley, J. W. 2024: A sea of change: Tracing parasitic dynamics through the past millennia in the northern Adriatic, Italy. Geology; 52 (8): 610–614. https://doi.org/10.1130/G52187.1


How to cite: Rojas-Briceno, A., Huntley, J. W., and Scarponi, D.: Spatial patterns of trematode-induced pits on bivalve skeletons: Challenges and prospects for research on parasite-host dynamics, EGU General Assembly 2025, Vienna, Austria, 27 Apr–2 May 2025, EGU25-4571, https://doi.org/10.5194/egusphere-egu25-4571, 2025.

Time-averaging is the hard limit to the resolution of the fossil record, and it is of fundamental importance to interpreting fossil assemblages, especially when comparing fossil and living assemblages. To accurately estimate time-averaging, it is essential to separate the variation in fossil ages from the uncertainties in the estimates of those individual ages. Here, I use simulations as well as ~100 previously published, dated assemblages from the Holocene of Australia to examine the effectiveness of different analytical methods used to separate dating uncertainty from the variation associated with different aged fossils (time-averaging). In the vast majority (88%) of assemblages, the variation due to time-averaging exceeds the variation associated with age-estimation error, and  time-averaging estimates that correct for age-estimation error are not different from time-averaging estimates that ignore age-estimation error. 

Despite their parametric roots, error-corrected IQR and Estimated Time Averaging (ETA) perform well across a wide range of simulated assemblage age distributions, and relatively modest sample sizes (N ~12) yield reasonable time-averaging estimates. When reporting time-averaging estimates, age-estimation error should be explicitly reported and corrected for if age-estimation error represents more than 40% of the total assemblage age variation. While ETA estimates are not directly comparable to most published time-averaging values, ETA is an effective method for removing the impact of dating uncertainty from time-averaging estimates. A consensus on the reporting of time-averaging estimates is overdue. 

How to cite: Kosnik, M.: Quantifing time-averaging and the temporal resolution of the fossil record, EGU General Assembly 2025, Vienna, Austria, 27 Apr–2 May 2025, EGU25-4790, https://doi.org/10.5194/egusphere-egu25-4790, 2025.

EGU25-5563 | ECS | Orals | SSP4.2

Reconstructing Seasonality in Northwest Europe during the Early to Middle Eocene using Clumped Isotope Thermometry on Fossil Mollusks 

Barbara Goudsmit-Harzevoort, Niels de Winter, Johan Vellekoop, Frank Wesselingh, Rob Witbaard, and Martin Ziegler

The early to middle Eocene (56 – 41 Ma) is characterized by high atmospheric CO2 concentrations between 1,000 and 1,500 ppm, making it the warmest interval of the Cenozoic [1,2]. The future atmospheric CO2 concentration could reach similar levels around 2100, based on the high CO2 emissions scenario SSP5-8.5 [3]. By studying the Eocene climate, we gain understanding of how our climate system could operate under these extreme conditions.

An important aspect of climate is the seasonal temperature variability: the differences between summer and winter temperatures. Past seasonality can be reconstructed from sub-annually resolved climate archives such as the incremental growth bands of mollusk shells. We performed clumped isotope analysis on micro-samples of 11 fossil shells of early to middle Eocene age from shallow marine settings in northwestern Europe: 8 bivalves (species Venericor planicosta) and 3 gastropods (Haustator solanderi).

We obtained seasonal shell chronologies from the variability in the oxygen isotope records of the micro-samples, and we used the corresponding clumped isotope records to reconstruct the seasonal temperature variability of the seawater independent of its isotopic composition [4].

Our results suggest a moderate seasonal temperature variability of approximately 6 – 7 °C during both the early (56 – 48 Ma) and middle (48 – 41 Ma) Eocene. A comparison with Eocene climate model simulations suggests that models overestimate the observed seasonality due to colder winter temperatures in the model simulations compared to the reconstructions. This temperature record sheds light on the role of seasonality in mid-latitude shallow marine environments in hothouse climates and can aid our understanding of regional and seasonal scale model-data discrepancies.


[1] Rae, J. W. B., Zhang, Y. G., Liu, X. et al. (2021). Atmospheric CO2 over the past 66 million years from marine archives. Annual Review of Earth and Planetary Sciences, 49(1). https://doi.org/10.1146/annurev-earth-082420-063026

[2] The Cenozoic CO2 Proxy Integration Project Consortium (2023). Toward a Cenozoic history of atmospheric CO2. Science, 382(6675). https://doi.org/10.1126/science.adi5177

[3] Chen, D., Rojas, M., Samset, B. H. et al. (2021). Framing, context, and methods. In V. Masson-Delmotte, et al. (Eds.), Climate change 2021: The physical science basis. Contribution of Working Group I to the Sixth Assessment Report of the Intergovernmental Panel on Climate Change (pp. 147–286). Cambridge University Press.

[4] de Winter, N.J., Agterhuis, T., & Ziegler, M. (2021). Optimizing sampling strategies in high-resolution paleoclimate records. Climate of the Past, 17(3). https://doi.org/10.5194/cp-17-1315-2021

How to cite: Goudsmit-Harzevoort, B., de Winter, N., Vellekoop, J., Wesselingh, F., Witbaard, R., and Ziegler, M.: Reconstructing Seasonality in Northwest Europe during the Early to Middle Eocene using Clumped Isotope Thermometry on Fossil Mollusks, EGU General Assembly 2025, Vienna, Austria, 27 Apr–2 May 2025, EGU25-5563, https://doi.org/10.5194/egusphere-egu25-5563, 2025.

Reconstructing past biodiversity changes, and integrating these with modern biodiversity assessments, requires that fossil assemblages accurately capture key aspects of diversity (as represented by biodiversity metrics, for example). This is particularly true for the plant fossil record, where separate organs such as sporomorphs (pollen and spores) and leaves have to be used as proxies for understanding vegetation composition and diversity change through time. Although much attention has been focused on how well fossil plant assemblages capture variations in species richness, other aspects of diversity have until recently been relatively overlooked.

Here, I focus on phylogenetic diversity (PD), which represents the amount of evolutionary history contained in an assemblage of taxa. It can therefore provide a more detailed assessment of biodiversity gains and losses through time and space, and their underlying causes and consequences, relative to simple counts of the number of species present in a sample, and as such is used both as a conservation metric and as a tool to understand community assembly. To date, however, PD has been underexplored by palaeoecologists, and it is not currently known how well variations in vegetation PD across broad spatial scales are captured by sporomorph assemblage data. I compare estimates of seed plant PD from vegetation data and surface pollen samples from across North and South America. The results indicate a relatively low concordance between vegetation and pollen PD, and differing relationships with climate data, suggesting that sporomorph data cannot be used as a straightforward PD record. Other data sources (e.g. aDNA data for late Quaternary datasets, macrofossil data in deeper time settings) need to be considered for reconstructing vegetation PD through time. More generally, how well sporomorph data captures other aspects of plant biodiversity, and how successfully the plant fossil record can be used for conservation-relevant questions, ought to be critically (re-)assessed.

How to cite: Jardine, P.: How well does palynological data represent vegetation phylogenetic diversity?, EGU General Assembly 2025, Vienna, Austria, 27 Apr–2 May 2025, EGU25-5945, https://doi.org/10.5194/egusphere-egu25-5945, 2025.

EGU25-6564 | Orals | SSP4.2

Using paleodata to map parasite diversity throughout Holocene 

Kenneth De Baets and Karina Vanadzina

Parasites make up a significant portion of the global biomass and are integral to the healthy functioning of modern ecosystems. Despite their importance today, past changes in parasite distribution and diversity remain largely unexplored due to their limited preservation potential in the fossil record. Using information from more than 700 archaeological and paleoparasitological studies, we compiled a comprehensive database of parasite finds from the Holocene to address this knowledge gap. Our aim was to provide high-resolution spatial and temporal data on parasite occurrences to facilitate their use beyond archaeological literature, e.g., in macroevolutionary analyses and in ecological modelling of future trends in parasite distribution. The database includes more than 3,000 occurrences, which, along with information on their locality, age, taxonomic identity of the parasite and its potential hosts within relational database framework, allows users to build comprehensive profiles of parasite diversity on different geographical scales or spanning a particular time period. The majority of parasite finds consist of resistant eggs or trace evidence of intestinal helminths, such as nematodes (particularly genera Ascaris and Trichuris) and flatworms (genera Dibothriocephalus, Taenia and Fasciola), recovered from sediment samples and coprolites associated with human settlements or burials. Most parasite finds have been identified to at least the genus level and are mostly concentrated in the late Holocene period, with a significant increase in occurrences at the start of the Middle Ages. Using various modelling approaches, we demonstrate that the presence of the most common genera of intestinal parasites in archaeological record throughout the Holocene correlate with increases in human population density and seasonality.

How to cite: De Baets, K. and Vanadzina, K.: Using paleodata to map parasite diversity throughout Holocene, EGU General Assembly 2025, Vienna, Austria, 27 Apr–2 May 2025, EGU25-6564, https://doi.org/10.5194/egusphere-egu25-6564, 2025.

EGU25-7336 | Orals | SSP4.2

Shells in the seagrass: Holocene mollusks as a tool for identifying unaltered habitats 

Michal Kowalewski, Louis Grimmelbein, Savanna Barry, Sahale Casebolt, Alexander Hyman, Katherine Cummings, and Thomas Frazer

Surficial accumulations of marine mollusk shells archive information about ecosystems from previous centuries and millennia and can be used not only to measure recent human impacts but also detect habitats that have remained relatively unaltered. In this case study, we applied this near-time conservation paleobiology approach to assess the status of seagrass meadows that form structured habitats along the northern Gulf coast of Florida. Previous studies suggest that seagrass habitats in the study area may have remained relatively unaltered. We tested the “pristine seagrass” hypothesis by comparing living mollusks to the surficial mollusk accumulations time-averaged over the last three millennia. Samples were collected hierarchically at six estuaries (21 sites total) and live-dead comparisons were carried out at five observational scales: (1) size fractions within quadrats, (2) quadrats within sites, (3) sites within estuaries, (4) estuaries, and (5) the entire study area. At all scales, the species rank abundances of live and dead mollusks were positively and significantly correlated suggesting concordance in faunal composition. Similarly, local species richness and species evenness were congruent when comparing live and dead samples. Non-metric Multidimensional Scaling (NMDS) ordinations and pairwise Bray-Curtis similarities indicated consistent trends in the distribution of past and present mollusk faunas along a spatial gradient in productivity. The results support the hypothesis that seagrass habitats in the study area have not been notably modified by human activities and reinforce the urgency for continued conservation of the seagrass ecosystem of the northern Gulf coast of Florida. The results also suggest that the studied seagrass system can serve as a comparative benchmark for evaluating changes in other seagrass ecosystems that have been more strongly affected by human activities.

How to cite: Kowalewski, M., Grimmelbein, L., Barry, S., Casebolt, S., Hyman, A., Cummings, K., and Frazer, T.: Shells in the seagrass: Holocene mollusks as a tool for identifying unaltered habitats, EGU General Assembly 2025, Vienna, Austria, 27 Apr–2 May 2025, EGU25-7336, https://doi.org/10.5194/egusphere-egu25-7336, 2025.

Dead-shell and fossil assemblages are tantalizing sources for information on past ecosystem-response to natural and anthropogenic perturbations. However, assessing the effects of interspecific differences in preservation on species abundances time-averaged dead-shell assemblages is hampered by the lack of long-term compositional data on present-day living assemblages. Here, we compare a unique, multidecadal-scale dataset of living assemblages (N~500,000) with surficial time-averaged death assemblages (N~40,000) from the southern California shelf to estimate the compositional bias that might arise from inherent differences in skeletal durability. We show that shell thickness is, among other four traits considered (shell size, mineralogy, organic content, and mode of life), the most important trait modifying molluscan species abundances. Using this as the null benchmark for live-dead discordance that is taphonomic in origin, the remainder of mismatch, such as the greater abundance of epifaunal suspension-feeders and siphonate deposit-feeders in death assemblages owes in fact to their ecological decline in recent centuries, even though their thicker shells and other attributes make them more preservable relative to thin-shelled remains of infaunal chemosymbiotic and detritus-feeders. Applying a correction factor informed by shell thickness sharpens the ability of live-dead mismatch to detect ecosystems modulated by human stressors, crucial to management and conservation decisions.

How to cite: Tomašových, A. and Kidwell, S. M.: Correcting for durability bias in estimating the composition of death and fossil assemblages: implications for understanding past ecological changes, EGU General Assembly 2025, Vienna, Austria, 27 Apr–2 May 2025, EGU25-7812, https://doi.org/10.5194/egusphere-egu25-7812, 2025.

EGU25-8510 | ECS | Orals | SSP4.2

Dietary niche partitioning among large sharks in the Late Cretaceous Western Interior Seaway of North America documented by zinc isotopes 

Jeremy McCormack, Michael L. Griffiths, Harry Maisch IV, Martin A. Becker, Wolfgang Müller, Jade Knighton, Robert Eagle, and Kenshu Shimada

The Western Interior Seaway (WIS) was a major epicontinental sea that divided North America during the Late Cretaceous with a rich ecosystem that hosted a wide variety of marine life. The seaway was home to a diverse range of species, from microscopic planktonic organisms to giant reptiles and sharks. However, food web structures and trophic interactions among Late Cretaceous marine taxa remain largely ambiguous due to the challenges in reconstructing ecological interactions in the fossil record. Fossil evidence of predator-prey interactions such as preserved bite marks, stomach content or faeces is limited. For sharks, trophic interactions can be inferred from morphological comparisons of teeth with modern counterparts. Yet, none of these methods alone can decisively identify the overall diet nor can they quantify a species’ trophic position. Thanks to recent methodological advancements, an animal’s trophic position can now be reconstructed on geologic timescales by analysing geochemical proxies preserved in dental enamel(oid). Among these novel proxies are zinc isotope ratios (66Zn/64Zn), reported as δ66Zn value, a trophic-level proxy that is increasingly applied to address archaeological and palaeobiological research questions.

Here we use enamel(oid) δ66Zn values to investigate the food web structures and trophic positions among lamniform sharks within the WIS. We focus on specimen from two Upper Cretaceous localities in the U.S., the Tocito Sandstone-Mulatto Tongue of the Mancos Shale in New Mexico and the Codell Sandstone Member of the Carlile Shale in Kansas. The fossil assemblages are dated to the Turonian-Coniacian transition, just prior to the radiation of Mosasauroidea (extinct marine lizards) to becoming the dominant marine predator of the WIS. Our results demonstrate well-preserved enamel(oid) δ66Zn values in both localities, but locality-specific differences in the diagenetic modification of dentine δ66Zn values. We highlight significant resource partitioning among the 16 analysed taxa within the WIS. Archaeolamna cf. A. kopingensis, Cretodus sp. and Cretoxyrhina mantelli occupied very high trophic positions, whereas Cretalamna cf. C appendiculata was likely foraging opportunistically across several trophic levels. We expand the use of enamel(oid) δ66Zn analyses to Mesozoic fossils and demonstrate that the analyses of enameloid δ66Zn values of multiple taxa within fossil assemblages enables robust reconstructions of food web dynamics and trophic interactions, providing new avenues for palaeobiological and evolutionary research in deep time.

How to cite: McCormack, J., Griffiths, M. L., Maisch IV, H., Becker, M. A., Müller, W., Knighton, J., Eagle, R., and Shimada, K.: Dietary niche partitioning among large sharks in the Late Cretaceous Western Interior Seaway of North America documented by zinc isotopes, EGU General Assembly 2025, Vienna, Austria, 27 Apr–2 May 2025, EGU25-8510, https://doi.org/10.5194/egusphere-egu25-8510, 2025.

EGU25-8996 | ECS | Orals | SSP4.2

Advancements in the Study and Conservation of Coralligenous Bioconstructions: Integrating ROV-Based Sampling, Geobiology and Geochemistry 

Giuseppe Maruca, Mara Cipriani, Rocco Dominici, Carmine Apollaro, Giovanni Vespasiano, Francesco Perri, Gianpietro Imbrogno, Fabio Bruno, Antonio Lagudi, Valentina Alice Bracchi, Daniela Basso, Antonietta Rosso, Rossana Sanfilippo, and Adriano Guido

Among the bioconstructed habitats of the Mediterranean Sea, Coralligenous is undoubtedly the most important ecosystem because of its extent, complexity and heterogeneity, which supports very high levels of biodiversity. Coralligenous is a hard-biogenic substrate mainly produced by the superposition of several generation of calcareous red algae, living in dim light conditions. Coralligenous contributes to seascape shaping through geological times, producing various morphotypes and causing geomorphological changes of the seafloor. Nevertheless, these bioconstructions are characterized by a low accretion rate and a high sensitivity to natural and anthropic impacts, including climate changes. For all these reasons, Coralligenous has since long time been the object of special interest by the UNEP RAC/SPA and considered among the priority habitats for monitoring and conservation by the EU. Recent technological advances have enhanced the study and preservation of these ecosystems. An innovative minimally invasive ROV-based coring systems have been developed under the “FISR- CRESCIBLUREEF” project and upgraded in the frame of the project “Tech4You PP2.3.1 Action 1 (CUP H23C22000370006) with integration of robotic and AI-based computer vision technologies for accurate 3D reconstruction, sampling, and mapping of these marine bioconstructions.

Using the protocol proposed by Cipriani et al. (2024), coralligenous core samples, collected from Marzamemi (Sicily, Italy) with ROV-based technologies, were compared with data obtained from coralligenous build-ups sampled in the same area by scuba-divers. Comparison between microfacies of core-samples and those of “tale quale” build-ups revealed no significant differences in term of abundance and relationship between skeletal frame-builders and non-skeletal carbonate components, despite the much smaller size of the core sample. These results allow to consider the ROV-based system as a powerful tool to obtain representative samples of bioconstructions for geobiological, environmental and paleoenvironmental studies without making invasive sampling, which would damage these fragile and delicate ecosystems.

Moreover, an integrated geochemical/geobiological approach has been utilized in order to identify possible proxies for short- and long-term environmental studies. This multidisciplinary approach showed an evident relationship between chemical composition of the carbonate minerals and the waters in which Coralligenous forms. Positive anomalies in heavy metals were found in bioconstructions and surrounding seawaters. Such enrichments could result from pollutants introduced into the marine system by human activities and recorded by the components of the bioconstructions. These data allow to consider coralligenous build-ups as environmental database that continuously record environmental disturbance, enabling temporal reconstruction of the marine environment over time.

Although coralligenous bioconstructions are present along almost all Mediterranean continental shelf, their distribution is still underestimated and has been mapped only in few areas. For this reason, a protocol for benthic habitat mapping were also proposed and tested in shallow coastal waters of Isola Capo Rizzuto Marine Protected Area (Calabria, Italy). The method has proven capable not only of identifying coralligenous bioconstructions, but also of quantitatively defining their 3D distribution in terms of covered surface, volume and thickness. Combining this mapping protocol with minimally invasive sampling systems and geobiological-geochemical characterization of marine bioconstructions, a potent instrument for monitoring, protecting and enhancing these delicate ecosystems could be obtained.

How to cite: Maruca, G., Cipriani, M., Dominici, R., Apollaro, C., Vespasiano, G., Perri, F., Imbrogno, G., Bruno, F., Lagudi, A., Bracchi, V. A., Basso, D., Rosso, A., Sanfilippo, R., and Guido, A.: Advancements in the Study and Conservation of Coralligenous Bioconstructions: Integrating ROV-Based Sampling, Geobiology and Geochemistry, EGU General Assembly 2025, Vienna, Austria, 27 Apr–2 May 2025, EGU25-8996, https://doi.org/10.5194/egusphere-egu25-8996, 2025.

EGU25-11409 | ECS | Posters on site | SSP4.2

Surviving the heat: Long-term growth patterns of Adriatic gobies reconsructed from otolith analysis  

Isabella Leonhard, Emilia Jarochowska, Rafał Nawrot, Lovrenc Lipej, and Martin Zuschin

Marine fishes are increasingly affected by climate warming and anthropogenic stressors, particularly since the beginning of the Industrial Revolution. The widely accepted Temperature-Size Rule (TSR) predicts that aquatic ectotherms grow faster, mature earlier, but attain smaller adult sizes under warmer conditions. However, its universal applicability remains controversial, and growth responses vary among species, ontogenetic ages and ecosystems. Fossil fish remains offer a unique opportunity to understand long-term growth and body size variability, providing historical baseline data, predating significant human impacts. Otoliths,  incrementally grown CaCO3 structures in the inner ear of teleost fishes, are well-preserved in the fossil record and exhibit species-specific morphologies. These biominerals preserve detailed records of growth, age, life history, and environmental conditions in the form of daily, seasonal, and annual growth bands that can be analyzed through sclerochronological analyses. Our study focuses on the black goby (Gobius niger Linnaeus, 1758), a non-commercial, resident demersal species that is highly abundant in temperate shelf regions of the Atlantic and Mediterranean Sea, today and in the geological past. We use fossil otoliths from Holocene sediment cores off the coast of Piran (Slovenia) in the northern Adriatic Sea and modern otoliths from living populations caught in the same area to test whether anthropogenic climate warming has altered the growth patterns of this species, as predicted by the TSR. To assess growth patterns over the past millennia, sclerochronological analyses, including light microscopy and backscatter electron imaging of incremental records, are combined with radiocarbon dating on the same specimens. Our first results reveal no significant differences in overall growth patterns between fossil and modern populations. However, modern otoliths exhibit greater structural complexity and stress-related features, such as vaterite formations, alongside more variable growth patterns. Our study highlights the importance of integrating fossil and modern data to examine long-term growth trends and to expand our knowledge beyond commercially important and charismatic species to inform conservation and management strategies today.

How to cite: Leonhard, I., Jarochowska, E., Nawrot, R., Lipej, L., and Zuschin, M.: Surviving the heat: Long-term growth patterns of Adriatic gobies reconsructed from otolith analysis , EGU General Assembly 2025, Vienna, Austria, 27 Apr–2 May 2025, EGU25-11409, https://doi.org/10.5194/egusphere-egu25-11409, 2025.

EGU25-12336 | Orals | SSP4.2

Collapse of a bivalve fishery documented by historical records and paleontological data 

Rafał Nawrot, Melita Peharda, Hana Uvanović, Adam Tomašových, Sebastian Zemann, and Martin Zuschin

Archival data sources can bridge the gap between the paleoecological and ecological time-series and provide a socio-economic context for the understanding of long-term changes in populations of exploited marine species. Detailed fishery statistics from the eastern Adriatic Sea extend back to the early 1870s when the Austro-Hungarian maritime administration initiated a systematic and centralized reporting of annual landings. Here we combine these data with early naturalist accounts to track changes in the Ark shell (Arca noae) populations in that area over the last 150 years. Our results indicate that the collapse of the Ark shell fishery in the 1950s was preceded by at least 80 years of intensive exploitation. During that time A. noae fishery was one of the most important in the eastern Adriatic with the annual catch regularly exceeding 200 t and reaching as much as ~780 t in 1879. At the same time it was one of the cheapest marine products available on the market, consumed primarily by the poor. Historical testimonies indicate that by the late 19th century, fishery administrators and naturalists were well aware of the adverse effects of overexploatiation of marine populations and destructive fishing practices. However, A. noae was explicitly excluded from the regulations establishing legal size limits and no-catch periods that were introduced in the 1880s to protect the Mediterranean mussel (Mytilus galloprovincialis) and European flat oyster (Ostrea edulis), two bivalve species characterized by lower annual landings but much higher market value. Following a mass mortality event in the late 1940s, the annual catch of A. noae rapidly declined and has remained below ~30 t until today – an order of magnitude lower compared to the late 19th and early 20th century. Decades-long, intense harvesting of A. noae may be one the major drivers of the significant shift in its life history characteristics, which was previously documented by sclerochronological analyses of modern and fossil (middle to late Holocene) shells of this species.

How to cite: Nawrot, R., Peharda, M., Uvanović, H., Tomašových, A., Zemann, S., and Zuschin, M.: Collapse of a bivalve fishery documented by historical records and paleontological data, EGU General Assembly 2025, Vienna, Austria, 27 Apr–2 May 2025, EGU25-12336, https://doi.org/10.5194/egusphere-egu25-12336, 2025.

EGU25-12822 | ECS | Posters on site | SSP4.2

Reconstructing Holocene primary productivity in the northern Adriatic Sea using δ15N of bivalves 

Lukas Schweigl, Simone Moretti, and Daniele Scarponi

Primary productivity is a critical parameter of marine ecosystems, yet in many coastal areas, it has been significantly altered by human activities. The Northern Adriatic Sea (NAS), a shallow epicontinental sea bordered by the Italian and Balkan peninsulas, exemplifies this phenomenon. In the 20th century, eutrophication caused by substantial fertilizer use, industrial discharge, and high riverine input led to frequent algal blooms, bottom hypoxia, and mucilage events. Over the past three decades, however, environmental regulations and declining river discharge have reduced nutrient input, leading to decreased eutrophication.

These shifts in primary productivity have profoundly impacted marine communities. Understanding how communities respond to such changes is essential as climate change and anthropogenic pressures continue to shape the NAS. Fortunately, the NAS provides historical analogs due to marked fluctuations in freshwater, sediment, and nutrient input during the Holocene.

This study employs nitrogen stable isotope values (δ15N) in shell-bound organic matter of bivalves as a proxy for past primary productivity. δ15N is fractionated by primary producers and reflects nutrient dynamics within an ecosystem. As low-level consumers, bivalves offer δ15N values indicative of the food web base, providing a more stable proxy than primary producers, which are highly sensitive to short-term environmental fluctuations. The robust (sub)fossil record of bivalves allows correlations between changes in primary productivity and community turnovers over time.

Our research focuses on Varicorbula gibba, an infaunal filter feeder abundant in the NAS throughout the Holocene and increasingly dominant during 20th-century eutrophication due to its opportunistic nature. The first step of this study involves calibrating δ15N values from live bivalves against water samples collected across a productivity gradient in the NAS. This calibration will assess how well shell-bound δ15N reflects variations in primary productivity along an onshore-offshore gradient.

δ15N analysis is conducted using the denitrifier method, wherein nitrogen species from bivalve and water samples are oxidized, bacterially transformed into N₂O, and analyzed via mass spectrometry. Understanding how δ15N of V. gibba relates to its environment enables us to extend this analysis to (sub)fossil specimens, reconstructing Holocene primary productivity changes and their ecological impacts.

By providing a historical baseline, this study offers valuable insights into the NAS's past ecosystem dynamics and serves as an analog for predicting future changes under ongoing environmental pressures.

How to cite: Schweigl, L., Moretti, S., and Scarponi, D.: Reconstructing Holocene primary productivity in the northern Adriatic Sea using δ15N of bivalves, EGU General Assembly 2025, Vienna, Austria, 27 Apr–2 May 2025, EGU25-12822, https://doi.org/10.5194/egusphere-egu25-12822, 2025.

EGU25-13199 | ECS | Posters on site | SSP4.2

Can we improve the accuracy of climate reconstructions from fossil shells by measuring internal water in their carbonate? 

Brendan Oerlemans, Barbara Goudsmit-Harzevoort, Jeroen H.J.L. van der Lubbe, Rob Witbaard, Jan van Gils, Pieter Z. Vroon, Melita Peharda, Didier M. Roche, and Niels J. de Winter

Bivalve mollusc shells have proven to be promising recorders of environmental variability on short time-scales: incremental growth over their lifetimes (~ 1 – 100 years) allows for high resolution temporal sampling in their carbonate shells1. Seasonal and even daily environmental variability have successfully been reconstructed using fossil shells, e.g. 2–4.

However, these shells are not made up of pure carbonates but also contain organic matter and internal fluids5. Understanding the formation pathways and associated isotopic and trace elemental fractionation of these components of the shell carbonate system is important to deconvolute the bulk carbonate chemical signal. Furthermore, measurements of oxygen isotopes (δ¹⁸O) of internal fluids and carbonate coupled with clumped isotope (Δ₄₇, Δ₄₈) measurements of the carbonate can constrain disequilibrium precipitation and diagenetic alteration processes6,7. Accounting for these processes allows for improved δ¹⁸O-based temperature reconstructions. As it is yet not well-constrained where internal fluids are present in biogenic carbonates, their significance for shell formation and as an environmental indicator is currently largely unknown8.  

Utilizing bivalve molluscs cultivated under closely monitored environmental conditions, we develop a method to quantify the different components of the shell carbonate system, analyse their respective isotopic and elemental signatures and correlate these with conditions experienced during growth. Modern bivalve shells collected from a wide range of present-day climate zones allow us to assess the performance of mollusc shells as archives for environmental conditions. This approach aims to provide a robust framework for improved future mollusc-based climate reconstructions and more accurate interpretation of chemical and isotope proxies in carbonate archives from past climates and environments.


1. Ivany, L. C. Reconstructing paleoseasonality from accretionary skeletal carbonates - challenges and opportunities. Paleontol. Soc. Pap. 18, (2012).

2. de Winter, N. J. et al. Amplified seasonality in western Europe in a warmer world. Sci. Adv. 10, eadl6717 (2024).

3. Kniest, J. F. et al. Dual clumped isotopes from Mid-Eocene bivalve shell reveal a hot and summer wet climate of the Paris Basin. Commun. Earth Environ. 5, 1–10 (2024).

4. Arndt, I. et al. 20,000 days in the life of a giant clam reveal late Miocene tropical climate variability. Palaeogeogr. Palaeoclimatol. Palaeoecol. 112711 (2025) doi:10.1016/j.palaeo.2024.112711.

5. Lécuyer, C. & O’Neil, J. R. Stable isotope compositions of fluid inclusions in biogenic carbonates. Geochim. Cosmochim. Acta 58, 353–363 (1994).

6. Nooitgedacht, C. W., van der Lubbe, H. J. L., Ziegler, M. & Staudigel, P. T. Internal water facilitates thermal resetting of clumped isotopes in biogenic aragonite. Geochem. Geophys. Geosystems 22, e2021GC009730 (2021).

7. Staudigel, P. et al. Fingerprinting kinetic isotope effects and diagenetic exchange reactions using fluid inclusion and dual-clumped isotope analysis. Geochem. Geophys. Geosystems 24, e2022GC010766 (2023).

8. de Graaf, S. et al. Analytical artefacts preclude reliable isotope ratio measurement of internal water in coral skeletons. Geostand. Geoanalytical Res. 46, 563–577 (2022).

How to cite: Oerlemans, B., Goudsmit-Harzevoort, B., van der Lubbe, J. H. J. L., Witbaard, R., van Gils, J., Vroon, P. Z., Peharda, M., Roche, D. M., and de Winter, N. J.: Can we improve the accuracy of climate reconstructions from fossil shells by measuring internal water in their carbonate?, EGU General Assembly 2025, Vienna, Austria, 27 Apr–2 May 2025, EGU25-13199, https://doi.org/10.5194/egusphere-egu25-13199, 2025.

EGU25-13458 | ECS | Orals | SSP4.2

 Past seawater temperature in Paleo-Tokyo Bay during MIS 9 reconstructed from oxygen isotopes of fossil shells of Mercenaria stimpsoni (Bivalvia) 

Shiono Miki, Bernd R. Schöne, Tomoki Chiba, Christoph Gey, Daniel Vigelius, and Kotaro Shirai

Paleo-Tokyo Bay, which existed in Central Japan during MIS 9 when climate was globally warm and sea level was high, potentially provides an analogue to the contemporary global warming trends. Although a large number of well-preserved shells is available from marine deposits of Paleo-Tokyo Bay (Yabu Formation, Shimosa Group), seawater temperature in Paleo-Tokyo Bay has so far largely remained unknown. The majority of shells found in respective strata belong to the cold-water bivalve, Mercenaria stimpsoni, with a lifespan exceeding 100 years. This is interesting as the global climate during MIS 9 was warm. Recently, Miki et al. (2024) quantified past seawater temperature using fossil shells of this species, but they used only one individual of MIS 9. Hence, a detailed understanding of seawater temperature and its influence on shell growth is still missing.

Here, we aimed to further substantiate seawater temperature conditions of Paleo-Tokyo Bay during MIS 9 using oxygen isotope data of five additional M. stimpsoni shells collected from two outcrops (Semata and Takakura). We also assessed how the paleoenvironmental conditions affected the growth rate of the bivalves.

Samples were cleaned with tap water and then cut along the maximum growth axis to obtain two slices of shells. One slice was polished and stained with Mutvei’s solution for growth pattern analysis. The other slice was used for isotope analysis. Shells were sampled with a computer-controlled micromilling system at low drill speed to produce CaCO3 powder for oxygen isotope analysis. Isotope analysis was performed by means of CF-IRMS (continuous flow – isotope ratio mass spectrometry; Thermo Fisher MAT 253; reaction temperature: 72 °C). The analytical precision was better than ±0.10 ‰. δ18O-derived temperature was computed using two different paleothermometry equations, i.e., expression by (i) Grossman and Ku (1986, Chem. Geol. Isot. Geosci. Sect.) with the scale correction by Gonfiantini et al. (1995, IAEA Rep.) and (ii) Kim et al. (2007, Geochim. Cosmochim. Acta). For the latter, the oxygen isotope data were adjusted for different acid fractionation factors of aragonite (shell) and calcite (reference materials) (Kim et al., 2007, Chem. Geol.). The δ18Oseawater value was assumed to be 0 ‰ in all calculations.

The seasonal changes in seawater temperature during consecutive five to seven years were reconstructed from five specimens. All shells recorded maximum seawater temperatures above 18 or 20 °C (first value using the equation by Grossman & Ku, 1986; second value Kim et al., 2007). Such temperatures were probably highly stressful for specimens of this cold-water species resulting in growth cessation and formation of dark bands. Seasonal shell growth started at a temperature of 12 to 16 °C. Those values were clearly higher than those of modern shells (approximately 10 °C). Fossil M. stimpsoni seem to have been adapted to warmer seawater than modern specimens. In conclusion, fossil shells from Paleo-Tokyo Bay (Shimosa Group) can provide snapshots of a warmer world and a key insight into its influence on the bivalves.

How to cite: Miki, S., R. Schöne, B., Chiba, T., Gey, C., Vigelius, D., and Shirai, K.:  Past seawater temperature in Paleo-Tokyo Bay during MIS 9 reconstructed from oxygen isotopes of fossil shells of Mercenaria stimpsoni (Bivalvia), EGU General Assembly 2025, Vienna, Austria, 27 Apr–2 May 2025, EGU25-13458, https://doi.org/10.5194/egusphere-egu25-13458, 2025.

Museums worldwide have organized collections of hundreds of corals, yet most studies of coral museum records in the United States focus on DNA for symbiosis and taxonomic investigations. Few researchers have explored processing these collections for insights into ecological resilience, particularly for marine species in and near the Caribbean. This study utilizes two large coral reef databases from natural history museums to track the presence and absence of Floridian coral reef genera and their traits from 1887 to 2024 in response to acute and chronic disturbances. The aim is to identify coral genera and their characteristic traits to better understand the influence of sea surface temperature anomalies and hurricane exposure. These findings are then compared to available in-situ studies to assess whether coral museum records can reliably inform future modeling and enhance understanding of species retention or loss on regional and paleoecological scales. This research serves as a case study for applying similar approaches to other regions in the Caribbean and global reef locations.

How to cite: Griffith, A.: Tracking Reef Resilience Through Museum Collections: Presence-Absence Analysis of Floridian Coral Traits Over Time, EGU General Assembly 2025, Vienna, Austria, 27 Apr–2 May 2025, EGU25-14048, https://doi.org/10.5194/egusphere-egu25-14048, 2025.

The species richness and shell size distribution of major clades and functional groups among gastropods, a key element of the Modern Evolutionary Fauna (MEF), underlines the dominant role at modern tropical latitudes of carnivorous Caenogastropoda and Heterobranchia, including small-sized ectoparasites and micrograzers. The escalation hypothesis emphasises prey-predator interactions as gastropods’ macroevolutionary drivers during the Mesozoic Marine Revolution, but overlooks the significance of the highly-diversified smaller species. The early Mesozoic roots of the Neogastropoda, active predators particularly diversified since the Cretaceous and eminent extant members of the MEF, are poorly understood. I revise the tropical fossil record of the Permian-Triassic mass extinction (PTME), the major in animal history, and the Triassic rise of the MEF. The study suggests that non-carnivorous species dominated the gastropod fauna immediately before and after the PTME; Permian micrograzers mainly fed on sponges and waned during the rise of the MEF; ectoparasites and micrograzing carnivores diversified in the second part of the Middle Triassic; larger predators are lacking throught the interval. Patterns of gastropod species richness, size and form, the fossil record of reef-builders and other benthic invertebrates, and an analysis of stem neogastropods jointly highlight a Middle Triassic revolution of small-sized gastropods triggered by the emergence of scleractinian corals and the diversification of echinoderms. Habitat heterogeneity and new food sources offered niches for the early radiation of modern gastropod clades, pointing the Triassic as a laboratory to understand macroevolutionary processes in the wake of a major biotic crisis.

How to cite: Dominici, S.: Gastropods in deep time and the early Modern Evolutionary Fauna, EGU General Assembly 2025, Vienna, Austria, 27 Apr–2 May 2025, EGU25-14980, https://doi.org/10.5194/egusphere-egu25-14980, 2025.

EGU25-17130 | ECS | Posters on site | SSP4.2

A long-due taxonomic re-evaluation of the Late Cretaceous (Coniacian-Santonian) brachiopods of Ariyalur, India, and their implications. 

Adrish Mahata, Arghya Poddar, Shubhabrata Paul, Debahuti Mukherjee, Arkaprava Mukhopadhyay, and Debarati Chattopadhyay

The present study provides a long-due taxonomic evaluation of the brachiopods of the Ariyalur sub-basin, Cauvery Basin, India. After the seminal works of Stoliczka (1872), this is the first study on the Late Cretaceous Trichinopoly Group brachiopods. 1507 specimens were collected from the medium-sized sandstone units of the Anaipadi Member and Kulakkanattam Member of the Garudamangalam Formation. Based on their morphology, six rhynchonellid and two terebratulid species are identified. The terebratulids, Sahnithyris andurensis, and Carneithyris carnea are distinctly differentiated based on their body size, shape, and plication. The rhynchonellids,  Sillakkudirhynchia plicatiloides, Protegulorhynchia cranifera, Tegulorhynchia squamosa, Orbirhynchia nutans, Orbirhynchia multicostata, Orbirhynchia arrialoorensis are mainly distinguished by the ornamentation pattern, pedicle opening, convexity of both valves and sulcus patterns . Small rhynchonellids dominate our collected samples, and bigger terebratulids represent only 3% of the brachiopod assemblage. Among rhynchonellids, Sillakkudirhynchia plicatiloides, Protegulorhynchia cranifera, Tegulorhynchia squamosa are dominant species. Sillakkudirhynchia plicatiloides shows a right-skewed, Protegulorhynchia cranifera shows a left-skewed, Tegulorhynchia squamosa shows a bell-shaped size distribution due to their difference in mortality rate, recruitment. This study reports the first brachiopod drilling predation from Coniacian.   A drilling frequency of 4.3% was observed with predators showing valve selectivity, taxon selectivity, and size (8-17mm) selectivity of prey. A biogeographic study is carried out with the help of six genera and thirteen locations incorporated into four biogeographic regions. India shows its closest similarity (Jaccard = 0.84, Dice = 0.90) with Antarctica and its association with the Austral region. Based on the brachiopod genera distribution, cluster analysis depicts the Austral region’s biogeographic connections with the Central European Region. This indicates probable active seaways through Eastern Tethys to the South Atlantic Ocean during the Late Cretaceous.

How to cite: Mahata, A., Poddar, A., Paul, S., Mukherjee, D., Mukhopadhyay, A., and Chattopadhyay, D.: A long-due taxonomic re-evaluation of the Late Cretaceous (Coniacian-Santonian) brachiopods of Ariyalur, India, and their implications., EGU General Assembly 2025, Vienna, Austria, 27 Apr–2 May 2025, EGU25-17130, https://doi.org/10.5194/egusphere-egu25-17130, 2025.

EGU25-17778 | ECS | Orals | SSP4.2

Palaeoclimate and palaeoecology at the end of the Late Palaeozoic Ice Age: Insights from the Lower Permian Bioarchive of Oman 

Marco Viaretti, Gaia Crippa, Hana Jurikova, James W.B. Rae, and Lucia Angiolini

The late Sakmarian (Early Permian) is a key time-interval to unravel deep time climate changes at the transition from icehouse to greenhouse conditions. Very recent data (Jurikova et al., 2025) showed that the demise of the Late Palaeozoic Ice Age (LPIA) was caused by an increase in atmospheric CO2 linked to volcanic activity, peaking in the late Sakmarian. To understand how this CO2 increase impacted the climate at the seasonal scale and how it affected marine ecosystems, we performed a sclerochemical analysis on a carefully screened shell of the brachiopod Pachycyrtella omanensis from the Saiwan Fm. in Oman. This specimen thrived at ~45°S, in shallow water settings along the Gondwanan margin, in the context of the deglaciation from the LPIA and Early Permian warming.

High-resolution δ18O, δ13C and δ11B sclerochemical analyses along the shell growth axis revealed oscillating profiles, characterized by at least three main periodic cycles each. Preliminary profile analysis points towards broad coupling of main internal δ13C and δ11B cycles, showing a maximum signal amplitude of ~3‰ and 5‰, respectively, which might be representative of growth cycles punctuated with growth halts in between.

Periodicity in the δ18O profile showed a maximum signal amplitude of 3.2‰ and might correspond to seasonal variations in seawater temperature. Based on the average δ18O and signal amplitude, and assuming a δ18Osw value of –0.5‰, this specimen recorded an average temperature of 25.5°C with a temperature seasonality of 15°C. The average temperature recorded by P. omanensis is much higher than what is observed at similar latitudes and depths nowadays, as is the seasonal variation. The relatively higher average temperature could be explained by the warming and increasing CO2 conditions during the Early Permian. Elevated seasonality is not expected under these conditions, but it may have been magnified by seasonally variable δ18Osw reflecting a dynamic coastal environment, which could also explain the observed internal cyclicity in δ13C and δ11B.

This study underlines the potential of sclerochemical analyses in well-preserved fossil brachiopods for providing news insights into deep-time environmental change at annual/ seasonal scale. Our results also lend support to the hypothesis that P. omanensis might have been an opportunistic species that exploited dynamic environments subjected to seasonal stressors with oscillating but abundant food resources. These findings suggest a potential analogue scenario for future marine ecosystems under the current warming icehouse.


Jurikova H., Garbelli C., Whiteford R., Reeves T., Laker G., Liebetrau V., Gutjahr M., Eisenhauer A., Savickaite K., Leng M.J., Iurino D.A., Viaretti M., Tomašových A., Zhang Y., Wang W., Shi G.R., Shen S.Z., Rae J.W.B. & Angiolini L. (2025). Rapid rise in atmospheric CO2 ended the Late Palaeozoic Ice Age. Nature Geoscience.


How to cite: Viaretti, M., Crippa, G., Jurikova, H., Rae, J. W. B., and Angiolini, L.: Palaeoclimate and palaeoecology at the end of the Late Palaeozoic Ice Age: Insights from the Lower Permian Bioarchive of Oman, EGU General Assembly 2025, Vienna, Austria, 27 Apr–2 May 2025, EGU25-17778, https://doi.org/10.5194/egusphere-egu25-17778, 2025.

EGU25-18178 | ECS | Posters on site | SSP4.2

Still in the shadow of the dinosaurs: evidence for avian predation driving nocturnality in small mammals 

Simona Bekeraitė, Ivona Juchnevičiūtė, and Andrrej Spiridonov


This study investigates the extent of evolutionary pressure by predatory birds on small mammals. Using neontological datasets of predatory bird and small mammal body masses, diets and activity patterns, we show that small mammals are significantly more likely to be nocturnal than the larger-sized species. We apply allometric scaling laws and estimate potential prey body size distributions of vertebrate-feeding hypercarnivorous birds. Using species-level mammal and bird phylogenetic trees we investigate the timelines of temporal niche change in mammals and compare them with the diversification histories of diurnal predatory birds. Our preliminary results suggest that bird predation pressure has been restricting a significant fraction of small mammals to the nocturnal niche, giving support to the nocturnal bottleneck hypothesis.

This study was supported by the grant S-MIP-24-62 BretEvoGeneralized.

How to cite: Bekeraitė, S., Juchnevičiūtė, I., and Spiridonov, A.: Still in the shadow of the dinosaurs: evidence for avian predation driving nocturnality in small mammals, EGU General Assembly 2025, Vienna, Austria, 27 Apr–2 May 2025, EGU25-18178, https://doi.org/10.5194/egusphere-egu25-18178, 2025.

EGU25-18559 | ECS | Posters on site | SSP4.2

Porpoise pasts: A journey through skull size variation in European waters 

Shirin N. Rahman, Richard Sabin, Bram Langeveld, Lonneke IJsseldijk, and Emilia Jarochowska

Commercial whaling peaked between the 1700s and 1800s, leading to declines in whale populations worldwide. While it is well constrained that baleen whales have shrunk in body size over the past centuries - likely due to whaling pressure and climate change – smaller toothed whale species, which were not the primary targets during the whaling era, have been largely understudied in this regard.

However, one of the major challenges in the face of global change and increasing anthropogenic influence is predicting population declines in order to establish suitable conservation strategies before a collapse can take place. Tracking declines in body sizes over large temporal scales has proven to be a reliable indicator preceding such population declines and collapses.

In this study we investigate body sizes of the harbour porpoise (Phocoena phocoena), which is one of the smallest toothed cetacean species and a common inhabitant of European waters. We use skull sizes as proxies for estimating body sizes of individuals collected from Scotland, England and the Netherlands, with collection dates spanning from the 17th century to the present. The aim of this study is to assess whether a decline in harbour porpoise body sizes over time and additionally, if possible morphospecies from different regions of the North Sea, can be identified.

How to cite: Rahman, S. N., Sabin, R., Langeveld, B., IJsseldijk, L., and Jarochowska, E.: Porpoise pasts: A journey through skull size variation in European waters, EGU General Assembly 2025, Vienna, Austria, 27 Apr–2 May 2025, EGU25-18559, https://doi.org/10.5194/egusphere-egu25-18559, 2025.

EGU25-19619 | ECS | Orals | SSP4.2

Tracing Holocene dynamics of lagoon’s ecological quality: a stratigraphic-based, benthic foraminiferal approach from the Po Plain (N Adriatic Sea) 

Amanda Vecchi, Giulia Barbieri, Éric Armynot du Châtelet, Fabrizio Frontalini, Ilaria Mazzini, Simone da Prato, Stefano Claudio Vaiani, and Veronica Rossi

Lagoonal environments are highly biodiverse coastal ecosystems, extremely susceptible to multiple anthropogenic and natural stressors (eutrophication, contaminants, storms and floods, relative sea-level rise among others). Given their ecological importance, effective monitoring and restoration strategies are essential to safeguard their integrity. The quantitative assessment of the Ecological Quality Status (EcoQS) represents a fundamental step in designing action plans through an ecosystem-based approach that incorporates biological indicators, as mandated by the EU Water Framework Directive (2000) and the Marine Strategy Framework Directive (2008/56/EC).

This study aims to contextualize the EcoQS of a modern lagoon (Bellocchio Lagoon) belonging to the Po coastal plain (N Adriatic Sea), by comparing current values with pristine reference conditions from the past. To achieve this purpose, we integrated analyses of benthic foraminiferal assemblages from sediment cores and modern samples to reconstruct environmental changes and EcoQS temporal trends mainly applying the Foram-AMBI index, which is based on species sensitivity to organic-matter enrichment.

Reference conditions were reconstructed analyzing the foraminiferal assemblages encased within the well-dated sedimentary successions of a near-site humid area, whose Holocene record reflects depositional environments comparable, though on a different scale, to the Bellocchio Lagoon.

A reliable comparison of past and present environments was based on the identification of three distinct biofacies within the Bellocchio Lagoon, by means of cluster analyses based on the benthic foraminiferal thanatocoenoses. Each biofacies corresponds to a sub environment (i.e. inner lagoon, outer lagoon, and salt marsh - channels) characterized by a typifying foraminiferal content and a set of environmental parameters (i.e. sand, calcium carbonate and total organic matter content). Using the Modern Analogue Matching technique, cores assemblages were compared to the biofacies, enabling the identification of modern analogues for past depositional settings. The reconstruction of long-term ecosystems’ dynamics and the assessment of the Ecological Quality Ratio, calculated comparing the EcoQS derived from core samples with the EcoQS of modern biocoenoses, allow to evaluate the present-day ecological conditions in the context of the natural and human forcing factors that have affected lagoonal environments over time.

How to cite: Vecchi, A., Barbieri, G., Armynot du Châtelet, É., Frontalini, F., Mazzini, I., da Prato, S., Vaiani, S. C., and Rossi, V.: Tracing Holocene dynamics of lagoon’s ecological quality: a stratigraphic-based, benthic foraminiferal approach from the Po Plain (N Adriatic Sea), EGU General Assembly 2025, Vienna, Austria, 27 Apr–2 May 2025, EGU25-19619, https://doi.org/10.5194/egusphere-egu25-19619, 2025.

EGU25-19989 | Posters on site | SSP4.2

Resolving the conodont trophic enigma with the photogrammetry and dental topography analysis 

Przemysław Świś, Paweł Bącal, Tomasz Szczygielski, and Sergi López-Torres

Conodonts were an extinct group of marine chordates and a crucial part of past ecosystems for approximately 300 million years. They were the earliest vertebrates that developed mineralized tissues in the form of an oral apparatus composed of conodont elements. Those dental parts currently find utility in biostratigraphy, paleoclimatology, and evolutionary biology.  Their remains have profoundly influenced disciplines such as stratigraphy, paleoclimatology, and evolutionary biology. However, the understanding of the paleoecology of conodonts and their role in ancient ecosystems is far from being fully resolved. Herein, we adopted a new method of electron scanning microscope and three-dimensional topography to describe transformation of conodont elements during ontogeny. Our findings reveal significant morphological differences between juvenile and adult specimens, with two out of three dental topographic metrics showing notable variation across ontogenetic stages.

How to cite: Świś, P., Bącal, P., Szczygielski, T., and López-Torres, S.: Resolving the conodont trophic enigma with the photogrammetry and dental topography analysis, EGU General Assembly 2025, Vienna, Austria, 27 Apr–2 May 2025, EGU25-19989, https://doi.org/10.5194/egusphere-egu25-19989, 2025.

The Upper Cretaceous Coon Creek Formation (CCF) of western Tennessee is renowned for its diverse assemblage of exceptionally well-preserved shallow marine fossils, particularly shelled mollusks. Microfossils, including calcareous nannoplankton and dinoflagellates, confirm a late Campanian age for the site and indicate both warm- and cool-water taxa, suggesting shifting climatic conditions recorded within the sedimentary sequence. The formation, consisting of approximately 8 meters of glauconitic, clayey sands, was deposited in a shallow marine environment with significant terrestrial input, as evidenced by stable carbon isotope studies of arthropod fossils, fossilized wood, and abundant clay. However, the variability in the strength or influence of this terrestrial input over seasonal or longer timescales remains unclear. Recent investigations have revealed that some mollusk shells from the CCF may preserve evidence of harmful toxins, such as brevetoxin and saxitoxin, which are commonly associated with harmful algal blooms (HABs) in modern aquatic environments.

To further explore the relationship between paleoenvironmental parameters and HABs, we collected mollusk shells, sediments, and microfossils from multiple horizons within the CCF for geochemical and algal toxin analyses. SEM imaging confirmed the exceptional preservation of primary aragonite prisms and fibers in the fossilized shells. Using LA-ICP-MS, trace elements such as phosphorus, barium, magnesium, and strontium were measured along shell growth axes. Multiple transects were conducted at different points in the same shell to assess the reproducibility of trace element time series within a single specimen. Additionally, stable isotope analyses (δ¹⁸O and δ¹³C) were performed parallel to the trace element analyses to correlate these records within each shell.

The trace element and stable isotope records within CCF bivalves exhibit cyclic variations, suggesting seasonal environmental changes within this warm coastal ecosystem. Temperature estimates derived from δ¹⁸O are concordant with previous estimates and align with other regional records. Some trace elements, including barium and phosphorus, display transient spikes that may reflect episodes of increased terrestrial input and/or algal blooms, although direct evidence for these events remains limited. By investigating the chemistry of these ancient mollusks and comparing them to modern environments, this study aims to shed light on the potential occurrence of HABs during a prior greenhouse climate and evaluate the role of terrestrial runoff in influencing nutrient cycles and marine ecosystem health. These results provide valuable insights into the environmental and climatic conditions of the Cretaceous and contribute to a broader understanding of how terrestrial input may have driven nutrient dynamics and the development of algal blooms in shallow marine settings.


How to cite: Kelley, N., Oster, J., and Kovalski, A.: Trace Element and Stable Isotope Records Reveal Seasonal and Episodic Environmental Fluctuations in the Upper Cretaceous Coon Creek Formation, EGU General Assembly 2025, Vienna, Austria, 27 Apr–2 May 2025, EGU25-20254, https://doi.org/10.5194/egusphere-egu25-20254, 2025.

EGU25-21450 | ECS | Orals | SSP4.2

Red Sea Rhodoliths as Environmental Archives: A Novel Method to Overcome Historical Challenges in Climate Reconstruction 

Lena Li, Juan Pablo Bernal Tamayo, Viswasanthi Chandra, Steffen Hetzinger, and Maggie D. Johnson

Global environmental change threatens the persistence of coral reef systems. Long term in-situ environmental data is required to contextualize reef-scale thermal variability and future organismal resilience. These data can be derived from skeletal growth patterns of various marine calcifiers, most commonly corals, bivalves, and foraminifera. Free-living coralline algae, or rhodoliths, are largely underutilized biogenic archives which record environmental data in their growth increments. Many traditional attempts to utilize rhodoliths as (paleo-) environmental proxies have failed to produce viable reconstruction data due to difficulties in physical sectioning from nonlinear branching patterns and gaps in the resulting chronologies from unpredictable growth interruptions. Here we present a novel method of non-destructively deriving reef-scale annual mean sea temperatures using composite increment width profiles from microtomography scans of rhodoliths from the central Red Sea. Compiled profiles of rhodolith growth increment width were strongly positively coupled with mean annual temperature (R = 0.63), with a positive relationship between resemblance to corresponding temperature profiles and number of branches compiled. By circumventing inaccuracies in chronologies from unpredictable growth interruptions in rhodoliths, this novel method allows for the derivation of more accurate reconstructions of mean annual reef-scale sea temperatures using a previously inaccessible archive.

How to cite: Li, L., Bernal Tamayo, J. P., Chandra, V., Hetzinger, S., and Johnson, M. D.: Red Sea Rhodoliths as Environmental Archives: A Novel Method to Overcome Historical Challenges in Climate Reconstruction, EGU General Assembly 2025, Vienna, Austria, 27 Apr–2 May 2025, EGU25-21450, https://doi.org/10.5194/egusphere-egu25-21450, 2025.

EGU25-21661 | Posters on site | SSP4.2

Late Quaternary to modern patterns in the distribution of trematode-induced pits in Chamelea gallina (Po-Adriatic system, northern Italy) 

Alexis Rojas-Briceno, John Warren Huntley, Lukas Schweigl, and Daniele Scarponi

Chamelea gallina, found in both late Holocene and recent shoreface environments of the Adriatic Sea in Italy, reveals a significant reduction (by an order of magnitude) in parasite-host intensity and abundance before and after notable human impacts. This reduction parallels the increasing human influence on the Adriatic, which has transitioned into an urban sea (Fitzgerald et al. 2024). Despite these findings, empirical studies of parasite-host dynamics often overlook the spatial information inherent in trace locations. Quantifying these spatial patterns in antagonistic interactions provides valuable insights into the relationships between parasites and hosts, helping us understand whether these interactions have remained stable over time or whether they indicate substantial disruptions in ecological functions due to environmental changes.

We employ Spatial Point Pattern Analysis of Traces (SPPAT) to assess variations in the spatial distribution of trematode-induced pits in C. gallina-rich assemblages from shoreface settings of the Po-Adriatic system (northern Italy) across three different geological time periods: the Holocene Climatic Optimum (~7.5ka B.P.), Late Holocene (~2.5ka B.P.), and modern settings. Preliminary results indicate that these traces are significantly clustered in all analyzed geological intervals (as per the DCLF test of Complete Spatial Randomness: HCO: u = 0.006761147, rank = 1, p-value = 0.001; Late Holocene: u = 0.011823097, rank = 1, p-value = 0.001; modern: u = 0.006127347, rank = 1, p-value = 0.001). Additionally, all Holocene spatial patterns exhibit marginally significant segregation at larger distances due to the clustering of pits near the shell edge. However, distance-based statistics and Kernel Density Mapping reveal some variations in the patterns, characterized by the aggregation of pits at medium to short distances, along with some differences in the maximum clustering distance (HCO: 0.58; Late Holocene: 0.39; modern: 0.47).

Although our results are preliminary and subject to the limitations of the data, we demonstrate how the spatial information inherent in parasite-induced traces can complement previous studies on parasite-host dynamics across changing environments and aid in reconstructing the persistence of this critical ecological interaction through time amidst significant anthropogenic changes.


Fitzgerald, E., Ryan, D., Scarponi, D., and Huntley, J. W. 2024: A sea of change: Tracing parasitic dynamics through the past millennia in the northern Adriatic, Italy. Geology; 52 (8): 610–614. https://doi.org/10.1130/G52187.1

Rojas A, Dietl GP, Kowalewski M, Portell RW, Hendy A, and Blackburn JK. 2020: Spatial point pattern analysis of traces (SPPAT): An approach for visualizing and quantifying site-selectivity patterns of drilling predators. Paleobiology; 46(2):259-271. doi:10.1017/pab.2020.15  

How to cite: Rojas-Briceno, A., Huntley, J. W., Schweigl, L., and Scarponi, D.: Late Quaternary to modern patterns in the distribution of trematode-induced pits in Chamelea gallina (Po-Adriatic system, northern Italy), EGU General Assembly 2025, Vienna, Austria, 27 Apr–2 May 2025, EGU25-21661, https://doi.org/10.5194/egusphere-egu25-21661, 2025.

BG6 – Geomicrobiomes and their function

Microbial carbon use efficiency (CUE) affects the fate and storage of carbon in terrestrial ecosystems, but its global importance remains uncertain. Accurately modeling and predicting CUE on a global scale is challenging due to inconsistencies in measurement techniques and the complex interactions of climatic, edaphic, and biological factors across scales. The link between microbial CUE and soil organic carbon relies on the stabilization of microbial necromass within soil aggregates or its association with minerals, necessitating an integration of microbial and stabilization processes in modeling approaches. In this perspective, we propose a comprehensive framework that integrates diverse data sources, ranging from genomic information to traditional soil carbon assessments, to refine carbon cycle models by incorporating variations in CUE, thereby enhancing our understanding of the microbial contribution to carbon cycling.

How to cite: He, X.: Emerging multiscale insights on microbial carbon use efficiency in the land carbon cycle, EGU General Assembly 2025, Vienna, Austria, 27 Apr–2 May 2025, EGU25-55, https://doi.org/10.5194/egusphere-egu25-55, 2025.

Defining the links between DNA-derived taxonomic outputs and morphological identifications is an important step in determining the contributions to ecological functioning by soil biotic asslemblages. Here, I present findings from work linking sequence outputs of soil faunal assemblages ( nematodes and springtails) with their inherent ecological and functional traits. These are then linked to experimental manipulations and restoration gradients that can help to unpack these relationships to can provide greater insight into the influence of ecosystem services  towards community assemblages. These aspects can greatly accelerate classification of functional traits on seqeuences alone, advancing our understanding of soil communities and their importance to ecosystem functioning.

How to cite: Ross, G.: Verifying molecular sequencing data with morphological data in soil biota to uncover contributions to ecosystem functioning, EGU General Assembly 2025, Vienna, Austria, 27 Apr–2 May 2025, EGU25-901, https://doi.org/10.5194/egusphere-egu25-901, 2025.

EGU25-2276 | ECS | Posters on site | SSS4.10

Microbial Carbon Accumulation Efficiency: Assessing Microbial Carbon Pump Efficiency based on 13C-glucose Amendment Experiment 

Wanjia Hu, Yue Cai, Xingqi Li, Juan Jia, and Xiaojuan Feng

Soil microbes play an important role in stabilizing soil organic carbon (C) as microbial residues, a process known as soil ‘microbial C pump’ (MCP). Accurately assessing MCP efficiency is essential for understanding microbial-mediated soil C sequestration. Conventional assessments based on microbial C use efficiency (CUE) hinge on microbial biomass only and do not include microbial necromass, which may not depict MCP efficiency. Here we propose a relatively simple and rapid approach based on 13C-glucose amendment experiment to assess microbial C accumulation efficiency (CAE)  as a novel metric for assessing MCP efficiency. We first validated the approach by showing negligible retention of glucose to soils with a wide range of edaphic properties. Glucose-derived 13C may hence be considered to represent microbial C (including biomass and residues) after a few days of addition, given the rapid uptake of glucose by microbes. Microbial CAE may thus be assessed as the recovery of glucose-derived 13C in the soil. By further conducting a meta-analysis of literature data involving isotopically labeled glucose amendment experiments, we revealed distinct variation patterns and influencing factors of microbial CAE and CUE across various terrestrial ecosystems. Compared to CUE which is mainly regulated by factors influencing microbial physiological processes (particularly substrate availability), CAE is jointly regulated by factors that influence microbial growth (e.g., biomass and climate) and residue preservation (e.g., clay content). These findings underscore that CAE is decoupled from CUE. Incorporating CAE into soil C models may provide new insights into future SOC dynamics under climate change.

How to cite: Hu, W., Cai, Y., Li, X., Jia, J., and Feng, X.: Microbial Carbon Accumulation Efficiency: Assessing Microbial Carbon Pump Efficiency based on 13C-glucose Amendment Experiment, EGU General Assembly 2025, Vienna, Austria, 27 Apr–2 May 2025, EGU25-2276, https://doi.org/10.5194/egusphere-egu25-2276, 2025.

EGU25-3790 | Orals | SSS4.10

In vivo vs. ex vivo pathways of carbon and nitrogen stabilization – a model analysis 

Stefano Manzoni and Francesca Cotrufo

Soil microorganisms contribute to the stabilization of organic carbon and nutrients by breaking down organic matter into relatively small compounds that can be stabilized on mineral surfaces (ex vivo pathway) and by building biomass that eventually turns into necromass, which can also be effectively stabilized (in vivo pathway). Which of these pathways is dominant? We answer this question using a model tracing the fate of plant residues into particulate organic matter (POM) and mineral associated organic matter (MAOM). The model allows partitioning ex vivo and in vivo contributions through a small set of parameters that can be estimated using data from incubation of isotopically labelled plant residues. Leveraging a new database of plant-derived POM and MAOM data from these incubations, we estimated the contributions of the two pathways across nearly 40 soils. We found that the in vivo pathway is in general more important than the ex vivo pathway (especially for stabilization of organic nitrogen). Comparing results across soils, we found that the contribution of the in vivo pathway is particularly high in fine-textured soils with low organic matter content, where a larger area of mineral surfaces is available. We conclude that microbial necromass is a key factor for carbon and nitrogen stabilization, especially in soils that have abundant available mineral surfaces.

How to cite: Manzoni, S. and Cotrufo, F.: In vivo vs. ex vivo pathways of carbon and nitrogen stabilization – a model analysis, EGU General Assembly 2025, Vienna, Austria, 27 Apr–2 May 2025, EGU25-3790, https://doi.org/10.5194/egusphere-egu25-3790, 2025.

EGU25-4045 | ECS | Posters on site | SSS4.10

Microbial use of C and N from organic sources - Insights from isotopic tracer literature data 

Maja Siegenthaler and Stefano Manzoni

Soil microorganisms use various sources of organic matter to meet their carbon (C) and energy needs. Additionally, they require nutrients such as nitrogen (N) in appropriate stoichiometric proportions. Organic sources often have higher C/N ratios than microbial biomass, which influences organic matter decomposability and the fate of C and N in the microbe-soil-plant system. In general, microbial carbon-use efficiency (CUE), the ratio of growth to C uptake, is higher for organic sources with lower C/N, promoting C stabilization in soil. While CUE has received increasing attention, less often microbial C and N transformations are jointly studied.
We collect literature data from studies applying 13C- and 15N-enriched organic sources with variable C/N (e.g., plant litter, microbial necromass, and small organic molecules). Isotope tracing allowed quantification of C and N originating from these sources in soil and microbial biomass. We aim to determine across studies how the recovery of C and N in the microbial biomass over time is impacted by the organic source C/N and system-specific conditions. We hypothesize that high source C/N leads to greater loss of C via respiration and thus higher relative recovery of source N than C in the microbial biomass. In contrast, low source C/N likely results in a reduced difference in the relative recovery of C and N in the microbial biomass. These patterns are likely modified by system-specific conditions such as the presence of plants or inorganic fertilization. Our contribution aims to provide insights into the joint microbial use of C and N related to organic source stoichiometry.

How to cite: Siegenthaler, M. and Manzoni, S.: Microbial use of C and N from organic sources - Insights from isotopic tracer literature data, EGU General Assembly 2025, Vienna, Austria, 27 Apr–2 May 2025, EGU25-4045, https://doi.org/10.5194/egusphere-egu25-4045, 2025.

EGU25-4171 | Orals | SSS4.10

Phosphate amendment drives bloom of RNA viruses after soil wet-up 

Ella T. Sieradzki, G. Michael Allen, Jeffrey A. Kimbrel, Graeme W. Nicol, Christina Hazard, Erin E. Nuccio, Steven J. Blazewicz, Jennifer Pett-Ridge, and Gareth Trubl

Soil rewetting after a long dry season results in a burst of microbial activity accompanied by succession of both microbial and DNA viral communities. We hypothesized that RNA viruses, like DNA viruses, would exhibit temporal succession following rewetting. Moreover, we expected their response would change with the addition of phosphate, since viral proliferation may lead to phosphorus (P) limitation due to their low C:N:P ratio. We used a replicated time-series of soil metatranscriptomes collected after rewetting to identify parameters affecting RNA viral community composition over three weeks. P amendment led to a decrease in RNA viral community diversity and evenness, significantly impacting beta diversity over time. As has been observed for DNA viruses, the spatial distribution of RNA viruses in dry soil was highly heterogeneous. Most viruses were predicted to infect bacteria or fungi, and a small fraction was predicted to infect protists, plants, and animals. The amount of RNA extracted from phages of the class Leviviricetes increased significantly after one week in P-amended soil, contrasting with unamended soil. This suggests that P availability plays an important role in RNA phage proliferation. We estimate that the number of bacteria infected by RNA phages is on the order of 107–109 per gram soil, comparable to the range of total cells in soil. This implies that RNA phages likely have a profound effect on the bacterial community following soil wet-up when P is not a limiting factor.

How to cite: Sieradzki, E. T., Allen, G. M., Kimbrel, J. A., Nicol, G. W., Hazard, C., Nuccio, E. E., Blazewicz, S. J., Pett-Ridge, J., and Trubl, G.: Phosphate amendment drives bloom of RNA viruses after soil wet-up, EGU General Assembly 2025, Vienna, Austria, 27 Apr–2 May 2025, EGU25-4171, https://doi.org/10.5194/egusphere-egu25-4171, 2025.

EGU25-4860 | ECS | Orals | SSS4.10

Functional Consequences of Solving Elemental Imbalances 

José Murúa Royo, Brittni Bertolet, Luciana Chávez Rodríguez, and Steven Allison

Currently, most microbially-explicit biogeochemical models use flexible carbon-use efficiency (i.e., overflow respiration) to balance the mismatch between microbial biomass and litter stoichiometry (e.g. carbon : nitrogen, C:N). However, other known mechanisms might lead to different biogeochemical outcomes. Here we perform a rigorous test of the functional consequences of several mechanisms that aid in solving this mismatch. We used an individual-based, trait-based leaf litter decomposition model that represents microbial functional groups by uptake and extracellular enzyme genes. The original model incorporates overflow respiration and flexible biomass stoichiometry as mechanisms to solve elemental imbalance. We further introduce a novel mechanism of enzyme allocation. We established 4 simulation treatments: overflow, overflow + flexible stoichiometry, overflow + enzyme allocation, and overflow + flexible stoichiometry + enzyme allocation. In each treatment we manipulate initial litter C:N from 10 to 90. We also manipulate the initial community to yield scenarios with high and low functional redundancy based on the number of polymers each “taxon” can degrade. We found that biomass production was greatest when all mechanisms were in operation, followed by enzyme allocation, flexible stoichiometry, and overflow being the lowest. This pattern inverted in the low redundancy scenario. Total respiration decreased with higher litter C:N but was greater for flexible stoichiometry and lowest for enzyme allocation. When enzyme allocation was present, mass loss and nutrient mineralization were consistently decreased. As suggested by other studies, carbon-use efficiency remained high when having alternatives to overflow. This, however, occurs only in the low redundancy scenario. We conclude that current microbially-explicit biogeochemical models might be overestimating carbon losses for high C:N substrates due to an unrealistic increase in respiration rates by overflow. We urge for the quantification of these mechanisms in natural systems.

How to cite: Murúa Royo, J., Bertolet, B., Chávez Rodríguez, L., and Allison, S.: Functional Consequences of Solving Elemental Imbalances, EGU General Assembly 2025, Vienna, Austria, 27 Apr–2 May 2025, EGU25-4860, https://doi.org/10.5194/egusphere-egu25-4860, 2025.

EGU25-5260 | ECS | Orals | SSS4.10

Microbial energetic costs of phosphorus mining and uptake 

Nataliya Bilyera

Phosphorus (P) is a growth-limiting nutrient for plants and microorganisms in many natural and agricultural ecosystems. Microbial transformations of P in soils play a crucial role in increasing its availability to plants. Once taken up by microorganisms, P contributes to the energy and nutrient metabolism of microbial cells and often becomes plant-available only after microbial cell death (i.e., through the mineralization of microbial necromass).

The processes of P acquisition and microbial activation require cellular energy, which is often transferred by P-containing substances with high-energy phosphoester bonds, most commonly adenosine triphosphate (ATP). Microbial phosphorus mining from organic phosphorus compounds demands energy for the production of phosphatases. The type and combination of phosphatases required depend on the complexity of the P-containing compound, as these enzymes hydrolyze P into a plant-available form.

This talk will present measurements of the energetic costs microorganisms invest in producing various enzymes to solubilize P from compounds of increasing complexity. Additionally, the energetic costs of microbial P uptake from inorganic sources will be compared to those associated with the enzymatic hydrolysis of organic sources.

Results from incubation experiments revealed that the heat released during organic P hydrolysis increased with the complexity of the substrate, ranging from phosphomonoester bonds in sugar phosphate to six ester bonds in phytate. Furthermore, microorganisms expended significantly more energy on enzyme production than on phosphorus uptake via active cellular transport alone.

These findings provide valuable insights into predicting the hydrolysis of organic P compounds in soil, based on potential enzymatic activities and the energy balance of microorganism-mediated processes.

Acknowledgments and Funding: This work was funded by the German Research Foundation (DFG, BI 2570/1-1), project number 525137622.

How to cite: Bilyera, N.: Microbial energetic costs of phosphorus mining and uptake, EGU General Assembly 2025, Vienna, Austria, 27 Apr–2 May 2025, EGU25-5260, https://doi.org/10.5194/egusphere-egu25-5260, 2025.

EGU25-5988 | Orals | SSS4.10

Disentangling the role of earthworms in soil phosphorus cycling 

Alix Vidal, Andreas Burr, Laura Ferron, Hannah M.J. Vos, Chiara Pistocchi, Federica Tamburini, Mart Ros, Gerwin F. Koopmans, and Jan Willem van Groenigen

Earthworms play a crucial role in enhancing phosphorus (P) availability in soils by processing organic matter as well as mineral soil particles and associated P. This role could represent a lever to increase agronomic P use efficiency. However, if earthworms are employed to unlock soil P, soils will still need to be replenished with nutrients. This could be accomplished through the application of circular fertilisers. In this context, earthworms could help to mobilize P from emerging mineral fertilisers recovered from waste streams, such as struvite. Despite these potential benefits, the biotic influence of earthworms on P cycling remains poorly understood and the interactions between earthworms and emerging fertilisers are unknown. Here, we present results of two studies aiming at (1) testing an isotopic approach based on the oxygen isotopes ratio in phosphate (PO4) to study the biotic effect of earthworms on soil P cycling in arable soils; and (2) investigating the role of earthworms in mobilizing P from poorly soluble struvite. In a mesocosm experiment using straw and 18O-enriched water in the presence of soil-dwelling earthworms, we found that earthworms have a significant effect on the mineralization of P from organic residues in litter-amended soils with a low PO4 availability. We demonstrated that the 18O-isotopic approach provides a promising method to study the influence of earthworms on PO4 cycling. In a field study using struvite and ryegrass in the presence of multiple combinations of earthworm species, we showed that struvite performs comparably to conventional mineral P fertiliser in terms of plant P uptake, highlighting that struvite could be an efficient P fertiliser. The effect of earthworms on plant P uptake was significant but relatively small. These two studies emphasize that the effect of earthworms on P cycling is highly context dependent (e.g., soil P status and organic matter), with optimal efficiency observed in P-poor soils when a suitable food source is provided.

How to cite: Vidal, A., Burr, A., Ferron, L., Vos, H. M. J., Pistocchi, C., Tamburini, F., Ros, M., Koopmans, G. F., and van Groenigen, J. W.: Disentangling the role of earthworms in soil phosphorus cycling, EGU General Assembly 2025, Vienna, Austria, 27 Apr–2 May 2025, EGU25-5988, https://doi.org/10.5194/egusphere-egu25-5988, 2025.

EGU25-6267 | ECS | Orals | SSS4.10

Long-term effects of a single soil inoculation: shifts in soil microbial community composition and functioning after a community coalescence event in sand, clay, and peat grasslands.  

Merlijn Schram, Paul Bodelier, Freddy ten Hooven, Iris Chardon, Ciska Veen, and Wim van der Putten

Thriving communities of soil biota are a cornerstone of soil functionality. Intensification of land management with the aim to increase yield changes the biodiversity of soils, which comes at the cost of other soil functions, due to the destructive effect such management can have on soil biodiversity. While more nature-inclusive soil management practices may lead to more balanced soil multifunctionality, the recovery of biodiversity in long-term intensively managed soils is expected to take a long time. Inoculation with healthy soil may provide a jump start in the recovery of degraded soils, but only if the inoculated soil communities can become successfully established. Previous studies have shown that soil transplantation can result in greater recovery of soil communities compared to when single soil species are inoculated, but the effects on soil microbial communities and their contributions to soil functionality are not yet well-understood. Therefore, we used a four-years-old mesocosm experiment in order to test the long-term effects of soil inoculation by soil transplantation on the community composition and functionality of three types of grasslands soils. The experiment is composed of 60 intact soil cores of 95 cm diameter and 1 m depth that have been collected from three high input-output production grasslands on sand, clay, and peat. These grasslands had been exposed to high mowing frequencies, and had low vegetation diversity. At the start of the experiment, the soil cores were inoculated with soil from less intensively managed mid-successional grasslands, containing higher plant diversity than the intensively used grasslands. For half of the soil cores, the inoculate was sterilized beforehand to serve as a control. Bi-yearly measurements of yield, quarterly measurements of greenhouse gas emissions (CO2, CH4, N2O), measurements of soil organic carbon, a vegetation analysis, and results from a recent litter decomposition experiment are combined with a time-series of amplicon sequence data of soil microbial communities. I will present the effects of inoculation on microbial community composition in sand, clay, and peat soils, and show that these inoculations can have functional consequences.

How to cite: Schram, M., Bodelier, P., ten Hooven, F., Chardon, I., Veen, C., and van der Putten, W.: Long-term effects of a single soil inoculation: shifts in soil microbial community composition and functioning after a community coalescence event in sand, clay, and peat grasslands. , EGU General Assembly 2025, Vienna, Austria, 27 Apr–2 May 2025, EGU25-6267, https://doi.org/10.5194/egusphere-egu25-6267, 2025.

Soil drying challenges microbial viability and survival, with bacteria employing various mechanisms to respond to shifts in osmolarity, including dormancy or metabolic upregulation of osmoprotectants. However, the extent to which these responses are shaped by an organism’s phylogeny or the climate history of a given environment is poorly understood. This study examines the responses of phylogenetically similar bacteria from semi-arid and humid tropical forest soils to osmotic and matric stress using synchrotron radiation-based Fourier Transform Infrared spectromicroscopy. This non-destructive approach depicts the biochemical phenotype for whole cells under control and stress conditions. We observed that, under osmotic stress, bacteria upregulated cell-signaling pathways, rapidly turned over lipid-storage compounds, and increased osmolyte production. In contrast, matric stress induced a more muted response, typically elevating the production of carbohydrate stress compounds, such as glycine betaine and trehalose. While phylogenetically similar bacteria showed comparable biochemistry under control conditions, climate history played an important role in regulating responses to stress, whereby a stronger metabolic response was observed from semi-arid relative to tropical forest isolates. We conclude that bacterial stress response to drought can be more diverse than previously observed, and regulated by both phylogeny and climate history.

How to cite: Bouskill, N.: Does climate history shape the bacterial metabolic response to drought?, EGU General Assembly 2025, Vienna, Austria, 27 Apr–2 May 2025, EGU25-7728, https://doi.org/10.5194/egusphere-egu25-7728, 2025.

EGU25-8436 | ECS | Posters on site | SSS4.10

The microbial metabolism in a heterogeneous and warming soil environment: A bioenergetic point of view 

Peng Tian, Christian Lorenzen, Guodong Shao, Callum Banfield, Michaela Dippold, Sandra Spielvogel, and Bahar Razavi

The physical colocation of decomposers and substrates has been proposed as being a determining factor of microbial metabolism in soil, which is also greatly modulated by environmental temperature. Moreover, spatial heterogeneity of insoluble substrates is hypothesized to favor the fungal energy channel, as fungi have a well-developed capacity to translocate resources within their mycelia thus overcoming local resource limitation. Here, the effects of warming, substrate spatial heterogeneity, and fungal translocation on microbial metabolism as indicated by substrate-derived CO2 emission, heat production, and calorespirometric ratio (CR, the ratio of heat production to CO2 emission) were tested, using cylinders with four compartments that either prevent or allow diffusion between compartments.

With increasing spatial heterogeneity, the CO2 emission rate generally declined under ambient temperature. The emission rate was slightly higher when diffusion was not allowed across the compartments, except the second half of incubation in the most heterogeneous treatment (100-0-0-0%). In warming environment, the CO2 emission rates were stimulated, but with diminished effect of spatial heterogeneity. The heat release in the most heterogeneous treatment was lower than the most homogenous (25-25-25-25%) and intermediate heterogeneous (50-0-50-0%) treatments. Under warming condition, the peaks of heat release were heightened, and the peak of the most heterogeneous treatment was brought forward. The heat release was higher when diffusion was not allowed across the compartments under ambient temperature, but insignificant difference among treatments were detected under warming environment. CR decreased rapidly in the first half of incubation, and remained stable during the rest . The difference in CR was mainly detected in the first half of incubation, with CR declining with the decrease of spatial heterogeneity.

Overall, our findings provide detailed information about microbial metabolism in response to substrate spatial heterogeneity and warming climate, and suggest that the degree of substrate spatial heterogeneity is an important boundary condition shaping the energy use channel in this soil compartment.

How to cite: Tian, P., Lorenzen, C., Shao, G., Banfield, C., Dippold, M., Spielvogel, S., and Razavi, B.: The microbial metabolism in a heterogeneous and warming soil environment: A bioenergetic point of view, EGU General Assembly 2025, Vienna, Austria, 27 Apr–2 May 2025, EGU25-8436, https://doi.org/10.5194/egusphere-egu25-8436, 2025.

EGU25-8656 | ECS | Posters on site | SSS4.10

Effects of forest management and microbial diversity and community composition on soil respiration 

Daniela Guasconi, Marleen Pallandt, Jūratė Aleinikovienė, Dorian Behling, Sara Filipek, Aleksi Lehtonen, Tijana Martinović, Boris Ťupek, and Stefano Manzoni

Soil microbes are responsible for important ecosystem services such as nutrient cycling and decomposition, and as such their activity is an important contributor to GHG emissions from soils. However, while microbial biomass is known to affect soil C turnover, the role of community composition and diversity is less clear. It has been theorized that microbial functional diversity may be a useful predictor of decomposition rates, but empirical data from natural systems are ambiguous. In addition, the contribution of diversity to decomposition may be affected by the different sensitivity of various fungal and bacterial functional groups to land management. In this study we aim to disentangle the direct effect of forest management on decomposition rates via changes in soil moisture and temperature, from its indirect effects via changes in microbial community composition. We use empirical data collected from multiple forest management experiments across Europe by the HoliSoils consortium (Holistic management practices, modelling and monitoring for European forest soils; https://holisoils.eu/). Preliminary results indicate a significant correlation between microbial diversity and soil respiration, but with significant differences between fungi and bacteria. This suggests that identifying appropriate diversity indicators could improve microbially explicit C turnover models and inform forest management practices for climate impact mitigation.

How to cite: Guasconi, D., Pallandt, M., Aleinikovienė, J., Behling, D., Filipek, S., Lehtonen, A., Martinović, T., Ťupek, B., and Manzoni, S.: Effects of forest management and microbial diversity and community composition on soil respiration, EGU General Assembly 2025, Vienna, Austria, 27 Apr–2 May 2025, EGU25-8656, https://doi.org/10.5194/egusphere-egu25-8656, 2025.

EGU25-9667 | Orals | SSS4.10

Microbial growth in intact soil cores assessed by deuterium isotope probing 

Hannes Schmidt, Alberto Canarini, Gaëlle Marmasse, Lucia Fuchslueger, and Andreas Richter

A key parameter to understand microbial activity in soil is growth. However, our approaches to measure microbial growth fail to integrate a potential key element for microbial functioning: the spatial structure of soil. In this study we used soil cores together with deuterium-labelling of soil water via vapor exchange to identify growing microbial groups in undisturbed soil compared to sieved soil via the production of (labelled) phospholipid fatty acids (PLFAs). Our results showed comparable measurements of community-level microbial respiration, mass-specific growth rates, and carbon use efficiency in intact and sieved soil. Although soil cores exhibited a larger variability of PLFA biomarker production rates, a high level of overlap was observed among the growing community members in intact and sieved soils. Contrary to our assumption, we conclude that sieving does not necessarily affect quantification of soil microbial growth rates. Importantly, the presented approach enables to identify and to quantify the growing soil microbial subpopulation in experimental conditions close to the field, which opens new avenues for spatial detection of soil microbial growth in situ.

How to cite: Schmidt, H., Canarini, A., Marmasse, G., Fuchslueger, L., and Richter, A.: Microbial growth in intact soil cores assessed by deuterium isotope probing, EGU General Assembly 2025, Vienna, Austria, 27 Apr–2 May 2025, EGU25-9667, https://doi.org/10.5194/egusphere-egu25-9667, 2025.

EGU25-9719 | ECS | Posters on site | SSS4.10

Exploring the energetics of soil microbial metabolism under substrate limitation 

Martin-Georg Endress and Sergey Blagodatsky

The growth of soil microorganisms is limited by scarce substrate availability for most of the time in most soils, interrupted only by comparatively brief bursts of activity following localized pulses of substrate input. During periods of starvation, microbes must persist in a state of inactivity or dormancy to maintain their viability. Given the prevalence of such non-growing microbes, the costs of maintenance metabolism as well as those associated with emergence from and return to dormancy can be expected to play a significant role in soil carbon (C) cycling.

Recent advances have highlighted the utility of bioenergetic modeling based on coupled C and energy fluxes for the analysis of microbial activity in soil. In particular, the calorespirometric ratio (CR) of heat to CO2 production obtained from incubation experiments presents a useful tool for monitoring the bioenergetics of microbial metabolism in a dynamic fashion. However, previous studies have primarily focused on the CR during microbial growth, and the effects of non-growth metabolism are rarely considered.

In this contribution, we present a theoretical analysis of the consequences of non-growth metabolism on temporal patterns of the CR (Fig. 1). Specifically, we employ process-based modeling to show that both exogenous maintenance fueled by the consumption of external substrates and endogenous maintenance fueled by the consumption of biomass have distinct effects on the dynamics of the CR (Fig. 1) as well as on the relationship between CR and microbial C use efficiency (CUE), depending on the energy content of the consumed compounds. To connect these theoretical findings with empirical evidence, we compiled data on the CR measured in unamended soils as well as during the lag and retardation phases of substrate amendment experiments from the literature. The results reveal a wide range of observed CR values consistent with high metabolic diversity of microbial maintenance processes. In addition, we find a strong positive correlation between the non-growth CR and the average SOM energy content in arable soils but observe a weak inverse relationship in forest soils, the causes and implications of which remain to be explored.

Overall, our theoretical findings demonstrate a distinct effect of microbial maintenance metabolism on the coupling between C and energy fluxes in soil, which is supported by existing empirical evidence from incubation experiments.

Fig. 1: Simulated dynamics of CR after addition of labile substrate

both with (red) and without (black) additional utilization of SOM (i.e., priming).

Dotted lines indicate CR calculated from rates of heat and CO2 release (CRrate),

solid lines indicate CR calculated from cumulative release (CRcumu).


How to cite: Endress, M.-G. and Blagodatsky, S.: Exploring the energetics of soil microbial metabolism under substrate limitation, EGU General Assembly 2025, Vienna, Austria, 27 Apr–2 May 2025, EGU25-9719, https://doi.org/10.5194/egusphere-egu25-9719, 2025.

EGU25-9770 | ECS | Posters on site | SSS4.10 | Highlight

The Influence of Multitrophic Soil Biodiversity on Carbon Stabilization 

Janus den Toonder, Jes Hines, Pierre Ganault, Nico Eisenhauer, and Gerrit Angst

The role of multitrophic diversity in regulating soil carbon dynamics remains unclear, yet understanding these dynamics is essential for enhancing soil health and carbon storage. This study examines how tree mycorrhizal diversity and soil community complexity influence soil carbon sequestration. We hypothesize that greater soil community complexity and the presence of both arbuscular (AMF) and ectomycorrhizal fungi (EMF) enhance carbon stabilization. To test this, biodiversity was manipulated by (1) pairing tree species associated with AMF, EMF, or both, and (2) establishing four levels of soil complexity: microbes alone, microbes with mesofauna, microbes with mesofauna and macrofauna, and all previous levels with earthworms. Treatments were fully crossed and incubated in ecotrons for 140 days. Soil carbon responses are currently being assessed across free and occluded particulate organic matter and mineral-associated organic matter fractions. Ongoing carbon content analyses may provide valuable insights into how multitrophic biodiversity shapes soil carbon dynamics, with implications for soil management and carbon storage.


How to cite: den Toonder, J., Hines, J., Ganault, P., Eisenhauer, N., and Angst, G.: The Influence of Multitrophic Soil Biodiversity on Carbon Stabilization, EGU General Assembly 2025, Vienna, Austria, 27 Apr–2 May 2025, EGU25-9770, https://doi.org/10.5194/egusphere-egu25-9770, 2025.

EGU25-9807 | ECS | Orals | SSS4.10

Linking microbial community composition and their functions in the course of cellulose degradation in arable soil 

Fatemeh Dehghani, Thomas Reitz, Steffen Schlüter, Luis Daniel Prada Salcedo, and Evgenia Blagodatskaya

Soil microorganisms utilize organic carbon (C) through catabolic processes to produce the energy required for their metabolic needs and to synthesize microbial biomass via anabolic processes. The fraction of C retained in microbial biomass relative to the total amount of metabolized C is usually termed carbon use efficiency (CUE), which is a key metric for carbon turnover processes in soil. The input of fresh labile substrate in soil typically activates fast-growing microorganisms which are often less efficient than their slow-growing counterparts. However, the microbial succession may differ when utilizing less degradable organic compounds such as plant residues. In addition to the primary C source, newly-formed microbial biomass can subsequently act as a secondary source of C, nutrients, and energy for soil microorganisms. Therefore, the degradation of more complex organic compounds might be sequentially performed by different microbial taxa. However, knowledge of the microbial succession that occurs in the course of degradation of such complex organic compounds remains elusive.

To explore the microbial community changes during the degradation of complex C compounds, we conducted an incubation experiment using arable soil amended with 13C-labeled cellulose as a carbon and energy source. Microbial activity, estimated by respiration and heat release, was continuously determined for 56 days. To calculate CUE, the fraction of 13C transformed into CO2 was quantified via isotope probing techniques. Following DNA extraction at specific time points, 16S rRNA and ITS amplicon sequencing were performed to determine successions in bacterial and fungal community composition. Finally, kinetic parameters of cellobiohydrolase, ß-glucosidase, and phosphatase were measured destructively at specific time points during the incubation. Heat and CO2 release indicated an intensive degradation phase in the first 14 days of incubation. While the Vmax of the enzymes slightly changed during the incubation period, essential changes in bacterial and fungal communities were observed. This study provides insights into the dynamics of microbial communities and their functional roles during cellulose degradation in soils.

How to cite: Dehghani, F., Reitz, T., Schlüter, S., Prada Salcedo, L. D., and Blagodatskaya, E.: Linking microbial community composition and their functions in the course of cellulose degradation in arable soil, EGU General Assembly 2025, Vienna, Austria, 27 Apr–2 May 2025, EGU25-9807, https://doi.org/10.5194/egusphere-egu25-9807, 2025.

EGU25-10195 | ECS | Posters on site | SSS4.10

Microbial communities and functionality in degraded tundra soils 

Arna Björt Ólafsdóttir, Ólafur Sigmar Andrésson, Isabel C Barrio, Denis Warshan, and Ingibjörg Svala Jónsdóttir

In Iceland, unsustainable land use has led to severe land degradation and desertification. Degradation may shape soil microbial communities, which has implications for ecosystem functioning. This study presents for the first time a characterization of the structure and function of soil microbial communities in tundra soils of contrasting stages of degradation in Iceland and shows promise in identifying degradation processes and potentials for recovery. We used shotgun metagenomic sequencing to compare soil microbial communities in a Betula nana heath with erosion spots and a highly degraded desert at two sites, inside and outside the active volcanic zone (Þeistareykir and Auðkúluheiði). The bacterial taxonomic composition of the desert soils with relatively high abundance of Actinobacteria, low respiration (microbial activity) and lower functional diversity reflected a highly degraded state. Heath soils at Þeistareykir had more abundant key ecosystem taxa of the genus Bradyrhizobium, higher taxonomic richness, microbial activity, and functional diversity compared to the heath at Auðkúluheiði, indicating that the heath in Auðkúluheiði is more degraded. Use of the trait-based framework of high yield (Y), resource acquisition (A), and stress tolerance (S) provided a more nuanced picture of the functional microbial roles in each of these soil types.

How to cite: Ólafsdóttir, A. B., Andrésson, Ó. S., Barrio, I. C., Warshan, D., and Jónsdóttir, I. S.: Microbial communities and functionality in degraded tundra soils, EGU General Assembly 2025, Vienna, Austria, 27 Apr–2 May 2025, EGU25-10195, https://doi.org/10.5194/egusphere-egu25-10195, 2025.

EGU25-10523 | ECS | Orals | SSS4.10

Hybrid Soil Microbiome Modeling - Combining process-based models with machine learning to predict microbial dynamics and organic matter turnover in soil systems 

Paul Collart, Jürgen Gall, Andrea Schnepf, Alberto Vinicius Sousa Rocha, Malte Herold, Kate Buckeridge, and Holger Pagel

Soil microorganisms control organic matter cycling and largely determine how soil systems can cope with and mitigate climate change and environmental threats. Integrating microbial dynamics in process-based soil models is critical for predicting how soil carbon flows and stocks change in ecosystems with time. Functional traits can be inferred from amplicon sequencing data and metagenome assembled genomes to leverage model parameterization. However, informing models using omics-based datasets is challenging due to their large dimensional nature and the nonlinear relationship between genomes and the actual function microbes express. We present a hybrid modeling framework that combines machine learning to analyze metagenomic and DNA sequencing data with a simple microbial explicit process-based model. This hybrid model is conditioned using a convolutional network trained with data from the LUCAS 2018 database (Land Use and Coverage Area frame Survey), which includes soil metagenomes, 16S sequencing data in combination with soil carbon, microbial biomass and soil respiration measurements. Using trait inference from genomes, the model can learn several biokinetic parameters such as growth rates, dormancy rates, affinities to organic matter, growth yields or decay rates. We present the concept of the hybrid soil modelling framework and discuss what data is informative for these models and how to best link machine learning with process-based models.

How to cite: Collart, P., Gall, J., Schnepf, A., Sousa Rocha, A. V., Herold, M., Buckeridge, K., and Pagel, H.: Hybrid Soil Microbiome Modeling - Combining process-based models with machine learning to predict microbial dynamics and organic matter turnover in soil systems, EGU General Assembly 2025, Vienna, Austria, 27 Apr–2 May 2025, EGU25-10523, https://doi.org/10.5194/egusphere-egu25-10523, 2025.

EGU25-11138 | ECS | Orals | SSS4.10

Linking agricultural extensification to soil microbial communities and soil nutrient functioning 

Rosa Boone, Bjorn Robroek, Wim van der Putten, and Hans de Kroon

Our current agricultural system is non-sustainable due to its negative impact on soil and water quality, and its eroding effect on biodiversity. To promote sustainability while maintaining productivity, we need to explore alternative practices. One such strategy is the extensification of agricultural management, which reduces external inputs while aiming to enhance soil functioning. Nutrient cycling, a key soil function, may improve under extensification due to shifts in abiotic conditions and microbial community interactions. However, the mechanisms by which extensification affects soil microbial communities and their functional interactions in field conditions remain poorly understood. In this study, we investigated how management extensification affects soil nutrient cycling. We assessed nutrient cycling using enzymatic assays, Microresp analysis, and Teabag decomposition, and evaluated the role of abiotic factors (e.g., pH, SOC) and microbial community composition along an agricultural extensification gradient, ranging from conventional productive grasslands to semi-natural grasslands. Microbial interactions were explored using co-occurrence network analysis to assess how management influences the community as a whole. Preliminary results show that fungal communities change with extensification, accompanied by an increase in overall soil nutrient functioning, particularly for decomposition rate. Our results highlight that management choices have implications for soil functioning, and that the validity to use soil parameters to underpin soil nutrient functioning are highly context dependent.

How to cite: Boone, R., Robroek, B., van der Putten, W., and de Kroon, H.: Linking agricultural extensification to soil microbial communities and soil nutrient functioning, EGU General Assembly 2025, Vienna, Austria, 27 Apr–2 May 2025, EGU25-11138, https://doi.org/10.5194/egusphere-egu25-11138, 2025.

EGU25-14626 | Orals | SSS4.10

Microbial emergent ecophysiology affects soil carbon accumulation across land use gradients 

Ashish Malik, Lisa Cole, Tim Goodall, Jeremy Puissant, Nico Jehmlich, Cécile Gubry-Rangin, Gerd Gleixner, and Robert Griffiths

Agricultural land use intensification has led to loss of soil carbon; restoring soil carbon through regenerative practices offers an opportunity to help mitigate climate change and promote soil health. The soil microbiome is central in transforming plant materials into persistent forms of soil organic carbon. However, there is a poor mechanistic understanding of how microbiomes function, assemble, interact and collectively influence soil carbon changes across land use gradients. Here we present integration of knowledge across scales from field observations and lab experiments to highlight the importance of microbial ecophysiology and their emergent traits in determining the soil carbon balance in multiple paired local contrasts of low and high land use intensity systems in the UK. Across 11 paired contrasts, we observed significantly higher microbial community-level carbon use efficiency (CUE) and increased biomass in low intensity grassland soils compared with high intensity cropland soils. We suggest that less-intensive management practices have more potential for carbon storage through increased microbial CUE. Using proteomics and extracellular enzyme analysis, we demonstrate that reduced CUE in cropland soils was linked to higher microbial investment in stress alleviation and resource acquisition traits. To examine if grassland microbiomes with higher CUE could be recruited to help accumulate soil carbon in cropland soils, in lab mesocosm we reciprocally transferred microbiomes derived from historically undisturbed grassland soil and neighbouring cropland soil into their sterile counterparts from 2 paired contrasts. We fed the microbiomes with plant litter tea and monitored community assembly over 8 months. We observed that soil conditions were more important than inoculum source in determining bacterial assemblage, inoculum source was more important than soil conditions in determining fungal assemblage, whereas both inoculum source and soil conditions mattered equally in shaping the protist assemblage. This highlights the differential response of bacteria, fungi and protists to environmental filtering and raises questions around the persistence and therefore efficacy of microbial inoculations. In terms of soil carbon accumulation, we observed that a grassland microbiome led to positive outcomes in terms of soil carbon changes in cropland soil after 8 months suggesting that the microbial emergent ecophysiology that arises from both initial inoculum as well as the soil conditions matter in determining soil carbon accumulation. Our research highlights the need for careful land management to create the right soil conditions for the promotion of beneficial microbiomes with efficient metabolism for carbon accumulation. This will aid in regenerating degraded soils for sustainable climate-smart agriculture.

How to cite: Malik, A., Cole, L., Goodall, T., Puissant, J., Jehmlich, N., Gubry-Rangin, C., Gleixner, G., and Griffiths, R.: Microbial emergent ecophysiology affects soil carbon accumulation across land use gradients, EGU General Assembly 2025, Vienna, Austria, 27 Apr–2 May 2025, EGU25-14626, https://doi.org/10.5194/egusphere-egu25-14626, 2025.

EGU25-15114 | Posters on site | SSS4.10

Metagenomic for a better understanding of cultivated soil health 

Guillaume Gauthier, Hervé Van Der Heyden, Jacynthe Dessureault-Rompré, and Thiago Gumiere

Soil health is defined as the ability of a soil to function as a vital, living ecosystem, supporting the growth of plant, animal and humain This capacity is highly dependent on the microorganisms living in the soil due to their role in biochemical cycles linked to the recycling and availability of nutrients such as carbon (C), nitrogen (N), and phosphorus (P). Due to their disruption of the soil microbiome, conventional farming practices negatively affect the long-term health of cultivated soils (Montgomery & Biklé, 2021). The establishment of soil’s health indices is a complex matter due to the grand variability of existing soil’s type, texture, soil physicochemicalcharacteristics, and the variation in crop’s needs. Those three cycle where chosen for their importance in the context of agricultural’s plants needs and those critical process include the fixation of atmospheric nitrogen and the recycling of nitrogen compound from organic matter and the production of acid and alkaline phosphatase by soil’s archeae, bacteria and fungy. Those process are deemed critical by the introduction in a usable form of critical nutriment to plant’s grow that are other wise in a unusable form for the plant. To this end, we observed the impact of 4 different kind of mulches, all with reduced tillage, and a standard treatment with conventional farming practice over a 3 years period, with two sampling per year, one in May and one in August. The obtention of the soil’s microbiome composition was done with the shotgun metagenomic technique using the AVITI plateform. The metagenomic shotgun technique was chosen for its capacity to obtain an overall picture of the population of fungi, bacteria, and archaea composing the soil microbiome in a single sequencing run, thus avoiding PCR bias due to multiple amplicon sequencing on the microbiome's proportions. In this presentation, the observed variation in the soil’s microbiome population du to the treatments and their impacts on the soil critical process will be explored. We hypothesize that the soil under the conventional treatment will have a lower redundancy level compare to the soil under the other treatment.

Lehmann, J., Bossio, D. A., Kögel-Knabner, I., & Rillig, M. C. (2020). The concept and future prospects of soil health. Nature Reviews Earth & Environment, 1(10), 544-553. https://doi.org/10.1038/s43017-020-0080-8

Montgomery, D. R., & Biklé, A. (2021). Soil Health and Nutrient Density: Beyond Organic vs. Conventional Farming [Review]. Frontiers in Sustainable Food Systems, 5. https://doi.org/10.3389/fsufs.2021.699147

How to cite: Gauthier, G., Van Der Heyden, H., Dessureault-Rompré, J., and Gumiere, T.: Metagenomic for a better understanding of cultivated soil health, EGU General Assembly 2025, Vienna, Austria, 27 Apr–2 May 2025, EGU25-15114, https://doi.org/10.5194/egusphere-egu25-15114, 2025.

EGU25-15487 | ECS | Orals | SSS4.10

General Rules for Size and Spatial Distribution of Soil Bacterial Communities 

Samuel Bickel and Dani Or

Soil water dynamics within a highly fragmented soil physical environment constrain soil bacterial dispersion ranges, modulate diffusion and access to patchy resources. We have used a mechanistic modeling framework that integrates soil hydration status with organic carbon inputs to estimate community size distributions and interaction distances of modeled soil bacterial populations. The resulting spatial patterns of bacterial communities is critical for interpreting soil micro-ecological functioning. Experimental data supported by model results show that soil bacterial cluster sizes often follow an exponentially truncated power law with key parameters that vary with mean soil water content and total carbon inputs across biomes. Similar to human settlement size distributions, tree sizes and other spatially fixed systems in which growth rates are defined by their environment independent of object size (city or a tree), bacterial community size distribution is expected to obey the so-called Gibrat’s law (derived analytically for growth rates independent of community size). Results support generalization in soil using positively skewed distributions of soil bacterial community sizes (e.g., log normal). We show that soil bacteria reside in numerous small communities (with over 90% of soil bacterial communities containing less than 100 cells), supported by theoretical predictions of log-normal distribution for non-interacting soil bacterial community sizes with scaling parameters that vary with biome characteristics.

How to cite: Bickel, S. and Or, D.: General Rules for Size and Spatial Distribution of Soil Bacterial Communities, EGU General Assembly 2025, Vienna, Austria, 27 Apr–2 May 2025, EGU25-15487, https://doi.org/10.5194/egusphere-egu25-15487, 2025.

EGU25-16373 | Orals | SSS4.10

Phosphorus additions increase microbial phosphorus accumulation and carbon turnover in tropical soils in French Guiana 

Lucia Fuchslueger, Christian Ranits, Laynara Figueiredo Lugli, Helena Vallicrosa, Laëtitia Bréchet, Leandro Van Langenhove, Lore Verryckt, Irene Ramirez-Rojas, Pere Roc Fernandez, Elodie Courtois, Clement Stahl, Dolores Asensio, Guille Peguero, Joan Llusia, Alberto Canarini, Victoria Martin, Erik Verbruggen, Josep Peñuelas, Andreas Richter, and Ivan Janssens

Tropical forests often grow on highly weathered soils with rather high nitrogen (N), but low rock-derived phosphorus (P) (and base cation) availability. While the role of P limitation in constraining plant productivity is well established, its impact on heterotrophic microbial communities remains less clear. Specifically, it is crucial to understand how P availability shapes microbial activity, physiology and resource acquisition strategies, but also potential repercussions on organic matter decomposition, nutrient mineralization, and long-term carbon (C) sequestration.

To address this knowledge gap, we studied soil microbial communities in tropical lowland forest soils located in the north-eastern Amazon in French Guiana following three years of N and P additions. We assessed soil microbial biomass, stoichiometry, extracellular enzyme activity potential, and respiration rates. Additionally, we quantified soil microbial growth using a substrate-independent method based on the incorporation of 18O from labelled water into microbial DNA.

Our results showed that soil microbial biomass slightly increased in response to N, but remained unaffected by P additions. In contrast, P additions increased microbial P content (and reduced associated C:P ratios), suggesting that microbes are highly competitive for P and can act as a significant P sink in these soils. Additionally, P additions also increased total and available soil P pools, indicating that both plant and microbial communities are well adapted to naturally occurring low P availability, and may have reached P saturation after multiple years of nutrient enrichment. Despite these changes, microbial biomass-normalized specific respiration- and growth-rates increased with both N and P fertilization, with a stronger response to P, while overall, the C use efficiency of the microbial communities remained unaffected by both.

Our results highlight (i) the pivotal role of soil microbes in C, N and P cycling in tropical forest soil and (ii) the remarkable P storage capacity of microbial communities in highly weathered soils. While microbial C and N dynamics appear tightly coupled, likely due to the similar composition of microbial cell walls, our data demonstrate non-homoeostatic stoichiometric behavior of microbial communities. This underscores the importance of reconsidering assumptions about strict stoichiometric relationships in soil and ecosystem models. 

How to cite: Fuchslueger, L., Ranits, C., Figueiredo Lugli, L., Vallicrosa, H., Bréchet, L., Van Langenhove, L., Verryckt, L., Ramirez-Rojas, I., Fernandez, P. R., Courtois, E., Stahl, C., Asensio, D., Peguero, G., Llusia, J., Canarini, A., Martin, V., Verbruggen, E., Peñuelas, J., Richter, A., and Janssens, I.: Phosphorus additions increase microbial phosphorus accumulation and carbon turnover in tropical soils in French Guiana, EGU General Assembly 2025, Vienna, Austria, 27 Apr–2 May 2025, EGU25-16373, https://doi.org/10.5194/egusphere-egu25-16373, 2025.

EGU25-16575 | Orals | SSS4.10

Fungal necromass composition highlights the ecological significance of microbial death pathways in soil 

Tessa Camenzind, Jessie Gawronski, Arne Zimmer, Carmen Höschen, Rebeca L Oliva, Matthias C Rillig, Kyle Mason-Jones, Steffen Schweizer, and Johannes Lehmann

Microbial activity drives soil carbon mineralization, while microbial necromass along with other residues contributes to the stable soil organic carbon pool. Still, precise quantification and characterization of microbial residues remains methodologically challenging in complex soil systems, requiring controlled microbial experiments. We have recently presented the conceptual framework of microbial death pathways in soil, where we hypothesized that different agents of death would lead to varying chemical properties of microbial necromass, with consequences for the fate of microbial necromass carbon in soil.

In the studies presented here, we have now tested these hypotheses experimentally and analysed fungal mycelial residues exposed to diverse agents of death. We investigated the composition of mycelial residues by (i) microscopic live/dead staining, (ii) measurements of carbon, nitrogen and melanin contents, (iii) Raman spectroscopy and (iv) Nanoscale Secondary Ion Mass Spectrometer (NanoSIMS). Using fungal isolates in a controlled experimental design, we found that heat or fungicide exposure led to rapid hyphal death with less chemical transformation of necromass compared to biomass. By contrast, starvation or senescence (ageing of hyphae) allowed mycelia to internally recycle cytosolic components, leading to residues reduced in cytosolic compounds and characterized by wider C:N ratios and increased melanin contents. A litterbag experiment in soil showed that mycelia resembling the chemical properties of biomass are mineralized more rapidly than chemically altered fungal necromass.

We further tested the impact of nitrogen availability on residue formation. Necromass nitrogen contents affect mineralization rates, but also stabilization due to preferential binding of nitrogen-rich compounds to mineral surfaces. Here, fungal residues from nitrogen depleted media showed wide C:N ratios (50-90), resulting from internal recycling of cytosolic compounds but also differential cell wall composition (as indicated by Raman spectroscopy and NanoSIMS analyses). Interestingly, independent of medium nitrogen supply, fungal residues in contact with mineral surfaces (goethite) were strongly nitrogen enriched, indicating preferential binding of nitrogen-rich compounds independent of overall mycelial C:N ratios.

In conclusion, specific microbial death pathways may alter the composition of microbial residues in soil, with consequences for carbon mineralization and stabilization processes. These results further highlight the interaction of carbon and nitrogen cycling via microbial turnover and stabilization, mechanisms that must be integrated in future conceptual and experimental approaches.

How to cite: Camenzind, T., Gawronski, J., Zimmer, A., Höschen, C., Oliva, R. L., Rillig, M. C., Mason-Jones, K., Schweizer, S., and Lehmann, J.: Fungal necromass composition highlights the ecological significance of microbial death pathways in soil, EGU General Assembly 2025, Vienna, Austria, 27 Apr–2 May 2025, EGU25-16575, https://doi.org/10.5194/egusphere-egu25-16575, 2025.

EGU25-17846 | ECS | Posters on site | SSS4.10

Theoretical Considerations Concerning Soil Microbial Growth 

Yujia Luo, Dennis Metze, Ksenia Guseva, and Andreas Richter

Microbial growth is a fundamental aspect of microbial life history, underpinning essential ecosystem functions and driving all biogeochemical cycles. While culture-based studies have provided valuable insights into microbial growth, they often fail to capture how microbes grow under natural conditions, which include complex interactions with other organisms and their physical and chemical environments.

Currently, microbial growth is typically defined as the ability of individual cells to replicate. Such a definition, however, overlooks the diverse strategies to survive and thrive in dynamic environments. These strategies reflect how microorganisms allocate carbon they take up to various pathways, including cellular replication, synthesis of storage compounds (e.g., triacylglycerides and polyhydroxyalkanoates), accumulation of osmolytes, and exudation of substances such as extracellular polymeric substances, extracellular enzymes and metabolites like short-chain fatty acids. These strategies are often accompanied by physiological shifts, such as transitioning between active and dormant metabolic states.

Despite the central importance of microbial growth, its in situ measurement remains a significant challenge. This limitation hinders our understanding of the ecological functions of soil microbiomes and our ability to accurately predict carbon use and cycling. Addressing this knowledge gap requires, a multi-faceted approach including the following key considerations:

  • Expanding definitions of microbial growth: Microbial growth encompasses more than cell division and DNA replication, particularly under stress conditions, such as nutrient and water scarcity. It includes the synthesis of storage compounds, osmolytes, and extracellular material. A more flexible definition, along with a delineation of growth and activity, is urgently needed.
  • Understanding and benchmarking growth methods: To isolate patterns in growth across microbial ecosystems, it is crucial to understand what different growth methods (that target various biomolecules, such as nucleic acids, proteins, and lipids) actually quantify, and how they relate to one another. Emphasis should be placed on substrate-independent methods.
  • Developing and improving models: Models should prioritize the exploration of microbial growth strategies in dynamic, non-steady steady-state environments and include robust experimental validation.

By addressing these key considerations, we hope to be able to deepen our understanding of microbial growth in natural systems, enhance ecological modeling, and better predict the role of soil microbiomes in carbon cycling.

How to cite: Luo, Y., Metze, D., Guseva, K., and Richter, A.: Theoretical Considerations Concerning Soil Microbial Growth, EGU General Assembly 2025, Vienna, Austria, 27 Apr–2 May 2025, EGU25-17846, https://doi.org/10.5194/egusphere-egu25-17846, 2025.

EGU25-17905 | Posters on site | SSS4.10

Implementation of a novel soil module that simulates the microbiome species dynamics in grasslands 

Sergi Costafreda-Aumedes, Lorenzo Brilli, Luisa Leolini, Marco Moriondo, and Beniamino Gioli

Soil microbiome is one of the most important components influencing biogeochemical cycles. Changes in the dominance of different microbial functional groups can result in a community that, due to the changes in microbial enzymes, can respond more or less rapidly to decomposition rates, synthesis of organic matter, nutrient availability and soil structure (Brangarí et al., 2021, Wu et al., 2024). The size and composition of soil microbiome is influenced by variables such as plant species, soil moisture and temperature, pH and nutrients availability (Naylor et al., 2022), which in turn are influenced by climate conditions and agronomic practices. Estimating the soil microbiome composition is therefore crucial to deeper understanding processes such as crop development, carbon (C) and nitrogen (N) uptake, soil nutrient retention, drought tolerance and pest resistance (Lutz et al., 2023).

Despite the large importance of soil microbial composition at determining magnitude and patterns of biogeochemical cycles, the majority of crop and biogeochemical models currently existing are not able to well represent this process. For instance, the microbial biomass simulated by STICS (Brisson et al., 1998) and EPIC (Izaurralde et al., 2006) varies according to N availability in the soil organic matter (SOM) decomposition, without considering microbial species dynamics. Similarly, the pools of models such as RothC (Coleman and Jenkinson, 1996), CENTURY (Parton, 1996), APSIM (Probert et al., 1998), DayCent (Parton et al., 1998), FASSET (Berntsen et al., 2003)  Report fixed values of C/N ratios.

This poor representation is mainly related to the lack of detailed algorithms to simulate, for example, SOM turnover driven by soil microbial biomass, the partitioning of different incorporation of decomposable C pools (i.e., lignin and cellulose) from crop residues into soils, the effect of N deficiency on SOM decomposition, and gas transport in soils. These processes should be incorporated into process-based biogeochemical models as driven by soil microbiome to provide more reliable estimates of C and N while reducing uncertainties.

To this end, the RothC submodel implemented within the GRASSVISTOCK model (Leolini et al., 2023) has been improved to take into account seasonal evolution of the soil microbiome and the related effect of agronomic practices. Specifically, new mathematical approaches reproducing the response of microbiota activity to soil temperature and water availability numerically quantify the seasonal trend of the enzymatic activity of the soil microbiota communities (Zhao et al., 2024; Babic et al., 2024; Ghodizadeh et al., 2024) will be integrated within the GRASSVISTOCK model and then validated against a measured available data of the grassland test site in Italy.

How to cite: Costafreda-Aumedes, S., Brilli, L., Leolini, L., Moriondo, M., and Gioli, B.: Implementation of a novel soil module that simulates the microbiome species dynamics in grasslands, EGU General Assembly 2025, Vienna, Austria, 27 Apr–2 May 2025, EGU25-17905, https://doi.org/10.5194/egusphere-egu25-17905, 2025.

EGU25-19125 | ECS | Orals | SSS4.10

How many bacteria are growing in soil? 

Dennis Metze, Bram W. Stone, Bruce A. Hungate, Joana Séneca, Rebecca L. Mau, Michaela Hayer, Alicia M. Purcell, Jeffrey Propster, Xiao Jun A. Liu, Benjamin J. Koch, Jennifer Pett-Ridge, Egbert Schwartz, Paul Dijkstra, César Terrer, Steven J. Blazewicz, Ember M. Morrissey, Kirsten S. Hofmockel, Jane Marks, Andreas Richter, and Christina Kaiser and the Team

Growing bacteria, alongside fungi, are the productive core of the soil microbiome. They assimilate soil organic matter and drive biogeochemical transformations. While recent evidence suggests that large parts of the bacterial community are transcriptionally or translationally active, only a subset of bacteria actively divides at any given time. However, the proportion of dividing bacteria and their responses to environmental change remain poorly understood.

Using more than 76,000 taxon-specific growth estimates inferred by 18O-quantitative stable isotope probing from >200 soil samples, we characterized the size and dynamics of the growing fraction of soil bacteria across a range of ecosystems and environmental change treatments (warming, nutrient addition, drought, cooling). We then estimated the percentage of replicating bacterial cells and taxa based on taxon-specific 18O-enrichment, absolute 16S rRNA gene abundances, and predicted gene copy numbers.

Across soils, a significant yet variable proportion of bacterial cells (median: 12%; range: 0.2-65%) were growing, representing about 16% (median; range: 0.9-39%) of the total taxa richness. More than 50% of all taxa were growing exclusively in only 1-2 samples. Environmental change affected the size of the growing community as well as its composition. More than 40% (median; range: 9.7-90%) of the taxa growing at ambient conditions stopped growing when the environment changed, whereas others initiated growth following a shift in conditions.

Our results indicate that the pool of growing bacteria constitutes a significant fraction of the soil microbiome and responds dynamically to changes in the environment through shifts in size and composition with potential implications for soil functioning. 

How to cite: Metze, D., Stone, B. W., Hungate, B. A., Séneca, J., Mau, R. L., Hayer, M., Purcell, A. M., Propster, J., Liu, X. J. A., Koch, B. J., Pett-Ridge, J., Schwartz, E., Dijkstra, P., Terrer, C., J. Blazewicz, S., Morrissey, E. M., Hofmockel, K. S., Marks, J., Richter, A., and Kaiser, C. and the Team: How many bacteria are growing in soil?, EGU General Assembly 2025, Vienna, Austria, 27 Apr–2 May 2025, EGU25-19125, https://doi.org/10.5194/egusphere-egu25-19125, 2025.

EGU25-19286 | ECS | Posters on site | SSS4.10

Mapping microbial growth, turnover and necromass formation in soil microhabitats using photothermal infrared spectromicroscopy  

Bouke Bentvelsen, Megan Foley, Floriane Jamoteau, Jan Roelof van der Meer, and Marco Keiluweit

Current efforts to enhance carbon storage and minimize losses in natural and managed soil systems increasingly recognize microbial necromass (i.e., the sum of extracellular microbial products as well as dead cells) as a major contributor to persistent carbon. To date, however, the abiotic and biotic factors controlling necromass formation and persistence in complex and diverse soil microhabitats are poorly understood. Here we combine microfluidics experiments with optical photothermal infrared (OPTIR) spectromicroscopy and fluorescence microscopy to track microbial growth, turnover and necromass production within different microhabitats. The microfluidics approach allows us to create different microenvironments that vary in pore connectivity and, thus, show gradients in substrate, oxygen, and nutrient availability. We inoculated microfluidic plates with bacterial species isolated from a topsoil in Switzerland (21 species; see Čaušević et al., 2022), representing four major phyla: Actinobacteria, Bacteroidetes, Firmicutes, and Proteobacteria. Using diagnostic infrared spectra along with fluorescence labelling, we can follow the growth dynamics of different bacterial species within synthetic communities as well as their turnover and associated necromass formation. Spectra were obtained for soil bacteria known to differ in essential ecophysiological characteristics, such as EPS production, Gram classification (Gram-positive vs. Gram-negative), and predatory versus non-predatory behaviour. We will report on a first proof-of-concept experiment that highlights the potential for this approach to reveal critical interactions between bacterial traits, microhabitats characteristics, growth dynamics, and necromass formation. 


Literature cited:

Čaušević, S., Tackmann, J., Sentchilo, V., von Mering, C., & van der Meer, J. R. (2022). Reproducible propagation of species-rich soil bacterial communities suggests robust underlying deterministic principles of community formation. Msystems7(2), e00160-22.

How to cite: Bentvelsen, B., Foley, M., Jamoteau, F., van der Meer, J. R., and Keiluweit, M.: Mapping microbial growth, turnover and necromass formation in soil microhabitats using photothermal infrared spectromicroscopy , EGU General Assembly 2025, Vienna, Austria, 27 Apr–2 May 2025, EGU25-19286, https://doi.org/10.5194/egusphere-egu25-19286, 2025.

EGU25-20117 | Posters on site | SSS4.10

Ecosystem-dependent microbial respiration and growth strategies with consequences for global soil carbon cycling  

Qing-Fang Bi, Markus Reichstein, and Marion Schrumpf

The quantitative understanding of microbial physiological roles in microbial-explicit soil organic carbon (SOC) models has been limited by focusing primarily on microbial carbon use efficiency (CUE) in relation to SOC storage. To improve this understanding, it is essential to explore underlying processes such as microbial respiration and growth, which directly impact SOC loss and sequestration. 

Using a global database of CUE measured through 18O-microbial DNA growth, we found that total microbial respiration and growth rates behave differently across various climate zones and land uses. Respiration and growth rates are the highest in temperate grasslands and boreal forests, while no significant differences are observed for specific rates. Moreover, microbial respiration is found to be more sensitive to environmental constraints than microbial growth, although both are ecosystem-dependent. For example, the contrasting relationships between SOC-CUE and microbial biomas C-CUE in temperate grasslands and tropical forests arise from the interplay of C availability, nitrogen limitation, and microbial growth and respiration dynamics. While temperate grasslands maintain a balance between microbial growth and respiration despite nitrogen limitations, tropical forests experience severe inefficiencies due to higher microbial activity and faster nutrient cycling. These differences underscore the ecosystem-specific nature of microbial respiration, growth, and consequently CUE. 


How to cite: Bi, Q.-F., Reichstein, M., and Schrumpf, M.: Ecosystem-dependent microbial respiration and growth strategies with consequences for global soil carbon cycling , EGU General Assembly 2025, Vienna, Austria, 27 Apr–2 May 2025, EGU25-20117, https://doi.org/10.5194/egusphere-egu25-20117, 2025.

EGU25-20563 | Posters on site | SSS4.10

Impact of cover crops on functional response of soil microbial communities in a citrus orchard in the Canary Islands 

Mónica González-González, María Quintana-González-de-Chaves, María Araceli García-González, Marta Selma Garzón-Molina, and Arely Giovanna Gómez-Jara

Conservative agricultural practices have been identified as pivotal in mitigating the effects of global warming. These practices are essential to maintain soil fertility and ensure the productivity of crops. Ground cover crops are an example of this practice, which can be readily implemented in orchards. They confer numerous benefits to agrosystems, including the prevention of soil mechanical damage and erosion, the reduction of water evaporation, the enhancement of soil carbon sequestration, the facilitation of weed control, the increase of soil microorganism community stability, the promotion of beneficial specific taxa, and the improvement of soil multifunctionality. This study was conducted within the framework of the LIFE Vida for Citrus project (LIFE18 CCA/ES/001109), which had the primary objective of developing sustainable control strategies to enhance the resilience of citrus orchards under the threat of climate change and to prevent the entry of Huanglongbing (HLB), or citrus greening disease, into the European Union. The objective of the present study was to evaluate the benefits of cover crops under the climatic and edaphic conditions of the Canary Islands (Spain), in the functional diversity of edaphic microbiota in a citrus orchard. In the Canary Islands, areas with little or poor soil depth (normally located below 300 meters above sea level) are usually modified by creating terraces with more fertile soil from higher altitudes (300-700 m.a.s.l.) situated in the northern side of the islands. This practice allows for more favorable cultivation, but degrades the original soil. The cover crops that were evaluated included the grass Lolium arundinaceum (Schreb.) Darbysh and a combination of flowering species, such as Lobularia maritima (L.) Desv., Diplotaxis tenuifolia (L.) DC., Calendula arvensis L., Medicago sativa L., Trifolium repens L., and Petroselinum crispum (Mill.) Fuss. The community level physiological profiles were measured, by the MicroRespTM method, after three years of groundcovers sowing. Total and oxidizable organic matter, as well as total nitrogen content, were also evaluated. The multiple substrate-induced respiration (MSIR) profiles were found to be influenced by the utilization of the cover crop in comparison to the bare soil, which exhibited a substantial impact on the individual respiration rates for 16 of the 18 tested substrates (p < 0.050). The soil under groundcovers exhibited the highest consumption (between 2.2 and 3.0 times higher MSIR) of simple and complex carbohydrates, linear and aromatic carboxylic acids, and amino acids and amino sugars, in comparison to the bare soil (p < 0.050). Additionally, the highest respiratory responses were exhibited after the addition of γ-aminobutyric acid, arabinose and α-ketoglutaric acid, ranging from 0.773 ± 0.370 and 2.34 ± 1.04 μg C-CO2 · g-1 · h−1. The diversity of the soil microbial community is a sensitive means to assess soil health in the implementation of conservative agriculture practices in the citrus orchards.

How to cite: González-González, M., Quintana-González-de-Chaves, M., García-González, M. A., Garzón-Molina, M. S., and Gómez-Jara, A. G.: Impact of cover crops on functional response of soil microbial communities in a citrus orchard in the Canary Islands, EGU General Assembly 2025, Vienna, Austria, 27 Apr–2 May 2025, EGU25-20563, https://doi.org/10.5194/egusphere-egu25-20563, 2025.

EGU25-21218 | Orals | SSS4.10

Quantifying species differences in hyphal persistence between wood decomposing fungi at the microscale 

Kristin Aleklett Kadish, Roos-Marie Ilse Jeanne van Bokhoven, and Dimitrios Floudas

The vegetative mycelium of wood decomposing fungi is indeterminate and ever changing over the course of their lifetime. When it comes to fruiting bodies, we know that there are stark differences between species in terms of how long lasting their fruiting bodies are, with some appearing, ephemerally, for a short moment in the season and others lasting for multiple years. However, for the vegetative mycelium, it is not well known and documented how ephemeral the body of the mycelial network is for the same species.

In this study, we utilized microfluidic chip systems to document, classify and quantify turnover of fungal hyphae in eight different species of basidiomycetes grown with two different carbon sources (glucose or carboxymethylcellulose) to gain a better understanding of how mycelial turnover and potential recycling differs across wood decomposing species.

Our results show that there was a difference between species but not between carbon sources in terms of how quickly and to what degree the mycelium was degenerated. The turnover rate and hyphal persistence of the different species grouped into two distinct clusters. One with low turnover rate and species leaving “skeletonized hyphae” behind and one group that showed a quick and almost full turnover of hyphae (likely through autolysis). These results open up for new questions around species differences in hyphal re-cycling abilities, whether some wood decomposing species could contribute more to carbon sequestration in soils than others and if they have different effects on subsequent succession scenarios due to the different levels of nutrients left behind. 

How to cite: Aleklett Kadish, K., van Bokhoven, R.-M. I. J., and Floudas, D.: Quantifying species differences in hyphal persistence between wood decomposing fungi at the microscale, EGU General Assembly 2025, Vienna, Austria, 27 Apr–2 May 2025, EGU25-21218, https://doi.org/10.5194/egusphere-egu25-21218, 2025.

EGU25-1069 | ECS | PICO | AS4.17

Study on long-range transport of dust-associated airborne bacteria over Eastern Himalayas in India 

Antara Pramanick, Shahina Raushan Saikh, Md Abu Mushtaque, and Sanat Kumar Das

Transboundary movement of atmospheric microorganisms through dust transportation plays a pivotal role in influencing human health, agricultural productivity, and climate dynamics by participating in cloud condensation processes. Present study investigates long-range transported atmospheric bacteria along with dust particlesover Darjeeling (27°03′N, 88°26′E), a high-altitude region (2.2 km amsl) in the Eastern Himalayas, India. 27 samples are collected in winter (Temp: 6.2± 1.5°C; RH: 85.2 ± 9.6%) and summer 2022 (Temp: 16 ± 1.5°C; RH: 93.5 ± 6.5%). Total bacterial cell count is found tobe increased by 24 ± 0.4% in summer compared to that in winter. Concurrently, particle number concentrations, measured using a Scanning Mobility Particle Sizer (SMPS) within the size range of 8-350 nm, showed 70% increasein summer, with modal size shifting from 110 nm to 150 nm.Satellite observations from MODIS on-board Aqua, Terra, and OMI on-board Aura reveal an increase in Aerosol Optical Depth (AOD) from 0.4 in winter to 0.7 in summer, alongside decline in Angstrom Exponent from 1.6 to 0.3, indication of coarser aerosol abundances. Aerosol Index also rises from 0.8 to 2.1, indicating dust dominance. CALIPSO data identifies a 1 km thick dust layer within 2 to 3 km altitude above the Eastern Himalayas. Air mass back-trajectory analysis suggests dust particles travel at an altitude of 2 to 3 km from the Thar Desert to Eastern Himalayas.Seasonal shifts in microbial communities are evident, with higher Shannon diversity in summer (4.4 ± 0.8) compared to winter (2.3 ± 0.6). Beta diversity analyses confirm distinct community compositions in summer that is due to transport of unique bacteria attached with desert dust. In summer, predominant bacterial genera included Flavobacterium (5.4 ± 3.6%), Nocardioides (4.2 ± 3%), and Corynebacterium (4.2 ± 1.4%), while Corynebacterium (2.4 ± 0.5%), Acinetobacter (1.8 ± 0.9%), and Massilia (1.3 ± 0.3%) in winter. Notably, pathogenic genera such as Afipia and Clostridium, linked to human and animal infections, are detected with dust exclusively in summer.Presentresult highlights the role of transported dust-associated microbes in altering the airborne bacterial composition in the Himalayas, providing critical insights into the sources and biodiversity changes over the Eastern Himalayas in India.

How to cite: Pramanick, A., Saikh, S. R., Mushtaque, M. A., and Das, S. K.: Study on long-range transport of dust-associated airborne bacteria over Eastern Himalayas in India, EGU General Assembly 2025, Vienna, Austria, 27 Apr–2 May 2025, EGU25-1069, https://doi.org/10.5194/egusphere-egu25-1069, 2025.

EGU25-1414 | ECS | PICO | AS4.17

 Cyanobacteria and climate change: Insights from Atmospheric and Heritage Studies  

Alessandra Mascitelli, Piero Chiacchiaretta, Fernanda Prestileo, Eleonora Maria Stella, Eleonora Aruffo, Pasquale Simeone, Paola Lanuti, Silvia Di Lodovico, Mara Di Giulio, Simone Guarnieri, Piero Del Boccio, Maria Concetta Cufaro, Valentina Gatta, Federico Anaclerio, Stefano Dietrich, and Piero Di Carlo

The atmosphere plays a pivotal role in modulating the interactions between microorganisms and their surrounding environments, influencing ecological cycles, heritage conservation, and providing opportunities for novel applications. Recent studies have highlighted the role of microbial responses to atmospheric conditions as indicators of environmental change [1]. This study highlights the potential of cyanobacteria as biosensors for detecting and monitoring climate change, using the Majella Massif region of Central Italy as a case study. The region’s rock art, characterized by red and black schematic motifs, is increasingly impacted by microbial colonization, driven by climate-induced temperature variations. These impacts align with broader research showing the link between microbial growth patterns and climatic factors [2]. 

Laboratory analyses were performed on cyanobacteria samples collected near rock paintings in Lama dei Peligni, Abruzzo. Using BG11 culture medium under controlled conditions, the growth rates of cyanobacteria were compared at two temperature regimes: 14.3 °C, representing historical mean temperatures (1930-1970), and 18.6 °C, reflecting current averages (2023). Results revealed a significant increase in growth rates at the higher temperature (40 cfu/ml vs. 35 cfu/ml), demonstrating their sensitivity to climatic shifts. Similar findings have been reported in studies of microbial ecology, emphasizing the value of cyanobacteria as biosensors [3]. This sensitivity positions cyanobacteria as effective biosensors for tracking environmental changes over time. 

These findings underscore the dynamic role of atmospheric factors in shaping microbial survival and propagation. Beyond their implications for heritage conservation, cyanobacteria’s responsiveness to temperature changes offers a unique avenue for monitoring broader climate dynamics. The enhanced growth of cyanobacteria due to rising temperatures also poses a challenge: while serving as indicators of change, their proliferation can degrade cultural heritage sites, threatening their preservation. This duality has been widely documented, where microorganisms act as both agents of degradation and ecological indicators [4,5]. 

This research advocates for interdisciplinary approaches that integrate atmospheric sciences, microbial ecology, and heritage studies to explore the dual role of cyanobacteria as both threats and tools. By leveraging their biological traits, cyanobacteria can provide valuable insights into climate dynamics while emphasizing the urgency for proactive strategies to mitigate environmental impacts on vulnerable ecosystems and heritage sites. 

[1] Decho, A. W., et al. (2010). "Microbial indicators of environmental change." 

[2] Pointing, S. B., et al. (2009). "Microbial growth patterns linked to climatic factors." Colwell, R. R., et al. (2008). "Microbial responses to atmospheric shifts." 

[3] Paerl, H. W., & Huisman, J. (2008). "Cyanobacteria as biosensors for climate monitoring." Whitton, B. A. (2012). "Ecological roles of cyanobacteria." 

[4] Gu, J. D., et al. (2021). "Microorganisms in heritage conservation." Mitchell, R., et al. (2013). "Dual roles of microorganisms in degradation and ecology." 

[5] Foster, P. L., et al. (2021). "Cyanobacteria in environmental monitoring." Singh, A., et al. (2020). "Applications of cyanobacteria in climate studies." 

How to cite: Mascitelli, A., Chiacchiaretta, P., Prestileo, F., Stella, E. M., Aruffo, E., Simeone, P., Lanuti, P., Di Lodovico, S., Di Giulio, M., Guarnieri, S., Del Boccio, P., Cufaro, M. C., Gatta, V., Anaclerio, F., Dietrich, S., and Di Carlo, P.:  Cyanobacteria and climate change: Insights from Atmospheric and Heritage Studies , EGU General Assembly 2025, Vienna, Austria, 27 Apr–2 May 2025, EGU25-1414, https://doi.org/10.5194/egusphere-egu25-1414, 2025.

EGU25-1548 | ECS | PICO | AS4.17

Hidden Ecosystems Above: Unraveling Viral-Bacterial Interactions in Cloudwater 

Janina Rahlff, Ritam Das, Rebecca Büschel, Julia Micheel, and Manuela van Pinxteren

Clouds have been regarded as atmospheric oasis for microbes including psychrophilic bacteria (Delort et al., 2017; Péguilhan et al., 2023). However, adaptations of bacteria to the cloud environment and interactions with viruses are not fully understood. In this study, cloudwater was sampled with six compact Caltech active strand cloud water collectors (Demoz et al., 1996) on the Mount Verde, a mountain of 744 m height on the São Vicente island in the tropical Atlantic Ocean (van Pinxteren et al., 2020) and stored frozen. From iron-flocculated and filtered cloudwater samples, DNA was short-read sequenced for metagenomics, and 24 bacteria were additionally isolated from these samples on Luria-Bertani (LB) and Reasoner's 2A (R2A) agar. After purification, the bacterial DNA was subjected to whole-genome sequencing, revealing a diverse array of microbial taxa. The isolate genomes were identified as belonging to Gram-positive species, including Agrococcus sp., Alkalihalobacillus_A gibsonii_A, Arthrobacter sp., Bacillus spizizenii, Cytobacillus oceanisediminis, Curtobacterium spp., Deinococcus sp., Micrococcus luteus, and Rossellomorea spp., as well as Gram-negative species such as Paracoccus marcusii, and Sphingomonas sp. This microbial diversity highlights the presence of spore-forming, halotolerant, and marine-associated bacteria in cloudwater. The genomes had an average GC content of 58.3% (range 41% – 73%) and encoded for cold-shock genes probably supporting survival during sample freezing and in supercooled cloudwater. The presence of 24 prophages and a diverse arsenal of antiviral defense systems, including adaptive CRISPR immunity targeting viral operational taxonomic units (vOTUs), indicates ongoing bacterial-viral interactions in cloudwater. On average, bacterial strains encoded for five defense systems, with restriction-modification systems being the most common. Interestingly, the isolated strain Sphingomonas sp. MPC37 encoded for the highest number of defense systems (12), indicating its potential ecological significance in this unique environment. Metagenomic sequencing identified 458 vOTUs, with major bacterial hosts predicted as Sphingomonas spp. (75 vOTUs), Deinococcus spp. (15), Novosphingobium spp. (14), and Methylobacterium spp. (13). Analysis of air mass trajectories for the cloudwater suggests a marine origin for certain samples, which were associated with the highest counts of both unique and total vOTUs. We also find genetic variability within a population of closely related viruses (microdiversity). Viral variants arise sequentially during different cloud events and are shared among temporally proximate events. Our results reveal clouds as dynamic microbial and viral ecosystems with complex survival strategies and interactions.

References

Delort, A. M., Vaïtilingom, M., Joly, M., … & Deguillaume, L. (2017). Clouds: a transient and stressing habitat for microorganisms. Microbial ecology of extreme environments, 215-245. https://doi.org/10.1007/978-3-319-51686-8_10

Demoz, B. B., Collett, J. L., & Daube, B. C. (1996). On the Caltech Active Strand Cloudwater Collectors. Atmospheric Research, 41(1), 47-62. https://doi.org/10.1016/0169-8095(95)00044-5

Péguilhan, R., Rossi, F., Joly, M., … & Amato, P. (2023). Clouds, oases for airborne microbes – Differential metagenomics/ metatranscriptomics analyses of cloudy and clear atmospheric situations. bioRxiv, 2023.2012.2014.571671. https://doi.org/10.1101/2023.12.14.571671

van Pinxteren, M., Fomba, K. W., Triesch, N., . . . & Herrmann, H. (2020). Marine organic matter in the remote environment of the Cape Verde islands – an introduction and overview to the MarParCloud campaign. Atmos. Chem. Phys., 20(11), 6921-6951. https://doi.org/10.5194/acp-20-6921-2020


How to cite: Rahlff, J., Das, R., Büschel, R., Micheel, J., and van Pinxteren, M.: Hidden Ecosystems Above: Unraveling Viral-Bacterial Interactions in Cloudwater, EGU General Assembly 2025, Vienna, Austria, 27 Apr–2 May 2025, EGU25-1548, https://doi.org/10.5194/egusphere-egu25-1548, 2025.

Airborne microorganisms (bioaerosols) play crucial roles in global biogeochemical cycles and ecosystem dynamics. We have developed a novel dual-chamber atmospheric simulation system to investigate the physicochemical properties and survival mechanisms of bioaerosols under controlled conditions.

The system is installed in a BSL-2 compliant Class 100 clean room and features two interconnected stainless steel chambers. The material selection and surface treatment of the chambers have been optimized to minimize microbial adhesion while preventing electrostatic losses of aerosol particles. Each chamber is equipped with UV irradiation systems and precise temperature control mechanisms. The chambers are connected by dampers, enabling separate control of environmental conditions. This design allows for bioaerosol generation in one chamber while conducting exposure experiments with various environmental factors (disinfectants, temperature, humidity, UV radiation, etc.) in the other.

A distinctive feature of our system is its capability to simultaneously evaluate both the physical characteristics of aerosol particles and the biological activity of bioaerosols. By combining real-time particle counter monitoring with SEM-EDS analysis of particle morphology and composition, we can comprehensively characterize the properties of particles acting as microbial carriers. This approach has enabled novel insights into size-dependent effects of disinfectants and environmental stresses on airborne microbial survival strategies.

The system's unique infrastructure allows for segregation and size-specific analysis of particles and bioaerosols, making it a crucial platform for studying atmospheric microorganisms. We have validated the system through experiments with various environmental microorganisms, demonstrating its effectiveness in maintaining stable experimental conditions while enabling precise measurements of both biological and physical parameters.

Current research utilizing this facility focuses on understanding the transport processes of airborne microorganisms and their interactions with atmospheric components. The findings are expected to contribute significantly to our understanding of microbial transport processes and global biogeochemical cycles.

How to cite: Maruyama, F. and Fujiyoshi, S.:  Development of a Dual-Chamber Atmospheric Simulation System for Bioaerosol Research: Size-Dependent Analysis and Surface Interaction Studies, EGU General Assembly 2025, Vienna, Austria, 27 Apr–2 May 2025, EGU25-1931, https://doi.org/10.5194/egusphere-egu25-1931, 2025.

Atmospheric microorganisms play a crucial role in cloud formation and climate processes, yet understanding their spatial and temporal dynamics remains a significant challenge. To advance our knowledge of atmospheric microbial ecology and transport processes, our research team initiated a multi-dimensional study in 2023 that examines the complex interactions between airborne microorganisms and their atmospheric environment. The study encompasses five integrated components: continuous real-time bioaerosol monitoring coupled with meteorological measurements, weekly microbiological community analysis using high-volume air samplers, monthly high-altitude microbial sampling via light aircraft at 1600 m above sea level, multi-level atmospheric monitoring using a 123-meter tower, and planned sampling in cloud-prone regions.

Our monitoring efforts revealed distinct temporal patterns in microbial abundance and distribution. While total particle concentrations showed minimal diurnal variation, biological particle counts exhibited pronounced daily fluctuations during the late summer and early autumn months (August-October), with this pattern notably absent during the winter period (November-March). Spatial analysis across monitoring sites demonstrated consistent total particle distributions but heterogeneous biological particle patterns, suggesting strong influences of local environmental factors on microbial dynamics. Community structure analysis indicated that under typical conditions, atmospheric microorganisms predominantly originated from local sources rather than long-range transport, highlighting the importance of surface-atmosphere exchange processes.

These findings contribute to our understanding of the atmosphere as a dynamic component of Earth's microbiome, where microorganisms actively participate in biological, chemical, and physical processes. Future research will focus on elucidating the mechanisms governing microbial survival and activity in the atmosphere, including their responses to environmental stressors and their potential influence on atmospheric processes.

How to cite: Fujiyoshi, S. and Maruyama, F.: Temporal and spatial dynamics of bioaerosol particles through integrated monitoring approach of local air distribution patterns, EGU General Assembly 2025, Vienna, Austria, 27 Apr–2 May 2025, EGU25-2115, https://doi.org/10.5194/egusphere-egu25-2115, 2025.

Fungi are among the most important biota on the planet, mediating ecosystem processes and contributing to the global bioaerosol budget and pollution even when metabolically inactive. Despite this, diversity and transport of fungi in the atmosphere are poorly explored. Here I show that the atmosphere contains diverse fungi with varied ecological roles and recruitment reflecting underlying habitats. The atmospheric mycobiome is dominated by decomposers and pathogens; over 40% of the total airborne mycobiota are known pathogens of plants or animals, including humans, with the capacity to transfer antibiotic resistance genes. Using aircraft surveys between 2022-2023 and unprecedented comprehensive environmental datasets, I found that remote sensing and meteorological data can predict diversity of fungi comprising the rare/transient portion of the atmospheric mycobiome. Vegetative decay/turnover is linked to increased fungal richness in the atmosphere, strengthening the view that phenology is a major determinant of atmospheric biodiversity. Additionally, ecological selection and niche effects can shape vertical assembly of the atmospheric mycobiome. Forward trajectory models predict air masses carrying the sampled fungi will reach Africa, Europe, and Asia as far as east as Kazakhstan, with global impacts and long-range transport beyond 11,000-km possible. This work sheds light on how genomic and environmental datasets acquired by aircraft and satellites can be used for multipronged data forecasts and dispersal predictions to allow proactive measures, clarify aerobiology questions, and provide a unified view of fungal ecology for planetary protection.

How to cite: Metris, K.: Fungus above us: Eco-environmental drivers of fungal diversity and transport in the atmosphere, EGU General Assembly 2025, Vienna, Austria, 27 Apr–2 May 2025, EGU25-2599, https://doi.org/10.5194/egusphere-egu25-2599, 2025.

EGU25-3895 | ECS | PICO | AS4.17

Impact of Yellow Dust Event on PM2.5 Microbial Communities during Spring in Ulaanbaatar, Mongolia 

Ian Cho, Sookyung Kang, Amgalan Natsagdorj, Jiyi Lee, and Kyung-Suk Cho

The Ulaanbaatar region in Mongolia exhibits a characteristic increase in particulate matter (PM) concentrations during spring, due to yellow dust events. This phenomenon has emerged as a significant air pollution issue across Asia. Among air pollution indicators, PM2.5 has substantial impacts on human health and plays a crucial role in microbial community structures and ecological interactions. This study investigated the characteristics of PM2.5 microbial communities during spring, including a yellow dust event, in Ulaanbaatar, Mongolia. The bacterial and fungal metagenomes of PM2.5 samples collected in Ulaanbaatar over a week from April 6 to April 12, 2022 were analyzed. DNA was extracted from PM2.5 filters, and bacterial 16S rRNA gene regions were amplified using 515F/806R primers. For fungi, ITS2 gene regions were amplified using ITS3/ITS4 primers. Subsequently, sequence analysis was performed using Illumina MiSeq. The study examined the impact of air pollutants (NOx, NO) and meteorological factors (relative humidity (RH), temperature) on microbial diversity indices (Chao1, Shannon) and the characteristics of dominant species during the investigation period. Based on the sequencing results, the relative abundance of bacteria and fungi in PM2.5 at the genus level was assessed, and changes in microbial abundance before and after the yellow dust event were compared using a heatmap. Additionally, Spearman correlation analysis was conducted to explore the relationships between the Top 5 dominant bacterial and fungal species on the yellow dust event day and the air pollutants as well as meteorological factors. The results indicated that the diversity indices of bacterial and fungal communities during spring tended to be higher with increasing concentrations of air pollutants and temperature; however, higher RH was associated with lower diversity indices. Changes in dominant microorganisms throughout the study period were confirmed through heatmap analysis, revealing that the composition of dominant microorganisms altered before and after the yellow dust event. On the yellow dust day, the Top 5 dominant bacterial genera were identified as Nitrososphaera, Arthrobacter, Nocardioides, Sphingomonas, and Chthoniobacter, while the Top 5 dominant fungal genera were Trichosporon, Cladosporium, Ascochyta, Alternaria and Vishniacozyma. On the event day, the dominant bacterial genera exhibited positive correlations with PM10 concentrations and temperature, while showing negative correlations with RH. Most of these genera are typically found in soil environments and are known to survive in arid conditions. In the case of fungi, the Top 5 fungal species on the yellow dust day, except for Trichosporon, also showed negative correlations with RH. This study may serve as fundamental data for future management strategies of PM2.5 air quality.

How to cite: Cho, I., Kang, S., Natsagdorj, A., Lee, J., and Cho, K.-S.: Impact of Yellow Dust Event on PM2.5 Microbial Communities during Spring in Ulaanbaatar, Mongolia, EGU General Assembly 2025, Vienna, Austria, 27 Apr–2 May 2025, EGU25-3895, https://doi.org/10.5194/egusphere-egu25-3895, 2025.

EGU25-6447 | ECS | PICO | AS4.17

Photoheterotrophy provides increased fitness in airborne bacteria: Aerosol simulation chamber studies 

Frédéric Mathonat, Federico Mazzei, Marie Prévot, Virginia Vernocchi, Elena Gatta, Muriel Joly, Mariline Théveniot, Barbara Ervens, and Pierre Amato

The atmosphere harbors a great diversity of microorganisms. Among them, some taxa of bacteria, such as Methylobacterium species are abundant and recurring members of the viable fraction (Amato et al., 2017; Woo and Yamamoto, 2020). These include non-obligate light-users, and we postulate that this function could be linked with their prevalence and survival capacity in the atmosphere. The alternative use of light to generate biochemical energy (ATP) through photoheterotrophy and anoxygenic photosynthesis is known to enhance survival under nutrient-deficient conditions (Soora and Cypionka, 2013). The use of light could therefore be beneficial and favor survival by supporting the maintenance of metabolic activity in the atmospheric environment,  with dispersed droplets or particles where access to substrates is limited.

To test the hypothesis that photoheterotrophy is beneficial to the survival of airborne bacteria, two distinct phenotypes of the same strain (with or without the photosynthetic pigment bacteriochlorophyll; [BChl+] or [BChl-], respectively, which can be controlled by growing cells under dark or light conditions, respectively) of a facultative photoheterotrophic strain of Methylobacterium sp. (R17b-9), isolated from clouds, were injected into the atmospheric simulation chamber (ASC) "ChAMBRe" (Vernocchi et al., 2023). Their survival was monitored for 2 hours while being exposed to different light intensities. During experimentation in the ASC, cell viability, cultivability, ATP concentration and residence time were measured.

Bacteria containing bacteriochlorophyll retained greater viability and cultivability than those lacking this photosynthetic pigment.  Light exposure on [BChl-] phenotype had a negative impact on cultivability, but not on viability. The mean half-lives (measuring by cultures) of bacteria [BChl-] was ~100-700 min depending on light intensity whereas there was no loss of cultivability over time for bacteria with pigment independently from light exposure. The ATP/cell ratio was 3 times greater for bacteria with bacteriochlorophyll than without. In addition, bacteria with bacteriochlorophyll sedimented 1.71 times faster than their counterparts without the pigment. This study supports the idea that not all bacteria are equal to atmospheric transport, and that specific phenotypic traits can be involved. It is possible that the widespread distribution, at low level, of photoheterotrophy in bacteria in the global environment could be promoted by their increased ability to disperse aerially.


Reference

Amato, P., Joly, M., Besaury, L., Oudart, A., Taib, N., Moné, A. I., Deguillaume, L., Delort, A.-M., and Debroas, D.: Active microorganisms thrive among extremely diverse communities in cloud water, PLOS ONE, 12, e0182869, https://doi.org/10.1371/journal.pone.0182869, 2017.

Soora, M. and Cypionka, H.: Light Enhances Survival of Dinoroseobacter shibae during Long-Term Starvation, PLOS ONE, 8, e83960, https://doi.org/10.1371/journal.pone.0083960, 2013.

Vernocchi, V., Abd El, E., Brunoldi, M., Danelli, S. G., Gatta, E., Isolabella, T., Mazzei, F., Parodi, F., Prati, P., and Massabò, D.: Airborne bacteria viability and air quality: a protocol to quantitatively investigate the possible correlation by an atmospheric simulation chamber, Atmospheric Measurement Techniques, 16, 5479–5493, https://doi.org/10.5194/amt-16-5479-2023, 2023.

Woo, C. and Yamamoto, N.: Falling bacterial communities from the atmosphere, Environmental Microbiome, 15, 22, https://doi.org/10.1186/s40793-020-00369-4, 2020.

How to cite: Mathonat, F., Mazzei, F., Prévot, M., Vernocchi, V., Gatta, E., Joly, M., Théveniot, M., Ervens, B., and Amato, P.: Photoheterotrophy provides increased fitness in airborne bacteria: Aerosol simulation chamber studies, EGU General Assembly 2025, Vienna, Austria, 27 Apr–2 May 2025, EGU25-6447, https://doi.org/10.5194/egusphere-egu25-6447, 2025.

EGU25-7510 | PICO | AS4.17

Preliminary study of Microbiology in Clouds at Whiteface Mountain in New York 

Sara Lombardo, Archana Tripathy, Sridar V Chittur, Diana Gentry, Andrew Hayden, Marcy L Kuentzel, Paul W Casson, Rudra Patel, Lily Hammond, and Sara Lance

Whiteface Mountain (WFM) in northern NY State is the site of a historic mountaintop atmospheric observatory with an ongoing cloud water chemistry monitoring program that has been operating every summer (June through September) since 1994. Though long-term chemical analysis has been conducted, no analysis on the microbiome has been completed at WFM. Over the years, a new chemical regime has been reported in the cloudwater with missing analytes. Knowing how microbes can interact with chemicals, we hypothesize microbes are partially responsible for this shift and are crucial in understanding the chemical background of clouds.

To start this study, cloudwater filters have been analyzed both chemically and microbially. Chemically, weighted averages have been calculated for each cloudwater filter based on the chemical composition of the clouds. Microbially, we have begun DNA extractions and subsequent metagenomic analysis using the Oxford Nanopore MinION using a select number of cloud water filters from 2024. Overall, this study aims to build upon microbial work accomplished by the Puy de Dôme groups and discuss the collection, storage, and analysis of cloudwater filters to connect the chemical to the microbial at WFM.

How to cite: Lombardo, S., Tripathy, A., Chittur, S. V., Gentry, D., Hayden, A., Kuentzel, M. L., Casson, P. W., Patel, R., Hammond, L., and Lance, S.: Preliminary study of Microbiology in Clouds at Whiteface Mountain in New York, EGU General Assembly 2025, Vienna, Austria, 27 Apr–2 May 2025, EGU25-7510, https://doi.org/10.5194/egusphere-egu25-7510, 2025.

EGU25-11035 | ECS | PICO | AS4.17

In-depth analysis of the origin of Primary Biological Aerosol Particles in a temperate forest of Leipzig 

Bhavana Valath Bhuan Das, Martina Herrmann, Beate Michalzik, Susanne Dunker, and Beatriz Sánchez-Parra

Primary Biological Aerosols (PBAPs) or bioaerosols are airborne particles originating from biological sources that are directly emitted from the biosphere into the atmosphere. These include bacteria, archaea, viruses, pollen, fungal spores, and fragments of plants and animals (Després, 2012) PBAPs play a significant role in atmospheric processes, climate regulation, and human health, making it essential to investigate their sources, composition, and emission mechanisms.

Bioaerosols can be transported over short or long distances, influenced by factors such as atmospheric turbulence, and environmental conditions (Fröhlich-Nowoisky, 2016) However, the mixing of locally emitted particles with those transported over long distances complicates the accurate identification of their emission sources. This challenge hinders our ability to fully understand their real influence on the atmosphere and ecosystem of origin.

To better elucidate the exchange of particles between these interconnected systems, in this study we investigated the plant and soil litter composition of a temperate floodplain forest thanks to the Leipzig Canopy Crane facility, located in the Leipzig Auwald, along with the dynamics of bioparticles in the air between the spring and autumn seasons.

Relevant data were obtained through sequencing the samples. By comparing the sequences with their potential sources, we obtained temporal and source-specific variations in the bioaerosol community structure across the different months. In Bacteria there is an increase in the overall diversity from spring to autumn, similar seasonal variation is observed in the fungal population. Ascomycota, one of the more dominant groups in the microbial community, varies in abundance with seasonal shifts, being consistently more abundant in the air samples when compared to Basidiomycota which are more prevalent in source communities, likely contributed by their individual dispersion properties.


References-

  • Després, V. R., Huffman, J., et al. (2012). Primary biological aerosol particles in the atmosphere: A review. Tellus B: Chemical and Physical Meteorology, 64(0), 15598. https://doi.org/10.3402/tellusb.v64i0.15598
  • Fröhlich-Nowoisky, J., et al. (2016). Bioaerosols in the Earth system: Climate, health, and ecosystem interactions. Atmospheric Research, 182, 346–376. https://doi.org/10.1016/j.atmosres.2016.07.018

How to cite: Valath Bhuan Das, B., Herrmann, M., Michalzik, B., Dunker, S., and Sánchez-Parra, B.: In-depth analysis of the origin of Primary Biological Aerosol Particles in a temperate forest of Leipzig, EGU General Assembly 2025, Vienna, Austria, 27 Apr–2 May 2025, EGU25-11035, https://doi.org/10.5194/egusphere-egu25-11035, 2025.

EGU25-13349 | PICO | AS4.17

Airborne microalgae: investigating their aerosolization potential and gaseous emissions 

Bernadette Rosati, Jane Tygesen Skønager, Marat Bektassov, Merete Bilde, Marta Barbato, Kasper Vita Kristensen, and Sylvie V.M. Tesson

Atmospheric aerosols influence the Earth’s radiation balance and play a significant role in cloud formation, as well as air quality. Among biological aerosols, there is a clear lack of understanding the impact airborne microalgae have on climate.  To date, most studies have focussed on the associated health and environmental effects when microalgae disperse to new environments; their interactions with sunlight and potential role in cloud seeding have so far been largely neglected.

In this work, we performed detailed laboratory measurements to mimic the potential release of microalgae from the oceans into the atmosphere.  For this purpose, we utilized a sea spray simulation chamber with a plunging jet. We selected microalgae strains from saltwater and freshwater environments that have previously been found to be important for the release of dimethyl sulphide, a compound that is imperative for new particle formation in the atmosphere in marine regions. We focussed on the investigation of the emission of the microalgae themselves and volatile organic compounds (VOCs) that are simultaneously released. Aerosol particle concentrations and size distributions were tracked online by using an aerosol size spectrometer; additionally, the emitted particles were sampled with an impinger and counted using microscopy. A proton-transfer-reaction mass spectrometer continuously measured the VOCs, which were also periodically sampled with Tenex sorbent tubes and analysed using mass spectrometry. Furthermore, we analysed whether microalgae viability was affected by the water-air transfer.

How to cite: Rosati, B., Skønager, J. T., Bektassov, M., Bilde, M., Barbato, M., Kristensen, K. V., and Tesson, S. V. M.: Airborne microalgae: investigating their aerosolization potential and gaseous emissions, EGU General Assembly 2025, Vienna, Austria, 27 Apr–2 May 2025, EGU25-13349, https://doi.org/10.5194/egusphere-egu25-13349, 2025.

EGU25-15888 | PICO | AS4.17

Lipidome of Saharan dust aerosols 

Kalliopi Violaki, Christos Panagiotopoulos, Pierre Rossi, Ernest Abboud, Maria Kanakidou, Nikolaos Evangeliou, Christine Groot Zwaaftink, and Athanasios Nenes

Lipidomics, a subfield of metabolomics, is an emerging field where hundreds to thousands of lipid species are simultaneously identified. Given the ubiquity and diverse biological roles of lipids, lipidomics offers valuable insights into mechanisms and the discovery of biomarkers related to environmental stressors that affect the cellular physiology and their numerous biochemical pathways. The major source of lipids in the atmosphere are the biogenic particles (bioaerosols) e.g., bacteria, fungi, pollen, plant fragments and viruses. Specifically, the terrestrial ecosystems including deserts, are the major sources of the atmospheric bioaerosols with urban environments and areas with agricultural and industrial activity being particularly important. The desert dust aerosols contain high concentrations of bioaerosols mainly composed of soil microorganisms and plant detritus. Agricultural dust can contain significantly more amounts of biological material, which subsequently can be enriched with additional biogenic particles when they are transported across terrestrial and aquatic environment through their coagulation with other airborne bioaerosols. The lipidome of airborne biogenic particles is unexplored to date, yet it can provide unique insights on bioaerosols, their stress state and oxidant exposure history. During this study we used lipidomics as a novel tool for the atmospheric research, to study the lipid changes in bioaerosols systems induced by their exposure to air pollutants and other atmospheric aging factors.

To achieve this, Saharan dust aerosols (n= 15) were sampled from East Mediterranean (Crete, Greece) using a high-volume (85 m3 h−1) TSPs sampler (TISCH). Dust atmospheric particles were collected on precombusted (450 °C for 5 h) 20 × 25 cm quartz filters (Pall, 2500QAT-UP). A reliable analytical protocol was established for lipidomics analysis of Saharan dust aerosols, which allowed us to identify approximately 60 lipid species, primarily phosphatidylcholines (PC), phosphatidylethanolamines (PE), triglycerides (TG), and their oxidation products, ceramides (Cer), and monogalactosyldiacylglycerols (MGDG). In addition to lipid analysis, biological identification and chemical analysis, including metals, major ions, and sugars, was also performed and will be discussed in detail.

Each dust event has a distinct signature, reflecting not only the chemical composition of the Saharan soil but also the atmospheric processing during its long-range transport. Preliminary results indicate a higher percentage contribution from the oxidation products of TG (OxTG, 33%) and PCs (OxPC, 22%) to the total identified lipids. The significant correlation between PCs and mannitol indicates a fungal contribution to airborne cholines. Furthermore, the correlation between anthropogenic metals (e.g., V, Ni, As, Cr, Pb) and galactolipids (MGDG), which are common plant membrane lipids, indicates a complex mixture of anthropogenic emissions and plant material in the dust aerosols due to long range transport of Saharan soil.


How to cite: Violaki, K., Panagiotopoulos, C., Rossi, P., Abboud, E., Kanakidou, M., Evangeliou, N., Groot Zwaaftink, C., and Nenes, A.: Lipidome of Saharan dust aerosols, EGU General Assembly 2025, Vienna, Austria, 27 Apr–2 May 2025, EGU25-15888, https://doi.org/10.5194/egusphere-egu25-15888, 2025.

EGU25-16671 | ECS | PICO | AS4.17

Isolation and characterization of potentially pathogenic bacteria from mountainous regions in France 

Masoumeh Kashiri, Athanasios Zervas, Florian H. H. Brill, Jörg Steinmann, and Alexandre M. Anesio

Introduction:

High-altitude snowy regions are recognized as unique biomes hosting diverse microbial communities. Microorganisms in these environments have evolved adaptations to survive extreme conditions, such as low temperatures, high UV radiation, and limited nutrient availability. These adaptations may include antibiotic resistance and virulence factors, which could pose ecological and public health risks if transferred to human pathogens or clinically relevant ecosystems. 

This study aimed to isolate and identify bacterial strains from these environments, assess their temperature tolerance, hemolytic activity, and potential antibiotic resistance profiles and to investigate the presence of antibiotic resistance genes (ARGs) and their potential public health risks.


Methods:

Snow samples were collected from Chamrousse Ski Resort (Grenoble, France) and cultivated on R2A agar at 4°C, 15°C, and 37°C, with morphologically distinct colonies isolated and purified. Growth was monitored over 7 days at 4°C, 15°C, 25°C, and 37°C by measuring OD600 at 24-hour intervals to assess temperature tolerance. Hemolytic activity was evaluated on sheep and horse blood agar plates incubated at 15°C, 25°C, and 37°C, with patterns of alpha, beta, or gamma hemolysis recorded. Genomic DNA was extracted, and 16S rRNA sequencing was used to identify the isolates at the species level. Whole genome sequencing was conducted using the Oxford Nanopore method, and antibiotic resistance genes (ARGs) were identified via the CARD database. Minimum inhibitory concentration (MIC) testing is planned as a follow-up to validate resistance profiles and assess the functional expression of the identified ARGs.


Results:

Sanger sequencing of the 16S rRNA gene identified Peribacillus simplex for isolates 1, 2, and 3, and Sphingomonas faeni for isolate 4, with 100% sequence homology. Growth monitoring revealed that Peribacillus isolates grew best at 25°C, with Peribacillus 1 showing moderate growth at 37°C, while Sphingomonas exhibited psychrotolerant traits, thriving at 15°C and 25°C but performing poorly at other temperatures. Hemolytic activity tests showed that Peribacillus 1 exhibited alpha hemolysis on both sheep and horse blood agar, whereas Peribacillus 2 and 3 showed gamma hemolysis, and Sphingomonas did not grow on blood agar. Whole genome sequencing identified several antibiotic resistance genes (ARGs) linked to multidrug resistance and virulence, including blaZ and vanY in Peribacillus spp., and acrB and mexA in Sphingomonas spp.


Conclusion:

This study highlights the adaptability of microbial communities in snowy alpine environments to changing climates and their potential to spread ARGs and hemolytic features into ecosystems. The presence of such traits in these microorganisms underscores their possible role as reservoirs of antibiotic resistance and virulence factors in natural habitats. Further studies, including MIC testing and pathogenicity assessments, are crucial to fully understanding the ecological and public health implications of these findings.

How to cite: Kashiri, M., Zervas, A., H. H. Brill, F., Steinmann, J., and M. Anesio, A.: Isolation and characterization of potentially pathogenic bacteria from mountainous regions in France, EGU General Assembly 2025, Vienna, Austria, 27 Apr–2 May 2025, EGU25-16671, https://doi.org/10.5194/egusphere-egu25-16671, 2025.

EGU25-17716 | PICO | AS4.17

Microorganisms in the air through the lenses of atmospheric chemistry and microphysics  

Barbara Ervens, Pierre Amato, Kifle Aregahegn, Muriel Joly, Amina Khaled, Tiphaine Labed-Veydert, Frederic Mathonat, Leslie Nuñez-López, Raphaelle Peguilhan, and Minghui Zhang

Microorganisms in the atmosphere comprise a tiny fraction (~10-8%) of the Earth’s microbiome. A significant portion of this ‘aeromicrobiome’ consists of bacteria that typically remain airborne for a few days before being returned to the ground through wet or dry deposition. Unlike bacteria in the other Earth surface spheres (e.g., litho-, hydro-, phyllo-, cryospheres), atmospheric bacteria are aerosolized, residing in individual particles and separated by considerable distances (a few centimeters) from each other. Within these small isolated microcosms, bacteria are exposed to particular chemical and physical conditions that potentially affect their stress levels, survival and general functioning. Using fundamental chemical and microphysical concepts of atmospheric aerosol particles and cloud droplets, we examine these specific environmental conditions. In particular, we challenge the concept of clouds as microbial oases by illustrating the water amounts and time scales inside clouds. In addition, we suggest that the small volumes of cloud droplets may cause greater nutrient limitations but simultaneously reduce oxidative stress compared to other aquatic environments. Various chemical and microphysical factors may act as microbial stressors (e.g., oxidative, osmotic, and UV-induced) in the atmosphere, which may either enhance or diminish the survival and diversity of atmospheric bacteria. Based on established atmospheric chemical and microphysical principles, we discuss that observed trends of bacterial community properties and pollutant concentrations may lead to incorrect interpretations due to confounding factors. In summary, our presentation aims to motivate future experimental and modeling studies to disentangle the complex interplay of chemical and microphysical factors with the atmospheric microbiome. Such studies are important to eventually allow for a comprehensive understanding of the atmosphere’s role in affecting airborne microorganisms, a small yet rapidly evolving component of the Earth’s microbiome.


Ervens, B., Amato, P., Aregahegn, K., Joly, M., Khaled, A., Labed-Veydert, T., Mathonat, F., Nuñez López, L., Péguilhan, R., and Zhang, M.: Ideas and perspectives: Microorganisms in the air through the lenses of atmospheric chemistry and microphysics, Biogeosciences, 22, 243–256, https://doi.org/10.5194/bg-22-243-2025, 2025.

How to cite: Ervens, B., Amato, P., Aregahegn, K., Joly, M., Khaled, A., Labed-Veydert, T., Mathonat, F., Nuñez-López, L., Peguilhan, R., and Zhang, M.: Microorganisms in the air through the lenses of atmospheric chemistry and microphysics , EGU General Assembly 2025, Vienna, Austria, 27 Apr–2 May 2025, EGU25-17716, https://doi.org/10.5194/egusphere-egu25-17716, 2025.

EGU25-18147 | PICO | AS4.17

Characterization of the Atmospheric Microbiome in a Semi-Rural Area of Central Europe Using Flow Cytometry 

Ernest Abboud, Pierre Rossi, Benoit Crouzy, Athanasios Nenes, and Kalliopi Violaki

The abundance, characterization, and identification of biological aerosol particles (bioaerosols) are important for understanding their impact on the Earth system in terms of biogeochemical cycles of phosphorus and nitrogen, cloud formation, precipitation, and human health. Bioaerosols consist of all airborne prokaryotes or eukaryotes ranging in size from a few nanometers to hundreds of micrometers.

In this study, a flow cytometry protocol was optimized in order to quantify and characterize the biogenic particles collected from a semi-rural site in central Europe (Payern, Switzerland). Samples collection (n = 39) was performed using a high-volume wet-cyclone over a period of 5 months (April to August 2024). Specifically, a live/dead protocol for atmospheric samples was optimized using two nucleic acid stains: Syto13 to stain all live cells and propidium iodide to stain all dead cells. The simultaneous use of the dyes and the subsequent application of an automated clustering algorithm after acquisition (FlowSOM, Bioconductor - FlowSOM) allowed us to identify populations characterized by a high nucleic acid (HNA) content (e.g., fungal spores and protists) and a low nucleic acid (LNA) content (e.g., bacterial cells and dead protists).

Preliminary results showed that the average concentration of bioaerosols was 2.25x10⁴ ± 2.99x10⁴ microorganisms m-3. The HNA population was dominant during the sampling period (detected in 79% of the samples) while the LNA population dominated the bioaerosols fraction on rainy days. The intact population dominated the bioaerosol fraction (92.6 ± 12.3%) compared to the dead population (7.4 ± 12.3%). A significant high correlation was found between the LNA and the dead populations (rspearman = 0.88), indicating that the dead population is a component of the LNA population (rspearman = 0.50 with the HNA population).

The populations quantified by flow cytometry will be identified taxonomically using Oxford Nanopore sequencing. The results will be discussed in detail.

How to cite: Abboud, E., Rossi, P., Crouzy, B., Nenes, A., and Violaki, K.: Characterization of the Atmospheric Microbiome in a Semi-Rural Area of Central Europe Using Flow Cytometry, EGU General Assembly 2025, Vienna, Austria, 27 Apr–2 May 2025, EGU25-18147, https://doi.org/10.5194/egusphere-egu25-18147, 2025.

EGU25-18628 | PICO | AS4.17

Microorganisms from North African deserts persist in Southern Europe’s atmosphere 

Joan Cáliz, Mateu Menéndez-Serra, Xavier Triadó-Margarit, Anna Avila, and Emilio O. Casamayor

Long-range atmospheric processes facilitate global dispersal of microorganisms, with significant implications for Earth’s ecosystems functioning and global health. While traditional aerobiological studies have focused on low troposphere aerosols, assuming airborne communities are primarily influenced by neighbouring ecosystems, our study challenges this perspective. We analysed nearly three decades of aerosol particles present in rainwater samples collected at a mountain site located in South Europe (Iberian Peninsula, NE Spain). Coupling this data with analyses of high troposphere air mass provenances and genetic data of topsoils from North Africa and from a global public bacterial database, we revel a persistent influence of desert microorganisms from North Africa in Southern European sky. Remarkably, desert-derived microorganisms dominate even in rain originating from the Atlantic Ocean, despite sea spray being the largest source of global aerosols. The frequency of dust outbreaks, altitude reached, and long residence times of fine-sized particulates are postulated as critical factors that significantly shape the long-range and persistence of aerial assemblages, while air mass provenance playing a secondary role. Our findings highlight the profound and long-lasting impact of desert aerosols on terrestrial ecosystems, calling for further exploration of intercontinental aerial connections with deserts and drylands elsewhere, and the ecological implications of desert immigrants on worldwide ecosystems.

How to cite: Cáliz, J., Menéndez-Serra, M., Triadó-Margarit, X., Avila, A., and O. Casamayor, E.: Microorganisms from North African deserts persist in Southern Europe’s atmosphere, EGU General Assembly 2025, Vienna, Austria, 27 Apr–2 May 2025, EGU25-18628, https://doi.org/10.5194/egusphere-egu25-18628, 2025.

EGU25-18717 | ECS | PICO | AS4.17

Temporal Dynamics of Atmospheric Microbial Communities in the Alps: Insights from 11-Years of High-Altitude Sampling 

Marie Labat Saint Vincent, Patrik Winiger, Julian Weng, Stephan C. Schuster, Christoph Hueglin, Sophie Darfeuil, Pauline Bros-Rolere, Patrick Ginot, Claudia Mohr, Jean-Luc Jaffrezo, Imad El-Haddad, Aurélien Dommergue, and Catherine Larose

Temporal Dynamics of Atmospheric Microbial Communities in the Alps: Insights from 11-Years of High-Altitude Sampling

Marie Labat Saint Vincent1; Patrik Winiger2; Julian Weng2; Stephan C. Schuster3; Christoph Hueglin4; Sophie Darfeuil1; Pauline Bros-Rolere1; Patrick Ginot1; Claudia Mohr2,5; Jean-Luc Jaffrezo1; Imad El-Haddad2; Aurélien Dommergue1; Catherine Larose1

1: Institut des Géosciences de l’Environnement (IGE) CNRS, UGA, IRD, INRAE, Grenoble INP, 38058, Grenoble CEDEX, France

2 : PSI Center for Energy and Environmental Sciences (PSI-CEES), Paul Scherrer Institute, Villigen, 5232, Switzerland

3 : Singapore Centre for Environmental Life Sciences Engineering (SCELSE), Nanyang Technological University Singapore, Singapore, Singapore

4 : Swiss Federal Laboratories for Materials Science and Technology (EMPA), Dübendorf, 8600, Switzerland

5 : Department of Environmental Systems Science, ETH Zurich, 8092 Zürich, Switzerland


Atmospheric microbial communities play a significant role in biogeochemical cycles and serve as a key source of microorganisms deposited onto glacial surfaces, where they may be preserved for millennia. Understanding the dynamics of these communities and their responses to environmental factors is critical for assessing their transfer and preservation in glacial archives. In this study, we leverage a unique dataset collected by the Swiss National Air Pollution Monitoring Network (NABEL), consisting of 11 years (2010–2021) of atmospheric particulate samples from Jungfraujoch (3500m a.s.l., Switzerland). This sampling site provides a rare opportunity to unravel atmospheric microbial community dynamics at high altitude as well as providing information on the pool of microorganisms that can potentially be deposited onto glaciers in the Alps.

DNA extraction and quantitative PCR (qPCR) were performed on atmospheric filters collected every four days (>1000 samples) to quantify microbial abundance. These data allow us to investigate the temporal trends in abundance in the Alpine atmosphere over more than a decade, highlighting seasonal variations over time. Additionally, correlations with geo-physico-chemical environmental parameters, like temperature, pollution events, and atmospheric composition, were carried out to identify key factors driving these dynamics.

This time series represents one of the most comprehensive temporal datasets of atmospheric microbial dynamics at high altitude available. In addition to providing a unique opportunity to characterize the drivers of microbial communities in the atmosphere over longer time scales, this data also represents an important step towards understanding the processes governing microbial deposition and preservation in Alpine ice. This work lays the foundation to the broader goal of validating ice cores as reliable archives of past atmospheric microbial diversity and environmental conditions.

How to cite: Labat Saint Vincent, M., Winiger, P., Weng, J., Schuster, S. C., Hueglin, C., Darfeuil, S., Bros-Rolere, P., Ginot, P., Mohr, C., Jaffrezo, J.-L., El-Haddad, I., Dommergue, A., and Larose, C.: Temporal Dynamics of Atmospheric Microbial Communities in the Alps: Insights from 11-Years of High-Altitude Sampling, EGU General Assembly 2025, Vienna, Austria, 27 Apr–2 May 2025, EGU25-18717, https://doi.org/10.5194/egusphere-egu25-18717, 2025.

EGU25-19389 | PICO | AS4.17

Metabolic activity and inaZ gene expression during atmospheric dispersal of plant pathogen Pseudomonas syringae  

Tina Šantl-Temkiv, Corina Wieber, María Palomeque Sánchez, Anton Legin, Arno Schintlmeister, Stefanie Imminger, Sigurd Christiansen, Meilee Ling, Augusta Kjelstrup Isaksen, Merete Bilde, Thomas Boesen, Dagmar Woebken, Bernadette Rosati, and Kai Finster

Pseudomonas syringae is a common plant pathogen, posing significant threats to the global crop production. By producing ice-nucleating proteins (INpro), encoded by the inaZ gene, cells can inflict frost injuries to plants, gaining access to nutrient-rich plant tissue. Furthermore, P. syringae can impact cloud formation and interfere with atmospheric chemistry through their metabolic and ice-nucleation activity. Both metabolic activity and inaZ gene expression under atmospheric conditions remain poorly understood, limiting our ability to accurately predict the atmospheric impact and dispersal success of P. syringae.


Our fist aim was to investigate the metabolic activity of P. syringae at simulated atmospheric conditions. We exposed single cells placed on polycarbonate filters to RH 94-100% in presence of D2O. We used the incorporation of deuterium as an activity marker detected via nanoscale secondary ion mass spectrometry (NanoSIMS). Cells exhibited metabolic activity when liquid water was available (RH 100%) without the addition of carbon sources, suggesting that P. syringae can maintain activity based on storage compounds. While we observed a significant decrease in deuterium incoorporation when water was supplied through the vapor phase (<100% RH), likely due to reduced viability, a fraction of cells remained metabolically active at 97% and 94% RH. Interestingly, we observed deuterium incorporation in non-viable cells, likely because of residual enzymatic activity. Such residual enzymatic activity in dead airborne cells may have unknown impacts on atmospheric chemistry, which remain to be determined. Altogether, the results suggest that metabolic activity is possible both in cloud droplets and in dry atmosphere based on storage compounds available in cells, which could support cells in actively modifying their surface properties, by e.g. synthesizing novel INpro while airborne.


Our second aim was to investigate the effect of aerosolization on the inaZ gene expression in P. syringae. Using bubble-bursting aerosolization combined with immunofluorescence staining we found a significantly larger proportion of INpro-bearing cells in the aerosolized fraction (33.2%) compared to pre-aerosolization (10.7%). Using microbial adhesion to hydrocarbon test in combination with a droplet-freezing assay to quantify INpro-bearing cells, we found that cell surface hydrophobicity did not vary between INpro-bearing and other cells, suggesting that our observation was not linked to preferential aerosolization of INpro-bearing cells. Finally, we assessed the relation between cell viability and the number of INpro-bearing cells, to decipher whether INpro synthesis is triggered in aerosolized cells. Here, cells were aerosolized using a Sparging Liquid Aerosol Generator into a flow tube at varying RH and were recollected using different methods which both affected cell viability. Viability was determined by live/dead staining and flow cytometry. We found that the increase in INpro-bearing cell fraction after aerosolization, as determined via the droplet-freezing assay, correlated with the fraction of viable cells, suggesting that a stress response triggered inaZ gene expression leading to the synthesis of novel INpro.


Overall, we demonstrated that metabolic activity and inaZ gene expression is feasible in airborne P. syringae and leads to a significant increase in INpro-bearing cells. These processes may have profound impacts on cloud formation,  atmospheric chemistry, and the dispersal success of P. syringae.

How to cite: Šantl-Temkiv, T., Wieber, C., Sánchez, M. P., Legin, A., Schintlmeister, A., Imminger, S., Christiansen, S., Ling, M., Isaksen, A. K., Bilde, M., Boesen, T., Woebken, D., Rosati, B., and Finster, K.: Metabolic activity and inaZ gene expression during atmospheric dispersal of plant pathogen Pseudomonas syringae , EGU General Assembly 2025, Vienna, Austria, 27 Apr–2 May 2025, EGU25-19389, https://doi.org/10.5194/egusphere-egu25-19389, 2025.

The atmospheric dust cycle serves as a global conduit for microorganisms, with implications for environmental processes, ecosystem health, and human well-being. This study investigates the growth dynamics of dust-borne bacteria, focusing on their ability to thrive on atmospheric dust substrates, the characterization of the microbiome, their localization, and interactions. Dust samples collected from the eastern Mediterranean were cultured to identify selected bacterial with versatile metabolic capacities that are often associated with significant ecological and health impacts. We will present our findings of their growth patterns, substrate utilization, and environmental tolerance, explored under laboratory conditions. Our preliminary findings highlight the diversity of dust-borne bacterial community, their potential interactions, and their durability in different environmental conditions and anthropogenic effects.

How to cite: Lahav, E. and Lang-Yona, N.: Growth Dynamics of Dust-Borne Bacteria on Atmospheric Dust Substrates and Potential Implications, EGU General Assembly 2025, Vienna, Austria, 27 Apr–2 May 2025, EGU25-19919, https://doi.org/10.5194/egusphere-egu25-19919, 2025.

EGU25-20514 | PICO | AS4.17

Influence of climatic variables on the production and dispersion of allergenic pollen in Mexico City. 

Maria del Carmen Calderon-Ezquerro, Benjamín Martínez-López, and César Guerrero-Guerra

Climate change has diverse biological impacts on plants, significantly altering their reproductive processes. These alterations are reflected in flowering phenology and pollen production rates, which are highly sensitive to climatic variations and are frequently used as bioindicators in temperate regions.

Pollen data analysis is essential to assess the effects of climate change on plants at a regional level. Temperature emerges as a key factor influencing changes in flowering phenology, and advances in reproductive stages are increasingly linked to global warming. Likewise, water availability significantly influences plant productivity.

Global warming due to increased greenhouse gas emissions, especially CO2, is the primary driver of climate change in vast regions of our planet. Increased surface air temperatures, changes in water availability, and high atmospheric CO2 concentrations directly impact plant biology, affecting photosynthesis and thus modifying plant growth and development. Furthermore, temperature and precipitation variations related to some patterns of interannual climate variability, such as the North Atlantic Multidecadal Oscillation and El Niño-Southern Oscillation, can influence plant phenology. These changes have public health implications, as they can modify pollen production and increase the prevalence and severity of pollen-related allergic diseases.

How to cite: Calderon-Ezquerro, M. C., Martínez-López, B., and Guerrero-Guerra, C.: Influence of climatic variables on the production and dispersion of allergenic pollen in Mexico City., EGU General Assembly 2025, Vienna, Austria, 27 Apr–2 May 2025, EGU25-20514, https://doi.org/10.5194/egusphere-egu25-20514, 2025.

BG7 – Extraterrestrial and Extreme Environment Biogeosciences

The Upper Paleozoic Carboniferous Taiyuan-Shanxi Formation acts as the main hydrocarbon supply layer for tight sandstone gas in the Ordos Basin. The hydrocarbon generation and expulsion characteristics as well as the hydrocarbon generation potential of coal, carbonaceous mudstone, and dark mudstone are crucial matters in the exploration and development of tight sandstone gas in the southern part of the basin. Considering that the maturity in the southern Ordos Basin is generally above 2.0%, to restore the original hydrocarbon generation potential, in this study, low-mature samples of three types of coal-measure source rocks from the Carboniferous Taiyuan Formation in the Chengning Uplift of the Huanghua Depression in the Bohai Bay Basin were collected from the same strata. Different simulation temperatures ranging from 350 to 700 °C with a gradient of 50 °C were set. Hydrocarbon generation and expulsion simulation experiments in a closed system were conducted, and the residual and expelled hydrocarbons of the source rock simulation samples under different maturity gradients were obtained. The maturity of each simulated temperature point was calibrated by coal samples. Additionally, the source rock samples before and after the simulation were subjected to mass weighing, total organic carbon (TOC) analysis, rock pyrolysis (Rock-Eval), and quantitative analysis of hydrocarbon expulsion. The results indicate that as the simulation temperature increases, the oil generation process mainly occurs before 400 °C (Ro = 1.13%). Meanwhile, gas generation continuously increases from 300 °C (Ro = 0.83%) to 700 °C (Ro = 4.35%) without reaching a peak. The percentage of methane gradually rises and reaches over 95%. Combined with basin modeling, it is determined that the Late Jurassic to Early Cretaceous is the main gas generation period. At an experimental temperature of 700 °C in the closed system, the organic carbon conversion rate of dark mudstone is 77.1%. In contrast, coal has an organic carbon conversion rate of less than 20%, and carbonaceous mudstone has a rate of less than 30%. This shows that coal and carbonaceous mudstone still have significant hydrocarbon generation potential under high-temperature conditions.

How to cite: Zhang, Y.: Study on gas generation process of high-over mature coal-measure source rocks in southern Ordos Basin, EGU General Assembly 2025, Vienna, Austria, 27 Apr–2 May 2025, EGU25-3166, https://doi.org/10.5194/egusphere-egu25-3166, 2025.

EGU25-3813 | Posters on site | BG7.1

The control of physical and biological drivers on pelagic methane fluxes in a Patagonian fjord (Golfo Almirante Montt, Chile) 

Oliver Schmale, Volker Mohrholz, Svenja Papenmeier, Klaus Jürgens, Martin Blumenberg, Peter Feldens, Sebastian Jordan, Paula Ruiz-Fernández, Christian Meeske, Jenny Fabian, Sören Iwe, and Lars Umlauf

The methane flux from coastal water areas such as fjords and the underlying control mechanisms have been little studied to date. Fjords are characterized by a complex hydrography that is shaped by marine and limnic interactions and leads to a pronounced stratification of the water column. The resulting low ventilation of the deep water together with high primary production rates in the surface water and the subsequent transport of the organic material to the seabed often lead to high methane releases from the seabed. In our study, we analyzed a fjord system in the Chilean part of Patagonia, the Golfo Almirante Montt. The investigation is based on studies of water column methane concentration and stable carbon isotopes, the distribution and activity of methane-oxidizing bacteria, and oceanographic and geological observations. Our results indicate that methane is of biogenic origin is released from gas-rich sediments at the entrance of the main fjord basin, which is characterized by pockmarks and gas flares. Tidal currents and turbulent mixing at the sill cause a methane plume near the surface to spread into the main fjord basin and mix with the methane- and oxygen-depleted deep water. The wind-induced mixing at the sea surface controls the methane flux from the methane plume into the atmosphere. The methane plume is consumed mainly by methanotrophic bacteria. An enrichment of the signature gene particulate methane monooxygenase (pmoA) in the methane-poor deep water, and a conspicuously high δ13C-CH4 signature of the methane suggest that methane-rich intrusions are periodically introduced into the deep water, which are subsequently converted microbially. Additionally, a δ13C-CH4 anomaly in deep water that correlates with a zooplankton accumulation in this depth during daytime is considered to be a product of zooplankton-associated methane production. Our interdisciplinary study offers a comprehensive insight into the complex physical and biological processes that modulate methane dynamics in fjords and thus help to better assess how methane emissions from these systems will change under anthropogenic influence.

How to cite: Schmale, O., Mohrholz, V., Papenmeier, S., Jürgens, K., Blumenberg, M., Feldens, P., Jordan, S., Ruiz-Fernández, P., Meeske, C., Fabian, J., Iwe, S., and Umlauf, L.: The control of physical and biological drivers on pelagic methane fluxes in a Patagonian fjord (Golfo Almirante Montt, Chile), EGU General Assembly 2025, Vienna, Austria, 27 Apr–2 May 2025, EGU25-3813, https://doi.org/10.5194/egusphere-egu25-3813, 2025.

EGU25-4139 | Posters on site | BG7.1

Adaptation of methane-oxidizing bacteria to environmental changes: implications for coastal methane dynamics 

Helge Niemann, Tim de Groot, Julia C. Engelmann, Pierre Ramond, Julia Diorgio, and Judith van Bleijswijk

Global warming induced alterations in ocean temperature regimes, and precipitation patterns are increasingly impacting coastal ecosystems, leading to shifts in water column properties. These changes may have profound implications for microbial communities such as methane-oxidizing bacteria (MOBs), which play a critical role in regulating methane fluxes and ecosystem dynamics. In this study, we investigate the resilience and adaptability of aerobic MOBs in response to changing environmental conditions. Through microcosm incubation experiments with waters from the North Sea and the Wadden Sea collected during different seasons, we explore how variations in methane availability, temperature, and salinity influence the MOB community structure and functional capacity. Our results reveal an increase in the relative abundance of MOBs to up to 57% in experiments with elevated methane concentrations, highlighting the primary role of methane availability for MOB community development. Temperature and salinity variations, on the other hand, exerted lesser effects on MOB composition and relative abundance. A strong effect on MOB community development was furthermore caused by the origin of the inoculum (location and season). Our results thus suggest a functional redundancy in the variable pools of microbial inocula enabling multiple MOB clades to cope with drastic changes in environmental parameters. The adaptability of MOB communities is key to understand their role in mitigating methane emissions from coastal regions in a future ocean with potentially elevated methane, temperature and variable salinity levels.

How to cite: Niemann, H., de Groot, T., Engelmann, J. C., Ramond, P., Diorgio, J., and van Bleijswijk, J.: Adaptation of methane-oxidizing bacteria to environmental changes: implications for coastal methane dynamics, EGU General Assembly 2025, Vienna, Austria, 27 Apr–2 May 2025, EGU25-4139, https://doi.org/10.5194/egusphere-egu25-4139, 2025.

EGU25-4230 | Posters on site | BG7.1

Microbial turnover of hydrocarbons at a leaking abandoned oil well in Germany 

Martin Blumenberg, Georg Scheeder, Sebastian F.A. Jordan, Martin Krüger, and Stefan Schlömer

With a contribution of about one third, methane is the second most important greenhouse gas in the climate system. In addition to a biogenic formation, e.g. in wetlands, methane also is emitted during anthropogenic industrial activities. BGR is investigating abandoned onshore oil and gas wells in Germany, which are generally plugged and buried, for their relevance as sources of methane. Initial results from studied wells examined so far (about 75 wells) indicated no or very low methane emissions at very few sites. A controlling process for low methane emissions for the wells could be microbial methane oxidation, which is an important process in organic-rich soils overlying wells in Northern Germany (Jordan et al., accepted).

We present here data from soil above a plugged oil well, drilled in the early 1920s and located at Nienhagen near Hannover (Germany). At the well ~40 mg CH4 h-1 were emitted (average range for plugged US oil wells ~50 to 170 mg h-1 per well; Williams et al. 2021). Gas geochemical analyses of the soil gas confirm the presence of natural gas (up to 8 % methane and 600 ppm ethane) and the δ13C of the methane supports that the majority is thermogenic (-47.1 ‰). In addition to natural gas, we also found petroleum in the soil, which reached up to 80 % soil total organic carbon. Our data suggest a complex mosaic of hydrocarbon-altering effects dominated by products from the microbial degradation of well-derived oil and natural gas (e.g., propane oxidation). It is likely that O2 availability controls the degradation of petroleum in the soil under investigation, because the strongest degree of degradation was found in the upper soil horizons. The properties of the formerly produced oil exclude biodegradation in the reservoir, so the degraded oil must have been formed during the ascent or in the topsoil. The gas geochemical composition of the soil gases indicates also deeper, anaerobic processes, such as methanogenesis, probably with petroleum as the carbon source. Soil microcosms from different depths showed, indeed, a rapid onset of microbial degradation of added oil both under aerobic and anaerobic conditions in the lab. Although processes in a deeper biosphere appear to play a role here, it is likely that mostly the microbial processes in the soil surrounding the well regulate the composition and quantity of oil and gas. In conclusion, the (i) high degree of degradation in the natural gas components in the soil and petroleum, as well as the overall (ii) only low methane emissions, indicate that the Nienhagen well is only leaking relatively little and that a “microbial hydrocarbon filter” is established and active.

References

Jordan, S.F.A., Schloemer, S., Krüger, M., Heffner, T., Horn, M.A., Blumenberg, M., (accepted) Preprint. Interferences caused by the microbial methane cycle during the assessment of abandoned oil and gas wells. EGUsphere. doi:10.5194/egusphere-2024-1461

Williams J. P., Regehr A. and Kang M. (2021) Methane Emissions from Abandoned Oil and Gas Wells in Canada and the United States. Environmental Science & Technology 55, 563–570.

How to cite: Blumenberg, M., Scheeder, G., Jordan, S. F. A., Krüger, M., and Schlömer, S.: Microbial turnover of hydrocarbons at a leaking abandoned oil well in Germany, EGU General Assembly 2025, Vienna, Austria, 27 Apr–2 May 2025, EGU25-4230, https://doi.org/10.5194/egusphere-egu25-4230, 2025.

EGU25-4511 | ECS | Posters on site | BG7.1

Exploring biomarker signatures of methane hydrates in the Amazon Cone 

Monique Aparecida Marchese Rizzi, Tais Freitas da Silva, Joice Cagliari, Tiago Jonatan Girelli, Adolpho Herbert Augustin, Luiz Frederico Rodrigues, Dennis James Miller, José Antonio Cupertino, and Farid Chemale Jr.

The study of organic matter in sediments is crucial for advancing energy resource exploration and understanding geological and biogeochemical processes. This study focuses on the Amazon Cone (Brazil), a region of significant interest following the last decade's discovery of gas hydrates in Brazilian waters. Methane, the main gas released by dissociating hydrates, is a potent greenhouse gas with biogenic or thermogenic origins. Therefore, understanding its pathways in sedimentary environments is fundamental for energy exploration and climate sciences. Building on data from the 2023 Amaryllis-Amagas Oceanographic Mission aboard the Marion Dufresne research vessel, this work investigates gas hydrate systems on Brazil’s equatorial margin through biomarker analysis. A total of 89 samples from seven piston cores were analyzed by Rock-Eval Pyrolysis, and 20 samples were selected based on Total Organic Carbon (TOC) values and core positions (top, middle, and bottom). Soxhlet extraction with dichloromethane/methanol (8:2) was followed by liquid chromatography to separate saturated hydrocarbons, aromatic hydrocarbons, and polar fractions, and GC/MS (Gas Chromatography-Mass Spectroscopy) was used for compound identification. N-alkanes ranging from n-C18 to n-C35 were identified with a predominance of long-chain n-alkanes (n-C25 to n-C35) with a marked odd-over-even carbon number preference (e.g., the greater abundance of nC27, nC29, nC31, and nC33), which indicate an input of terrestrial plant-derived organic matter. Furthermore, pristane and phytane are present in very low abundance. Terpanes distribution points to anoxic depositional conditions, and the domination of ββ-C30, ββ-C31, and ββ-C32 compounds corresponds to a low level of thermal maturity. The steranes analysis also observed low maturity, showing a predominance of biological isomers, while the diasteranes DIA27S > DIA27R ratio emphasizes clay-catalyzed processes in a clastic, clay-rich sedimentary environment, characteristic of the Amazon Cone. The terrestrial input coupled with evidence of bacterial activity highlights the role of microbial processes in shaping the organic matter composition. Also, the low thermal maturity of the organic matter aligns with favorable conditions for biogenic methane production. Likewise, the clay-rich environment of the Amazon Cone facilitates the trapping and preservation of gas hydrates by providing structural stability to the sediments. Combined with the anoxic conditions inferred from the biomarkers, these findings are consistent with the microbial pathways critical for methane production and gas hydrate stability. Therefore, the Amazon Cone appears to be a region where microbial and geological processes converge to create and maintain methane hydrate deposits. This underscores the potential of the area not only as a site of scientific interest but also as a candidate for future energy exploration, with the added significance of understanding methane’s role in global carbon cycling and greenhouse gas emissions.

How to cite: Rizzi, M. A. M., da Silva, T. F., Cagliari, J., Girelli, T. J., Augustin, A. H., Rodrigues, L. F., Miller, D. J., Cupertino, J. A., and Chemale Jr., F.: Exploring biomarker signatures of methane hydrates in the Amazon Cone, EGU General Assembly 2025, Vienna, Austria, 27 Apr–2 May 2025, EGU25-4511, https://doi.org/10.5194/egusphere-egu25-4511, 2025.

Cold seeps are chemosynthetic ecosystems on the seafloor that harbor diverse benthic communities by the supply of methane-rich fluids from subsurface reservoirs. Despite the global significance in biogeochemical cycling of cold seeps, the relative importance of methane-related microbial processes and the impact of methane leakage on the upper ocean remains not fully understood. We integrated a suite of biogeochemical approaches to elucidate microbial activity of methane oxidation in cold seeps sediment and overlying waters of South China Sea, and further estimate the role of methane oxidation in the regulation of methane emissions. Stable carbon isotope of methane suggested a biological origin and δ13C values of DIC indicated the dominance of methane oxidation. Radiotracer labelling showed that methanogenesis, anaerobic oxidation of methane and sulfate reduction concurrently occurred in seep sediments. In the overlying waters, methane concentrations in the vicinity of the seeps (up to ~71 µM) were well above background levels (~1−2 nM) and methane oxidation rates reached up to 8658 nmol L−1 day−1, among the highest rates documented in pelagic ocean. Using a machine learning model, we complied a database of methane emission and oxidation from global seeps. We estimated a global methane emission rate of 57.8 Tg yr−1 from seeps to the overlying water columns and 31%−63% of this methane could be oxidized aerobically around seeping waters, suggesting that aerobic methanotrophy significantly reduces the emissions of methane released from submarine seeps. Our results also indicated that methane leakage from seeps could impact metabolic activity and carbon cycling in the deep ocean.

How to cite: Zhuang, G. and Mao, S.: Methane oxidation and emissions in cold seeps: from South China Sea to global scale, EGU General Assembly 2025, Vienna, Austria, 27 Apr–2 May 2025, EGU25-4957, https://doi.org/10.5194/egusphere-egu25-4957, 2025.

Methane dynamics in groundwater flow systems are critical to understanding underground microbial methane systems. The migration of methane in aqueous solution is understudied, although it can only concentrate in large quantities along longer horizontal groundwater flow paths. This is a necessary condition for the formation of commercial accumulations (as hydrocarbon resources) but also increases the potential amount of gas released to the atmosphere in the discharge areas of groundwater flows.

This study focuses on understanding the fundamental elements of an underground microbial methane system, highlighting the microbial gas generation depth range and key groundwater flow system parameters such as volume discharge, Darcy velocity, pressure, temperature, and salinity. To achieve this, by innovatively integrating hydrogeological and petroleum geological knowledge and methodologies, a Python-based computational model was developed. In addition, extensive methane and carbon dioxide solubility databases containing over 200,000 data points were created considering temperature, pressure and salinity conditions. To address gaps related to methane and carbon dioxide solubility reverse data engineering was applied using Python language.

The model comprises two principal domains: (1) a midline zone where semi-horizontal groundwater flow maintains roughly constant pressure, temperature, and salinity conditions, facilitating microbial gas dissolution, and (2) a discharge zone where upward groundwater flow triggers decrease of these parameters, leading to oversaturation and gas exsolution. Present-day microbial gas generation depth was established based on generation kinetics, while the theoretical regional groundwater flow system was characterized by the basin-scale evaluation of measured hydraulic data. Model input parameters, such as pressure, temperature, salinity, and flow velocity were sourced from existing publications. As a result, the model defines (a) the minimum horizontal migration length necessary for groundwater saturation with methane, (b) the volume of methane transported in solution, (c) the quantity of methane gas released in underground discharge zones that can be trapped, and (d) the quantity of methane gas released to the surface.

When applied to the Central Pannonian Basin, including the largest microbial gas accumulation in Hungary (Hajdúszoboszló field), the model can explain the formation of this accumulation at the end of a horizontal flow converging zone where flow direction turns upward due to the regional flow conditions and a major fault zone. From the gas amount which arrives at the discharge area during 1 million years from a 300 km2 charge area, about 226 million m3 released under the surface that could be trapped and about 700 million m3 released to the surface. The latter means 700 m3 gas emission per year which only comes from groundwater discharge. Sensitivity analyses provided further insights into the controlling factors of microbial gas migration and their relationships highlighting the complexity of the system.

Ongoing work is testing the model around another significant microbial gas accumulation in Hungary (Kunmadaras field), where hydrogeological conditions are different, further refining our understanding of methane dynamics in groundwater flow systems.

The research was supported by the Papp Simon Foundation, Hungary.

How to cite: Adonya, R. A.: Microbial methane dynamics in groundwater flow systems and their potential contribution to atmospheric emissions, EGU General Assembly 2025, Vienna, Austria, 27 Apr–2 May 2025, EGU25-5268, https://doi.org/10.5194/egusphere-egu25-5268, 2025.

The late-stage gas charging diversifies the material composition and chemical characteristics of the early reservoir, while the differences in the range and intensity of gas invasion lead to the formation of complex distribution pattern of oil and gas, which restricts a detailed understanding of the mechanisms of oil and gas accumulation. The research focuses on the Tahedong area of the Tarim Basin, utilizing geological background and integrating techniques such as crude oil geochemical analysis, fluid inclusion observation, scanning electron microscopy, and methane carbon isotope analysis to quantitatively characterize the intensity of gas invasion. The results indicate that: (1) The loss of n-alkanes in the research area is significant, with a loss rate ranging from 60.11% to 80.58%, while aromatics are relatively enriched, and the reservoir rocks develop gas inclusions with the presence of gas pores in the asphalt. (2) The gas charging ratio in condensate oil reservoirs and natural gas reservoirs ranges from 48% to 92%, with a high degree of gas invasion; in light oil reservoirs, the ratio ranges from 25% to 34%, with a moderate degree of gas invasion; in normal oil reservoirs, gas invasion is not significant. (3) The gas generation range of the source rocks in the Himalayan period matches the range of gas charging ratio greater than 35%, and the drying coefficient of natural gas decreases gradually from southeast to northwest, and the relative density increases, reflecting the decrease of natural gas charging ratio.It is therefore believed that the study area has developed varying intensities of gas invasion, with the southeastern region experiencing the strongest gas invasion, resulting in the formation of condensate oil and natural gas reservoirs. As the distance increases towards the northwest, the gas invasion weakens and overlaps with earlier oil reservoirs, transitioning in phase to light oil and medium oil. This understanding is of significant guiding importance for the exploration of late high-maturity oil and gas in the Tahedong area.

How to cite: Wang, J., Liu, H., and Su, Y.: Quantitative characterization of gas invasion intensity in oil and gas reservoirs using methane carbon isotopes: Example from Tahedong Area in the Tarim Basin, EGU General Assembly 2025, Vienna, Austria, 27 Apr–2 May 2025, EGU25-5293, https://doi.org/10.5194/egusphere-egu25-5293, 2025.

EGU25-5340 | Posters on site | BG7.1

The investiagtion of methane seeps and hydrothermal vents in the Middle Okinawa Trough 

Jiwei Li, Zhilei Sun, and Dawei Wang

From October 3 to November 9, 2024, a manned deep-sea dive expedition in the Okinawa Trough was successfully conducted by the expedition team from the Chinese Academy of Sciences and Ministry of Natural Resources of China. Utilizing the exploration vessel "TAN-SUO-ER-HAO" and the manned submersible "SHEN-HAI-YONG-SHI," the expedition aimed to investigate the geological, environmental, and biological phenomena associated with the submarine fluid systems on the seafloor in the Middle Okinawa Trough. The expedition uncovered large-scale active cold seeps developing at the back-arc spreading center axis, covering an area of approximately several dozen square kilometers. Geological activities related to the release of high-temperature supercritical carbon dioxide fluids were also observed, with multiple venting sites identified that generate a carbon dioxide-rich hydrothermal plume. These discoveries provide an exceptional natural laboratory for observational research on critical issues such as deep-seated carbon release at back-arc spreading centers, localized deep-sea water acidification, and the life adaptation strategies in extreme environments.

How to cite: Li, J., Sun, Z., and Wang, D.: The investiagtion of methane seeps and hydrothermal vents in the Middle Okinawa Trough, EGU General Assembly 2025, Vienna, Austria, 27 Apr–2 May 2025, EGU25-5340, https://doi.org/10.5194/egusphere-egu25-5340, 2025.

EGU25-5580 | ECS | Orals | BG7.1

Production of the disaccharide’s trehalose and sucrose by ANME‑2/SRB consortia in a cold seep at the Astoria Canyon    

Lennart Stock, Gunter Wegener, Stian Torset, Julius Lipp, Lukas Dirksen, Manuel Liebeke, Laura L. Lapham, Anna Hildebrand, John Pohlman, Ellen Lalk, and Marcus Elvert

The anaerobic oxidation of methane (AOM) coupled to sulfate reduction (SR) is a key microbial process in the sulfate-methane transition zones (SMTZ) of cold seeps. In this process, anaerobic methanotrophic archaea (ANME) oxidize methane to inorganic carbon and transfer gained electrons to their sulfate-reducing partner bacteria (SRB), which, in turn, reduce sulfate to sulfide. While electron transfer is a well-established interaction mechanism, interactions on the molecular level, involving, for example, low-molecular-weight organics, have not been investigated.

Here, we examined the presence of such molecules in cold seep sediments from Astoria Canyon. We found unusually high concentrations of the disaccharide’s trehalose and sucrose in both the pore water and the solid phase of the sediments. Elevated levels of these sugars in the SMTZ, along with negative δ¹³C values between -55 and -80‰, indicate the production by the AOM core community. The presence of ANME-2 and SRB lipids with similar δ¹³C values supports this interpretation. A stable isotope probing experiment on sediments from the same cold seep system confirms the AOM-dependent production of these disaccharides. There, trehalose and sucrose showed strong 13C-incorporation upon addition of ¹³C-labeled inorganic carbon, alongside the lipids of the autotrophic AOM community.

While the precise role of trehalose and sucrose production during AOM remains unclear, our findings suggest that they may serve as intermediates in ANME/SRB interactions and possibly in the production or conservation of the extracellular polymeric substance (EPS) that encases them. To further elucidate their biochemical significance and functional role, we aim to quantify trehalose and sucrose in both pore water and sediment. Understanding the role of these disaccharides in AOM consortia will provide deeper insights into microbial interaction and adaptations in methane-dominated and other extreme environments.

How to cite: Stock, L., Wegener, G., Torset, S., Lipp, J., Dirksen, L., Liebeke, M., Lapham, L. L., Hildebrand, A., Pohlman, J., Lalk, E., and Elvert, M.: Production of the disaccharide’s trehalose and sucrose by ANME‑2/SRB consortia in a cold seep at the Astoria Canyon   , EGU General Assembly 2025, Vienna, Austria, 27 Apr–2 May 2025, EGU25-5580, https://doi.org/10.5194/egusphere-egu25-5580, 2025.

EGU25-6790 | ECS | Posters on site | BG7.1

Crayfish and Climate: how invasive species amplify aquatic GHG emissions 

Lucia Cabrera-Lamanna, Ivo Roessink, Peeters Edwin THM, and Sarian Kosten

Since their introduction to European waters in the 1970s, the invasive red swamp crayfish Procambarus clarkii has rapidly expanded due to traits such as rapid reproduction, high environmental tolerance, and opportunistic feeding. P. clarkii can significantly transform freshwater ecosystems, causing extensive reduction in plant coverage, predation on amphibians and other macroinvertebrates, and a decline in native crayfish species populations. In many systems, the expansion of P. clarkii has lead to a dramatic reduction in plant coverage at specific sites. While numerous studies have explored how climate change influences the spread of invasive species, little is known about the reverse relationship: how invasive species contribute to climate change.

As a country with an extensive network of freshwater ecosystems, the Netherlands provides an excellent opportunity to study the effect of invasive species on aquatic GHG emissions. More than half of the Dutch territory has already been invaded by crayfish, with detrimental effects on submerged plants. Additionally, ditches serve as significant hotspots for GHG emissions, with estimates suggesting they are responsible for approximately 10–16% of the Dutch national annual CH4 emissions. These estimates are largely based on measurements in ditches dominated by submerged plants, which have been shown to mitigate CH₄ emissions through mechanisms such as CH4 oxidation and reduction of CH4 formationLoss of submerged plants can therefore lead to a considerable increase in CH4 emissions, further exacerbating the impact of ditches on the national GHG budget.

By combining data on ditch CH4 emissions, the area invaded by P. clarkii, and results from a controlled mesocosm experiment focusing on the cascading effects of crayfish on submerged plants and GHG emissions (particularly CH4), we found that high crayfish densities (2 individuals/m2) increase CH4 emissions by 2.4 times compared to systems without crayfish. This effect seems primarily driven by plant clipping and bioturbation

These findings highlight the ecological and climatic consequences of P. clarkii invasions. By enhancing CH4 emissions, this invasive species not only disturbs local aquatic ecosystems but also contributes to global climate change. Understanding the effects of crayfish bioturbation is essential for developing targeted management strategies to mitigate their environmental impact.

How to cite: Cabrera-Lamanna, L., Roessink, I., Edwin THM, P., and Kosten, S.: Crayfish and Climate: how invasive species amplify aquatic GHG emissions, EGU General Assembly 2025, Vienna, Austria, 27 Apr–2 May 2025, EGU25-6790, https://doi.org/10.5194/egusphere-egu25-6790, 2025.

EGU25-6858 | ECS | Orals | BG7.1

Floating algal beds and aquatic methane emissions:a potential positive ecosystem-climate feedback loop 

Sofia Baliña, José R. Paranaiba, Maite Colina, Stefan T.J. Weideveld, Herman Fomenko, Daniela Seitz, Romee E. Groenboss, Stefan A. Sooniste, Qiaoyu Qu, and Sarian Kosten

Eutrophic shallow freshwater ecosystems often develop floating filamentous microalgae on their surface during spring and summer. In recent years, this phenomenon has become more pronounced due to rising temperatures and drier conditions, with floating algae sometimes even covering the entire surface of water bodies. These floating mats, known as Floating Algal Beds (FLAB), are primarily composed of phytoplankton from the group Chlorophyte. New evidence suggests that phytoplankton can produce methane (CH₄), raising the possibility that these floating beds may represent overlooked sources of CH₄ emissions to the atmosphere. However, FLAB may also reduce CH4 emissions by decreasing the CH₄ diffusion at the air-water interface and/or trapping CH₄ bubbles. Consequently, the net impact of FLAB on CH₄ emissions in freshwater ecosystems remains unclear. To address this knowledge gap, this study aims to investigate how FLAB influence CH₄ dynamics by examining both biological processes (such as CH₄ production pathways and CH₄ oxidation) and physical factors (as CH4 bubble retention). To achieve this, we conducted field mesocosm experiments in a eutrophic ditch in the Netherlands during the summer of 2024. Eight mesocosms were deployed, with four containing FLAB on their surface and four controls without FLAB. The mesocosms were closed at the sides to prevent lateral transport and open at the surface and bottom allowing for the inclusion of CH₄ sediment production, CH₄ oxidation, CH₄ bubble dissolution, CH₄ diffusive flux at the air-water interface, and potential CH₄ production in the water column (including contributions from FLAB). Over a five-day period, we monitored all these CH₄ pathways alongside several other limnological parameters in both the treatment and control mesocosms. Additionally, we also incubated sediment, water and FLAB separately, to test for CH4 production and oxidation in each one of these compartments. Preliminary results indicate that mesocosms with FLAB exhibited CH₄ diffusive emissions on average ten times higher compared to the control mesocosms. Further analysis is needed to determine whether these elevated emissions originate from CH₄ production by FLAB, increased sediment and/or water column CH₄ production, or reduced CH₄ oxidation in the presence of FLAB; but these preliminary findings already suggest that FLAB significantly influences CH₄ dynamics in eutrophic systems. This points to a potential increase in the climate-ecosystem feedback loop, were climate change drives higher temperatures and periods of drought, leading to more stagnant waters. This, in turn, promotes the growth of FLAB, which enhances CH4 emissions.

How to cite: Baliña, S., Paranaiba, J. R., Colina, M., Weideveld, S. T. J., Fomenko, H., Seitz, D., Groenboss, R. E., Sooniste, S. A., Qu, Q., and Kosten, S.: Floating algal beds and aquatic methane emissions:a potential positive ecosystem-climate feedback loop, EGU General Assembly 2025, Vienna, Austria, 27 Apr–2 May 2025, EGU25-6858, https://doi.org/10.5194/egusphere-egu25-6858, 2025.

EGU25-7624 | Posters on site | BG7.1

Exploring Carbon Dynamics in Taiwan's Qigu Lagoon: The Balance Between Carbon Burial and Methane Emissions 

Pei-Chuan Chuang, Yen-Kuan Tseng, Hsiao-Fen Lee, and Chieh-Wei Hsu

Blue Carbon Ecosystems (BCEs) play a crucial role in carbon sequestration and climate change mitigation. However, their carbon cycle dynamics, particularly under changing environmental conditions, remain insufficiently understood. This study investigates the Qigu lagoon ecosystem, a representative BCE along Taiwan's southwestern coast. Adjacent to mangrove forests, the lagoon harbors rich biodiversity and holds substantial carbon storage potential but faces increasing threats from global climate change and intensified human activities. To address these challenges, we conducted integrated field sampling and laboratory analyses to examine the biogeochemical processes governing carbon cycling in the Qigu lagoon. Sediment cores were collected from multiple locations across the lagoon and analyzed for dissolved methane concentrations, total alkalinity, dissolved ions, and nutrient levels. These measurements aim to quantify sedimentary carbon burial rates, assess greenhouse gas emissions, and evaluate nutrient cycling within the ecosystem. Preliminary results indicate that, while the lagoon effectively sequesters organic matter in its sediments, it simultaneously emits significant amounts of methane (CH₄), a potent greenhouse gas. This discovery raises important questions about whether methane emissions from wetlands—traditionally regarded as natural carbon sinks—may substantially offset the carbon burial and absorption capacity of marine blue carbon systems. Understanding the balance between carbon sequestration and greenhouse gas emissions is critical for accurately evaluating the climate mitigation potential of BCEs. Findings from this study will provide valuable insights for the conservation and sustainable management of coastal ecosystems, contributing to global efforts in combating climate change.

How to cite: Chuang, P.-C., Tseng, Y.-K., Lee, H.-F., and Hsu, C.-W.: Exploring Carbon Dynamics in Taiwan's Qigu Lagoon: The Balance Between Carbon Burial and Methane Emissions, EGU General Assembly 2025, Vienna, Austria, 27 Apr–2 May 2025, EGU25-7624, https://doi.org/10.5194/egusphere-egu25-7624, 2025.

EGU25-9501 | Posters on site | BG7.1

Methane-related seafloor habitats and sediment microbiome at a cold-water corals site off the Vesterålen coast, northern Norway 

Bénédicte Ferré, Claudio Argentino, Luca Fallati, Giuliana Panieri, Sebastien Petters, Hans C. Bernstein, Ines A. Barrenechea, and Alessandra Savini

Cold-water corals in the Hola area off the coast of Vesterålen (N. Norway), thrive on a substrate made of methane-derived carbonate and are closely associated with microbial mats. High resolution seafloor imagery and sediment samples collected during the EMAN7 expedition in June 2022 allowed us to reconstruct the spatial relationships between methane seepage and seafloor habitats and gain insights into subsurface biogeochemical processes directly influencing benthic ecosystems. Here, we present the fine-scale orthomosaics and habitat maps covering 1680 m2 of seafloor in proximity to the coral mounds and the geochemistry (sedimentary carbon and nitrogen, pore waters) of a pushcore and blade core collected from a microbial mat and a reference area, respectively. The push core revealed the presence of a macroscopic microbial biofilm at 9 cm depth within the sediment, which is associated with a sharp drop in downcore δ13C of sedimentary organic matter and dissolved inorganic carbon and in C/N ratios. Results from 16S rRNA gene analyses conducted on the uppermost 10 cm of sediment in the pushcore showed a drop in alpha diversity and a compositional change from high abundance of ASVs representing Protebacteria to those representing Halobacterota that we ascribe to the occurrence of methanotrophic consortia performing anaerobic oxidation of methane

Acknowledgments: this research was funded by EMAN7 project (Research Council of Norway grant No. 320100) and supported by AKMA project (Research Council of Norway grant No. 287869) and EXTREMES (UArctic UA 06/2024)

How to cite: Ferré, B., Argentino, C., Fallati, L., Panieri, G., Petters, S., Bernstein, H. C., Barrenechea, I. A., and Savini, A.: Methane-related seafloor habitats and sediment microbiome at a cold-water corals site off the Vesterålen coast, northern Norway, EGU General Assembly 2025, Vienna, Austria, 27 Apr–2 May 2025, EGU25-9501, https://doi.org/10.5194/egusphere-egu25-9501, 2025.

EGU25-10399 | ECS | Orals | BG7.1 | Highlight

Attribution of increasing global lake methane emissions to climate and eutrophication using the FLaMe model 

Maoyuan Feng, Manon Maisonnier, David Bastviken, Ronny Lauerwald, Shushi Peng, Philippe Ciais, Sandra Arndt, and Pierre Regnier

Methane (CH4) emissions from lakes were considered entirely natural by the Intergovernmental Panel on Climate Change (IPCC) and the Global Methane Budget (Saunois et al., 2020). However, eutrophication, via enhanced inputs of nutrients (mostly total dissolved phosphorus, TDP) from the surrounding catchments has been shown to be a substantial control factor of both diffusive and ebullitive lake CH4 fluxes, suggesting that a fraction of these emissions are in fact attributable to human factors. Here, we adopted a newly developed physically-resolved process-based model of the coupled carbon-oxygen-methane cycles, FLaMe (Fluxes of Lake Methane), to simulate decadal trends (1901-2070) in CH4 emissions and decompose them into natural and anthropogenic components. By configurating global lakes from the HydroLAKES database (with an area of 2.47 million km2), we estimated that global lake CH4 emissions already increased by about 20 % over the last century (from 28±1 to 34±1 Tg CH4 yr-1). Furthermore, we adopted a factorial experiment approach to conduct the attribution analysis, and found that over this time period, eutrophication and climate contributed to 70% and 30% of the cumulative growth in global lake CH4 emissions, respectively. Moreover, we identified a progressive shift from eutrophication to climate control on global lake CH4 emissions from the early part till the end of the last century. In the future, we project that global lake CH4 emissions will further increase to reach 39±2, 44±4 and 45±5 Tg CH4 yr-1 by year 2070 under climate scenarios SSP1-2.6, SSP3-7.0 and SSP5-8.5, respectively. Our analysis implies that the future risks stemming from lake CH4 emissions could be reduced by efficient nutrient removal from urban and agricultural sources.

How to cite: Feng, M., Maisonnier, M., Bastviken, D., Lauerwald, R., Peng, S., Ciais, P., Arndt, S., and Regnier, P.: Attribution of increasing global lake methane emissions to climate and eutrophication using the FLaMe model, EGU General Assembly 2025, Vienna, Austria, 27 Apr–2 May 2025, EGU25-10399, https://doi.org/10.5194/egusphere-egu25-10399, 2025.

EGU25-11163 | ECS | Posters on site | BG7.1

Methane oxidation along oxygen gradients in the Baltic Sea 

Linnea Henriksson, Yvonne Yu Yan Yau, Henry Lok Shan Cheung, Claudia Majtényi-Hill, Wilma Ljungberg, Aprajita Singh Tomer, Stefano Bonaglia, Tristan MacKenzie, and Isaac Santos

Eutrophication and anoxic and hypoxic conditions can drive substantial CH4 production in sediment and potentially in the water column. However, the extent of CH4 oxidation in the water column of marginal seas remains poorly quantified, leading to a possible overestimation of CH4 fluxes to the atmosphere. Here, we investigate the fate of CH4 in the deep-water column analysing its concentration and stable isotope (δ13C-CH4) along a 5000-km cruise track in the Baltic Sea. CH4 concentrations increased with water column depth, more so under low oxygen conditions. The median CH4 concentration in the bottom layer in different basins ranging from 4 to 1300 nM. δ13C-CH4 values ranging from -82 to -46‰ with respect to VPDB indicates benthic CH4 production. Methane oxidation causes isotopic fractionation, resulting in a more 13C-enriched CH4. Here oxidation in the water column removed 1% to 90% of benthic-produced CH4 before it reaches the surface. Large differences in CH4 concentrations and δ13C-CH4 were observed between basins related to oxygen concentrations, reflecting distinct biogeochemical dynamics. For instance, benthic CH4 concentrations in the anoxic, deep Baltic Proper were 2 to 295 times higher than those in the oxygenated, shallower Gulf of Bothnia. Our results underline the importance of CH4 oxidation in the water column, mitigating CH4 emissions to the atmosphere. Accurate regional CH4 budgets should consider oxidation processes and the unique characteristics of different basins.

How to cite: Henriksson, L., Yau, Y. Y. Y., Cheung, H. L. S., Majtényi-Hill, C., Ljungberg, W., Singh Tomer, A., Bonaglia, S., MacKenzie, T., and Santos, I.: Methane oxidation along oxygen gradients in the Baltic Sea, EGU General Assembly 2025, Vienna, Austria, 27 Apr–2 May 2025, EGU25-11163, https://doi.org/10.5194/egusphere-egu25-11163, 2025.

EGU25-12579 | ECS | Orals | BG7.1

In situ monitoring reveals episodic water column methane anomalies at abandoned wells in the Dutch North Sea 

Annalisa Delre, Geert de Bruin, Ilona Velzeboer, Henk de Haas, Furu Mienis, Henko de Stigter, Jessica Riekenberg, Robin van Dijk, Rosanne Huybens, Julia Engelmann, Gert-Jan Reichart, and Helge Niemann

Continental margins harbor substantial reservoirs of methane, generated by microbial activity or thermogenic processes. In the North Sea, commercial extraction of subsurface methane is common, and wellheads of depleted gas field are typically sealed with concrete. Despite these measures, abandoned wells may still leak methane to the water column and potentially to the atmosphere contributing to atmospheric methane levels. With several thousand of such wells scattered across the North Sea, the scale of these emissions and the processes leading the fate of the released methane—whether through microbial oxidation or direct escape into the atmosphere—are still not well understood. We investigated methane dynamics at 3 different  locations in the Dutch sector of the North Sea (A15-03 and B17-05 abandoned wells, B17-04 likely natural seepage), combining various methods, including  autonomous tools. For a time period of 3 days, we continuously measured in situ bottom water methane concentrations and near-bed hydrodynamics using a laser spectrometer and ADCP mounted on a mini-lander. We recorded several episodic events characterized by increasing methane concentrations peaking at 550nM at A15-03 and 800nM at B17-05. In contrast, maximum concentrations remained comparably low at B17-04 with values of up to 80nM. To further resolve vertical methane distribution, we conducted repeated hydro casts that also showed events of rising water column methane concentrations. Discrete water samples were additionally taken to quantify microbially mediated methane oxidation rates, revealing the presence of methanotrophs that could act as a filter for methane escaping to the atmosphere. In this presentation, we will discuss our data in relation to environmental drivers, including tides, currents and biological factors such as methanotrophic community dynamics.

How to cite: Delre, A., de Bruin, G., Velzeboer, I., de Haas, H., Mienis, F., de Stigter, H., Riekenberg, J., van Dijk, R., Huybens, R., Engelmann, J., Reichart, G.-J., and Niemann, H.: In situ monitoring reveals episodic water column methane anomalies at abandoned wells in the Dutch North Sea, EGU General Assembly 2025, Vienna, Austria, 27 Apr–2 May 2025, EGU25-12579, https://doi.org/10.5194/egusphere-egu25-12579, 2025.

EGU25-15270 | ECS | Orals | BG7.1

Reconstructing Microbial & Animal Associated Formation and Dissolution of Methane Seep Carbonates using U/Th Dates and Electron Microscope Imagery 

Kira Homola, Frank Norbert, Andrea Schroeder-Ritzrau, Daniel Smrzka, Tobias Himmler, and Tina Treude

Active venting of methane from organic matter buried below the seafloor supports a unique diversity of life in the overlying sediment and on the seafloor. The consumption of this methane by microbial consortia sustains animal symbionts and reduces the amount of methane reaching the atmosphere, representing a key methane sink in the marine carbon cycle. Microbially mediated sulfate-dependent anaerobic methane oxidation also precipitates authigenic carbonate rocks. Under anoxic conditions, these carbonates can form large outcropping rock features on the seafloor that provide hard substrate for seep-associated endemic symbiotic macro and micro fauna, affecting deep ocean biodiversity. In the presence of oxygen, however, microbial and animal activity promotes the dissolution of seep carbonates, returning carbon to the water and short-term carbon cycle. To examine how seep chemical and biologic activity affects carbonate formation and dissolution, we determined the age, composition, and growth structure of seep carbonates from a range of water depths, ambient oxygen concentrations, and methane flux environments. Carbonates were collected from Southern California Borderland (800 and 1020 m) and Aleutian Trench (2020 m) seeps and subsampled to allow comparisons across both km- and µm- scales. U/Th dating revealed carbonate ages ranging from 201±100 to 10,138±63 years. Micro-scale rock fabric texture, microbe-mineral paragenesis, and elemental composition were determined from Scanning Electron Microscope backscatter images and energy-dispersive x-ray detector spectrum maps along with thin-section Electron Probe Micro-Analyzer images. Micro-scale results are used to examine the microbial-mineral interactions visible through fossil and crystal inclusions and discontinuities. We contextualize the macro-scale growth histories of the dated carbonates by relating them to variations in glacial-interglacial associated sea level and methane hydrate stability; overlying water column productivity and circulation related oxygen availability; and tectonic or tidal associated methane flux. These preliminary results improve our understanding of long-term biological and chemical processes associated with seep carbonate formation and dissolution, and their implications for global carbon cycling.

How to cite: Homola, K., Norbert, F., Schroeder-Ritzrau, A., Smrzka, D., Himmler, T., and Treude, T.: Reconstructing Microbial & Animal Associated Formation and Dissolution of Methane Seep Carbonates using U/Th Dates and Electron Microscope Imagery, EGU General Assembly 2025, Vienna, Austria, 27 Apr–2 May 2025, EGU25-15270, https://doi.org/10.5194/egusphere-egu25-15270, 2025.

EGU25-15926 | Posters on site | BG7.1

Biogeochemical signatures for archaeal communities involved in active gas seeping on Tatarsky Trough 

Dong-Hun Lee, Jung-Hyun Kim, Alina Stadnitskaia, Yung Mi Lee, Young-Keun Jin, Carme Huguet, Eun-Ji Jeong, and Kyung-Hoon Shin

The Tatarsky Trough lies near the eastern coast of the Far Eastern Russia, extending into the northern parts of the East Sea of Korea (also known as the Sea of Japan). This region is renowned for its tectonic activity and active gas seeps, making it an ideal natural laboratory for studying the biogeochemical dynamics of gas-rich sediments. In this study, we investigated two sediment cores, LV67-07HC (358 cm core length) and LV67-19HC (398 cm core length), recovered from active fault zones on the eastern slope (water depths of 300–700 m) during the SSGH expedition aboard the R/V Akademik M. A. Lavrentyev in 2014. Using a combination of lipid and nucleic acid analyses alongside other parameters (i.e., gas and porewater composition), we aim to assess the potential environmental roles of archaeal communities inhabiting these seepages. Both cores exhibited high abundances of lighter hydrocarbon gases, primarily methane and carbon dioxide. The sulfate-methane transition zone (SMTZ) was clearly delimited, with its depth varying based on the extent of deep fluid ascent within coal-gas areas. Notably, significant concentrations of 13C-depleted archaeal lipids - glycerol dialkyl diethers (DGDs) and glycerol dialkyl glycerol tetraethers (GDGTs) - were observed near dense carbonate concretions in core LV67-07HC (91–185 cm depth). This finding suggests sustained methanotrophic activity associated with gas seepage events in the Tatarsky Trough. In these settings, archaeal sequences predominantly revealed the presence of ANME-1 clades, which are known to thrive under intense seepage conditions within coal-gas zones. Considering that gas hydrate destabilization in the Tatarsky Trough could trigger slope failures, a notable geological hazard, our results offer valuable insights into the transport and removal processes of hydrocarbon gases, aiding in the evaluation of their impact on regional carbon cycling.

How to cite: Lee, D.-H., Kim, J.-H., Stadnitskaia, A., Lee, Y. M., Jin, Y.-K., Huguet, C., Jeong, E.-J., and Shin, K.-H.: Biogeochemical signatures for archaeal communities involved in active gas seeping on Tatarsky Trough, EGU General Assembly 2025, Vienna, Austria, 27 Apr–2 May 2025, EGU25-15926, https://doi.org/10.5194/egusphere-egu25-15926, 2025.

EGU25-16134 | ECS | Orals | BG7.1

Potential drivers and seasonal comparison of the methane paradox in three Austrian peri-Alpine lakes 

Niharika Sharma, Manuela Felsberger, and Barbara Bayer

Methane, traditionally thought to be produced only under anoxic conditions, is widely observed in oxic surface layers of freshwater lakes-a phenomenon known as "methane paradox". The methane paradox results from a complex interaction of biotic and abiotic processes which could vary substantially across different lacustrine systems. The variability in biological and geochemical characteristics of lakes can influence methane production and transport, limiting our understanding of the main drivers sustaining elevated methane concentrations in oxic surface waters.

In this study, we investigated the methane paradox in three Austrian peri-alpine lakes differing in size and trophic state, and compared the factors controlling oxic methane production in these lakes during different seasons. Two of the studied lakes, Mondsee (14.2 km²) and Attersee (49.5 km²), are located within the same catchment area. Lake Mondsee is mesotrophic and lake Attersee ultra-oligotrophic. Lake Lunzsee is oligotrophic, and the smallest lake studied (0.7 km²). Elevated methane concentrations were observed in all three lakes during both summer and autumn seasons indicating year-round occurrence of the methane paradox in the lakes. Subsurface methane concentrations ranged from 100 to 400 nM which was substantially higher than the atmospheric equilibrium (~3 nM), indicating oxic methane production as a potential, yet unaccounted, source of methane to the atmosphere. Positive correlations of methane concentrations with chlorophyll-a and ammonium concentrations suggested a link with biological activity. Additionally, high phytoplankton abundances coincided with the methane maximum, further indicating that primary productivity was one of the main drivers associated with oxic methane production. Methane concentrations were the highest in mesotrophic lake Mondsee, which was dominated by cyanobacterial phytoplankton. In contrast, the phytoplankton composition in lake Attersee and Lunzsee was mainly composed of eukaryotic species.

Our findings indicate that the magnitude of subsurface methane concentrations in peri-Alpine lakes is influenced by nutrient availability, which is one of the key factors determining phytoplankton taxonomic composition. Our results demand a further investigation of oxic methane production pathways associated with different phytoplankton taxa to better understand how future eutrophication events might affect methane dynamics in peri-Alpine lakes.

How to cite: Sharma, N., Felsberger, M., and Bayer, B.: Potential drivers and seasonal comparison of the methane paradox in three Austrian peri-Alpine lakes, EGU General Assembly 2025, Vienna, Austria, 27 Apr–2 May 2025, EGU25-16134, https://doi.org/10.5194/egusphere-egu25-16134, 2025.

EGU25-17015 | Posters on site | BG7.1

Quantification of secondary methanogenesis from multiple isotopologue proxies: a case study in Tokamachi mud volcano, Japan 

Alexis Gilbert, Mellinda Jajalla, Mayuko Nakagawa, Koudai Taguchi, and Naizhong Zhang

Microbial methane production represents an important source of methane on Earth. In oil and gas reservoirs, microbial methane can be formed from secondary methanogenesis, i.e., from C2+ hydrocarbons biodegradation, either directly [1] or indirectly from the biodegradation products [2]. Despite its global significance [2], secondary methanogenesis is arguably challenging to detect, mainly because methane isotopic signature overlaps with that of the existing thermogenic methane in the reservoir, and is thus inferred only from indirect proxies such as high 13C content of propane and CO2.

Here, we combine methane clumped isotopes with propane position-specific isotope analysis (PSIA) of 19 samples from mud volcanoes and gas seepages located in Tokamachi area (Niigata, Japan). Previous studies have shown that both propane and CO2 in Tokamachi natural gas samples are 13C-enriched, consistent with biodegradation-associated methanogenesis [3]. Propane 13C-PSIA shows a clear biodegradation trend where δ13C of the central position of propane is specifically enriched as the relative amount of propane decreases [4]. Interestingly, the extent of propane biodegradation, as indicated by the difference between the two positions of propane (∆Central = δCentral - δTerminal), correlates with ∆13CH3D and ∆CH2D2 of methane, both of which tending towards equilibrium values at high biodegradation rates. A simple models shows that ca. 20% of methane present in the subusrface is produced directly or indirectly from hydrocarbons anaerobic biodegradation. This study emphasizes the importance of using multiple indicators to tackle hydrocarbons cycling in the subsurface, in particular methanogenesis associated with hydrocarbons biodegradation.

References:
[1] Zhou et al. 2022 Nature v. 601, 257
[2] Milkov 2011 Org. Geochem. v. 42, 184
[3] Etiope et al. 2011 Appl. Geochem., v. 26, 348
[4] Gilbert et al. 2019 Proc. Natl. Acad. Sci., v. 116, 6653

How to cite: Gilbert, A., Jajalla, M., Nakagawa, M., Taguchi, K., and Zhang, N.: Quantification of secondary methanogenesis from multiple isotopologue proxies: a case study in Tokamachi mud volcano, Japan, EGU General Assembly 2025, Vienna, Austria, 27 Apr–2 May 2025, EGU25-17015, https://doi.org/10.5194/egusphere-egu25-17015, 2025.

EGU25-17215 | ECS | Posters on site | BG7.1

Gas hydrate potential of heavier order hydrocarbons in the South China Sea 

Zhen Liu and Jin Qian

To assess the role of gas hydrates in global resources and the carbon cycle, it is crucial to estimate the volume of natural gas hydrate resources. Most hydrate resource estimates typically focus on methane hydrates. However, hydrate drilling at many sites in the South China Sea (SCS) has found Structure II hydrates containing heavier hydrocarbons, suggesting that methane hydrates may lead to an underestimation of the total hydrate resources. This study, based on the biogenic and thermogenic gases in the SCS, analyses three different gas compositions including 100% methane, 96% methane+4% ethane, and 86.1% methane+13.9% ethane (Gumusut-Kakap gas). The thickness and distribution of the gas hydrate stability zone (GHSZ) for Structure II hydrates were calculated using statistical thermodynamic methods. The results indicate that the thickness of the GHSZ in the SCS varies from 0 to 800 m. In the continental slope area, most of the thickness of the GHSZ are less than 500 m. In contrast, in localized areas such as the Manila Trench, the southwestern Nansha Trough, the South Palawan Basin, and the Luzon Strait, the thickness of the GHSZ exceeds 500 m. The new estimates of the GHSZ thickness for methane hydrates, 96% methane plus 4% ethane, and Gumusut-Kakap gas are 203 m, 219 m, and 254 m, respectively. Based on the volumetric method, the corresponding resource volumes are 82.65 Gt (115.43×10¹² m³), 93.11 Gt (130.04×10¹² m³), and 111.29 Gt (155.43×10¹² m³) using the gas expansions of 155, 162 and 160, respectively. On this basis we calculated the incremental hydrate resource using the GHSZ thickness difference. The incremental resource volumes for the two Structure II hydrates are 10.46 Gt (14.61×10¹² m³) for the 96% methane+4% ethane composition, representing an increase of approximately 13%, and 18.18 Gt (25.39×10¹² m³) for the Gumusut - Kakap gas composition, representing an increase of approximately 22%. This study recalculates the natural gas hydrate resources in the South China Sea and can be used to assess global Structure II hydrate resources.

How to cite: Liu, Z. and Qian, J.: Gas hydrate potential of heavier order hydrocarbons in the South China Sea, EGU General Assembly 2025, Vienna, Austria, 27 Apr–2 May 2025, EGU25-17215, https://doi.org/10.5194/egusphere-egu25-17215, 2025.

EGU25-19068 | ECS | Posters on site | BG7.1

High-resolution OBS modeling beneath Honeycomb and Glendhu ridges on the southern Hikurangi subduction margin reveals concentrated gas hydrate accumulations in unprecedented detail 

Elisaveta Sokolkova, Jörg Bialas, Anke Dannowski, Gareth Crutchley, Christian Berndt, Cord Papenberg, Ingo Pecher, Helene-Sophie Hilbert, Henrike Timm, Bruna T. Pandolpho, and Karsten Kroeger

Gas hydrates are relevant to global carbon cycling, climate change and ocean acidification. In particular, hydrates play an important role in sub-seafloor fluid migration because they reduce the porosity and permeability of sediments. Gas hydrates, and their associated underlying free gas zones, have also been linked to sediment failure and submarine mass transports. The active Hikurangi Margin hosts New Zealand’s largest gas hydrate province, with concentrated accumulations generally focused below accretionary thrust ridges.

Recently acquired high-resolution Ocean-Bottom-Seismometer (OBS) data at the southern Hikurangi Margin images highly reflective layers beneath the accretionary Honeycomb Ridge. This ridge is of particular interest as it is thought to host a concentrated gas hydrate system. Unlike previous surveys, we have the advantage of being able to record converted shear waves that help us identify the nature of the highly reflective layers in the gas hydrate stability zone. In March 2023, we deployed 20 OBS from R/V Tangaroa with a USBL-wired system to position each OBS with 100 m spacing along an existing 2D seismic profile. A 150 in3 GI-gun was fired at a shot rate of 7 s, to ensure for excellent lateral and vertical resolution. This setup allows us to present an updated high-resolution seismic velocity model and inversion of Honeycomb Ridge, and partially Glendhu Ridge.

OBS data were processed in Seismic Unix and Vista 2023. In Vista 2023, the data were flattened, filtered with Ormsby bandpass, FK-filter and a threshold median noise attenuation and reduction (THOR) filter. Reflection and refraction phases were picked with PASTEUP and used for forward modeling with MODELING (RAYINVR). The detailed P-wave forward model served as input for the 2D tomography inversion (TOMO2D). The tomography for 8 iterations results in a χ2 of 2.1 and RMS-fit of 30 ms.

The P-wave tomography confirms a low velocity zone below the BSR in both ridges. Higher velocities are resolved in the landward limbs of the ridges compared to seaward limbs in agreement with previous findings. The areas of higher velocities correspond to high-reflectivity layers in the seismic data. We suggest that the anomalously high-reflectivity layers above the BSR in the ridge represent concentrated gas hydrate accumulations, fed by underlying free gas via stratigraphic pathways that enable fluid migration into the system. We also aim to test whether positive and negative polarity reflections within the regional gas hydrate stability zone are due to simultaneous presence of gas hydrates and free gas, respectively. Supplementary analysis of S-waves will allow us to test our hypothesis that free gas is injected into the hydrate stability zone and remains, at least partially, in the gaseous phase. Our detailed study contributes to a better understanding of how gas hydrate systems and fluid migration pathways evolve at active margins.

How to cite: Sokolkova, E., Bialas, J., Dannowski, A., Crutchley, G., Berndt, C., Papenberg, C., Pecher, I., Hilbert, H.-S., Timm, H., Pandolpho, B. T., and Kroeger, K.: High-resolution OBS modeling beneath Honeycomb and Glendhu ridges on the southern Hikurangi subduction margin reveals concentrated gas hydrate accumulations in unprecedented detail, EGU General Assembly 2025, Vienna, Austria, 27 Apr–2 May 2025, EGU25-19068, https://doi.org/10.5194/egusphere-egu25-19068, 2025.

EGU25-19271 | ECS | Posters on site | BG7.1

Methane dynamics in a temperate seagrass meadow 

Guiyuan Dai, Xiaogang Chen, Guangchao Zhuang, Peiyuan Zhu Zhu, Yafei Sun, Qiaoqiao Wang, and Ling Li

Seagrass meadows are essential coastal ecosystems that play a crucial role in carbon sequestration and greenhouse gas regulation. However, our understanding of methane (CH4) production and emission from these important carbon sinks remains limited. This study investigates CH4 dynamics in a temperate seagrass meadow in Swan Lake (Shandong, China), with a focus on the production and emission of CH₄. The addition of 13C-labelled substrates revealed that CH₄ production rate constant in sediments ranged from 0.072 to 2.2 day⁻¹, with methylotrophic methanogenesis predominating, accounting for over 96% of the total CH₄ production, while hydrogenotrophic methanogenesis contributed less than 4%. These rate constants were significantly lower (up to 20 times) compared to those observed in tropical seagrass meadows, likely due to the lower temperatures in temperate ecosystems. Additionally, anaerobic oxidation of CH₄ was not detected based on the 13CH4 incubation experiments. Time-series observations of 222Rn, CH4 and various hydrological parameters indicated that the CH₄ emission fluxes from sediment-water interface were 1065±176 μmol m-2 day-1 in the summer and 1415±233 μmol m-2 day-1 in the winter, exceeding the range of CH₄ fluxes previously reported from other seagrass meadows. The CH₄ outgassing fluxes were 184±55 μmol m-2 day-1 in the summer and 216±65 μmol m-2 day-1 in the winter. Notably, over 80% of the CH4 was oxidized in the water column before reaching the atmosphere. The higher CH₄ emissions observed in winter were attributed to the seasonal presence of swans in Swan Lake. Swan excreta and the food provided to them significantly increased the availability of dissolved organic carbon (DOC), which, in turn, supplied ample substrates for CH₄ production, consistent with the higher DOC concentrations observed in the winter. Our study provides valuable insights into CH₄ production and emission dynamics, highlighting the seagrass meadow as a source of atmospheric CH₄.

How to cite: Dai, G., Chen, X., Zhuang, G., Zhu, P. Z., Sun, Y., Wang, Q., and Li, L.: Methane dynamics in a temperate seagrass meadow, EGU General Assembly 2025, Vienna, Austria, 27 Apr–2 May 2025, EGU25-19271, https://doi.org/10.5194/egusphere-egu25-19271, 2025.

EGU25-19544 | ECS | Orals | BG7.1

Modeling the Controls on Microbial Iron and Manganese Reduction in Methanic Sediments 

Racheli Neumann Wallheimer, Itay Halevy, and Orit Sivan

Microbial iron and manganese respiration processes have been observed in deep methanic sediments of lacustrine and marine environments, sometimes accompanied by deep methane sink. These findings challenge the “classical” model of microbial respiration in aquatic systems. Nonetheless, assessments of the type and relative role of these respiration processes in the methanic zone are lacking. Here, we quantify both the thermodynamic and the kinetic controls of potential iron and manganese respiration processes in the methanic sediments of lacustrine and marine sites – Lake Kinneret (LK) and the Southeastern Mediterranean Sea (MedS). Using theoretical bioenergetic methods, we develop a model to calculate catabolic rates, considering both kinetic and thermodynamic factors. Then, we estimate the biomass growth rates and microbial community sizes of expected iron and manganese reducers. Additionally, we perform a Monte Carlo simulation to account for variations in uncertain parameter values, along with a sensitivity analysis. Together, these calculations enable estimation of the expected total reaction rates of the various metabolic processes.

Our results indicate that the type of consumed oxide, which determines its thermodynamic and kinetic properties, is more significant in influencing bioreaction rates than its concentration.  Thus, bioreactions with amorphous manganese oxides are more favorable than those with highly reactive iron oxides. Among the iron oxides, the reduction of amorphous iron oxyhydroxide and ferrihydrite are the only reactions capable of generating biomass in the methanic sediments at both sites. In both environments, manganese oxide reduction by ammonium and methane oxidation are expected to be significant, while manganese oxide reduction by hydrogen and acetate oxidation are expected to be considerable only in LK. The most probable iron oxide reduction process in LK is hydrogen oxidation, followed by methane oxidation. In the MedS iron oxide reduction is most probably coupled to the oxidation of ammonium (Feammox) to molecular nitrogen, and in a few cases may be coupled to methane oxidation. The Monte Carlo simulation agrees with the nominal model results for manganese reduction, and additionally predicts that iron reduction may be possible with some combinations of parameter values. These findings improve our understanding of the thermodynamic and kinetic controls on the composition of microbial communities and their effect on the geochemistry of methanic sediments.

How to cite: Neumann Wallheimer, R., Halevy, I., and Sivan, O.: Modeling the Controls on Microbial Iron and Manganese Reduction in Methanic Sediments, EGU General Assembly 2025, Vienna, Austria, 27 Apr–2 May 2025, EGU25-19544, https://doi.org/10.5194/egusphere-egu25-19544, 2025.

EGU25-19885 | ECS | Posters on site | BG7.1

One of Europe’s largest methane ebullition field lies at 400 m below sea level in the Baltic Sea. 

Vicent Doñate Felip, Marcelo Ketzer, Yoann Ladroit, Martin Jakobsson, Matthew O'Regan, Cristoph Humborg, and Christian Stranne

This seep area, estimated to extend over 17 km2 at depths of 400 m, is located in the west-central Baltic Proper at the Landsort Deep, the deepest part of the Baltic Sea. The Landsort Deep is a deep and narrow trough fault (Fromm, 1943) filled with around 100 m of late glacial and post-glacial sediments at its axis. The ebullition field is associated with a local drift deposit extending along the fault axis with higher than average sedimentation rates (1 cm/year; Jofesson, 2022). High current-associated sedimentation rates with relatively slow terrigenous deposition result in notable organic matter accumulation (TOC average of 11.4 weight %; Ketzer et al., 2024). The inflow of salty water from the North Sea and the freshwater runoff from the catchment area gives rise to a permanent halocline in the Baltic Proper at a depth of around 80 m. The euxinic waters below the halocline, resulting from limited vertical water exchange and eutrophication, combined with sapropel deposition, promote anomalous high biogenic methane production within the sediments.
Methane oversaturation in the sediment porewater leads to bubble formation, which escapes the seafloor intermittently and sporadically within the ebullition field. Mid-water acoustic data acquired at the study site reveal that many bubbles rise more than 300 m from the seafloor, with some reaching all the way to the sea surface (>400 m). Data analysis identified two groups of bubbles based on rise velocities, indicating two separate bubble size ranges. When comparing the observations with a bubble dissolution model, the results suggest that only extraordinarily large bubbles can explain the large rise heights.
Further methane flux estimations derived from acoustic data in combination with dissolution modelling will provide insights into the efficiency of the vertical methane flux from the ebullition field and help determine whether methane discharge from Landsort Deep sediments, at 400 m below the sea surface, can actually end up in atmosphere.

Fromm, E., 1943. Havsbottnens Morfologi Utanför Stockholms Södra Skärgård. Geografiska Annaler 25:3-4, 137-169. https://doi.org/10.1080/20014422.1943.11880722
Josefsson, S., 2022. Contaminants in Swedish offshore sediments 2003–2021. 103 pages. Geological Survey of Sweden.
Ketzer, M., Stranne, C., Rahmati-Abkenar, M., Shahabi-Ghahfarokhi, S., Jaeger, L., Pivel, M.A.G., Josefsson, S., Zillén, L., 2024. Near seafloor methane flux in the world's largest human-induced dead zone is regulated by sediment accumulation rate. Marine Geology 468, 107220. https://doi.org/10.1016/j.margeo.2024.107220

How to cite: Doñate Felip, V., Ketzer, M., Ladroit, Y., Jakobsson, M., O'Regan, M., Humborg, C., and Stranne, C.: One of Europe’s largest methane ebullition field lies at 400 m below sea level in the Baltic Sea., EGU General Assembly 2025, Vienna, Austria, 27 Apr–2 May 2025, EGU25-19885, https://doi.org/10.5194/egusphere-egu25-19885, 2025.

EGU25-21093 | Orals | BG7.1

Clumped isotope constraints on the origin of methane hydrate from the Amazon Cone 

Luiz Frederico Rodrigues, Alexis Gilbert, Mayuko Nakagawa, João Marcelo Ketzer, Malavika Sivan, Thomas Röckmann, Adolpho Herbert Augustin, Dennis Miller, José Antônio Cupertino, and Farid Chemale Junior

The studies of deep-sea gas venting associated with occurrences of gas hydrates in the Amazon Cone has increased the interest of the world scientific community in understanding the role of the Amazon region in the Earth's climate system. Gas plumes have been observed to align along the edge of the regional gas hydrate stability zone in several areas, suggesting the climate-driven dissociation of gas hydrates, and along faults related to the gravitational collapse of the fan. The gas that migrates toward the seabed is stored in gas hydrates and/or authigenic carbonates or released to the oceans by seafloor venting.

Here, we present data from gas hydrates that were sampled during the AMAGAS campaign offshore Brazil in May-June 2023. Five samples of methane hydrates were sampled and their dD and d13C measured. In addition, the abundance of doubly substituted isotopologues of methane (13CH3D and 12CH2D2) were measured for one sample. It is very important to mention that if the compounds have reached equilibrium with respect to their distributions of isotopes among all possible isotopologues, the proportions of 13CH3D and 12CH2D2 will be a function of temperature.

Results of the methane stable isotopes (δ13C and δD) of hydrate-bound for the Amazon fan indicated the dominant microbial origin of methane via carbon dioxide reduction, in which 13C and deuterium isotopes were depleted (δ13C and δD of -90% to -70% V-PDB and -250 to -150% V-SMOW, respectively). Regarding clumped isotopes, Δ13CH3D and Δ12CH2D2 values from +5.5 ‰ and +16.6 ‰, respectively. The hydrate samples are located around the thermodynamic equilibrium line in the Δ13CH3D vs. Δ12CH2D2 space, and their isotopic compositions correspond to apparent temperatures of  °C and  °C for Δ13CH3D and for Δ12CH2D2, respectively.

Given the geothermal gradient in the area, this temperature corresponds to a depth of about 1000 meters suggesting methane is migrating upwards with deeper fluids. These observations concur with seismic evidence of signal wipe-outs consistent with the rise of gas-bearing fluids along the faults.

How to cite: Rodrigues, L. F., Gilbert, A., Nakagawa, M., Ketzer, J. M., Sivan, M., Röckmann, T., Augustin, A. H., Miller, D., Cupertino, J. A., and Junior, F. C.: Clumped isotope constraints on the origin of methane hydrate from the Amazon Cone, EGU General Assembly 2025, Vienna, Austria, 27 Apr–2 May 2025, EGU25-21093, https://doi.org/10.5194/egusphere-egu25-21093, 2025.

EGU25-21766 | ECS | Posters on site | BG7.1

Physical and geochemical dynamics of shallow hydrates-bearing sediments at two active seepages sites in the western Black Sea 

Constant Art-Clarie Agnissan, Olivia Fandino, Rima Haidar, Thomas Giunta, Antoine Crémière, Charlène Guimpier, Bertrand Chazallon, Arnaud Desmedt, Claire Pirim, Christophe Brandily, Jean-Pierre Donval, Sandrine Chéron, Xavier Philippon, Vincent Riboulot, and Livio Ruffine

In the western Black Sea, gas hydrates are found at water depths greater than 660 m and are often associated with areas of active gas seepages. Their occurrence has been inferred from both geophysical data (1) and coring operations (2). During the GHASS-2 cruise (2021) offshore Romania, gravity cores containing hydrate were recovered from a ridge site and from a newly mapped mud volcano site. This work integrates data from field observations coupled with physico-chemical and geochemical analyses of gas hydrate, pore fluids and sediments in order to explore the local dynamics of gas hydrate and their interplays with geochemical processes. Gas hydrates are mainly composed of methane (99.6%), and are formed by filling subparallel fractures, as networks of interconnected veins, or as agglomerated nodules, resulting from the combined effect of sediment properties and the fault/fractures system. The combination of chloride porewater anomalies and in situ pore pressure and temperature measurements argues in favor of a recent and/or fast hydrate formation at the ridge area. In addition, microstructural analysis by Raman spectroscopy shows local enrichment of H2S in hydrate cages at the mud volcano site. This H2S, trapped in gas hydrates, is interpreted to stem from the anaerobic oxidation of methane coupled with sulfate reduction (AOM-SR) taking place just above the hydrate occurrence zone. Taken together, these results provide new insights onto processes occuring at hydrate areas in the Romanian sector of the Black Sea.

Acknowledgements
The authors thank the different projects and programs for their financial supports: DOORS by the EU Project number 101000518, and BLAME by the ANR (ANR18-CE01-0007).

References
1. Popescu I, Lericolais G, Panin N, De Batist M, Gillet H. Seismic expression of gas and gas hydrates across the western Black Sea. Geo-Marine Letters. 2007;27(2):173-83.
2. Ker S, Thomas Y, Riboulot V, Sultan N, Bernard C, Scalabrin C, et al. Anomalously Deep BSR Related to a Transient State of the Gas Hydrate System in the Western Black Sea. Geochemistry, Geophysics, Geosystems. 2019;20(1):442-59.

How to cite: Agnissan, C. A.-C., Fandino, O., Haidar, R., Giunta, T., Crémière, A., Guimpier, C., Chazallon, B., Desmedt, A., Pirim, C., Brandily, C., Donval, J.-P., Chéron, S., Philippon, X., Riboulot, V., and Ruffine, L.: Physical and geochemical dynamics of shallow hydrates-bearing sediments at two active seepages sites in the western Black Sea, EGU General Assembly 2025, Vienna, Austria, 27 Apr–2 May 2025, EGU25-21766, https://doi.org/10.5194/egusphere-egu25-21766, 2025.

EGU25-21777 | Posters on site | BG7.1

Thermodynamic constraints on the biogeochemical cycle of methane in the Black Sea 

Antoine Perhirin, Antoine Crémière, Olivia Fandino, and Laurent Toffin

Due to its permanent vertical stratification, the Black Sea is the world’s largest aquatic methane reservoir, holding an estimated 96 Tg of methane1. Understanding the biogeochemical processes at work in this unique system is crucial for evaluating the vulnerability of the methane reservoir to environmental perturbations. Additionally, such knowledge is essential for assessing the potential of deep Black Sea waters as a viable option for carbon storage, contributing to strategies aimed at mitigating greenhouse gas emissions.

Below approximately 150 m of water depth, the anoxic waters are enriched with reduced compounds such as dissolved CH₄ and H₂S, and dissolved organic matter. These unique chemical conditions sustain a specialized ecosystem dominated by anaerobic chemotrophic microbes, which rely on these compounds for energy production and play a critical role in the biogeochemical cycling of carbon and sulfur. Specifically, the anaerobic oxidation of methane (AOM) is a critical methane sink regulating the content of methane in the water column. The methanotrophic archaea comprise 3-4% of microbial cells in the water column2 and are believed to drive pelagic AOM. While this process typically involves a symbiosis between anaerobic and sulfate-reducing bacteria in marine sediments, AOM mechanisms in the Black Sea water column remain poorly understood.

To better understand the Black Sea’s methane dynamics, a new biogeochemical model of the water column has been developed. This model explores microbial metabolism coupling both thermodynamic and microbiology approaches, shedding light on the processes governing methane oxidation and transfer across water layers. The study also aims to address uncertainties in methane production, oxidation, and storage. By providing updated methane stock estimates and insights into flux dynamics, this research will inform future environmental impact assessments.

1 Reeburgh, William S., Bess B. Ward, Stephen C. Whalen, Kenneth A. Sandbeck, Katherine A. Kilpatrickt, et Lee J. Kerkhof. 1991. « Black Sea methane geochemistry ». Deep Sea Research Part A. Oceanographic Research Papers, Black Sea Oceanography: Results from the 1988 Black Sea Expedition, 38.
2 Durisch-Kaiser E, Klauser L, Wehrli B, et Schubert C. 2005. « Evidence of Intense Archaeal and Bacterial Methanotrophic Activity in the Black Sea Water Column. » Applied and Environmental Microbiology.


How to cite: Perhirin, A., Crémière, A., Fandino, O., and Toffin, L.: Thermodynamic constraints on the biogeochemical cycle of methane in the Black Sea, EGU General Assembly 2025, Vienna, Austria, 27 Apr–2 May 2025, EGU25-21777, https://doi.org/10.5194/egusphere-egu25-21777, 2025.

Stepwise Pb-Pb leaching (PbSL) is a silicate digestion technique based on sequential acid treatment of a mineral, resulting in the selective recovery of radiogenic and common Pb from the crystal lattice. This technique has proven effective for directly dating rock-forming silicates associated with metamorphic reactions that define a PT path. Two Paleoarchean granitoids from the Bastar craton were selected for this study; one is a ~3.5 Ga orthopyroxene-bearing basement tonalite sample near Nagaras, CH13 [1] and the other is the ~3.6 Ga ‘true granite’ sample near Dalli-Rajhara [2], resampled as C30. Orthopyroxene (Opx) and microcline (Mc) grain separates were leached in multiple steps using HBr, HNO3, and HF acids [3]. Lead was separated and purified using 100 µL and 10µL AG1-X8 anion exchange resin using HNO3 – HBr chemistry, and the purified Pb fraction was dissolved in 0.2% HNO3 solution. Lead isotope ratios were measured on a Thermo-Fisher Scientific Neptune Plus MC-ICPMS at the Indian Institute of Technology (IIT) Kharagpur, India, using a novel approach of combining Thallium-doping with sample-standard bracketing. Two multi-grain Opx fractions from sample CH13 yielded a combined Pb-Pb isochron age of 3594±95 Ma (2σ error, MSWD = 8.3, n = 11), which is slightly older than the zircon U-Pb crystallization age of 3453±21 Ma [1]. Therefore, sample CH13 is a Paleoarchean charno-enderbite formed at lower crustal depths. In contrast, Mc separated from sample C30 yielded a Pb-Pb isochron age of 3189±3 Ma (2σ error, MSWD = 1.3, n = 5), which confirms that despite an older zircon U-Pb crystallization age, this sample is not a ~3.6 Ga ‘true granite’ but is a product of a later ~3 Ga partial melting event, related to the Mesoarchean Sukma orogeny [1].

[1] Nandi, A., Mukherjee, S., Sorcar, N., and Vadlamani, R., 2023, Relict Mesoarchean (2.99–2.94 Ga) metamorphism overprinted by late Neoarchean tectonothermal event(s) from the Sukma Group supracrustal rocks, Bastar craton, India: Evidence from new Lu-Hf and Sm-Nd garnet isochron and Th-U-total Pb monazite ages: Precambrian Research, v. 390, p. 107056.

[2] Rajesh, H. M., Mukhopadhyay, J., Beukes, N. J., Gutzmer, J., Belyanin, G. A., and Armstrong, R. A., 2009, Evidence for an early Archaean granite from Bastar craton, India: Journal of Geological Society, London, v. 166, p. 193 – 196.

[3] Frei, R., and Kamber, B. S., 1995. Single mineral Pb-Pb dating. Earth and Planetary Science Letters, 129(1-4), 261 – 268.

How to cite: Nandi, A. and Vadlamani, R.: Constraining timing of early Archean magmatism using stepwise Pb-Pb leaching (PbSL) dating from the Bastar Craton, central India, EGU General Assembly 2025, Vienna, Austria, 27 Apr–2 May 2025, EGU25-875, https://doi.org/10.5194/egusphere-egu25-875, 2025.

Mount Isa Inlier, located in northwest Queensland, consists of multiple Proterozoic volcano-sedimentary sequences intruded, deformed and metamorphosed during a complex tectonic history between ~1880 Ma and ~1490 Ma. The stratigraphy of the Mount Isa Inlier is generally interpretated to reflect the superposition of three major superbasin events, marked by discontinuities, and deformed and metamorphosed during the Isan Orogeny (1620-1500 Ma). The superbasin model proposes continuation of stratigraphy along the length of the inlier and the existence of corelative units across the inlier. According to this model, the stratigraphy in the Dajarra region (southern part of Western Fold Belt) consists of a series of units that are either continuous with or can be corelated along strike with units that occur further north. The oldest units are the Bottletree Formation and the Lower Haslingden Group, characterized by bimodal volcanics and siliciclastic rocks which were deposited during the 1800-1780 Ma Leichardt Superbasin. These units were unconformably overlain by the Warrina Park Quartzite and the Moondarra Siltstone accumulated during the 1690-1670 Ma Calvert Superbasin. However, there is no geochronological data available from the sedimentary units in the Dajarra region and these correlations remain speculative. In this study, we report new LA-ICP-MS ages from magmatic and detrital zircons that can help constrain the magmatic and sedimentary history of the rocks occurring in this region and evaluate the existing stratigraphic correlations. Two new magmatic events, between 1810-1780 Ma and between 1710-1690 Ma, are identified in the southern part of the Western Fold Belt. The detrital zircon data indicates that (1) siliciclastic rocks mapped as the Mount Guide Quartzite have the youngest detrital populations between 1885 Ma and 1850 Ma; (2) siliciclastic sediments from the Eastern Creek Volcanics and the Jayah Creek Metabasalt have the youngest detrital zircon populations between 1870 and 1850 Ma; (3) siliciclastic rocks mapped as the Timothy Creek Sandstone and as the Mount Isa Group have the youngest detrital populations between 1820 and 1780 Ma. The maximum depositional ages obtained in this study are significantly older compared to the same stratigraphic units mapped to the north indicating either a different source or that these units are indeed much older and represent a different stratigraphy not previously recognized in the Mount Isa Inlier.

How to cite: Noptalung, S., Sanislav, I., and McCoy-West, H.: New constraints on the timing of magmatism and sedimentation in the Dajarra region, southern area of Western Fold Belt, Mt Isa Inlier, Australia: implication for stratigraphic successions during Paleoproterozoic , EGU General Assembly 2025, Vienna, Austria, 27 Apr–2 May 2025, EGU25-2666, https://doi.org/10.5194/egusphere-egu25-2666, 2025.

The Manamedu Ophiolite Complex (MOC) within the Palghat-Cauvery Suture Zone (PCSZ) in southern India comprises metamorphosed equivalents of mafic–ultramafic group of rocks including pyroxenite and dunite with locally cumulate textures; gabbroic rock types including gabbro, gabbronorite, and anorthosite; sheeted mafic dykes of amphibolite to meta-andesite and plagiogranite; a thin layer of ferruginous cherts. The tectonic discrimination of these rocks based on various geochemical plots shows that they were related to island arc tholeiite (IAT) group with tholeiitic to calcalkaline signatures. Most of the samples (hornblendite, anorthosite, and amphibolite) have similar chondrite-normalized rare earth element patterns characterized by light REE enrichment, slightly Eu anomaly, and flat heavy REE profiles, except plagiogranite has a significant Eu anomaly. In the primitive mantle-normalized spidergram, all samples show depletion in HFSE (P, Zr, Sm, Ti, and Y) and enrichment of LILE (Rb, Ba, Th, Sr) with negative Nb anomalies. The petrological and geochemical characteristics of the lithological association of MOC represent the remnants of an oceanic crust, which may be formed in a suprasubduction zone geodynamic environment.

How to cite: Chen, N. H.-C.: Geochemical and petrological study of the Manamedu Ophiolite Complex, Cauvery suture zone, southern India, EGU General Assembly 2025, Vienna, Austria, 27 Apr–2 May 2025, EGU25-4628, https://doi.org/10.5194/egusphere-egu25-4628, 2025.

Clarifying the sedimentary characteristics of the Precambrian microbialite is crucial for understanding the evolution of early life on Earth. In the study, the sedimentary, mineralogical and geochemistry characteristics of microbial dolomite at the Ediacaran in the Upper Yangtze Block are analyzed. The results show that the late Ediacaran in the Upper Yangtze is a rimmed carbonate platform. The microbialite inside the semi-restricted platform is small and sparse, with low residual organic matter, while microbialite at the platform margin is large and dense, with high residual organic matter. The in- situ major elements, rare earth elements, C/O isotopes, and mineral assemble of microbialite indicate significant hydrothermal activity at the platform margin. Under the influence of hydrothermal activity, microbialite at the platform margin are enriched in Fe, Mn, PEF, BaEF, NiEF, CuEF, CoEF, ZnEF, with higher levels of NaEF, KEF, MgEF and UEF, MoEF, VEF, indicating a sedimentary environment with sufficient nutrients, higher salinity, higher seawater temperature and lower oxygen. It can be concluded that environments significantly influenced by hydrothermal activity during the late Neoproterozoic were more suitable for microbial habitation, which may also suggest the origin of early life on Earth.

How to cite: Wang, H.: Sedimentary characteristics of Ediacaran microbialite in the Yangtze Platform, South China: implications for the evolution of early life, EGU General Assembly 2025, Vienna, Austria, 27 Apr–2 May 2025, EGU25-4766, https://doi.org/10.5194/egusphere-egu25-4766, 2025.

EGU25-6167 | PICO | GD3.2

Slow Thickening of Cratons Has Increased Kimberlite Frequency Over Time 

Jyotirmoy Paul and Clinton Phillips Conrad

Kimberlites are exclusively found on cratons, some of which have remained stable for more than 3 billion years. Kimberlite melts are generated at temperatures of at least 1300°C and pressures of 5–7 GPa, corresponding to depths of 160–250 km. Cratons, being thicker than normal lithosphere, are thus natural hosts for kimberlite melts. Analyzing the frequency of kimberlite eruptions over time, we found that their frequency gradually increased after 1.5 Gyr. Notably, before 2 Gyr, only 4-5 records of kimberlite eruptions have been documented. As kimberlites are found on stable cratons, preservation bias due to tectonic or erosional destruction may not fully explain the scarcity of older kimberlites. This paucity motivated us to explore a potential correlation between craton thickness and kimberlite frequency. Analysing previous studies we hypothesize that, initially, cratons were less than 150 km thick — below the kimberlite stability depth –  and they have thickened over time, eventually reaching depths conducive to kimberlite stability. Mechanisms for craton growth remain poorly understood, although gravitational thickening and self-compressive thickening have been proposed. To investigate these mechanisms within the context of supercontinental cycles, we developed 2D box models using the finite element code ASPECT. Starting with a 150 km thick craton, we allowed mantle flow to evolve over 3 Gyr. Due to their high viscosity and thickness, cratons can divert mantle flow, creating a self-compressive environment during supercontinental assembly. During supercontinental breakup, mantle flow generates an extensional environment that thins the craton. We simulated four supercontinental cycles corresponding to Superia, Columbia, Rodinia, and Pangea. Our results show that cratons became progressively thicker during each cycle. After 1.5 Gyr, craton thickness increased to approximately 160 km, entering the kimberlite stability field. By the time of the Rodinia assembly, craton thickness had reached levels suitable for diamondiferous kimberlite formation, potentially explaining the sudden increase in kimberlite eruptions around 1.1 Ga. We tested various parameters, including viscosity, density, initial thickness, and craton width, against different background mantle flow velocities. Our preliminary results suggest that the gradual thickening of cratons after 1.5 Gyr increased the likelihood of kimberlite eruptions on Earth.

How to cite: Paul, J. and Conrad, C. P.: Slow Thickening of Cratons Has Increased Kimberlite Frequency Over Time, EGU General Assembly 2025, Vienna, Austria, 27 Apr–2 May 2025, EGU25-6167, https://doi.org/10.5194/egusphere-egu25-6167, 2025.

Plate tectonics is central to the long-term release of heat from Earth’s deep interior, which ultimately maintains habitability, but its time of onset is highly debated. Early Archean granitic domes surrounded by greenstones provide evidence for gravitational reorganization of the crust and dominance of vertical tectonics distinct from plate tectonics. However, because plate tectonics is a kinematic framework, a measure of motion such as that provided by paleomagnetism is needed for direct tests. The East Pilbara craton (Western Australia) preserves classic Paleoarchean to Mesoarchean granite-greenstone geology, but paleomagnetic data from these rocks have been interpreted as tracing modern plate tectonic velocities. Herein, we report new paleomagnetic data from granite, basalt and dacite ranging in age from 3.49 to 3.2 Ga from the East Pilbara craton and find that these carry a 2.7 Ga reset magnetization, a pattern seen in data throughout the craton. The recognition of this resetting resolves the conflict with the geological record, and together with other paleomagnetic results from the Kaapvaal (South Africa) and the Yilgarn (Western Australia) cratons define a 600 myr-long transition between stagnant lid tectonics and modern plate tectonic motions, the latter beginning ca. 3.0 to 2.7 billion years ago.

How to cite: Cottrell, R., Bono, R., and Tarduno, J.: Modern plate tectonic motions commenced after formation of voluminous Paleoarchean to Mesoarchean TTG crust , EGU General Assembly 2025, Vienna, Austria, 27 Apr–2 May 2025, EGU25-7331, https://doi.org/10.5194/egusphere-egu25-7331, 2025.

EGU25-10015 | ECS | PICO | GD3.2

Clay-hematite Association in Late Paleoproterozoic Oolitic Ironstones of the North China Craton  

Yisheng Li, Xiancai Lu, Xiangjie Cui, Huan Liu, Jiarun Liu, and Yuanfeng Cai

Original phases of the Proterozoic Iron Formations (IFs) have been considered as essential archives of paleo-seawater geochemistry. It is widely acknowledged that hydrated ferric oxides/hydroxides were the primary precursor phase. However, the significance of high silica concentrations in Precambrian seawater has been receiving increasing attention for understanding the original iron mineralogy. Recent studies have provided compelling evidence that Fe(II)-silicates were the predominant precursor phases of IFs.

In this study, we identified the Fe-illite cortices within ooids from the Paleoproterozoic Chuanlinggou Iron Formation, located on the northern margin of the North China Craton. The Fe-illite, characterized by an Fe(II)/Fetotal ratio of approximately 20%, exhibits tangentially arranged crystals probably formed by wave action in reducing environments. There is considerable hematite within the Fe-illite cortices, which can be categorized into striped and granular types. Striped hematite is tangentially arranged alongside the Fe-illite, and its rare earth element (REE) patterns exhibit heavy rare earth element (HREE) enrichment, similar to Fe-oxide cortices. In contrast, Fe-illite associated with granular hematite exhibits light rare earth element (LREE) enrichments. We propose the Fe-illite cortices reflect the original Fe-smectite precipitation from paleo-seawater under alkaline conditions, and striped hematite represents the original mineral phase during the formation of the Fe-smectite cortices. Furthermore, the Fe-illite cortices exhibit orders-of-magnitude enrichment in biological elements compared to Fe-oxide cortices. It is noticeable that similar clay-hematite association has been reported in the Paleoproterozoic Yunmengshan oolitic ironstone from the southern margin of the North China Craton (Qiu et al., 2020). These findings indicate specific solution chemistry and potential biological influences at the craton margins during the Proterozoic era.


References

Qiu, Y., Zhao, T. and Li, Y. (2020) The Yunmengshan iron formation at the end of the Paleoproterozoic era. Applied Clay Science 199, 105888.

How to cite: Li, Y., Lu, X., Cui, X., Liu, H., Liu, J., and Cai, Y.: Clay-hematite Association in Late Paleoproterozoic Oolitic Ironstones of the North China Craton , EGU General Assembly 2025, Vienna, Austria, 27 Apr–2 May 2025, EGU25-10015, https://doi.org/10.5194/egusphere-egu25-10015, 2025.

EGU25-10905 | ECS | PICO | GD3.2

Late Archaean basalts from the Yilgarn craton record evidence of thin lithosphere prior to cratonisation 

Marthe Klöcking, Karol Czarnota, Ian H. Campbell, Hugh Smithies, David C. Champion, and D. Rhodri Davies

The dynamics of Earth’s early mantle and the timing of the onset of plate tectonics remain a topic of debate. Proposed hypotheses for the Archaean eon range from a stagnant-lid Earth all the way to modern-style plate tectonics. Here, we estimate temperatures and depths of melt generation in the late Archaean mantle using a new geochemical data compilation of mafic igneous rocks from the Yilgarn craton, Australia. We combine these results with stratigraphic and geodynamic constraints to resolve the tectonic regime and upper mantle dynamics at the time.

Primitive volcanic rocks can preserve signatures of the melting processes in the mantle: depth and temperature of melting are recorded in magma major and trace element chemistry. We have collated a data compilation of mafic volcanic samples from the Archaean Yilgarn craton in Western Australia. In order to identify those samples most representative of melting conditions in the convecting mantle, the data were screened to minimise the effects of crystal fractionation and assimilation of crustal or cumulate material (9 wt% < MgO < 15 wt%; no Eu anomalies, no positive Pb anomalies; Nb/U > 30). We further correct these screened compositions for olivine fractionation. This screened dataset predominantly comprises tholeiitic basalts in the Kalgoorlie terrane that erupted prior to the main komatiite sequence and the felsic magmas that make up the bulk of the Yilgarn cratonic crust. The mafic compositions investigated here therefore represent melting conditions immediately before the onset of cratonisation.

The screened data display depleted, MORB-like rare earth element patterns with no evidence of a garnet signature. Forward and inverse geochemical modelling of these compositions, assuming a primitive mantle source, predicts melting at depths as shallow as ~40 km and mantle potential temperatures elevated by ~200 °C compared to present-day ambient mantle. These results are consistent with melting of a rising plume head combined with moderate extension of the pre-existing lithospheric lid.

How to cite: Klöcking, M., Czarnota, K., Campbell, I. H., Smithies, H., Champion, D. C., and Davies, D. R.: Late Archaean basalts from the Yilgarn craton record evidence of thin lithosphere prior to cratonisation, EGU General Assembly 2025, Vienna, Austria, 27 Apr–2 May 2025, EGU25-10905, https://doi.org/10.5194/egusphere-egu25-10905, 2025.

The ocean pH is a fundamental property regulating various aspects of Earth system evolution. However, the early ocean pH remains controversial, with estimates ranging from strongly acidic to alkaline. Here we develop a model integrating global carbon cycling with ocean geochemistry, and incorporating continental growth and mantle thermal evolution. By coupling global carbon cycle with ocean charge balance, and by using solid Earth processes of mantle degassing and crustal evolution to specify the history of volatile distribution and ocean chemistry, we show that a rapid increase in ocean pH is likely during the Hadean to the early Archean, with pH evolving from 5 to neutral by approximately 4.0 Ga. This rapid pH evolution is attributed primarily to elevated rates of both seafloor and continental weathering during the Hadean. This acceleration in weathering rates originates in the unique aspects of Hadean geodynamics, including rapid crust formation, different crustal lithology, and fast plate motion. Earth likely transformed from a hostile state to a habitable one by the end of the Hadean, approximately 4.0 Ga, with important implications for planetary habitability and the origin of life.

How to cite: Guo, M. and Korenaga, J.: Rapidly evolving ocean pH in the early Earth: Insights from global carbon cycle coupled with ocean chemistry, EGU General Assembly 2025, Vienna, Austria, 27 Apr–2 May 2025, EGU25-11088, https://doi.org/10.5194/egusphere-egu25-11088, 2025.

EGU25-11656 | ECS | PICO | GD3.2

Lithosphere-Mantle Interactions and Weakening Processes in Early Earth: Implications on the onset of Plate Tectonics 

Poulami Roy, Jeroen van Hunen, Michael Pons, and Arijit Chakraborty

The initiation of plate tectonics marks a pivotal moment in Earth's geological history, shaping its surface dynamics and influencing its habitability. Despite its significance, the mechanisms that triggered the onset of plate tectonics during the early Earth remain a subject of active debate, with several mechanisms that may have existed prior to Plate tectonics (PT), and might have gradually evolved into or abruptly triggered PT., e.g. crustal resurfacing, crustal overturn, sagduction, plume induced subduction, formation of reworked crust, damage induced plate boundary formation and plutonic squishy lid regime. In this study, we investigate how localized lithospheric weakening, potentially driven by mantle plumes and/or melt, could have contributed to the emergence of plate tectonics. Using 2D numerical simulations developed with the ASPECT geodynamic code, we explore the conditions under which these mechanisms may operate. To investigate these processes, a parameter sensitivity study that explores the effects of mantle and crustal rheological properties and ambient mantle temperature have been carried out. We will present the preliminary results of this work which provides new insights into the complex interplay of lithosphere and mantle processes that could have driven the emergence of plate tectonics, offering a framework for reconciling diverse hypotheses.


How to cite: Roy, P., van Hunen, J., Pons, M., and Chakraborty, A.: Lithosphere-Mantle Interactions and Weakening Processes in Early Earth: Implications on the onset of Plate Tectonics, EGU General Assembly 2025, Vienna, Austria, 27 Apr–2 May 2025, EGU25-11656, https://doi.org/10.5194/egusphere-egu25-11656, 2025.

EGU25-16055 | ECS | PICO | GD3.2

3.7 Ga Isua Supracrustal Belt sediments record formation of fore-arc basin with conditions conducive to proliferation of life 

Austin Jarl Boyd, Minik Rosing, Magnus Harding, Donald Canfield, and Tue Hassenkam

The Isua Supracrustal Belt hosts >3.7 Ga old detrital meta-sediments that consist of turbiditic and pelagic pelites. These meta-sediments contain some of the oldest evidence for life in the form of abundant graphite with low δ13C. The continuous occurrence of this graphite throughout these meta-sediments is consistent with their formation in a basin with a continued pelagic biomass productivity, fueled by a consistent source of nutrients. Understanding the environment in which these early life-forms thrived is fundamental to our understanding of which conditions are conducive to life on Earth. In order to trace the tectonic and compositional development of the basin and proximal terranes, we have characterized a ca. 80 m rock core that samples the basaltic basement, iron-rich meta-sediments, detrital meta-sediments and contacts between these lithologies. The basement consists of basalts with major and trace elemental compositions that are similar to boninites and are conformably overlain by iron rich mixed chemical and detrital sediments. Iron concentrations fall gradually upwards in the core, with sporadic reoccurring iron-rich layers occurring in the upper core. The gradual change in iron concentrations shows that the core contains a broadly conformable and coherent stratigraphy that records the formation of the volcanic basement, followed by iron deposition enhanced by post-volcanic hydrothermal circulation. Detrital sediments were being deposited as soon as the basin floor was formed, indicating that proximal erodible terranes were already present. A combination of proxies, consisting of La/Yb, Ti/Zr and petrographic observations show that this detrital component was derived from ca. 60 % tonalities and 40 % non-boninitic basalts. These conditions are best explained by the formation of a volcanic fore-arc basin in front of a pre-existing differentiated terrane formed by melting of hydrated basalts. This sequence of events is consistent with cumulative zircon ages in surrounding gneisses that suggest episodic collisions of primitive arcs, followed by re-initiation of subduction. The active volcanism, tectonism and formation of (semi)restricted basins in this environment likely allowed the accumulation of nutrients required for the proliferation of life.

How to cite: Boyd, A. J., Rosing, M., Harding, M., Canfield, D., and Hassenkam, T.: 3.7 Ga Isua Supracrustal Belt sediments record formation of fore-arc basin with conditions conducive to proliferation of life, EGU General Assembly 2025, Vienna, Austria, 27 Apr–2 May 2025, EGU25-16055, https://doi.org/10.5194/egusphere-egu25-16055, 2025.

EGU25-18911 | PICO | GD3.2

Namibe Group detrital zircon U-Pb and Lu-Hf isotopes: a testimony of late-Orosirian (1.9–1.8 Ga) crustal growth in the Angolan Shield (Congo Craton) 

Ezequiel Ferreira, Jérémie Lehmann, José Feliciano Rodrigues, Paulo Bravo Silva, Trishya Owen-Smith, José Luis Garcia Lobón, João Correia, Henriette Ueckermann, Mmasetena Anna Molekwa, José Manuel, and Américo da Mata Lourenço Victorino

The Namibe Group represents the largest package of immature supracrustal rocks of the Angola Shield (Congo Craton), occupying an area of nearly 10,000 km2 in the Namibe Zone (NZ). It is a folded, steeply dipping, meta-volcanosedimentary sequence essentially comprising immature micaschists and greywackes, felsic metavolcaniclastites, along with intercalated marbles and amphibolites. The metavolcanosedimentary sequence is intruded by ca. 1810–1790 Ma ultramafic to felsic plutonic rocks with magmatic arc geochemical signatures. Despite its importance, key aspects such as its maximum depositional age (MDA), sedimentary provenance, and the detrital zircon (DZ) record of crustal evolution remain unresolved. This study presents LA-ICP-MS U-Pb and Lu-Hf DZ analyses from nine NG samples.

The results reveal a dominant cluster of MDAs between 1840 ± 6 Ma and 1820 ± 5 Ma, with two samples yielding older MDAs of 1867 ± 15 Ma and 1880 ± 13 Ma. These findings establish a late-Orosirian age for the NG, refuting earlier proposals of an Archean age. The DZ age distributions are dominated by a prominent youngest peak, with most ages clustering near the MDA. These patterns resemble those of active magmatic arc basin deposits, indicating a convergent plate margin setting for NG deposition.

The provenance for all DZs can be explained by sources internal to the SW Angolan Shield, apart from a minor (8%) Rhyacian age fraction (~2.08 and ~2.14 Ga), for which no rocks of this age have been identified in the Angolan Shield. Approximately 63% of the DZs are late-Orosirian (1.82–1.90 Ga), with a predominant component at ~1.83 Ga and a minor one at ~1.87 Ga. These zircons were likely sourced from the extensive magnesian, calc-alkaline granitoids of the Epupa Metamorphic Complex (EMC: ~1.86–1.76 Ga), the Kamanjab Inlier (~1.88–1.80 Ga), the NZ (~1.83–1.79 Ga), and/or ~1.84–1.80 Ga plutons intruding the Central Eburnean Zone (CEZ: 2.04–1.95 Ga). Older DZ populations comprise 23% early-Orosirian (Eburnean) ages (peaks at ~1.92, ~1.97, and ~2.01 Ga) and 6% Archean ages (2.50–3.52 Ga). These Eburnean and Archean DZs were likely sourced from the CEZ and/or Cassinga Zone in southern Angola, and/or the Sesfontein-Grootfontein-Tsumkwe-Quangwadum inliers in northern Namibia.

Archean DZs exhibit mostly subchondritic Hf compositions, indicating significant crustal reworking. This trend persisted during Rhyacian to early Orosirian times, with 88% of DZs displaying markedly negative εHf(i) values. In contrast, most late Orosirian DZs (86%) plot above the crustal evolution trend of older ones, reflecting a marked shift toward slightly subchondritic to suprachondritic εHf(i) values and younger TDM2 model ages. This trend indicates a substantial increase in the contribution of juvenile material to magma generation in late-Orosirian times.

This isotopic shift is also observed in late-Orosirian granitoids of the NZ and EMC, likely reflecting a fundamental geodynamic transition from a period dominated by crustal reworking to juvenile accretion within this part of the Angolan Shield.  Our data show that significant continental growth took place in the southwestern margin of the Angolan Shield (Congo Craton) in late-Orosirian times, during the assembly of Columbia.

How to cite: Ferreira, E., Lehmann, J., Feliciano Rodrigues, J., Bravo Silva, P., Owen-Smith, T., Garcia Lobón, J. L., Correia, J., Ueckermann, H., Molekwa, M. A., Manuel, J., and da Mata Lourenço Victorino, A.: Namibe Group detrital zircon U-Pb and Lu-Hf isotopes: a testimony of late-Orosirian (1.9–1.8 Ga) crustal growth in the Angolan Shield (Congo Craton), EGU General Assembly 2025, Vienna, Austria, 27 Apr–2 May 2025, EGU25-18911, https://doi.org/10.5194/egusphere-egu25-18911, 2025.

EGU25-908 | ECS | Posters on site | GD1.2

Probing Mantle Structure to Reconcile Predicted and Observed Dynamic Topography 

Issac Jacob, Nicky White, and David Al-Attar

Density variations within the Earth’s mantle drive convective Stokes flow and shape key geophysical observables, one of which is dynamic topography, defined as the surface deflection due to normal stresses exerted on the base of the crust. For decades, predicted dynamic topography has differed from observations in two regards. First, the predictions contain too much power at long wavelengths  i.e > 10,000 km). Secondly, there is insufficient power at shorter wavelengths (i.e. < 1,000 km). Here, the propagator method is utilised to solve for the Stokes equation and self-gravitation within a spherically symmetric viscosity regime. To solve these equations, kernels (i.e. Green’s functions) are obtained, which represent the sensitivity of observables like surface and core-mantle boundary topographies to density anomalies at varying depths and wavelengths within the mantle. These kernels are strongly sensitive to viscosity structure. In exploring the parameter space within the forward problem, predicted dynamic topography must match the observational dataset of dynamic topography, containing over 14,000 measurements. The geoid is sensitive to the Earth’s (relative) viscosity structure, and therefore provides an excellent primary constraint. In constructing predicted dynamic topography, a whole-mantle density model is required, usually  acquired from a global shear-wave velocity model and using a constant scaling factor from mineral physics. A large range of tomographic models (n = 17) are utilised to undertake a more comprehensive search for the most appropriate mantle structure. In isolation, the lower mantle is found to produce several hundred metres of surface dynamic topography and match the long-wavelength features remarkably well. Current whole-mantle tomographic models result in predictions with insufficient short-wavelength features, as compared to residual topography studies. Hybrid density models are therefore constructed by smoothly blending high-resolution upper-mantle models, such as SL2013, with the previous suite of whole-mantle models, resulting in a predicted dynamic topography signal which better matches observed dynamic topography on shorter length scales. An improved velocity-to-density conversion is explored, by introducing a depth-dependence on the conversion and focussing on the anelastic effects within the upper mantle. Reconciling predicted and observed dynamic topography strengthens the integration of dynamic topography with other observable fields, such as the geoid, and offers a more comprehensive framework to study Earth’s interior processes. 

How to cite: Jacob, I., White, N., and Al-Attar, D.: Probing Mantle Structure to Reconcile Predicted and Observed Dynamic Topography, EGU General Assembly 2025, Vienna, Austria, 27 Apr–2 May 2025, EGU25-908, https://doi.org/10.5194/egusphere-egu25-908, 2025.

EGU25-1081 | ECS | Orals | GD1.2

SS3DPacific: Structure of the Pacific uppermost mantle with 3D resolution and uncertainty 

Franck Latallerie, Christophe Zaroli, Sophie Lambotte, Alessia Maggi, Andrew Walker, and Paula Koelemeijer

Surface features in oceanic basins, such as mid-oceanic ridges, hotspots, seafloor subsidence, and fracture zones, result from geodynamic processes in the uppermost mantle. Insight into these processes are obtained from tomographic imaging using surface waves. However, the poor distribution of earthquakes and seismic stations, as well as noise in seismic data, give rise to spatial resolution artefacts and errors in tomography models, complicating their interpretation.

We constructed SS3DPacific, a model of the vertically-polarised shear-wave velocity structure of the Pacific uppermost mantle and surrounding regions. The model derives from Rayleigh-wave phase delays, that we measured along with an estimation of their uncertainty. SS3DPacific is accompanied by 3D resolution and uncertainty. To obtain this information, we combined the SOLA inverse method to control and produce resolution and uncertainty with finite-frequency theory for Rayleigh waves, leading to a 3D model.

In this talk, I will present SS3DPacific, its 3D resolution, and uncertainty. The model shows well-known large-scale features such as cratons, ridges, and the increase of seismic velocity with distance from mid-oceanic ridges. Detailed analysis of the 3D resolution reveals strong spatial artefacts, particularly vertically, which manifest themselves in the form of structural depth leakages. This effect, expected for this type of surface-wave tomography, will ultimately bias the analysis of the lithosphere cooling process if not accounted for. Additionally, SS3DPacific shows an intriguing pattern of bands of velocity variations aligned with fracture zones.

Given the availability of 3D resolution and uncertainty quantification, SS3DPacific can be utilised in studies aimed to assess mantle circulation models, and thus dynamic processes in the Earth.

How to cite: Latallerie, F., Zaroli, C., Lambotte, S., Maggi, A., Walker, A., and Koelemeijer, P.: SS3DPacific: Structure of the Pacific uppermost mantle with 3D resolution and uncertainty, EGU General Assembly 2025, Vienna, Austria, 27 Apr–2 May 2025, EGU25-1081, https://doi.org/10.5194/egusphere-egu25-1081, 2025.

EGU25-1975 | ECS | Posters on site | GD1.2

Dynamics of longitudinal Hawaiian hotspot motion and the formation of the Hawaiian-Emperor Bend 

Jie Zhang and Jiashun Hu

The Hawaiian-Emperor Chain in the North Pacific features a conspicuous 60° bend that has been the subject of multiple interpretations, including an abrupt change in Pacific plate motion in the Eocene (~47 Ma), a rapid southward drift of the Hawaiian hotspot before the formation of the bend, or a combination of the two factors. The latest geodynamic model has proposed that 30-35° of the Hawaiian-Emperor Bend (HEB) was caused by the sudden westward movement of the Pacific Plate at the latitude of Hawaii around 50 Ma, which occurred as a result of the cessation of the slab pull force generated by intraoceanic subduction in the northern Pacific. The remaining 25-30° of the bend is attributed to the southward movement of the Hawaiian hotspot. But according to geometric analysis and back extrapolation of plate reconstructions, a stronger westward component in the motion of the Hawaiian hotspot is required to achieve a better fit of the HEB. However, there is no geodynamic justification for a significant westward component in the drift of the hotspot.

Here, using geometric analysis with constraints from plate kinematics, we show a significant longitudinal hotspot motion is required to fit the Hawaiian-Emperor Chain. Further application of global mantle convection models reveals a westward (by ~6°) and then an eastward (by ~2°) hotspot drift in addition to the southward motion before and after the bend, with the westward motion primarily controlled by the intraoceanic subduction in Northeast Pacific. While both the westward and southward motion are required to fit the seamount chain, the former contributes ~20 degrees to the bend angle, larger than the later, challenging traditional views. Combining geodynamically-predicted Pacific Plate motion change at 47 Ma, our model provides a nearly perfect fit to the seamount chain, suggesting plate-mantle reorientation as the ultimate cause. It also suggests that the Hawaiian plume conduit is tilted towards the southwest, solving the long-lasting debate on the source of the Hawaiian plume among seismological studies.

How to cite: Zhang, J. and Hu, J.: Dynamics of longitudinal Hawaiian hotspot motion and the formation of the Hawaiian-Emperor Bend, EGU General Assembly 2025, Vienna, Austria, 27 Apr–2 May 2025, EGU25-1975, https://doi.org/10.5194/egusphere-egu25-1975, 2025.

Mantle convection alters Earth’s ellipsoidal shape and modifies its moment of inertia, leading to rotation-axis shifts known as true polar wander (TPW). By combining seismic tomography with the Back-and-Forth Nudging (BFN) method, we created a time-dependent convection model that reconstructs mantle density evolution and Earth’s moment of inertia over the last 70 million years. This modeling framework closely agrees with independent paleomagnetic data on Cenozoic changes in Earth’s rotation pole, notably reproducing the previously unexplained U-turn in TPW around 50 million years ago.

Our results show that TPW can exceed five degrees, despite stabilizing factors such as high viscosity in the lower mantle and Earth’s remnant rotational bulge. Verification of predicted variations in Earth’s ellipsoidal figure, based on paleomagnetic constraints, provides a robust reference point for forecasting convection-induced dynamic flattening. Over the 70-million-year interval, we document changes in flattening that range from -0.2% to +0.1% during the Paleogene. Furthermore, our predictions of Paleogene axial precession frequency align with recent independent cyclostratigraphic analyses, offering strong evidence for the accuracy of our model and reinforcing the hypothesis of diminished luni-solar tidal dissipation during that period.

How to cite: Forte, A. M., Rowley, D., Rowley, D., and Kamali Lima, S.: Resolving 70 Million Years of Earth’s True Polar Wander and Precession: Paleomagnetic Validation of a Seismic Tomography–Based Mantle Convection Model, EGU General Assembly 2025, Vienna, Austria, 27 Apr–2 May 2025, EGU25-2596, https://doi.org/10.5194/egusphere-egu25-2596, 2025.

EGU25-3202 | ECS | Orals | GD1.2

Magnetic tracing of lost time in Cenozoic sediments: Testing dynamic topography of the Yellowstone plume, USA 

Dieke Gerritsen, Stuart Gilder, Yi-Wei Chen, Michael Wack, and Alina Ludat

Dynamic uplift may be expressed in the geologic record by the presence of unconformities, which represent periods of erosion and/or halted sedimentation. One distinct example, the early Miocene unconformity (EMU), formed shortly before the impingement of the Yellowstone plume in the northern Rocky Mountains. The most complete geologic record around this event is preserved in southwest Montana. There, we sampled eight sedimentary sections crossing the EMU. Our magnetostratigraphic study in combination with published radiometrically-dated ash layers determines the EMU ended at ~20.1 Ma and lasted up to 1.5 Myr. We found that the EMU is marked by an abrupt increase in magnetite concentration coincident with a shift in detrital zircon age spectra. These data indicate a rapid reorganization in sediment source likely caused by the emplacement of the Columbia River flood basalt synchronous with a shift in the North American drainage divide. The passage of the Yellowstone plume and/or the onset of Basin and Range extension likely provided the tectonic stimulus for the widespread unconformity and changes in sediment source.

How to cite: Gerritsen, D., Gilder, S., Chen, Y.-W., Wack, M., and Ludat, A.: Magnetic tracing of lost time in Cenozoic sediments: Testing dynamic topography of the Yellowstone plume, USA, EGU General Assembly 2025, Vienna, Austria, 27 Apr–2 May 2025, EGU25-3202, https://doi.org/10.5194/egusphere-egu25-3202, 2025.

EGU25-3336 | ECS | Orals | GD1.2

North Atlantic surface-motion changes in early Paleogene: Observations and geodynamic interpretations 

Zhirui Ray Wang, Giampiero Iaffaldano, and John Hopper

Mantle convection is a crucial component for providing driving and resisting forces for horizontal motion of tectonic plates, as well as for generating non-isostatic vertical motion commonly termed “dynamic topography”. These two kinds of surface motion are often investigated in isolation. However, the existence of a thin, mechanically weak asthenosphere allows us to study mantle convection in the context of Couette/Poiseuille flow, which links mantle flow properties to temporal changes in both horizontal and vertical motions. In this study, we utilize publicly available finite rotations and stage-resolution stratigraphic dataset in the North Atlantic region to investigate its surface-motion history in early Paleogene, which coincides with the peak Icelandic plume activity deduced from independent geologic constraints. We find that our inferred horizontal and vertical motion changes are temporally correlated. We examine this correlation through a quantitative torque analysis, which incorporates an analytic Couette/Poiseuille flow model. We parameterize this flow model in terms of observed kinematics coupled with flow-flux estimates of Icelandic plume and/or Farallon slab activity. Our analysis indicates (1) that torque-variation tied to the Icelandic plume flux closely resembles our kinematic inferences, and (2) that the inclusion of slab flux does not modify such a scenario significantly. In light of these inferences, our efforts shed light on the role of asthenospheric channelized flow flux in influencing the North Atlantic surface expressions in early Paleogene.


How to cite: Wang, Z. R., Iaffaldano, G., and Hopper, J.: North Atlantic surface-motion changes in early Paleogene: Observations and geodynamic interpretations, EGU General Assembly 2025, Vienna, Austria, 27 Apr–2 May 2025, EGU25-3336, https://doi.org/10.5194/egusphere-egu25-3336, 2025.

EGU25-3690 | Posters on site | GD1.2

Geodynamic modelling the thermochemical structure of the Earth's mantle using integrated geophysical and petrological inversion of surface wave and satellite gravity data 

Javier Fullea, Olga Ortega-Gelabert, Sergei Lebedev, Zdenek Martinec, Juan Carlos Afonso, and Bart Root

The lateral and vertical thermochemical heterogeneity in the mantle is a long-standing question in geodynamics. The forces that control mantle flow and therefore Plate Tectonics arise from the density and viscosity lateral and vertical variations. Satellite gravity data are a unique source of information on the density structure of the Earth due to its global and relatively uniform coverage, which complements gravimetric terrestrial measurements. Gravity data (geoid, gravity, gravity gradients) sense subsurface mass anomalies have proven to be helpful in determining the Earth’s thermochemical field in virtue of density’s relatively stronger dependence on rock composition compared to seismic velocities. However, the inversion of gravity data alone for the density distribution within the Earth is an ill-posed problem with a highly non-unique solution that requires regularization and smoothing, implying additional and independent constraints. A common approach to estimate the density field for geodynamical purposes is to simply convert seismic tomography anomalies sometimes assuming constraints from mineral physics. Such converted density field does not match in general with the observed gravity field, typically predicting anomalies the amplitudes of which are too large. Furthermore, a complete description of the Earth’s gravity field must include the internal density distribution and must satisfy the requirement of mechanical equilibrium as well. Therefore, the deformation of the density contrast interfaces (surface of the Earth and Core Mantle Boundary-CMB, primarily) must be consistent with the 3D mass distribution for a given rheological structure of the Earth. With the current resolution of modern tomography models and integrated geophysical-petrological modelling it is possible to consistently predict the topography of the mineral phase transitions across the transition zone (i.e., olivine à wadsleyite, and ringwoodite+majorite à perovskite+ ferropericlase) based on a temperature and chemical description of the Earth. However, for a consistent representation of the gravity field such thermochemical (i.e., density) 3D models must be compatible with the mantle flow arising from the equilibrium equations that explains both the surface topography (dynamic + isostatic-lithospheric components) and the CMB topography. Here we present a new inversion scheme to image the global thermochemical structure of the whole mantle constrained by state-of-the-art seismic waveform inversion, satellite gravity (geoid and gravity anomalies and gradiometric measurements from ESA's GOCE mission) and surface heat flow data, plus surface and CMB dynamic topography (Stokes flow). The model is based upon an integrated geophysical-petrological approach where mantle seismic velocities and density are computed within a thermodynamically self-consistent framework, allowing for a direct parameterization in terms of the temperature and composition variables.

How to cite: Fullea, J., Ortega-Gelabert, O., Lebedev, S., Martinec, Z., Afonso, J. C., and Root, B.: Geodynamic modelling the thermochemical structure of the Earth's mantle using integrated geophysical and petrological inversion of surface wave and satellite gravity data, EGU General Assembly 2025, Vienna, Austria, 27 Apr–2 May 2025, EGU25-3690, https://doi.org/10.5194/egusphere-egu25-3690, 2025.

EGU25-3805 | Posters on site | GD1.2

300 Million Years of Mantle Dynamics: Subduction, True Polar Wander, and Earth's Surface Evolution 

Marianne Greff-Lefftz, Boris Robert, and Jean Besse

We begin with a simple mantle dynamics model that integrates subducted lithosphere and large-scale upwelling plumes over the last 300 million years (Ma). Our calculations are performed using several plate models and mantle reference frame models, which are constructed based on various surface indicators, including geological data, thermal data from boreholes, a compilation of global surface volcanism, a reassessment of hotspot classifications, and paleomagnetic data.

A Monte Carlo approach identifies the optimal mantle viscosity and density contrasts that explain present-day geoid, gravity, and gravity gradients. Results highlight a consistent degree-2/order-2 mantle mass anomaly over 300 Ma, linked to the stable subduction girdle around the Pacific Ocean and two equatorial, quasi-antipodal mantle domes.

Time-dependent calculations of the Principal Inertia Axis (PIA) and True Polar Wander (TPW) reveal significant shifts in Earth's rotation axis, including cusps caused by the cessation of Paleo-Tethys and Tethys subduction and notable polar wander events .

Dynamic topography is computed and compared with geological and current observations, providing further insight into mantle dynamics and Earth's surface evolution.

How to cite: Greff-Lefftz, M., Robert, B., and Besse, J.: 300 Million Years of Mantle Dynamics: Subduction, True Polar Wander, and Earth's Surface Evolution, EGU General Assembly 2025, Vienna, Austria, 27 Apr–2 May 2025, EGU25-3805, https://doi.org/10.5194/egusphere-egu25-3805, 2025.

The Lithosphere-Asthenosphere Boundary (LAB) demarcates the transition from a conductive thermal lid to a convecting asthenosphere below. The Southwestern United States presents an intriguing natural laboratory for investigating the processes at play in this critical boundary: intraplate volcanism is abundant and geochemical and geophysical analyses suggest the presence of a sub-lithospheric layer of partial melt. It has been suggested that a change in mantle strength at the top of the melt-bearing layer helps to create the LAB, indicating that melt stability is an important factor in understanding lithospheric dynamics. The mechanism, or interplay between mechanisms, that govern the LAB has implications for geodynamic modeling as well as for understanding the long-term evolution of lithosphere and volcanism. The analysis presented here is based on seismic observations of surface waves and converted body waves, which are used to determine 1-D profiles of shear wavespeed (Vs) throughout the Southwestern United States, from the surface to 300 km depth. The LAB is determined from the depth location of negative Vs gradients within the mantle. From the Vs profiles, we estimate temperature within the upper mantle, using two different geophysical interpretive toolkits. These toolkits each predict geophysical properties via forward-modeling of temperature, melt fraction, and/or compositional state, and assumptions made within the forward-modeling can yield large discrepancies in interpreted temperature. We leverage temperatures derived from geochemical thermobarometry as a constraint to guide our choice of method and attenuation parameterization. From this workflow, we report inferred temperature at and below the gradient inferred to be the LAB, and evaluate the relationship of these temperatures to the mantle adiabat and the peridotite solidus. Temperatures are near the solidus in portions of the lithospheric mantle, particularly in the Basin and Range province, suggesting that melting does play a role in defining the LAB, but not in every location. Moreover, the prevalence or absence of partial melt appears to be connected to regional variations in deformation style, surface heat flow, and topography. Finally, we note that additional constraints on hydration state and composition of the lithosphere, as well as the geometry and distribution of partial melt, will improve the workflow presented here.

How to cite: Golos, E. and Fischer, K.: Seismic constraints on temperature and melting at the Lithosphere-Asthenosphere Boundary in the Southwestern United States, EGU General Assembly 2025, Vienna, Austria, 27 Apr–2 May 2025, EGU25-3867, https://doi.org/10.5194/egusphere-egu25-3867, 2025.

Seismological observations suggested that Earth’s inner core presents complex heterogeneity and anisotropic structure. The key to understand the structure of Earth’s inner core is to study the mineralogical composition and dynamic mechanism of the anisotropic structure of Earth’s inner core. Hexagonal close-packed (hcp) and body centered cubic (bcc) Fe alloys both have seismically anisotropic features under temperature and pressure conditions of the Earth’s inner core. When the fast axis can be oriented along the Earth’s rotation axis, the anisotropic characteristics of the Earth’s inner core, which is fast in the north-south direction and slow in the equatorial direction, can be explained. The input of light elements into Fe alloys significantly changed the anisotropy of Fe alloys. Particularly, the fast axis orientation of superionic Fe-H alloys changes with the increase of H contents in those alloys. Interestingly, superionic Fe alloys present both ionic diffusion and seismic velocity anisotropy, which establish a potential connection between the lattice preferred orientation (LPO) anisotropic structure and dipole geomagnetic field. If the Earth’s inner core is under the superionic condition, the directional diffusion of light elements driven by the geomagnetic field could result in the presence of the lattice internal stress which would then result in the LPO. The anisotropic superionic fibers explain the anisotropic seismic velocities in the IC, suggesting a strong coupling between the IC structure and geomagnetic field.

How to cite: He, Y.: Superionic inner core and anisotropic structure driven by geomagnetic field, EGU General Assembly 2025, Vienna, Austria, 27 Apr–2 May 2025, EGU25-4922, https://doi.org/10.5194/egusphere-egu25-4922, 2025.

EGU25-5805 | Posters on site | GD1.2

Dynamic Topography and The Mantle Forcing on Climate: A Missing Link in Earth System Science 

Pietro Sternai, Agostino Meroni, Bram Vaes, and Claudia Pasquero

Global topography plays a fundamental role in shaping climate, influencing atmospheric circulation and precipitation patterns through orographic effects. While much of Earth's topography arises from isostatic support due to variations in crustal and lithospheric thickness and density, a significant portion of up to 1-2km results from dynamic forces driven by slow yet vigorous mantle convection. Despite decades of research on the spatial and temporal evolution of such ‘dynamic topography’, its impact on global climate remains largely unexplored. In this study, we address this gap by quantifying the influence of mantle-induced dynamic topography on present-day atmospheric circulation and precipitation patterns. Using an Earth Model of Intermediate Complexity forced with different models of global dynamic topography, we isolate the mantle’s contribution to climate patterns. Our findings reveal prominent climatic effects linked to mantle dynamics, particularly along the American Cordillera, the East African Rift System, and other regions across latitudes which are critical to biodiversity and the evolution of life. These results uncover a hitherto unknown connection between Earth's deep interior and surface environments, with the mantle dynamics as active driver of climate processes, enhancing our understanding of the Earth System. By linking mantle dynamics to global climate, our study offers new opportunities for paleoclimate investigations and insights into how geodiversity and biodiversity have co-evolved throughout Earth's history.

How to cite: Sternai, P., Meroni, A., Vaes, B., and Pasquero, C.: Dynamic Topography and The Mantle Forcing on Climate: A Missing Link in Earth System Science, EGU General Assembly 2025, Vienna, Austria, 27 Apr–2 May 2025, EGU25-5805, https://doi.org/10.5194/egusphere-egu25-5805, 2025.

EGU25-6615 | Posters on site | GD1.2

Investigation of seismic anisotropy in the D’’ layer and at the CMB underneath Siberia and the North Atlantic 

Yvonne Fröhlich, Fiona Dorn, Muhammad I. F. Dillah, and Joachim R. R. Ritter

Within the Priority Program 2404 “Reconstructing the Deep Dynamics of Planet Earth over Geologic Time” (DeepDyn, https://www.geo.lmu.de/deepdyn/en/) we investigate possible seismic signatures at magnetic high-latitude flux lobes (HLFLs). The focus is on four target regions on the Northern Hemisphere: Siberia, Canada, the North Atlantic, and Indonesia. While Siberia and Canada show the HLFLs, the North Atlantic should be the location of a third postulated HLFL, but this area does not show an intense-flux signal in the magnetic field. The region beneath Indonesia and the Indian Ocean is characterized by an area of intense magnetic flux that changes direction and moves westwards over time. Our aim is to understand whether mineralogy and seismic structure (i.e., thermal constraints) could be responsible for the different magnetic signatures at the core mantle boundary (CMB). This is done by combining two approaches: seismic anisotropy (KIT) and seismic reflections (University of Münster) near the CMB (https://www.geo.lmu.de/deepdyn/en/projects/ritter-joachim-und-thomas-christine-understanding-the-influence-of-deep/).

To study anisotropy, we measure shear wave splitting (SWS) of SKS, SKKS, and PKS phases. Thereby, we determine the splitting parameters, the fast polarization direction φ and the delay time δt, using both the energy-minimization and the rotation-correlation methods. Especially, we search for phase pair discrepancies based on the observation type (null vs. split), e.g., between SKS and SKKS phases, as they are a clear indication for a lowermost mantle contribution to the splitting signal. For the target region underneath Siberia, SWS measurements are obtained using earthquakes with epicenters in Southeast Asia recorded at stations in the North of Scandinavia and Svalbard as well as earthquakes with epicenters in Central America recorded at the station ULN in Mongolia. These SWS measurements indicate that for the discrepant pairs the phases with piercing points closer to the center of the HLFL beneath Siberia show splitting while the phases more distant to the HLFL do not show anisotropy. Furthermore, we present first results for the target region North Atlantic. Based on our SWS measurements, we will derive structural and mineralogical anisotropy models using the MATLAB Seismic Anisotropy Toolbox (Walker and Wookey 2012). To test these models, we then simulate synthetic seismograms using AxiSEM3D (Leng et al. 2016, 2019).

How to cite: Fröhlich, Y., Dorn, F., Dillah, M. I. F., and Ritter, J. R. R.: Investigation of seismic anisotropy in the D’’ layer and at the CMB underneath Siberia and the North Atlantic, EGU General Assembly 2025, Vienna, Austria, 27 Apr–2 May 2025, EGU25-6615, https://doi.org/10.5194/egusphere-egu25-6615, 2025.

EGU25-7454 | ECS | Posters on site | GD1.2

Crustal Contributions to Moment of Inertia as Key Constraints for Earth-Like Mantle Convection Models: “Munk & MacDonald (1960)” Revisited 

Shayan Kamali Lima, Alessandro M Forte, Marianne Greff, and Petar Glišović

In their seminal work, Munk and MacDonald (1960) showed that considering only the crustal contribution to the Earth’s moment of inertia (MOI) would predict a rotation axis passing through a location near Hawaii – clearly inconsistent with the present-day geographic pole. This finding implied there must be additional mass anomalies, which the authors speculated to be in the convecting mantle, that realign the rotation axis with the observed North Pole.
Modern geodynamic studies confirm that isostatic compensation of crustal thickness and density variations explains much of Earth’s observed topography, yet the crust’s gravitational contribution is often overlooked because it is relatively small compared to that generated by density anomalies in the mantle. As a result, residual topography (the difference between observed and isostatic topography) remains a prominent global constraint on the amplitude and spatial distribution of mantle density anomalies, while residual geoid (the difference between observed and crustal isostatic geoid) is utilized far less frequently. Crucially, this omission disregards the crust’s influence on Earth’s moment of inertia (MOI) and, by extension, its impact on the location of the rotational axis. Overlooking crustal mass heterogeneities can therefore lead to unrealistic (non-Earth-like) inferences of mantle density anomalies that do not correctly predict the location of the present-day rotational axis.
By analyzing satellite-derived non-hydrostatic geoid data and comparing modeled and observed moments of inertia, we find that preserving the present-day location of the rotational axis requires systematically accounting for crustal contributions. We implement a second order-accurate isostasy model – which integrates crustal buoyancy variations in a deformable crust – to more accurately capture the interplay between surface topography, the geoid, and the convective mantle. Neglecting this refinement not only fails to preserve the present-day rotational axis position but also compromises True Polar Wander (TPW) predicted by time-dependent mantle convection simulations.
Our findings suggest that integrating a second-order accurate isostasy framework into global mantle convection models is essential for producing consistent TPW trajectories, ensuring alignment between the modeled rotational axes and Earth’s observed pole positions.

How to cite: Kamali Lima, S., Forte, A. M., Greff, M., and Glišović, P.: Crustal Contributions to Moment of Inertia as Key Constraints for Earth-Like Mantle Convection Models: “Munk & MacDonald (1960)” Revisited, EGU General Assembly 2025, Vienna, Austria, 27 Apr–2 May 2025, EGU25-7454, https://doi.org/10.5194/egusphere-egu25-7454, 2025.

EGU25-7772 | ECS | Orals | GD1.2

Wholesale flat subduction of Indian slab and northward mantle convective flow: Plateau growth and driving force of India-Asia collision 

Jincheng Ma, Xiaodong Song, Hans-Peter Bunge, Andreas Fichtner, and You Tian

The tectonic evolution of the Tibetan Plateau has been influenced by continental collision and post-collisional convergence of Indian and Eurasian plates, both of which have undoubtedly imposed their imprints on the lithosphere and upper-mantle structures beneath the collision zone. However, the mode by which the Indian Plate has subducted beneath Tibet, and its driving forces, have been highly uncertain. Here, we present seismic evidence from a full-waveform tomographic model that reveals flat subduction of the Indian Plate beneath nearly the entire plateau at ~300 km depth, implying that the slab may have transitioned to positive/neutral buoyancy and is no longer capable of supporting steep-angle deep subduction. The horizontal distance over which the flat slab slides northward increases from west (where it collides with the Tarim lithospheric keel) to east (where it has resided approximately north of the Songpan-Ganzi Fold Belt beyond the Qiangtang Block). The Asian lithosphere is subducting beneath northeastern Tibet without colliding with the Indian slab. The low-velocity zone, with a thickness of 50-110 km, sandwiched between the Tibetan crust and Indian slab, is positively correlated with the high-elevation, low-relief topography of Tibet, suggesting partial melting of the uppermost mantle that has facilitated the growth and flatness of the plateau by adding buoyant material to its base. We propose that deep mantle convective currents, traced to the Réunion plume and imaged as large-scale low-velocity anomalies from the upper mantle under the Indian Plate downward towards the uppermost lower mantle under the Baikal-Mongolia Plateau, are the primary force driving the ongoing India-Asia post-collisional convergence.

How to cite: Ma, J., Song, X., Bunge, H.-P., Fichtner, A., and Tian, Y.: Wholesale flat subduction of Indian slab and northward mantle convective flow: Plateau growth and driving force of India-Asia collision, EGU General Assembly 2025, Vienna, Austria, 27 Apr–2 May 2025, EGU25-7772, https://doi.org/10.5194/egusphere-egu25-7772, 2025.

EGU25-8576 | Orals | GD1.2

On the effect of strain rates on the deformation creep mechanisms in deep Earth mantle 

Philippe Carrez, Patrick Cordier, Karine Gouriet, Timmo Weidner, James Van Orman, Olivier Castelnau, and Jennifer Jackson

The transport of heat from the interior of the Earth drives convection in the mantle, which involves the deformation of solid rocks over billions of years. Significant advancements have been made over recent years to study lower mantle assemblages under relevant pressure and temperature conditions, which have confirmed the usual view that ferropericlase is weaker than bridgmanite. However, natural strain rates are 8 to 10 orders of magnitude lower than those observed in the laboratory, and remain inaccessible to us. Once the physical mechanisms of the deformation of rocks and their constituent minerals have been identified, it is possible to overcome this limitation thanks to multiscale numerical modeling, which allows for the determination of rheological properties for inaccessible strain rates. This presentation will demonstrate how this theoretical approach can be used to describe the elementary deformation mechanisms of bridgmanite and periclase. These descriptions are compared with available experimental results in order to validate the theoretical approach. In a subsequent phase, the impact of very slow strain rates on the activation of the aforementioned mechanisms is evaluated. Our findings indicate that significant alterations in deformation mechanisms can occur in response to changes in strain rate.

How to cite: Carrez, P., Cordier, P., Gouriet, K., Weidner, T., Van Orman, J., Castelnau, O., and Jackson, J.: On the effect of strain rates on the deformation creep mechanisms in deep Earth mantle, EGU General Assembly 2025, Vienna, Austria, 27 Apr–2 May 2025, EGU25-8576, https://doi.org/10.5194/egusphere-egu25-8576, 2025.

EGU25-8681 | Orals | GD1.2

Enhancing Adjoint Reconstructions of Earth’s Mantle with Geochemical Data from Intra-Plate Lavas 

Rhodri Davies, Sia Ghelichkhan, and Ruby Turner

Reconstructing the thermo-chemical evolution of Earth’s mantle and its diverse surface manifestations is a grand challenge in the geosciences. Achieving this requires the development of a digital twin -- a dynamic digital representation of Earth’s mantle across space and time, constrained by observational data on the mantle’s structure, dynamics, and evolution. To this end, geodynamicists are increasingly exploring adjoint-based approaches, which reformulate mantle convection modelling as an inverse problem. In this framework, unknown model parameters are optimized to fit available observational data.

Traditionally, inverse geodynamic models have primarily focused on observations that constrain either the initial (inverse sense) or final (forward modelling sense) state of the system, such as seismic tomography and geodesy. However, additional observational constraints are needed to rigorously reconstruct the mantle’s evolution over geological time. Surface plate velocities, their time-dependent behaviour, and plate boundary characteristics provide critical constraints. Another untapped dataset is the geochemistry of intra-plate volcanic lavas, which reflects the depth and temperature of mantle melting at the time of eruption. This geochemical signature provides insights into lithospheric thickness (the ‘lid’) and underlying thermal structure, extending our ability to constrain mantle evolution into the past.

Here, we present early efforts to incorporate mantle geochemistry into adjoint models of mantle convection using the Geoscientific ADjoint Optimisation PlaTform (G-ADOPT -- https://gadopt.org/). Our synthetic experiments demonstrate that geochemical constraints on temperature and pressure enhance the accuracy of reconstructed mantle flow trajectories, unlocking insights into dynamic processes and interactions previously obscured in mantle retrodiction models. This integration offers the potential for a transformative leap in resolving mantle evolution, illuminating the interplay between deep Earth dynamics and surface processes that shape our planet’s geological history.

How to cite: Davies, R., Ghelichkhan, S., and Turner, R.: Enhancing Adjoint Reconstructions of Earth’s Mantle with Geochemical Data from Intra-Plate Lavas, EGU General Assembly 2025, Vienna, Austria, 27 Apr–2 May 2025, EGU25-8681, https://doi.org/10.5194/egusphere-egu25-8681, 2025.

One of the surface expressions of mantle convection is dynamic topography, as the the surface is uplifted above upwellings and pulled down above downwellings. However, it is challenging to extract the topography signal from the convecting mantle, because of large isostatic topography contributions from within the crust and subcrustal lithosphere. Technically, the latter can be included as part of dynamic topography but that needs to be clearly specified to avoid confusion. Here we use two recent crustal models to subtract crustal isostasy, and show that the remaining (residual) topography signal as well as the geoid can be matched well by a model where density anomalies and temperatures in the subcrustal mantle are inferred from seismic tomography. The model uses depth-dependent viscosity, and lateral variations due to temperature dependence below depth 219 km, and the distinction between (thicker) cratons, thinner lithosphere elsewhere and weak plate boundaries above that depth. We show that the fit can be improved if, in addition to densities inferred from tomography, a negative buoyancy between zero and about -40 kg/m^3 is added in continental lithosphere, in particular in cratons. The exact amount depends on model specifics, especially which crustal and tomography models are used. In our model, this buoyancy is added in the entire lithosphere, however, in reality, chemical buoyancy may be prevalent in certain depth regions. To address that issue we follow an approach similar to Wang et al. (Nature Geoscience, 16, 637–645, 2023) and plot the difference between dynamic topography from only sub-lithospheric density anomalies, and residual topography after only subtracting crustal isostatic topography against lithosphere thickness derived from tomography. The slope of this plot gives an indication of lithospheric density anomalies. For our best-fitting combination of dynamic and residual topography, we find a break in slope from nearly zero above 150 km to a negative slope below. This indicates that chemical density anomalies that cause lithospheric buoyancy are concentrated in the upper ~150 km.

How to cite: Steinberger, B. and Cui, R.: Modeling geoid and dynamic topography from tomography-based thermo-chemical density anomalies in the lithosphere and convecting mantle beneath  , EGU General Assembly 2025, Vienna, Austria, 27 Apr–2 May 2025, EGU25-8840, https://doi.org/10.5194/egusphere-egu25-8840, 2025.

EGU25-10156 | ECS | Orals | GD1.2

Tomotectonic reconstructions validated via mantle circulation models in a closed-loop experiment 

Yi-Wei Chen, Jonny Wu, Hans-Peter Bunge, Ingo Stotz, Gabriel Robl, and Bernhard S.A. Schuberth

Mantle slabs imaged by seismic tomography provide complementary subsurface information that could improve global plate reconstructions because they are indications of ancient tectonic plates. Linking mantle slabs to the surface plates requires approaches that follow geodynamic principles in a highly vigorous mantle. Here, we propose a new workflow that couples a slab unfolding approach and a mantle circulation model through which tomotectonic reconstructions can be performed, evaluated, and improved in a closed-loop experiment. We found that intra-oceanic subductions are crucial for understanding the evolution of the mantle and surface tectonics in the Pacific realm. Our closed-loop experiment allows us to reinterpret published tomotectonic reconstructions based on the vertical sinking slabs hypothesis. We conclude that highly vigorous mantle flow that allows lateral slab transport up to 4,000 km and non-constant sinking rates that deviate by up to 10 mm yr-1 locally within a 1,000 km area must be accounted for in tomotectonic reconstructions.

How to cite: Chen, Y.-W., Wu, J., Bunge, H.-P., Stotz, I., Robl, G., and Schuberth, B. S. A.: Tomotectonic reconstructions validated via mantle circulation models in a closed-loop experiment, EGU General Assembly 2025, Vienna, Austria, 27 Apr–2 May 2025, EGU25-10156, https://doi.org/10.5194/egusphere-egu25-10156, 2025.

EGU25-10765 | ECS | Orals | GD1.2

New Insights into Plume Buoyancy Fluxes and Dynamic Topography from Numerical Modelling 

Ziqi Ma, Maxim Ballmer, and Antonio Manjón-Cabeza Córdoba

Mantle plumes are hot upwellings that transport heat from the core to the base of the lithosphere, and sample lowermost-mantle chemical structure. Plume buoyancy flux is a crucial parameter measuring the mass and heat mantle upwellings bring to the surface. However, the calculation of the global plume buoyancy fluxes is still in contention. Hotspot swells (topographically high regions with elevations of up to 2~3 km and widths of up to ~1500 km) are diagnostic surface expressions of mantle plumes.

Traditional approaches to calculate the swell buoyancy flux are based on two assumptions: (1) the asthenosphere moves at the same speed as the overriding plate; (2) hotspot swells are fully isostatically compensated, in other words, the seafloor is uplifted due to the isostatic effect of replacing ”normal” asthenosphere with hot plume material. However, at least some plumes (e.g., Iceland) can move faster than the corresponding plate motion. Also, hotspot swells are partly dynamically compensated as plume material is injected into the upper mantle. With increasingly accurate observational constraints for dynamic seafloor topography, it is time to update plume buoyancy fluxes globally and build a scaling law between the surface dynamic topography and plume buoyancy flux.

Here, we conduct thermomechanical models to study plume-lithosphere interaction and hotspot swell support. We use the finite-element code ASPECT in a high-resolution, regional, 3D Cartesian framework. We consider composite diffusion-dislocation creep rheology and a free-surface boundary at the top. We systematically investigate the effects of plume excess temperature, plume radius, plate velocity and age, and mantle rheological parameters. From these results for plume spreading beneath moving plates, the buoyancy fluxes of individual plumes, as well as the relevant plume temperatures and radii are quantitatively constrained. We find that: (1) for a fixed plume radius, higher plume excess temperature results in higher but not necessarily wider swell; (2) plume buoyancy flux is linearly proportional to swell height × width2; (3) both faster plate velocities and older plates result in a lower swell height; (4) Lower upper mantle viscosity results in a wider but lower swell provided at a fixed plume buoyancy flux.

We demonstrate that previous swell-geometry-based estimates underscore the true buoyancy fluxes of the underlying plume upwelling. We update the plume-flux catalogue by building a scaling law for buoyancy flux as a function of swell geometry in order to estimate global heat and material fluxes carried by plumes.  

How to cite: Ma, Z., Ballmer, M., and Manjón-Cabeza Córdoba, A.: New Insights into Plume Buoyancy Fluxes and Dynamic Topography from Numerical Modelling, EGU General Assembly 2025, Vienna, Austria, 27 Apr–2 May 2025, EGU25-10765, https://doi.org/10.5194/egusphere-egu25-10765, 2025.

The Earth's palaeomagnetic record reveals the existence of a global magnetic field persisting for at least 3.4 billion years. This geomagnetic field is generated by thermochemical convection, driven by the cooling of the Earth's core. Efficient cooling of the core is crucial to sustaining the magnetic field. The solid mantle plays thus a critical role in regulating the core's long-term evolution. Notably, efficient mantle cooling resulting from plate tectonics is important for sustaining the magnetic field observed in the geological record up to the present day.

However, the timing of the onset of modern-style plate tectonics remains an open question. It may have been active since the Earth's formation (~4.5 billion years ago), or since the Archean (4 – 3 billion years ago), or emerged much more recently (<1 billion years ago). When and how plate tectonics began are major scientific questions in Earth science because of their profound implications for Earth's thermal and magnetic history. The convection regime that preceded plate tectonics remains unclear. Observations of other planetary bodies in the solar system such as Mars, Mercury, and the Moon suggest that a stagnant lid regime—characterized by a single and immobile plate—is the norm. This raises the possibility that early Earth operated under a stagnant lid regime, which is significantly less efficient at dissipating heat. Such inefficient cooling would limit the capacity to sustain a long-lived magnetic field, unlike the plate tectonics regime.

Our study aims to constrain the mantle-core co-evolution by investigating the impact of these two convection regimes—stagnant lid and plate tectonics (i.e. mobile lid)—and their transition during Earth's geological evolution. To achieve this, we developed a coupled model that integrates two one-dimensional evolution frameworks. One model describes the core's thermochemical evolution, including inner core crystallization and the potential formation of a thermally stratified layer. The other describes mantle dynamics, allowing for either stagnant lid or mobile lid behaviour.

We systematically explored a wide range of mantle parameters such as mantle viscosity, the relative efficiency of stagnant - versus mobile-lid regimes, the timing of plate tectonics onset, and the mantle's and core initial temperatures. For the core, we focused on two  end-member scenarios to account for the low and high thermal conductivity of iron whose precise determination remains controversial. We compared the resulting model predictions with key constraints, including the present-day inner core size, the palaeomagnetic record, the evolution of the mantle potential temperature, and the present-day thickness of a thermally stratified stable layer at the top of the liquid core. This integrated approach sheds light on the interplay between mantle dynamics and core processes since the time of Earth’s formation.

How to cite: Bonnet Gibet, V. and Tosi, N.: The effect of different mantle convection regimes on the long-term thermochemical evolution of the Earth’s core., EGU General Assembly 2025, Vienna, Austria, 27 Apr–2 May 2025, EGU25-11498, https://doi.org/10.5194/egusphere-egu25-11498, 2025.

EGU25-11583 | ECS | Posters on site | GD1.2

Tracking dynamic topography through hiatus surfaces 

Berta Vilacís, Hamish Brown, Sara Carena, Jorge N. Hayek, Ingo L. Stotz, Hans-Peter Bunge, and Anke M. Friedrich

The planform is a defining feature of mantle convection and it can be gleaned from the stratigraphic record by mapping the continent-scale sediment distribution. Positive and negative surface deflections induced by mantle convection (dynamic topography) imprint the stratigraphic record at inter-regional scales. Dynamically uplifted continental regions create erosional/non-depositional environments which lead to gaps in the stratigraphic record, known as sedimentary hiatuses. Contrarily, subsided regions result in continuous sedimentation.
We use continental- and country-scale digital geological maps, regional geological maps, online geological databases, correlation charts, drill logs and regional stratigraphic studies, at a temporal resolution of geological series (ten to tens of millions of years) to map these events through geological time. This results in the hiatus maps---a proxy for the interregional patterns of uplift and subsidence associated with dynamic topography.
We carry this out for all continents apart from Antarctica for eight geological series since the Upper Jurassic and obtain a proxy for dynamic topography for each geological series. We study the temporal and spatial changes of the hiatus surfaces, their correlation with flood basalts eruptions, and the effects of sea-level variation in the resulting maps. Moreover, we also study the manual and digital approaches employed in the mapping of these hiatus surfaces.

.

How to cite: Vilacís, B., Brown, H., Carena, S., Hayek, J. N., Stotz, I. L., Bunge, H.-P., and Friedrich, A. M.: Tracking dynamic topography through hiatus surfaces, EGU General Assembly 2025, Vienna, Austria, 27 Apr–2 May 2025, EGU25-11583, https://doi.org/10.5194/egusphere-egu25-11583, 2025.

EGU25-11593 | Posters on site | GD1.2

Structural Geological Characterization of Active Fault Zones in the Frontal Bavarian Forest and Implications for Large-Scale Cause-Effect Relationships of Tectonic Activity in the Bavarian Crystalline Basement (StruCtiv) 

Anke Friedrich, Alina Ludat, Mjahid Zebari, Sara Carena, Dominic Hildebrandt, Beth Kahle, Donja Assbichler, and Mugabo Dusingizimana

The StruCtiv project, funded by and in collaboration with the Geological Survey of Bavaria (Bayerisches Landesamt für Umwelt, Hof), focuses on the structural geological characterization of active fault zones in the Frontal Bavarian Forest and explores their implications for large-scale cause-effect relationships of tectonic activity within the crystalline basement of the Bavarian Forest. Our findings provide new insights into the tectonic, petrological, structural, and geomorphological processes shaping the region while highlighting the need for further investigations to refine our understanding of these complex systems.  Preliminary U–Pb and K–Ar dating of minor faults exposed in granite quarries reveal a multiphase tectonic evolution spanning the Eocene to the Pleistocene, with possible indications of recent activity. U–Pb dating of calcite has proven especially promising, though additional sampling and structural characterization are required to address variability in ages within quarry outcrops. Complementary geomorphological analyses and cosmogenic nuclide measurements of river sediments show regional differences in erosion rates (21–40 m/Myr) and topographic variations, reflecting differential uplift rates. We used high-resolution TanDEM-X data and cosmogenic nuclide dating of older fluvial terraces to explore the long-term interactions between tectonics, climate, and erosion.  Deliverables from the first project phase include ten high-resolution 3D models of quarries in the Bavarian Forest, structural measurements, dating of fault surfaces, and geomorphological analyses. These results have identified episodic fault reactivation from the post-Variscan to late Cenozoic periods. Landscape analyses based on chi-index and knickpoint studies and cosmogenic nuclide dating provide a consistent picture of the region's landscape evolution. Together, these findings suggest differential tectonic uplift across the Bavarian Forest.  The ongoing project aims to build on these results through expanded structural and geochronological studies, the development of 3D models in additional quarries, and further digital mapping of structural inventories. The outcomes will deepen our understanding of fault-system evolution in continental intraplate settings and their role in understanding the long-wavelength vertical motion of the Earth's surface.

How to cite: Friedrich, A., Ludat, A., Zebari, M., Carena, S., Hildebrandt, D., Kahle, B., Assbichler, D., and Dusingizimana, M.: Structural Geological Characterization of Active Fault Zones in the Frontal Bavarian Forest and Implications for Large-Scale Cause-Effect Relationships of Tectonic Activity in the Bavarian Crystalline Basement (StruCtiv), EGU General Assembly 2025, Vienna, Austria, 27 Apr–2 May 2025, EGU25-11593, https://doi.org/10.5194/egusphere-egu25-11593, 2025.

EGU25-11599 | ECS | Orals | GD1.2

From seismic models to mantle temperatures: Uncertainties and implications for geodynamic simulations 

Gabriel Robl, Bernhard Schuberth, Isabel Papanagnou, and Christine Thomas

Many geophysical studies require knowledge on the present-day temperature distribution in Earth's mantle. One example are geodynamic inverse models, which utilize data assimilation techniques to reconstruct mantle flow back in time. The thermal state of the mantle can be estimated from seismic observations with the help of thermodynamic models of mantle mineralogy. However, the temperature estimates are significantly affected by inherent limitations in both the seismic and mineralogical information, even in the case of (assumed) known chemical composition.

Using a synthetic closed-loop experiment, we quantify the theoretical ability to determine the thermal state of the mantle from tomographic models. The 'true' temperature distribution is taken from a 3-D mantle circulation model with Earth-like convective vigour. We aim to recover this reference model after: 1) mineralogical mapping from the 'true' temperatures to seismic velocities, 2) application of a tomographic filter to mimic the effect of limited seismic resolution, and 3) mapping of the 'imaged' seismic velocities back to temperatures. We test and quantify the interplay of tomographically damped and blurred seismic heterogeneity in combination with different approximations for the mineralogical 'inverse' conversion from seismic velocities to temperature. Our results highlight that, given the current limitations of seismic tomography and the incomplete knowledge of mantle mineralogy, magnitudes and spatial scales of a temperature field obtained from global seismic models will deviate significantly from the true state, with average deviations up to 200 K in the deep mantle. Large systematic errors furthermore exist in the vicinity of phase transitions due to the associated mineralogical complexities.

The inferred present-day temperatures can be used to constrain buoyancy forces in time-dependent geodynamic simulations. Initial errors in the temperature field might then grow non-linearly due to the chaotic nature of mantle flow. This could be particularly problematic in combination with advanced implementations of compressibility, in which densities are extracted from thermodynamic mineralogical models with temperature-dependent phase assemblages. Erroneous temperatures in this case might activate 'wrong' phase transitions and potentially flip the sign of the associated Clapeyron slopes, thereby considerably altering the model evolution.

How to cite: Robl, G., Schuberth, B., Papanagnou, I., and Thomas, C.: From seismic models to mantle temperatures: Uncertainties and implications for geodynamic simulations, EGU General Assembly 2025, Vienna, Austria, 27 Apr–2 May 2025, EGU25-11599, https://doi.org/10.5194/egusphere-egu25-11599, 2025.

EGU25-11831 | Orals | GD1.2

Linking Plate Kinematics and True Polar Wander over the last 250 Myrs 

Boris Robert, Clinton Phillips Conrad, Bernhard Steinberger, and Mathew Michael Domeier

The flux of subducting slabs into the mantle is an essential component of the Earth’s mantle convection. However, the slab flux remains poorly known for pre-Jurassic times because of the absence of preserved oceanic seafloor. Sinking of subducted slabs within the mantle perturbs Earth’s moment of inertia, which, in addition to perturbations related to upwellings, results in long-term motion of the solid Earth relative to the rotation axis, resulting in so-called True Polar Wander (TPW). This motion, which can be inferred using paleomagnetic data, should therefore yield crucial information about the large-scale subduction kinematics back in time. However, it is not yet clear how to separate the numerous contributions to TPW, since these result from the superimposition of a complex distribution of mantle mass heterogeneities that are advected through time. In this study, we developed a new approach to assess the impact of subducting slabs on TPW based on the harmonic decomposition of plate kinematics into large-scale patterns. We constructed simple plate models that yielded pure dipole and pure quadrupole and net stretching kinematics, which represent the spherical harmonic degree 1 and degree 2 components of relative plate motions, respectively. We then implemented these three patterns of large-scale plate motions, and their subduction zones, into three simple mechanistic models and computed mantle mass heterogeneities through time. We then calculated changes to Earth’s moment of inertia tensor to predict the resulting TPW. In this contribution, we will first show the results of these sensitivity experiments highlighting the evolution of inertia perturbations associated to each of these three large-scale patterns. We will then show the calculated TPW using the harmonic decomposition of full-plate models over the last 250 Myrs and discuss the influence of each of these three plate kinematic components on the observed TPW. Finally, we will discuss how the observed TPW can help better constrain the evolution of mantle mass heterogeneities and rates of subduction flux for past times.

How to cite: Robert, B., Conrad, C. P., Steinberger, B., and Domeier, M. M.: Linking Plate Kinematics and True Polar Wander over the last 250 Myrs, EGU General Assembly 2025, Vienna, Austria, 27 Apr–2 May 2025, EGU25-11831, https://doi.org/10.5194/egusphere-egu25-11831, 2025.

Constraining the long-term evolution of geoid anomalies is essential for unraveling Earth's internal dynamics. While most studies focus on present-day geoid snapshots, we reconstruct the time-dependent evolution of Earth’s strongest geoid depression, the Antarctic Geoid Low (AGL), over the Cenozoic. Unlike geodetic reference frames that place the deepest geoid low in the Indian Ocean, a geodynamic perspective (relative to a hydrostatic ellipsoid) reveals the strongest nonhydrostatic geoid depression actually resides over Antarctica. Using a back-and-forth nudging technique for time-reversed mantle convection modeling, we leverage 3-D mantle density structures derived from seismic tomography and geodynamic constraints. Our results show that the AGL has persisted for at least ~70 Myr, undergoing a major transition in amplitude and position between 50 and 30 Ma. This coincides with abrupt lateral shifts in Earth’s rotation axis at ~50 Ma, validated through paleomagnetic constraints on True Polar Wander. Initially, stable lower mantle contributions dominated the AGL, but over the past ~40 Myr, increasing upper-mantle buoyancy, particularly above ~1300 km depth, amplified the AGL magnitude. This shift stems from the interplay between long-term deep subduction beneath the Antarctic Peninsula and a buoyant, thermally driven upwelling of hot, low-density material from the lowermost mantle. These new results contrast with earlier interpretations, clarifying the crucial role of evolving mantle buoyancy in shaping global geoid anomalies. By incorporating seismic, geodynamic, and mineral-physics data, our reconstructions provide a more comprehensive understanding of mantle flow beneath Antarctica and offer new insights into the dynamic coupling between lower and upper mantle processes that govern Earth’s long-wavelength geoid evolution.

How to cite: Glišović, P. and Forte, A.: The Cenozoic Evolution of Earth’s Strongest Geoid Low: Insights into Mantle Dynamics below Antarctica, EGU General Assembly 2025, Vienna, Austria, 27 Apr–2 May 2025, EGU25-12626, https://doi.org/10.5194/egusphere-egu25-12626, 2025.

EGU25-12820 | ECS | Orals | GD1.2

Dynamic and seismic expressions of mineral phase transitions in mantle circulation models computed with TerraNeo 

Isabel Papanagnou, Bernhard S. A. Schuberth, Gabriel Robl, Roman Freissler, Ponsuganth Ilangovan, Eugenio D'Ascoli, Berta Vilacís, Hamish Brown, Anna Schneider, Andreas Burkhart, Nils Kohl, Yi-Wei Chen, Ingo Stotz, Marcus Mohr, and Hans-Peter Bunge

One major objective in geodynamics is to create models of mantle flow that provide quantitative information to other Earth science disciplines. In this respect, geologically informed fluid dynamics simulations, such as mantle circulation models (MCMs) are a key component. In addition, thermodynamic models of mantle mineralogy are essential in that they can provide detailed information on material behaviour, such as density, thermal expansivity, elastic parameters and specific heat capacity, as a function of pressure and temperature for the geodynamic simulations. They are also required in the assessment of the MCMs to link temperatures to seismic velocities and density. This way, a number of secondary predictions, such as seismic, geodetic and geologic data, can be computed, which enables the validation of our models and the testing of geodynamic hypotheses by comparison to observations.

Here, we focus specifically on the dynamic effects and seismic imprint of the mantle transition zone (TZ). The complex set of phase transformations, together with an increase in viscosity, in this depth range is expected to influence vertical mass flow between upper and lower mantle. Still, neither the associated dynamic effects nor the seismic structure of the TZ have conclusively been constrained to date. Using our highly scalable new mantle convection software TerraNeo, based on the matrix-free finite-element framework HyTeG, we present a suite of MCMs with different formulations of compressibility. Classically, compressibility is included in the mantle convection simulations in form of the truncated anelastic liquid approximation (TALA), and the effects of phase transformations are either neglected or incorporated in parametrized form at constant depth. A physically more complete treatment of compressibility has recently been introduced in the form of the ‘Projected Density Approximation’ (PDA; Gassmöller et al., 2020). The PDA is based on tabulated material properties from the thermodynamic mineralogical models, thus allowing us to self-consistently capture non-linear buoyancy effects specifically due to phase transitions in the simulation. Comparing MCMs using TALA and PDA, we will highlight effects of mineral phase transitions on the evolution of mantle flow over time, the resulting present-day temperature field, as well as its seismic signature.

How to cite: Papanagnou, I., Schuberth, B. S. A., Robl, G., Freissler, R., Ilangovan, P., D'Ascoli, E., Vilacís, B., Brown, H., Schneider, A., Burkhart, A., Kohl, N., Chen, Y.-W., Stotz, I., Mohr, M., and Bunge, H.-P.: Dynamic and seismic expressions of mineral phase transitions in mantle circulation models computed with TerraNeo, EGU General Assembly 2025, Vienna, Austria, 27 Apr–2 May 2025, EGU25-12820, https://doi.org/10.5194/egusphere-egu25-12820, 2025.

EGU25-12871 | ECS | Orals | GD1.2

A tomographic testbed for geodynamic reconstructions of past mantle flow 

Roman Freissler, Bernhard S.A. Schuberth, Christophe Zaroli, and Hans-Peter Bunge

Reconstructions of past mantle flow provide a powerful framework to sharpen our understanding of the dynamics and structure of the deep Earth. As a data-driven approach to geodynamic modelling, these reconstructions explicitly require an estimate of the present-day thermal state of the mantle, which can be derived from seismic tomography and an interpretation of observed mantle heterogeneity with mineral physics. Nonetheless, various uncertainties complicate the direct use of tomographic images. Critical issues are the spatially heterogeneous imaging quality, and the lack of definite metrics for seismic resolution and a practical quantification of model uncertainty. In many regions the patterns, but especially the amplitudes of velocity variations, are thus insufficiently constrained, making global tomography prone to drawing a dynamically inconsistent picture of the mantle’s buoyancy field. For geodynamic inferences, it is therefore vital to establish to what degree these current limitations affect our capacity to accurately reconstruct the mantle’s evolution back in time, and, where necessary, what strategies can be advised to address their impact.

We introduce a tomographic-geodynamic framework designed to tackle this issue with the aid of closed-loop experiments. Based on a reference mantle circulation model (MCM), we set up a complete, synthetic tomographic experiment with the following key components: 1) S-wave finite-frequency traveltime residuals are obtained from seismograms predicted for the MCM, recorded at ~10,000 real station locations. Therefore, we use the global wave propagation code SPECFEM3D_GLOBE to simulate in total 3,800 teleseismic earthquakes accurate down to a shortest period of ~10s. 2) We sample the complete dataset on the basis of ray turning point locations to obtain an optimal and balanced illumination of the entire mantle. 3) We perform tomographic inversions with the SOLA method and paraxial finite-frequency kernels. The explicit computation of the inverse and the corresponding resolving kernels in SOLA allow us to create tomographically filtered representations of the `true` MCM heterogeneity. Furthermore, it gives us the possibility to analyze them together with associated local resolution and uncertainty estimates. The resulting synthetic tomographic images are generally able to reproduce the patterns of major anomalies from the MCM. Yet, the amplitudes and exact shapes remain difficult to recover, even in the case of optimized data coverage and tuning of inversion parameters towards highly localized and narrow resolving kernels. This work serves as the basis for subsequent testing of the tomographic input within adjoint mantle flow reconstructions to complete the closed-loop setup.

How to cite: Freissler, R., Schuberth, B. S. A., Zaroli, C., and Bunge, H.-P.: A tomographic testbed for geodynamic reconstructions of past mantle flow, EGU General Assembly 2025, Vienna, Austria, 27 Apr–2 May 2025, EGU25-12871, https://doi.org/10.5194/egusphere-egu25-12871, 2025.

EGU25-12880 | ECS | Orals | GD1.2 | Highlight

Probing the influence of the mantle viscosity profile on the density spectrum and its effect on present-day surface observations  

Hamish Brown, Ingo L. Stotz, and Hans-Peter Bunge

Mantle convection drives large-scale vertical motion at the surface (dynamic topography), which is linked to present-day geoid undulations and residual topography. However, this link depends crucially on the mantle viscosity profile, which remains one of the largest uncertainties in global geodynamics. While instantaneous flow models based on seismic tomography have provided classic constraints on mantle viscosity structure, here the profile acts only to map a given density structure to surface observations. This means the viscosity profile is not necessarily consistent with the density structure. Here we tackle this problem using a suite of high-resolution time-dependent mantle circulation models which assimilate plate velocities over the past 400 Myrs. This allows us to study the role of the mantle viscosity profile in altering the density structure of the mantle through the planform of convection, in tandem to its role in mapping this to the surface through kernels. We find that the changes in the spherical harmonic density spectrum of the mantle, which result from a given change in the profile, can alter surface observations with the same magnitude as the changes to the kernel. The coupled influence of the profile on the mantle density spectrum and kernels, together with observed geoid undulations and residual topography, provides a new method of constraining the mantle viscosity profile using time-dependent convection modelling. 


How to cite: Brown, H., Stotz, I. L., and Bunge, H.-P.: Probing the influence of the mantle viscosity profile on the density spectrum and its effect on present-day surface observations , EGU General Assembly 2025, Vienna, Austria, 27 Apr–2 May 2025, EGU25-12880, https://doi.org/10.5194/egusphere-egu25-12880, 2025.

EGU25-13580 | ECS | Posters on site | GD1.2

Characterization of ferropericlase under extreme condition using shock wave experiments carried at European XFEL utilizing DiPOLE 100-X drive laser 

Carolina Camarda, Karen Appel, Khachiwan Buakor, Alexis Amouretti, Celine Crepisson, Marion Harmand, Lea Pennacchioni, Melanie Sieber, and Christian Sternemann

Ferropericlase (Mg,Fe)O, is the second most abundant mineral in the Earth’s lower mantle, and it’s structural and electronic properties are critical for understanding the formation processes and evolutionary history of the Earth's core.

This study focuses on the behavior of ferropericlase under extreme conditions that simulate the environment near the core-mantle boundary (CMB) and within the outer core, at pressures around 130 GPa and temperatures of about 3500 K related to a depth of approximately 2800 km by using shock compression experiments. It is well-documented that FeO exhibits varying structural configurations under high pressure and temperature [1] and iron electron spin changes [2]. This study aims at deepening understanding of ferropericlase's role in geophysical processes occurring at extreme conditions within Earth’s interior, ultimately contributing valuable insights into core formation theories and mantle dynamics. To investigate these properties, we synthesized ferropericlase (Fe0.14Mg0.86O) samples resembling pyrolytic mantle composition suitable for dynamic compression experiments. The experiments were conducted at the High Energy Density Scientific instrument at European XFEL within the scope of the DiPOLE community proposal 6656, utilizing time-resolved diagnostics to capture changes in the material's structure and electronic state. Two X-rays pulses were synchronized with a target impact, one before and another after the drive laser pulse of the DiPOLE 100-X laser, which allow us to probe the sample in a cold state and under pressure and temperature. The setup enabled us to acquire multiple datasets, including Velocity Interferometry for Any Reflector (VISAR) images, X-ray emission spectroscopy (XES), and X-ray diffraction (XRD). Data processing involved several steps: XES, spectra of Fe Kβ1,3 lines were analyzed for both pulses separately ensuring accurate timing of X-ray arrivals. XRD data underwent flat fielding correction followed by summation of diffraction patterns to calculate unit cell parameters for ferropericlase.

The XES data reveal a clear transition from high-spin to low-spin states as a function of laser energy and delay relative to the ambient conditions. Concurrently, XRD analysis shows a notable shift to larger momentum transfer in the main Bragg peak compared to cold runs, allowing for precise calculation of unit cell dimensions under varying pressure conditions. By integrating our initial findings with established equations of state (EoS) [3] we can estimate the pressure conditions at each experimental shot, indicating the variation of pressures up to ~130 GPa, i.e. conditions at the CMB. This analysis facilitates the construction of a volume-pressure curve that elucidates spin transitions relevant to Earth's depths. Next step consists in analyze VISAR data and get the Hugoniot for this composition. Furthermore, we aim to understand the electronic structure of the melts.

[1] Ozawa et al.  Spin crossover, structural change, and metallization in NiAs-type FeO at high pressure. Phys. Rev. B 84, 134417 (2011)

[2] Greenberg et al. Phase transitions and spin state of iron in FeO under the conditions of Earth's deep interior. Phys. Rev. B 107, L241103 (2023)

[3] Fei et al. Spin transition and equations of state of (Mg, Fe)O solid solutions. Geophys. Res. Lett., 34, L17307 (2007)

How to cite: Camarda, C., Appel, K., Buakor, K., Amouretti, A., Crepisson, C., Harmand, M., Pennacchioni, L., Sieber, M., and Sternemann, C.: Characterization of ferropericlase under extreme condition using shock wave experiments carried at European XFEL utilizing DiPOLE 100-X drive laser, EGU General Assembly 2025, Vienna, Austria, 27 Apr–2 May 2025, EGU25-13580, https://doi.org/10.5194/egusphere-egu25-13580, 2025.

EGU25-13762 | ECS | Orals | GD1.2

Unveiling Late Cenozoic Dynamic Topography Evolution Using Non-Linear Adjoint Models 

Siavash Ghelichkhan, David Rhodri Davies, Angus Gibson, and Dale Roberts

Mantle convection is the principal driver of Earth's long-wavelength surface structure, manifesting as dynamic topography—surface undulations induced by convective currents within the mantle. Unveiling the temporal evolution of dynamic topography remains a central challenge in predictive geodynamics. Adjoint methods have recently gained prominence for reconstructing mantle convection history and correlating it with key geological phenomena, including the cessation of marine inundation in North America, the uplift of Africa, and the tilting of Australia.

In this study, we introduce a new generation of retrodiction models developed using the Geoscientific ADjoint Optimisation PlaTform (G-ADOPT). These models incorporate Earth-like rheological parameters and leverage state-of-the-art Global Full‐Waveform seismic tomography to achieve unparalleled resolution of mantle structures. The models are refined through integration with the latest plate reconstruction models, yielding regularised solutions that reconcile tectonic and seismic observations.

For the first time, we unveil the evolution of dynamic topography during the late Cenozoic, as derived from these advanced models. These results provide novel insights into the interplay between mantle convection and surface processes, refining constraints on dynamic topography and illuminating the forces that have governed Earth’s geological evolution.


How to cite: Ghelichkhan, S., Davies, D. R., Gibson, A., and Roberts, D.: Unveiling Late Cenozoic Dynamic Topography Evolution Using Non-Linear Adjoint Models, EGU General Assembly 2025, Vienna, Austria, 27 Apr–2 May 2025, EGU25-13762, https://doi.org/10.5194/egusphere-egu25-13762, 2025.

EGU25-14576 | ECS | Orals | GD1.2

Cold Mantle Transition Zone Gap Formed by Progressive Tearing of the Segmented Western Pacific Slab 

Jung-Hun Song, Junkee Rhie, Seongryong Kim, and Benoit Tauzin

Complex interactions between plate subduction, mantle flow, and the overriding plate govern the dynamics of subduction zones. Numerous studies have highlighted the critical role of subduction processes in redistributing thermo-chemical domains within the mantle, significantly influencing mantle dynamics and plate tectonics. However, debates persist regarding the thermal conditions and dynamic models of the mantle affected by stagnant slabs. The physical state and long-term dynamics of the mantle surrounding stagnant slabs in the mantle transition zone (MTZ) remain poorly understood, partly due to the lack of detailed reconstructions of subduction history and robust constraints on mantle temperatures. 

The northwestern Pacific region, with its extensive subduction history spanning over 40 million years and involving multiple oceanic plates with episodic plate boundary modifications, provides an ideal setting for studying subducting slab structures and their associated tectonic and dynamic processes. High-resolution seismic tomography of the MTZ beneath the coastal margins of northeast Asia has revealed a narrow channel of low-velocity anomalies surrounded by high-velocity regions, indicating the presence of segmented western Pacific stagnant slabs. The geometric features of these imaged structures likely reflect rapid plate boundary reorganization during the Cenozoic in the western Pacific, driven by continuous lateral extension and tearing of the retreating Pacific slab. This process has led to the formation of a laterally extended MTZ gap characterized by moderate mantle temperatures (Tp ~1350–1450°C), as determined through joint analyses of seismic velocities and mantle phase transition thicknesses.

We propose that the current MTZ gap in the western Pacific exhibits minimal thermal anomalies capable of inducing focused mantle upwellings. Our observations suggest that mantle dynamics around the stagnant slabs would be largely passive, unless thermochemical sources capable of driving active convection are present. This further implies that active mantle upwellings, if they existed, were spatially and temporally constrained during past slab segmentation processes.

How to cite: Song, J.-H., Rhie, J., Kim, S., and Tauzin, B.: Cold Mantle Transition Zone Gap Formed by Progressive Tearing of the Segmented Western Pacific Slab, EGU General Assembly 2025, Vienna, Austria, 27 Apr–2 May 2025, EGU25-14576, https://doi.org/10.5194/egusphere-egu25-14576, 2025.

As a consequence of the evolution of the water-bearing basal magma ocean, water-induced mantle overturn can well account for many puzzling observations in the early Earth, such as the formation of the Archean continents and the boundary of the Archean and Proterozoic. The upwelling of the hot basal magma ocean during the mantle overturn also significantly affects the thermal state of the core-mantle boundary and the geomagnetic field. This study models the thermal evolution of the core-mantle boundary to investigate the effects of mantle overturn on the geomagnetic field. Our results demonstrate that mantle overturn substantially accelerates the cooling of the core and increases the heat flow across the core-mantle boundary. This enhanced heat flow strengthens the geomagnetic field, which well explains the high virtual dipole moments at ~3.5-2.5 Ga. The palaeomagnetic records and the formation of the Archean continents generate a concordant picture on the evolution of the water-induced mantle overturn. Additionally, the Earth's mass redistribution driven by the mantle overturn provides a novel mechanism for triggering true polar wander in the Archean. Therefore, the recorded apparent polar wander at 3.34-3.18 Ga may not result from plate tectonics.

How to cite: Wang, D. and Wu, Z.: Water-Induced Mantle Overturn Provides a Unifying Explanation for Palaeomagnetic Records and Formation of Archean Continents, EGU General Assembly 2025, Vienna, Austria, 27 Apr–2 May 2025, EGU25-14806, https://doi.org/10.5194/egusphere-egu25-14806, 2025.

EGU25-16300 | Posters on site | GD1.2

Time-Domain Analysis of Solid Earth Tides: A Pathway to Understanding Tectonic Dynamics 

Martina Capponi, Daniele Sampietro, and Filippo Greco

This study introduces a time-domain methodology for analyzing the response of solid Earth tides, focusing on their phase delay relative to maximum vertical gravitational attraction. Unlike traditional frequency-domain approaches, which primarily decompose tidal signals into harmonic components, the proposed method emphasizes temporal dynamics, offering higher resolution and fewer assumptions about signal periodicity.  

Solid Earth tides, driven by gravitational forces from the Moon and Sun, induce periodic deformations of the Earth's surface, known as tidal bulges. These bulges are expected to coincide with maximum gravitational attraction, but a measurable phase delay often occurs due to the Earth's internal rheological and viscoelastic properties. Understanding this delay is crucial for deciphering the complex interplay between tidal forces and tectonic processes, including stress evolution, crustal deformation, and even earthquake triggering mechanisms.  

To achieve this, the study analyzed high-precision gravity data from 14 permanent gravity stations in Europe, alongside GNSS-derived measurements of vertical surface displacement. Corrections were applied to isolate the gravitational effects of solid Earth tides, accounting for factors such as atmospheric pressure variations, ocean tidal loading, and direct gravitational attraction. The residual gravity signal, reflecting the solid Earth tidal bulge, was then examined for phase delay using time-domain algorithms.  

Key findings revealed significant variability in the phase delay across geographic and tectonic settings, suggesting localized geological factors influence the Earth’s response to tidal forcing. This delay, although small, was found to redistribute stresses within the crust and mantle, potentially affecting fault reactivation and long-term tectonic plate dynamics. The integration of GNSS data allowed a comprehensive view of vertical deformation, further validating the gravity-based findings.  

This time-domain approach provides a complementary perspective to frequency-domain analyses, capturing nonlinear and time-dependent effects often overlooked in traditional studies. By enhancing our understanding of tidal lag phenomena, the research contributes to refining models of lithospheric and asthenospheric dynamics. The methodology holds promise for broader applications in geophysical monitoring, offering insights into stress and strain evolution in tectonically active regions.  

These advancements pave the way for improved interpretations of solid Earth processes and their implications for natural hazards, resource management, and planetary dynamics. This study underscores the potential of integrating gravity and GNSS data for high-resolution analyses of Earth’s dynamic behavior.

How to cite: Capponi, M., Sampietro, D., and Greco, F.: Time-Domain Analysis of Solid Earth Tides: A Pathway to Understanding Tectonic Dynamics, EGU General Assembly 2025, Vienna, Austria, 27 Apr–2 May 2025, EGU25-16300, https://doi.org/10.5194/egusphere-egu25-16300, 2025.

Viscosity and thickness of Earth’s asthenosphere are typically inferred from observations of postglacial rebound of the lithosphere. Parameter values deduced from studies of these observations serve a wide range of geodynamic models that simulate processes evolving over time periods of hundred Myr - much longer than the duration of the rebound process itself. The question remains whether inferences derived from the kyr-long rebound process hold over Myr-long periods. The record of past motions of non-subducting plates may help address such a question, because these motions are necessarily driven by asthenospheric Poiseuille-type flow, which is sensitive to viscosity and thickness of the asthenosphere. Here I show how a simple model for the dynamics of non-subducting plates may be used to address the question whether parameter values derived from the kyr-long rebound hold over the longer time-scales of plate motions. By interrogating the reconstructed records of past motions of three non-subducting plates, I find that indeed this is the case. Furthermore, including also constraints on the asthenosphere thickness from seismic tomography narrows down the range of plausible values of asthenosphere viscosity to [1, 3]*10^19 Pa*s.

How to cite: Iaffaldano, G.: Viscosity and thickness of Earth’s asthenosphere: inferred from Kyr-long processes, applicable to Myr-long dynamics, EGU General Assembly 2025, Vienna, Austria, 27 Apr–2 May 2025, EGU25-16470, https://doi.org/10.5194/egusphere-egu25-16470, 2025.

EGU25-16517 | Orals | GD1.2

Fault evolution in the Kenya Dome: an area of highly elevated topography within the East African Rift System 

Beth Kahle, Simon Kübler, Chintan Purohit, Annett Junginger, Alastair Sloan, Anke Friedrich, Stefanie Rieger, and Mjahid Zebari
Mantle flow and the resulting surface deformation play a critical role in shaping continental rift systems; sublithospheric flow supports topography and applies tractions to the base of the non-convecting lid.  Surface observations of faulting, and of fault evolution through time, can be compared with predictions of flow from mantle convection models.  However, continental lithosphere is extremely heterogeneous and these heterogeneities apply a fundamental control on the way that the crust responds to stress.  It is therefore important to assess the contribution of factors such as crustal age, structural inheritance and seismogenic thickness to faulting patterns and the kinematics of continental deformation through time.  
The Kenya Rift is an area of high topography within the eastern, mainly volcanic, branch of the East African Rift System (EARS).  Within the Kenya Rift, the spatial distribution of fault activity is puzzling.  The rift is bounded by impressive border faults which often exceed 40 km in length, with shorter (typically less than 10 km long), more closely spaced faults in the centre of the rift.  These observations suggest that - as expected - fault activity has migrated towards the rift centre, accompanied by a reduction in seismogenic thickness, with time.  If this is correct, the area should pose a relatively low seismic hazard.  However, our intial remote sensing and field observations, combined with an earlier palaeoseismological study, suggest recent activity along the border faults.  Given the length of the border faults, and their large accumulated offset, widespread continuing activity would have significant implications for seismic hazard assessment in the area.  The potential for large-magnitude earthquakes originating from these major faults warrants a re-evaluation of tectonic activity and associated risks in this rapidly urbanising area. 
In addition, the border faults are locally oriented obliquely in comparison to the orientation of the faults in the rift centre, and compared to the present-day - largely E-W oriented - extension direction.  This observation has been used to infer a rotation of the stress field through time.  We use remote sensing data to map these structures in order to compare them with inherited structural orientations and with predictions of sub-lithospheric flow through time from mantle convection models.  These observations not only challenge assumptions about fault migration and rift evolution, but also underline the potential for complex interations between mantle flow, surface deformation and seismic hazard in continental rifts.

How to cite: Kahle, B., Kübler, S., Purohit, C., Junginger, A., Sloan, A., Friedrich, A., Rieger, S., and Zebari, M.: Fault evolution in the Kenya Dome: an area of highly elevated topography within the East African Rift System, EGU General Assembly 2025, Vienna, Austria, 27 Apr–2 May 2025, EGU25-16517, https://doi.org/10.5194/egusphere-egu25-16517, 2025.

EGU25-16588 | Orals | GD1.2

A 6-year quasi-periodicity in the Earth's core magnetic field dynamics from 1932 to 2022 

Roman Sidorov, Anatoly Soloviev, and Shamil Bogoutdinov

Recent studies suggest that the secular variation dynamics of the geomagnetic field exhibits periodic patterns that indicate underlying wave processes in the Earth’s core. However, as long as the analytical core field models are based on geographically sparse and noisy observatory data, they have apparent limitations for studying fine structure of its spatiotemporal variations. The advent of satellite measurements of the full geomagnetic field vector in 1999 removed this limitation and made it possible to produce reliable and highly accurate models of the secular variation, allowing downward continuation to the core-mantle boundary. These models have revealed rapid core field variations on a time scale of the order of 10 years. In particular, the 6-year quasi-periodicity in the second time core feld derivative has been established. In our recent research, we expand our previously successful efforts to extract the secular variation and secular acceleration signal from the magnetic observatory data over 90-year period (1932-2022), i.e. far before the advent of the space era. As a result, our approach to data analysis for the first time has made it possible to confirm the existence of a 3-year quasi-periodicity of secular acceleration pulses of alternating polarity over the mentioned period. The proposed methodology does not imply an intermediate production of a core field model, as done according to classical approaches.

How to cite: Sidorov, R., Soloviev, A., and Bogoutdinov, S.: A 6-year quasi-periodicity in the Earth's core magnetic field dynamics from 1932 to 2022, EGU General Assembly 2025, Vienna, Austria, 27 Apr–2 May 2025, EGU25-16588, https://doi.org/10.5194/egusphere-egu25-16588, 2025.

EGU25-16609 | ECS | Orals | GD1.2

Investigating deep mantle evolution by linking geodynamic modelling to seismic data 

Anna Schneider, Bernhard Schuberth, Paula Koelemeijer, Grace Shephard, Alex Myhill, and David Al-Attar

The alternation between superchrons and periods of rapid field reversals is comparable
to timescales of mantle convection, suggesting that lowermost mantle evolution impacts
the reversal frequency of the Earth’s magnetic field. By controlling the heat flow from
the outer core, the deep mantle temperature distribution can either support or hamper
the convective pattern in the outer core that generates the dipolar field component.

Due to the long timescales, the main means of testing a potential correlation between
reversal frequency rate and CMB heat flow distribution is through tectonically informed
geodynamic modelling. However, even though state-of-the-art mantle circulation models (MCMs) 
typically explain statistical properties of seismological data, they do not consistently 
reproduce the location of present-day mantle features. The main influence
on position is given by the assimilated absolute plate motion model, which is inherently
restricted by the lack of longitudinal constraints as well as the need to separate plate
motion and true polar wander signal in paleo-magnetic data. Geodynamic model predictions 
therefore need to be compared to independent observations.

In this contribution, we investigate predictions of present-day mantle structure that
are based on differences in the absolute plate motion model. We compute synthetic seismic
data by coupling MCM predicted structure with a thermodynamic mineralogical model.
The analysis is predominantly focused on normal mode data, as they capture the longwavelength 
component of structures throughout the entire mantle. In addition, the
global sensitivity of normal modes reduces the drawbacks of uneven data coverage. By
quantifying the fit to seismic data, we evaluate different realisations of mantle structure
that reflect plausible variations in the absolute plate motion history.

How to cite: Schneider, A., Schuberth, B., Koelemeijer, P., Shephard, G., Myhill, A., and Al-Attar, D.: Investigating deep mantle evolution by linking geodynamic modelling to seismic data, EGU General Assembly 2025, Vienna, Austria, 27 Apr–2 May 2025, EGU25-16609, https://doi.org/10.5194/egusphere-egu25-16609, 2025.

EGU25-17175 | Orals | GD1.2

Geophysical modelling of vertical motion processes constrained by geodetic and geological observations (UPLIFT) 

Hans-Peter Bunge, Anke Friedrich, Roland Pail, and Yi-Wei Chen

The Earth's lithosphere undergoes vertical motion on a range of spatial and temporal scales. In recent years it has become increasing clear that mantle related forcing and in particular mantle plumes are a significant contributor to uplift events in many regions of the world, making vertical motions a powerful probe into sublithospheric processes. Significant improvements of observational methods (e.g. satellite missions) and publicly-accessible databases (e.g. digital geological maps) make it now feasible to map vertical motions from geodetic to geologic time scales. This in turn provides invaluable constraints to inform key, yet uncertain, parameters (e.g. rheology) of geodynamic models. Here we report results of an ongoing Research Training Group (RTG) 2698, with 10 individual dissertation projects and a Post-doc project, funded by the German Research Foundation. The RTG follows an interdisciplinary approach of Geodynamics, Geodesy and Geology aiming to answer questions related to how the interaction of exo- and endogenic forcing shapes a diverse array of earth processes. From a combined interpretation of interdisciplinary observations with different spatial and temporal sensitivity, together with physical models, work in the RTG tries to disentangle different uplift mechanisms, including the plume, plate and isostatic mode, based on their specific spatial and temporal patterns. We will give an overview of key results and highlight the synergies that derive from bringing multiple constraints to bear on vertical motion processes of the lithosphere.

How to cite: Bunge, H.-P., Friedrich, A., Pail, R., and Chen, Y.-W.: Geophysical modelling of vertical motion processes constrained by geodetic and geological observations (UPLIFT), EGU General Assembly 2025, Vienna, Austria, 27 Apr–2 May 2025, EGU25-17175, https://doi.org/10.5194/egusphere-egu25-17175, 2025.

EGU25-18199 | ECS | Orals | GD1.2

The thermochemical Hawaiian plume and its dynamic influence on upper mantle discontinuities  

Martina Monaco, Raymond Russo, and Hamish Brown

The anomalous seismic structure of the upper mantle at the Hawaiian hotspot, including the X-discontinuity at 310 km depth and a perturbed 410, has been ascribed to large quantities (>40%) of recycled eclogite in the Hawaiian mantle plume. These estimates far exceed the classical geodynamic constraints of 15-20%, suggesting the existence of additional mechanisms driving eclogite accumulations. 

We tackle this discrepancy by superimposing discrete heterogeneities of recycled eclogite to a plume featuring a realistic mechanical mixture composition. This approach allows us to entrain higher amounts of denser material and quantify its segregation in the 310-410 km depth range. To reproduce the ample spectrum of buoyancy fluxes reported for the Hawaiian hotspot, we test plume radii of 80-100 km, excess plume temperatures of 200-300 K, and recycled heterogeneity fractions between 5 and 20%.

Our 8 best-fit cases yield average eclogite accumulations of 19.5% at 310 km and 21-25% at 410 km, with peaks of 21-24% and 26-32%, respectively. This uniformity indicates that higher eclogite entrainments do not substantially increase material segregation in the mid-upper mantle. 

We demonstrate that, while the Hawaiian plume has the potential of recycling more than 18% denser material, high segregations are unsustainable over geological timescales, and excess entrainments above 20% would require unrealistic buoyancy fluxes. Our findings provide the first quantitative constraint of the dynamic relationship between the Hawaiian mantle plume and the X-discontinuity, critically advancing our understanding of the influence of recycled eclogite on mantle discontinuities.

How to cite: Monaco, M., Russo, R., and Brown, H.: The thermochemical Hawaiian plume and its dynamic influence on upper mantle discontinuities , EGU General Assembly 2025, Vienna, Austria, 27 Apr–2 May 2025, EGU25-18199, https://doi.org/10.5194/egusphere-egu25-18199, 2025.

EGU25-18671 | Posters on site | GD1.2

Variations of Earth's volume driven by intermittend mantle stratification 

Thorsten Nagel and Stéphane Bodin

Through almost the entire mantle column, oceanic crust is denser than ambient mantle. In a ca. 100 kilometers thick channel below the lower-upper-mantle boundary, however, this relation is reversed. Hence, this channel constitutes a trap for oceanic crust and several recent studies have indeed proposed large ponds of crust at this depth. Accumulation of crust would be expected to be continuous, while sequestration into the lower mantle should be episodic due to the metastable nature of the gravitational trap. Non-steady-state concentration of crust in the channel would be associated with variations in Earths volume in the order of several millions of cubic kilometers. While transfer of crust from the upper mantle into the channel causes volume increase, the collapse of crust into the lower mantle would be associated with net volume decrease. We propose that collapse events could be associated with rising mantle plumes, hence, a net volume decrease of Earth would precede the eruption of large igneous provinces (LIP). A dramatic volume loss in 650 kilometers depth might be able to pull down the surface for a brief time. Such an event might be expressed in an outstanding sea-level-drop before the eruption of LIP. This hypothesis is confirmed by a review of eustatic sea-level changes accompanying late Paleozoic – Cenozoic LIPs activity showing that a majority of LIP emplacement are shortly (< 500 kyr) preceded by an episode of up to 50 meters (average of 25 meters) eustatic sea-level fall, with return to pre-perturbation levels at the onset of LIP eruption.

How to cite: Nagel, T. and Bodin, S.: Variations of Earth's volume driven by intermittend mantle stratification, EGU General Assembly 2025, Vienna, Austria, 27 Apr–2 May 2025, EGU25-18671, https://doi.org/10.5194/egusphere-egu25-18671, 2025.

Over the past decade, advances in data assimilation techniques combined with a rapid increase in computational power have allowed for increasingly realistic dynamo simulations. One of the key parameters controlling the dynamics of the magnetic field is the amount of heat loss through the core-mantle boundary (CMB), highlighting the crucial role of the lower mantle in the dynamo processes. Previous studies (Kutzner and Christensen, 2004) suggest that heat flux variations at the lower mantle may explain the observed changes in reversal frequency on time scales of some 10 million years. 

To study the effect of the mantle on reversals, we use the numerical code MagIC, simulating the dynamo process over geological timescales. The long required simulation time forces us to use a relatively large Ekman number of E = 3 · 10-4. Following Frasson et al. (2024), we first explore the impact of several fundamental heat-flux patterns (spherical harmonic degree Y10, Y20, Y22, ...) and amplitudes imposed at the outer boundary. Secondly, we use a codensity approach to explore whether a higher degree of compositional driving reduces the impact of the core-mantle boundary heat flux pattern. Finally, we investigate the impact of the stably stratified layer at the top of the outer core (Buffett et al., 2016) on the geodynamo process and the stability of the magnetic field.

How to cite: Lohay, I. and Wicht, J.: Utilizing Codensity Approach to Assess How Core-Mantle Boundary Properties Influence Geomagnetic Reversal Frequency, EGU General Assembly 2025, Vienna, Austria, 27 Apr–2 May 2025, EGU25-19113, https://doi.org/10.5194/egusphere-egu25-19113, 2025.

EGU25-19600 | ECS | Orals | GD1.2

Geodetic Evidence for Weak Mantle Beneath the Sumatran Backarc and Its Influence on Regional Sea-Level 

Grace Ng, Lujia Feng, Xin Zhou, Haipeng Luo, Kelin Wang, Tianhaozhe Sun, Chien Zheng Yong, and Emma M. Hill

Postseismic deformation in the far field following large earthquakes is increasingly recognised as a key factor contributing to regional land height and relative sea-level (RSL) changes. The Sumatran subduction zone provides a unique setting to study this deformation owing to the availability of far-field (600 – 1000 km from the trench) and long-term (>20 years) Global Navigation Satellite System (GNSS) observations. In this study, we model the GNSS-constrained postseismic deformation of multiple great (Mw ≥ 8.0) regional earthquakes using a layered and self-gravitating spherical Earth model. Our results reveal a weak asthenosphere beneath the continental lithosphere in explaining the far-field GNSS observations. We estimated an asthenosphere Maxwell viscosity as low as 𝜂m = 1.5 – 3e18 Pa s. Even assuming the presence of a weaker lithosphere-asthenosphere boundary layer (𝜂m = 1.3 – 2.8e17 Pa s) of 5-10 km thickness, the asthenospheric Maxwell viscosity remains less than 1e19 Pa s. Using these mantle viscosities, we estimated horizontal and vertical postseismic viscoelastic surface deformation over a broader region beyond where GNSS observations are available. We show that a weak backarc asthenosphere leads to relatively large, fast, and extensive postseismic deformation, a conclusion that likely applies to many other subduction zones. The great Sumatran megathrust earthquakes, namely the 2004 Sumatra-Andaman, 2005 Nias-Simeulue, and 2007 Bengkulu events, caused continuous far-field postseismic land subsidence over two decades. The 2012 Mw 8.6 and Mw 8.2 Wharton Basin strike-slip earthquake sequences in the Indian Ocean produced postseismic uplift in the far field, slowing down but not offsetting the ongoing subsidence caused by the great megathrust earthquakes. Our results highlight a critical concern for Southeast Asia’s coastal population, as the regional VLM and RSL rise due to large earthquakes compounds the impacts of climate-driven sea-level changes.

How to cite: Ng, G., Feng, L., Zhou, X., Luo, H., Wang, K., Sun, T., Yong, C. Z., and Hill, E. M.: Geodetic Evidence for Weak Mantle Beneath the Sumatran Backarc and Its Influence on Regional Sea-Level, EGU General Assembly 2025, Vienna, Austria, 27 Apr–2 May 2025, EGU25-19600, https://doi.org/10.5194/egusphere-egu25-19600, 2025.

EGU25-19803 | ECS | Posters on site | GD1.2

Investigating Uplift in the Afar Depression: Tectonic Complexity and Afar Plume through InSAR Time Series (2014–2024) 

Wojciech Milczarek and Peyman Namdarsehat

The Afar Depression, a key tectonic and volcanic region in East Africa, is characterized by complex interactions between rifting processes and mantle dynamics, particularly the influence of the rising Afar plume. This study offers a detailed investigation of uplift patterns in the Afar Depression over a decade (from 2014 to 2024) using Interferometric Synthetic Aperture Radar (InSAR) time-series analysis. The objective of this study is to generate critical insights and key observations as a foundational resource for advancing and refining future geological research. Resolving subtle, spatially distributed uplift patterns linked to tectonic activity has historically been challenged by methodological limitations. To address this, we analyzed three ascending (14, 87, 116) and four descending (6, 35, 79, 108) Sentinel-1A paths, applying the Small Baseline Subset (SBAS) method, complemented by decomposition techniques to achieve precise deformation measurements. We categorized the Afar area according to regions with the highest uplift rates, aiming to identify zones exhibiting significant tectonic activity. Our analysis reveals significant spatial and temporal variations in uplift rates, providing new insights into the region’s tectonic complexity and the role of the Afar plume. These findings highlight the intricate interplay between plume-driven uplift and tectonic structures, advancing our understanding of the Afar Depression’s geological evolution and the broader dynamics of continental rifting and lithospheric deformation.

How to cite: Milczarek, W. and Namdarsehat, P.: Investigating Uplift in the Afar Depression: Tectonic Complexity and Afar Plume through InSAR Time Series (2014–2024), EGU General Assembly 2025, Vienna, Austria, 27 Apr–2 May 2025, EGU25-19803, https://doi.org/10.5194/egusphere-egu25-19803, 2025.

EGU25-19898 | ECS | Orals | GD1.2

Morphotectonic Chronology of the Dead Sea Rift's Western Margin: Insights from U-Pb Dating of Speleothems 

Boaz Langford, Anton Vaks, Tzahi Golan, Elan Levy, Tami Zilberman, Gal Yasur, Keren Weiss-Sarusi, and Amos Frumkin

The development of the Dead Sea Transform (DST) coincided with a vertical uplift of the transform margins, forming the main N-S mountain ridge of Israel, as well as a subsidence of Dead Sea pull-apart basin. So far only minor parts of these events have been accurately dated.  Karst processes that started after marine regression, led to the formation of karst aquifers in the carbonate lithologies of Cenomanian to Eocene age. The vertical tectonics (mountain uplift and Dead Sea Valley subsidence) caused the caves to be gradually uplifted above the regional groundwater level. In the current study, we used Laser Ablation (LA) U-Pb chronology of phreatic and vadose cave calcite to determine the timing of vertical tectonic stages: the marine regression, onset of karst processes, and transition of the caves from the groundwater up to the vadose zone. U-Th chronology was used for dating the youngest calcites. Phreatic and vadose calcite samples were collected from sites with similar altitudes and a spatial extent of ~150 kilometers on N-S transect along the western DST margin. In-situ LA U-Pb chronology of calcite,  along with calcite 18O values ranging between -16‰ and -9‰ (VPDB), fluid inclusion (FI) 18O-D analyses and associated d-excess values of 9‰ to 29‰ (VSMOW) indicates that meteoric waters infiltrated into the aquifer since Late Eocene – Early Oligocene (35.1±0.3 Ma to 29.17±0.4 Ma), marking the timing of sea regression and onset of meteoric water infiltration into the aquifer. The onset of vertical tectonics in the region during the early Miocene, caused an initial uplift of the caves above water table and deposition of first vadose speleothems around 20 Ma. The average uplift rate of the western margin of DST was approximately 26 m per million years, which increased to 120 m per million years from 6 Ma to the present. This change appears to correspond with a few degrees shift in previously parallel sinistral strike slip movement of the Dead Sea Transform, introducing an extensional component and leading to the development of the pull apart basin.

How to cite: Langford, B., Vaks, A., Golan, T., Levy, E., Zilberman, T., Yasur, G., Weiss-Sarusi, K., and Frumkin, A.: Morphotectonic Chronology of the Dead Sea Rift's Western Margin: Insights from U-Pb Dating of Speleothems, EGU General Assembly 2025, Vienna, Austria, 27 Apr–2 May 2025, EGU25-19898, https://doi.org/10.5194/egusphere-egu25-19898, 2025.

EGU25-1339 | ECS | Orals | GD5.3

The Boron Isotope Record of Fluid-Rock Interaction in Abyssal Serpentinite: Insights from IODP Expedition 399 

William Osborne, Ivan Savov, Andrew McCaig, Samuele Agostini, and Marguerite Godard and the the International Ocean Discovery Program Expedition 399 Sci Party

The use of fluid-mobile elements and their isotopes to track fluid-mediated subduction zone processes requires an accurate estimate of the volatile element systematics of subducting oceanic crust. Near-ridge hydrothermal circulation represents the primary means by which seawater can penetrate the oceanic crust and produce enrichments in fluid-mobile elements (B, Sr, Li, U, Cl etc.), particularly at slow-spreading ridges where hydrated mantle peridotite (ie. serpentinite) is commonly exposed at the seafloor. However no previous drilling has penetrated abyssal serpentinite deeper than 200.8m below seafloor, where late-stage alteration and intense fault-controlled circulation during exhumation might produce anomalous fluid-mobile element signatures. While ophiolites provide a valuable analogue, it is often hard to distinguish geochemical signatures related to interaction with seawater-derived fluid from those acquired during subsequent interaction with subduction-related and/or meteoric fluids.

We present new data from IODP Expedition 399, which recovered 1268m of serpentinized depleted mantle peridotite and variably altered gabbroic rocks (Hole U1601C) from the southern wall of the Atlantis Massif (30°N; Mid-Atlantic Ridge). Peridotites are generally highly serpentinized (80-90%) and display complex pseudomorphic, mesh and vein textures, attesting to a multistage history of alteration. Gabbros range from fresh to completely altered and exhibit a diversity of secondary mineral assemblages (±amphibole ±serpentine ±talc ±chlorite ±sulphides ±prehnite ±secondary plagioclase ±zeolite ±saponite ±carbonate). Our downcore fluid-mobile trace element and B and Sr isotopic profiles provide a comprehensive framework in which to understand physicochemical conditions during serpentinization and metasomatism of the actively metamorphosing basement of the massif, and their relation to current seafloor venting at the Lost City Hydrothermal Field.

B concentrations in serpentinites decrease by an order of magnitude downcore, which we interpret in terms of B depletion of alteration fluid through the serpentinization process. Substantial downcore variation in the B isotopic composition of serpentinite (δ11B of +12‰ to +40‰) reflects local T and pH conditions as well as isotopic evolution of the alteration fluid along the flow path. Serpentinite Sr isotopic compositions vary between seawater and near mantle values (87/86Sr of 0.704 to 0.709); likely reflecting considerable elemental exchange between alteration fluid and gabbroic intrusions. Our results also shed new light on the geochemical influence of late-stage alteration processes (carbonation, oxidation, infilling of reaction porosity etc.) postdating serpentinization.

In addition, we present new B isotope data from (olivine-bearing) gabbroic rocks of the central massif (Hole U1309D) and detachment-proximal serpentinites from the south wall drilled during IODP Expedition 357. Together, these data represent an important step towards quantifying the fluid-mobile element makeup and specifically the B and 11/10 B content of the lower oceanic crust.

How to cite: Osborne, W., Savov, I., McCaig, A., Agostini, S., and Godard, M. and the the International Ocean Discovery Program Expedition 399 Sci Party: The Boron Isotope Record of Fluid-Rock Interaction in Abyssal Serpentinite: Insights from IODP Expedition 399, EGU General Assembly 2025, Vienna, Austria, 27 Apr–2 May 2025, EGU25-1339, https://doi.org/10.5194/egusphere-egu25-1339, 2025.

EGU25-1610 | ECS | Posters on site | GD5.3

Evaluation of the role of detachment faulting in the genesis of felsic melts in the Atlantis Bank oceanic core complex, Southwest Indian Ridge 

Wei-Qi Zhang, Chuan-Zhou Liu, Christopher J MacLeod, and C. Johan Lissenberg

Oceanic detachments are deep-rooted, long-lived structures at plate scale, acting as conduits for fluid introduction into the oceanic lithosphere. These processes impact plate rheology and potentially induce oceanic crustal anatexis. However, the mechanisms and extent of fluid ingress and crustal melting during detachment faulting remain poorly constrained. This study investigates felsic veins from the Atlantis Bank oceanic core complex (OCC) on the Southwest Indian Ridge to elucidate controls on crustal anatexis imposed by oceanic detachments.

We report systematic results for mineral chemistry, zircon U-Pb ages and Hf-O-Zr isotopes, and Nd-O isotopes of apatites from 23 felsic rocks retrieved from 50−800 meters below the seafloor in IODP Hole U1473A. Additionally, phase equilibria and zircon trace element modeling for three formation modes of oceanic felsic melts (hydrous partial melting of gabbros, fractional crystallization of MORB, and fractional crystallization of anatectic melts) were performed. These data and models consistently suggest that most U1473A felsic veins were products of advanced mid-ocean ridge basalt (MORB) differentiation.

Further examination of zircon trace element data for the Atlantis Bank OCC indicates that the felsic veins resulted from strong fractionation of either primitive basalts or magmas generated by hydrous melting of gabbros. The presence of anatectic felsic veins near the fault plane suggests that the detachment fault facilitated high-temperature (750–900°C) alteration and hydrous melting of gabbros. Additionally, analyses of felsic rocks from two OCCs on the Mid-Atlantic Ridge, based on published zircon trace element data and models, reveal distinct manifestations of the interplay among faulting, magmatism, and hydrothermal circulation across various OCCs. Our findings underscore the critical role of detachment faulting in fluid ingress and oceanic crust melting, with significant implications for chemical and thermal exchanges between seawater and the oceanic lithosphere.

How to cite: Zhang, W.-Q., Liu, C.-Z., MacLeod, C. J., and Lissenberg, C. J.: Evaluation of the role of detachment faulting in the genesis of felsic melts in the Atlantis Bank oceanic core complex, Southwest Indian Ridge, EGU General Assembly 2025, Vienna, Austria, 27 Apr–2 May 2025, EGU25-1610, https://doi.org/10.5194/egusphere-egu25-1610, 2025.

The specific oceanic crust architecture, magmatism, hydrothermal fluid circulation and lithologies at oceanic core complexes (OCCs) imply different S and metal (e.g. Cu, Zn, Co, Ni) fluxes relative to well-structured oceanic crust at-fast spreading ridges. Extensive hydrothermal fluid circulation within OCCs often leads to seafloor massive sulfide (SMS) deposits formation either hosted in the OCC or in the crustal hanging wall. The S and metal source zones in OCC are nevertheless poorly constrained. The study of S and metal distribution in the ODP Hole 735B deep drill core from the Atlantis bank allows to understand these fluxes along detachment faults and to better constrain the source zones of S and metals for OCC-related SMS deposits. Significant depletion of S, Cu, Zn and Ni are observed within the upper 250 m of the drill core where intense deformation and hydrothermal fluid circulation occurred. During the complex tectono-magmatic-hydrothermal evolution of the Atlantis Bank, four important stages are recognized for S and metal mobilization: 1) magmatic stratification leading to a higher proportion of sulfide-rich and S, Cu, Zn and Co fertile oxide gabbros in the root zone of the Atlantis Bank detachment, 2) high temperature ductile deformation leading to magmatic sulfide reworking and onset of sulfide leaching with limited metal mobilization, 3) extensive sulfide leaching and metal mobilization during amphibolite to greenschist facies metasomatism and, 4) late stage secondary sulfide precipitation and S enrichment during low temperature fluid circulation. Mass balance calculations from the source zones of the Atlantis Bank detachment highlights that metal mobilization during hydrothermal alteration of gabbroic rocks along detachment faults can fully account for the formation of OCC-related SMS deposits at slow and ultraslow spreading ridges. The Atlantis Bank detachment system, however, is gabbroic-dominated and represent the magmatic end-member of OCCs and further work is necessary for understanding metal fluxes in ultramafic-dominated detachment systems such as at the Atlantis Massif.

How to cite: Patten, C. G. C., Junge, M., Coltat, R., Jesus, A. P., Beranoaguire, A., Tropper, P., and Alt, J.: Sulfur and metal mobilization during the magmatic-hydrothermal evolution of the Atlantis Bank oceanic core complex: implications for seafloor massive sulfide deposits formation at slow and ultra-slow spreading ridges, EGU General Assembly 2025, Vienna, Austria, 27 Apr–2 May 2025, EGU25-1702, https://doi.org/10.5194/egusphere-egu25-1702, 2025.

EGU25-1757 | Posters on site | GD5.3

Rates of melt lens replenishment at the East Pacific Rise, 9º50’N  

Jean-Arthur Olive, Hugo Boulze, and Jean-Didier Garaud

Axial melt lenses (AMLs) are key features of fast and magmatically-robust spreading ridges. These sill-shaped bodies typically sit atop a lower crustal mush zone, and supply magma that gets intruded in the brittle axial lithosphere as dikes, or emplaced at the seafloor as lava flows. The replenishment rate of these shallow reservoirs is thus a critical control on the modes of crustal accretion, the timing of mid-ocean ridge eruptions, and the thermo-chemical output of hydrothermal convection, but remains scarcely documented.

Here we revisit estimates of magmatic inflation rates at the East Pacific Rise, 9º50’N based on measurements of vertical seafloor displacements carried out by Nooner et al. (2014). These measurements revealed seafloor uplift rates as fast as ~7 cm/yr above the AML, decaying over ~10 km in the cross-axis direction, between 2009 and 2011. We model this uplift profile as resulting from the inflation of a 1.5 km-deep, 1-km wide AML in a visco-elastic half-space that includes a viscous mush zone of uniform viscosity.

Our models reveal a tradeoff between the assumed viscosity of the mush zone and the sill inflation rate that is necessary to explain the observed seafloor uplift. Specifically, if we assume a strong mush (viscosity > 1018 Pa.s), the replenishment rate must be ~200 m3/yr per meter along axis. On the other hand, a weaker mush (viscosity < 1016 Pa.s) significantly damps the surface expression of sill inflation, requiring a replenishment rate of ~470 m3/yr/m to match the observations. Further constraints on AML replenishment rates can be obtained by assuming the associated heat flux sustains on-axis hydrothermal venting near 9º50’N (~100 MW). We also find that rapid AML deflation during an eruption can induce a characteristic deformation transient lasting up to a few years, which is akin to the post-seismic phase of the seismic cycle. Depending on the assumed viscosity of the mush zone, this post-eruption signal has the potential to bias estimates of steady AML replenishment rates.

Regardless of the assumed mush viscosity, our modeling yields replenishment rates comparable to the long-term crustal accretion rate (~600 m3/yr/m). This suggests that magmatic inflation is not an unusual event at a fast-spreading ridge like the East-Pacific Rise. By estimating the fraction of the ridge’s magma supply that transits through the AML, our results may also provide new constraints on the modes of accretion of the oceanic lower crust, i.e., help discriminate between the gabbro glacier and multiple-sills endmember models.

How to cite: Olive, J.-A., Boulze, H., and Garaud, J.-D.: Rates of melt lens replenishment at the East Pacific Rise, 9º50’N , EGU General Assembly 2025, Vienna, Austria, 27 Apr–2 May 2025, EGU25-1757, https://doi.org/10.5194/egusphere-egu25-1757, 2025.

EGU25-1938 | Orals | GD5.3

Abyssal peridotites: Rosetta Stone for recycled mantle materials in the asthenosphere 

Chuan-Zhou Liu, Wei-Qi Zhang, Ying-Zhen Lin, Yang Xu, and Zhen Zhang

Decompressional melting of the asthenosphere gives rise of mid-ocean ridge basalts (MORB) that are extracted to generate ocean crust, and also leaves mantle residues that are represented by abyssal peridotites. Thus, both MORB and abyssal peridotites can be utilized to constrain the compositional characteristics of the asthenosphere. Numerous studies on MORB have widely demonstrated that they are from a relatively homogenous and geochemically depleted mantle source. The homogeneity of the asthenosphere has been commonly attributed to the efficiency of mantle convection. Nonetheless, geochemical compositions of global abyssal peridotites show highly variable compositions and a wide range of isotopic spectrum, clearly reflecting that the asthenosphere is compositionally heterogeneous. Mantle peridotites memorizing evolutionary histories at different tectonic settings, including sub-continental lithospheric mantle, mantle wedge and oceanic mantle, can be recycled into the asthenosphere, which might be eventually popped up at ocean ridges where they are sampled by abyssal peridotites. Different types of recycled mantle materials can be discriminated using geochemical tools. Our recent studies on abyssal peridotites dredged at different segments along the Southwest Indian Ridge (SWIR) have shown the occurrence of diverse types of recycled mantle, i.e., Archean cratonic mantle in its western segment, mantle wedge in its central segment, and oceanic mantle in this eastern segment. Such a spatial distribution is genetically related to the assembly and breakup of the Gondwana supercontinent since the Cambrian. Therefore, systematic studies on abyssal peridotites outcropped along the ocean ridges can decipher the compositionally characteristics and evolutionary histories of different mantle domains within the asthenosphere.

How to cite: Liu, C.-Z., Zhang, W.-Q., Lin, Y.-Z., Xu, Y., and Zhang, Z.: Abyssal peridotites: Rosetta Stone for recycled mantle materials in the asthenosphere, EGU General Assembly 2025, Vienna, Austria, 27 Apr–2 May 2025, EGU25-1938, https://doi.org/10.5194/egusphere-egu25-1938, 2025.

The length of oceanic transform faults varies dramatically from near zero-offsets to long-offset mega-transforms that are >1000 km long. However, the formation and development of longer oceanic transform faults (>200 km) remains incomplete and requires further study. We investigate how changes in the plate motion vector impacts plate stress and transform fault development using high resolution 3D geodynamic numerical models in ASPECT (Advanced Solver for Planetary Evolution, Convection, and Tectonics). Specifically, we study how the length of transform faults evolve over time after inducing transpression or transtension across simple and complex stepped rift-transform geometries. We also determine how the angle of oblique extension affects the required tectonic force necessary to develop new tectonic structures, providing insight into real-world plate tectonic processes. Our results show that transpressional deformation along a transform leads to longer, diffuse transforms at higher angles, while transtensional deformation leads to oblique extension across the transform margin. These transpressional model results are also analogous to real world examples such as the Davie (West Somali Basin) and Ungava Fault Zones (Davis Strait), where we also highlight how the contemporaneous alignment of extinct mid-ocean ridges and young oceanic lithosphere can influence where new transform faults develop.

How to cite: Longley, L. and Phethean, J.: Mega-transform fault development: New insights from Geodynamic modelling using ASPECT and real-world examples, EGU General Assembly 2025, Vienna, Austria, 27 Apr–2 May 2025, EGU25-2320, https://doi.org/10.5194/egusphere-egu25-2320, 2025.

EGU25-2367 | Posters on site | GD5.3

Seismicity in the Zabargad Fracture Zone, Northern Red Sea and its tectonic implications: insights from an Ocean Bottom Seismometers Network 

Hasbi Ash Shiddiqi, Laura Parisi, Eduardo Cano, Margherita Fittipaldi, Nico Agustin, Guillaume Baby, P. Martin Mai, and Sigurjón Jónsson

The Red Sea is one of the youngest ocean basins on Earth and is classified as an ultra-slow spreading ridge, with spreading rates decreasing from 15 mm/year in the Southern Red Sea to 7 mm/year in the Northern Red Sea. The Zabargad Fracture Zone (ZFZ), the largest rift-axis offset (~100 km) in the Red Sea (23.5oN to 26oN), separates the Central and the Northern Red Sea. The proximity of the seismically active ZFZ to coastal cities and infrastructure in the region has implications for the regional seismic hazard. However, thick salt and sedimentary covers in the ZFZ obscure the exact geometry of the oceanic spreading axes, and any potential transform faults or non-transform offsets, resulting in ambiguous interpretations. Seismological studies to date have relied on onshore recordings, yielding limited earthquake location accuracy that has impeded detailed analysis.

We deployed the first-ever broadband ocean-bottom seismometer network in the Red Sea, which was augmented with land-based stations, for a period of 12 months to improve the seismic data coverage in the ZFZ. The deployment resulted in a recovery rate of over 90% for the continuous seismic recordings. Using this new dataset, we applied a deep-learning-based algorithm for automatic earthquake detection and phase picking. The results were manually verified and refined, enabling the development of a high-resolution earthquake catalog. These processing steps yielded over 3,900 local earthquakes, with magnitude ranging from ML -0.4 to ML 2.5.  We further optimized a 1-D seismic velocity model for the ZFZ and improved earthquake locations using a double-difference relocation algorithm. Focal mechanisms for selected events were determined using polarity and amplitude ratios.

Our findings reveal two major seismicity clusters in the northern part, near the Mabahiss Deep, a deep with exposed oceanic crust, and in the southern part, around the ZFZ. The hypocenter distribution is consistent with NNW-SSE trending normal faults parallel to the ridge axis, indicating ridge segmentations and at least one ~25 km long NE-SW transform fault with strike-slip mechanisms. Variations in seismicity depth highlight changes in the brittle-ductile transition zone: shallower near Mabahiss Mons, an axial Mid-Oceanic Ridge Basalt volcano, reflecting elevated temperatures, and deeper further south, suggesting lower temperatures due to fluid circulation. These results provide new insights into the ZFZ's tectonic structure and seismic activity, improving our understanding of oceanic spreading dynamics in the northern Red Sea and the associated earthquake hazard.

How to cite: Shiddiqi, H. A., Parisi, L., Cano, E., Fittipaldi, M., Agustin, N., Baby, G., Mai, P. M., and Jónsson, S.: Seismicity in the Zabargad Fracture Zone, Northern Red Sea and its tectonic implications: insights from an Ocean Bottom Seismometers Network, EGU General Assembly 2025, Vienna, Austria, 27 Apr–2 May 2025, EGU25-2367, https://doi.org/10.5194/egusphere-egu25-2367, 2025.

EGU25-2791 | Posters on site | GD5.3

On the segmentation of the slow spreading Mid-Atlantic Ridge between Atlantis and Oceanographer Transform (29.5 N to 35.5 N) 

Ingo Grevemeyer, Lars Ruepke, Adina Pusok, and Javier Escartin

Mid-Ocean Ridges (MOR) are accretionary plate boundaries where new seafloor is created by seafloor spreading. In the early 1980s, these features were mapped for the first time in high detail using multi-beam echosounders and researchers found that the ridge crest of this approximately 70.000 km long rift system has many lateral discontinuities that partition its axis into segments. Discontinuities differ in form and behaviour and are often deeper and less active volcanically than the segments they define. As a result, the crest of the MOR undulates up and down by hundreds of meters over distances of several to hundreds of kilometres. The most prominent ridge offsets are the oceanic transform faults which typically offset the ridge axis by over 20 km. Long transform faults generally form deep valleys, while shorter discontinuities (non-transform offsets) displacing the spreading axis by only a few kilometres to tens of kilometres may show more complex tectonic features.

Even 60 years after the plate tectonic revolution and the introduction of seafloor spreading, much of the classification of ridges crest segmentation is still based on the study of fast-spreading ridges dominated by robust magma supply where discontinuities along the spreading axis are readily identified by offsets of the crest-like ridge axis, including overlapping and often migrating Overlapping Spreading Centres (OSC). It is generally believed that slow spreading ridges show analogue features. Yet observations of prominent median valleys at slow spreading ridges show a much more diverse segmentation. Here, we revisit the segmentation of the slow spreading Mid-Atlantic Ridge (MAR) between 29°30’N (south of Atlantis transform) to 35°30’N (north of Oceanographer transform) using data collected in September and October of 2024 aboard the German RV METEOR during the cruise M204 running a swath-mapping survey along the axis of the MAR. In analogy to fast spreading ridges, we find transform faults and overlapping volcanic centres, but we also map large dome-like features, en-échelon spreading segments, and offsets revealing bookshelf faulting. These structures provide insight into both the various styles of non-transform offsets, and the parameters controlling the different shear accommodation styles.

How to cite: Grevemeyer, I., Ruepke, L., Pusok, A., and Escartin, J.: On the segmentation of the slow spreading Mid-Atlantic Ridge between Atlantis and Oceanographer Transform (29.5 N to 35.5 N), EGU General Assembly 2025, Vienna, Austria, 27 Apr–2 May 2025, EGU25-2791, https://doi.org/10.5194/egusphere-egu25-2791, 2025.

EGU25-3590 | ECS | Orals | GD5.3

Controlling processes of marginal ridge development 

Stanislaw Staniaszek and Michal Nemčok,

Transform faults, key elements of plate tectonics, play a crucial role in shaping transform
margins. Marginal ridges, which are elevated basement highs at margin borders, represent
one of the structural elements occurring at some transform margins.
This study examines marginal ridges and their failed candidates, which occur along the
Zenith-Wallaby-Perth transform fault zone in West Australia, using seismic and gravity data,
and plate reconstructions to investigate their development histories.
Existing models of marginal ridge development often include processes such as thermal
expansion-related uplift, flexural uplift and flower structure development. However, data
from the study area suggest a more complex mechanism, which is related to the formation
of strike-slip faults and pull-apart basins inside the transform fault zone.
This study proposes a model of the marginal ridge formation characterized by the evolving
faulting during continental and continental-oceanic stages of the transform development.
The nucleation and linkage of strike-slip faults along the future transform fault zone lead to
the formation of pull-apart basins, characterized by a complex fault system. In the same
time, (1) initially broad zone of deformation undergoes progressive focusing and (2) fault
activity decays along the transform strike towards the ocean. Depending on the duration of
fault activity, some parts of the initial strike-slip fault zones and pull-aparts develop further,
while others are abandoned. In regions where faults remain active for extended periods
during the continental-oceanic stage of the transform development, marginal ridges may
develop, and even occasionaly evolve into micro-continents separated from the continent.
Further complexity in their development is the effect of the pre-existing anisotropy in
regions of their development.

How to cite: Staniaszek, S. and Nemčok,, M.: Controlling processes of marginal ridge development, EGU General Assembly 2025, Vienna, Austria, 27 Apr–2 May 2025, EGU25-3590, https://doi.org/10.5194/egusphere-egu25-3590, 2025.

EGU25-4175 | Posters on site | GD5.3

Global Subseafloor Ecosystem and Sustainability (GSES) 

Fengping Wang, Kai-Uwe Hinrichs, Ken Takai, Thulani Makhalanyane, Mohamed Hatha Abdulla, and Mohamed Jebbar

The subseafloor ecosystem includes all life living in marine sediment, crust and the accompany fluids. This ecosystem, also called the deep biosphere, mostly derives its energy source from geological processes, which are cut off from sunlight. Deep-sea hydrothermal vents and cold seeps are regarded as windows of the subsurface life. Still, little is known about the subseafloor life and there is a substantial knowledge gap related to understanding the breadth of their diversity, assemblage, function, and possible ecosystem services to society. These insights are key to understanding the origin of life and evolutionary processes, and also pivotal for evaluating the impact of the proposed ocean-based climate interventions. As part of the efforts to reduce this knowledge deficiency, we initiate a global-scale program “Global Subseafloor Ecosystem and Sustainability” (GSES). This program aims to generate new systematic insights into subseafloor ecosystems with the aim of transforming these datasets for predictive capabilities. As a newly endorsed program of the UN Ocean Decade, the overarching objective of GSES is to significantly advance scientific comprehension, conservation, and sustainable management of Earth's subseafloor ecosystems. Focused on addressing substantial knowledge gaps in microbial life, carbon dynamics, and historical records within this critical, vulnerable and understudied environment, GSES aims to develop internationally standardized protocols, cutting-edge investigation platforms, and ecological indices. A pilot project that targets the microbiome in the oceanic crust, which is the largest by volume but least understood biosystem on Earth, will be showcased and discussed.

How to cite: Wang, F., Hinrichs, K.-U., Takai, K., Makhalanyane, T., Abdulla, M. H., and Jebbar, M.: Global Subseafloor Ecosystem and Sustainability (GSES), EGU General Assembly 2025, Vienna, Austria, 27 Apr–2 May 2025, EGU25-4175, https://doi.org/10.5194/egusphere-egu25-4175, 2025.

EGU25-4307 | ECS | Orals | GD5.3

Implications of pressure-dependent permeability for hydrothermal heat transfers 

Jie Chen, Jean-Arthur Olive, Mathilde Cannat, and Antoine Demont

Hydrothermal convection in young oceanic lithosphere accounts for ~25% of the total global heat flow, and thus plays a critical role in Earth's thermal evolution. The permeability structure of the lithosphere is a key factor governing how efficiently heat tapped from magma bodies or hot upwelling mantle can be transferred to the overlying ocean. Drill hole measurements and laboratory experiments unambiguously show that permeability decreases with depth (i.e., pressure), either exponentially or through some power law relations. However, the impact of depth-decreasing permeability on the depth extent and heat output of seafloor hydrothermal systems has not been explored systematically.

Here we present 2-D numerical simulations of hydrothermal convection treated as Darcy porous flow, with fluid properties corresponding to a 3.2 wt% NaCl-H2O mixture, and depth (i.e., pressure)-dependent permeability fields. We consider an empirical exponential dependence as well as a more recently proposed power-law-type dependence rooted in micromechanical modeling of experimental data. In reference simulations with uniform permeability, we find that, for a given basal temperature (TH) imposed at the model bottom, the hydrothermal heat output at the seafloor increases with permeability, but is largely independent of the depth extent of the model domain. On the other hand, in simulations with depth-decreasing permeability, the depth extent of hydrothermal convection (ZH) may be significantly lower than the height of the model domain. In such systems, heat extraction is intuitively more efficient when the heat source lies at a shallower depth. We find that the heat output in these simulations is primarily controlled by the harmonic mean of permeability in the hydrothermal system.

To further quantify this finding, we investigate the relationship between our simulations' Rayleigh number (Ra, estimated from model inputs using the harmonically-averaged permeability) and Nusselt number (Nu, measured from simulation results). We find that the linear relationship Nu=Ra/Rac that is typical of porous convection holds for Ra > 103, with a critical Rayleigh number (Rac) on the order of 102. This relationship allows us to build an analytical model that predicts ZH, given the heat output, basal temperature (TH), and exponentially-decreasing permeability with depth Z: k= k0 e(-cZ). Fitting parameters against observed magma-fueled hydrothermal systems at mid-ocean ridges suggests that permeability at the seafloor (k0) is on the order of 10-12 - 10-11 m2, in agreement with independent estimates based on drill hole measurements and the poro-elastic tidal modulation of venting temperatures, and that the constant c is on the order of 1-4×10⁻³ m-1. Our findings further suggest that for convection to reach depths > 13 km, as has been proposed near oceanic detachment faults, permeability at the seafloor would need to be extremely large (k0> 10-10 m2). It remains unclear whether such conditions can be attained in the damage zone of a detachment fault.

How to cite: Chen, J., Olive, J.-A., Cannat, M., and Demont, A.: Implications of pressure-dependent permeability for hydrothermal heat transfers, EGU General Assembly 2025, Vienna, Austria, 27 Apr–2 May 2025, EGU25-4307, https://doi.org/10.5194/egusphere-egu25-4307, 2025.

EGU25-4333 | ECS | Posters on site | GD5.3

Tectonics control alteration-induced rheological heterogeneities in magma-poor ultraslow-spread oceanic lithospheres 

Leila Mezri, Alexander Diehl, Thomas P. Ferrand, Javier Javier García-Pintado, Manon Bickert, and Marta Pérez-Gussinyé

At ultraslow, magma-poor spreading ridges, plate divergence is controlled by tectonics, leading to the formation of detachment faults. These faults cut through thick, brittle lithosphere (up to 15 km) and accommodate tens of kilometers of displacement, exposing heterogeneous, altered rocks. Among the alteration reactions, serpentinization has garnered significant attention for its role in sustaining chemosynthetic microbial life and influencing the spatial distribution of earthquakes within the lithosphere. Although the influence of serpentinization on seismicity is largely recognized in ultraslow-spread lithospheres, the nature and extent of alteration remain poorly constrained.

To address this, we use a 2D visco-elasto-plastic model with thermodynamic calculations to simulate lithospheric alteration during ultraslow seafloor spreading under a low magma budget. By coupling water availability and lithospheric hydration progress with active deformation, we reveal: (i) a tectonically controlled vertical extent of alteration along detachment faults; (ii) the preservation of amphibole-facies in exhumed serpentinized footwalls, forming kilometer-scale asperity-like features; and (iii) significant lithospheric-scale rheological heterogeneities resulting from tectonically induced spatial variations in alteration mineral assemblage equilibria across the lithosphere. The largest rheological changes occur along the deep hydration front near the brittle-ductile transition zone, where the alteration of exhumed fresh mantle begins to form high-temperature amphibole-bearing assemblages.

By comparing our model results with seismic data from two magma-poor segments—the easternmost Southwest Indian Ridge and the Knipovich Ridge—we observe that sparsely seismically active regions correlate with highly serpentinized domains in the shallow lithosphere, while deeper seismically active zones correspond to areas with low alteration degrees and the presence of amphibole, talc, and chlorite in amphibole-bearing assemblages. These findings support a conceptual model suggesting that tectonics controls the formation of alteration-induced rheological heterogeneities, which play a key role in controlling earthquake depth distribution at mid-ocean ridges and associated transform faults, and also have implications for seismogenesis in subduction zones.

How to cite: Mezri, L., Diehl, A., Ferrand, T. P., Javier García-Pintado, J., Bickert, M., and Pérez-Gussinyé, M.: Tectonics control alteration-induced rheological heterogeneities in magma-poor ultraslow-spread oceanic lithospheres, EGU General Assembly 2025, Vienna, Austria, 27 Apr–2 May 2025, EGU25-4333, https://doi.org/10.5194/egusphere-egu25-4333, 2025.

EGU25-4386 | ECS | Orals | GD5.3

Tectonics control seismic velocity anomalies in magma-poor ultraslow-spread oceanic lithospheres 

Leila Mezri, Javier García-Pintado, Alexander Diehl, and Marta Pérez-Gussinyé

At ultraslow-spreading mid-ocean ridges (MORs, spreading rate <20 mm/yr), limited magma supply often results in tectonic extension and the formation of oceanic detachment faults. These faults cut through thick brittle lithosphere (up to 15 km), accommodating tens of kilometers of displacement and exposing heterogeneous rocks altered by seawater-rock interactions. Among these reactions, serpentinization has drawn significant attention for its role in sustaining chemosynthetic microbial life and modulating geological carbon budgets. However, quantitatively determining the extent and distribution of serpentinization within the lithosphere remains challenging, as large-scale estimates rely primarily on seismic observations that struggle to differentiate between serpentinized mantle, gabbro, and fresh mantle at depth. Despite advances in seismic resolution, key uncertainties persist regarding how magmatic, tectonic, and alteration processes shape velocity anomalies in newly formed oceanic lithosphere. Here, we address lithospheric alteration during magma-poor seafloor spreading by coupling a geodynamic model with thermodynamic calculations of alteration reactions and seismic properties as a function of pressure-temperature and mineral assemblages. We focus on the well-documented magma-poor ridge at 64°30′E on the Southwest Indian Ridge, where recent seismic surveys have been conducted. Our model reproduces the “smooth-smooth” seafloor morphology shaped by alternating flip-flop detachments. By coupling water availability and lithosphere alteration with active deformation, we reveal: (i) vertically controlled alteration along detachments, including deep alteration beyond serpentine stability; and (ii) tectonically-induced lateral velocity anomalies caused by variations in alteration mineral assemblages in the detachment footwall. Comparing our thermodynamically-constrained velocity model with seismic observations from 64°30′E SWIR suggests that the imaged alteration boundary along detachment faults likely represents a peak in serpentinization, rather than the traditionally interpreted serpentinization front.

How to cite: Mezri, L., García-Pintado, J., Diehl, A., and Pérez-Gussinyé, M.: Tectonics control seismic velocity anomalies in magma-poor ultraslow-spread oceanic lithospheres, EGU General Assembly 2025, Vienna, Austria, 27 Apr–2 May 2025, EGU25-4386, https://doi.org/10.5194/egusphere-egu25-4386, 2025.

EGU25-4667 | Posters on site | GD5.3

Highly variable lithospheric structure and associated magmatic accretion at the ultraslow-spreading Gakkel Ridge 

Jiabiao Li, Tao Zhang, Xiongwei Niu, Zhiteng Yu, Xiaodong Wei, Caicai Zha, Jie Jiang, Pingchuan Tan, Chunguo Yang, Zhezhe Lu, Weiwei Ding, and Yinxia Fang

The mid-ocean ridge (MOR) is the longest volcanic chain on the Earth (∼75,000 km), with spreading rates varying from fast (>80 mm/yr) to ultraslow (<20 mm/yr). It is generally believed that mantle beneath MORs upwells passively due to viscous drag from the diverging tectonic plates, leading to pressure-release melting. While passive mantle upwelling models explain the uniform crustal thickness observed at fast-spreading ridges, they fail to account for the complexities at ultraslow-spreading ridges. At these ridges, enhanced conductive cooling and hydrothermal circulation thicken the ocean lithosphere, shrinking the melting zone and inhibiting melt production. The fundamental dynamics governing crustal accretion at ultraslow-spreading ridges remain elusive. In 2021, we conducted a high-resolution active-source ocean-bottom seismometer (OBS) experiment along the eastern ultraslow-spreading Gakkel Ridge between 76° and 100° E using the icebreaker ‘Xuelong 2’, during the Joint Arctic Scientific Mid-ocean ridge Insight Expedition (JASMInE). Our new seismic model reveals highly variable crustal thickness, which ranges from 3.3 km to 8.9 km along the ridge axis. Meanwhile, this thickness increases from ~4.5 km to ~7.5 km over the past 5 Myr across the ridge axis. In addition, the magnetotelluric data reveals prominent low-resistivity zones at depths 20–45 km beneath volcanic centers, but high resistivities (>100 Ω m) down to ~ 50 km at volcanic ends, indicating highly variable electrical lithosphere (eLAB). Microearthquakes recorded by the OBSs occurred at depths of <10 below the seafloor along the ridge axis, suggesting a relatively shallow brittle lithosphere and a high magma supply. These observations contradict the passive upwelling models and are instead consistent with buoyant active mantle flow model that is driven by thermal and compositional density changes due to melt extraction. Active mantle upwelling is predicted to play a more significant role as the spreading rate decreases, which is highly sensitive to the mantle temperature and composition. This implies that the observed variability in crustal and lithospheric thickness is likely an inherent characteristic of ultraslow-spreading ridges.

How to cite: Li, J., Zhang, T., Niu, X., Yu, Z., Wei, X., Zha, C., Jiang, J., Tan, P., Yang, C., Lu, Z., Ding, W., and Fang, Y.: Highly variable lithospheric structure and associated magmatic accretion at the ultraslow-spreading Gakkel Ridge, EGU General Assembly 2025, Vienna, Austria, 27 Apr–2 May 2025, EGU25-4667, https://doi.org/10.5194/egusphere-egu25-4667, 2025.

EGU25-4754 | ECS | Posters on site | GD5.3

Microbial Residents in Serpentinized Upper Mantle of the Atlantis Massif 

Zhicheng Wang, Ruize Xie, Jialin Hou, Lewen Liang, William Brazelton, and Fengping Wang and the IODP Expedition 399 Scientists

The rock-hosted subseafloor biosphere provides key insights into the limits and origins of life, yet it remains largely unknown due to limited access. Recently, IODP Expedition 399 provided unprecedented access to a 1,268-meter core from the upper mantle of the Atlantis Massif, primarily composed of serpentinized harzburgite. The abundance and composition of indigenous organisms, their metabolic capabilities, physiological activity, and the role of serpentinization in sustaining life are critical, yet unanswered questions. However, the extremely low biomass and high DNA adsorption capacity of these mantle rocks present significant challenges for DNA extraction and contamination control, limiting our exploration of the rock-hosted biosphere. In this study, we made notable progress by distilling and refining DNA extraction protocols. Using 16S rRNA gene amplicon and metagenomic sequencing, we specifically developed the quality control and decontamination workflow tailored to the unique complexities of low-biomass samples. In this context, we characterized candidate microbial residents within the rocks and fluids, including Campylobacteria, Aquificae, Dehalococcoidia, Bathyarchaeia, Hadarchaeia, Methanosarcinia, and Nitrososphaeria, with distinct phylogenies from those typically found in seawater and sediments. These putative microbial residents likely play key roles in mediating the carbon, nitrogen, and sulfur cycles between the mantle rocks and formation fluids. Our findings suggest the presence of a complex metabolic network capable of thriving in the mantle rocks under high-temperature, hydrogen-rich, and alkaline conditions, underscoring the adaptability of microbial life in extreme subsurface environments. These results contribute to a broader understanding of life’s resilience in the deep biosphere and offer new insights into the origins of life and the potential for extraterrestrial life.

How to cite: Wang, Z., Xie, R., Hou, J., Liang, L., Brazelton, W., and Wang, F. and the IODP Expedition 399 Scientists: Microbial Residents in Serpentinized Upper Mantle of the Atlantis Massif, EGU General Assembly 2025, Vienna, Austria, 27 Apr–2 May 2025, EGU25-4754, https://doi.org/10.5194/egusphere-egu25-4754, 2025.

EGU25-5117 | Orals | GD5.3

Origin and implications of the amagmatic segment of the Gakkel Ridge 

Alexandra Yang Yang, Charles Langmuir, and Peter Michael

Global ocean crust has an average thickness of 6–7 kilometers, suggesting a globally pervasive, rather uniform mantle composition. At some ultra-slow spreading ridges, crustal thickness is highly variable and mantle peridotite can be found at the surface. The peridotites, however, are mostly recovered in fracture zones that expose the deeper crust, or at the edges of ridge segments where there is a central volcano. The Gakkel Ridge is unusual in this regard because it contains a 400-kilometer-long sparsely magmatic zone (SMZ) with extensive mantle peridotite exposure, negligible crustal thickness and limited basaltic lava outcrops. This segment is also bracketed by two other sections of ridge that have active volcanism, including the adjacent Western Volcanic Zone (WVZ) where no peridotites were recovered. What is the origin of this enigmatic expanse of ridge, and is it simply a curiosity or does it have global implications for ocean ridges and mantle recycling?
 
We have undertaken systematic geochemical analysis of 267 basaltic glass samples from the WVZ and the few recovered basalts from the SMZ. The WVZ has normal-thickness oceanic crust and predominantly produces depleted normal mid-ocean ridge basalt (N-MORB). Gradients in chemical composition can be accounted for by a combination of more depleted mantle and lower extents of melting as the SMZ is approached. Across an abrupt boundary, the SMZ has negligible crustal thickness and is dominated by exposed mantle peridotite and a few samples of enriched mid-ocean ridge basalt (E-MORB).
 
Quantitative models suggest the SMZ is the result of cold, ancient ocean mantle lithosphere that has been metasomatized by enriched, low degree melts. While the SMZ is a rare occurrence, simple mass balance considerations suggest such occurrences should instead be very common. While recycled ocean crust is commonly called upon, sometimes as an isolated lower mantle reservoir, the mass of depleted ocean mantle lithosphere would be more than ten times greater. Indeed, using current ridge production rates, over the last 2.5 billion years the total volume of recycled mantle lithosphere would be equivalent to the volume of the entire lower mantle. While vestiges of such lithosphere are frequently invoked from Os isotopes or melt inclusions, almost all of these occurrences are coincident with predominant basalts, and occur in regions with normal crustal thickness. Why are there not vast regions dominated by depleted lithosphere, negligible crust, or common occurrences of basalts that come from highly depleted reservoirs? An obvious solution is that mantle convection is highly efficient at mixing crustal and mantle components on a scale finer than is sampled by melting, permitting relatively uniform crustal thickness and composition on a global basis.

How to cite: Yang, A. Y., Langmuir, C., and Michael, P.: Origin and implications of the amagmatic segment of the Gakkel Ridge, EGU General Assembly 2025, Vienna, Austria, 27 Apr–2 May 2025, EGU25-5117, https://doi.org/10.5194/egusphere-egu25-5117, 2025.

EGU25-5278 | ECS | Orals | GD5.3

 Rapid exhumation of mantle rocks along detachment faults facilitated by felsic granitoid intrusions at a continent-ocean transition drilled in the Tyrrhenian Sea 

Eirini Poulaki, Manon Bickert, Paola Vannucchi, Brandon Shuck, Tomoaki Morishita, Alessio Sanfilippo, Ashutosh Pandey, Norikatsu Akizawa, Emily Cunningham, Riccardo Tribuzio, Jaime Barnes, Joshua Garber, Claudiu Nistor, Rachel Bernard, and Matthew Loocke and the IODP Expedition 402 Team

Mantle exhumation mechanisms at continent-ocean transitions (COTs) are similar to those at slow and ultraslow spreading ridges, where plate divergence is also accommodated by a combination of magmatic processes and detachment faulting. However, the timescales of exhumation at COTs are poorly constrained because of the thick sediment cover blanketing basement rocks along mature passive margins. IODP Exp. 402 drilled the Tyrrhenian Sea COT and successfully recovered in situ sections of mantle exhumed during Late Cenozoic extension in this back-arc basin. Onedrill site sampled a sequence of variably deformed granitic gneisses intercalated with ~cm-thick slivers of peridotites and basalts, and another drill site sampled a heterogeneous section of heavily serpentinized peridotites with granitoids between the ultramafics. Structural observations and core recovery trends indicate localized deformation along the granitoids, with fabrics varying from undeformed to mylonitic. The presence of both peridotites and felsic granitoids provides a unique opportunity to acquire precise ages for the exhumation and deformation stages that have not yet been resolved in detail.

Zircon and apatite U-Pb geochronology of granitoids yields similar Pliocene ages (<4 Ma), coeval with the biostratigraphic ages of the basal overlying sediments, requiring crystallization at depth followed by rapid exhumation. Thin section microstructures and Electron Backscatter Diffraction data suggest that these granitoids accommodated significant strain during exhumation along a detachment fault. Quartz and feldspar in the mylonites are deformed by dislocation creep, with quartz exhibiting grain boundary rotation and migration, and feldspar displaying bulging, suggesting deformation at temperatures of ~450°C. In contrast, quartz in the protomylonite shows polygonal-shaped grains, indicating static recrystallization at high temperatures with low strain. Ti in quartz analyses yields temperatures of ~400°C for both mylonites and protomylonites, suggesting that the differences in the microstructures are strain dependent and that shear was localized within a ~5-m-thick zone. These chronological and microstructural constraints require >1 cm/year exhumation rates after granitoid emplacement. Lastly, stable isotope constraints from the surrounding peridotites give serpentinization temperatures of ~200°C, with higher temperatures adjacent to granitic intrusions. These results, together with microstructural observations, suggest that serpentinization occurred at shallower depths, after most of the unroofing. Overall, we show that felsic lithologies facilitate most of the exhumation prior to serpentinization and demonstrate that heterogeneous lithologies and pre-existing structures have a major influence on the slip behavior of faults at COTs.

How to cite: Poulaki, E., Bickert, M., Vannucchi, P., Shuck, B., Morishita, T., Sanfilippo, A., Pandey, A., Akizawa, N., Cunningham, E., Tribuzio, R., Barnes, J., Garber, J., Nistor, C., Bernard, R., and Loocke, M. and the IODP Expedition 402 Team:  Rapid exhumation of mantle rocks along detachment faults facilitated by felsic granitoid intrusions at a continent-ocean transition drilled in the Tyrrhenian Sea, EGU General Assembly 2025, Vienna, Austria, 27 Apr–2 May 2025, EGU25-5278, https://doi.org/10.5194/egusphere-egu25-5278, 2025.

EGU25-5724 | ECS | Posters on site | GD5.3

Thermal structure and stress pattern of the oceanic transform fault: insights form 3D numerical modelling 

Ming Chen, Lars Rüpke, Ingo Grevemeyer, Yu Ren, and Sibiao Liu

Oceanic transform faults (OTFs) are one of three classes of plate boundaries representing the most seismogenic part of the global mid-ocean ridge (MOR) system. Their cumulate length represents more than 40% of the global MOR system. In a classical view, OTFs are perpendicular to mid-ocean ridges and considered as pure strike-slip zones where one plate moves past another and no material is added or destroyed. Recent studies show that OTFs are oblique boundaries where extensional tectonics and a two-phase crustal grow, which challenges a major concept of plate tectonics. However, thermal structure and stress pattern that are key to explore geodynamics processes at OTFs remain poorly understood.

We conducted 3D numerical simulations of plate separation and dike injection at a ridge-transform-ridge system by using the geodynamic code LaMEM (Lithosphere and Mantle Evolution Model). Our results reveal three key findings. First, OTFs are always deeper and warmer than fracture zones for all models, which could be well explained by focused brittle deformation that locally reduces viscosity and strength of OTFs, allowing the far-field tectonic stretching to be preferentially partitioned into the transform domain. Mantle upwelling beneath rheologically weaken OTFs is therefore locally enhanced. Second, plate boundaries of ridge-transform intersections (RTIs) at depth are oblique, which is structurally different from its seafloor expressions. Its obliqueness increases with depth and reduced dike injection rate to the inside corner of ridge segments. Third, we found in all models, that strike-slip faulting, which is thought to be a main feature of OTFs only occurs at distances away from the RTIs. Approaching the RTIs, maximal horizontal stress is oblique to OTFs by more than 45, indicating transform-normal extension at the inside corner. These results provide a first-order constraint on thermal and mechanical behaviour of OTFs and are in line with recent bathymetry, gravity and micro-earthquake evidence.

How to cite: Chen, M., Rüpke, L., Grevemeyer, I., Ren, Y., and Liu, S.: Thermal structure and stress pattern of the oceanic transform fault: insights form 3D numerical modelling, EGU General Assembly 2025, Vienna, Austria, 27 Apr–2 May 2025, EGU25-5724, https://doi.org/10.5194/egusphere-egu25-5724, 2025.

EGU25-5906 | ECS | Posters on site | GD5.3

Magmatism distribution and modes of seafloor spreading at a Ridge-transform fault system revealed by marine magnetics 

Fei Zhou, Ingo Grevemeyer, Lars H. Rüpke, and Colin W. Devey

The interaction between transform faults and mid-ocean ridges results in complex magmatic distribution, consequently, intricate crustal accretion processes. In this study, we present magnetic survey data collected over the Argo transform fault in the Central Indian Ocean. Magnetic modeling was conducted along two profiles crossing the adjacent spreading center and one profile over the transform fault. The results reveal the absence of a central magnetic anomaly over the spreading center where it intersects with the transform fault indicating reduced magmatic activity. In this case, plate divergence is alternately driven by magmatic and tectonic processes. Isochron alignment on both sides of the transform fault correlates well, indicating an age offset of 7.5 Myr and a consistent half-spreading rate. The profile over the transform fault and associated fracture zones (FZs) shows strong magmatic signals in the FZ areas near the outside corners, suggesting magma intrusion from the juxtaposed ridge. Conversely, most areas along the transform fault exhibit weak magnetic signals, except for a moderate magnetic anomaly over a transform-parallel serpentinite ridge with gabbro intrusions. These findings further demonstrate that transform faults are not simple conservative plate boundaries and shed light on the dynamics of magmatism and seafloor spreading in ridge-transform systems.

How to cite: Zhou, F., Grevemeyer, I., H. Rüpke, L., and W. Devey, C.: Magmatism distribution and modes of seafloor spreading at a Ridge-transform fault system revealed by marine magnetics, EGU General Assembly 2025, Vienna, Austria, 27 Apr–2 May 2025, EGU25-5906, https://doi.org/10.5194/egusphere-egu25-5906, 2025.

EGU25-6973 | ECS | Posters on site | GD5.3

Microseismicity of the Eastern Gakkel Ridge, Arctic Ocean  

Xinran Li, Zhiteng Yu, Jiabiao Li, Yan Jia, Zhangju Liu, Xiongwei Niu, Zhongyan Shen, Zhengyi Tong, Pingchuan Tan, Tao Zhang, Weiwei Ding, and Yinxia Fang

The mid-ocean ridge forms new oceanic lithosphere, which subsides, thickens, and moves away from the ridge axis. It is generally believed that the lithospheric thickness is dependent on spreading rate. At ultraslow-spreading ridges (<20 mm/yr), the lithosphere is expected to thicken substantially due to strong hydrothermal cooling and limited magma supply. However, this view has been challenged by the observed highly variable crustal thickness at the ultraslow-spreading Southwest Indian Ridge and Gakkel Ridge, where their lithospheric structures are poorly understood due to limited passive seismic observations. In particular, the Gakkel Ridge, located in the Arctic Ocean, is the slowest-spreading mid-ocean ridge in the world, but no onsite microseismicity has been reported due to severe ice conditions. The 2021 JASMInE cruise marked the first deployment of Ocean Bottom Seismometers (OBSs) array in the eastern part of Gakkel Ridge. 43 OBSs with spacings of 5-10 km were set up to record both air-gun source signals and natural seismic signals. These instruments were deployed along and across the ridge axis, with a focus on the volcanic area at 85°E, covering a range from 75°E to 102°E. Analysis of seismic data identified 234 microearthquakes that occurred continuously in August 2021, and ~50% of them have uncertainties of <10 km. Their focal depths are located no deeper than 13 km below the sea floor (bsf), with most events located at 0-10 km bsf. This depth range is much shallower compared to the microseismicity observed by seismic stations installed on the ice floes during the 2007 AGAVE expedition, where most events were found between 7-16 km deep. We reanalyzed the seismic data collected during the 2007 AGAVE expedition, and preliminary results indicate that the seismic phases have a very low signal-to-noise ratio, with poorly picked S-wave phases, which may result in the observed differences. Furthermore, the newly observed deepest depth of these seismic events is consistent with the 600°C isotherm as previously calculated, approximately 12.6 km bsf. It is unexpected that no earthquakes were recorded beneath the volcano center where explosive volcanic eruption was reported in 1999. Seismic source mechanism analysis reveals normal faulting near the volcano center, but no volcanic swarm-like events were observed. Instead, most earthquakes were concentrated near the segment end at around 88°E, likely associated with a normal fault inclined southward within the rift valley. In addition to the JASMInE cruise, a small seismic network consisting of five OBSs was deployed in August 2023 at the 100°E volcanic center. These instruments were operated on the seabed for approximately one week, but no microearthquakes were detected. These observations may suggest that, at ultraslow-spreading ridges, despite robust magma supply in magmatic segments, magmatic activity is not vigorous. Crust accretion and episodic volcanic eruptions appear to be short-lived, and for most of the time, the magmatic system remains in a period of seismic quiet.

How to cite: Li, X., Yu, Z., Li, J., Jia, Y., Liu, Z., Niu, X., Shen, Z., Tong, Z., Tan, P., Zhang, T., Ding, W., and Fang, Y.: Microseismicity of the Eastern Gakkel Ridge, Arctic Ocean , EGU General Assembly 2025, Vienna, Austria, 27 Apr–2 May 2025, EGU25-6973, https://doi.org/10.5194/egusphere-egu25-6973, 2025.

EGU25-7472 | ECS | Posters on site | GD5.3

Magnetic Characterization of Borehole Samples from IODP Expedition 399: Atlantis Massif, Mid-Atlantic Ridge 

Ethan Lopes, Olivia Ju, Sonia Tikoo, Ji-in Jung, and Dale Burns and the IODP Expedition 399 Science Party

Serpentinization is a hydrothermal process that often forms magnetite, significantly altering the magnetic properties of ultramafic rocks at mid-ocean ridges. However, the evolution of these magnetic properties during serpentinization and their stability over geological timescales are not completely understood. The Atlantis Massif, one of the best-studied oceanic core complexes, is an ideal place to study serpentinization's effects on rock magnetism. IODP Expedition 399 drilled a deep (1268m) borehole (Hole U1601C) into uplifted lower crustal and upper mantle rocks on the Mid-Atlantic Ridge, providing an excellent opportunity to study the variation in rock magnetic properties with spatial context at mid-ocean ridges. In-depth magnetic properties were analyzed using facilities at Stanford and the Institute for Rock Magnetism at the University of Minnesota. We measured room temperature hysteresis loops, back field curves, magnetic properties measurement system, first-order reversal curves, low and high-temperature magnetic susceptibility, and anisotropy of magnetic susceptibility. We found that the magnetic carriers for serpentinized peridotites consisted predominantly of stoichiometric magnetite. Magnetic carriers for gabbros were dominated by magnetite and titanomagnetite, with noticeable contributions from monoclinic pyrrhotite in some samples. Most of the serpentinized samples exhibited vortex (pseudo-single domain-like) domain behavior. Ongoing scanning electron microscopy (SEM) and energy dispersive X-ray spectroscopy measurements are being used to contextualize the spatial distribution of magnetic minerals in relation to primary phases, secondary minerals (ex. lizardite, brucite), cracks, and void spaces. Tentative results indicate that iron sulfides in gabbros were predominantly located in cracked regions, while SEM-detectable magnetite grains in serpentinized peridotites were typically found along the rims of relict olivine grains.

How to cite: Lopes, E., Ju, O., Tikoo, S., Jung, J., and Burns, D. and the IODP Expedition 399 Science Party: Magnetic Characterization of Borehole Samples from IODP Expedition 399: Atlantis Massif, Mid-Atlantic Ridge, EGU General Assembly 2025, Vienna, Austria, 27 Apr–2 May 2025, EGU25-7472, https://doi.org/10.5194/egusphere-egu25-7472, 2025.

In the summer of 2024, we conducted the first magnetotelluric (MT) profile survey beneath sea ice at the ultraslow spreading Gakkel Ridge. A total of 17 MT instruments were deployed for approximately 20 days along a 125 km profile across the ridge axis at 100°E. This profile spanned the 0–14 Ma lithosphere north of the Gakkel Ridge. Preliminary analysis reveals a zone of high electrical conductivity at depths of 30–50 km beneath the ridge axis, attributed to a high-degree partial melting zone. A more striking feature is the abrupt deepening of the electrical lithospheric base to ~65 km just north of the ridge axis, beyond which it flattens significantly. The flat lithospheric base likely represents a dehydration boundary, where water content sharply decreases above it due to melting processes. The dehydration could enhance mantle viscosity by 2–3 orders of magnitude, suggesting that the mechanical lithosphere near the ridge axis is governed more by compositions than by thermal structure. The depth of this boundary aligns with the seismic reflection boundary in the Atlantic Ocean, the Gutenberg discontinuity, and the top of the seismic radial anisotropy layer, indicating a possible global significance of this feature.

How to cite: Zhang, T., Li, J., and Team, J.: Magnetotelluric evidence for a compositionally controlled lithosphere at the Gakkel Ridge, Arctic Ocean, EGU General Assembly 2025, Vienna, Austria, 27 Apr–2 May 2025, EGU25-7632, https://doi.org/10.5194/egusphere-egu25-7632, 2025.

EGU25-7696 | ECS | Posters on site | GD5.3

Chemically heterogeneous asthenosphere beneath the Gakkel Ridge constrained by abyssal peridotites 

Yang Xu, Chuan-Zhou Liu, and Yin-Zheng Lin

The refractory mantle contributes little to the genesis of mid-ocean ridge basalts (MORB), thus observations of the component of the asthenospheric mantle based on the MORB alone are incomplete. In this study, we present both major and trace element compositions of ~70 abyssal peridotite samples from the Sparsely Magmatic Zone (SMZ) and Eastern Volcanic Zone (EVZ) of the Gakkel Ridge. Compositional data indicate that they are mantle residues of the asthenosphere after variable degrees of partial melting. Their clinopyroxenes display two different types of REE patterns, i.e., LREE-depleted and LREE-flat. The latter suggests that some Gakkel peridotites have been refertilized by quasi-instantaneous melts that retained in the melting column. The Gakkel peridotites show large geochemical variability along the ridge axis at length-scales which are too short to be thermally driven. Degrees of partial melting modelled by peridotite geochemistry are greater than those inferred seismically by crustal thicknesses in the SMZ and EVZ. This implies that compositional variations in those abyssal peridotites are inherited from prior melting. In addition, the composition of the Gakkel peridotites differs significantly from that of the subduction-related peridotites. Trace element modelling further supports the presence of a geochemically decoupled crust-mantle. We suggest that the strong heterogeneity of theasthenosphere beneath the Gakkel Ridge is the dominant driver of crust-mantle geochemical decoupling. In particular, in the SMZ region, the small amount of enriched mantle domains in the asthenosphere become the source of the enriched MORB, while massive refractory mantle inherited from prior melting hardly contributes to the SMZ basalts. Therefore, compositional signatures of asthenospheric mantle inferred from MORB of amagmatic zones along mid-ocean ridges may considerably overestimate the proportion of enriched mantle.

How to cite: Xu, Y., Liu, C.-Z., and Lin, Y.-Z.: Chemically heterogeneous asthenosphere beneath the Gakkel Ridge constrained by abyssal peridotites, EGU General Assembly 2025, Vienna, Austria, 27 Apr–2 May 2025, EGU25-7696, https://doi.org/10.5194/egusphere-egu25-7696, 2025.

EGU25-8006 | ECS | Posters on site | GD5.3

Interplay between tectonics, magmatism, and hydrothermal activity in slow-spreading systems: insights from the sheeted dike complexes of the Limassol Forest and Troodos ophiolites, Cyprus 

Maureen van den Bosch, Sanne van den Ing, Anke van Grieken, Anouk Beniest, and Richard Wessels

Cyprus exposes a world-class ophiolite containing a fossil ridge-transform system that formed in an (ultra)slow spreading supra-subduction zone setting. The stratigraphic completeness and outcrop quality make it uniquely suited for studying its (de)formation history and associated magmatic and hydrothermal processes. The Arakapas Transform Fault separates two distinct domains of the ophiolite; in the north, the Troodos ophiolite largely conforms to the Penrose stratigraphy, while in the south, the Limassol Forest Complex (LFC) is characterised by anomalous stratigraphic and structural contacts.
In this study, the intrusive history of the sheeted dike complex in the Limassol Forest is unravelled on the basis of field observations, petrology, and geochemistry, and compared with the sheeted dike complex of the Troodos ophiolite. Field descriptions and the relative timing of dike sets in the Limassol Forest and Troodos are expanded with geochemical and petrological characterization of selected samples using optical and scanning electron microscopy combined with whole-rock, trace, and rare-earth elemental analyses.
The geological, geochemical, and petrological data will be used to determine and compare the evolution of the Limassol Forest Complex and the Troodos ophiolite. Their heterogeneous evolution, and the influence of the Arakapas Transform Fault, provide insights into the interplay between tectonic, magmatic, and hydrothermal processes active at slow spreading ridge-transform systems.

How to cite: van den Bosch, M., van den Ing, S., van Grieken, A., Beniest, A., and Wessels, R.: Interplay between tectonics, magmatism, and hydrothermal activity in slow-spreading systems: insights from the sheeted dike complexes of the Limassol Forest and Troodos ophiolites, Cyprus, EGU General Assembly 2025, Vienna, Austria, 27 Apr–2 May 2025, EGU25-8006, https://doi.org/10.5194/egusphere-egu25-8006, 2025.

EGU25-8156 | Orals | GD5.3

Hydrothermal activity along the young, ultra-slow spreading Red Sea Rift – an update from recent discoveries 

Froukje M. van der Zwan, Nico Augustin, Sven Petersen, Isabel Diercks, and Sylvia G. Sander

Hydrothermal activity has been intensively studied at mature mid-ocean ridges and is crucial for the formation of mineral resources, as habitats for chemosynthetic communities, and for the cooling of the newly formed oceanic lithosphere1. However, the role of hydrothermal circulation in the early history of a young emerging ocean basin shortly after continental breakup and the geological expression of its hydrothermal vents, their geochemical characteristics, and their associated ecosystems can only be studied at a few locations. The Red Sea Rift is one of Earth’s youngest ocean basins, but despite ample indications for hydrothermal activity based on rock chemistry, the presence of extinct chimney fields, metalliferous sediments, and high-temperature brine poolssee overview in 2, the first direct observation of active hydrothermal vents was only reported in 20223. These vents at the axial volcano, Hatiba Mons, constitute one of the largest active hydrothermal areas worldwide, hosting 43 individual fields. In contrast to many mature locations, no high-temperature vent nor specialized macro-fauna was observed. Instead, the vents were characterized by low-temperature fluids, numerous Fe-Mn-oxyhydroxide mounds, and thriving microbial mats3. As this was the first active hydrothermal area observed in the Red Sea, the question remains if this is typical for the Red Sea and potentially for young mid-ocean ridges.

Here we present the outcomes of two expeditions in 2023 with the R/V Aegaeo (KRSE5-1) and R/V Meteor (M194)4, which resulted in the discovery of five more hydrothermally active areas distributed along the Red Sea Rift between 17°N and 25°N at water depths between 400-1,800 m. All hydrothermal areas consist of multiple smaller vent fields with similar low-temperature venting as reported from Hatiba Mons. The locations of the vents in their geological context and the expressions of hydrothermal occurrences show some variations ranging from small chimneys along fault lines to larger mounds covering wider areas.  We compare the six hydrothermal fields in terms of their geology, geomorphological expression, precipitate chemistry, and fluid characteristics to evaluate their regional differences and similarities to further understand the nature of hydrothermal venting in a young oceanic basin.


1Hannington et al. (2005) In: Economic Geology 100th Anniversary Volume, 111-141

2F. M. van der Zwan et al. (2019) In: Geological Setting, Palaeoenvironment and Archaeology of the Red Sea. Springer, 221-232

3F. M. Van der Zwan et al. (2023) Communications Earth & Environment 4 (1), 496

4N. Augustin (2023) METEOR Short Cruise report, M194. GEOMAR Helmholtz Centre for Ocean Research https://oceanrep.geomar.de/id/eprint/59591

How to cite: van der Zwan, F. M., Augustin, N., Petersen, S., Diercks, I., and Sander, S. G.: Hydrothermal activity along the young, ultra-slow spreading Red Sea Rift – an update from recent discoveries, EGU General Assembly 2025, Vienna, Austria, 27 Apr–2 May 2025, EGU25-8156, https://doi.org/10.5194/egusphere-egu25-8156, 2025.

EGU25-8189 | ECS | Posters on site | GD5.3

The Jøtul field revisited: High carbon and hydrogen fluxes from a sediment‑hosted hydrothermal vent site in the Knipovic Ridge 

Alexander Diehl, Patrick Monien, Thomas Pape, Eirini Anagnostou, Eva-Maria Meckel, Miriam Römer, Donata Monien, Wolfgang Bach, and Gerhard Bohrmann

We report on the composition of gas‑tight hydrothermal vent fluid samples from the Jøtul field at the ultraslow spreading Knipovic ridge, collected during the R/V MARIA S. MERIAN expedition MSM131 in September 2024. The sampled fluids exhibit high pH values and total alkalinities. Elevated methane concentrations–exceeding those at the sediment-hosted Guaymas Basin vent site–suggest fluid-sediment interaction and thermal decomposition of organic matter derived from continental sediments. These fluids also contain high hydrogen concentrations (>14 mM), which surpass typical values for sediment-hosted hydrothermal vent fluids. The elevated hydrogen levels are accompanied by low H2S concentrations (< 2.5 mM), which might point to a heazlewoodite-pentlandite mineral assemblage controlling the concentrations of these compounds. We suggest that the hydrothermal vent fluids at the Jøtul field acquire their distinct chemical signatures through a combination of fluid‑sediment interactions in the recharge and discharge zones, along with fluid rock interactions governed by ultramafic rocks in the high‑temperature reaction zone. This combination of subsurface conditions produces vent fluids that are metal‑poor but enriched in carbon and hydrogen. The high methane concentrations measured in the Jøtul field highlight hydrothermal fluid‑sediment interactions as a yet underestimated source of carbon emissions into the ocean.

How to cite: Diehl, A., Monien, P., Pape, T., Anagnostou, E., Meckel, E.-M., Römer, M., Monien, D., Bach, W., and Bohrmann, G.: The Jøtul field revisited: High carbon and hydrogen fluxes from a sediment‑hosted hydrothermal vent site in the Knipovic Ridge, EGU General Assembly 2025, Vienna, Austria, 27 Apr–2 May 2025, EGU25-8189, https://doi.org/10.5194/egusphere-egu25-8189, 2025.

EGU25-8689 | ECS | Posters on site | GD5.3

An oceanic core complex on Cyprus? Unravelling the Limassol Forest ophiolite. 

Sanne van den Ing, Maureen van den Bosch, Anouk Beniest, and Richard Wessels

The Troodos ophiolite on Cyprus contains a world-class exposure of a ridge-transform system that developed in a supra-subduction zone setting, making it an ideal location to study the associated tectonic and magmatic processes. On Cyprus, the Arakapas Transform Fault separates the ophiolite into distinct terrains. South of this fault lies the Limassol Forest Complex (LFC), an anomalous domain with stratigraphic and structural contacts that differ markedly from the characteristic Penrose ophiolite stratigraphy.
The LFC was likely formed in an (ultra)slow-spreading environment, dominated by temporally and spatially variable magmatic and amagmatic extension. Evidence of magmatism includes extensive dike intrusions observed throughout the stratigraphy, suggesting a dynamic system with ongoing melt generation and emplacement. The structural contact between the crust and mantle lithologies however indicates episodes of amagmatic tectonic extension, responsible for dismembering the crustal sequence of the LFC, bearing similarities with oceanic core complexes.
To evaluate the resemblance of the LFC to oceanic core complexes, this study focuses on the crust-mantle contact in the northwestern part of the LFC. By integrating high-resolution drone imagery, structural measurements, and detailed geological mapping, we refine our understanding of the stratigraphic contacts, intrusive relationships, and deformation processes. The relative timing of intrusive and tectonic events will help clarify the interactions between magmatic and extensional processes.
The results will be compared to known oceanic core complexes, such as the Monviso ophiolite, active systems along the Mid-Atlantic Ridge, and active supra-subduction zones, such as the Philippine Sea Plate, to identify similarities in mantle exhumation processes, fault dynamics, and magmatic-tectonic interactions. These findings have implications for the evolution of transform margins, the role of magmatism in slow-spreading systems, and the influence of supra-subduction processes on oceanic lithosphere formation. By highlighting the interaction of tectonic, and magmatic processes, this study places the LFC in the larger context of ridge-transform fault systems.

How to cite: van den Ing, S., van den Bosch, M., Beniest, A., and Wessels, R.: An oceanic core complex on Cyprus? Unravelling the Limassol Forest ophiolite., EGU General Assembly 2025, Vienna, Austria, 27 Apr–2 May 2025, EGU25-8689, https://doi.org/10.5194/egusphere-egu25-8689, 2025.

EGU25-8921 | ECS | Orals | GD5.3

Dispersion of Helium from the TAG hydrothermal vent field: perspectives from coupled physics-geochemistry model experiments 

Maria Gabriela Escobar Franco, Clément Vic, Thomas Gorgues, and Cécile Cathalot

Hydrothermal vents are oceanic sources of biogeochemical constituents. Some of these constituents, such as iron, significantly contribute to global biogeochemical cycles. Yet, their fate, i.e., transport and mixing through physical processes, and modification of their concentration through bio-geochemical processes, remains poorly quantified. Using state-of-the-art physical-biogeochemical (CROCO-PISCES) model simulations that resolve submesoscale processes, internal gravity waves and parameterized mixing processes, we analyse the physical processes involved in the dispersion of passive tracers (i.e. Helium) released at the Trans-Atlantic Geotraces (TAG) hydrothermal site.

A reference simulation features a horizontal grid spacing of 1 km, 150 terrain-following vertical levels, and includes high-frequency atmospheric and tidal forcing. Helium is initialized and continuously released at TAG, following a distribution that is constrained by observations. We also ran sensitivity experiments, without tides and with a smooth bathymetry designed to investigate the effects of CMIP (Coupled Models Intercomparison Project) model coarse bathymetries on the circulation.

At short spatial and time scales (~20 km, ~10 days), we find that tidal processes are instrumental in the tracer dispersion. Through comparisons between the reference and the no-tides simulations, we show that tidal currents and internal tides drive the dispersion within the TAG surrounding valley, and tidally-induced mixing drives the vertical dispersion of tracers, especially on the flanks of the valley walls and within fracture zones. At longer and larger scales (>20 km, >10 days), submesoscale and mesoscale instabilities catalyzed by the interaction of currents with the ridge topography lead to the formation of eddies that trap tracers and escape from the ridge valley to wander at depth preferentially westward of the ridge. Small-scale topographic structures such as fracture zones and abyssal hills control the dispersion and notably slows down the dispersion of tracers outside of the ridge valley. Simulation with smooth bathymetry hence shows a more isotropic and rapid dispersion. This could lead to biases in the inferred pathways of tracers in global models. Next, we will investigate the fate of active tracers, such as iron, which is impacted by biogeochemical processes, such as scavenging and complexation by ligands.

How to cite: Escobar Franco, M. G., Vic, C., Gorgues, T., and Cathalot, C.: Dispersion of Helium from the TAG hydrothermal vent field: perspectives from coupled physics-geochemistry model experiments, EGU General Assembly 2025, Vienna, Austria, 27 Apr–2 May 2025, EGU25-8921, https://doi.org/10.5194/egusphere-egu25-8921, 2025.

Oceanic crust is formed by basaltic melt produced through decompression melting of ascending mantle at mid–ocean ridges. This oceanic crust is separated from the residual mantle by the Mohorovičić (Moho) discontinuity. Determining the crustal and mantle velocities and the structure of Moho transition zone is critical for understanding the mantle melting, melt extraction and migration and crustal accretion along mid–ocean ridges.


We used seismic full waveform inversion (FWI) to analyse the ocean bottom seismometer (OBS) data from the 2016 CREST experiment from the South Atlantic Ocean at 31oS that samples the 30.6 Ma crust formed along the Mid–Atlantic Ridge at a slow–spreading rate (half–spreading rate of 24 mm/year). Seven four–component OBSs were deployed at ~10 km interval along the seismic profile, and the airgun array source was shot at 150 m interval. The high–quality OBS data show clear crustal refraction arrivals (Pg) up to ~35 km offsets, strong Moho reflection arrivals (PmP) at ~20–65 km offsets but absence of mantle refraction arrivals (Pn), indicating the presence of a relatively thin Moho transition zone (MTZ) and a negative velocity gradient in the mantle.


We performed two-dimensional elastic FWI of the pressure data recorded by hydrophone to constrain fine–scale crustal and mantle velocity. The starting model for FWI was obtained from a previous study of joint tomography of manually picked travel times of Pg and PmP arrivals. We progressively inverted the OBS seismic data in FWI from 3.0–4.5 Hz data to 3.0–6.5 Hz data to gradually update the subsurface velocity. The preliminary FWI result shows a uniformly thick crust of 7.1 km along the profile, ~1 km thicker than the global mean of oceanic crust. This observation indicates a relatively uniform mantle upwelling along the ridge and ~20oC higher mantle temperature at the time of crustal formation. The lower–upper crustal ratio is ~2.5, suggesting the upper crust was formed by a magma reservoir in the mid–crust. The lower crust is heterogeneous where high and low velocity layering is observed, indicating lower crustal accretion by the in–situ crystallisation of melt sills. Assuming the depths of 7.2 and 8.0 km/s velocity contours as the top and bottom of the MTZ, respectively, the thickness of the MTZ varies between 0.6 and 1.2 km with an average of ~0.9 km. A ~1 km–thick layer with velocity up to 8.2 km/s lies beneath the MTZ, possibly due to the presence of a thin dunite–rich layer. Further below, the upper mantle velocity gradually decreases with depth, which could be due to the mantle anisotropy and/or the presence of frozen gabbroic sills in the mantle.

How to cite: Wang, Z. and Singh, S. C.: Thick crust, thin Moho transition zone and negative velocity gradient in the mantle along a 30.6 Ma segment in the South Atlantic Ocean at 31oS, EGU General Assembly 2025, Vienna, Austria, 27 Apr–2 May 2025, EGU25-9158, https://doi.org/10.5194/egusphere-egu25-9158, 2025.

EGU25-9441 | ECS | Orals | GD5.3

Quantifying magmatism and tectonism along the ultraslow-spreading Southwest Indian Ridge (46-52°E)  

Mingxu Wang, Chunhui Tao, Zhongmin Zhu, and Zhikui Guo

Over one-third of mid-ocean ridges exhibit a spreading rate less than 20 mm per year. The process of crustal accretion, which facilitates the expansion of oceanic plates at mid-ocean ridges, is driven by the combined and interactive efforts of magmatic and tectonic processes. The seafloor morphology along ultraslow mid-ocean ridge flanks serves as a record of the accretion on oceanic crust. However, volcanic eruptions, mass wasting and reverse-faulting earthquakes occurring on mid-ocean ridges, which reshape the seafloor, present a significant obstacle for the precise quantification of oceanic crust accretion and seafloor morphology. Due to the temporal and spatial variability of magma supply, particularly in the Indomed-Gallieni supersegment (46-52°E) of the Southwest Indian Ridge (SWIR), magmatic and tectonic processes exhibit pronounced spatiotemporal variations, along with asymmetric crustal accretion, making it rather difficult to conduct quantitative analysis of the geomorphology of the oceanic crust. By utilizing multibeam bathymetry and gravity data of Indomed-Gallieni supersegment, we calculated several parameters such as the fraction of magmatic accretion (M-value), axial valley depth (D-value), magma supply, melt flux, and strain ratio, as well as fault heave and fault throw, thereby quantifying magmatism and tectonism. The majority of parameters indicative of tectonic accretion exhibit a negative correlation with magmatic parameters. Moreover, we compared the two-dimensional Fourier spectra of seafloor on mid-ocean ridge flank with magma supply. The anisotropy of seafloor is positively correlated with magma supply, with morphology becoming increasingly isotropic as magma supply diminishes. Our research suggests that although tectonic processes account for nearly 50% of oceanic crust accretion at ultraslow spreading mid-ocean ridges, the accretion process and the geomorphic features of the young oceanic crust are predominantly influenced by magma supply.

How to cite: Wang, M., Tao, C., Zhu, Z., and Guo, Z.: Quantifying magmatism and tectonism along the ultraslow-spreading Southwest Indian Ridge (46-52°E) , EGU General Assembly 2025, Vienna, Austria, 27 Apr–2 May 2025, EGU25-9441, https://doi.org/10.5194/egusphere-egu25-9441, 2025.

The Atlantis Massif is a well-studied oceanic core complex in the Atlantic Ocean that hosts the Lost City Hydrothermal Field (LCHF). The LCHF is a low-moderate temperature, high pH vent system. In gabbroic intrusions within the serpentinite-dominated substrate of the LCHF, a variety of hydrothermal alteration reactions occur, including replacement, dissolution creating macroscopic (mm scale) reaction porosity, and precipitation of secondary minerals including chlorite, amphibole, prehnite and clays.

Many samples recovered from Expedition 399 and earlier expeditions contain  zones of reaction porosity. This work presents SEM, EMPA and other analysis of sample: U1601C 18R2 75-78 and U1309D-310R1 92-95 from Exp. 399, as well as several other samples analyzed concurrently, used only for example purposes.

Reaction porosity filled with actinolite is present at several levels in the gabbroic hole U1309D, including in areas that were newly deepened by Expedition 399. We highlight sample U1309D-310R1 92-95, collected at a depth of 1495 meters below seafloor (mbsf), which contains porosity partially filled with amphiboles zoned from edenitic hornblende cores to actinolite rims, suggesting dissolution by relatively higher temperature fluids.

Hole U1601C is dominated by serpentinised peridotite; porosity is widespread in gabbroic intrusions with a wide range of fills including chlorite, tremolite, diopside, serpentine, prehnite and saponite. Sample U1601C 18R2 75-78 consists of a 1 cm wide gabbroic vein (domain 1) within serpentinised peridotite (domain 2). Along the boundary with domain 2,  domain 1 contains a  ~5 mm zone of porosity partially filled by secondary diopside and serpentine. Relict porosity up to 200 µm in size is common. Domain 2 also contains porosity filled with diopside and serpentine, as well as zoned rosettes, of various stages of hydrogarnet solid solution, moving from pyrope-rich in the inner core, to more definitively hydro-andradite (identified by Raman spectroscopy (Frezzotti et al. 2012) and EPMA) in the rosette rim. The rosettes here may be replacing pyroxene.

We suggest that gabbroic veins acted as conduits for fluid flow during hydrothermal alteration, probably at temperatures of 300-400 °C, and contributed to the intense serpentinisation of the mantle rocks.  Magnetite is not observed in this sample, but hydrous andradite rich in Fe3+ offers another potential H2 generating reaction.

Work in progress includes XCT analysis of the porosity. Further work will involve characterising the geological sequence of events, and in some cases their subsequent deformation (through sequence mapping), investigating the arguments for dissolution versus fill reactions (through extensive SEM, EMPA and X-Ray Tomography) and characterising the extent of reaction porosity in the Atlantis Massif.

References

Frezzotti, M.L., Tecce, F. and Casagli, A. (2012) ‘Raman spectroscopy for fluid inclusion analysis’, Journal of Geochemical Exploration, 112, pp. 1–20. Available at: https://doi.org/https://doi.org/10.1016/j.gexplo.2011.09.009.#

How to cite: Matchett, J.: Rotten Rocks at the Heart of the Atlantis Massif – A dive into reaction porosity in the Lost City Hydrothermal Field, EGU General Assembly 2025, Vienna, Austria, 27 Apr–2 May 2025, EGU25-9528, https://doi.org/10.5194/egusphere-egu25-9528, 2025.

EGU25-10319 | Posters on site | GD5.3

Electrical resistivity structure of the lithosphere-asthenosphere boundary beneath the extinct ridge of the South China Sea 

Fan Zhang, Bo Yang, Jian Lin, Tao Zhang, Naif Samer, Jiabiao Li, Makoto Uyeshima, Chuanzhou Liu, Weiwei Ding, Xubo Zhang, Jiangyang Zhang, Caicai Zha, Alexandra Yang Yang, Zihua Cheng, Pengcheng Zhou, Jinyu Tian, and Wule Lin

Extinct spreading ridges are globally widespread and are crucial to understanding the lifespan of oceanic plates. Yet the nature of the LAB beneath extinct ridges remains enigmatic. In this study, we investigate the LAB structure beneath the SCS basin, where a ~700-km-long extinct ridge system stopped spreading at ~15 Ma. A 120 km long marine magnetotelluric (MT) transect perpendicular to the extinct mid-ocean ridge in the southwest sub-basin of SCS was carried out at September 2021. The electrical resistivity model reveals a relatively low-resistivity layer at depths of 50-80 km, potentially corresponding to 0.1%-0.9% partial melts. This low-resistivity layer is heterogeneous and absent directly beneath the extinct ridge axis. This observation supports a model in which melts are efficiently extracted beneath the ridge axis, leaving the central region depleted, while partial melts are retained in the surrounding areas on either flank. Additionally, residual melts at shallower depths have likely solidified due to plate cooling, while deeper melts indicate the depth of the LAB. These findings propose a new mechanism for the emplacement of long-lived partial melts at the LAB and suggest that a discontinuous melt-rich layer may commonly occur near extinct spreading ridges globally.

How to cite: Zhang, F., Yang, B., Lin, J., Zhang, T., Samer, N., Li, J., Uyeshima, M., Liu, C., Ding, W., Zhang, X., Zhang, J., Zha, C., Yang, A. Y., Cheng, Z., Zhou, P., Tian, J., and Lin, W.: Electrical resistivity structure of the lithosphere-asthenosphere boundary beneath the extinct ridge of the South China Sea, EGU General Assembly 2025, Vienna, Austria, 27 Apr–2 May 2025, EGU25-10319, https://doi.org/10.5194/egusphere-egu25-10319, 2025.

EGU25-11050 | ECS | Posters on site | GD5.3

Olivine-quartz association in a gabbro-peridotite hybrid rock of the Kane Fracture Zone: evidence for hydrous Si-rich melt percolation in abyssal context. 

Manon Bickert, Mathieu Rospabé, Mary-Alix Kaczmarek, and Marcia Maia

Felsic plutonic rocks, such as plagiogranites, are commonly found in minor proportions in the lower oceanic crust. The presence of quartz of magmatic origin in the oceanic lithosphere, especially in the mantle, is therefore rarely documented. Here, we present microstructural and petrological observations of a gabbro-peridotite hybrid rock collected in situ by HOV Nautile along the southern wall of the Kane Fracture Zone, at the base of the Kane megamullion, during the KANAUT expedition (Mid-Atlantic ridge, 23°N; Auzende, 1992). This sample, a strongly deformed gabbro containing a peridotite fragment, shows evidence of mantle reacting with hydrous SiO2-rich melt at the contact between both lithologies.

The gabbro is composed of oriented plagioclase-rich layers alternating with polymineralic layers of plagioclase, clinopyroxene, orthopyroxene (Opx) and Fe-Ti oxides, and of mm-thick quartz-rich layers. These gabbroic layers locally enclose an aggregate of weakly deformed olivine grains with few Opx grains (up to 1 mm in size). The high Mg# of both olivine and Opx (up tp 85% for both), and the low TiO2 (< 0.1 wt.%) of Opx and of the rare spinels in the aggregate, support a mantle origin. The contact between the two lithologies is marked by a rim of small, polygonal to interstitial Opx grains, forming bulges into the adjacent olivine grain boundaries. The cusp-shapes of olivine grains at contact with Opx, the bulges of Opx along olivine grain boundaries, and the presence of phlogopite and edenitic amphibole, indicate local dissolution of olivine and precipitation of Opx and phlogopite in presence of a hydrous melt, as documented in peridotite from subcontinental contexts.

Temperatures estimated from geothermometry in Opx, plagioclase-amphibole and quartz all indicate that this melt-rock reaction occurred around 900-1000°C. This is also consistent with the crystallographic preferred orientation (CPO) of plagioclase showing a main direction of [100]. The CPO of all minerals forming the gabbroic layers have a main direction parallel to the foliation, which also follows the contours of the peridotite fragment. By contrast, the olivine CPO in the peridotite fragment, showing a clear [100](010) slip system typical of high temperature, low stress conditions prevailing in the asthenosphere, has a direction orthogonal to the foliation. Taken together, the Mg# of olivine and Opx in the peridotite fragment, and the gabbro foliation orthogonal to the presumed foliation in the peridotite, provide evidence that this peridotite fragment preserved the deep mantle conditions during exhumation, despite its reaction with a hydrous melt. To our knowledge, this is the first time in an abyssal context that the reaction between a mantle component and hydrous Si-rich melt, leading to olivine-quartz association in a same sample, is reported.

AUZENDE Jean-Marie (1992). KANAUT cruise, RV Le Nadir, https://doi.org/10.17600/92003211

How to cite: Bickert, M., Rospabé, M., Kaczmarek, M.-A., and Maia, M.: Olivine-quartz association in a gabbro-peridotite hybrid rock of the Kane Fracture Zone: evidence for hydrous Si-rich melt percolation in abyssal context., EGU General Assembly 2025, Vienna, Austria, 27 Apr–2 May 2025, EGU25-11050, https://doi.org/10.5194/egusphere-egu25-11050, 2025.

The magmatic upper crust is generally divided into Layer 2A and Layer 2B, where Layer 2A is interpreted to consist of lava flows and Layer 2B of dikes, although hydrothermal alteration processes have also been suggested to define the Layer 2A/2B boundary. Using 3D seismic reflection method at the Axial Volcano in the Eastern Pacific, we have recently imaged > 3 km of layered lava flows that dip inwards towards the rift zone and interact with the axial melt lens, hence indicating the absence of a dike sequence. These images also show the injection of melt sills within the lava pile. However, the conventional stacking of wide-angle data (triplication associated with the high velocity gradient zone at the base of Layer 2A) indicates that a classical Layer 2A/2B boundary can be defined in our study area.

Here, we present results of seismic full waveform inversion applied to ultra-long offset (12 km) multi-channel seismic data collected in 2019 during the same survey that yielded the 3D seismic reflection results. In our high-resolution P-wave velocity section and associated velocity gradient section we find layered structures consistent with the 3D seismic image. We also find (1) a low-velocity layer in the upper part, evocative of Layer 2A, (2) a high-velocity gradient zone underlain by (3) a high-velocity but low-gradient zone (similar to Layer 2B) underneath, all within the imaged thick lava pile. We suggest that the uppermost lava flow layer consists of hydrated lava flows whereas the lower layer has undergone dehydration and metamorphism and has been formed by the interaction of lava flows with melt bodies and injected sills. Thus the classical Layer 2A/2B boundary would correspond to the boundary between hydrated and dehydrated lava flows. Our results suggest that the upper oceanic crust is formed by lava flows and their interactions with melt-sills, which resolves the long-standing debate about Layer 2A/2B boundary.

How to cite: Xie, W., Wu, H., Singh, S., Carton, H., Kent, G., and Arnulf, A.: Seismic Evidence of Hydrated/dehydrated Lava Flows at the Layer 2A/2B boundary from Full Waveform Inversion of Ultra-long Offset Multi-channel Seismic Data at the Axial Volcano in the Pacific Ocean, EGU General Assembly 2025, Vienna, Austria, 27 Apr–2 May 2025, EGU25-11076, https://doi.org/10.5194/egusphere-egu25-11076, 2025.

EGU25-11184 | ECS | Posters on site | GD5.3

Investigating the response of hydrothermal convection to decadal cycles of magmatic inflation at the East Pacific Rise, 9º50'N 

Kim Moutard, Jean-Arthur Olive, Thibaut Barreyre, Fabrice J. Fontaine, Daniel J. Fornari, Jill McDermott, Ross Parnell-Turner, Jyun-Nai Wu, and Milena Marjanović

Hydrothermal circulation at the axis of fast-spreading mid-ocean ridges is intrinsically linked to magmatic activity, which typically fluctuates on decadal time scales, i.e., the characteristic recurrence time of eruptions. While hydrothermal vent temperatures are known to fluctuate in response to sudden events such as dike intrusions or seismic swarms, their response to longer-term processes such as the replenishment of an axial melt lens (AML) remain poorly documented. Here we focus on high-temperature vents from the 9°50'N segment of the East Pacific Rise, which experienced eruptions in 1991/1992 and 2005/2006, and has been extensively monitored over the last 3 decades. There, a compilation of legacy data complemented by recently acquired temperature measurements from the Bio9 vent site (cruise AT50-21, February-March 2024) reveal decadal trends where maximum vent temperatures increase by ~30ºC in ~15 yr between eruptions, and drop by a commensurate amount within a few years of each eruption. In this study we use numerical models of hydrothermal convection to test the hypothesis that decadal increases in vent temperatures are caused by AML inflation pressurizing the upper crust and decreasing its permeability.

We simulate 2-D porous convection driven by a constant basal heat flux, where permeability decreases exponentially with pressure, as suggested by rock deformation experiments. We first benchmark the relationship between average maximal vent temperature and mean permeability against the analytical model of Driesner (2010). Then, we perturb the permeability field using a mechanical model of sill inflation that imparts isotropic compression across the upper oceanic crust, resulting in exponentially-decaying permeability above the 1.5 km deep AML. When using a narrow basal heat source, we obtain a single plume of rising hot fluid, whose flow progressively slows down in the basal conductive boundary layer. This creates a positive thermal anomaly which is then advected to the seafloor by the plume. However, when the heat source is broader and the convection geometry more intricate, variations in permeability modify fluid pathways, leading to a more complex response. Lastly, simulating cycles of AML inflation and deflation yields oscillations in vent temperatures with periods representative of the duration of a replenishment cycle, but with a lag strongly modulated by the vigor of the convective system.

How to cite: Moutard, K., Olive, J.-A., Barreyre, T., Fontaine, F. J., Fornari, D. J., McDermott, J., Parnell-Turner, R., Wu, J.-N., and Marjanović, M.: Investigating the response of hydrothermal convection to decadal cycles of magmatic inflation at the East Pacific Rise, 9º50'N, EGU General Assembly 2025, Vienna, Austria, 27 Apr–2 May 2025, EGU25-11184, https://doi.org/10.5194/egusphere-egu25-11184, 2025.

Many potential green energy resources are undiscovered on our planet, hidden within crustal structures such as microcontinents, the formation of which is not well-understood. Recent work by Whittaker et al. (2016) suggests formation of microcontinents from plate tectonic reorganisation, where transpression along transform plates causing ridge jumps into rifted continental margins. To test this hypothesis, we aim to globally map transpressive and transtensional oceanic fracture zones. These structures with specific spectral gravity wavelength signatures will be identified using machine learning approaches and the Generic Mapping Tools (GMT). In later work, we will kinematically model the onset and development of these transpressional and transtensional structures to understand their relative timing to kinematic change and decipher the role of lithospheric structures in microcontinent cleaving and the global plate tectonic system.

How to cite: Tranova, T. M. K., Phethean, J., Khan, W. A., and Hussain, M.: Lithospheric controls on plate tectonic motions and microcontinent formation, part 1: Mapping global transpression and transtension using gravity derivatives and machine learning, EGU General Assembly 2025, Vienna, Austria, 27 Apr–2 May 2025, EGU25-13455, https://doi.org/10.5194/egusphere-egu25-13455, 2025.

Since the recognition of seafloor spreading, numerous kinematic and dynamic models for the accretion of oceanic crust and lithosphere have been proposed. Early models were constrained by the interpretation of marine seismic data and the internal structure of ophiolite complexes and predated any direct observations of the oceanic crust. Mapping the extent of axial lava flows and subsurface axial magma chambers established the very limited dimensions of where new oceanic crust is built.

Unlike spreading at slow rates, where faulting and sporadic magmatism result in heterogeneous structures, spreading at intermediate to superfast spreading rates (and higher, more consistent magma budgets) results in a layered upper crustal structure with a complex internal structure. Direct observations from submersibles, ROVs, and deep drill cores provide constraints that allow for the refinement or modification models for oceanic crust accretion at these relatively fast spreading rates.

Key observations reveal structures and processes that are not obvious from surface investigations. These include progressively more steeply inward-dipping (initially horizontal) lava flows, outward-dipping (originally vertical) dikes, downward-increasing brittle deformation and hydrothermal metamorphism of lavas and dikes, and underplating by much-less-faulted and altered gabbroic rocks. The thickness and internal structure of these upper crustal rock units are created by continuous dike intrusion feeding lava flows that cause caldera-like, vertical subsidence of hundreds of meters above an axial magma chamber. Greater subsidence and deformation of upper crustal units occur at intermediate spreading rates (or lower magma budgets) than at the highest rates.

These results have implications for viscous mass redistribution beneath the spreading axis even as additional magma is delivered from the mantle below. Applying observable parameters to dynamic models yields internally consistent results with extremely weak axial lithosphere (effective elastic thickness < 1 km) that strengthens laterally as it ages off axis prior to the formation of abyssal hill faults.

How to cite: Karson, J.: Building the Oceanic Crust at Intermediate to Superfast Mid-Ocean Ridge Spreading Centers: Implications of Complex Internal Structures of the Upper Oceanic Crust, EGU General Assembly 2025, Vienna, Austria, 27 Apr–2 May 2025, EGU25-13464, https://doi.org/10.5194/egusphere-egu25-13464, 2025.

EGU25-14183 | Posters on site | GD5.3

Historical Interaction of Central Indian Ridge and Réunion hotspot in the Indian Ocean 

Yiming Luo, Fan Zhang, Zhiyuan Zhou, and Jian Lin

The interaction between the Central Indian Ridge (CIR) and the Réunion hotspot has significantly influenced the formation of notable volcanic features in the Indian Ocean over the past 60 million years, including the Maldive ridge and Chagos bank on the Indian-Australian Plate, as well as the Mascarene Plateau, Mauritius Island, Réunion Island, and Rodrigues Ridge on the African Plate. Plate reconstruction results indicate that the distances between the CIR and Réunion hotspot have varied throughout the geological history, transitioning from off-axis (65-40 Ma) to on-axis (40-20 Ma) and back to off-axis (20-10 Ma) cases, with the current distance exceeding 1,000 km. This makes the CIR-Réunion system an ideal setting for studying both on-axis, off-axis interactions and their transitions. In this study, we utilized the advanced computational geodynamic platform ASPECT to investigate the CIR-Réunion system, focusing on 3-D mantle evolution, deep structures and their connectivity, and the migration pattern of hotspot material towards the ridge and surrounding regions. Our results illustrate the dynamic processes of mantle and crust, the dispersion of temperature anomaly, and the migration of plume material. The model results show that the critical points of the interactions begin and cease are ~50 and ~10 Ma, respectively. There is no direct connection between the ridge and hotspot at present. These indicate that the traces of the ridge-hotspot interaction may show spatial features, but it actually reflects the temporal variations.

How to cite: Luo, Y., Zhang, F., Zhou, Z., and Lin, J.: Historical Interaction of Central Indian Ridge and Réunion hotspot in the Indian Ocean, EGU General Assembly 2025, Vienna, Austria, 27 Apr–2 May 2025, EGU25-14183, https://doi.org/10.5194/egusphere-egu25-14183, 2025.

In the current theories of mid-ocean ridges, diking processes have been considered by using simplified models with a single permanently open central dike. Here, I instead consider long-term large-scale rheological effects of multiple dikes emplacement, which lead to rheological weakening of the forming mid-ocean ridge lithosphere. Based on 2D numerical experiments modeling multiple dikes emplacement, I derive rheological expressions representing effective strength of the melt-weakened lithosphere as the function of local melt flux. These expressions are then implemented into 3D visco-elasto-plastic mid-ocean ridge models including mantle decompression melting, crustal growth and melt flux-induced weakening of the spontaneously accreting oceanic lithosphere. Based on 3D numerical experiments, I demonstrate that the newly developed rheological theory explains well the observed mid-ocean ridge topography and faulting pattern variations with spreading rate and oceanic crust thickness. This theory may be further used for other geodynamical situations involving melt transport through oceanic and continental lithosphere such as continental and oceanic rifting, continental breakup and plume-lithosphere interaction processes.

How to cite: Gerya, T.: Melt-induced weakening controls topography and faulting pattern of mid-ocean ridges, EGU General Assembly 2025, Vienna, Austria, 27 Apr–2 May 2025, EGU25-15390, https://doi.org/10.5194/egusphere-egu25-15390, 2025.

EGU25-15659 | ECS | Posters on site | GD5.3

Global distribution and growth mechanisms of seamounts: Insights from statistical and tectonic analysis 

Sibiao Liu, Lars Rüpke, Pilar Madrigal, and Ming Chen

Volcanic seamounts found in every ocean are among the most widespread landforms on Earth and their geological evolution provides valuable insights into Earth's interior melting processes. Seamounts form in diverse tectonic settings, including mid-ocean ridges, subduction zones, and intraplate volcanism, with their size and distribution reflecting their tectonic origin. Smaller seamounts typically form on younger seafloor near mid-ocean ridges, while larger seamounts originate from volcanism on older seafloor far from ridge axes. A common height threshold distinguishing small and large seamounts is 1-1.5 km. Using the latest gravity-predictive seamount census, we statistically analyzed 18400 well-surveyed seamounts, integrating geometric data (exposed height above the seafloor, radii, volume, and irregularity) and tectonic features (seafloor age, spreading rate, and hotspot proximity) from GEBCO_2024 and GPlates reconstructions.

Our analyses to date show that 90% of seamounts are under 2 km in height and distribute in all tectonic environments, whereas those above 2 km high are primarily located away from mid-ocean ridges. This height threshold may serve as a new criterion to distinguish small from large seamounts. Additionally, there are no fundamental differences in the distribution and shapes of seamounts across the Atlantic, Indian, and Pacific Oceans. Specifically, seamount height shows no strong correlation with spreading rate but a weak positive trend with seafloor age. Approximately one-third of seamounts in the three major oceans lie within hotspot tracks. Strikingly, nearly all seamounts taller than 4 km are associated with hotspots or large igneous provinces, exemplified by those situated on the "hotspot highway" in the western Pacific.

In a nutshell, seamounts generally grow to heights of up to 2 km regardless of formation setting, but growth to heights exceeding 4 km requires stronger impulse from hotspots or large igneous provinces. This finding suggests that towering seamounts worldwide are likely to be the product of anomalous magmatic activity caused by the upwelling of deep mantle plumes.

How to cite: Liu, S., Rüpke, L., Madrigal, P., and Chen, M.: Global distribution and growth mechanisms of seamounts: Insights from statistical and tectonic analysis, EGU General Assembly 2025, Vienna, Austria, 27 Apr–2 May 2025, EGU25-15659, https://doi.org/10.5194/egusphere-egu25-15659, 2025.

EGU25-16578 | ECS | Orals | GD5.3

Serpentinite microstructure at the Atlantis Massif – serpentinization reaction or deformation? 

Rebecca Kühn, Rüdiger Kilian, Luiz Morales, Andy Parsons, Barbara John, and Jeremy Deans and the IODP Expedition 399 Science Party

Oceanic core complexes are a common feature along slow-spreading mid-ocean ridges. Serpentinized mantle rocks are exposed at the seafloor in the footwall to large-scale detachment faults. While it is likely that the exposed and rotated footwall has experienced deformation, it is unclear how internal footwall deformation is accommodated by the ultramafic rocks. One example of such an oceanic core complex is the Atlantis Massif at the Mid-Atlantic ridge (30° N) drilled by International Ocean Discovery Program (IODP) Expedition 399. Site U1601 provides the unique opportunity to understand any deformation recorded in serpentinized mantle rocks over >1.2 km depth.

To better understand the depth distribution of deformation and the associated deformation mechanisms, we combine microstructure and crystallographic preferred orientation (CPO) analysis by means of Scanning Electron Microscopy techniques and synchrotron high energy X-ray diffraction. Results show variable microstructures ranging from zoned mesh cells with no CPO, to foliated samples with a strong CPO of both serpentine and magnetite, to serpentinite samples exhibiting deformation microstructures like kinking and dissolution-precipitation features. The origin of characteristic microstructures and CPOs, whether formed due to serpentinization, deformation, or mutual interaction, will be discussed.

How to cite: Kühn, R., Kilian, R., Morales, L., Parsons, A., John, B., and Deans, J. and the IODP Expedition 399 Science Party: Serpentinite microstructure at the Atlantis Massif – serpentinization reaction or deformation?, EGU General Assembly 2025, Vienna, Austria, 27 Apr–2 May 2025, EGU25-16578, https://doi.org/10.5194/egusphere-egu25-16578, 2025.

EGU25-16615 | ECS | Posters on site | GD5.3

Formation and early transformation of hydrothermal Fe nano-colloids in a black smoker system 

Lotta Ternieten, Martina Preiner, Péter Pekker, Mihály Pósfai, Peter Kraal, and Oliver Plümper

Motivated by the goal to determine the chemical form, variability, and potential processes that modulate the flux of ecosystem-limiting metals, like hydrothermal iron (Fe) nano-colloids, and to explore their unique catalytic capabilities, we sampled suspended and dissolved matter in the water column above the Rainbow (36°-33°N) hydrothermal vent field at the Mid-Atlantic Ridge. To investigate the (trans)formation of hydrothermal iron-based nanocolloids, we employed a direct sampling approach that bypasses conventional techniques such as filtration and resuspension. Instead, small amounts of plume fluid were immediately drop-cast onto transmission electron microscopy (TEM) grids and plunge-frozen, preserving dissolved compounds and nanocolloids through vitrification. Using an array of microscopic and spectroscopic techniques, combined with machine learning, allowed detailed characterization of the Fe nanocolloids down to the nano-scale and provided insight into their early (trans)formation and bioavailability.

TEM and synchrotron-based spectroscopy show that the Fe colloids suspended in the hydrothermal plume predominantly consist of poorly ordered ferric Fe-oxyhydroxides most similar to 2-line (2L-Fh) and 6-line ferrihydrites (6L-Fh), which contain local enrichments in P, S, and/or Cu phases. Using the machine learning model SIGMA1 allowed us to explore the distribution of distinct Fe phases and revealed local P:Fe ratios of 1:2 for 2L-Fhs and 1:6 for 6L-Fhs. Utilizing nano-scale scanning TEM tomography, we showed that some 2L-Fh aggregates contain ferrous chalcopyrite (CuFeS2) cores. On the outside, the plunge-frozen Fe-nano colloids are covered with the vitrified plume fluid enriched in Mg, Cl, and ± S. Notably, our results do not show associations of Fe with (organic) carbon.

These observations suggest that chalcopyrite forms in the shallow subsurface before venting and acts as a crystallization seed for some fast oxidizing Fe(II) after mixing with seawater. Ferrihydrite (Fh) forms through the formation of Fe13-Keggin clusters2, and we argue that part of the clustering process occurred on the surface of the chalcopyrite, resulting in dendritic textures of some 2L-Fh. In contrast, Fh can also nucleate by clustering of Fe without needing a preexisting template, resulting in a more compact morphology. The larger surface area of the dendritic Fh that utilizes metal sulfides for their nucleation results in higher adsorption of PO4 and, consequently, due to the dehydration of the surface, significantly decreases the dissolution and, therefore, recrystallization, suppressing the transformation into more ordered 6L-Fh. Furthermore, this shows limited interaction between C-rich phases and Fe-bearing precipitates during early (trans)formation in a black smoker system, contrasting previous studies, which suggest that organic compounds play a key role in stabilizing and transporting hydrothermal Fe3.

Our findings shed completely new light on the transport and persistence of vent-derived reduced iron phases, highlighting the role of ferric coatings in protecting nano-scale iron sulfides and challenging the previously proposed importance of complexation with organic matter. Overall, we provide new perspectives on the early (trans)formation processes of vent-derived iron, its interaction with other essential elements, and, eventually, its impact on ocean chemistry.


  • Tung, P., et al. Geochem., Geophys., Geosystems 24, (2023).
  • Weatherill, J. S., et al. Environ. Sci. Technol. 50, 9333–9342 (2016).
  • Toner, B. M. et al. Acc. Chem. Res. 49, 128–137 (2016).

How to cite: Ternieten, L., Preiner, M., Pekker, P., Pósfai, M., Kraal, P., and Plümper, O.: Formation and early transformation of hydrothermal Fe nano-colloids in a black smoker system, EGU General Assembly 2025, Vienna, Austria, 27 Apr–2 May 2025, EGU25-16615, https://doi.org/10.5194/egusphere-egu25-16615, 2025.

Black-smoker-type hydrothermal vent systems are a feature of all mid ocean ridges. They often sit atop developing massive sulfide deposits, such as the TAG mound in the central Atlantic. The measured apparent upper limit for vent fluid temperatures at these sites around 400°C can be explained with the thermodynamic properties of water [1]. However, continuum-scale numerical models of seawater and hydrothermal fluid circulation commonly fail to reproduce these high vent temperatures under realistic assumptions of host rock permeability. While most discharge of circulating seawater does occur diffusively and at low temperatures, an explanation for the extreme focusing of flow at hot vent sites is needed.

One common approach to resolve this is the so-called “clogged shell” model, where the precipitation of mainly anhydrite at the interface of rising hot fluids and entrained seawater locally lowers permeability around the hydrothermal plume, preventing mixing and increasing vent temperatures [2]. This concept has been validated in a number of studies [e.g., 3], but no fully coupled model of hydrothermal fluid flow and fluid-rock interaction in such systems exists.

Using a newly developed coupling of open-source C++ libraries to solve fluid flow in 2D and 3D (OpenFOAM) and local equilibrium thermodynamics (Reaktoro [4]), we investigate feedback between reactive fluid flow, anhydrite precipitation and vent temperatures.

Anhydrite solubility decreases with higher temperatures, leading to precipitation from heated seawater at the interface with rising hot hydrothermal fluids. Solubility also depends on salinity, increasing in saltier fluids [5]. Thus, we vary hydrothermal fluid salinity between 0 and 5 wt%, based on vent fluid measurements.

Our results clearly show that anhydrite precipitation occurs around the plume and inhibits mixing, focusing the hot upflow and increasing vent temperatures over time. These effects are strongly dependent on fluid salinity: Initial vent temperatures are highest with high salinity, linked to thermodynamic properties of water. Over time, lower salinity hydrothermal fluids produce a narrower anhydrite shell, leading to stronger focusing and a steeper vent temperature increase.

Figure 1. Model results: (a) 2D anhydrite shell (b) cut 3D Anhydrite shell (c) vent temperature over time with variable hydrothermal fluid salinity.


References

[1] Jupp, T. and A. Schultz, A thermodynamic explanation for black smoker temperatures. Nature, 2000. 403(6772): p. 880-3.

[2] Cann, J.R. and M.R. Strens, Modeling periodic megaplume emission by black smoker systems. Journal of Geophysical Research: Solid Earth, 1989. 94(B9): p. 12227-12237.

[3] Guo, Z., et al., Anhydrite‐Assisted Hydrothermal Metal Transport to the Ocean Floor—Insights From Thermo‐Hydro‐Chemical Modeling. Journal of Geophysical Research: Solid Earth, 2020. 125(7).

[4] Leal, A.M.M. Reaktoro: An open-source unified framework for modeling chemically reactive systems. 2015; Available from: https://reaktoro.org.

[5] Creaser, E.C., M. Steele-MacInnis, and B.M. Tutolo, A model for the solubility of anhydrite in H2O-NaCl fluids from 25 to 800 °C, 0.1 to 1400 MPa, and 0 to 60 wt% NaCl: Applications to hydrothermal ore-forming systems. Chemical Geology, 2022. 587.


How to cite: Engelmann, J. and Rüpke, L.: The Hydrothermal “Clogged Shell” Model Revisited Using Coupled Reactive Fluid Flow (OpenFOAM + Reaktoro) – Feedback Between Vent Fluid Salinity, Temperature, and Anhydrite Precipitation, EGU General Assembly 2025, Vienna, Austria, 27 Apr–2 May 2025, EGU25-16639, https://doi.org/10.5194/egusphere-egu25-16639, 2025.

EGU25-17434 | Posters on site | GD5.3

Magmato-tectonic variability along the Mohns Ridge: Insights into the controls on hydrothermal circulation 

Morgane Le Saout, Thibaut Barreyre, Javier Escartín, and Masako Tominaga

The Mohns Ridge is located in the Norwegian-Greenland Sea, between the Jan Mayen Transform Fault and the Mohns-Knipovich Bend. It is an ultra-slow spreading ridge section with a full spreading rate of 15 to 17 mm/yr. Over its 580 km, the variations in axis depth and crustal thickness attest of the overall decrease of magma supply associated with the distance from the Jan Mayen Hotspot. In parallel seafloor ages based on sediment thickness and sedimentation rate in the axial valley attest of the relatively young volcanic activity (<180 ka) experienced by the entire ridge axis. Utilizing a multi-proxy approach, we aim to provide new insights into the magmato-tectonic interplay along the Mohns Ridge, including its transient nature and controls on hydrothermal circulation. We investigate: (i) the variability in relative tectonic and magmatic extension by deciphering seafloor morphology extracted from the bathymetric data; (ii) the variability in magma supply and volcanic activity by analyzing gravimetry and magnetic anomalies, and (iii) the distribution and intensity of the recent crustal activity affecting the ridge based on the 40 years of seismicity record. The analyses highlight two significant trends. First, a regional trend linked to the Jan Mayen and Iceland plumes controlling the distance between volcanic centers (i.e., axial volcanic ridges – AVRs) and the focus of the volcanic activity. Second, a local trend associated with AVR maturity controlling AVR volume and related faulting patterns. Combining these observations with the location of known hydrothermal vents, we find no evidence of the regional magma budget variability impacting the distribution of hydrothermal vents. Instead, the locations of hydrothermal vents appear to be related to AVRs with recent and voluminous volcanic activity. This suggests that hydrothermal activity is linked to recent phases of the AVR construction over shorter time scales than to overall melt supply and along-axis gradients, over longer timescales. Finaly, although the seismic activity has been stable over the last 40 years, the lack of correlation with the hydrothermal vent distribution or AVR geometry, suggests that it is related to transient processes over shorter time scales than that of the AVR construction and associated hydrothermal activity.

How to cite: Le Saout, M., Barreyre, T., Escartín, J., and Tominaga, M.: Magmato-tectonic variability along the Mohns Ridge: Insights into the controls on hydrothermal circulation, EGU General Assembly 2025, Vienna, Austria, 27 Apr–2 May 2025, EGU25-17434, https://doi.org/10.5194/egusphere-egu25-17434, 2025.

EGU25-17718 | Posters on site | GD5.3

Cooling of young Arctic oceanic lithosphere modulated by off-axis fluid circulation and post-glacial sedimentation 

Thibaut Barreyre, Jean-Arthur Olive, Javier Escartin, and Steffen Jørgensen

Mid-ocean ridges (MORs) are sites of key thermo-chemical transfers between the Earth's interior and the ocean. Heat flow at MORs primarily depends on lithospheric age but is also modulated by various processes including sedimentation, hydrothermal activity, and faulting, which alter the thermal properties of young oceanic lithosphere. Here we quantify this modulation by analyzing heat flow measurements across the ultraslow-spreading Mohn’s Ridge in the Arctic Ocean. The Mohn’s ridge features major asymmetries in tectonic structures, with larger-offset normal faulting occurring on the West side (North American plate), as well as more sedimentation on the East side (Eurasian plate).

Recently acquired measurements of conductive heat flow across Mohn’s Ridge reveal a significant asymmetry. The eastern (sedimented) side shows a typical conductive profile with values exceeding 600 mW/m2 at the axis decreasing off-axis towards an asymptote at ~100 mW/m². By contrast, the western (faulted) side lacks this conductive plateau, with conductive heat flow dropping to near zero off-axis in ~15-Ma seafloor.

We used 2-D numerical models of hydrothermal convection coupled with conductive heat transport to test two hypotheses (1) An asymmetry in the intensity of brittle deformation leads to greater crustal permeability on the faulted west side, enabling cooling by hydrothermal circulation far off-axis. This manifests as very low conductive heat flux in 10+Ma seafloor. (2) Permeability is the same on both sides of the ridge, but a thick, impermeable sediment blanket suppresses off-axis hydrothermal convection in the Eurasian plate to the East. We find that explaining the low Western heat fluxes requires a high off-axis permeability. The Eastern heat fluxes are better explained either by a lower permeability, or the insulating effect of the sediment. Interestingly, the instantaneous addition of a sediment blanket at a prescribed time in our simulations can turn a heat flow profile typical of the West side into a classical conductive profile typical of the East side in a few 100 kyrs. This suggests that a post-glacial input of sediment on the Eurasian plate could have contributed to a rapid onset of the heat flow asymmetry across Mohn’s Ridge.

How to cite: Barreyre, T., Olive, J.-A., Escartin, J., and Jørgensen, S.: Cooling of young Arctic oceanic lithosphere modulated by off-axis fluid circulation and post-glacial sedimentation, EGU General Assembly 2025, Vienna, Austria, 27 Apr–2 May 2025, EGU25-17718, https://doi.org/10.5194/egusphere-egu25-17718, 2025.

EGU25-18143 | Posters on site | GD5.3

MAPRIDGES: Geometry of global mid-ocean ridge plate boundaries, and the role of transform faults and non-transform offsets 

Javier Escartín, Benjamin Sautter, Carmen Gaina, Sven Petersen, Roi Granot, and Manuel Pubelier

The global mid-ocean ridge system produces the oceanic lithosphere accounting for ~70% of the Earth’s surface, while hosting active processes (tectonic, volcanic, hydrothermal circulation). The ridge system is segmented by both transform faults and non-transform offsets, and their geometry can be now re-evaluated with existing multibeam bathymetry (with a resolution of ~100 m or better), both from publicly accessible datasets (e.g., GMRT, NCEI, Pangaea, AWI, among others) and available through published studies. This high-resolution bathymetry is now available for ~25% of the ocean seafloor, but covers a significant proportion of the global mid-ocean ridge system (>70%) and is thus suitable to refine and finely define its geometry. 


The MAPRIDGES database (https://doi.org/10.17882/99981) provides a global dataset that includes the newly-defined geometry of individual mid-ocean ridge segments, the most complete catalog to date of transform faults, and identifies non-transform offsets (NTOs). This effort is linked to the World 5M project by CGMW (Commission for the Geological Map of the World). We calculate the lateral offset associated with these NTOs, and determine if they correspond to overlaps of adjacent segments or if they are associated with a gap (underlap). Two different plate models (MORVEL and GSRM) are used to estimate  the length of overlaps, underlaps and their links to variations in spreading direction.


Our new database, gives a global, detailed view of the global mid-ocean ridge geometry, and provides the first  evaluation of the overall lengths of ridges and associated lateral offsets, both transform and non-transform. Mid ocean ridge segments (1471) show a cumulative length of ~71200 km, with and along-axis distance of ~4800 km of overlapping segments, and ~1700 km of underlap; taking these offsets into account this yields a total length of along-axis segments of ~75300 km. We have also digitized the traces of 262 transform faults to obtain the most complete catalogue to date of these structures. Transform faults account for a cumulative lateral offset of ridges of ~27000 km. We report a first estimate of the lateral offset of 1058 identified NTOs at ~10400 km, accounting for >30% of the cumulative transform fault length. The resulting cumulative lateral offset from both transform and non-tranform segments is thus ~37400 km, and is ~50% of the total ridge length. As in the case of transform faults, these NTOs are associated with deformation of a significant volume of the recently accreted oceanic lithosphere, and thus likely facilitating hydrothermal circulation and alteration of the lithosphere. This study will facilitate the quantification of these processes and provides a basis to better understand their implications on local and global environments (e.g., chemical fluxes associated with alteration at all offsets).

How to cite: Escartín, J., Sautter, B., Gaina, C., Petersen, S., Granot, R., and Pubelier, M.: MAPRIDGES: Geometry of global mid-ocean ridge plate boundaries, and the role of transform faults and non-transform offsets, EGU General Assembly 2025, Vienna, Austria, 27 Apr–2 May 2025, EGU25-18143, https://doi.org/10.5194/egusphere-egu25-18143, 2025.

EGU25-18332 | Orals | GD5.3

IODP Expedition 399: the six million year uplift history of a record-breaking section of depleted mantle 

Andrew McCaig, Johan Lissenberg, Susan Lang, and Blum Peter and the International Ocean Discovery Program Expedition 399 Science Party

IODP Expedition 399 drilled a record 1268m hole (U1601C) in the Atlantis Massif oceanic core complex, sampling serpentinised harzburgites and dunites, cut by a gabbro net-vein complex (Lissenberg et al., 2024). The near ridge environment of the Atlantis Massif, and the well constrained exhumation of the section by detachment faulting (Escartin et al., 2022), allows us to constrain the recent (~6 million year) history of this important section of abyssal peridotites exceptionally well. In addition, Site U1601 is located only 800 m from the Lost City hydrothermal field (LCHF), which vents warm (40-115 °C) alkaline fluids rich in H2 and CH4.  The section allows direct comparison with the LCHF substrate and reactions occurring deep in the massif, together with extremophile microbiology and abiotic organic synthesis.

Here we focus on the history of the section, beginning with partial melting in the upwelling asthenosphere beneath the mid-Atlantic ridge, inferred to have begun at ~ 60km depth (Olive, 2023) and ~ 6 m.y. ago based on a half-spreading rate of 11.8 mm/yr. It is important to recognise that detachment faulting involves rotation of the fault and footwall. The detachment fault captures part of the mid-ocean ridge corner flow translating vertical upwelling into horizontal plate motion. The current near-vertical section collected by drilling was therefore plunging at a low angle until incorporated into the lithosphere and rotated by faulting. The section contains numerous dunitic veins inferred to be melt pathways forming in the upwelling asthenosphere. Dips of these veins peak at ~45° in the core reference frame, suggesting they were neither vertical nor horizontal in the rotated section. Further upwelling led to incorporation of the section into the lithosphere in the footwall of the nascent detachment fault, at a depth of 7-10 kmbsf. The next event was intrusion of a net vein complex of gabbros, with 265 logged units, mostly < 1 m in thickness. Significant mylonitic deformation is seen along the margins of many of these gabbros. During further uplift towards the seafloor, intense hydrothemal alteration of the gabbros and serpentinisation of the harzburgites and dunites occurred at temperatures < 400 °C, and the section was first exposed on the seafloor at ~ 600 kyr (Escartin et al., 2022), with the detachment fault rotating to a subhorizontal dip. Following this, a local low temperature overprint leading to oxidation of magnetite and locally high uranium contents  is observed in the upper 200m of the core.

The history outlined above offers a framework for understanding the full range of magmatic, deformation, alteration and microbiological processes in the upwelling mantle at a slow spreading ridge, including new constraints on processes in the substrate of the LCHF.


Escartin et al., (2022). Tectonic termination of oceanic detachment faults, with constraints on tectonic uplift and mass wasting related erosion rates.Earth and Planetary Science Letters 584, 117449

Lissenberg et al., (2024). A long section of serpentinized depleted mantle peridotite. Science. 623-629 385.6709

Olive (2023) Mid-Ocean Ridges: Geodynamics Written in the Seafloor DOI 10.1016/B978-0-323-85733-8.00018-4

How to cite: McCaig, A., Lissenberg, J., Lang, S., and Peter, B. and the International Ocean Discovery Program Expedition 399 Science Party: IODP Expedition 399: the six million year uplift history of a record-breaking section of depleted mantle, EGU General Assembly 2025, Vienna, Austria, 27 Apr–2 May 2025, EGU25-18332, https://doi.org/10.5194/egusphere-egu25-18332, 2025.

EGU25-20531 | Orals | GD5.3

Boninites formed in deep hydrothermal fault zones at mid-ocean ridges: experimental evidence  

Jürgen Koepke, Sandrin Feig, and Jasper Berndt-Gerdes

Water-saturated partial melting experiments were carried out using a refractory harzburgite from the Oman Ophiolite as starting material. The experiments were performed at pressures of 100, 200 and 500 MPa using both reducing (corresponding to the FMQ buffer) and oxidizing (FMQ+3) conditions. Specially designed internally heated pressure vessels were used to control oxygen fugacity and allow rapid quenching. Temperatures varied between 980 and 1220°C, and run durations were up to 82 hours.  The solidus and clinopyroxene-out curve show significant variation with pressure.  As expected, the melts produced were generally SiO2-rich, with SiO2 concentrations ranging between 55 and 65 wt%. These melts exhibit boninitic characteristics. Due to the refractory character of the starting material, the experimental melts are highly depleted in incompatible trace elements, showing chondrite-normalized REE patterns with a characteristic concave-upward shape. Calcium and sodium in the system are mainly derived from the clinopyroxene in the starting harzburgite, resulting in extremely high Ca/Na ratios in the experimental melts. At temperatures above the clinopyroxene breakdown, the residual mineral paragenesis exhibits characteristics similar to extremely refractory harzburgites, with Cr# in Cr-spinel (Cr2O3 /(Al2O3 + Cr2O3), molar) reaching up to 86, reminiscent of ophiolites formed under supra-subduction zone conditions.

The melts produced have compositions of high-Mg andesite and boninite. Our experimental results show that the formation of distinct rock types within the paleocrust of the Oman Ophiolite such as high-Ca boninites, high-Si boninites, high-Mg andesites, depleted gabbronorite cumulate rocks, and extremely refractory harzburgites containing Cr-spinel with Cr# > 80, could, in principle, be attributed to a single process of fluid-induced partial melting of harzburgite below the crust/mantle boundary of the Oman paleocrust. The temperatures for the heating process (> 1040°C) for such a model, could be provided by ascending MORB magmas. The presence of water-rich fluids at the crust/mantle boundary or within the uppermost mantle which are necessary for such a model, could be derived from seawater via deep hydrothermal fault zones. We present amphibole data from deep hydrothermal fault zones in the lowermost gabbros of the Oman Ophiolite, which provide evidence that temperatures of deep hydrothermal fault zones are high enough to trigger the melting of hydrated harzburgites.

How to cite: Koepke, J., Feig, S., and Berndt-Gerdes, J.: Boninites formed in deep hydrothermal fault zones at mid-ocean ridges: experimental evidence , EGU General Assembly 2025, Vienna, Austria, 27 Apr–2 May 2025, EGU25-20531, https://doi.org/10.5194/egusphere-egu25-20531, 2025.

BG8 – Biogeosciences, Policy and Society

EGU25-2251 | Posters on site | BG8.2

Quantifying Carbon Absorption of Riverine Wetlands and Proposing Restoration Scenarios 

Hoyong Lee, Soojun Kim, Kyunghun Kim, and Jaeseung Seo

Riverine wetlands are reservoirs of biodiversity and provide various ecological functions, including carbon absorption. However, they have been subjected to continuous degradation and loss due to river management practices focused on irrigation and flood control. This study aims to quantify the carbon absorption capacity of riverine wetlands and propose strategies for their restoration and management. To achieve this, a laboratory-scale wetland model was developed, and carbon absorption rates were analyzed under varying hydrological conditions. The results revealed that while methane emissions increased under inundation conditions, the absorption of carbon dioxide increased even more significantly. When assessed using the Global Warming Potential (GWP) metric, the overall carbon absorption capacity was found to improve. Wetlands were spatially categorized into waterside wetlands (outside the levee) and landside wetlands (inside the levee) to establish a carbon absorption assessment framework. This framework was used to evaluate restoration needs and propose tailored restoration scenarios for each wetland type. For waterside wetlands, strategies were suggested to regulate carbon absorption based on inundation zones and hydrological characteristics. For landside wetlands, a model was developed to enhance carbon absorption through the creation of carbon forests using Nature-based Solutions (NbS) and biochar application. Additionally, the carbon cycle was established as a closed system, termed the "Carbon-Closing System," to promote sustainability. This study provides standardized models and evaluation frameworks for carbon-neutral riverine wetlands, advancing technologies for wetland creation, restoration, and management while contributing to climate change mitigation and ecological value enhancement.


Keywords: Carbon Absorption, Hydrological Conditions, Restoration Scenarios, Riverine Wetlands


Acknowledgement: This work was supported by Korea Environmental Industry&Technology Institute through Wetland Ecosystem Value Evaluation and Carbon Absorption Value Promotion Technology Development Project, funded by Korea Ministry of Environment(MOE)(2022003630001)

How to cite: Lee, H., Kim, S., Kim, K., and Seo, J.: Quantifying Carbon Absorption of Riverine Wetlands and Proposing Restoration Scenarios, EGU General Assembly 2025, Vienna, Austria, 27 Apr–2 May 2025, EGU25-2251, https://doi.org/10.5194/egusphere-egu25-2251, 2025.

Land management interventions such as forest management have gained significant traction in the last few years as instruments in increasing carbon sequestration in working lands of the United States. Indeed, storing carbon in forests has been identified as a key nature-based solution pathway. While the importance of forest management in maintaining and potentially enhancing the terrestrial carbon sinks has been well established, carbon as a management objective in the practical context of silviculture and forest management is a relatively new concept. Yet a new emissions trading market, the Voluntary Carbon Offset Market in California, has been dominated by offsets originating from managed forests. Furthermore, almost two hundred million forest carbon offsets have been issued through the California Cap-and-Trade Program and Voluntary Offset Market, yet little information is available on the practical forest management applied in these projects. Finally, in 2021, California passed Senate Bill (SB-155) allocating $2.5 billion in state funding for forest resilience and wildfire prevention, but as of now, lacks a universal framework for transparently assessing the carbon benefits (i.e., additionality) claimed by forest carbon offset projects.

Within the offset markets context, improved forest management (IFM) has been identified as one of the forestry-related land management pathways with significant climate change mitigation potential. Currently, IFM is loosely defined and how it translates into practical forestry and connects to sustainable forest management (i.e., best management practices) as a whole has not been identified in detail. Our novel analysis of the offset market in California reveals that while improved forest management is the most credited project type in the California market, existing projects vary to a great degree in their disclosure about the planned or completed forest management activities for the project area. Our research has found several gaps and research and policy needs—particularly related to forest practices considered improved forest management, forest carbon offset additionality and permanence—and finally, highlights a pressing need for policy instruments to support and oversee these efforts.

How to cite: Kaarakka, L., Rothey, J., Cornett, M., and Dee, L.: Forests, forest management and climate change – understanding the existing forest offset market and its connection to practical forest management in the United States, EGU General Assembly 2025, Vienna, Austria, 27 Apr–2 May 2025, EGU25-2950, https://doi.org/10.5194/egusphere-egu25-2950, 2025.

EGU25-3721 | ECS | Posters on site | BG8.2

Me4soc: a multi-model ensemble interface for soil organic carbon predictions 

Elisa Bruni, Aleksi Lehtonen, and Bertrand Guenet

Model predictions are paramount to understanding climate and land management effects on soil organic carbon (SOC) stocks and greenhouse gas (GHG) emissions in forests. However, SOC models remain highly uncertain, and multi-model ensembles can be used to evaluate the level of uncertainty of the predictions due to model choice. One major barrier to the use of multiple models is data availability and the time-scale consistency across models.

In this work, we present me4soc, a Multi-model Ensemble interface For Soil Organic Carbon predictions. This open-source software offers a complete environment to launch six SOC models widely used by the soil community to predict the dynamics of SOC stocks and GHG fluxes (CO2, CH4, and N2O) in forests. It allows users to explore the effect of nature-based climate solutions over multiple decades under climate and land-use changes. The models can be run with either user-provided observational data or data automatically extracted from large-scale open-source datasets for the European region. Available earth system model predictions are used to simulate climate and land-use change scenarios. The tool has been developed in Shiny, a R-based package for simple web application developments.

The obtained results showed the ability of me4soc to simulate the temporal dynamics of SOC stocks and GHG emissions at site-scale under different climate, land-use, and land management change scenarios. Employing multiple models based on different mathematical structures offers a unique opportunity to estimate the uncertainties in the predictions associated with differences in the model structure.

This tool can be applied by the scientific community, forest managers, and policymakers to acquire scientifically-based information about the effects of forest management and disturbances on SOC stocks and GHG emissions. It is an important step towards the use of state-of-the-art models and large-scale datasets to improve model predictions and assess their uncertainties. The software's systematic validation with observational data and parameter optimization to improve model fit are the key priorities of future work. Further software developments to cover other ecosystems (e.g., croplands and grasslands) and data-less sites outside of Europe are also foreseen.

How to cite: Bruni, E., Lehtonen, A., and Guenet, B.: Me4soc: a multi-model ensemble interface for soil organic carbon predictions, EGU General Assembly 2025, Vienna, Austria, 27 Apr–2 May 2025, EGU25-3721, https://doi.org/10.5194/egusphere-egu25-3721, 2025.

EGU25-4808 | ECS | Orals | BG8.2

Nitrous oxide emission hotspots in temporarily flooded cropland depressions: year-round measurements and regional estimation 

Peiyan Wang, Sarah Kylborg, Xiaoye Tong, Bo Elberling, and Per Ambus

Temporarily flooded depressions within cropland have been identified as substantial hotspots of nitrous oxide (N2O) emission, releasing up to 80 times more N2O than surrounding field areas during the flooded period. Despite their significant contribution, the temporal dynamics of N₂O emissions from these depressions and their impact on regional annual N₂O budgets remain inadequately quantified. The primary drivers of these high emissions are poorly understood, limiting the accuracy of regional estimates and the development of effective mitigation strategies.

To address this knowledge gap, we established two elevation transects in two Danish croplands, each comprising five positions (0, 1, 2, 3, 4; with three replicate plots per position) along a slope gradient from depressions to the uphill areas. Biweekly in-situ N₂O flux measurements were conducted at each plot over a year (March 2020 to March 2021) using static chambers. Concurrently, soil samples were collected for laboratory analysis of physicochemical properties along with each field measurement, and soil water content and temperature were monitored at 30-minute intervals in the depression areas. Additionally, daily photographs of each transect were captured using installed cameras, and daily remote sensing images at 3-m resolution (PlanetScope) were utilized to evaluate relative wetness for each plot. Based on the field data, daily photos, and relative wetness, the study year was divided into three distinct periods:  flooded period (with water above the soil surface), flood recover period (characterized by high soil water content typically after flooding), and drained period (with comparable soil moisture between depression and uphill areas).

Our results reveal significant spatial and temporal variability in N₂O fluxes along the transects. Positions within the depressions exhibited significantly higher annual mean N₂O fluxes, ranging from 93.4 to 204.6 µg N₂O m⁻² h⁻¹, compared to 20.6 to 58.2 µg N₂O m⁻² h⁻¹ in the transition areas and 12.1 to 26.4 µg N₂O m⁻² h⁻¹ in the uphill areas. Temporally, flood recover period in depressions showed the highest N₂O fluxes compared to any other periods, whereas the uphill areas maintained consistent emissions throughout the year. Annual cumulative N₂O emissions from positions within the depressions were estimated to be 0.64 to 1.5 g N₂O m⁻², significantly higher than the emissions of 0.16 to 0.39 N₂O m⁻² from transition areas and 0.09 to 0.27 g N₂O m⁻² from uphill areas. Regionally, although depressions cover less than 1% of the total cultivated area, they contribute approximately 10% to the total annual N₂O emissions. Our analysis identified soil moisture and temperature as key drivers for the spatial and temporal variabilities in N₂O emissions along the transects. These findings highlight the importance of incorporating high-emitting depressions into local and regional N₂O inventories to improve the accuracy of agricultural greenhouse gas estimates and inform the development of effective mitigation strategies.

How to cite: Wang, P., Kylborg, S., Tong, X., Elberling, B., and Ambus, P.: Nitrous oxide emission hotspots in temporarily flooded cropland depressions: year-round measurements and regional estimation, EGU General Assembly 2025, Vienna, Austria, 27 Apr–2 May 2025, EGU25-4808, https://doi.org/10.5194/egusphere-egu25-4808, 2025.

EGU25-7574 | ECS | Orals | BG8.2 | Highlight

Scalable quantification of agroecosystem carbon budget and crop yield based on knowledge-guided machine learning 

Wang Zhou, Licheng Liu, Kaiyu Guan, Zhenong Jin, Bin Peng, and Sheng Wang

Quantifying carbon outcomes from agroecosystems plays an important role in mitigating global warming and ensuring food security through sustainable production. However, high spatial-temporal-resolution (e.g., ~100m, daily), accurate, well-resolved carbon budgets and crop yield in agroecosystems are extremely challenging to quantify due to the complexity of involved processes and large variations in environmental and management drivers. Traditional process-based-modeling approaches are computationally expensive to achieve field-scale resolution and contain large uncertainty due to underdetermined model structure and parameters. Knowledge-guided machine learning (KGML) is a hybrid modeling approach that leverages recent advances in machine learning combined with known physical principles and relationships to enhance the training and application processes, which helps open the “black box” of conventional ML models, and enable better predictions that capture variability in both time and space. Here we proposed a data-efficient KGML framework that effectively predicts daily variations in agricultural CO2 emissions, crop yields, and soil carbon storage at field scale, as successfully demonstrated for the US Midwest. Multi-source data and pretraining with outputs from a well-validated agroecosystem model were incorporated into a hierarchically structured deep learning neural network that greatly outperformed both process-based and pure machine learning models, especially in data-limited cases. This work demonstrates the advantages of integrating domain knowledge with state-of-the-art artificial intelligence in agroecosystem modeling that will lead toward broader use of KGML in geoscience.

How to cite: Zhou, W., Liu, L., Guan, K., Jin, Z., Peng, B., and Wang, S.: Scalable quantification of agroecosystem carbon budget and crop yield based on knowledge-guided machine learning, EGU General Assembly 2025, Vienna, Austria, 27 Apr–2 May 2025, EGU25-7574, https://doi.org/10.5194/egusphere-egu25-7574, 2025.

EGU25-7672 | ECS | Posters on site | BG8.2

Revisiting the role of China’s protected areas in carbon storage  

Shuhan Wang, Jian Peng, Yifan Lin, and Tao Hu

It is widely expected that conservation efforts within protected areas (PAs) can achieve multiple conservation objectives simultaneously. PAs established primarily for biodiversity conservation also contribute to increasing carbon storage in terrestrial ecosystems. However, there is a lack of quantitative studies on the role of China’s existing PAs in carbon storage protection. We proposed an integrated approach to estimate the carbon density of terrestrial ecosystems in China, based on a modified InVEST model. Through a statistical matching method, we evaluated the effectiveness of PAs in conserving carbon storage during 2020-2050. Under the moderate emission scenario (SSP2-RCP4.5), the average carbon density of PAs was projected to increase to 168.3 Mg C ha-1, a 14.2% rise compared to 2020. In contrast, under the low emission scenario (SSP1-RCP2.6) and high emission scenario (SSP5-RCP8.5), the average carbon density of PAs was projected to decrease by 4.8% and 4.6%, respectively. By 2050, approximately 45%-47% of PAs were expected to be effective in conserving carbon storage, with about 80% of PAs experiencing no change in effectiveness during 2020-2050. Additionally, 34.3%-36.2% of the areas of PAs remained effective, while 1.8%-4.0% were projected to transition from ineffective to effective. PAs effective in conserving carbon storage were predominantly located in humid, mid-to-high-altitude regions. Given the spatial mismatch among existing PAs, priority areas for carbon storage protection and effective areas for carbon storage protection, our findings underscored the necessity of expanding China’s PA system to expand the additional benefits of PAs in conserving carbon storage.

How to cite: Wang, S., Peng, J., Lin, Y., and Hu, T.: Revisiting the role of China’s protected areas in carbon storage , EGU General Assembly 2025, Vienna, Austria, 27 Apr–2 May 2025, EGU25-7672, https://doi.org/10.5194/egusphere-egu25-7672, 2025.

Accurate large-scale crop yield estimation is increasingly critical for agricultural management and understanding the dynamics of food security under climate change. The complex nature of crop growth, influenced by multiple environmental factors across temporal scales, requires advanced approaches for yield prediction. While recent advances in remote sensing provide diverse data sources for enhanced crop monitoring capabilities, effectively integrating heterogeneous data sources at large scales remains challenging for accurate yield prediction. In this study, we developed a temporal multi-modal fusion framework for soft wheat yield prediction at the sub-national level across the European Union from 2001 to 2019. Our framework integrated time-series data from optical remote sensing observations, climate data, and vegetation productivity indicators, along with static soil properties. A Transformer encoder was used to extract temporal patterns of crop growth, and the temporal features were fused with soil features to capture spatial patterns for large-scale wheat yield prediction. The proposed framework achieved much better performance (RMSE = 0.75 t·ha-1) compared with benchmark models including LSTM (RMSE = 0.82 t·ha-1) and Random Forest (RMSE = 1.09 t·ha-1). The study indicates that late fusion strategies are more effective in preserving modality-specific temporal patterns, enhancing the accuracy by 5.9% (RMSE) compared to early fusion. Ablation studies reveal the incremental benefits of multi-modal data integration, with soil properties notably improving prediction performance by 15.0-23.9% (RMSE). Feature importance analysis through explainable machine learning indicates that remote-sensing-related variables contribute more significantly to yield prediction than climatic variables.  The novel multi-modal fusion framework developed in this study for large-scale crop yield prediction provides insights into understanding crop-environment relationships in wheat yield formation.

How to cite: Lin, Z., Guan, K., and Wang, S.: Temporal Multi-modal Fusion Framework for Predicting Wheat Yield across the EU from Multi-source Satellite and Environmental Data, EGU General Assembly 2025, Vienna, Austria, 27 Apr–2 May 2025, EGU25-7753, https://doi.org/10.5194/egusphere-egu25-7753, 2025.

EGU25-8055 | Posters on site | BG8.2

Cross-scale Sensing of Field-level Essential Agroecosystem Variables for the EU Climate-smart Agriculture 

Sheng Wang, Kaiyu Guan, Jørgen E. Olesen, Rui Zhou, Zhiju Lu, Zhixian Lin, Sijia Feng, René Gislum, Claire Treat, and Klaus Butterbach-Bahl

Climate-smart agriculture aims to implement a suite of conservation management practices, such as cover crops, reduced tillage, smart irrigation and crop rotations, to maximize agroecosystem productivity and reduce greenhouse gas emissions. Timely and high-resolution agriculture data are crucial for measuring, reporting and verifying the implementation and benefits of climate-smart agriculture practices. However, agricultural data collection through field sampling, laboratory analysis, and/or grower surveys is time-consuming and costly. To address these challenges, we developed an artificial intelligence-empowered cross-scale sensing framework to integrate multi-source ground truth data with multi-modal satellite Earth observations to quantify high spatial and temporal information of essential agroecosystem variables in the EU. Specifically, these essential variables include crop types, harvest time, tillage practices, cover crop adoption and biomass, crop yield, soil moisture, ecosystem gross primary productivity and evapotranspiration. We developed computer vision and machine learning algorithms to obtain ground truth data from in-situ measurements, citizen sciences, census surveys, and ground or aerial vehicle system data. Through process-guided machine learning (PGML), we integrated the domain knowledge of soil-vegetation radiative transfer models and ground truth data to accurately quantify these essential variables from Sentinel-1, 2, 3 and SMAP satellite data. This study highlights the potential of integrating cross-scale sensing and PGML to quantify essential ecosystem variables to support climate-smart agriculture.

How to cite: Wang, S., Guan, K., E. Olesen, J., Zhou, R., Lu, Z., Lin, Z., Feng, S., Gislum, R., Treat, C., and Butterbach-Bahl, K.: Cross-scale Sensing of Field-level Essential Agroecosystem Variables for the EU Climate-smart Agriculture, EGU General Assembly 2025, Vienna, Austria, 27 Apr–2 May 2025, EGU25-8055, https://doi.org/10.5194/egusphere-egu25-8055, 2025.

EGU25-8696 | ECS | Posters on site | BG8.2

Improving satellite microwave sensing of global soil moisture via radiative transfer process-guided machine learning 

Sijia Feng, Aoyang Li, Klaus Butterbach-Bahl, Majken C. Looms, Kaiyu Guan, Claire Treat, Christian Igel, and Sheng Wang

Accurately estimating top ~5 cm surface soil moisture (SM) is highly valuable for understanding the terrestrial water cycle. Based on the zero-order τ-ω radiative transfer model (RTM), the Soil Moisture Active Passive (SMAP) mission has provided daily global surface SM estimations at 9 km spatial resolution using L-band (1.41 GHz) radiometry since April 2015. As the parameterization of RTM for SMAP's official algorithm highly relies on in-situ measurements, SMAP SM has weaker performance in regions with few calibration sites. To improve the accuracy of global SM estimations, we developed a new radiative transfer Process-Guided Machine Learning (PGML) method, which integrates the mechanistic understanding of RTM and data-driven machine learning approaches to estimate global SM. We generated a synthetic dataset from RTM and developed a pre-trained PGML to quantify SM by using this synthetic dataset. Furthermore, we utilized SM measurements at 1131 in-situ sites collected from International Soil Moisture Network (ISMN) during April 2015 and December 2023 across the globe to fine-tune PGML. The validation result shows that the estimated  9-km daily PGML global SM has a good agreement with in-situ SM measurements from ISMN. Our model has significantly better performance on estimating global SM  than the SM retrievals from RTM (R from 0.413 to 0.636, RMSE from 0.132 to 0.100 m3/m3, bias from 0.042 to 0.001 m3/m3, ubRMSE from 0.125 to 0.100 m3/m3). This study highlights the potential of PGML to integrate machine learning and radiative transfer models for accurate remote sensing of SM at the global scale.

How to cite: Feng, S., Li, A., Butterbach-Bahl, K., C. Looms, M., Guan, K., Treat, C., Igel, C., and Wang, S.: Improving satellite microwave sensing of global soil moisture via radiative transfer process-guided machine learning, EGU General Assembly 2025, Vienna, Austria, 27 Apr–2 May 2025, EGU25-8696, https://doi.org/10.5194/egusphere-egu25-8696, 2025.

EGU25-9828 | ECS | Posters on site | BG8.2

Advancing understanding of sustainable production on livestock farms: The importance of accurately assessing upland soil carbon stocks  

Laura Giles, Phil Scott, Jess Davies, Jan Bebbington, and John Quinton

Whilst it is generally understood that grasslands are able to store significant amounts of carbon and that much of our degraded agricultural soil has capacity to build carbon stocks and potentially mitigate on-farm emissions, to date, the greater focus of studies has been on the response of lowland grassland soil carbon to management practices. In contrast, comprehension of current and potential soil carbon stocks in heterogeneric ‘upland’ or marginal farmed environments is currently lacking, and the potential for sustainable livestock production to deliver increased soil carbon sequestration unsubstantiated. With upland farming systems producing 29% and 44% of breeding cows and sheep respectively, understanding the impact of changes in upland livestock management on soil carbon is critical to ensure future land management scenarios are environmentally positive and can sustain food production.

We aim to address this knowledge gap by combining field surveys of soil carbon concentrations and stocks with modelling of potential soil carbon change under nutrient, land use and climate change scenarios using the process-based N14CP model. In this contribution we will present the empirical data and carbon modelling results.

Three 'upland' livestock farms in Cumbria, UK were chosen as representative of diversity of parent material, climate, topography and livestock farming practices. Pedogenic-stratified random sampling of the top 0 – 30cm soil at a rate of 1 sample per 2 hectares; ≥5 metres apart was conducted July-September 2024. Samples were assessed for bulk density (corrected for coarse fragments ≥2mm) and carbon concentration (by dry combustion).

Preliminary analyses suggest high spatial variation in bulk density, soil carbon concentration and stocks within and between farms, reflecting the heterogeneity of ‘upland’ environments. Our sampling approach demonstrates that detecting change in soil carbon empirically, with confidence, is unlikely to be possible in these diverse landscapes, with implications for predicting carbon sequestration potential as climate mitigation.

How to cite: Giles, L., Scott, P., Davies, J., Bebbington, J., and Quinton, J.: Advancing understanding of sustainable production on livestock farms: The importance of accurately assessing upland soil carbon stocks , EGU General Assembly 2025, Vienna, Austria, 27 Apr–2 May 2025, EGU25-9828, https://doi.org/10.5194/egusphere-egu25-9828, 2025.

EGU25-11022 | ECS | Orals | BG8.2

Estimating the carbon dioxide removal potential of alley-cropping agroforestry systems in Germany 

Stephen Björn Wirth, Susanne Rolinski, and Christoph Müller

Agroforestry (AF) refers to a wide range of agricultural practices that incorporate woody plants into crop- and grasslands. Agroforestry systems (AFS) can be distinguished by their share of trees and their spatial allocation, the selection of tree species, and tree management. While AFS are common in the global south to promote soil fertility, reduce heat stress and improve the water balance, they are less common in the global north. Currently, AFS are discussed as a nature-based solution for terrestrial carbon dioxide removal (CDR). Here, alley-cropping AFS are a promising system because their tree cover is sufficiently large for significant CDR rates and they are still compatible with the use of agricultural machinery that is common in modern agricultural practices. However, estimating the large-scale CDR potential of AFS is challenging because of the variety of potential systems whose performance strongly depends on environmental conditions.

We study the CDR potential of AFS by extending the process based dynamic global vegetation model Lund-Potsdam-Jena managed Land (LPJmL) to represent alley-cropping AFS on cropland. The model explicitly accounts for shading effects of tree rows depending on row and tree distance and row orientation as well as the competition for soil water and nutrients between trees and crops. As an example for potential model applications, we assessed the future CDR potential of timber alley-cropping AFS for Germany assuming a moderate linear annual increase of AF areas by 0.5% of the total cropland area until 2060 and a moderate tree cover.

With the process-based representation of AFS in LPJmL, the model can be applied to study carbon, water, and nitrogen fluxes and pools of different alley-cropping AFS and conventional cropping systems at large spatial scales, including maximum carbon sequestration rates, potential equilibrium states and reversibility.

How to cite: Wirth, S. B., Rolinski, S., and Müller, C.: Estimating the carbon dioxide removal potential of alley-cropping agroforestry systems in Germany, EGU General Assembly 2025, Vienna, Austria, 27 Apr–2 May 2025, EGU25-11022, https://doi.org/10.5194/egusphere-egu25-11022, 2025.

EGU25-14513 | ECS | Orals | BG8.2

Balancing Productivity and Climate Impact: Climate-Smart Potential of Irrigation Practices 

Shashank Kumar Anand, Rishabh Singh, Binayak Mohanty, Lorenzo Rosa, Nithya Rajan, and Salvatore Calabrese

Traditional agricultural practices have placed unsustainable pressures on soils, resulting in degraded soil health and losses in biodiversity and fertility. Modern agriculture faces the dual challenge of increasing productivity while building resilience to climate change, particularly in water-scarce regions where crop productivity is at risk. Recognizing the potential of agricultural soils as a nature-based climate solution, climate-smart agriculture (CSA) offers a transformative strategy by integrating conservation practices and efficient water management to enhance soil health and mitigate climate impacts. From an irrigation perspective, this necessitates a comprehensive framework to holistically evaluate practices, moving beyond traditional objectives of maximizing yield and water use efficiency. In this study, we develop a multi-objective optimization framework for climate-smart irrigation (CSI), whereby a dual-index system evaluates irrigation systems (e.g., drip, sprinkler) and strategies (e.g., stress-avoidance, deficit irrigation) across productivity and climate impact dimensions. We first demonstrate the application of this framework by analyzing field studies of different crops (such as wheat and rice), irrigation practices and soil greenhouse gas (GHG) emission compositions, showing how the new indices jointly identify optimal irrigation practices. Additionally, using an ensemble of crop model simulations for corn production using irrigation across major U.S. production regions under varying climate and soil conditions, we explore trade-offs between productivity and climate impact goals. Results reveal a spectrum of Pareto-optimal irrigation practices that balance these dual objectives. These insights underscore the importance of holistic approaches in CSI and are critical for providing actionable insights into nature-based climate solutions in agricultural ecosystems.

How to cite: Anand, S. K., Singh, R., Mohanty, B., Rosa, L., Rajan, N., and Calabrese, S.: Balancing Productivity and Climate Impact: Climate-Smart Potential of Irrigation Practices, EGU General Assembly 2025, Vienna, Austria, 27 Apr–2 May 2025, EGU25-14513, https://doi.org/10.5194/egusphere-egu25-14513, 2025.

More Nature-based Solutions (NbS) and related, new farming practices are needed to promote the green transition of agriculture, and to reach the policy targets set in relation to environmental protection, biodiversity preservation, climate change adaptation and mitigation in combination with a sustainable agricultural production. This issue is addressed in a series of research and innovation projects, including the pan-European and China related trans4num.eu Horizon Europe project, and the Sustainscpes.org and Land-CRAFT.dk research centers.
This paper outlines the research-based development of a Decision Support System (DSS), coupled with farm models and data, for farmers and multiple stakeholders to prioritize and implement more NbS in their practices, and thereby meet targets set. Special focus is put on agricultural nutrient management. A new point for innovation is that the DSS should be able to operate at the landscape scale, together with central NatureBased solutions, and thereby used in new types of catchment scale advisory services, relevant to both farmers and other industry related decision makers, as well as for policy development.     
NbS measures of particular relevance for the Limfjorden study area are selected (incl. conversion from rotational crops to more permanent crops, in particular more grassland, and related new types of crop rotations). Innovative methods for landscape scale data collection are developed (based on digital farm data sources and remote sensing techniques), and the multiple stakeholder DSS design is developed though workshops in collaboration with local stakeholders, and demonstration of the landscape scale data collected. 
Results are presented in the form of solution scenarios for green transitions in the Limfjorden catchment, based on the selected NbS, and the DSS components developed. GIS-based maps are used to illustrate the potentials and implications for farmers as well as local, regional, national and international decision-makers are discussed. Feedbacks to the implications for local farming system development are collected, and potentials and further research needs for upscaling and similar applications in other sites across Europe and beyond are synthesized and discussed.

How to cite: Dalgaard, T.: Decision support for Nature-based Solutions in agricultural nutrient management – Green transition scenarios demonstrated for the landscapes around Limfjorden, Denmark, EGU General Assembly 2025, Vienna, Austria, 27 Apr–2 May 2025, EGU25-15083, https://doi.org/10.5194/egusphere-egu25-15083, 2025.

EGU25-15993 | ECS | Posters on site | BG8.2

A review of whole-farm models - gaps in the literature, links to landscape-level modelling and assessments of Nature-Based Solutions 

Fabio Delle Grazie, Nicholas Hutchings, Tommy Dalgaard, and Klaus Butterbach-Bahl

This article contains a review of whole-farm models for the description of nutrient cycles and greenhouse gas emissions, identifying research needs for the assessment of Nature-based Solutions for reduced emissions, occurring at the interface between the farm and the landscape level. The review thereby aims to give an overview of the state of the art of farm-level models and highlight gaps in the literature with the view of integrating whole-farm models into landscape-level modelling and assessments. The review covers peer-reviewed articles published in the period between 1980 and April 2024, captured in the Web of Science and Scopus databases, as well as using the snowballing method. Google scholar was also used to gather the relevant articles. The articles were described using several characteristics, such as country of origin, year published and complexity of the model. Dynamic process-based models were the most used, particularly the Agricultural Production Systems sIMulator, APSIM and the Integrated Farm System, IFSM, with life cycle assessment (LCA) also being widely used. Dairy and beef farms were the most studied farm types, with most studies published from the USA, followed by Australia and New Zealand; however significant gaps were identified regarding complete whole farm models, including all parts of the farming systems, and links to the landscape level modelling needed to assess key Nature-Based Solutions to reduce emissions from agriculture. The review allowed to highlight these gaps, which will be illustrated by examples from Denmark and studies related to the Land-CRAFT.dk Pioneer Center for Landscape Research in Sustainable Agricultural Futures. The tools most used for the assessment of Nature-based Solutions are also highlighted.

How to cite: Delle Grazie, F., Hutchings, N., Dalgaard, T., and Butterbach-Bahl, K.: A review of whole-farm models - gaps in the literature, links to landscape-level modelling and assessments of Nature-Based Solutions, EGU General Assembly 2025, Vienna, Austria, 27 Apr–2 May 2025, EGU25-15993, https://doi.org/10.5194/egusphere-egu25-15993, 2025.

EGU25-16922 | ECS | Posters on site | BG8.2

Assessment of climate mitigation potential of French grasslands using the land surface model ORCHIDEE-GM 

Emilio Baud Fraile, Jinfeng Chang, Eric Ceschia, Katja Klumpp, Pierre Mischler, Nicolas Viovy, and Ronny Lauerwald

There is now growing awareness that agricultural land use impacts climate not only through its GHG budget, but also through albedo-mediated changes of the surface energy budget. For instance, grasslands have higher surface albedo (i.e. more incoming solar radiation is reflected instead of being adsorbed and transferred into heat) than forage crops especially during the fallow period.

The project ALBAATRE-Systèmes focuses on reducing the climate impact of forage systems by increasing the share of grassland and by adapting land management practices to increase surface albedo. For this, extensive experimental data is collected from a network of experimental farms from IDELE across France as well as at ICOS flux tower sites. At the same time a modelling framework is being developed to upscale the experimental data at the scale of France. For this task, we use the land surface model ORCHIDEE-GM (Chang et al., 2013), which represents a branch of the global land surface model ORCHIDEE (Krinner et al., 2005) that incorporates main features of the grassland management model PaSim (Riedo et al., 1998). This model is used to study the impact on production and climate of grasslands management such as grazing, fertilization and cutting. At present, however, it has a very simplistic surface albedo description.

Therefore, this study intends to improve albedo formalisms in ORCHIDEE-GM v3.2 in order to better take into account the seasonal and structural changes of different grassland types in France. To evaluate the model, we will use the in-situ data collected over several years at the IDELE farms and at the ICOS grassland flux towers sites.

The meteorological and flux data from ICOS sites were used as input and to calibrate ORCHIDEE. The reflectance of vegetation is now described across the short wave spectrum (400 nm to 2500 nm) as a function of leaf area index, average leaf angle, leaf water content, and pigment concentration. First results show that the new albedo description has a better correlation with the observed data than with the original one but still needs to be investigated further.

This model development will allow us to better account for the albedo changes that happen in response to meteorologic conditions and management practices, thus better quantifying the mitigation potential of French grasslands (forage and natural). Moreover, future simulations will help to adapt management practices and to recommend specific grass species that have a high albedo and/or resilience to heat and drought stress, increasing both the climate change adaptation and mitigation potentials of the French forage systems.

How to cite: Baud Fraile, E., Chang, J., Ceschia, E., Klumpp, K., Mischler, P., Viovy, N., and Lauerwald, R.: Assessment of climate mitigation potential of French grasslands using the land surface model ORCHIDEE-GM, EGU General Assembly 2025, Vienna, Austria, 27 Apr–2 May 2025, EGU25-16922, https://doi.org/10.5194/egusphere-egu25-16922, 2025.

EGU25-17273 | ECS | Orals | BG8.2

Quantification of the biogeophysical impact of crop residue management in Europe 

Ke Yu, Yang Su, Philippe Ciais, Ronny Lauerwald, David Makowski, Eric Ceschia, Tiphaine Tallec, and Daniel Goll

Managing jointly the biogeochemical and biogeophysical (e.g. albedo and energy fluxes) impacts of agriculture is essential towards reaching climate-neutral agriculture. Only few observations collected in a small number of sites are available to quantify the impacts of agriculture on both the biogeochemical and biogeophysical effects on climate. The coupling of dedicated crop models with land surface models allows the combined quantification of those effects, but often lacks crop-specific parameterization and accounting of cropland management effects on biogeophysical effects. For these reasons, the biogeophysical and net climatic impact of agriculture on climate remains uncertain.  

Here, we refined spatiotemporal bare soil albedo dynamics and the quantification of crop pigmentation and canopy structure effects on cropland albedo in the ORCHIDEE-CROP land surface model. This model develops a detailed crop growing module based on the process-based STICS formalism.  We further introduced a new module assessing the effects of crop residues on soil albedo and soil evaporation. The model was parameterized and evaluated at nine European cropland flux sites for which detailed management information, field photos, soil moisture and surface albedo monitoring data were available. In addition, we produced a novel daily bare soil albedo product derived from Sentinel-2 at 300 m spatial resolution for Europe. 

Using the refined model we quantified the effect of the presence of crop residues on radiative forcing, soil temperature and soil moisture of winter wheat crops. Simulations with the presence of crop residues left on the soil after harvest in 2-3 months increased surface albedo by approximately 0.08±0.03 in average, with significant spatiotemporal variability influenced by meteorological and soil conditions, as well as tillage practices among sites. We further found that over the same period residue cooled the surface soil by −1.18 ± 1.98 ℃ and enhanced the total soil water content by 35.77 ± 36.23 kg/m2. In a simulation of 10-year dry scenarios, we found that returning crop residues to the field can progressively increase plant available water over multiple years, with the extent of this increase influenced by climatic conditions. This study underscores the significance of the biogeophysical impacts of residue management on surface energy balance and highlights its potential in mitigating climate change, in particular in a warmer drier climate in Europe. The new framework developed in this study allows for a more rigorous assessment of the combined biogeochemical and biophysical impacts of field operations in Earth System Models such as cover crops that could allow climate cooling both through soil organic carbon sequestration and increase in surface albedo.

How to cite: Yu, K., Su, Y., Ciais, P., Lauerwald, R., Makowski, D., Ceschia, E., Tallec, T., and Goll, D.: Quantification of the biogeophysical impact of crop residue management in Europe, EGU General Assembly 2025, Vienna, Austria, 27 Apr–2 May 2025, EGU25-17273, https://doi.org/10.5194/egusphere-egu25-17273, 2025.

Among other sectors agriculture is under pressure to reduce greenhouse gas (GHG) emission to contribute to national net zero targets. Avoiding all emissions is not possible. Therefore, negative emissions are required to achieve climate neutrality or net zero targets. Croplands are acknowledged to have good capacity to capture and store carbon in form or soil organic matter (SOM). Management changes on croplands are required to increase SOM in cropland. Additionally, monitoring systems must be available to quantify SOM or soil organic carbon (SOC) changes. There are several measuring/monitoring, reporting and verification (MRV) systems in place to provide the required approaches for quantification. However, there are no standards about the structure of an MRV system. Financial constrains driving the applied methods in the available MRV systems for SOC changes, with remote sensing and modelling popular cost-effective solutions. This presentation shows results of an analysis applied in the ClieNFarms project, which assess and advice on solutions to achieve climate neutral farming. Selected MRV systems are analysed for their functionality, applicability and potential accuracy. Further, the available MRV systems are compared for the representation of different compartments that could be implemented for a perfect approach to quantify SOC changes. This is a qualitative analysis highlighting used methods to quantify SOC changes and provides an analysis about the functionality and the applicability of methods being influenced by stakeholder needs and varying levels of data availability. This study also highlights advantages and disadvantages of using the tools and models in MRV systems or for SOC monitoring in general. Models are powerful tools but there is a wide range of different models available, which differ in data demand and accuracy. The results highlight that the available systems are mainly driven by the urgent demand considering an easy applicability, low labour requirements and cost-effectiveness. This is a critical analysis not doubting the quality of available MRV systems, but provide discussion points and views on the available and applied systems.

How to cite: Kuhnert, M., Kashyap, D., and Klumpp, K.: Monitoring of soil carbon storage to achieve climate neutral farming – analysing existing MRV systems and model options, EGU General Assembly 2025, Vienna, Austria, 27 Apr–2 May 2025, EGU25-18001, https://doi.org/10.5194/egusphere-egu25-18001, 2025.

EGU25-18549 | ECS | Posters on site | BG8.2

Short and long-term effects of co-cropping systems in temperate regions: water-carbon interlinkages and the role of cultivar traits 

Oludare Durodola, Cathy Hawes, Jo Smith, Tracy A. Valentine, and Josie Geris

Co-cropping, the cultivation of two or more crops simultaneously on the same field, is a nature-based solution that has high potential to improve climate change adaptation and mitigation in arable systems. The short-term benefits of co-cropping, such as higher yields, better productivity, improved soil carbon and enhanced water uptake, are well-established in temperate regions, but evidence is still generally lacking for humid temperate environments. In addition, the interlinkages between water and carbon dynamics in co-cropping and the longer-term functioning, resilience and sustainability of these systems under future scenarios remain unclear. This study focuses on addressing these knowledge gaps by monitoring the short-term (2 years) and modelling the longer-term (~20 years) impact on water and carbon dynamics in different agricultural co-cropping systems for a typical temperate agroecosystem in Scotland.

The experimental study focussed on two barley (Hordeum vulgare) cultivars with contrasting phenotypic traits (high yielding and stress tolerant), co-cropped with pea (Pisum sativum) and their three corresponding monoculture systems. Crops were grown without agrochemical inputs to investigate the potential for co-cropping in low input systems. On 6 occasions during a two-year field experiment, we investigated soil physical, carbon and nitrogen properties at two depths (i.e. upper (<5 cm) and lower (25-30 cm) topsoil). Crop production and grain quality (i.e. grain carbon and nitrogen contents) were also assessed. Analyses of hydrometric monitoring, and soil and plant samples for stable water isotopes further informed the hydro-climatological conditions and plant water uptake interactions. In the short term, we found that co-cropping modified barley water uptake strategies and enhanced soil carbon, crop production and grain quality, although barley cultivar traits determined the specific effects.

The data also informed a modelling study that coupled a soil carbon (RothC) and water balance model (Hydrus-1) to test how crop water uptake patterns and carbon change interact in co-cropping systems throughout the growing season under different conditions of climate change and water availability. The findings of this study provide an evidence-base for sustainable agricultural practices in temperate systems and determine the resilience of co-cropping systems to future climatic conditions.

How to cite: Durodola, O., Hawes, C., Smith, J., Valentine, T. A., and Geris, J.: Short and long-term effects of co-cropping systems in temperate regions: water-carbon interlinkages and the role of cultivar traits, EGU General Assembly 2025, Vienna, Austria, 27 Apr–2 May 2025, EGU25-18549, https://doi.org/10.5194/egusphere-egu25-18549, 2025.

EGU25-18904 | ECS | Orals | BG8.2

Balancing biogeochemical gains and surface albedo shifts: climate impacts of no-tillage and mulching in Southern Africa 

Souleymane Diop, Rémi Cardinael, Ronny Lauerwald, Petra Sieber, Christian Thierfelder, Regis Chikowo, Marc Corbeels, Armwell Shumba, and Eric Ceschia

Conservation agriculture (CA) practices, such as no-tillage and mulching, can contribute to climate change mitigation by enhancing soil organic carbon (SOC) stocks and by influencing nitrous oxide (N2O) emissions. However, their impacts on surface albedo and overall climate benefits, remain underexplored, particularly in Africa. This study tries to better address the net climate impacts of no-tillage and no-tillage with mulching compared to conventional tillage through two long-term experiments conducted in Zimbabwe - one established on an abruptic Lixisol soil (DTC site), the other one on a xanthic Ferralsol soil (UZF site). Over two years, measurements included SOC concentrations to a depth of 1 m, N2O emissions, and surface albedo. The ICBM soil carbon model was employed to predict SOC stocks over 30 years of CA practices. Results indicated that no-tillage with mulching significantly increased SOC in the topsoil (0–30 cm), with stocks projected to reach 0.41 Mg C ha-1y-1 at DTC and 0.56 Mg C ha-1y-1 at UZF after 30 years. Conversely, no-tillage without mulching resulted in slight SOC losses at DTC, with predicted losses of approximately 0.036 Mg C ha-1y-1 over 30 years, while at UZF, SOC stocks increased by 0.11 Mg C ha-1y-1. Both sites exhibited very low N2O emissions, indicating minimal climate impacts from this source. Net climate impacts were evaluated using the Global Warming Potential (GWP) approach at 20- and 100-year time horizons to assess short- and long-term climate effects. Results showed that no-tillage without mulching increased surface albedo on both soil types, inducing net cooling effects of -2.56 Mg CO2 eq ha-1 y-1 and -0.65 Mg CO2 eq ha-1 y-1, with surface albedo contributing 90% and 86%, respectively, on the Lixisol over 20 and 100 years. On the Ferralsol, no-tillage without mulching generated cooling effects of -1.25 Mg CO2 eq ha-1 y-1 and -0.77 Mg CO2 eq ha-1 y-1, with surface albedo contributing 52% and 23%, respectively, over the same periods. In contrast, mulching had contrasting effects at the two sites. On the Ferralsol, mulching enhanced surface albedo, contributing to net cooling effects of -1.82 Mg CO2 eq ha-1 y-1 over 20 years and -1.57 Mg CO2 eq ha-1 y-1 over 100 years, with surface albedo contributing approximately 20% in the short term and 5% in the long term. Conversely, on the Lixisol, mulching reduced surface albedo, offsetting 100% of SOC benefits and resulting in a near-neutral climate effect of +0.09 Mg CO2 eq ha-1 y-1 over 20 years and +0.55 Mg CO2 eq ha-1 y-1 over 100 years. This study underscores the necessity of integrating biogeochemical and biogeophysical effects when assessing the climate mitigation potential of CA practices, particularly in regions with diverse soil types and climatic conditions.

How to cite: Diop, S., Cardinael, R., Lauerwald, R., Sieber, P., Thierfelder, C., Chikowo, R., Corbeels, M., Shumba, A., and Ceschia, E.: Balancing biogeochemical gains and surface albedo shifts: climate impacts of no-tillage and mulching in Southern Africa, EGU General Assembly 2025, Vienna, Austria, 27 Apr–2 May 2025, EGU25-18904, https://doi.org/10.5194/egusphere-egu25-18904, 2025.

EGU25-21430 | Orals | BG8.2

Optimizing the revisiting frequency of remotely sensed thermal observations for continuous estimation of ecosystem evapotranspiration and productivity using Bayesian inference 

Arnau Riba Palou, Monica Garcia, Ana M. Tarquis, Cecilio Oyonarte, Francisco Domingo, Jun Liu, Mark S. Johnson, Yeonuk Kim, and Sheng Wang

Understanding the energy, water, and carbon fluxes in dryland ecosystems is essential for maintaining ecosystem functioning and biodiversity. The limited in-situ measurements in drylands pose a significant challenge to the accurate monitoring and modelling of ecosystem dynamics. Satellite remote sensing provides high potential to monitor key surface and carbon variables, such as land surface temperature (LST), evapotranspiration (ET) and gross primary productivity (GPP). Although these data provide valuable insights, their temporal resolution is limited to satellite revisit overpasses, which can limit the continuity of monitoring. To address these gaps, dynamic land surface models serve as effective tools for integrating sparse remote sensing observations with continuous simulations of energy, water, and carbon cycles. The Soil-Vegetation-atmosphere Energy, water, and CO2 traNsfer (SVEN) model exemplifies this approach, offering high temporal resolution simulations that incorporate satellite-based LST and meteorological in-situ inputs. This study focuses on calibrating and validating the model in southeastern Spain, as the only sub-desertic protected area in Europe. Calibration of SVEN was achieved using a combination of MODIS remote sensing data and in-situ LST measurements from an eddy covariance system, ensuring robust parameterization tailored to local field characteristics. Furthermore, the model was validated with in situ measurements, obtained through an eddy covariance tower. The RMSE values for the land surface temperature, latent heat flux, net radiation, sensible heat flux, gross primary productivity, and soil moisture were 1.99 ºC, 25.97 W m-2, 52.71 W m-2, 50.90 W m-2, 1.44 gCm-2s-1 and 1.19 m3m-3, respectively at half-hourly time scale. Normalized root mean square deviations of the simulated values were 7.84%, 10.81%, 5.67%, 7.81%, 13.09% and 6.59%, respectively. Otherwise, it was observed that until 8 days of revisit frequency, the calibration parameters did not affect the model accuracy considerably, increasing the RMSE of variables by 0.42 to 10.53% at the half-hourly time scale. The model’s accuracy across energy, water, and carbon fluxes highlights its potential as a reliable tool for dryland monitoring, offering insights into processes that are critical for ecological management and climate adaptation strategies. By filling the temporal gap between satellite observations, this work demonstrates the value of dynamic models like SVEN in enhancing our understanding of dryland ecosystems and promoting sustainable management practices in water-limited environments. This publication is supported by the EU COST (European Cooperation in Science and Technology) Action CA22136 “Pan-European Network of Green Deal Agriculture and Forestry Earth Observation Science” (PANGEOS).

How to cite: Riba Palou, A., Garcia, M., M. Tarquis, A., Oyonarte, C., Domingo, F., Liu, J., S. Johnson, M., Kim, Y., and Wang, S.: Optimizing the revisiting frequency of remotely sensed thermal observations for continuous estimation of ecosystem evapotranspiration and productivity using Bayesian inference, EGU General Assembly 2025, Vienna, Austria, 27 Apr–2 May 2025, EGU25-21430, https://doi.org/10.5194/egusphere-egu25-21430, 2025.

EGU25-1416 | PICO | BG8.5

Monitoring the ecosystem services provided by a woodland area in North-Eastern Italy for the population’s well-being   

Teodoro Georgiadis, Letizia Cremonini, Massimiliano Fazzini, Francesco Corvaro, and Antonio Ruberto

In countries such as Italy, there is a notable skewing of the population pyramid toward older age groups and individuals with chronic health conditions. This demographic shift is anticipated to result in increased social costs. It would be advantageous to enhance the physiological conditions and socialization opportunities for the elderly, as this may lead to improved overall well-being and reduced healthcare expenditures. It can be reasonably argued that there is a substantial potential for the ecosystem services provided by forest and woodland ecosystems to benefit this particularly vulnerable population. Due to its distinctive territorial configuration, Italy presents many opportunities for implementing restoration policies. A crucial step is to evaluate the actual welfare benefits that natural areas can offer. To this end, an experimental campaign was conducted in the Parma area of northern Italy, which aimed to assess the positive impact of ecosystem services compared to urban environments. This study's results support the notion that policies encouraging the temporary residency of the elderly in forested and wooded areas may facilitate physiological recovery.

This study was conducted and funded by the Project "OptForEU" Grant Agreement number 101060554 European Research Executive Agency (https://optforeu.eu/

How to cite: Georgiadis, T., Cremonini, L., Fazzini, M., Corvaro, F., and Ruberto, A.: Monitoring the ecosystem services provided by a woodland area in North-Eastern Italy for the population’s well-being  , EGU General Assembly 2025, Vienna, Austria, 27 Apr–2 May 2025, EGU25-1416, https://doi.org/10.5194/egusphere-egu25-1416, 2025.

In managing ecosystems, it is important to understand the ‘natural’ regime in an ecosystem (Willis and Birks 2006), wherein what is ‘natural’ means the variation in ecosystem traits and properties as a function of climate variables and disturbance regimes across time. Components of ecosystems may be very dynamic (Brown et al. 2001) and be formed by historical legacies of disturbance regimes (Maezumi et al. 2022). However, modern scientists are unable to understand the underlying dynamism in ecosystems because they only have access to present-day distribution of species and ecosystem traits. Long-term ecological research stations are at best <200 years old and may not be able to provide the necessary length of time in which ecosystem dynamics play out. The problem of understanding what is natural is further compounded in the case of economically important timber species as their present-day distribution may far exceed their natural range due to past efforts in creating and managing plantations of these species. The current distribution of many timber species may not be due to natural dispersal, or natural affinity for the environmental conditions in that area, but due to silvicultural imperative. Using only present-day distribution for understanding species also may under-estimate their tolerance for different environmental conditions. This is particularly true for teak (Tectona grandis) and sal (Shorea robusta), two of the most economically valuable timber species in India. At present, they cover large tracts of India (~40%), but their future persistence and resilience under future climate change scenarios is uncertain. We create a paleo-dataset for Central India that includes climate, species composition and human disturbance across space (15 sites across the region) and time (across the Holocene)(Agarwala and Kulkarni, 2024) and use it to understand long-term factors associated with dispersal and extinction of teak and sal. We create spatially-explicit models for teak and sal dispersal and extinction across space and time, and parameterize these models using greenhouse experiments. We find that Sal occurrence is significantly explained by times of higher temperature and sites with higher precipitation and temperature, while teak occurrence is explained by significantly higher temperature. Role of fire appears weak despite being considered important in modern literature. Using this approach, we are able to successfully model teak and sal expansion and extinction, understand the interaction between climate, disturbance and demography. This approach may be used to create more accurate species distribution models than those using only contemporary distribution data.

Agarwala M, Kulkarni C (2024) Quat Environ Hum 100032. https://doi.org/10.1016/j.qeh.2024.100032
Brown J et al. CA (2001) Science 293:643–649
https://doi/10.1126/science.293.5530.643
Maezumi SY et al. (2022). Philos Trans R Soc B Biol Sci 377:20200499. https://doi.org/10.1098/rstb.2020.0499

How to cite: Agarwala, M. and Kulkarni, C.: Ecology of economically important teak Tectona grandis and sal Shorea robusta informed by palaeo-data, EGU General Assembly 2025, Vienna, Austria, 27 Apr–2 May 2025, EGU25-3106, https://doi.org/10.5194/egusphere-egu25-3106, 2025.

EGU25-3872 | ECS | PICO | BG8.5

The largest European forest carbon stocks are in the Dinaric Alps old-growth forests: comparison of direct measurements and standardised approaches 

Alessia Bono, Giorgio Alberti, Roberta Berretti, Milic Curovic, Vojislav Dukic, and Renzo Motta

Carbon sinks and stocks are among the most important ecosystem services provided by forests in climate change mitigation policies. In this context, old-growth forests represent an essential reference point for the development of close-to-nature silviculture, including carbon management techniques. Despite their small extent in Europe, temperate old-growth forests are assumed to be among the most prominent in terms of biomass and carbon storage. However, monitoring and reporting of their carbon stocks is still poorly understood. To better understand the amount and distribution of carbon stocks in temperate old-growth forests, we estimated the carbon stocks of two old-growth stands in the Dinaric Alps applying different assessment methods, including direct and indirect approaches (e.g., field measurements and allometric equations vs. IPCC standard methods). This paper presents the quantification and the distribution of carbon among the five main forest carbon pools (i.e., aboveground, belowground, deadwood, litter, and soil) in the study areas and the differences between the applied methods.

Our findings show a very prominent C stock in both study areas (507 Mg C ha-1), concentrated in a few large diameter trees (36% of C in 5% of trees in number). Furthermore, we found significant differences between C stock estimation methods, both between direct and indirect approaches, which tended to underestimate or overestimate depending on the pool considered, and within the direct methods.

The comparison of our results with previous studies and data collected in other European old-growth forests highlights the importance of temperate forests, among which the Dinaric Alps old-growth forests are the most prominent. These results provide an important benchmark for the development of future approaches to the management of the European temperate forests.

How to cite: Bono, A., Alberti, G., Berretti, R., Curovic, M., Dukic, V., and Motta, R.: The largest European forest carbon stocks are in the Dinaric Alps old-growth forests: comparison of direct measurements and standardised approaches, EGU General Assembly 2025, Vienna, Austria, 27 Apr–2 May 2025, EGU25-3872, https://doi.org/10.5194/egusphere-egu25-3872, 2025.

EGU25-5061 | PICO | BG8.5

Effect of climate extremes on carbon fluxes, acclimation, and resilience of European forests  

Mana Gharun, Mirco Migliavacca, Elena Vanguelova, Miglena Zhiyanski, and Rossella Guerrieri

Forests are pivotal in global carbon and biogeochemical cycles, covering nearly 40% of Europe's land area and sequestering approximately 290 million tons of CO₂ equivalent annually (as of 2020). However, the strength of this carbon sink is declining, having dropped by roughly one-third between 2010 and 2020 (from 430 to 290 million tons CO₂ equivalent per year, according to the national inventories). This decline threatens the role of European forests in achieving EU climate mitigation targets.

The resilience of forest ecosystems and their ability to mitigate climate change depend on how they respond and acclimate to intensifying climate extremes and disturbances. CLEANFOREST COST Action (CA21138, https://cleanforest.eu/) unites almost 400 participants organized in 4 Working Groups (WG) to develop a comprehensive understanding of the combined impacts of climate extremes and atmospheric deposition on European forests. One of the key objectives of CLEANFOREST is to disentangle the interactions between global change drivers and the responses of tree- and soil-related biogeochemical processes. Specifically, within WG3, we examine the three primary carbon fluxes—gross primary productivity (GPP), ecosystem respiration (Reco), and their balance, net ecosystem productivity (NEP)—that determine the net forest carbon sink. While GPP reflects canopy-level photosynthesis, Reco includes heterotrophic respiration from soil decomposition and autotrophic respiration from vegetation and soil.

In this study, we review the effects of multiple global change drivers—such as droughts, heatwaves, nitrogen deposition, elevated atmospheric CO₂, and understudied extremes like winter warming—on carbon fluxes, acclimation, and resilience of European forests. We synthesize findings on the interacting roles of these drivers and propose a conceptual framework that links biotic and abiotic factors with forest conditions. This framework provides insights into how forests' carbon sink capacity responds to these drivers, offering a foundation for strategies to enhance their resilience and climate mitigation potential.

How to cite: Gharun, M., Migliavacca, M., Vanguelova, E., Zhiyanski, M., and Guerrieri, R.: Effect of climate extremes on carbon fluxes, acclimation, and resilience of European forests , EGU General Assembly 2025, Vienna, Austria, 27 Apr–2 May 2025, EGU25-5061, https://doi.org/10.5194/egusphere-egu25-5061, 2025.

EGU25-7474 | PICO | BG8.5

Simulating Central-European forests in the 21st century – What are the effects of climate change and management? 

Manfred Lexer, Christian Hochauer, Mathias Neumann, Christoph Pucher, and Herbert Formayer

Large-scale scenario analysis to project development of European forest resources and explore the effect of climate change and forest use scenarios is a key requirement for policy making and has attracted much attention recently.

In a recent study we harness the individual-tree based ecosystem model PICUS v1.5 to simulate 20 mill ha forests in five Central European (CE) countries (Germany, Czechia, Slovakia, Austria, Slovenia). In a quasi-spatial frame work we assigned 46 mixture types which had been defined based on the national forest inventory (NFI) data to 8x8 km grid-cells and distribute these mixture types over 1x1km sub-cells considering CORINE landcover types and regional age-class distributions. A gap-filling algorithm had been used to complete the information base for all 5 countries. PICUS includes disturbance modules for spruce bark beetles and wind storms. Current climate and three transient climate change scenarios were prepared for each 1x1km cell. Currently applied management regimes (BAU) had been operationally defined for the mixture types based on reports and interviews with experts from the five countries. BAU includes also a share of not actively managed forests. Five management response options from owner´s perspective were defined, including a no management option. BAU and the response options were then combined in six adaptive management scenarios for the entire CE forest area.

Under conditions of moderate climate change volume stocks can be retained under BAU management. If precipitation decreases, a drastic reduction of growth at lower elevations results, in parallel with a sharp increase of salvage harvests. Stocks decrease due to reduced increment and high tree mortality. Adaptive management is replacing productive coniferous and broad-leaved species by more drought and heat tolerant broadleaves which overall are less productive. The more extreme future climate develops the sooner adaptive management approaches reduce potential losses and stabilize production and stocks and perform better than the currently practiced management would. Non-native species such as Douglas fir improve the net effect of adaptation strategies further.

Beyond selected results we scrutinize currently available means and conclude on useful improvements.

How to cite: Lexer, M., Hochauer, C., Neumann, M., Pucher, C., and Formayer, H.: Simulating Central-European forests in the 21st century – What are the effects of climate change and management?, EGU General Assembly 2025, Vienna, Austria, 27 Apr–2 May 2025, EGU25-7474, https://doi.org/10.5194/egusphere-egu25-7474, 2025.

EGU25-9754 | PICO | BG8.5

Dynamics of Forest Floor, Soil Organic Matter, and Carbon Stock Estimation in Temperate Forests of Romania 

Stefan Petrea, Gheorghe Raul Radu, Nicu Constantin Tudose, Mirabela Marin, Cosmin Ion Braga, Alexandru Zaharia, Alexandru Bogdan Cucu, Tibor Serban, Gruita Ienasoiu, and Stefan Leca

Temperate forests are crucial in global carbon dynamics, acting as significant carbon pools through biomass accumulation and soil organic matter storage. This study investigates the dynamics of the forest floor, soil organic matter, and carbon stock estimation on species type, age and forest management. The research focuses on Romania's temperate forests, on broadleaf, coniferous and mixed stands in the Southern Carpathians. The measurements were conducted across a systematic grid network of 450 plots, each combining two circular plots of 500 m² in size. These plots span an altitudinal gradient from 500 to 1650 meters above sea level (ASL), providing a robust dataset for analyzing carbon dynamics. Our research evaluates the contribution of forest floor components - litter, coarse woody debris and fine roots - to total carbon stocks, alongside soil organic matter dynamics at 30 cm depth. The study also integrates tree biomass data for major species such as beech (Fagus sylvatica L.), silver fir (Abies alba Mill. ), and Norway spruce (Picea abies L.), providing a comprehensive assessment of carbon sequestration potential.
Our preliminary results reveal significant differences in both forest floor weight and bulk density between management types. Plots in conservation areas had a significantly higher mean forest floor weight (21.1 tonnes/ha) than production plots (17.9 tonnes/ha, p < 0.01), while their mean bulk density was significantly lower (0.84 Mg/m³ vs. 0.96 Mg/m³, p < 0.01). These findings, combined with higher forest floor weight in conservation plots, underline the critical role of management strategies on soil carbon storage. The results also highlight the influence of forest type, stand age, and management practices on carbon storage, emphasizing their importance in climate change mitigation and sustainable forest management. This study provides valuable insights for optimizing forest management strategies to enhance carbon sequestration and improve understanding of carbon fluxes in temperate ecosystems. The findings are particularly relevant for aligning forest policies with national and international climate goals.

How to cite: Petrea, S., Radu, G. R., Tudose, N. C., Marin, M., Braga, C. I., Zaharia, A., Cucu, A. B., Serban, T., Ienasoiu, G., and Leca, S.: Dynamics of Forest Floor, Soil Organic Matter, and Carbon Stock Estimation in Temperate Forests of Romania, EGU General Assembly 2025, Vienna, Austria, 27 Apr–2 May 2025, EGU25-9754, https://doi.org/10.5194/egusphere-egu25-9754, 2025.

Facing an uncertain future, European forests are expected to fulfill a range of forest ecosystem services (FES), including timber supply, carbon storage or biodiversity. Using criteria and indicators forest managers can evaluate alternative management options and decision support systems (DSS) help them make decisions considering multiple objectives, trade-offs and complex interrelations of forest structure, management and FES. An important tool to support DSSs are modelling tools, that are capable of estimating future forest development under various climate scenarios and management practices and thus define possible development trajectories of European forests. Here we report on the simulation results in the project “OptFor-EU” using the hybrid forest model PICUS v1.5 for three case study areas in Austria, Italy and Romania. We use six different climate inputs (3 RCPs, 2 Regional climate models) and up to nine management alternatives in simulations until year 2099. The initial stand structure was derived using forest inventory data. Validating our results with remote sensing based primary production and leaf area index data, reveals general good agreement, if we consider differences in stand age and stand density. We derive selected indicators from a preliminary set of Essential Forest Mitigation Indicators (EFMI) to evaluate our simulations. Forest carbon, one of the most important regulatory FES, was more sensitive to forest management alternatives than to climate input. Deadwood volume, important not just as carbon storage and water retention, but also habitat to saproxylic organisms, increased under a “no harvesting” management alternative, which may become more frequent in the European Union under the new Nature Restoration law. Other indicators such as multi-layeredness, number of species and the Gini index show an opposite trend over the simulation period. The starting conditions (initial forest structure) overlay the effects of forest management and need prudent consideration, when incorporating simulation results into a DSS, as the outcomes of forest management varies depending on which development phase a forest of interest currently is. We conclude that current simulations using PICUS v1.5 in OptForEU are promising, but further model comparisons are needed to use model outputs for upscaling impacts of climate and management scenarios on a landscape scale.


References

Langner, A., Irauschek, F., Perez, S., Pardos, M., Zlatanov, T., Öhman, K., Nordström, E.-M., Lexer, M.J., 2017. Value-based ecosystem service trade-offs in multi-objective management in European mountain forests. Ecosystem Services 26, 245–257. https://doi.org/10.1016/j.ecoser.2017.03.001.

Irauschek, F., Rammer, W., Lexer, M.J., 2017. Evaluating multifunctionality and adaptive capacity of mountain forest management alternatives under climate change in the Eastern Alps. Eur J Forest Res 136, 1051–1069. https://doi.org/10.1007/s10342-017-1051-6.

How to cite: Pichler, J. and Neumann, M.: Sensitivity of forest model simulations to initial stand conditions, climate and management scenarios based on a novel indicator set, EGU General Assembly 2025, Vienna, Austria, 27 Apr–2 May 2025, EGU25-10027, https://doi.org/10.5194/egusphere-egu25-10027, 2025.

EGU25-10435 | ECS | PICO | BG8.5

Collaborative Dynamics at the Forest–Climate Nexus: Merging Practice with Science 

Mihai-Ionut Hapa, Alice Ludvig, Cezar Ungurean, Eglė Baltranaitė, Elisabeth Gotschi, Florian Knutzen, Francesca Giannetti, Hermine Mitter, Ilaria Zorzi, Jasdeep Anand, Letizia Cremonini, Mar Riera-Spiegelhalder, Marius Rohde Johannessen, Mathias Neumann, Mirabela Marin, Nicu Tudose, Raul Radu, Serban Davidescu, Sorin Cheval, and Teodoro Georgiadis

The forest-climate nexus highlights the challenges and the opportunities for change within communities resulting from the multifaceted relationships that arise over time and in specific geographic contexts. The relationships between society, forest and climate are essential for transformation, leveraging the understanding of ecological and physical processes which are strongly correlated to forest management and governance. In forestry, global discussions have polarized the discourse on climate change mitigation and adaptation. However, societal needs emerging from conflicts at the forefront of forest-climate nexus have shown the crucial role of human and local dimensions which is not surprisingly, mediated by international framing of events. To shed the light on the importance of collaboration, science-practice interactions contribute to climate change mitigation and adaptation, often through knowledge transfer under the form of dialogue, engaging communities in contributing to a better knowledge base for practical decision-making. Developing forest management policies as well as forest-wood chain towards sustainability requires a high level of cooperation between stakeholders including forest owners, wood industries, public authority and local communities as recipients of a diversity of forest services. 

This study provides insights on forest practitioners and their forest management plans across Europe in relation to climate change. It facilitates knowledge transfer among different types of actors across different European forest ecosystems and their species composition but also provides an overview of the stakeholder’s knowledge regarding climate change impacts, the adaptation measures they have implemented, and the challenges they face in mitigating climate change. 

The methodological approach is based on empirical social science research methods with an emphasis on a bottom-up approach which was carried out through 56 semi-structured face-to-face interviews performed in 8 case study areas (CSA) in Europe (Italy, Spain, Romania, Austria, Germany, UK, Lithuania, Norway) with relevant stakeholders. This was complemented by primary and secondary document analysis of forest management practices, selected upon criteria including ecosystem services. Under the forest-climate nexus, stakeholders from all CSAs have reported an increase in climatic parameters such as  extreme weather events like strong wind-storms and wind throws. This was complemented by the perceived climate change impact on forests, especially the expansion of the growing season and increased pest activity. This is the case of more bark beetle flights which have been the most seen impact on forests with a negative sentiment of on-going increment of the warming trend, but also regarding the demand for firewood due to warmer winters. Adaptation measures have prioritized natural regeneration and maintaining continuous forest cover while avoiding gaps. However, challenges and barriers in implementation hinders transition to more adapted species and lower production cycles, increasing the uncertainty of climate change related impacts. The analysis suggests a need for more flexible and supportive policies, as well as financial incentives, to enable forest managers to effectively adapt to the changing climate and its medium to long term impact, a conclusion which validates that collaboration through knowledge transfer addresses existing on-ground problems and should be used more.

How to cite: Hapa, M.-I., Ludvig, A., Ungurean, C., Baltranaitė, E., Gotschi, E., Knutzen, F., Giannetti, F., Mitter, H., Zorzi, I., Anand, J., Cremonini, L., Riera-Spiegelhalder, M., Johannessen, M. R., Neumann, M., Marin, M., Tudose, N., Radu, R., Davidescu, S., Cheval, S., and Georgiadis, T.: Collaborative Dynamics at the Forest–Climate Nexus: Merging Practice with Science, EGU General Assembly 2025, Vienna, Austria, 27 Apr–2 May 2025, EGU25-10435, https://doi.org/10.5194/egusphere-egu25-10435, 2025.

EGU25-10860 | PICO | BG8.5

 Assessing forest management practices across Europe under climate scenarios: insights from the 3D–CMCC–FEM model in the OptFor–EU Project 

Mauro Morichetti, Daniela Dalmonech, Elisa Grieco, Elia Vangi, and Alessio Collalti

Forest modeling is essential for understanding ecosystem dynamics, evaluating future scenarios, and supporting informed decision–making, mainly given the long–life cycles of trees. Within the 4–year project (2023–2027) “OPTimising FORest management decisions for a low–carbon, climate–resilient future in Europe” (OptFor–EU), several model types, including forest, climate, and land surface vegetation models, are used to simulate forest dynamics under climate scenarios. A primary project effort includes developing and testing new Forest Management Practices (FMPs), building on widely used management practices such as clearcut, shelterwood, and continuous forest cover using single tree harvesting. These FMPs are crucial for generating accurate forest future representation, as most European forests undergo active management (State of Europe’s forests, 2020).

The 3D–CMCC–FEM model plays a central role in the OptFor–EU project. It is a process–based model simulating forest eco–physiological, and biogeochemical processes, developed to simulate different forest management scenarios. It accounts for species differences, age classes, and tree dimensions, modeling carbon and water cycles on a daily basis at a hectare scale (Collalti et al., 2014, 2018, 2024; Dalmonech et al., 2022). It has been widely applied in European forests, making it perfectly fitting for OptFor–EU purposes (i.e., Collalti et al., 2016; Marconi et al., 2017; Morichetti et al., 2024; Vangi et al., 2024a).

The simulations focus on three case study areas: Austria, Romania, and Italy, representing alpine, temperate, and Mediterranean ecosystems, respectively. Climate data from the EURO–CORDEX regional models HIRHAM5 and RACMO22E, aligned with CMIP5 scenarios (RCP2.6, 4.5, and 8.5), are used to drive the simulations (Jacob et al., 2020). Forest stands are grouped by species composition and 20–year age classes to ensure heterogeneity. Simulations target a minimum of 50 plots per European Forest Type (EFT), ensuring statistical robustness.

Different FMPs are tested under the same climate conditions to isolate the impacts of management on forest carbon stocks. For instance, considering the EFT 6 (Fagus sylvatica L.), for AC1 (i.e., Age Class 0–20), NOMAN results in the highest biomass carbon stocks in the end of simulation (250 tC ha¹) due to the absence of harvesting. Shelterwood management (BAU), involving periodic thinnings and final harvesting, achieves near–NOMAN carbon levels. Variants like BAU+ (increased thinning) target larger products, whereas BAU (reduced thinning) promotes denser forests with higher carbon stocks. Continuous cover systems apply single–tree harvesting every decade, fostering uneven–aged stands. These methods sustain carbon stocks between 100–200 tC ha¹. In contrast, low–intensity harvesting (5 m3 ha¹ per year), suitable for protecting forests prone to disturbances, leads to moderate carbon storage trends.

This comparative approach provides valuable insights for decision–makers, enabling the development of tailored forest management strategies that consider ecological and climatic contexts. By integrating diverse FMPs and climate scenarios, OptFor–EU supports sustainable forest management for a low–carbon, and climate–resilient future in Europe.

How to cite: Morichetti, M., Dalmonech, D., Grieco, E., Vangi, E., and Collalti, A.:  Assessing forest management practices across Europe under climate scenarios: insights from the 3D–CMCC–FEM model in the OptFor–EU Project, EGU General Assembly 2025, Vienna, Austria, 27 Apr–2 May 2025, EGU25-10860, https://doi.org/10.5194/egusphere-egu25-10860, 2025.

EGU25-11365 | ECS | PICO | BG8.5

Natural tree colonisation of organo-mineral soils does not provide a net carbon capture benefit at decadal timescales 

Naomi Housego, Thomas Parker, Lorna Street, Elena Vanguelova, and Ruth Mitchell

Tree cover is often increased with the aim of increasing ecosystem carbon sequestration and mitigating climate change. However, when planting trees in ecosystems with carbon-rich soils, soil disturbance during ground preparation can cause soil carbon losses not counteracted by tree carbon gains at the decadal timescales relevant to climate change mitigation targets. Tree establishment via natural colonisation, which does not involve soil disturbance, might prevent these soil carbon losses, but this is unknown.

We measured soil, ground vegetation, and tree carbon stocks, as well as tree inputs, soil physicochemical properties, and soil community composition along an 8 metre transect from single, native, 25-year-old naturally colonised trees (Pinus sylvestris or Betula spp.) onto Calluna vulgaris-dominated moorland, at sites with carbon-rich organo-mineral soils in the Cairngorms, UK.

Along the transect away from the tree, organic soil carbon stocks increased from 4.0 kg C m-2 at 0.5 metres, to 6.0 kg C m-2 at 8 metres. Increased soil carbon stocks along the transect was associated with increased soil moisture and decreased carbon-to-nitrogen and carbon-to-phosphorus ratios, and changes to the soil bacterial and fungal community compositions. Meanwhile, carbon stocks in the top 10 cm of the mineral soil horizon, 3.6 kg C m-2, did not vary. Ground vegetation carbon stocks increased only slightly, from 1.0 kg C m-2 at 0.5 metres, to 1.3 kg C m-2 at 8 metres. Mean carbon stock per tree was 32.4 kg, so overall, sparse natural colonisation resulted in no net ecosystem carbon gain after 25 years.

However, trees might be established onto carbon-rich soils for a range of other ecosystem services, in addition to or instead of carbon storage benefits, such as biodiversity benefits, flood alleviation, water purification, and recreation. The trade-offs between soil carbon losses and these other benefits should be considered, and given that belowground carbon losses are offset by aboveground tree carbon gains, sparse natural tree colonisation could provide a mechanism for tree establishment whereby there is no net ecosystem carbon loss or gain on a decadal timescale, but other ecosystem services are increased.

How to cite: Housego, N., Parker, T., Street, L., Vanguelova, E., and Mitchell, R.: Natural tree colonisation of organo-mineral soils does not provide a net carbon capture benefit at decadal timescales, EGU General Assembly 2025, Vienna, Austria, 27 Apr–2 May 2025, EGU25-11365, https://doi.org/10.5194/egusphere-egu25-11365, 2025.

EGU25-11709 | PICO | BG8.5

FoResLab - Future Lab towards Forests Resilient to Climate Change 

Alexander Knohl, Simon Drollinger, Christian Ammer, Matthias Beyer, Harald Biester, Henrik Hartmann, Ann-Kathrin Koessler, Paul Magdon, Kaniska Mallick, Carola Paul, Sandra Potsch, Dominik Seidel, Ulrike Talkner, and Miriam Teuscher

Climate change directly affects forests in Central Europe challenging the way how they are managed under current and future conditions. As forests provide essential ecosystem functions and services to society, such as carbon uptake and storage, urgent solutions are needed to enhance their resilience to climate change. To meet this challenge and address the question of how we can make forests resilient to climate change now and in the future, we have established a new platform in Lower Saxony/Germany through the FoResLab project. A highly interdisciplinary and transdisciplinary approach was chosen to bring together experts from multiple institutions and practise partners ensuring close collaboration between science, the private sector, and civil society.

Organised into three platforms and 13 subprojects, FoResLab will pursue innovative ways of inter- and transdisciplinary research, science communication, and knowledge transfer. In the Experimental Platform, we will investigate relevant ecosystem functions and services using a harmonised experimental design and near-real-time sensor technology at six highly instrumented forest sites using eddy covariance, dendrometer, sapflux, and laser scan measurements. This will enable us to derive multi-functional indicators of forest resilience to climate change. The Experimental Platform will also serve to test and validate the Digital Platform, where airborne and spaceborne remote sensing, along with modelling approaches, will provide two online products available to stakeholders and the public: (1) Digital Twins of our experimental sites will enable the exploration of management options for real-world forests in a digital environment, and (2) an Online Forest Water Stress Monitor will provide high spatio-temporal resolution for near real-time forest monitoring in Lower Saxony and beyond. The Societal Platform will foster transdisciplinary research, stimulate synthesis publications, and ensure comprehensive stakeholder involvement. Through Göttingen’s new knowledge museum, Forum Wissen, we will explore novel ways in digital education, public events, and science communication, thus connecting science, politics, and society. Through its research, stakeholder and society involvement, as well as academic and non-academic knowledge transfer, FoResLab aims to provide a fundamental step towards forests resilient to climate change.

How to cite: Knohl, A., Drollinger, S., Ammer, C., Beyer, M., Biester, H., Hartmann, H., Koessler, A.-K., Magdon, P., Mallick, K., Paul, C., Potsch, S., Seidel, D., Talkner, U., and Teuscher, M.: FoResLab - Future Lab towards Forests Resilient to Climate Change, EGU General Assembly 2025, Vienna, Austria, 27 Apr–2 May 2025, EGU25-11709, https://doi.org/10.5194/egusphere-egu25-11709, 2025.

EGU25-12378 | PICO | BG8.5

Navigating the Policy Mix: Institutional Frameworks and Governance Mechanisms for climate-resilient forests in Europe 

Alice Ludvig, Sorin Cheval, Letizia Cremonini, Teodoro Georgiadis, Francesca Giannetti, Elisabeth Gotschi, Mihai Hapa, Indriany Lionggo, Mirabela Marin, Hermine Mitter, Mathias Neumann, Romulus Oprica, Mar Riera-Spiegelhalder, Nicu Tudose, Gerhard Weiss, Ilaria Zorzi, and Katharina de Melo

So far, policy mixes have been presented in scholarly literature as viable solutions for addressing complex problems. However, there has been a lack of empirical investigation to date, and even more so in the nature-based sectors that simultaneously advocate for the protection of forests and the production of wood. This is not surprising, as policy mixes include inputs, administrative processes and outputs of all kinds of individual programs and instruments included in such a mix, which appears messy to evaluate. The research explores the empirical reality of European-wide perceptions of institutional factors that aim to regulate climate adaptation, mitigation, restoration, protection, and wood production for both energetic and material uses. In order to investigate how the policy mix can be navigated, we focus methodologically on the perspectives of a selected target group of forestry stakeholders across regional case studies and European as well as global forestry related organizations.

By conducting a survey with 168 stakeholders, some additional expert interviews and a policy mapping, our results reveal how stakeholders perceive the "policy mix" in terms of institutional frameworks and their fostering and hindering elements. In the discussion section, we identify and analyze the categories of this policy mix.

Our conclusions indicate that the current bundle of policies is not well-coordinated and is challenging to manage due to sectoral differences. The policy mix suffers from trade-offs and soft coordination. Additionally, we examine aspects that work well, drawing insights from the surveys open questions and qualitative insights from the selected case studies.

To summarize, our research highlights the importance of institutional frameworks and governance mechanisms in supporting effective forest management. We identify key hindering and supporting factors, assess institutional gaps, and analyze policy barriers that impact the implementation of forest-based mitigation strategies. We contribute to discussions on contradicting socio-economic aspects of these strategies and provides recommendations for multi-level governance solutions.

How to cite: Ludvig, A., Cheval, S., Cremonini, L., Georgiadis, T., Giannetti, F., Gotschi, E., Hapa, M., Lionggo, I., Marin, M., Mitter, H., Neumann, M., Oprica, R., Riera-Spiegelhalder, M., Tudose, N., Weiss, G., Zorzi, I., and de Melo, K.: Navigating the Policy Mix: Institutional Frameworks and Governance Mechanisms for climate-resilient forests in Europe, EGU General Assembly 2025, Vienna, Austria, 27 Apr–2 May 2025, EGU25-12378, https://doi.org/10.5194/egusphere-egu25-12378, 2025.

The OptFor-EU Horizon Europe project seeks to develop a Decision Support System (DSS) that provides science-based guidance for optimizing Forest Ecosystem Services (FES) across Europe, with a focus on decarbonization and resilience in response to climate change. A cornerstone of this effort is the development of a novel set of Essential Forest Mitigation Indicators (EFMI) designed to guide forest managers in assessing and enhancing forests' carbon mitigation potential through targeted management practices in eight European case study areas but also scalable for application in other regions.

The development of the EFMI set within the OptFor-EU project is a beneficial support for forest management and climate mitigation practices. This work is innovative on multiple fronts, combining methodological novelty, practical applicability, and technological integration to address previously unfulfilled needs for evidence-based visualization and decision support in forest management.

The EFMI were developed using a participatory, bottom-up approach to ensure their relevance, feasibility, and applicability for stakeholders. Rooted in the Common International Classification of Ecosystem Services (CICES) framework, the indicators emphasize carbon storage, sequestration, and the broader impacts of forest management practices (FMPs) on decarbonization, forest resilience, and old-growth characteristics. The EFMI also incorporate indicators for regional climate regulation, enabling quantification of the effects of forest cover changes on local and regional climates.

The process to define the EFMI began with an extensive review of existing literature and indicator sets, identifying 130 potential indicators. Through internal evaluation and participatory external stakeholder involvement, this list was refined to a set of 22 essential indicators. These are supported by publicly accessible data derived from advanced forest and climate modeling, satellite data, and extensive data mining. Ongoing regional forest and climate modeling experiments will further enable the simulation of FMP impacts on climate conditions and calculation of relevant EFMI.

As the project advances, the EFMI set will be integrated into the DSS, tested across case study areas, and scaled from local to European level. By focusing on this stakeholder-driven set of indicators, the OptFor-EU project ensures its outcomes directly support forest managers in aligning forest management practices with European climate and forest policy goals, while enhancing the long-term sustainability and resilience of forest ecosystem services. The EFMI serve as a innovative, feasible tool for translating policy into actionable, evidence-based forest management strategies.

This study was funded by the Horizon Europe Project OptFor-EU (Grant agreement n°101060554).

How to cite: Linser, S. and the OptFor-EU project partners: Essential Forest Mitigation Indicators: A participatory, stakeholder-driven approach to guide carbon mitigation through forest management practices in Europe with application in a decision support system, EGU General Assembly 2025, Vienna, Austria, 27 Apr–2 May 2025, EGU25-13658, https://doi.org/10.5194/egusphere-egu25-13658, 2025.

EGU25-17238 | PICO | BG8.5

Optimizing Forest Management for Decarbonisation and Climate Resilience in Europe 

Sorin Cheval and Fulvio di Fulvio and the OptFor-EU and ForestNavigator

Forests play a critical role in mitigating climate change by acting as carbon sinks and offsetting anthropogenic CO2 emissions. However, their ability to sequester carbon is being threatened by factors such as increased demand for wood, natural disturbances, and forest maturity. To address these challenges, the OptFor-EU and ForestNavigator Horizon Europe projects aim to support sustainable forest management practices that enhance carbon sequestration, resilience, and ecosystem services (FES).

The OptFor-EU project focuses on developing a Decision Support System (DSS) tailored to European forests. This system is co-designed with forest managers and stakeholders to provide scientifically-informed strategies for optimizing forest management practices (FMP) across various European forest types. The DSS integrates data from observations, remote sensing, and modeling to assess the current state and future projections of FES. It is tested in eight case study areas and designed to scale across Europe. Key objectives include: (i) Improving the characterization of FES, particularly carbon stocks and sinks, with a focus on old-growth forests; (ii) Enhancing models to simulate the impacts of FMP, socio-economic factors, and climate scenarios on forests and their services; (iii) Providing tools that empower stakeholders to implement sustainable FMP, fostering carbon sequestration and forest resilience.

The ForestNavigator project complements these efforts by assessing the climate mitigation potential of European forests and forest-based sectors. It uses advanced modeling tools and near-real-time monitoring to evaluate the impacts of policy pathways on forest ecosystems and socioeconomic systems. The project aligns with the Land Use, Land-Use Change, and Forestry (LULUCF) reporting standards and provides policy makers with actionable insights to guide forest policy and bioeconomy strategies. Its scope includes: (i) Zooming into selected EU Member States for detailed assessments while considering global drivers and leakage effects; (ii) Developing a Policy Modelling Toolbox to address climate change impacts and support climate action; (iii) Enhancing the alignment between EU and national climate goals.

Together, these projects bridge robust science, strategic priorities, and stakeholder needs, aiming to reduce greenhouse gas emissions, promote the sustainable use of forest resources, and integrate ecological, economic, and societal values at the European scale. By leveraging innovative tools and fostering collaboration, OptFor-EU and ForestNavigator aim to transform forest management practices, ensuring that European forests continue to play a central role in achieving climate neutrality by 2050.

This research received funds from the projects ‘OPTimising FORest management decisions for a low-carbon, climate resilient future in Europe (OptFor-EU)’, under Grant agreement ID: 101060554, and ‘Navigating European Forests and forest bioeconomy sustainably to EU climate neutrality (ForestNavigator)’, under Grant agreement ID: 101056875, funded by the European Union Horizon Europe Programme.

How to cite: Cheval, S. and di Fulvio, F. and the OptFor-EU and ForestNavigator: Optimizing Forest Management for Decarbonisation and Climate Resilience in Europe, EGU General Assembly 2025, Vienna, Austria, 27 Apr–2 May 2025, EGU25-17238, https://doi.org/10.5194/egusphere-egu25-17238, 2025.

Productivity and survival of forest ecosystems, including planted forests, are at great risk from the predicted hotter and drier climate in southern Australia. Pinus radiata plantations are an important economic component in the forestry sector and extensive across southern Australia. Current management practices and stocking densities might not comply with future available resources and thus, better understanding is needed of how to maintain plantation productivity with decreasing water availability and concurrently ensure the water supply for local communities.

In this study rigorous plot-scale water use (transpiration) and soil moisture observations with variable plant available water (PAW) measurements across variable stocking densities and along a natural gradient of soil depth and microclimate within a topographically complex catchment area is used to of water use, productivity and management and to quantify interactions and improve understanding between spatially varying water stores, stand water use and growth dynamics. This will allow to parameterise a forest growth model to optimise stand density and productivity-water use dynamics under varying fertilisation responses and water availability to ensure productivity. In combination with catchment-scale climate and streamflow, upscaling of plot-level hydrological observations, the impact of plantation water use on the local water resource availability is explored that can inform future land use decisions.

How to cite: Hinko-Najera, N. and Lane, P.: Plantation productivity and water use dynamics across a topographically complex catchment area with varying water availability, EGU General Assembly 2025, Vienna, Austria, 27 Apr–2 May 2025, EGU25-19767, https://doi.org/10.5194/egusphere-egu25-19767, 2025.

EGU25-21678 | PICO | BG8.5

Supporting the management of pest and pathogen risks to trees across Europe 

Steffi Urhausen, Mathias Neumann, and Deborah Hemming

Tree pests and pathogens have been increasing in number and range across Europe in recent decades due largely to the growth in trade and travel which has facilitated spread, and to climate change, particularly warming, which has expanded the areas where climate is suitable for pest/pathogen survival and colonisation. Widespread impacts of pests and pathogens on forest species, biodiversity and ecosystem services (e.g. wood production, recreation) have been observed and the resilience of many forests to climate change and extreme weather/climate events is threatened.   

The OptFor-EU project (https://optforeu.eu/about/) is working with forest managers and other forest stakeholders to provide suitable climate adaptation and mitigation options for science-based optimising of forest ecosystem services, enhancing forest resilience and capacity to mitigate climate change across Europe. Within OptFor-EU we study the influence of climate variability and change on high priority tree/forest pests or pathogens and work with local forest managers to provide science and services that support the management of these risks and build future forest resilience. 

Here, we present a brief overview of current pest and pathogen risks to trees and forests across Europe and show how our work in OptFor-EU will support the management of these risks into the future.

How to cite: Urhausen, S., Neumann, M., and Hemming, D.: Supporting the management of pest and pathogen risks to trees across Europe, EGU General Assembly 2025, Vienna, Austria, 27 Apr–2 May 2025, EGU25-21678, https://doi.org/10.5194/egusphere-egu25-21678, 2025.

EGU25-776 | ECS | Posters on site | BG8.6

Towards Disentangling Environmental Costs of India's Agricultural Trade Network 

Shekhar Goyal, Raviraj Dave, Udit Bhatia, and Rohini Kumar


India faces a critical challenge in balancing its rising food demand with environmental sustainability. While the nation has achieved agricultural self-sufficiency, the environmental costs of production are escalating, with severe implications for soil, air, and water quality. The increasing reliance on interstate trade to meet growing consumption has further intensified the environmental burden on key agricultural regions. We herein investigate the environmental footprint of India's interstate agricultural trade network by analyzing the gross within-India trade network for cereal crops and disentangle underlying drivers resulting in environmental impacts. Using a recently developed pan-India nutrients data over the last decades, we found that excess nutrient pollution pressures are disproportionately concentrated in major production hubs such as north Indian food-bowl states like Punjab and Haryana, which simultaneously bear the brunt of air pollution (e.g., increased PM2.5 emissions) from agricultural residue burning and soil and water pollution from excess nutrient flows. Along with facing increasing mounting pressure of declining key (ground) water resources,  these regions, though pivotal to national food security, face mounting environmental degradation that threatens their long-term integrity and viability. For example, at the current trend, trade-related burdens in these regions would demand over 350 billion cubic meters of (gray)water annually to maintain groundwater-related nutrient levels within safe limits.  Our analysis highlights the challenging aspects of internal trade, which is undoubtedly a critical yet largely overlooked factor in developing effective regional air and water quality management strategies for India. We further present viable strategies based on nutrient-focused restructuring of India’s agricultural system, offering significant socio-environmental benefits by reducing nitrogen surplus by 16–24%, water use by 20–40%, and greenhouse gas emissions by 28% (113 Mt CO₂ eq), while enhancing farmer incomes and calorie production. Overall our  research underscores the necessity for regional cooperation and targeted interventions to mitigate the environmental costs of agricultural trade while ensuring sustainable food security for India's growing population.


How to cite: Goyal, S., Dave, R., Bhatia, U., and Kumar, R.: Towards Disentangling Environmental Costs of India's Agricultural Trade Network, EGU General Assembly 2025, Vienna, Austria, 27 Apr–2 May 2025, EGU25-776, https://doi.org/10.5194/egusphere-egu25-776, 2025.

EGU25-1645 | Posters on site | BG8.6

Agroecology Switzerland: Sustainable from farm to fork 

Anina Gilgen and Nicole Togni

The Swiss agricultural system still faces challenges in becoming sustainable. For example, most environmental targets have not been met, farm incomes are still low compared to other Swiss salaries, and the workload of many farmers is above average. The concept of agroecology tries to transform both the agroecosystem and the food system to become more sustainable. In this project, we are trying to put the concept of agroecology into practice with 40 selected farms and several hundred consumers. The farms can choose from a range of measures to become more agroecological. Their performance will be assessed using a wide range of indicators, such as greenhouse gas emissions, soil structure, income, or workload. The environmental performance of the farms will be rewarded with results-based payments. Each farm will be linked to a number of consumers, who will visit the farm on a regular basis. Consumers will take measures to reduce the environmental impact of their diet, reduce food waste, and eat healthier. The project only started in July 2024. So far, the farms have been recruited and initial data collection has been carried out.

How to cite: Gilgen, A. and Togni, N.: Agroecology Switzerland: Sustainable from farm to fork, EGU General Assembly 2025, Vienna, Austria, 27 Apr–2 May 2025, EGU25-1645, https://doi.org/10.5194/egusphere-egu25-1645, 2025.

EGU25-1696 | Orals | BG8.6

Impact of climate change on wildbeesand pollination service 

Sibylle Stöckli

Within the NCCS programme «Decision Support for Dealing with Climate Change in Switzerland» (NCCS-Impacts) actionable climate services for the environment, economy and society will be developed from 2023 to 2026. The aim of the project «Impacts of climate change on ecosystem services in Switzerland» is to describe the projected changes in ecosystem services and functions caused by climate change for the forest, agriculture and aquatic ecosystems.

As part of this broader initiative the EGU presentation will focus on the impact of climate change on wild-bees and pollination service in Switzerland up to 2074 as one of the most important ecosystem services and additionally related to other ecosystem services such as agricultural production. We will demonstrate how we model a high-resolution index of pollination service using a hierarchical framework at local scale considering species occurrence data from species distribution models, habitat indices related to floral resources and nesting habitat, pollination relevant species traits and pollination dependent crops. For future ESS projections we use the CH2018 climate scenarios that are based on socioeconomic mitigation pathways. Wild-bee monitoring data from the Agricultural species and habitats’ monitoring programme in Switzerland is used to validate the pollination service index. Preliminary results show that the impact of climate change on pollination service is strongly influenced by the pollination dependent crop, the region and pollination relevant species traits.


How to cite: Stöckli, S.: Impact of climate change on wildbeesand pollination service, EGU General Assembly 2025, Vienna, Austria, 27 Apr–2 May 2025, EGU25-1696, https://doi.org/10.5194/egusphere-egu25-1696, 2025.

EGU25-2526 | ECS | Orals | BG8.6

How far are food systems from sustainability? 

Marcellin Guilbert, Carole Dalin, Silvia Ceausu, Peiyu Cao, and Marta Tuninetti

The global food system, whose role is to nourish humanity, has significant environmental impacts. Through greenhouse gas emissions, disruption of the nitrogen cycle, depletion of water resources and biodiversity degradation, it is not only the health of the Earth System but also food production itself that are threatened when sustainability thresholds are crossed. Without action, due to projected population growth and dietary changes, this situation can only worsen. It is therefore essential to implement profound changes, which require assessing the sustainability of the food system on a global scale and at high spatial resolution to take into account the different pratices and local conditions.

We assess the various footprints of the food system (GHG emissions, water, nitrogen, biodiversity) on a global scale, at high resolution (5’ arcmin i.e 10 km at the Equator), and specifically for 25 crops in 2000 and 2020. Then, by comparing these footprints to various local or regional limits, we similarly evaluate the sustainability of the food system. The comparison between 2000 and 2020 allows us to track the temporal evolution of the sustainability of crop production. This assessment highlights regions where multiple limits are exceeded and whether the situation is worsening, indicating production systems that are particularly unsustainable.

Such study considering multiple environmental dimensions at high resolution paves the way for analyzing synergies and trade-offs to bring the global food system back within environmentally sustainable boundaries.

How to cite: Guilbert, M., Dalin, C., Ceausu, S., Cao, P., and Tuninetti, M.: How far are food systems from sustainability?, EGU General Assembly 2025, Vienna, Austria, 27 Apr–2 May 2025, EGU25-2526, https://doi.org/10.5194/egusphere-egu25-2526, 2025.

EGU25-4304 | ECS | Orals | BG8.6

Assessing agricultural multifunctionality from parcel to national scale: a quantitative framework for sustainable agriculture 

Kristine Valujeva, Una Diana Veipane, and Aleksejs Nipers

The transition to sustainable food systems requires a comprehensive understanding of how agricultural land use impacts climate change and biodiversity. Land resources face increasing demands due to agricultural expansion driven by population growth and the need for food security. However, agriculture is a significant contributor to greenhouse gas emissions, particularly from livestock and soil management, posing challenges to achieving climate neutrality. At the same time, agricultural practices influence habitat quality, playing a pivotal role in biodiversity conservation.

Sustainable land management strategies are essential to balance these competing demands. Our study assesses the multifunctionality of agricultural land by evaluating its economic, social, climatic, and biodiversity contributions through a comprehensive framework that integrates quantitative indicators across these dimensions. We analyse economic, social and climate and habitat quality across different farming systems and land use scenarios at parcel level. The analysis highlights opportunities to improve farming sustainability through practices such as afforestation of organic soils, precision farming, and the adoption of diverse cropping systems.

By providing a detailed comparison of agricultural land use at the parcel level, our approach supports policymakers and stakeholders in designing strategies that optimise agricultural productivity while mitigating climate impacts and preserving biodiversity at the national level. This methodology fosters balanced decision-making, ensuring that agricultural land management aligns with climate goals, supports biodiversity, and sustains rural livelihoods.

How to cite: Valujeva, K., Veipane, U. D., and Nipers, A.: Assessing agricultural multifunctionality from parcel to national scale: a quantitative framework for sustainable agriculture, EGU General Assembly 2025, Vienna, Austria, 27 Apr–2 May 2025, EGU25-4304, https://doi.org/10.5194/egusphere-egu25-4304, 2025.

EGU25-5654 | Orals | BG8.6

Bringing together measurements and data science for better nitrous oxide emission accounting in data-poor regions 

Eliza Harris, Matti Barthel, Sonja Leitner, Turry Ouma, Phillip Agredazywczuk, Abigael Otinga, Ruth Njoroge, Collins Oduor, Kevin Churchil Oluoch, and Johan Six

Nitrous oxide (N2O) is a potent greenhouse gas emitted during soil nitrogen cycling. Excess nitrogen fertilization leads to increased N2O emissions, which is a waste of applied nitrogen. Optimized nitrogen fertilizer management (4R nutrient management:  right product, right rate, right time, right method/place)  can enhance nitrogen use efficiency and reduce N2O emissions without reducing crop yields, mitigating the climate impact of agriculture. This is particularly relevant in developing regions like sub-Saharan Africa where fertilizer use is expected to increase over coming decades. Effective fertilizer management offers multiple benefits: Boosting food security while safeguarding the environment and minimizing input costs for farmers.

Quantifying N2O emissions at the field and farm level is challenging. Therefore, N2O is often not included in agroecosystem assessments, which may focus on variables such as the CO2 budget or soil carbon balance. Typical methods to quantify N2O fluxes – such as automated chamber measurements and eddy covariance – are expensive and require advanced knowledge and infrastructure. Moreover, N2O emissions are highly heterogeneous in space and time, thus many measurements are needed to quantify emissions. Novel measurements, models and machine learning can be used in combination with existing techniques to understand drivers, increase spatial coverage, and extrapolate to new locations.

Measurement innovations focusing on low-cost sensing of N2O will provide much needed data in remote and developing regions. Low-cost sensing is particularly suited in direct soil gas measurements, where N2O concentrations and variability are much higher than in free air. Specialised algorithms are needed to estimate fluxes based on soil gas measurements. Machine learning and process modelling approaches can furthermore be used to understand drivers and create simple simulations of N2O emissions, to extrapolate in space and time based on existing (sparse) measurements. These approaches can also leverage proxies, such as isotopic composition, to estimate emissions. Measurement campaigns in data-poor regions should prioritise calibration, collection of ancillary data (such as soil moisture, temperature and nitrogen content), robust metadata reporting, and open data sharing, to maximise the impact of measurements and facilitate data-driven analyses. Development of these tools and approaches will allow N2O emissions to be estimated for different sites and scenarios, opening the way for simple emission accounting and the inclusion of N2O in agroecosystem assessments.

How to cite: Harris, E., Barthel, M., Leitner, S., Ouma, T., Agredazywczuk, P., Otinga, A., Njoroge, R., Oduor, C., Oluoch, K. C., and Six, J.: Bringing together measurements and data science for better nitrous oxide emission accounting in data-poor regions, EGU General Assembly 2025, Vienna, Austria, 27 Apr–2 May 2025, EGU25-5654, https://doi.org/10.5194/egusphere-egu25-5654, 2025.

EGU25-12741 | ECS | Posters on site | BG8.6

Understanding farmers’ perspectives and barriers to adopting alternate wetting and drying (AWD) in Thai rice cultivation using the COM-B model. 

Tonwong Sudto, Sylvia Vetter, David McBey, and Pete Smith

Rice cultivation is a significant source of anthropogenic greenhouse gas (GHG) emissions, accounting for approximately 24% of global agricultural emissions. Methane emissions are particularly high in rice fields compared to other crops due to the anaerobic conditions created by continuous flooding. The adoption of alternate wetting and drying (AWD) is an approach to reduce these emissions significantly. However, AWD can also increase nitrous oxide emissions during drying phases. Therefore, farmers and their decisions play a central role in mitigating emissions from rice cultivation. In this study, we analyse the factors influencing the farmers’ behaviour by using the COM-B model to identify the key drivers and barriers affecting farmers' adoption of AWD practices. The COM-B model explains human behaviour (B) as the result of physical and psychological capability (C), physical and social opportunity (O), and reflective and automatic motivation (M). Data were collected through face-to-face surveys with 150 rice farmers in central region of Thailand between July and October 2024. Overall, farmers have positive attitudes toward AWD, with strong motivation to adopt this practice. This is seen in their agreement with statements about AWD's potential to reduce costs (96.7%) and save water (98%). Furthermore, farmers consider their current irrigation systems (96%) and terrain (87.3%) as feasible for implementing AWD on their fields. These findings align with the motivation and feasibility factors identified through factor analysis. Regarding barriers to adopting AWD, most farmers believe they know how to implement AWD, and these practices do not require significant investment, equipment, or additional workforce. However, operational factors highlighted challenges such as water availability (50%) and water monitoring difficulties (42.67%), which significant barriers to implementation. These findings indicate that farmers recognize their capability to adopt AWD practices, and the adoption does not significantly affect yield. Nevertheless, barriers such as limited water availability and insufficient social support hinder adoption.

How to cite: Sudto, T., Vetter, S., McBey, D., and Smith, P.: Understanding farmers’ perspectives and barriers to adopting alternate wetting and drying (AWD) in Thai rice cultivation using the COM-B model., EGU General Assembly 2025, Vienna, Austria, 27 Apr–2 May 2025, EGU25-12741, https://doi.org/10.5194/egusphere-egu25-12741, 2025.

EGU25-13566 | Orals | BG8.6

Building an evidence base for sustainable agricultural policies: the iMAP-FP project 

andrea schievano, simona bosco, marta perez-soba, Mathilde Chen, Ana Montero-Castaño, Giovanni Tamburini, Irene Guerrero, Bielza Maria, marijn Van der Velde, Beatrice Landoni, Otho Mantegazza, Maria Luisa Paracchini, Carlo Rega, Jean-Michel Terres, and David Makowski

The iMAP-FP project 1, conducted by the European Commission's Joint Research Centre from 2019-2025, aims to assess the sustainability of farming practices (FPs) using meta-analyses (MAs). The core objective is to create a comprehensive, evidence-based resource to inform European agricultural and environmental policies, particularly within the framework of the Common Agricultural Policy (CAP). The project seeks to identify practices that can mitigate environmental impacts while maintaining or improving agricultural productivity.

The iMAP-FP dataset encompasses 570 MAs published since 2000, analysing the impacts of 34 categories of FPs on a broad range of different environmental and agricultural outcomes, including GHG mitigation, soil health, water use, pollution control, biodiversity, and productivity. The dataset covers a broad range of geographic regions, and includes >5000 estimated effect sizes comparing sustainable interventions against conventional practices.

A free online evidence library 2 provides access to the synthesized evidence on specific FPs and their impacts. Farming practices have also been classified merging nomenclature found in the literature with the European policy contexts 3. An analysis of the MAs trends shows a quality improvement in meta-analysis standards but highlights key remaining deficiencies, including reporting biases and insufficient data sharing. Furthermore, the project identified frequent trade-offs between productivity and environmental outcomes, demonstrating the complex nature of agricultural sustainability. Quantitative effects assessing the climate and environmental impacts of many specific FPs, useful to assess CAP interventions, have also been provided 4,5, as well as a policy-brief report focusing on FPs improving water management 6. A promising pilot trial in merging primary data from 15 MAs focusing on organic vs conventional farming, overcoming methodological limitations, is another output of the project. These outcomes provide policymakers with tools to assess the environmental impacts of specific practices and identify areas where further research and policy intervention are needed.

Future developments of the iMAP-FP framework could focus on incorporating new MAs as they are published, updating the dataset with emerging FPs and agroecological systems, and exploring primary-literature data to better reflect context-specific effects. The creation of interactive tools and visualizations could also facilitate access and understanding for policymakers and stakeholders. The use of machine learning tools is also foreseen to automate data extraction, analyze trends, and identify potential research gaps. Finally, the scientific community might engage with the JRC to promote data sharing according to FAIR principles and enhance training in meta-analysis methodologies to inform future agricultural policies.

1. 10.1038/s41597-024-03682-6

2. https://wikis.ec.europa.eu/display/IMAP/

3. 10.2760/33560.

4. 10.2905/b097f5ed-7eba-4ee0-87a5-a582425eba3b.

5. 10.2760/20814

6. JRC137742


How to cite: schievano, A., bosco, S., perez-soba, M., Chen, M., Montero-Castaño, A., Tamburini, G., Guerrero, I., Maria, B., Van der Velde, M., Landoni, B., Mantegazza, O., Paracchini, M. L., Rega, C., Terres, J.-M., and Makowski, D.: Building an evidence base for sustainable agricultural policies: the iMAP-FP project, EGU General Assembly 2025, Vienna, Austria, 27 Apr–2 May 2025, EGU25-13566, https://doi.org/10.5194/egusphere-egu25-13566, 2025.

EGU25-14941 | ECS | Posters on site | BG8.6

Cultivation of Mycelium and Fruiting Bodies of Eringi Mushroom (Pleurotus eryngii) Using a Recyclable Mineral-Based Substrate 

Junsu Jang, Jayeon Yoo, Kyung-Suk Cho, and Hee-Wook Ryu

The substrate used for mushroom cultivation is primarily based on sawdust. In Korea, waste wood (domestic waste wood, construction waste wood, and forestry waste wood) is utilized as the raw material for sawdust production. However, due to the insufficient production of waste wood, the supply of high-quality sawdust required for mushroom cultivation is limited, leading to reliance on imports. Furthermore, when sawdust-based substrates are used, the sterilization process generates unpleasant odors, causing complaints from local residents. Additionally, only about one-third of the nutrients in sawdust are utilized by mushroom mycelium during the cultivation process. To address these issues and enhance the nutrient utilization efficiency of sawdust, this study aims to develop a mushroom mycelium and fruiting body cultivation technique using a mineral-based substrate.

Eringi mushroom (Pleurotus eryngii) was used as the test species, and vermiculite with a particle size of 1.0–1.5 mm was employed as the mineral matrix. Flour was used as the nutrient source for mycelial growth. The experimental conditions for optimal mycelial growth included pH (4–7), C/N ratio (10–30), flour content (10–30 wt%), moisture content (40–70 wt%), and sawdust content (0–75%). The base substrate consisted of a mixture of 75% vermiculite and 25% sawdust, with pH 5.5 and a moisture content of 67%. The control group used a traditional sawdust substrate composed of sawdust mixed with rice bran. The spawn used for inoculation was prepared by cultivating P. eryngii on a sawdust substrate, and approximately 10 wt% of the substrate was inoculated with the spawn. Mycelial growth characteristics were observed by placing the prepared substrates in cultivation molds of a fixed shape and incubating them at 22°C for 7 and 14 days under the specified experimental conditions.

The optimal conditions for mycelial growth were found to be a C/N ratio of 20, flour content of 30 wt%, and pH 6. Although mycelial growth showed a slight decrease with an increasing vermiculite content (and corresponding decrease in sawdust content), no significant difference was observed within the range of 25–75% vermiculite. Additionally, the effects of pH, C/N ratio, flour content, and sawdust content on the growth of Eringi mushroom fruiting bodies were investigated, using the same conditions as those for mycelium cultivation. Fruiting body cultivation was conducted in cultivation bottles with a capacity of 850 mL. The fruiting body yield from the sawdust substrate was 100 g. In contrast, fruiting body yield from the base substrate increased linearly with higher flour content, reaching approximately 49 g at 30 wt% flour content.

These findings suggest the potential of cultivating mushrooms using a mineral-based matrix, such as vermiculite, instead of organic materials. Although further research is required to enhance the growth of mycelium and fruiting bodies, this approach could significantly reduce waste generation by enabling the recovery and reuse of the mineral matrix after mushroom cultivation.


Acknowledgement

This research was supported by Basic Science Research Program through the National Research Foundation of Korea(NRF) funded by the Ministry of Education (2020R1A6A1A03044977)

How to cite: Jang, J., Yoo, J., Cho, K.-S., and Ryu, H.-W.: Cultivation of Mycelium and Fruiting Bodies of Eringi Mushroom (Pleurotus eryngii) Using a Recyclable Mineral-Based Substrate, EGU General Assembly 2025, Vienna, Austria, 27 Apr–2 May 2025, EGU25-14941, https://doi.org/10.5194/egusphere-egu25-14941, 2025.

EGU25-16258 | Posters on site | BG8.6

Trends and Tools for Swiss Plant Protection Product Data 

Marcel Mathis, Johannes Ranke, and Marianne Balmer

Plant protection products (PPP) must be registered before they can be marketed and used. During registration, they are tested for efficacy and side effects, and can only be authorised if they do not pose unacceptable risks to humans, animals or the environment, as assessed by the regulatory authorities. In Switzerland, PPP authorized for use are listed in the Swiss Register of Plant Protection Products (SRPPP), which provides detailed information on active ingredient content, uses, and associated restrictions. These data are publicly available online through a dedicated website and are published in a custom format based on Extensible Markup Language (XML).


The current formats of SRPPP data in Switzerland are difficult to analyse, hindering effective use by practitioners and researchers. To address this issue, we have developed two open-source R packages, srppp and srppphist, which provide user-friendly access to SRPPP data. The srppphist package contains annual SRPPP datasets from 2011 to the present, enabling time-series analysis of PPP authorization trends. These tools allow users to retrieve and analyse data on the active substance content of PPP, PPP categories, area of action, target organisms, and use restrictions. These tools assist in assessing sustainability in the context of PPP use by offering valuable support for developing indicators and metrics related to PPP sustainability.


In our first analyses, we provide an overview of the development of authorised PPP in Switzerland since 2011. We look at trends in the number and types of plant protection products and their active substances, as well as their modes of action and obligations. Between 2011 and 2024, 574 different substances were registered as active ingredients in the SRPPP. During this period, the number of authorised active substances decreased from 507 in 2011 to 321 in 2024 - a decrease by 63%. Of the active substances authorised in 2011, 51% were still authorised in 2024, while 81% of those authorised in 2024 were already listed in the SRPPP in 2011. These results illustrate the reduction in the availability of active substances over time. In this contribution, we show how different categories of active substances and plant protection products are affected.

How to cite: Mathis, M., Ranke, J., and Balmer, M.: Trends and Tools for Swiss Plant Protection Product Data, EGU General Assembly 2025, Vienna, Austria, 27 Apr–2 May 2025, EGU25-16258, https://doi.org/10.5194/egusphere-egu25-16258, 2025.

EGU25-16452 | Orals | BG8.6

DORA - A new process and metric to measure ecosystem performance of farms 

Peter Froehlich, Utku Berkalp Uenalan, Noura Fajraoui, and Mallku Caballero

Under the pressures of climate change and a growing population, traditional agricultural practices are increasingly insufficient to meet the rising demand for food and soil carbon sequestration. To address this challenge, regenerative agriculture has emerged as an approach—emphasizing the understanding of soil dynamics, promoting ecological restoration, and harmonizing with nature. However, transitioning from traditional methods to regenerative agriculture is not a one-size-fits-all solution. Achieving outcomes across all fields or applying uniform practices for all farmers is impractical. Instead, it demands robust monitoring of fields and their surrounding regions to tailor practices effectively to specific conditions. Remote sensing and advanced statistical techniques provide insights into agricultural practices, but these tools are largely confined to research-level applications and often cater to technical audiences. The most critical step in ensuring the success of regenerative agriculture lies in effective understanding of context and communication between farmers, farms and advisors. While remote sensing techniques are powerful, they are not always accessible or practical for end-users. To bridge this gap, we propose DORA—a user-friendly dashboard designed to make regenerative agriculture measurable and actionable. DORA provides outcome-based, benchmarked targets for sustainable agricultural practices, translating complex data into easy-to-interpret reports for farmers. With the images acquired from Sentinel 1, Sentinel 2 and landsat 7,8 and 9 satellites, DORA visualizes the adoption of regenerative practices on farms or within sourcing districts. It generates annual metrics for plant performance and soil cover for each field, including fields within a buffer zone. Furthermore, DORA prepares an eight-year field map, showcasing the stability of different zones and identifying problematic or high-performing areas. For instance, when a farmer delineates field boundaries on the platform, the system analyzes satellite data to compare biomass and soil cover trends. DORA f.e. can reveal that a farm generally performs above the region but produces less biomass during dry years, suggesting a need to improve drought resilience. An overall positive trend and increased soil cover compared to plant performance might indicate a shift from main crops to catch crops, pointing to issues with cover crop management or weed infestations. It can also point to unsuccessful fertilization, tillage or similar activities. Historical analysis of crops, such as sunflowers or potatoes, might highlight practices that reduced performance unless mitigated with vegetation between ridges or no-till methods with cover crops. With DORA, farmers and advisors can make data-driven decisions to optimize performance, enhance soil health, and align with regional sustainability goals. By combining innovative technology with practical application, DORA ensures regenerative agriculture is not only measurable but also accessible and impactful for farmers worldwide. 

How to cite: Froehlich, P., Uenalan, U. B., Fajraoui, N., and Caballero, M.: DORA - A new process and metric to measure ecosystem performance of farms, EGU General Assembly 2025, Vienna, Austria, 27 Apr–2 May 2025, EGU25-16452, https://doi.org/10.5194/egusphere-egu25-16452, 2025.

EGU25-16510 | Posters on site | BG8.6

High resolution maps of European agricultural indicators 

Jon Olav Skøien, Nicolas Lampach, Helena Ramos, Linda See, Julien Gaffuri, Renate Koeble, and Marijn van der Velde

The last European agricultural census, organized by Eurostat, took place in 2020, collecting more than 300 variables on agriculture and farm structure from 9.03 million farmers in the EU (and EFTA countries Iceland, Switzerland and Norway). Data are aggregated to NUTS 2, NUTS 1 or national levels before they are publicly released on the Eurostat website due to confidentiality regulations that do not allow individual data to be disclosed.

With a newly developed methodology, it is now possible to create multi-resolution grids of these variables, where the size of the grid cells depend on the spatial density of the data. All grid cells respect a series of confidentiality rules, such as a minimum number of farms per grid cell (at least 10) a dominance rule (the largest contributes cannot have more than 85% of the total production in a grid cell) and a quality rule (estimates must have an estimated coefficient of variation less than 35%).

We will here present a range of thematic maps based on the 2020 European agricultural census to highlight regional and country differences, giving a new insight in the geographical patterns of agriculture in Europe, some expected, some more unexpected. All of them correspond to contextual indicators for the Common Agricultural Policy (CAP) and are divided into three broad categories: structural components (i.e., agricultural holdings, land use, livestock patterns, and labor input); the demographics of farmers (i.e., age, gender, and skills); and agricultural production methods (i.e., irrigation and organic farming).

For example, our analysis shows that high farm densities occur in plains and fertile valleys, while organic farming is concentrated in areas with high grassland proportions. Young farmers' holdings are located in a belt from France through Switzerland, Austria, Czechia, Slovakia and Poland. These data sets allow for more local policy evaluation and offer researchers opportunities to draw causal spatial inferences. The data are available through the Gisco viewer:

https://ec.europa.eu/eurostat/web/experimental-statistics/geospatial-data-agricultural-census


How to cite: Skøien, J. O., Lampach, N., Ramos, H., See, L., Gaffuri, J., Koeble, R., and van der Velde, M.: High resolution maps of European agricultural indicators, EGU General Assembly 2025, Vienna, Austria, 27 Apr–2 May 2025, EGU25-16510, https://doi.org/10.5194/egusphere-egu25-16510, 2025.

EGU25-17001 | Posters on site | BG8.6

Sustainable Farming Practices for Improved Water Management in Agriculture: A Systematic Review of Meta-Analyses 

Simona Bosco, Mathilde Chen, Marta Perez-Soba, Ana Montero-Castaño, Andrea Schievano, Giovanni Tamburini, Rui Catarino, Irene Guerrero, Maria Bielza, Vincenzo Angileri, Frank Dentener, David Makowski, and Terres Jean-Michel

Agriculture is the largest user of water in the European Union, accounting for up to 60% of total water abstraction. However, water scarcity and pollution from agricultural activities pose significant challenges to sustainable water management. This systematic review of meta-analyses aims to identify farming practices that can reduce water use and improve water quality. Based on the iMAP-FP dataset, a collection of 570 meta-analyses examining  the effects of farming practices on the environment and climate, direct impacts on water management were assessed through several metrics related to water use efficiency, water consumed by the crop, soil water retention, water quality. Indirect effects on water quality such as nutrient leaching and run-off were considered as well. Results reported in 120 meta-analyses revealed that 15 farming practices can increase water use efficiency, reduce water pollution, and/or enhance soil water retention, including agroforestry, cover crops, crop residue management, mulching, and soil amendment with biochar. Notably, crop residue management, mulching, cover crops, landscape features, and water-saving practices have multiple positive effects. Our findings highlight the importance of adopting sustainable farming practices to mitigate water scarcity and pollution, and inform policymakers about the most effective policy measures in agriculture. Promoting these practices has the potential to contribute to the development of more sustainable and resilient agricultural systems and to address the pressing challenges of water scarcity and pollution.

How to cite: Bosco, S., Chen, M., Perez-Soba, M., Montero-Castaño, A., Schievano, A., Tamburini, G., Catarino, R., Guerrero, I., Bielza, M., Angileri, V., Dentener, F., Makowski, D., and Jean-Michel, T.: Sustainable Farming Practices for Improved Water Management in Agriculture: A Systematic Review of Meta-Analyses, EGU General Assembly 2025, Vienna, Austria, 27 Apr–2 May 2025, EGU25-17001, https://doi.org/10.5194/egusphere-egu25-17001, 2025.

EGU25-17372 | Posters on site | BG8.6

Assessing organic farming uptake across Europe using census data from 9 million farms  

Marijn Van Der Velde, Jon Skoien, Nicolas Lampach, Andrea Schievano, Linda See, and Helena Ramos

The uptake of organic farming is heterogeneous across the European Union (EU) and across farming systems. According to the 2020 agricultural census, at 14.8 million ha, the area under organic farming accounted for 9.1% of the total EU agricultural land, and close to 20% of the area under organic farming in the world. The EU’s Farm to Fork strategy, aims to have 25% of the EU’s agricultural land under organic farming by 2030.

While the agricultural census from 2020 collected data on organic farming uptake by farming type, geospatial data was not available, so far. Disclosing census data at a more granular level is subject to confidentiality treatment as specified in the Implementing Regulation (EU) 2018/1091 on Integrated Farm Statistics (IFS). Confidentiality requirements on the frequency and dominance of farm holdings must be applied to map the data. Following the recent implementation of a methodology that accounts for these requirements, spatial mapping of the 2020 census became possible, providing an unprecedented view on EU agriculture. In addition, this also increases the number of data points available for analysis by up to three magnitudes.

Using this data, we spatially map the shares of organic farming associated to permanent grasslands, green fodder, arable crops including cereals, and permanent crops such as fruit, olives, and vineyards. We quantify current levels and local uptake gaps, investigate which farming types are characterized by the largest share of organic farming, and identify the most important drivers of organic farming across the EU. To identify these drivers we distinguish natural factors such as physiography (soils), climate, but also socio-economic characteristics related to farm structure (e.g. farm physical and economic size, demography, labour), as derived from the new datasets. This is then compared to the commitment EU Member States have quantified up to 2028 in terms of the share of utilised agricultural area (UAA) supported by the Common Agricultural Policy for organic farming as part of the Performance Monitoring and Evaluation Framework.

How to cite: Van Der Velde, M., Skoien, J., Lampach, N., Schievano, A., See, L., and Ramos, H.: Assessing organic farming uptake across Europe using census data from 9 million farms , EGU General Assembly 2025, Vienna, Austria, 27 Apr–2 May 2025, EGU25-17372, https://doi.org/10.5194/egusphere-egu25-17372, 2025.

EGU25-19605 | Orals | BG8.6

Towards a novel framework for measuring the resilience of the EU Food System  

Rui Catarino, Frank Dentener, Oscar Smallenbroek, and Katalin Toth

Resilience is a cornerstone of the European Green Deal, essential for ensuring food security, economic stability, and environmental sustainability amid challenges such as climate change, market volatility, and socio-political disruptions. To tackle these challenges, the European Commission developed the EU Food System Sustainability Model (https://datam.jrc.ec.europa.eu/datam/mashup/EU_FOOD_SYSTEM_MONITORING/), a fit for purpose framework that integrates environmental, social, and economic dimensions. With 37 headline and supporting indicators, the framework monitors the transition toward sustainable food systems within planetary boundaries. Resilience is emphasized as a key horizontal thematic area, reflecting the system's capacity to absorb, adapt to, and recover from shocks while maintaining functionality and ensuring long-term sustainability.

However, existing frameworks for assessing food system resilience often rely on indicators that fail to fully capture the unique aspects of resilience within the European context and lack integration across key dimensions. To address this limitation, we propose an innovative methodology that integrates the four key aspects of resilience - preparedness, shock resistance, adaptation, and transformation - each linked to specific capacities and vulnerabilities. Indicators are carefully selected, categorized as either capacities (positive trends like crop diversity) or vulnerabilities (negative trends like soil erosion), and scored relative to the EU median. These scores are aggregated and normalized to produce a composite resilience score ranging from 0 to 1, offering a robust metric to evaluate resilience across Member States and the EU27. This score supports targeted strategies and interventions, enabling policymakers to strengthen the adaptability and sustainability of the food system.

While the proposed methodology marks significant progress, its full potential relies on addressing critical data gaps, particularly in underrepresented areas of the food supply chain and sustainability criteria. We will discuss the need for improved data availability and greater collaboration among public and private stakeholders at national and regional levels. Addressing these challenges is key for refining the framework and strengthening evidence-based policymaking.

How to cite: Catarino, R., Dentener, F., Smallenbroek, O., and Toth, K.: Towards a novel framework for measuring the resilience of the EU Food System , EGU General Assembly 2025, Vienna, Austria, 27 Apr–2 May 2025, EGU25-19605, https://doi.org/10.5194/egusphere-egu25-19605, 2025.

EGU25-21579 | Orals | BG8.6 | Highlight

Competition for land use and sustainable farming in EU27: perspectives from the past and expectation for the future 

Elbersen Berien, Tomaso Ceccarelli, Michiel van Eupen, Charlotte van Haren, Michele Koper, Shanon Peeters, Gemma Toop, Luca Salvati, Gerard Hazeu, Igor Staritsky, Judith Snethlage, Simone Verzandvoort, and Hendrik Boogaart

This study was executed in a service contract with DG-Agriculture and generated many insights in how agricultural land use has evolved in the EU27 over the last 30 years and how it can evolve in the next 30 years. Agricultural land was analyzed in relation to changes in use and land management, competition, and, synergies of agriculture with other land use sectors and also between food, feed, energy, and non-food biomass production. In this contribution we will focus on presenting the results in relation to future land use developments in the context of the Green Deal (GD) and the Farm to Fork (F2F) strategy, and the potential impacts these may have for environmental key performance indicators (KPIs). Modelled land use changes for two scenarios show that by 2050 it can be expected that farmland area loss can be limited with active policy interventions to reach the F2F goals and broader Green Deal goals. However, if no active policy interventions take place, as modelled in the BAU scenario, the decline of farmland will be more than 8 Mha. In the two land use change scenarios the effects on KPIs such as for nitrogen emissions to water and air, GHG emissions, soil health, pesticides use, agricultural land abandonment, land take by built-up area and calories produced are different. They show diverse trade-offs in KPI scores between European regions. KPI scores confirm that in the scenario with active policy interventions towards F2F goals (SA scenario), the lowering of fertilizer and pesticides inputs, more organic land use, and lower livestock numbers, are likely to lead to better water quality, lower ammonia emissions, reduction in GHG emissions on agricultural lands, most strongly caused by reduction of enteric fermentation (livestock-based emissions) but not necessarily to GHG emissions related to land use shifts expected between 2020 and 2050.

The study makes several recommendations specific to the EU27 regional profiles. All the territorially different conditions intrinsically influence agricultural dynamics and drive territories to answer in a possibly different way to policy stimuli. 

How to cite: Berien, E., Ceccarelli, T., van Eupen, M., van Haren, C., Koper, M., Peeters, S., Toop, G., Salvati, L., Hazeu, G., Staritsky, I., Snethlage, J., Verzandvoort, S., and Boogaart, H.: Competition for land use and sustainable farming in EU27: perspectives from the past and expectation for the future, EGU General Assembly 2025, Vienna, Austria, 27 Apr–2 May 2025, EGU25-21579, https://doi.org/10.5194/egusphere-egu25-21579, 2025.

EGU25-21734 | Posters on site | BG8.6

EU food system monitoring in context of spatial sciences 

Katalin Toth, Carolina Puerta-Piñero, Irene Guerrero, Rui Catarino, Szvetlana Acs, Jean-Noël Druon, Monica Ermolli, and Ilaria Proietti

The European Green Deal aims to help the EU become climate neutral and resource-efficient, ensuring economic growth within the planetary boundaries. It recognises the need for systemic changes in the key economic sectors, including those related to food. To measure progress, a monitoring system is needed that ensures systemic approach, including environmental, economic and social dimensions of sustainability in a cost efficient way. It is logical to reuse existing indicators, by assessing their relevance and completeness in terms of various sustainability aspects. However, integrating elements heterogeneous system involves resolving their interoperability. In practice, more than 300 indicators have been screened, documented according to a harmonised metadata schema and anchored to a food system model. The model includes the components of the food supply chain (primary production, food processing, distribution and consumption) and the three sustainability dimensions decomposed in 12 thematic areas and 37 indicator domains. This work has revealed important knowledge gaps. Earth observation data and other spatial information are essential to fill these gaps and provide meaningful analysis of food system sustainability in space and time.

How to cite: Toth, K., Puerta-Piñero, C., Guerrero, I., Catarino, R., Acs, S., Druon, J.-N., Ermolli, M., and Proietti, I.: EU food system monitoring in context of spatial sciences, EGU General Assembly 2025, Vienna, Austria, 27 Apr–2 May 2025, EGU25-21734, https://doi.org/10.5194/egusphere-egu25-21734, 2025.

EGU25-1225 | ECS | PICO | BG8.7

Land of opportunities: Aligning organic farming and conservation targets in Europe 

Luisa Gensch, Kerstin Jantke, Livia Rasche, and Uwe A. Schneider

The European Green Deal provides for two targets by 2030: 1) the strict protection of at least 10% of the European Union’s land area and 2) the expansion of organic farming to 25% of agricultural land. To address these independent objectives competing for land use, we construct a spatially explicit partial equilibrium model that fulfills both targets either consecutively or simultaneously and at an EU or national level. Results indicate that the 25% organic farming target is the restricting constraint with high marginal costs, leading to less cropland use, higher land prices and higher farming revenues. Less than 1% of cropland area in the EU is needed to fulfill the strict protection target. Therefore, both targets can be fulfilled without major conflicts over cropland use. While targets at the EU level lead to better resource utilization and significantly lower price effects, the uneven distribution of additional strictly protected area and organically managed cropland between countries could be perceived as unfair and should be compensated. Half of the newly strictly protected areas are re-designations of already protected area. Thus, a comprehensive approach that combines expansion with proper management of protected areas is crucial to achieving conservation goals.

How to cite: Gensch, L., Jantke, K., Rasche, L., and Schneider, U. A.: Land of opportunities: Aligning organic farming and conservation targets in Europe, EGU General Assembly 2025, Vienna, Austria, 27 Apr–2 May 2025, EGU25-1225, https://doi.org/10.5194/egusphere-egu25-1225, 2025.

EGU25-1471 | ECS | PICO | BG8.7

The potential of irrigation for cereals production in Sub--Saharan Africa: A machine learning application for emulating crop growth at large scale 

Marco Rogna, Ana Klinnert, Ana Luisa Barbosa, Pascal Tillie, and Edoardo Baldoni

Due to its geographical location and its poor economic conditions, Africa  is the continent most exposed to the adverse consequences of climate change, particularly on agriculture. The very low percentage of land equipped for irrigation, 3.5% in Sub-Saharan Africa, is another element of concern, sensibly reducing the ability to mitigate the likely productivity losses caused by increasing climate variability and extreme events. Fostering irrigation in Africa is therefore a priority, but due to a limited amount of resources, both in economic and physical (e.g. harvestable water) terms, irrigation projects have to be planned carefully and appropriate locations should be prioritized. The present paper tries to assess the potentials of irrigation in Sub-Saharan Africa and to individuate the locations to be prioritized. The analysis focuses on four cereals, maize, millet, sorghum and wheat, among the most common staples in the region, and relies on a mix of crop modelling (DSSAT) and machine learning (XGBoost) to draw its conclusions. Specifically, for all four crops, crop simulations under rain-fed conditions and optimal irrigation, with DSSAT adding water every time a need for it is observed, are performed on a sample of all Sub-Saharan agricultural plots. Yields differentials and water requirements for optimal irrigation are then computed. Subsequently, yields and water requirements are predicted for all remaining agricultural locations through machine learning, using as explanatory variables the same inputs, soil characteristics, management practices and weather variables, required by DSSAT. Water productivity, defined as the ratio of yields differentials over water requirements for irrigation, is finally computed to individuate the locations where irrigation projects would be most beneficial. By further relying on a continental map of run-off values, we individuate two types of priority locations: areas where simple water capture and storage devices are viable and areas where more complex systems are necessary. The paper points out the importance of irrigation in Sub-Saharan Africa, showing significant gains in yields, up to 100% compared to rain-fed conditions. It also finds high potentials for water capture and storage devices in the south-eastern part of the continent and in South Africa, while the western part and the stripe bordering the Sahara desert would have to rely on more complex irrigation systems.

How to cite: Rogna, M., Klinnert, A., Barbosa, A. L., Tillie, P., and Baldoni, E.: The potential of irrigation for cereals production in Sub--Saharan Africa: A machine learning application for emulating crop growth at large scale, EGU General Assembly 2025, Vienna, Austria, 27 Apr–2 May 2025, EGU25-1471, https://doi.org/10.5194/egusphere-egu25-1471, 2025.

EGU25-1509 | ECS | PICO | BG8.7

Assessing the Impact of Long-Term Wind Speed Changes on Crop Yields in China 

Jialu Xu and Zongliang Zhang

Wind plays a crucial role in the growth of plants. Recent decades have witnessed a global phenomenon of wind stilling and reversal; however, the implications of these long-term wind changes on crop yields have been insufficiently explored. In this study, we evaluated wind's impact on rice, wheat, maize, and soybean yields in China from 1980 to 2017. Utilizing statistical models across various agro-climatic zones and spatial scales, our findings consistently indicate that crop yields increase with a reduction in growing-season wind speed, even after controlling for temperature and precipitation variables. Over three decades of wind stilling, a total production gain of 212 million tons was realized, effectively compensating for the production losses attributed to rising temperatures. Nevertheless, as the trend of wind has reversed and wind speeds have returned to levels observed in the 1990s, the production gains attributable to wind effects have diminished from 109% to 76% relative to the losses incurred from warming. Additionally, we observed an increase in the annual fluctuations of both wind speed and temperature, which has introduced further instability to crop yields. Consequently, wind-related climatic changes may pose an unrecognized threat to food security, warranting further investigation into their underlying mechanisms and broader implications.

How to cite: Xu, J. and Zhang, Z.: Assessing the Impact of Long-Term Wind Speed Changes on Crop Yields in China, EGU General Assembly 2025, Vienna, Austria, 27 Apr–2 May 2025, EGU25-1509, https://doi.org/10.5194/egusphere-egu25-1509, 2025.

Crop migration is a vital strategy for alleviating the adverse effects of climate change on agricultural production and minimizing yield losses. Although previous studies have emphasized the importance of crop migration, there remains a significant gap in quantitative assessments of its effectiveness in mitigating climate-induced production losses. To address this gap, we constructed a MaxEnt–SPAM–EPIC framework that integrates a crop distribution model with a crop model. Using this framework, we quantified the effectiveness of crop migration in alleviating climate-induced production losses. Taking the North China Plain (NCP) as a case study, we projected the migration patterns of winter wheat in near-term, mid-term, and long-term periods under SSP1-2.6, SSP2-4.5, and SSP5-8.5 scenarios, along with its efficacy in reducing climate-induced production losses. The results indicate that under climate change, the center of gravity of winter wheat cultivation (GCW) on the NCP will shift northwest by 2.4-6.3 km, while the mean center of  winter wheat cultivation (MCW) will move westward by 11.22-17.90 km in the long term. Additionally, the planting boundary of winter wheat on the NCP will expand northwest and contract southeast, leading to an average increase of 0.42% in the winter wheat planting area under future SSP scenarios. Among the three scenarios, the SSP2-4.5 scenario exhibits the largest scale and most complex trajectory of crop migration. In contrast, under the SSP1-2.6 scenario, there is minimal change in cultivation patterns. In the short term, crop migration can temporarily alleviate climate-induced production losses, but it cannot reverse the long-term trend of production decline on the NCP. Compared to the baseline, winter wheat migration on the NCP can mitigate climate-induced production losses and enhance production by more than 4.15% in the near- and mid-term. However, in the long-term, except for the SSP1-2.6 scenario where winter wheat production remains roughly consistent with the baseline, crop migration has limited effectiveness in reducing production losses, with winter wheat production facing substantial reductions of 9.54% and 24.02% under the SSP2-4.5 and SSP5-8.5 scenarios, respectively. Our study reveals that while crop migration may provide temporary relief from the adverse effects of climate change on agricultural production, its long-term sustainability is questionable. Therefore, prioritizing on-site adaptation strategies to enhance crop resilience remains crucial for ensuring food security. Our research contributes to a deeper understanding of the practical effectiveness of crop migration as a climate mitigation strategy and provides evidence-based insights for policymakers to develop region-specific adaptation measures.

How to cite: Guo, X., Wang, L., and Yue, Y.: Crop migration could temporarily alleviate the impact of climate change on production, but it is not sustainable, EGU General Assembly 2025, Vienna, Austria, 27 Apr–2 May 2025, EGU25-1908, https://doi.org/10.5194/egusphere-egu25-1908, 2025.

Agricultural land systems globally face escalating pressures from rising food demands, climate change, environmental degradation, and biodiversity loss. China, as a critical case, exemplifies the urgent need for strategies that reconcile food security with ecological sustainability. Here, we demonstrate that adopting a systematic approach to spatially allocate existing land policy tools—such as cropland reforestation, agricultural intensification, non-grain cropland restoration, and agricultural expansion—has the potential to simultaneously achieve multiple sustainability goals. Using a predictive model based on a socio-ecological-technical framework and machine learning, we evaluated the outcomes of six counterfactual scenarios for China’s agricultural land-use transitions at the county level. Results indicate that under a maximum land-sparing scenario (maximizing intensification of exist cropland, restoring unstable cropland, and maintaining non-grain cropland), compared to the 2020 baseline, China could increase grain output by 8%, reduce crop carbon emission intensity by 1%, enhance carbon sequestration by 63%, while substantially mitigating biodiversity loss across key taxa. However, the spatial distribution of land policy tools remains uneven, leading to varying types and degrees of trade-offs across specific counties under any given scenario. This highlights the critical need for coordinated national leadership to achieve sustainable objectives at a broader scale, offering valuable insights for global land-use transitions.

How to cite: Han, B.: Exploring sustainable pathways through AI-based simulation of China’s agricultural land-use transitions, EGU General Assembly 2025, Vienna, Austria, 27 Apr–2 May 2025, EGU25-2739, https://doi.org/10.5194/egusphere-egu25-2739, 2025.

EGU25-4826 | ECS | PICO | BG8.7

Ozone (O3) risks to rice yields under warming climate using O3-FACE observations 

Beiyao Xu, Steven Dobbie, Huiyi Yang, Lianxin Yang, Yu Jiang, Andrew Challinor, Karina Williams, Yunxia Wang, and Tijian Wang

Ozone (O3) threatens food security by reducing rice yields, a staple food for half of the world’s population. While numerical research has shown the negative impact of O3 on rice through mathematical methods and crop models, existing global assessments have not incorporated data from rice-specific Free Air Concentration Enrichment (FACE) experiments into the mechanical models that simulate the interactions among crop phenology, physiology, and O3. FACE experiments are novel field experiments with O3 distributed directly to the crops in the field.  This provides a realistic environment for studying how rice responds to O3 and is well-suited for evaluating its impact.

To perform this study, we use the calibrated JULES-crop model based on data from O3-FACE experiments, to simulate the effects of O3 on rice.  We investigate the response of rice under various shared socio-economic pathways (SSPs) as part of CMIP6. These SSPs represent a range of potential future anthropogenic emissions and different climate projections, from scenarios of regional conflict to those of global cooperation. By assessing the effects of O3 on rice under these future scenarios, we gain valuable insights into pathways that could mitigate damage to food security. This research provides a critical foundation for policymakers facing the dual challenges of air pollution and climate change.

How to cite: Xu, B., Dobbie, S., Yang, H., Yang, L., Jiang, Y., Challinor, A., Williams, K., Wang, Y., and Wang, T.: Ozone (O3) risks to rice yields under warming climate using O3-FACE observations, EGU General Assembly 2025, Vienna, Austria, 27 Apr–2 May 2025, EGU25-4826, https://doi.org/10.5194/egusphere-egu25-4826, 2025.

EGU25-4958 | ECS | PICO | BG8.7

Optimizing irrigation schedule improves water use efficiency of maize and wheat 

Xuening Yang, Yongqiang Zhang, Jing Tian, Xuanze Zhang, and Ning Ma

The efficient management of water resources is critical for sustainable agricultural practices, particularly in arid and semi-arid regions. This study aims to assess crop yield and water use efficiency (WUE) for maize and wheat in Northern China, with a focus on irrigation management, using the Agricultural Production Systems sIMulator (APSIM). APSIM, a widely used crop modeling tool, provides a robust framework for simulating crop growth, yield, and water consumption under different climatic and management scenarios.

Our research integrates historical climate data and crop management practices to evaluate how irrigation strategies influence crop water consumption and yield in the region. By simulating different irrigation regimes, including deficit and full irrigation, we explore their impacts on crop water use efficiency (WUE) and overall yield. The results indicate that optimal irrigation scheduling can significantly enhance water use efficiency, reducing water consumption while maintaining crop productivity. Moreover, the model highlights the sensitivity of crop yield to varying water availability, demonstrating the importance of timely and appropriate irrigation interventions.

The study underscores how crop water consumption can be better managed to enhance WUE and achieve sustainable agricultural production. Future research will focus on refining the model to account for the effects of soil salinity and other environmental factors, further enhancing its applicability for water resource management in arid regions.

How to cite: Yang, X., Zhang, Y., Tian, J., Zhang, X., and Ma, N.: Optimizing irrigation schedule improves water use efficiency of maize and wheat, EGU General Assembly 2025, Vienna, Austria, 27 Apr–2 May 2025, EGU25-4958, https://doi.org/10.5194/egusphere-egu25-4958, 2025.

EGU25-5306 | ECS | PICO | BG8.7

PSNet: a knowledge guided deep learning approach for county-level corn yield estimation 

Renhai Zhong, Xingguo Xiong, Qiyu Tian, Jinfeng Huang, and Tao Lin

Accurate crop yield estimation is important for global food security. Data-driven deep learning approaches have shown great potential for agricultural system monitoring, but are limited by their out-of-sample prediction failure and low interpretability. How to embed knowledge into deep learning models to address the above challenges remains an open question. In this study, we developed a deep learning model named PSNet following the concept of hierarchical yield levels to estimate county-level crop yield. The PSNet model mainly consists of PotentialNet and StressNet to capture the interactions among crop, environment, and technological trend. The PotentialNet is developed to capture the spatiotemporal pattern of the rice yield potential based on environmental and local technological conditions. The StressNet is designed to capture the negative impact of climate stresses, which caused the yield gap between yield potential and actual yield. We applied the model to analyze the county-level rainfed corn yield in the US Corn Belt from 2006 to 2020. The Random Forest (RF) and Long Short-term Memory (LSTM) models were chosen as baselines. The results showed that the PSNet model achieved better yield estimation accuracy than baselines under the normal (R2 = 0.82) and stressful climate conditions (R2 = 0.77). The ablation results indicated that PotentialNet contributed to the yield estimation under normal climate conditions, while the StressNet was better at capturing the yield losses under climate stresses. This study provided a promising approach to extract the pattern of yield potential and stress impact to achieve good estimation performance across various growth conditions.

How to cite: Zhong, R., Xiong, X., Tian, Q., Huang, J., and Lin, T.: PSNet: a knowledge guided deep learning approach for county-level corn yield estimation, EGU General Assembly 2025, Vienna, Austria, 27 Apr–2 May 2025, EGU25-5306, https://doi.org/10.5194/egusphere-egu25-5306, 2025.

EGU25-5850 | PICO | BG8.7

Pest detection from a biology-informed inverse problem and pheromone sensors 

Thibault Malou, Simon Labarthe, Béatrice Laroche, Elizabeta Vergu, Katarzyna Adamczyk, Nicolas Parisey, Philippe Lucas, and Paul-Andre Calatayud

One third of the annual world's crop production is directly or indirectly damaged by insects, with an even increasing burden in a warming climate. Early detection of invasive insect pests is key for optimal treatment before infestation. Existing detection devices are based on pheromone traps: attracting pheromones are released to lure insects into the traps, with the number of captures indicating the population levels. Promising new sensors are on development to directly detect pheromones produced by the pests themselves and dispersed in the environment. Inferring the pheromone emission would allow locating the pest's habitat, before infestation. This early detection enables to perform pesticide-free elimination treatments and reduce the negative impact of agricultural practices on biodiversity, environment and human health, in a precision agriculture framework. 
In order to identify the sources of pheromone emission from signals produced by sensors spatially positioned in the landscape, the inference of the pheromone emission (inverse problem) is performed. In the present case, classical inference framework consists in combining the data from the pheromone sensors and the fluid mechanic-based pheromone concentration dispersion model that is a 2D reaction-diffusion-convection model. The proposed inference framework further incorporates into this combination additional a priori biological knowledge on pest behaviour (favourite habitat, insect clustering for reproduction, population dynamic behaviour...) [1]. This information is introduced to constrain the inference problem towards biologically relevant solutions. Different biology-informed constraints are tested, and the accuracy of the solutions of the inverse problems is assessed on simulated noisy data using a dedicated package [2].  
In addition, optimal experimental design will be presented to deduce optimal sensor position in order to reduce the uncertainty of the inference and to improve the prediction of pest’s habitat localization.

Reference:

[1] Malou T., Parisey N., Adamczyk-Chauvat K., Vergu E., Laroche B., Calatayud P.-A., Lucas P. and Labarthe S. (2024). Biology-Informed inverse problems for insect pests detection using pheromone sensors. Submitted for publication. https://doi.org/10.5281/ZENODO.11506617

[2] Malou T. and Labarthe S. (2024). Pherosensor-toolbox: a Python package for Biology-Informed Data Assimilation. Journal of Open Source Software, 29 (101), 6863. https://doi.org/10.21105/joss.06863.

Acknowledgements:

This work was carried out with the financial support of the French Research Agency through the Pherosensor project with grant agreement ANR-20-PCPA-0007. 

How to cite: Malou, T., Labarthe, S., Laroche, B., Vergu, E., Adamczyk, K., Parisey, N., Lucas, P., and Calatayud, P.-A.: Pest detection from a biology-informed inverse problem and pheromone sensors, EGU General Assembly 2025, Vienna, Austria, 27 Apr–2 May 2025, EGU25-5850, https://doi.org/10.5194/egusphere-egu25-5850, 2025.

The increased likelihood and severity of extreme weather events in the future affect the key processes of terrestrial ecosystems such as plant growth, water fluxes and biogeochemical cycles of all elements. It is urgent need to adopt climate change adaptive measures in agricultural production to overcome the negative effects of climate change on crop production and nutrient losses. This study aims to develop a comprehensive framework for investigating optimized crop rotations that balance environmental sustainability and economic benefits while enhancing resilience to future climate conditions . The research involves three key steps. First, crop rotations at the catchment scale were generated using the Crop Generator tool. Second, the water quality model (mHM-Nitrate) and the crop growth model (WOFOST) were coupled using a process-based modeling approach. Third, environmental and economic indicators—such as crop yields, farmers' income, and nitrate leaching—were employed to evaluate crop production activities under different climate scenarios. The study will be conducted in the Bode catchment, Germany, where 45 feasible crop rotations have been planned. The study is going to explore how these crop rotations may evolve over the next two decades under four distinct climate scenarios (SSP 1-2.6, 2-4.5, 3-7.0, and 5-8.5). Additionally, the study aims to identify recommended crop rotations by quantifying their impacts on nitrogen dynamics and crop yields. This research provides an useful and comprehensive framework for devising crop adaptation strategies at the watershed scale in the face of future climate change.

How to cite: Ding, W. and Rode, M.: Crop adaptation and its impact on non-point source pollution under future climate challenges, EGU General Assembly 2025, Vienna, Austria, 27 Apr–2 May 2025, EGU25-5971, https://doi.org/10.5194/egusphere-egu25-5971, 2025.

EGU25-5989 | PICO | BG8.7

Modeling Adaptive Optimization of Cultivated Land Multifunctionality in the Yangtze River Delta, China  

Shilei Wang, Xiaobin Jin, and Folberth Christian

Abstracts: The utilization of cultivated land and its evaluation has gradually transitioned from a singular focus on food production to encompassing socio-economic development, maintenance of ecological functions, and enhancement of landscape experience. Cultivated land multifunctionality has thus become a key area of agricultural land systems research. Especially the over-intensified utilization of cultivated land, lacking comprehensive consideration of utilization, supply, and demand, impairs the adaptive capacity of cultivated land multifunctionality. The resulting soil nutrient imbalance, decline in biodiversity, and homogenization of landscapes undermine its sustainable contribution to human well-being.

This study integrates land use, socio-economic data, remote sensing monitoring, and point-of-interest data to develop an adaptive optimization model for cultivated land multifunctionality. Based on a quantitative assessment of the utilization, supply, and demand of cultivated land multifunctionality, three supply-demand matching scenarios serve as the foundation for modeling. In the scenario with supply exceeding demand, the supply and demand indices define the lower and upper thresholds. In the supply-demand balance scenario, the range of balanced values is used as the threshold. In the scenario where demand exceeds supply, the supply index establishes the lower limit of the threshold. Through this modeling process, five utilization characteristics of cultivated land multifunctionality are identified: potential type, transition type, stabilization type, critical type, and surpass type. Among these five types, the potential type indicates that resources are underutilized, the surpass type signifies that the utilization of cultivated land multifunctionality has surpassed resource and environmental constraints, while the other three types are in a relatively safe state. Their spatial attribution informs the development of a composite zoning scheme for cultivated land multifunctionality, designed to support its adaptive optimization. An empirical study in the Yangtze River Delta, China, explores the spatial differentiation patterns, utilization characteristics, and optimization strategies of cultivated land multifunctionality.

The findings indicate that cultivated land multifunctionality in the Yangtze River Delta is characterized by uneven utilization levels, robust supply capacity, and relatively lagging demand conditions. Influenced by the spatial heterogeneity of utilization, supply, and demand, the utilization characteristics—analyzed using the supply-demand matching relationship as the threshold—indicate persistent challenges of cultivated land multifunctionality. Specifically, the agricultural production function reveals dual challenges of surpass and potential types coexisting, the social security function is predominantly of the potential type, the surpass type of ecological maintenance function accounts for 32.1% of the region, and the cultural landscape function generally remains within a safe range. Building on this analysis, the study proposes a composite zoning scheme that integrates dominant and refined zoning approaches. In this zoning, the agricultural production function necessitates reduced inputs of production factors in major grain production areas, while agricultural productivity can be appropriately enhanced in ecological protection areas. The ecological protection function must be constrained within the limits of the resource and environmental carrying capacity. The social security function requires further exploration to strengthen its contribution to rural socio-economic development. Lastly, the cultural landscape function is expected to operate effectively.

How to cite: Wang, S., Jin, X., and Christian, F.: Modeling Adaptive Optimization of Cultivated Land Multifunctionality in the Yangtze River Delta, China , EGU General Assembly 2025, Vienna, Austria, 27 Apr–2 May 2025, EGU25-5989, https://doi.org/10.5194/egusphere-egu25-5989, 2025.

EGU25-6625 | ECS | PICO | BG8.7

A New Probabilistic Crop Yield Emulator: Development and Applications 

Xinrui Liu, Thomas Gasser, Jianmin Ma, and Junfeng Liu

Climate change significantly threatens global food security, while advancements in negative emission technologies, such as Bioenergy with Carbon Capture and Storage (BECCS) from crop residues, offer potential for climate mitigation. Crop yields are influenced by climatic factors, including temperature, precipitation, and atmospheric CO2, as well as human management practices such as irrigation and fertilization. Crop residues, as unavoidable byproducts of food production, provide a sustainable resource for bioenergy generation without requiring additional cropland. To synergistically achieve the Sustainable Development Goals (SDGs) of Zero Hunger and Climate Action, a comprehensive analysis of future food crop yields through numerical modelling and exploration of diverse climatic and socio-economic scenarios incorporating region-specific adaptation strategies is crucial.

A new crop emulator, blending information from state-of-the-art global gridded crop models (GGCMs) and observational data from field experiments, has been developed to facilitate probabilistic projections of crop yields under diverse climatic and socio-economic scenarios. It can be integrated into simple climate models, such as the compact Earth system model OSCAR, or used standalone. For policy relevance, it is constructed at a sub-national scale with the flexibility to be aggregated to broader regional levels while remaining computationally efficient for large scenario ensembles. Aligned with the Inter-Sectoral Impact Model Intercomparison Project (ISIMIP) framework, it simulates yields for four major food crops: maize, rice (two growing seasons), soybean, and wheat (spring and winter varieties) driven by atmospheric CO2(C), growing season temperature (T), water availability (W), including precipitation and irrigation, and nitrogen fertilization (N). While crop yield responses to C, T, and W are calibrated using ISIMIP3b simulations conducted under fixed human forcing, responses to N are calibrated against long-term field experiments, addressing inter-model uncertainty and integrating diverse data sources. Applying observational constraints via Bayesian inference further improves the model’s accuracy.

This paper describes the calibration, integration, and validation of the crop emulator and illustrates its performance and potential through two example studies. The first examines historical crop yields under static human inputs, and the consistency of these results with ISIMIP3a outputs validates the emulator’s ability to emulate GGCMs. The second study uses dynamic human inputs and constraints derived from field experiments (e.g., open-top chamber and free-air CO2 enrichment experiments), showing good agreement with FAO statistics and demonstrating the emulator’s capability to represent human management impacts. Beyond these examples, the crop emulator's potential extends to various future applications, such as coupling with integrated assessment models (IAMs), reanalysis of the Sixth Assessment Report (AR6) scenarios, and contributions to the upcoming AR7.

How to cite: Liu, X., Gasser, T., Ma, J., and Liu, J.: A New Probabilistic Crop Yield Emulator: Development and Applications, EGU General Assembly 2025, Vienna, Austria, 27 Apr–2 May 2025, EGU25-6625, https://doi.org/10.5194/egusphere-egu25-6625, 2025.

EGU25-7663 | ECS | PICO | BG8.7

Mapping harvest area of comprehensive crop types in China from 1990 to 2020 at a 1-km resolution 

Kaixuan Dai, Changxiu Cheng, Bin Li, Zheng Wang, Nan Mu, Zhe Li, Shanli Yang, and Xudong Wu

Changing crop patterns are the primary driver of global land use change and impact Earth’s hydrological and ecosystem processes. While existing studies have mapped the distribution of some individual food crops in China, harvest area maps for a complete set of crops over the past few decades are currently lacking. This study pioneered the development of a spatiotemporally continuous dataset of harvest area maps for 16 crop types in China from 1990 to 2020 at a 1-km resolution. Prefecture-level crop statistics were allocated to grids based on the crop suitability score, which is evaluated by multi-source natural and economic factors influencing crop cultivation. County-level validations demonstrated that the built dataset is highly consistent with statistical data, especially for primary grains and oilseed crops. Moreover, crop harvest area attribution at the sub-pixel level can better represent gradient changes within urban-rural transition zones. The built crop maps revealed that the harvest zones of maize, rice, and soybeans in Northern China have steadily expanded over the past three decades, with their cultivation centers shifting northeast by more than 200 kilometres. In comparison, wheat cultivation has become increasingly concentrated in Northern China. This dataset fully supports the identification of spatiotemporal changes in China’s crop patterns and can serve as a critical input to biogeochemical models and dynamic agricultural models such as LPJmL. The datasets can be obtained at https://www.scidb.cn/en/s/yeAfme.

How to cite: Dai, K., Cheng, C., Li, B., Wang, Z., Mu, N., Li, Z., Yang, S., and Wu, X.: Mapping harvest area of comprehensive crop types in China from 1990 to 2020 at a 1-km resolution, EGU General Assembly 2025, Vienna, Austria, 27 Apr–2 May 2025, EGU25-7663, https://doi.org/10.5194/egusphere-egu25-7663, 2025.

EGU25-7666 | ECS | PICO | BG8.7

Comprehensive global gridded crop model improvements reduce the uncertainty of extreme climate impact assessment 

Yuchuan Luo, Zhao Zhang, Jichong Han, Juan Cao, Qiang Tang, and Fulu Tao

Extreme climate events like drought and heatwave are increasingly co-occurring and considerably threaten global food security. Global gridded crop models (GGCMs) are widely used to assess the impacts of climate extremes on crop yields; however, in which way and to what extent the uncertainty of assessment can be reduced remains largely unknown. Here, we jointly improve the CERES-Wheat model from model inputs, structure, and parameterization at 10-km resolution to reduce the uncertainties globally. The improved model parameterization remarkably increase the model explanatory power of observed global wheat yield losses from drought, heatwave, and their compounds during 1981-2015 by 25% to 60% compared to the multi-model ensemble (MME) approach. Improved temperature response functions for key physiological processes particularly contribute to a better representation of wheat response to heatwave by 20%. Taking 2003 European drought and heatwave events as examples, the improved model is capable of closely replicating the observed yield declines (> 90%), whereas most of the existing GGCMs fail to show any impact and MME merely explains < 25% of the reported influences. Our findings provide the first evidence for comprehensively constraining crop model uncertainty in extreme climate impact assessment, benefiting the accurate understanding of climate risk and the design of effective adaptation strategies.

How to cite: Luo, Y., Zhang, Z., Han, J., Cao, J., Tang, Q., and Tao, F.: Comprehensive global gridded crop model improvements reduce the uncertainty of extreme climate impact assessment, EGU General Assembly 2025, Vienna, Austria, 27 Apr–2 May 2025, EGU25-7666, https://doi.org/10.5194/egusphere-egu25-7666, 2025.

EGU25-7675 | PICO | BG8.7

Improving wheat developmental model based on dynamic changes in accumulated temperature demand 

Yujie Liu, Jiahao Chen, Shuyuan Huang, and Wenjing Cheng

The dynamic response and adaptation mechanisms of crop phenology to climate change have not been extensively studied. At present, the mainstream process mechanism models have not yet considered the adaptability of crop phenology to climate. The simulation of crop development process is generally driven by temperature, especially the development rate during the reproductive growth season is assumed to be only affected by temperature. The development rate of wheat is also affected by photoperiod, temperature cycle, vernalization, and growth continuity effects. This article uses long-term and multi variety wheat phenological observation data, combined with historical climate data and field management data, to identify the dynamic changes in wheat phenology and accumulated temperature demand in China from 1981 to 2018. It reveals the mechanism of wheat dynamic response and adaptation to climate change, couples indicators reflecting phenological plasticity, and improves the models of nutritional growth period and reproductive growth period respectively. The main results and conclusions of the research are as follows: (1) The dynamic changes in wheat accumulated temperature demand, even for the same variety and stage, there are differences in accumulated temperature demand in different environments. The dynamic nature of accumulated temperature indicates that previous models based on the assumption of constant accumulated temperature are difficult to apply to changing environments. (2) The increase in temperature shortened the reproductive growth period of winter wheat, and this effect tended to intensify during the study period. The rhythmicity of day night temperature can slow down the accelerated development of nutrient growth due to warming. The wheat variety is shifting towards a weaker winter orientation, and the weakened vernalization effect leads to an increase in accumulated temperature required for phenological occurrence. For the reproductive growth period, the flowering period will affect the development rate of wheat during the reproductive growth period, and the response of temperature to maturity period is delayed. The effect of flowering temperature on phenology will continue for 8-15 days after flowering. When the flowering temperature exceeds 26 ° C, the impact on maturity period will last for more than 20 days. (3) For the flowering period of spring wheat, the model considering the effects of photoperiod and temperature cycle on accumulated temperature has the best performance, while for the flowering period of winter wheat, the model considering the effects of photoperiod and vernalization on accumulated temperature has the best performance. The nonlinear plasticity model is the optimal model for simulating the maturity period of spring and winter wheat. The use of optimized models to simulate the flowering and ripening stages of wheat reduced the average simulation error by 22.71% and 22.19% compared to traditional models.

How to cite: Liu, Y., Chen, J., Huang, S., and Cheng, W.: Improving wheat developmental model based on dynamic changes in accumulated temperature demand, EGU General Assembly 2025, Vienna, Austria, 27 Apr–2 May 2025, EGU25-7675, https://doi.org/10.5194/egusphere-egu25-7675, 2025.

EGU25-7722 | ECS | PICO | BG8.7

Optimising nitrogen management for climate-smart agriculture: A hybrid modelling approach in wheat-maize rotations 

Deyao Liu, Baobao Pan, Shu Kee Lam, Enli Wang, and Deli Chen

Optimising nitrogen management has the potential to enhance crop productivity while mitigating greenhouse gas emissions. Nevertheless, it has low adoption rates, due to the complex interactions of crop types, environments (climate and soil) and management combinations, posing significant challenges to advancing climate-smart agriculture. In this study, a hybrid modelling approach was developed to target a minimum of 90% of the potential yield, while simultaneously increasing nitrogen use efficiency and optimising N inputs, reducing net GHG emissions and GHG intensity. A 30-year field trial was conducted on a wheat-maize rotation system in the North China Plain. The observations (annual yields, SOC and N2O emissions) were then used to validate the process-based DNDC model, and the NSGA-Ⅲ machine learning algorithm was applied for multi-objective optimisation. This hybrid modelling approach simulated and optimised three levels of nitrogen management under future climate scenarios (level 1: fertilizer rates; level 2: fertiliser rates, timing, frequency, and crop schedules; level 3: level 2 plus irrigation and residue retention). From 1990 to 2100, the optimised practice combinations were identified: delaying and reducing basal fertilization (+5 d, -52.8 kg N ha-1) while advancing top-dressing in wheat (-5 d) and both events in maize (-9 d, -3 d); postponing wheat sowing (+5 d) and advancing maize sowing (-9 d); aligning irrigation event with fertilization, and adding one irrigation event during the maize bell stage; and lowering residue retention (-0.2). Integrating additional practices with fertiliser rates (levels 2 and 3) proves effective in meeting these climate-smart objectives. Under SSP245 and SSP585, the optimal level 3 practices, compared to maintaining current practices unchanged (conventional practices), increase annual crop yields by 5.6% and 1.7%, respectively, while concurrently reducing net GHG emissions by 9.4% and 8.4%, respectively. Optimal level 3 practices, in comparison to level 2, increased yields by only 0.7%, but significantly reduced net GHG emissions by 8.7%. Furthermore, the implementation of optimal level 3 practices, compared to conventional practices, led to a reduction in N inputs, irrigation water use and residue inputs by 17.2%, 6.7% and 20.0%, respectively. The findings of this study demonstrate that the optimal practices continually adapted in order to respond to the changing climate conditions. It is imperative for decision-makers to consider the trade-off between achieving greater GHG reductions and the potentially higher implementation costs associated with adjusting practices, given the minimal yield differences but significant GHG emission disparities across levels.

How to cite: Liu, D., Pan, B., Lam, S. K., Wang, E., and Chen, D.: Optimising nitrogen management for climate-smart agriculture: A hybrid modelling approach in wheat-maize rotations, EGU General Assembly 2025, Vienna, Austria, 27 Apr–2 May 2025, EGU25-7722, https://doi.org/10.5194/egusphere-egu25-7722, 2025.

EGU25-7954 | ECS | PICO | BG8.7

Evaluating Climate Change Impacts and Adaptation Potential in Single and Double Cropping Systems using Crop Model Emulators 

Qiankun Niu, Christian Folberth, Nikolay Khabarov, and Juraj Balkovič
 

Climate change poses significant challenges to global food security, particularly in regions relying on double cropping systems. Developing sustainable adaptation strategies for these systems is essential to mitigate climate-induced yield losses and ensure sustainable crop production under changing climate. However, the effectiveness of these strategies remains underexplored in many regions, especially in areas where double cropping systems are a cornerstone of agricultural productivity and food security. This study aims to establish a global framework for climate change adaptation in single and double cropping systems, focusing on optimizing management practices such as sowing dates and cultivar selection. As a first prototype, we assessed the impacts of climate change on rainfed soybean and maize in single and double cropping systems in Brazil.

Using an advanced crop model emulator, the CROp model Machine learning Emulator Suite (CROMES), we projected crop yields under two shared socioeconomic pathways (SSP126 and SSP585) for 2016–2100. Our results reveal that optimizing sowing dates and cultivar selection is crucial for adapting cropping systems to climate change. Double cropping soybean faces yield declines up to 40% under SSP585 but gains up to 10% under SSP126, with early-sown and early-maturing varieties suffering sharper losses (up to 75%). Double cropping maize grown in the second season shows greater resilience, with declines ranging down to only -20%, while single cropping maize again faces sharper losses, reaching down to -60%. Single cropping soybean can increase yields by up to 30% under SSP126 with later planting and longer maturity groups but declines up to -30% under SSP585.

These findings provide valuable insights for understanding the vulnerabilities and potential adaptation strategies for single and double cropping systems in Brazil, setting the stage for broader global studies. Future work will extend this analysis to other key cereal-based double cropping systems in China, the United States, and Indonesia, contributing to a comprehensive global framework for transitioning to sustainable double cropping systems and securing food production under the pressures of climate change.

How to cite: Niu, Q., Folberth, C., Khabarov, N., and Balkovič, J.: Evaluating Climate Change Impacts and Adaptation Potential in Single and Double Cropping Systems using Crop Model Emulators, EGU General Assembly 2025, Vienna, Austria, 27 Apr–2 May 2025, EGU25-7954, https://doi.org/10.5194/egusphere-egu25-7954, 2025.

EGU25-8129 | ECS | PICO | BG8.7

Modelling soybean growth processes in the land surface model ORCHIDEE-CROP 

Xianglin Zhang, Daniel Goll, Philippe Ciais, Yang Su, and Ronny Lauerwald

Soybean, the most produced leguminous crop on Earth, serves as a vital source of vegetable oil and a major provider of protein for animal feed and human consumption. By fixing atmospheric nitrogen via rhizobia, soybean reduces reliance on synthetic fertilizers, promoting soil sustainability, reducing surface water eutrophication and N2O emissions. Most soybean is produced in the US and South America. In contrast, Europe and China are major importers, and produce only a small fraction of their soybean consumption. However, there is growing interest of increasing the soybean self-sufficiency in these regions, to decrease dependence on US exports, reduce environmental impacts of soybean expansion in South America, and for the sake of crop diversification in Europe and the agronomical and environmental benefits of leguminous crops. In order to explore the potential to cultivate soybean around the world, including probable yields, yield stability, and the agronomical and environmental effects mentioned above, comprehensive, process-based models are needed. Moreover, such models could permit for future predictions accounting for climate change, which has the potential to shift regions where soybean production is promising to higher latitudes. Here we present our recent developments of the land surface model ORCHIDEE-CROP (Organizing Carbon and Hydrology in Dynamic Ecosystems-Crop), for which we developed a representation of soybean as a major crop besides wheat, maize, and rice. For this crop, we developed a new parametrization of crop phenology, biomass production and allocation, and yield production. A new scheme was also introduced to represent the effects of fertilization on biomass development and yield production. Experimental data from ten flux tower sites were used to calibrate and validate the model. We find that the simulated gross primary productivity, evapotranspiration, leaf area index, and biomass agree well with the observations. Our model development provides an essential tool for assessing the agronomical and environmental benefits of legume crops in agroecosystems at regional to global scales.

How to cite: Zhang, X., Goll, D., Ciais, P., Su, Y., and Lauerwald, R.: Modelling soybean growth processes in the land surface model ORCHIDEE-CROP, EGU General Assembly 2025, Vienna, Austria, 27 Apr–2 May 2025, EGU25-8129, https://doi.org/10.5194/egusphere-egu25-8129, 2025.

EGU25-8826 | ECS | PICO | BG8.7

Six decades of global crop yield increase and cropland expansion from 1960 to 2020 

Karina Winkler, Richard Fuchs, Mark Rounsevell, and Martin Herold

Population growth, evolving consumption preferences, technological advancements, globalized trade, and environmental factors have all significantly influenced global agriculture. The rising demand for agricultural commodities has driven increased production through both land area expansion and intensification (reflected as higher yields). However, the connections between global agricultural expansion and intensification remain unclear.

Using a data-driven approach to map past cropland use and productivity changes on a global scale, we aim to (1) quantify the spatiotemporal patterns of global changes in cropland systems, particularly focusing on area expansion and contraction, as well as yield increases and decreases over the last six decades (1960-2020), and (2) explore the relationship between cropland intensification and expansion across different countries and regions.

Our findings reveal that high-income countries have followed a trajectory of yield increases and land contraction on croplands, aligning with the concept of land sparing and influenced by policy. In contrast, low-income countries have seen less yield increase but substantial cropland area expansion over time. Notably, emerging countries in tropical regions (e.g., Brazil, Indonesia, Thailand, Colombia, and Malaysia) have experienced both the highest crop yield increases and cropland expansion rates. This suggests potential knock-on effects of yield increases in high-profit crops such as soybean, oil palm, and sugar cane, primarily used for exports. These yield increases are linked to and likely triggered significant agricultural expansion into natural ecosystems. We find that the increase in tree crops is the underlying cause of more than half of the global deforestation for cropland expansion.

Overall, we demonstrate how the relationship between yield increases and cropland expansion varies by region and crop type. This relationship is also likely influenced to varying degrees by political intervention, global trade, technology transfer, and climate change.

How to cite: Winkler, K., Fuchs, R., Rounsevell, M., and Herold, M.: Six decades of global crop yield increase and cropland expansion from 1960 to 2020, EGU General Assembly 2025, Vienna, Austria, 27 Apr–2 May 2025, EGU25-8826, https://doi.org/10.5194/egusphere-egu25-8826, 2025.

EGU25-8894 | ECS | PICO | BG8.7

Building resilience in Mediterranean agriculture through participatory approaches: an evaluation of climate adaptation strategies in the Arroyo de la Balisa Sub-basin (Segovia, Spain) 

Mario Ballesteros-Olza, Paloma Esteve-Bengoechea, Isabel Bardají, Bárbara Soriano, Irene Blanco-Gutiérrez, Maite Jiménez-Aguirre, Sofía Garde-Cabellos, Carmen Galea, Jon Lizaso, Carlos H. Díaz-Ambrona, David Pérez, Margarita Ruiz-Ramos, and Ana M. Tarquis

The Mediterranean region faces critical water scarcity issues exacerbated by climate change, posing significant threats to agricultural sustainability and food security. Adaptive strategies for agriculture are vital to cope with these challenges and ensure long-term resilience. This research focuses on the prioritization and socio-economic evaluation of adaptation measures in the Arroyo de la Balisa sub-basin (SCAB), a representative case study in the Duero River Basin, in Segovia (Spain).

For the prioritization process, a participatory multicriteria approach was used, in which 41 stakeholders representing public administration, agronomic engineering companies, farmers, ranchers, environmentalists and experts, ranked 14 adaptive measures under current and future climatic scenarios, based on four criteria: effectiveness, economic benefit, environmental benefit and ease of implementation. Among the measures considered, the modernization and optimization of irrigation systems was valued as the top strategy for climate change adaptation, followed by the introduction of more resilient crops and several Common Agricultural Policy 2023-2027 eco-schemes, such as crop rotation or no-till farming. These adaptive measures were particularly well-valued for the future scenario, marked by increased evapotranspiration and reduced rainfall. In contrast, other measures requiring significant infrastructure investment, such as transitioning rainfed areas to irrigation, were ranked lower under future scenarios due to anticipated water scarcity.

In parallel, a structured survey targeting 150 local farmers and ranchers is being conducted to assess the socio-economic impacts of implementing these prioritized measures in the SCAB, focusing on potential variations in production costs, income and environmental externalities. The ongoing analysis aims to complement the prioritization results, offering a more comprehensive understanding of the viability of these measures, taking into account economic, social, environmental and institutional dimensions.

The preliminary findings of this research highlight the importance of integrating advanced technologies with sustainable agricultural practices to enhance water use efficiency and mitigate climate risks. Furthermore, the participatory approach employed in this study ensures the relevance and local acceptance of the proposed adaptation measures, fostering their practical implementation. By aligning these technical solutions with stakeholder priorities, this work drives the adoption of effective and sustainable agricultural adaptive strategies. Through this approach, it aims to inform agricultural policies that enhance resilience to climate change, contributing to the implementation of the National Climate Change Adaptation Plan (PNACC) 2021-2030.

How to cite: Ballesteros-Olza, M., Esteve-Bengoechea, P., Bardají, I., Soriano, B., Blanco-Gutiérrez, I., Jiménez-Aguirre, M., Garde-Cabellos, S., Galea, C., Lizaso, J., Díaz-Ambrona, C. H., Pérez, D., Ruiz-Ramos, M., and Tarquis, A. M.: Building resilience in Mediterranean agriculture through participatory approaches: an evaluation of climate adaptation strategies in the Arroyo de la Balisa Sub-basin (Segovia, Spain), EGU General Assembly 2025, Vienna, Austria, 27 Apr–2 May 2025, EGU25-8894, https://doi.org/10.5194/egusphere-egu25-8894, 2025.

EGU25-9686 | ECS | PICO | BG8.7

EU food system transformations 

Anniek Kortleve, José Mogollón, and Paul Behrens

The global food system is responsible for up to a third of greenhouse gas emissions and is a major cause of biodiversity loss. A low-emission food system transition towards more plant-rich diets is urgently needed in the EU to mitigate environmental crises including climate change. Linking global physical input-output models with public agro-economic data reveals that animal-sourced food (ASF) dominates EU agriculture, consuming the majority of agricultural land, Common Agricultural Policy (CAP) subsidies, fixed assets, and farm employment, while contributing disproportionally to greenhouse gas emissions, net farm profits, and caloric intake. ASFs account for most EU food-related greenhouse gas emissions (84%) yet provide only a fraction of the dietary calories (35%) and proteins (65%), highlighting their inefficiency.

Dietary shifts away from ASFs would free up significant agricultural land and CAP subsidies, unlocking opportunities for alternative land uses, such as rewilding, and CAP budget redirection to support plant-based alternatives. However, transitioning to more plant-rich diets could also lead to the stranding of ASF-related assets, currently evaluated at €258 billion (78% of all agricultural fixed assets). Our findings suggest that as agricultural assets depreciate over time, a systemic phase-out of ASF-related assets without further investments, would leave minimal residual value and limit the risk of stranded assets.

How to cite: Kortleve, A., Mogollón, J., and Behrens, P.: EU food system transformations, EGU General Assembly 2025, Vienna, Austria, 27 Apr–2 May 2025, EGU25-9686, https://doi.org/10.5194/egusphere-egu25-9686, 2025.

EGU25-9810 | PICO | BG8.7

Sustaining Irrigated Agriculture in the Mediterranean: A Comprehensive Assessment of Water and Energy Resources 

Davide Danilo Chiarelli, Harsh Nanesha, and Maria Cristina Rulli

Irrigation plays a vital role in sustaining agricultural productivity, particularly in the Mediterranean region, which is characterized by limited water resources and heightened vulnerability to water scarcity. Meeting the irrigation demands of both water and energy in such environments requires efficient management strategies to ensure long-term agricultural sustainability. This work aims to provide a comprehensive understanding of the current use of water and energy in Mediterranean agriculture, with implications for food production and environmental sustainability. Using high-resolution data on irrigated and rainfed areas, crop-specific water consumption, and regional irrigation infrastructure, the blue water (BW) consumption and energy demand for irrigation were calculated across the region. The results reveal that cereals account for the largest irrigated area, representing 54% of the total area and consuming 30% of the energy. Conversely, fruits and nuts, which cover just 14% and 7% of the irrigated area, respectively, contribute significantly to energy demand, requiring 30% and 17% of the total energy consumption. In total, irrigation across the Mediterranean region utilizes 88.34 km³/y of blue water and 85.19 × 10⁶ GJ/y of energy, covering an irrigated area of 17.88 Mha. These results offer important insights into the interlinkages within the WEFE Nexus, highlighting the resource intensity of irrigation. By quantifying energy demands, the study helps assess the broader environmental impacts of irrigation within the Nexus.

How to cite: Chiarelli, D. D., Nanesha, H., and Rulli, M. C.: Sustaining Irrigated Agriculture in the Mediterranean: A Comprehensive Assessment of Water and Energy Resources, EGU General Assembly 2025, Vienna, Austria, 27 Apr–2 May 2025, EGU25-9810, https://doi.org/10.5194/egusphere-egu25-9810, 2025.

EGU25-10203 | ECS | PICO | BG8.7

Optimizing crop straw management in China: valuing bioenergy potential and greenhouse gas reduction opportunities 

Xinqing Lu, Yifan Xu, Ziqi Lin, Guocheng Wang, and Zhangcai Qin

Tailoring straw return strategies to specific regional conditions can optimize soil health, enhance crop yields, and contribute to climate change mitigation. By using the Rothamsted carbon model (RothC) and the bioenergy-emission-economic model (BEE), we assessed the spatially explicit, optimal straw harvest strategies to maintain soil organic carbon (SOC), and evaluated the climate benefits aquired from straw-based bioenergy. We found that the national average straw return rate needs to reach 43% to meet the 4 per mille SOC target. Most crop straws in Northeast China must be returned to cropland to maintain SOC level, while straws in East China and Central China could provide substantial quantities of biomass feedstock for energy production without SOC loss. Under future climate scenarios and designed straw harvest strategies, 0.3 to 0.7 Pg C of straw could become available annually for energy production, providing a greenhouse gas mitigation potential of 1.4 to 2.5 Pg CO2e using the combined heat and power (CHP) and integrated gasification combined cycle (IGCC) technologies (2020-2100). These region-specific straw management strategies offer insights into sustainable agricultural practices, soil carbon enhancement, and agricultural sector’s climate policies.

How to cite: Lu, X., Xu, Y., Lin, Z., Wang, G., and Qin, Z.: Optimizing crop straw management in China: valuing bioenergy potential and greenhouse gas reduction opportunities, EGU General Assembly 2025, Vienna, Austria, 27 Apr–2 May 2025, EGU25-10203, https://doi.org/10.5194/egusphere-egu25-10203, 2025.

EGU25-10248 | ECS | PICO | BG8.7

Net Greenhouse Gas Impacts of US Irrigation: Integrating Local Emissions and Global Land Sparing 

Avery W. Driscoll, Justin A. Johnson, Joey Blumberg, Alison E. King, Seth A. Spawn-Lee, and Nathaniel D. Mueller

Irrigation increases cropland productivity, improves resilience to intensifying climatic stressors, and is accordingly recognized as an effective strategy for climate change adaptation. Irrigation also produces greenhouse gas emissions through energy use for pumping, increased N2O emissions, and degassing of CO2 from supersaturated groundwater, and therefore involves a potential tradeoff between climate change adaptation and mitigation goals. However, irrigation may also decrease global demand for agricultural land by increasing yields, preventing land use change emissions. Here, we quantify the net greenhouse gas impact of US irrigation via both direct emissions and avoided land use change. First, we find that irrigation produces 18.9 Mt CO2e yr-1, 72% of which is due to energy use and thus can be mitigated through adoption of electric pumps coupled with decarbonization of the electric grid. Next, we use empirical models of irrigated to rainfed yield ratios to estimate the production benefits of irrigation in the US for 16 crop groups. Based on these production estimates, we use a global economic model for evaluating land use (GTAP-AEZ) to project hypothetical land use change in response to the loss of irrigated crop production in the US. Land use change projections are downscaled to 300 m resolution using the Spatial Economic Allocation Landscape Simulator (SEALS) model, calibrated on historical land use change. Finally, we leverage existing estimates of biomass and soil carbon stocks to quantify the carbon impacts of the projected land use change. Preliminarily, we find the carbon benefits attributable to avoided land use to be ~4.6 Gt CO2e in total, equivalent to roughly 240 years of annual direct emissions from irrigation. These findings improve clarity regarding the environmental and economic tradeoffs of irrigation, particularly with respect to irrigation expansion for the sake of climate change adaptation.

How to cite: Driscoll, A. W., Johnson, J. A., Blumberg, J., King, A. E., Spawn-Lee, S. A., and Mueller, N. D.: Net Greenhouse Gas Impacts of US Irrigation: Integrating Local Emissions and Global Land Sparing, EGU General Assembly 2025, Vienna, Austria, 27 Apr–2 May 2025, EGU25-10248, https://doi.org/10.5194/egusphere-egu25-10248, 2025.

EGU25-11538 | PICO | BG8.7

Data-informed Machine Learning Modeling for Infestation Level Prediction of the Sugar Beet Weevil 

Laura Bernadó, Francisco Cerqueira, Pascal Léon Thiele, Martina Dokal, Marion Seiter, Jasmin Lampert, and Eva Molin

The notable increase in insect populations over the recent years has been closely linked to rising global temperatures and more frequent drought events, both consequences of climate change. This surge in insect activity has had a significant impact on agricultural production [1]. Among the crops most affected is sugar beet in the eastern part of Austria [2], where outbreaks of the sugar beet weevil (Asproparthenis punctiventris) have been become increasingly common. Identifying regions more prone to such infestations could aid crop planning and management practices, mitigate agricultural losses, improving energy efficiency, and increase crop yield. Previous publications have already shown the influence of weather conditions on the reproduction and survival rates of insects and linked these factors to their distinct life cycle stages [3,4]. These investigations employed simple regression models and statistical frameworks to study the correlation of the infestation level with weather parameters as well as degree-day models that aimed at predicting the time of insects’ outbreak.

In our study we extend this approach by incorporating soil composition data, historical crop records alongside the most relevant meteorological parameters. We use these data to train machine learning algorithms, specifically species distribution models together with random forests, aiming at forecasting infestation levels. By integrating data from diverse and heterogeneous sources, we construct a comprehensive database used as the foundation for developing our machine learning trained prediction algorithm. We propose a multi-layered model in which each layer processes data from a different source, spatially represented on a map. Furthermore, we integrate geospatial information of the previous sugar beet crops and derive a population spread function, which is subsequently used to refine the prediction results. Initial findings validate the feasibility of the proposed approach and its potential for geographically predicting infestation levels of the sugar beet weevil.


References

[1] Skendžić S, Zovko M, Živković IP, Lešić V, Lemić D. The Impact of Climate Change on Agricultural Insect Pests. Insects 2021; 12(5).

[2] Strotmann K., Pflanzenschutzverbot: 4.000 ha Rüben in Österreich vernichtet. Agrarmarkt Österreich; Jun.2023.

[3] Drmić Z, Čačija M, Virić Gašparić H, Lemić D, Bažok R. Phenology of the sugar beet weevil, Bothynoderes punctiventris Germar (Coleoptera: Curculionidae), in Croatia. Bull Entomol Res. 2019 Aug;109(4):518-527. doi: 10.1017/S000748531800086X. Epub 2018 Nov 27. PMID: 30477591.

[4] Lydia Jarmer. Masterarbeit: Auftreten des Rübenderbrüsslers (Asproparthenis punctiventris) in Ostösterreich unter besonderer Berücksichtigung von Witterungsverhältnissen. Universität für Bodenkultur; 2022.

How to cite: Bernadó, L., Cerqueira, F., Thiele, P. L., Dokal, M., Seiter, M., Lampert, J., and Molin, E.: Data-informed Machine Learning Modeling for Infestation Level Prediction of the Sugar Beet Weevil, EGU General Assembly 2025, Vienna, Austria, 27 Apr–2 May 2025, EGU25-11538, https://doi.org/10.5194/egusphere-egu25-11538, 2025.

EGU25-12059 | PICO | BG8.7

Potential Impacts of Climate Change on Cotton Production across the United States Cotton Belt and Evaluation of Adaptation Strategies 

Srinivasulu Ale, Bhupinder Singh, Sayantan Samanta, and Edward Barnes

The United States (US) is a major producer and exporter of cotton (Gossypium hirsutum L.). The US produces about 20% of the world’s cotton and cotton production in the country is concentrated in the southern states, also known as the “Cotton Belt”. Air temperature and carbon dioxide (CO2) concentration are important abiotic factors that control the growth and development of cotton. Global climate models (GCMs) project an increase in air temperature and CO2 concentration, and changes in precipitation amounts and patterns in the future. Thus, cotton production across the Cotton Belt could face severe challenges due to projected warmer and drier future climatic conditions and changes in availability of irrigation water. The objective of this study was to investigate the effects of climate change on cotton production across the US Cotton Belt and develop appropriate adaptation strategies for sustaining cotton production in the future using the DSSAT CROPGRO-Cotton model.

Five sites across the Cotton Belt including Maricopa in Arizona, Lubbock and Chillicothe in Texas, Camilla in Georgia, and Lewiston-Woodville in North Carolina were selected for this study. The latest Coupled Model Intercomparison Project Phase 6 (CMIP6) climate projections of nine GCMs from 1950 to 2100 were obtained for the study sites for four Shared Socioeconomic Pathway (SSP) scenarios: SSP1-2.6, SSP2-4.5, SSP3-7.0, and SSP4-8.5. Data was categorized into four time periods: Historic (1950-2014), Near-future (2015-2040), Mid-century (2041-2070), and Late-century (2071-2100) to assess the effects of projected climate change on seed cotton yield and irrigation water requirement at the study sites. Modifications to planting date and row spacing were evaluated as potential climate adaptation strategies.

Results indicated that the simulated irrigated seed cotton yield is expected to increase within a range of 10-24% at all sites, except at arid Maricopa site, where irrigated seed cotton yield is simulated to decrease within a range of 24-60%.  While the negative effects of projected increases in already higher temperatures dominated the positive effects of CO2 fertilization at Maricopa site, the opposite effects were found at the remaining four sites. The future irrigation requirement is expected to increase at all sites within a range of 4-30% to meet higher evapotranspiration requirements due to projected warmer and drier climates. Identified potential climate adaptation strategies differed across the study sites. For example, mid-season cotton planting in a narrow row spacing (75 cm) was found to be a promising climate adaptation strategy to improve irrigated seed cotton yield at Halfway while an early planted cotton with wide row spacing (100 cm) was found to be the most promising strategy for Maricopa. Findings from this study will be useful to US cotton producers in modifying agronomic practices conducive to cotton growth and development under projected future changes in climate.

How to cite: Ale, S., Singh, B., Samanta, S., and Barnes, E.: Potential Impacts of Climate Change on Cotton Production across the United States Cotton Belt and Evaluation of Adaptation Strategies, EGU General Assembly 2025, Vienna, Austria, 27 Apr–2 May 2025, EGU25-12059, https://doi.org/10.5194/egusphere-egu25-12059, 2025.

Research on the impacts of climate change on crop yield is necessary for improving agricultural management practices and increasing crop adaptability to climate change. Future climate change not only alters long-term climate trends but also changes the amplitude of their fluctuations. Currently, there is a lack of studies that comprehensively consider the effects of climate trend and fluctuation on crop yield. The North China Plain is the largest wheat producing area in China, this study utilizes the DSSAT crop model to analyzes the impacts of future climate trends and climate fluctuations on winter wheat yields in the North China Plain, explores the dominant climatic factors affecting irrigated and rainfed winter wheat in the North China Plain under different climate scenarios in the future and proposes feasible recommendations for management options to cope with climate change with a view to guaranteeing food security. It was found that winter wheat yield in the North China Plain increased by 1.5% in the 2030s and decreased by 13.4% in the 2080s. The main reason for the decrease was the increase in the future temperature trend, which could lead to an average potential decrease of 8.4 %, and the increase in precipitation in the future could play an alleviating role. Irrigated and rainfed agriculture respond differently to climate change, with future temperatures dominating yield reduction changes in irrigated winter wheat and precipitation dominating yield increase changes in rainfed winter wheat. Delaying the sowing date of winter wheat and increasing field fertility can effectively mitigate the negative effects of temperature increases, whereas the mitigation effect of increasing irrigation is limited. In the future, we should pay attention to the potential threat of high temperatures and heat damage to winter wheat planting, and rationally use regional climate resources to guide agricultural production.

How to cite: Hu, J., Li, Y., and Shi, P.: Assessment of the impact of future climate trend and fluctuation on winter wheat yield in the North China Plain and exploration of adaptation strategies, EGU General Assembly 2025, Vienna, Austria, 27 Apr–2 May 2025, EGU25-12356, https://doi.org/10.5194/egusphere-egu25-12356, 2025.

EGU25-12648 | PICO | BG8.7

HOLOS-IE: A System Model for Assessing Carbon Emissions and Balance in Agricultural Systems 

Mohammad Ibrahim Khalil, Badhan Sen, Mahjabin Siddque, Tasos Chatzichristou, Aaron McPherson, Shakeef Rakin, Jonathan Herron, Roland Kröbel, Bruce Osborne, and Rem Collier

Agriculture significantly contributes to greenhouse gas (GHG) emissions, mainly via enteric and manure methane (CH4) from livestock and fertilizer-induced nitrous oxide (N2O) from soils. Mitigation strategies include dietary changes, feed additives, and fertilisation with circularity approaches. Agroforestry further offsets GHGs through carbon sequestration (soil and biomass) while enhancing soil health and ecosystem services. Achieving carbon-neutral farms by 2050 requires sustainable agricultural transformation. System-based modelling is crucial for understanding agriculture, supporting informed decision-making, and balancing data needs. HOLOS-IE, evolving into HOLOS-EU, simplifies complex modelling for farmers and stakeholders, empowering them to reduce their environmental footprint and achieve sustainable production.

The HOLOS-IE v3.0 (www.ucd.ie/holos-ie) utilises large datasets, evidence-based algorithms, GIS, Machine Learning, and C#.NET coding. The ongoing development focuses on refining model components (crops, grasses, livestock, agroforestry and farm infrastructure), and their sub-components. These components are driven by key soil, climate and relevant variables, which are automated or user-defined inputs. As a case study, HOLOS-IE was applied to a 30-hectare Irish dairy farm to explore agroforestry scenarios (silvopastoral systems with Oak and Sycamore hedgerows) by sparing 5% of land without reducing livestock density. The model predicted sectoral GHG emissions, carbon removal, and total/net carbon balance, quantifying soil and biomass carbon sequestration. This analysis highlighted the offsetting potential and provided insights into total and net carbon balances, guiding future land-use planning for climate change mitigation.

The model successfully simulated GHGs, soil organic carbon (SOC), biomass carbon, and farm energy. On the dairy farm, the main GHG contributors were enteric CH4 (76%, 5148 tCO2eq ha-1), direct N2O (13%), and manure CH4 (9%), with indirect N2O contributing 2%, respectively. SOC density in grassland increased by 0.16 t C ha-1 y-1 over 23 years. After introducing silvopasture, grassland GHG contributions remained similar, but SOC density in the tree zone increased, especially in hedgerows. Silvopasture and hedgerows, covering 5% of the land, offset 19% of the farm’s carbon footprint without reducing livestock density, supporting future steps toward carbon neutrality.

This paper introduces HOLOS-IE as a foundational step towards the development of HOLOSEU. As the model is still under development, a relatively comprehensive scenario demonstrating how to achieve carbon neutrality including soil health indices, production metrics, cost-benefit analyses and maintaining profitability on a dairy farm will be presented at the conference. Feedback from stakeholders will be gathered to guide further improvements, followed by validation and calibration.

The HOLOS-IE project is funded by the Science Foundation Ireland (Currently Research Ireland) through the Gov.ie and the ECRRF (Grant No. 22/NCF/FD/10947) in collaboration with ReLive and HOLOSEU funded by Transnational ERA-NET and ICT-AGRI-FOOD, respectively through the Department of Agriculture, Food and the Marine, Ireland.

How to cite: Khalil, M. I., Sen, B., Siddque, M., Chatzichristou, T., McPherson, A., Rakin, S., Herron, J., Kröbel, R., Osborne, B., and Collier, R.: HOLOS-IE: A System Model for Assessing Carbon Emissions and Balance in Agricultural Systems, EGU General Assembly 2025, Vienna, Austria, 27 Apr–2 May 2025, EGU25-12648, https://doi.org/10.5194/egusphere-egu25-12648, 2025.

EGU25-13837 | ECS | PICO | BG8.7

Modeling impacts of food and fertilizer trade disruptions on global food security 

Pavel Kiparisov and Christian Folberth

Geopolitical tensions are increasingly affecting global trade in food and essential agronomic inputs such as fertilizers. This imperils food production and security in import-dependent countries. Major disruptions, such as armed conflicts or the formation of isolated political blocs, are expected to further disrupt bilateral trade as countries tend to save resources for their own populations or because of the destruction of trade infrastructure. Countries not directly involved in such conflicts may also choose to stop exporting and start stockpiling products as a precautionary measure. This will create a situation where the global trade network will be fragmented.

This study estimates the consequences of such trade disruptions on fertilizer supply and food security through network analysis and statistical modeling using global data on food and fertilizer trade, fertilizer inputs, and crop yields. We consider several hypothetical scenarios, including a military conflict between major military alliances, political separation into major (emerging) blocs, economic scenario, where the world is divided into Global North and Global South, and stochastic scenarios that model probable division into groups based on the structure and intensity of historical trade between partners through community detection in graphs. A first prototype considers major staple crops: rice, wheat, maize, potato, and cassava.

The results demonstrate that in the event of a political, military, or economic separation that disrupts trade, Non-Aligned and Global South countries will experience dramatic reductions in the availability of certain critical crops and fertilizers, with losses of more than 25 percent compared to uninterrupted supplies in 2022. In the military scenario, Non-Aligned nations will be most sensitive to the decline in maize, wheat, and fertilizer, while in the political scenario, access to maize, potatoes, rice, and wheat will be problematic. The economic scenario shows drops in availability of maize, rice, cassava, wheat, and fertilizer for the Global South block. Military alliances, political blocs, and Global North countries have limited supplies of at least two critical crops in every scenario, but their losses are less disruptive (excluding cassava, which is expected to decline by 95 percent in the Global North). For all groups of countries, the drops in food supply are compounded by a further reduction in expected agricultural output due to the loss of fertilizer supplies. Stochastic network simulations generally provide more balanced scenarios as they are based on interwoven historical trade data. Further research will refine the results using process-based crop modeling and explore scenarios for improving the resilience of the global food system.

How to cite: Kiparisov, P. and Folberth, C.: Modeling impacts of food and fertilizer trade disruptions on global food security, EGU General Assembly 2025, Vienna, Austria, 27 Apr–2 May 2025, EGU25-13837, https://doi.org/10.5194/egusphere-egu25-13837, 2025.

EGU25-14778 | PICO | BG8.7

Daycent model performance to simulate yield and soil carbon across diverse soil management practices in several long-term experiments 

Abiola Saliu, Florent Levavasseur, Genis Simon-Miquel, Marcel van der Heijden, Moritz Reckling, Raphaël Wittwer, and Magdalena Necpalova

Agricultural systems are a major source of greenhouse gas emissions, contributing significantly to global climate change. As the demand for food increases, there is a need to identify sustainable soil management practices that minimize environmental impacts while maintaining or enhancing crop productivity. The Daycent model is a useful tool for simulating ecosystem responses to changes in soil management and climate change. In this study, we calibrated Daycent using yield and soil carbon data collected from five long-term ongoing experiments (PROspective and QualiAgro sites in France, V4 and V140 in Germany, FAST in Switzerland) involving various soil management practices and covering different pedoclimatic conditions across Europe, with the aim of upscaling the impacts of these practices. The treatments in these experiments include conventional to reduced tillage, addition of organic and mineral fertilizers, and the use of cover crops. Data from each experiment was split by treatment into two parts, the calibration dataset and the validation dataset. The Daycent model performance to simulate yield and soil carbon was evaluated by comparing simulated data with measured data using statistical indicators, e.g., rRMSE and R2. Calibration dataset allowed for adjusting relevant parameters according to the calibration protocol. In model evaluation against the validation dataset across all sites, rRMSE ranged from 0.29 to 0.60 for yields, and from 0.03 to 0.14 for soil organic carbon stock. The R2 values indicate that the Daycent model predicted 84% and 99% of the measured variability in yields and soil carbon stock, respectively across the sites, which implies that the model was able to capture the overall variability due to management and pedoclimatic conditions. This study demonstrates that the Daycent model can simulate yields and soil organic carbon in long-term field experiments with diverse soil management practices across different pedo-climatic conditions and can be used for the upscaling of these practices to the regional scale. However, the model needs to be further calibrated to effectively simulate yields across these sites to avoid under- or over-estimation. This research is a part of ClimateCropping project developed in the framework of the EJP for SOIL “Towards climate-smart sustainable management of agricultural soils” funded by the European Union Horizon 2020 research and innovation programme.

How to cite: Saliu, A., Levavasseur, F., Simon-Miquel, G., van der Heijden, M., Reckling, M., Wittwer, R., and Necpalova, M.: Daycent model performance to simulate yield and soil carbon across diverse soil management practices in several long-term experiments, EGU General Assembly 2025, Vienna, Austria, 27 Apr–2 May 2025, EGU25-14778, https://doi.org/10.5194/egusphere-egu25-14778, 2025.

Agriculture is one of the largest sectors in terms of human land and water use, occupying over 38% of the Earth’s ice-free land surface and 80% of the global human water footprint. In addition, various scenarios project a continuous expansion of agricultural land use at least until the 2050s, therefore emphasizing the growing importance of agriculture as a major channel of human influence on the Earth system. At the same time, urbanization and declining rural populations, accompanied by economic growth, suggest a potential decrease in the share of agricultural employment within the labor market. In this study, we introduce agricultural workforce availability, in addition to environmental suitability and policy, into the projection of future potential cropland supply and compare it with the projections of future cropland demand. A simple model framework was developed to project workforce-available cropland area, which includes the estimation of potential agricultural workforce and technological advancements. Under the SSP1-RCP2.6 scenario, environmentally cultivable land is projected to remain underutilized due to limitations imposed by workforce availability, while under the SSP5-RCP8.5 scenario, the global cultivation capability is expected to exceed environmentally cultivable land area by the 2080s. Under both scenarios, total potential cropland supply is projected to surpass the cropland demand globally. On the other hand, regional insufficiencies in the potential cropland supply are anticipated. For instance, under the SSP1-RCP2.6 scenario, a group of high-latitude nations is expected to face a 10% shortfall in potential cropland supply by the 2050s, which is projected to decrease to 5% by the end of the 21st century. Even under the SSP5-RCP8.5 scenario with the fast technological advancements, Brazil is expected to have 20% deficiency in potential cropland supply throughout the century. The results of this study suggest that there is room for improvement in the cultivable land area as input dataset for Earth system simulation models. Additionally, it highlights regions where technological investments are necessary to meet current projections of cropland demand.

How to cite: Lee, H. and Kim, H.:  Evaluation on Future Potential Cropland Supply with Considering Agricultural Workforce Availability , EGU General Assembly 2025, Vienna, Austria, 27 Apr–2 May 2025, EGU25-15799, https://doi.org/10.5194/egusphere-egu25-15799, 2025.

EGU25-15806 | ECS | PICO | BG8.7

Sustaining livestock in Mongolia through integrated livestock–vegetation modelling 

Jonas Van Laere, Wolfgang Traylor, and Thomas Hickler

The Mongolian Steppe Ecosystem is a highly vulnerable system, prone to degradation, driven in part by increasing livestock densities. While reducing livestock numbers is often suggested to alleviate pressure on grasslands, there remains a lack of tools for projecting forage availability, potential livestock densities, and the utilization of net primary productivity (NPP) into the future. Such tools could provide valuable guidance for developing effective policies and sustainable management strategies.

To address this gap, we employed a Dynamic Global Vegetation Model (DGVM), LPJ-GUESS, adapted with a daily allocation scheme for grasses, to which we added a simplified livestock submodule to simulate the effects of grazing on aboveground biomass. Forage availability was modeled using historical climate data (ERA5-Land, 0.1° resolution), while NPP utilization was assessed by comparing model runs with and without observed livestock numbers included. Using an iterative approach, potential livestock densities were determined as the maximum densities at which forage sufficiency was maintained over the period from 1970 to 2023.

Our results show a reasonable alignment between LPJ-GUESS modeled GPP and NPP, and GOSIF GPP as well as MODIS NPP. We show spatially explicit utilisation rates and compared actual livestock densities with potential densities, revealing areas of overutilisation that to some extent agree with degradation patterns. When combined with future climate projections, this approach offers a valuable tool for stakeholders and policymakers aiming to sustain the ecological balance and productivity of the Mongolian Steppe under changing climate and grazing scenarios.

How to cite: Van Laere, J., Traylor, W., and Hickler, T.: Sustaining livestock in Mongolia through integrated livestock–vegetation modelling, EGU General Assembly 2025, Vienna, Austria, 27 Apr–2 May 2025, EGU25-15806, https://doi.org/10.5194/egusphere-egu25-15806, 2025.

EGU25-15965 | ECS | PICO | BG8.7

How has climate variability affected regional crop production across Europe in the last 30 years? 

Ludovic Harter, Rasmus Einarsson, and Julia Le Noë

Nitrogen plays a fundamental role in agri-food systems, as the primary component of proteins, a key limiting soil nutrient, and a significant driver of environmental pollution. The Generalized Representation of Agri-Food Systems (GRAFS; Billen et al., 2014) model provides a comprehensive and robust framework for quantifying nitrogen flows across regional, national, or continental scales. By employing a metabolic approach to analyze nitrogen dynamics, GRAFS enables detailed diagnostic assessments of historical and current trends in crop production linked to socio-technical, pedological, and climatic variables. The predictive capacity of this approach yet remains limited by the lack of explicit incorporation of climatic drivers on N flows, particularly those related to crop harvest.

Utilizing a newly compiled annual dataset from 1990 onwards, the model offers high-resolution diagnostics across Europe, capturing spatio-temporal variability across 127 subnational regions. This study focuses on quantifying the influence of climatic variables on the historical evolution of arable crop yields. The methodology is based on an empirical relationship between total nitrogen yields at the crop-rotation scale and total nitrogen inputs from synthetic fertilizers, manure, biological fixation, and atmospheric deposition. This yield response to nitrogen fertilization follows a hyperbolic curve characterized by a single parameter (Ymax; Lassaletta et al., 2014), representing the theoretical maximum yield for a given territory. 

We analyze the temporal evolution of this parameter for the 127 European regions in relation with shifts in climate-related factors, including precipitation, water balance, temperature, and extreme weather events. We establish a relationship between climatic variables and shifts in the Ymax value, which characterizes the yield-fertilization relationship. Our results provide foundation for developing prospective scenarios addressing the combined effects of climate change and transformations in agricultural systems on agronomic and environmental performances of food systems.


Reference

Billen, G., Lassaletta, L., Garnier, J., 2014. A biogeochemical view of the global agro-food system: Nitrogen flows associated with protein production, consumption and trade. Glob. Food Sec. 3, 209–219. https://doi.org/10.1016/j.gfs.2014.08.003.

Lassaletta, L., Billen, G., Grizzetti, B., Anglade, J., Garnier, J., 2014. 50 year trends in nitrogen use efficiency of world cropping systems: the relationship between yield and nitrogen input to cropland. Environ. Res. Lett. 9. https://doi.org/10.1088/1748-9326/9/10/105011.

How to cite: Harter, L., Einarsson, R., and Le Noë, J.: How has climate variability affected regional crop production across Europe in the last 30 years?, EGU General Assembly 2025, Vienna, Austria, 27 Apr–2 May 2025, EGU25-15965, https://doi.org/10.5194/egusphere-egu25-15965, 2025.

EGU25-16002 | ECS | PICO | BG8.7

Predicting future food loss and waste patterns under changing socio-economic conditions 

Francesco Semeria, Giacomo Falchetta, Adriano Vinca, Francesco Laio, Luca Ridolfi, and Marta Tuninetti

Food loss and waste (FLW) represent a critical challenge to global sustainability, with significant implications for food security and environmental conservation. As about one third of the food that is produced is lost or wasted along the value chain, water, land and energy resources employed in its many stages (e.g., production, transformation, storage) are wasted together with it. Despite extensive research on this topic, a significant gap remains in understanding how FLW will evolve in the future, particularly under the influence of key drivers such as economic development, urbanization, and access to electricity. Changes in FLW patterns have far-reaching consequences for the Water-Energy-Food Nexus, particularly in regions where local resources are already under stress. Current projections frequently employ static assumptions or simplified scenarios, overlooking the dynamic socio-economic trends that have the potential to reshape FLW profiles of countries. This limitation is especially relevant in rapidly developing regions like Sub-Saharan Africa, where present per capita FLW levels are relatively low compared to high-income regions. However, rapid socio-economic transformations in these regions have the potential to drastically alter this scenario in the near future, thereby deviating from current estimates.

In order to address these challenges, a random forest algorithm was employed, leveraging data from the FAO Food Loss and Waste Database. The integration of these data with socio-economic predictors such as GDP, urbanisation rates, and technological adoption has enabled the development of a predictive framework capable of estimating future FLW shares at the country level. The analysis reveals diverse trajectories in FLW evolution across regions. While technological advancements and increased mechanisation in agriculture and food processing may reduce supply-side losses in rapidly developing economies, there is likely to be a reciprocal increase in consumption-side waste, which could potentially offset gains achieved through technological improvements and amplify pressures on critical resources such as water, land, and energy. These findings emphasise the urgent need for the design and implementation of sustainable transformation pathways to reduce FLW generation in agri-food systems in present and future conditions, while also addressing the existing trade-offs between FLW reduction and energy security.

How to cite: Semeria, F., Falchetta, G., Vinca, A., Laio, F., Ridolfi, L., and Tuninetti, M.: Predicting future food loss and waste patterns under changing socio-economic conditions, EGU General Assembly 2025, Vienna, Austria, 27 Apr–2 May 2025, EGU25-16002, https://doi.org/10.5194/egusphere-egu25-16002, 2025.

EGU25-16450 | ECS | PICO | BG8.7

Soil and vegetation responses to biochar application in terms of its feedback on carbon sequestration under different environmental conditions – LiDELS model overview 

Mikita Maslouski, Annette Eschenbach, Christian Beer, Simon Thomsen, and Philipp Porada

Biochar application to soil shows promise for enhancing soil properties, increasing crop yields, improving water retention, and promoting carbon sequestration. While the direct effects of biochar on soil properties have been studied to some extent, the overall impact on ecosystem carbon balance remains uncertain, as field and lab studies typically do not account for interactions with vegetation. The LiDELS (LiBry-DETECT Layer Scheme) model offers a process-based approach to assess these soil-vegetation interactions and the potential for carbon sequestration in response to biochar application under diverse environmental conditions. This study presents an overview of the LiDELS model and its application to a sandy soil profile under the climate conditions of Northern Germany. LiDELS simulates the impacts of biochar on key soil functions, including water retention, thermal properties, evapotranspiration rates, and net primary production (NPP). Model validation shows strong agreement with observed data for soil moisture, temperature, and CO2 flux, confirming LiDELS’s applicability across varying soil textures, vegetation types, and biochar treatments. Results indicate that biochar application to sandy soil in Northern Germany enhances soil water availability by 35%, increases NPP by 5%, raises soil CO2 by 19%, and has nosignificant impact on soil respiration or soil temperature. LiDELS thus represents a valuable predictive tool for evaluating environmental feedback of biochar in agriculture and carbon management, supporting sustainable land use practices.

How to cite: Maslouski, M., Eschenbach, A., Beer, C., Thomsen, S., and Porada, P.: Soil and vegetation responses to biochar application in terms of its feedback on carbon sequestration under different environmental conditions – LiDELS model overview, EGU General Assembly 2025, Vienna, Austria, 27 Apr–2 May 2025, EGU25-16450, https://doi.org/10.5194/egusphere-egu25-16450, 2025.

EGU25-16514 | ECS | PICO | BG8.7

Integrating Seasonal Forecasts with Process-Based Crop Modeling for Responsive Adaptation to Food Risks in Sub-Saharan Africa 

Ignacio Saldivia Gonzatti, Hester Biemans, and Spyros Paparrizos
Understanding the impacts of climate variability on crop yields is critical for food security, particularly in Sub-Saharan Africa, where rainfed agriculture dominates and is highly sensitive to climatic changes. While process-based crop models are commonly used with long-term climate scenarios to inform transformative adaptation, integrating long-range seasonal forecasts offers an opportunity to inform short-term, responsive adaptation strategies. This study uses the LPJmL process-based hydrology-crop model with SEAS5 seasonal hindcasts as climatic inputs (temperature, precipitation, and radiation) to evaluate the skill of seasonal forecasts in predicting crop yields at lead times of one to seven months for major crops in three countries in Sub-Saharan Africa: Ghana (West Africa), Kenya (East Africa), and Zimbabwe (Southern Africa). We validate the results against the WFDE5 dataset and observed weather station data from national meteorological agencies. We calibrate LPJmL with sub-national yield data to ensure local relevance and accuracy. We use performance metrics, including cumulative probability distributions and Ranked Probability Skill Scores, to evaluate forecast reliability. By capturing interannual and intraseasonal variability, this seasonal yield forecasting can serve as an early warning system to support a range of short-term response strategies, such as agricultural measures (adjusting sowing dates, early harvest due to extreme weather events, and fertilizer application) and broader strategies that include market interventions, cash transfers, food reserve management, and food assistance programs. This study advances the integration of seasonal forecasts into process-based crop models and the use of yield forecasts for responsive adaptation strategies for food security in Sub-Saharan Africa.

How to cite: Saldivia Gonzatti, I., Biemans, H., and Paparrizos, S.: Integrating Seasonal Forecasts with Process-Based Crop Modeling for Responsive Adaptation to Food Risks in Sub-Saharan Africa, EGU General Assembly 2025, Vienna, Austria, 27 Apr–2 May 2025, EGU25-16514, https://doi.org/10.5194/egusphere-egu25-16514, 2025.

EGU25-17144 | PICO | BG8.7

Effect of upslope runoff on crop functioning under Mediterranean conditions: an analysis based on a modelling approach 

Jérôme Molénat, Rim Zitouna-Chebbi, Mariem Dhouib, Laurent Prévot, Insaf Mekki, and Frédéric Jacob

Mediterranean hilly landscapes, surface runoff is one of the main hydrological processes that redistributes water from upslope to downslope. In agricultural catchments, surface runoff causes rainfall water to transfer from upstream plots to downstream plots due to hydrological connectivity. The water thus redistributed can then infiltrate into the soil of the downstream plot, depending on the soil's infiltration capacity, thereby increasing water availability in the root zone. While the impact of hydrological connectivity on hydrological processes such as streamflow generation is well recognized, few studies evaluate its effect on crop functioning. In general, crop functioning is studied using multilocal methods that assume hydrological independence between plots, overlooking the influence of hydrological connectivity. In the development of catchment agro-hydrological models, the coupling between the crop model and the hydrological model is partly conditioned by the effect of hydrological connectivity.

The objective is to study the effect of water redistribution through runoff on crop functioning in the context of Mediterranean rainfed annual crops, using a modelling approach. A numerical experiment using the AquaCrop model was performed, considering two hydrologically connected plots. The experiment explored a range of agro-pedo-climatic conditions upstream and downstream: crop type, soil texture and depth, climate forcing, and the size of the upstream plot. Data collected over the past 25 years from the OMERE Environmental Research Observatory in northeastern Tunisia (Molénat et al., 2018) were used, along with data from the literature. The Aquacrop model was previously parametrised and validated for the soil, crop and climate conditions of this in northeastern Tunisia site (Dhouib et al., 2022).

Results show that annual crop production under semi-arid and subhumid climatic conditions can be increased due to hydrological processe in a moderate number of cases (16% for wheat and 33% for faba bean on average for above-ground biomass and yield) (Dhouib et al., 2024). Positive impacts are mainly observed for higher soil water retention capacity and under semi-arid and dry subhumid climate conditions, with a significant effect of the intra-annual distribution of rainfall in relation to crop phenology.


Dhouib M., Zitouna-Chebbi R., Prevot L., Molénat J., Mekki I., Jacob F. (2022). Multicriteria evaluation of the AquaCrop crop model in a hilly rainfed Mediterranean agrosystem. Agricultural Water Management, 273, 107912, https://dx.doi.org/10.1016/j.agwat.2022.107912

Dhouib M, Molénat J., Prevot L., Mekki M, Zitouna-Chebbi, C et Jacob F.. Numerical exploration of the impact of hydrological connectivity on rainfed annual crops in Mediterranean hilly landscapes. Agronomy for Sustainable Development, 2024, 44 (6), 51 p. ⟨10.1007/s13593-024-00981-5⟩. ⟨hal-04752688⟩

Molénat J., Raclot D., Zitouna R., et al., 2018. OMERE, a long-term observatory of soil and water resources in interaction with agricultural and land management in Mediterranean hilly areas. Vadose Zone journal, 17(1), doi:10.2136/vzj2018.04.0086

How to cite: Molénat, J., Zitouna-Chebbi, R., Dhouib, M., Prévot, L., Mekki, I., and Jacob, F.: Effect of upslope runoff on crop functioning under Mediterranean conditions: an analysis based on a modelling approach, EGU General Assembly 2025, Vienna, Austria, 27 Apr–2 May 2025, EGU25-17144, https://doi.org/10.5194/egusphere-egu25-17144, 2025.

Abstract _ 

Crop protection covers are increasingly a necessary tool to face the increasing abiotic stresses under climate change, threatening both fruit quality and yield. Cover systems have been widely studied as they can modify the microclimate and consequently the ecophysiological responses of the crops growing underneath. The effects of covers on the propagation of radiation below the covers is crucial in determining the plant microclimate. Also the training system affects the canopy radiative regime via modifying the plant structural properties. Finally, the meteorological conditions and latitude affect the available radiation, resulting in very context specific modification of the microclimate.

In this study a 3D radiative transfer model (Discrete Anisotropic Radiative Transfer, DART) was used to represent the light propagation across a cherry orchard covered by a rain exclusion net.

The cherry orchard was represented by the repetition in all directions of a single tree, covered by a rain exclusion screen and in absence of covers. The DART scene was characterized by geometrical properties of the tree and the rain exclusion net, measured in the orchard, which were used for model calibration. The trunk and canopy volumes were described as a trapezoids based on trunk diameter and height, and crown dimensions, while the leaves as triangles with a certain leaf angle distribution.

The cherry tree canopy and cover were optically characterized based on spectrophotometric measurements, while the soil based on DART optical libraries. Field measured values of top of the canopy global short wave radiation recorded around noon were used as input for simulation of light propagation. The angles of incident sun rays were determined by DART starting  from time (date, local time zone) and scene location. The simulated radiation values obtained at three canopy heights were then were compared with ceptometer measurements performed at the same time. Following, sequence of simulations were run to obtain the spatial and temporal variations in light propagation during the growing season.

To the authors knowledge, this is the first application of a 3D radiative model on covered orchard systems. The proposed approach can give important insights into the effects of canopy covers on the radiative regime across climatic and context specific conditions. Considering the increasing use of covers to protect crops from climate change, the proposed approach may possibly contribute to drive agricultural advisers and farmers to more aware selections of the type of cover, according to their features.

The study was funded by the PRIN CHOICE project (Optimizing CHerry physiOlogIcal performanCE
through the correct choice of multifunctional covers


How to cite: Destefanis, C. and Reyes, F.: Unravelling the effect of tree protection covers on the propagation of radiation within a cherry tree canopy, EGU General Assembly 2025, Vienna, Austria, 27 Apr–2 May 2025, EGU25-18534, https://doi.org/10.5194/egusphere-egu25-18534, 2025.

EGU25-19244 | ECS | PICO | BG8.7

copan:LPJmL: A new hybrid DGVM-based modeling framework for dynamic land use and agricultural management 

Jannes Breier, Christoph Müller, Luana Schwarz, Hannah Prawitz, Werner von Bloh, Max Bechthold, Dieter Gerten, and Jonathan Donges

Dynamic global vegetation models have been established as a useful tool in environmental and agricultural sciences for many purposes, e.g. modeling crop growth, fire disturbances, or biosphere-climate interactions. Nevertheless, DGVMs are often very limited in terms of interactions with the anthroposphere, particularly human-Earth interactions. DGVMs such as LPJmL have been successfully connected to integrated assessment models such as Remind-MAgPIE or IMAGE. Still, the model coupling of those approaches often remains loose and static over the simulation period. copan-LPJmL addresses this issue by providing a standardized Python interface, consisting of the LPJmL coupler extension and the pycoupler, that can be used to exchange LPJmL inputs and outputs annually during the simulation period. In addition to LPJmL and the coupling interface, copan:LPJmL also integrates the world-earth modeling framework copan:CORE, which provides useful standardized abstractions of key entities of such models as the world (the simulation space as a whole), the cell, or the individual (an agent in agent-based modeling (ABM)). With copan:LPJmL, any LPJmL output can be retrieved at the world and cell level, and any input to LPJmL can be returned at the same level. This allows for any modeling to be carried out easily using this structure to interact with LPJmL. We here show three examples making use of this: (1) The model of Integrated social-ecological resilient land systems (InSEEDS), which uses a classical ABM approach to model management decisions by farmers, (2) an adaption of an established crop calendar model and (3) a novel LLM (Large Language model) ABM approach. These three examples show the diversity of models that can be implemented using the copan:LPJmL modeling framework to gain new insights into future potential land use and agricultural pathways in the context of global change.

How to cite: Breier, J., Müller, C., Schwarz, L., Prawitz, H., von Bloh, W., Bechthold, M., Gerten, D., and Donges, J.: copan:LPJmL: A new hybrid DGVM-based modeling framework for dynamic land use and agricultural management, EGU General Assembly 2025, Vienna, Austria, 27 Apr–2 May 2025, EGU25-19244, https://doi.org/10.5194/egusphere-egu25-19244, 2025.

EGU25-19302 | ECS | PICO | BG8.7

Estimating Rhizosphere Priming in European Agricultural Soils 

Breil L. Nicolas, Ahrens Bernhard, Wild Birgit, Hugelius Gustaf, Clivot Hugues, Lashermes Gwenaëlle, Monteux Sylvain, Kummu Matti, and Keuper Frida

The rhizosphere priming effect (RPE) is a key process where the mineralization of soil organic carbon (SOC) by microorganisms is modified by the presence and activity of plant roots compared to SOC mineralization on bare soil, increasing carbon fluxes from soils to the atmosphere. However, its magnitude in agricultural systems remains uncertain. Moreover, since the RPE is not specifically accounted for in earth system models it is a source of uncertainty in global carbon loss estimates relevant to achieve climate change targets. The PrimeSCale model offers a simple framework to quantify RPE-induced SOC respiration at large spatial scales. Here we aim to estimate the RPE in specific European croplands.

The PrimeSCale model estimates the RPE using root carbon input to the soil derived from the combination of MODIS gross primary production (GPP) and net primary production (NPP) data, root depth distribution, heterotrophic respiration, soil bulk density and soil organic carbon content. A central component of PrimeSCale is the RPE ratio, the relative increase in heterotrophic respiration induced by priming based on literature using living plants. Our analysis of the time period 2010-2020 covers six types of croplands (maize, wheat, oat, barley, legumes, and soy) across Europe at a 5 km resolution, down to a depth of 200 cm. The model outputs include the magnitude of the RPE ratio and RPE-induced SOC loss in these croplands and how they vary within Europe according to climate and crops. Our findings will enhance understanding of the processes behind carbon cycling in managed environments and provide insights for carbon-farming policies to better suit mitigation strategies.

How to cite: Nicolas, B. L., Bernhard, A., Birgit, W., Gustaf, H., Hugues, C., Gwenaëlle, L., Sylvain, M., Matti, K., and Frida, K.: Estimating Rhizosphere Priming in European Agricultural Soils, EGU General Assembly 2025, Vienna, Austria, 27 Apr–2 May 2025, EGU25-19302, https://doi.org/10.5194/egusphere-egu25-19302, 2025.

Paddy rice cultivation is a major source of methane emissions, a greenhouse gas with a relatively short atmospheric lifetime. Reducing methane emissions from rice fields offers significant potential for near-term climate change mitigation. Large rice-producing countries in tropical and subtropical regions, such as China, India, and Vietnam, commonly adopt multiple cropping systems to maximize rice yields. However, according to the IPCC Guidelines for National Greenhouse Gas Inventories (2019), continuous rice cultivation on the same land over consecutive seasons can more than double methane emissions compared to intermittent cropping. The anticipated rapid growth in the rice-consuming population, particularly in Asia, will likely drive further increases in rice demand and production. To mitigate methane emissions from rice cultivation, additional strategies are required beyond existing and emerging agronomic practices such as crop improvement and alternate wetting and drying. Here we propose a season-spatial redistribution of rice cultivation as an immediately effective strategy for reducing rice methane emissions. Using emission factors for various cropping patterns from the IPCC 2019 Guidelines and a temporal-spatial cropland cover database developed by the Taiwan Agricultural Research Institute (TARI), we computed the methane-minimizing season-spatial reallocation for a two-year period (four cropping seasons) in all townships of Yunlin, Taiwan's key rice-growing county, while keeping aggregate harvested area constant. Results indicate that the maximum methane mitigation potential for a single township could reach reductions of 12.63% in the first year, 44.31% in the second year, and 32.80% over the entire two-year period compared to scenarios without such reallocation. This reallocation strategy aligns with existing policies aimed at reducing irrigation water use and promoting self-sufficiency in non-rice staple crops. It can be implemented without incurring additional costs for subsidies or the establishment of new policies. The TARI cropland cover database, which incorporates Sentinel-2 satellite imagery, aerial photographs, and ground truth data analyzed using Geographic Information System (GIS) technologies, provides a detailed season-spatial map of crop cultivation in Taiwan, where two rice cropping seasons are feasible annually. Similar to the Crop Data Layer (CDL) database maintained by the USDA, the TARI database was originally designed for crop production forecasting. However, our study demonstrates its additional utility in informing policies to advance agricultural sustainability. With the increasing accessibility and affordability of digital imaging technologies, the proposed season-spatial reallocation approach could be adopted by other countries with multiple rice-cropping systems, complementing agronomic efforts to cut methane emissions from rice cultivation.

How to cite: Lee, H.-L. and Zhang, Y.-T.: Season-spatial redistribution of rice cultivation as an immediately effective strategy for cutting methane emissions, EGU General Assembly 2025, Vienna, Austria, 27 Apr–2 May 2025, EGU25-19626, https://doi.org/10.5194/egusphere-egu25-19626, 2025.

EGU25-19810 | PICO | BG8.7

Local impacts of climate change on winter wheat in Great Britain 

Thibaut Putelat, Whitmore Whitmore, Nimai Senapati, and Mikhail A. Semenov

Under future CMIP5 climate change scenarios for 2050, an increase in wheat yield of about 10% is predicted in Great Britain (GB) as a result of the combined effect of CO2 fertilization and a shift in phenology. Compared to the present day, crops escape increases in the climate impacts of drought and heat stresses on grain yield by developing before these stresses can occur. In the future, yield losses from water stress over a growing season will remain about the same across Great Britain with losses reaching around 20% of potential yield, while losses from drought around flowering will decrease and account for about 9% of water limited yield. Yield losses from heat stress around flowering will remain negligible in the future. These conclusions are drawn from a modelling study based on the response of the Sirius wheat simulation model to local-scale 2050-climate scenarios derived from 19 Global Climate Models from the CMIP5 ensemble at 25 locations representing current or potential wheat-growing areas in GB. However, depending on susceptibility to water stress, substantial interannual yield variation between locations is predicted, in some cases suggesting low wheat yield stability. For this reason, local-scale studies should be performed to evaluate uncertainties in yield prediction related to future weather patterns.


How to cite: Putelat, T., Whitmore, W., Senapati, N., and Semenov, M. A.: Local impacts of climate change on winter wheat in Great Britain, EGU General Assembly 2025, Vienna, Austria, 27 Apr–2 May 2025, EGU25-19810, https://doi.org/10.5194/egusphere-egu25-19810, 2025.

EGU25-19936 | PICO | BG8.7

Durum Wheat in a Changing Climate: Comparing Conservation and Conventional Practices in a Mediterranean environment 

Valentina Mereu, Antonio Trabucco, Muhammad Faizan Aslam, and Gianluca Carboni

The Mediterranean Basin is recognized as a "climate change hotspot" due to its high exposure and vulnerability to interconnected climatic risks. Agriculture in this region must not only adapt to these challenges but also contribute to mitigation goals, as it is a significant source of greenhouse gas emissions. This study evaluates the impacts of climate change on durum wheat productivity in two sites in southern Sardinian (Italy), representative of Mediterranean cereal farming, and compares conservation tillage practices (reduced tillage and no-tillage) with conventional management. Crop modelling was performed using the CSM-CERES-Wheat model, implemented in the DSSAT software, parameterized with data from two long-term experiments on conservation agriculture. Climate projections from the Euro-Cordex platform under three Representative Concentration Pathways (RCP2.6, RCP4.5, RCP8.5) were considered for future projections. Results indicate significant increases in temperatures across all scenarios, with shortened crop growing cycles and earlier maturation by up to three weeks under the most extreme scenarios. Yield variations ranged from -9% to +20% by the end of the century, influenced by the direct effect of increased atmospheric CO2 concentration on photosynthesis rate and water use efficiency. Grain yields obtained with conservation tillage practices are comparable with the values obtained with conventional practices, but with several related advantages, including reduced operational costs, time savings, and lower greenhouse gas emissions. These findings highlight the dual role of conservation agriculture as a strategy for climate adaptation and mitigation in Mediterranean cereal systems. However, further research is needed to better address uncertainties related to extreme weather, pests and diseases, and greenhouse gas emissions, to ensure sustainable agricultural productivity in the face of climate change.

How to cite: Mereu, V., Trabucco, A., Aslam, M. F., and Carboni, G.: Durum Wheat in a Changing Climate: Comparing Conservation and Conventional Practices in a Mediterranean environment, EGU General Assembly 2025, Vienna, Austria, 27 Apr–2 May 2025, EGU25-19936, https://doi.org/10.5194/egusphere-egu25-19936, 2025.

Central Asia, characterised by arid climate and water scarcity, is climate change hotspot, warming at rates above the global average. This research models how changing climatic conditions, irrigation practices, and co-produced adaptation strategies impact soybean productivity in southeastern Kazakhstan, biggest Central Asian economy. Agricultural modelling incorporated different methodologies including AquaCrop crop modeling, field data collection, in-depth interviews, surveys, and group discussions with stakeholders. AquaCrop crop model was applied to simulate the effects of stakeholder-proposed adaptation strategies and assess soybean yield sensitivity to temperature and precipitation changes under various irrigation scenarios.

For the first time in this region, the AquaCrop model was calibrated and validated for soybean using data from the 2016–2022 growing seasons, showing its suitability for local conditions. Results highlighted the importance of irrigation timing, with maximum yields achieved when irrigation was applied during flowering, pod formation, and pod filling, especially at the first two stages. Smaller irrigation applications increased water productivity by 0.93 kg/m³ and yield by 14.7 % compared to current practices. However, inadequate irrigation infrastructure emerged as a critical challenge for stakeholders. Sensitivity analysis revealed that a 2°C temperature increase reduced the growing season by 10 days due to faster accumulation of growing degree days, highlighting the need for adaptive management under a warming climate.

These findings have important implications for improving soybean production in Kazakhstan and Central Asian region. The results demonstrate the importance of holistic agricultural modeling including modeling of the effect of adaptation strategies co-produced with the stakeholders. Research carries significant implications for regional sustainable food future and food security, emphasising the need for informed adaptation  strategies to the changing environmental and economic conditions. 

How to cite: Suleimenova, S. and Lukac, M.: Is food secure in Central Asia: agricultural modelling of soybean productivity and adaptation to climate change., EGU General Assembly 2025, Vienna, Austria, 27 Apr–2 May 2025, EGU25-20344, https://doi.org/10.5194/egusphere-egu25-20344, 2025.

EGU25-20520 | ECS | PICO | BG8.7

From Crops to Carbon Sequestration: A Technology-Explicit AFOLU Module for Energy Models 

Daniele Mosso, Laura Savoldi, and Matteo Nicoli

The Paris Agreement commits 197 countries to stabilizing global average surface temperatures at less than 2 °C above pre-industrial levels. Many industrialized nations, including Italy, aim for climate neutrality by 2050 through “net zero” greenhouse gas (GHG) emissions policies, aimed at decarbonizing all the energy intensive sector. In this context, the role of agriculture, forestry, and other land use (AFOLU) sector play an ambiguous role. Challenges include balancing GHG mitigation with food security, addressing synergies with the energy sector (e.g., bio commodities), and leveraging AFOLU as a net sink to offset emissions from other sectors.

Energy system optimization models (ESOMs), as widely used to design cost-optimal decarbonization policies, can be used to determine effective AFOLU management strategies at a national level. Nevertheless, their focus on energy-intensive processes had previously limited detailed AFOLU representation, despite its prominent role in emission mitigation. ESOMs often lack the integration of natural capital constraints, such as land and water availability, as well as the ability to model specific AFOLU commodities like crops, livestock, and forest products. To address this gap, we introduce a novel AFOLU module designed to couple with ESOMs, enabling the formulation of national decarbonization scenarios incorporating a technology-explicit AFOLU representation, biophysical constraints and the possibility to evaluate climate change impacts on the sector.

The AFOLU module tracks GHG emissions from livestock, crops, and bioenergy production while optimizing sectoral contributions to national decarbonization goals. Additionally, it projects the evolution of AFOLU commodities, including shifts in crop types, livestock production, and forest management strategies in response to climate and policy drivers. Finally, it can account for biophysical constraints such as land use limitations, crop yield sensitivity to fertilizer and climate change, and forest absorption potential. The module is designed to be directly fed by the Global Agro-Ecological Zones (GAEZ) database from FAO, allowing for the automatized creation of national instances based on up-to-date geospatial datasets.

To demonstrate the utility of the module, we integrate it with the open-source energy system optimization model TEMOA, which has been validated in Italian case studies and shown coherence with established models like TIMES, and similar in structure to other ESOMs like MESSAGE, and OSeMOSYS. The integrated model evaluates Italy’s national climate mitigation plans, focusing on the interplay between energy and AFOLU sectors, including land competition for bio crop production.

Key outputs of the model include detailed accounting and optimization of AFOLU emissions, land and water use, and cost-effective decarbonization pathways for all the energy intensive sectors. For instance, scenarios explore the potential of organic farming to reduce crop-related emissions, the role of manure management in mitigating livestock emissions, and the benefits of afforestation for carbon sequestration. Preliminary results from the Italian case study reveal critical trade-offs and synergies, such as the tension between bioenergy production and food security, while identifying least-cost pathways to achieve climate neutrality.

This research bridges a critical gap in decarbonization modeling by integrating a flexible AFOLU module with energy systems, offering a reproducible framework for other national applications.


How to cite: Mosso, D., Savoldi, L., and Nicoli, M.: From Crops to Carbon Sequestration: A Technology-Explicit AFOLU Module for Energy Models, EGU General Assembly 2025, Vienna, Austria, 27 Apr–2 May 2025, EGU25-20520, https://doi.org/10.5194/egusphere-egu25-20520, 2025.

EGU25-20785 | ECS | PICO | BG8.7

Assessing potential climate smartness of agronomic practices in oil palm plantations 

Lisma Safitri, Marcelo Valadares Galdos, Iput Pradiko, Alexis Comber, and Andrew Juan Challinor
Oil palm (OP) plantations show potential for climate mitigation and adaptation, particularly in non-deforested and non-peatland areas, where carbon sinks are plausible. Agronomic practices like reduced nitrogen fertiliser combined with mechanical weeding or empty fruit bunch (EFB) application maintain yields while reduce N₂O emissions. Optimal EFB application rate and irrigation enhance soil organic carbon (SOC) and sustained photosynthesis respectively, lead to improved yields. However, most studies focus on the impact of these practices on yield, neglecting mitigation and adaptation performance under climate change.
Accordingly, this study applies the climate-smart agriculture (CSA) framework to evaluate agronomic practices in OP plantations  in North Sumatra, Indonesia. The Agricultural Production Systems sIMulator (APSIM) was used to assess seven scenarios of agronomic practices under changing climate conditions (UKESM1 and MP1 models with SSP 370 and SSP 585 pathways). Scenarios comprised: (1) business-as-usual (BAU), (2) reduced N fertiliser + 30 t ha⁻¹ yr-1 EFB, (3) reduced N fertiliser + 60 t ha⁻¹ yr-1 EFB, (4) irrigation at 10 mm deficit, (5) irrigation at 30 mm deficit, (6) irrigation at 30 mm deficit + 30 t ha⁻¹ yr-1 EFB, and (7) reduced N fertiliser + irrigation at 30 mm deficit + 30 t ha⁻¹ yr-1 EFB. Climate smartness was measured using carbon balance and two indices from the literature, based on yield, water use, greenhouse gas (GHG) emissions, and SOC stock changes.   
Results showed that irrigation is more effective than EFB application in increasing climate smartness. Irrigation scenarios resulted in increased yield, greater carbon sinks, higher water productivity, and lower GHG intensity by preventing stomatal closure during water deficits without causing an increase in emissions, and thus higher climate smartness scores. EFB application caused the smallest decline in SOC stock but led to the highest emissions, resulting in the lowest climate-smartness score. These findings highlight the effectiveness of irrigation in sustaining climate smartness, encompassing productivity and climate mitigation-adaptation in OP plantations, which has been underexplored in previous studies.

How to cite: Safitri, L., Valadares Galdos, M., Pradiko, I., Comber, A., and Challinor, A. J.: Assessing potential climate smartness of agronomic practices in oil palm plantations, EGU General Assembly 2025, Vienna, Austria, 27 Apr–2 May 2025, EGU25-20785, https://doi.org/10.5194/egusphere-egu25-20785, 2025.

EGU25-21495 | PICO | BG8.7

Towards Water-Efficient Agriculture in the Danube River Basin: Insights from Hydro-Agroecological Modelling 

Elisabeth Probst, Marianela Fader, and Wolfram Mauser

Achieving the food-related UN Sustainable Development Goals, particularly global food security and sustainable agriculture, requires sustainable intensification. This approach strives to close yield gaps by efficiently utilizing land, water, and agricultural inputs, while protecting natural ecosystems. Agriculture stands as the largest global consumer of freshwater, and its demand is expected to rise as a result of Global Change, making the enhancement of water use efficiency crucial for sustainable agriculture.

The Danube River Basin encompasses some of Europe’s most fertile regions, with its wide agricultural plains forming an important part of the continent’s breadbasket. However, agriculture in this region remains largely extensive due to insufficient resource inputs and water limitations. By adopting resource-efficient management (esp. fertilization, irrigation), yield gaps could be closed, thereby contributing to global food security. Nevertheless, in the Danube River Basin—the world’s most international river basin—20 countries and their water-using sectors are in competition for the basin’s freshwater resources.

In this presentation, we share research highlights, primarily from Probst et al. (2024), employing the mechanistic hydro-agroecological model PROMET in the Danube River Basin. PROMET integrates biophysically-based vegetation modelling and dynamic hydrological modelling at a high spatial and temporal resolution (1 km², 1 h). The model concept allows for systematic analyses of agricultural management effects (e.g. fertilization, irrigation) on crop yields, water use efficiency, and water balance through irrigation water withdrawal. This enables the identification of underutilized yield potential and hotspots of inefficient water use, facilitates understanding of inter-sectoral economic trade-offs (e.g. with hydroenergy production), pinpoints ecological impacts, and identifies opportunities for more efficient land management. Thus, this modelling approach offers valuable decision-support for both the agricultural and other sectors in the Danube River Basin.

References:

Probst, E., Fader, M. & Mauser, W. (2024): The water-energy-food-ecosystem nexus in the Danube River Basin: Exploring scenarios and implications of maize irrigation. Science of The Total Environment 914: 169405. https://doi.org/10.1016/j.scitotenv.2023.169405

How to cite: Probst, E., Fader, M., and Mauser, W.: Towards Water-Efficient Agriculture in the Danube River Basin: Insights from Hydro-Agroecological Modelling, EGU General Assembly 2025, Vienna, Austria, 27 Apr–2 May 2025, EGU25-21495, https://doi.org/10.5194/egusphere-egu25-21495, 2025.

Continental-scale research infrastructures and flux networks (e.g., AmeriFlux, AsiaFlux, ChinaFlux, ICOS, NEON, OzFlux), alongside smaller GHG flux networks and individual sites, assess CO2, CH4, and other GHG exchange, as well as evapotranspiration (ET), between ecosystems and the atmosphere. Over four decades, these flux stations have expanded to 2100+ stationary measurement points and various campaign sites, informing long-term climate modeling.

Despite the potential of these high-resolution measurements for measuring GHG emissions and ET, their applications still rarely extend beyond academia due to the perceived complexity of the method, actual complexity and cost of current instrumentation and site operation, lack of broad geographic data coverage, and absence of a comprehensive approach focused on using direct flux measurements for immediate societal benefits.

This presentation continues to address these challenges by simplifying explanations, offering detailed guides for method understanding, developing lower-cost simpler-to-use automated flux instrumentation and networks, facilitating peer-to-peer cross-sharing to reduce data gaps and station setup costs, and providing professional services for experiment design and executions. All of these allow adopting an overall approach inspired by current automated weather stations (AWS) feeding and tuning remote sensing products and resulting in weather modeling and forecasting.

In the most recent developments, in early 2025, three new guides on direct real-time dMRV/aMRV/MMRV of all carbon pools will be published. These guides aim to optimize costs, de-risk dMRV systems, create premium carbon products, develop standardized frameworks, and assist in writing protocols for carbon sequestration and credit verification. The books include:

  • Harvesting Carbon: Fields & Grasslands
  • Harvesting Carbon: Forests, Orchards, and Wooded Wetlands
  • Harvesting Carbon: Lakes, Ponds, and Wetlands

These latest publications aim to fundamentally change carbon markets by providing a direct, defensible, traceable, repeatable, real-time, evidence-based approach to quantify sequestration and emission.

The ultimate goal of this presentation is to ignite discussions on utilizing these guides and direct flux measurements at large to help practical decision-making applications to benefit society, and identify current needs, ideas, and examples for leveraging flux data in everyday decision contexts.

How to cite: Burba, G.: Direct Flux Measurements for Immediate Societal Benefits: Clear Guidance, Modern Automation, Resource Sharing, Professional Services, and Weather Station-Inspired Approach, EGU General Assembly 2025, Vienna, Austria, 27 Apr–2 May 2025, EGU25-3303, https://doi.org/10.5194/egusphere-egu25-3303, 2025.

EGU25-6116 | ECS | Posters on site | BG8.8

Decadal nitrogen deposition impacts on forest functions and ecosystem services across the Europeanof Alps 

Liangzhi Chen, Yann Vitasse, Arun Bose, Frank Krumm, Jelle Lever, Micah Wilhelm, and Arthur Gessler

Forests provide various ecosystem services (ES), including the delivery of natural resources, the regulation of atmosphere-land surface interactions, and the facilitation of social and cultural activities. However, the acceleration of climate change is increasingly threatening the sustainability of these ES by modifying essential ecological processes via biogeophysical-chemical determinants of critical processes such as fluxes of gases, water, energy, and nutrients. Atmospheric nitrogen deposition is a major air pollutant that affects forest ecosystems through nitrogen cycles. Across the European Alps, though the total nitrogen deposition has steadily decreased since the late 1980s, the present annual deposition remains at medium to high levels (on average 15 kg N/ha), while temperate forests are generally nitrogen-limited. How nitrogen deposition affects forests in the Alps, particularly in the context of reduced nitrogen deposition, is critical for anticipating future forest functions and ES. In addition, the promotion of some essential forest ES is inherently contradicting. For instance, timber production requires massive logs of standing trees, whereas mitigating abiotic disturbances and hazards generally necessitates retaining high biomass and biological diversity. Balancing forest multi-functions is, therefore, integral to ensuring better, more sustainable use of natural resources benefiting our societies in the context of rapid global change. Here, we focus on (i) building a framework to identify and integratively quantify various ES across 6000 Swiss National Forest Inventory plots; (ii) quantifying and comparing the impact of nitrogen deposition on various ES at the stand level since 1990 in a multivariate inference framework while explicitly taking into account potential spatial dependence and confounding factors using [YV1] a stochastics process embedded in the multivariate framework; (iii) quantifying the overall impact of two-decadal nitrogen deposition rates on forest multi-functionalities accounting for the synergies between each ES. Finally, we discuss the potential and conditions for transposing these impacts to other forest ecosystems.

How to cite: Chen, L., Vitasse, Y., Bose, A., Krumm, F., Lever, J., Wilhelm, M., and Gessler, A.: Decadal nitrogen deposition impacts on forest functions and ecosystem services across the Europeanof Alps, EGU General Assembly 2025, Vienna, Austria, 27 Apr–2 May 2025, EGU25-6116, https://doi.org/10.5194/egusphere-egu25-6116, 2025.

EGU25-6254 | ECS | Posters on site | BG8.8

Year-long measurements of CO2 and H2O fluxes above a vineyard in an Alpine valley 

Mira Shivani Sankar, Sebastiano Carpentari, Lorenzo Giovannini, Dino Zardi, and Nadia Vendrame

Direct CO2 and H2O flux measurements provide valuable insights into ecosystem processes and their societal benefits, such as greenhouse gas budget assessments and optimizing agricultural water management. This study presents a year-long dataset of eddy covariance flux measurements to examine the carbon and water dynamics of a vineyard ecosystem located in the Adige Valley of the Italian Alps. The vineyard trained as a pergola, with spontaneous herbaceous vegetation on the floor, employs a drip irrigation system during hot and/or dry periods. The eddy covariance station, operational since August 2023, was deployed as part of the Euregio project INTERFACE. High-frequency data were processed applying standard corrections using EddyPro® software and gap filling of 30-min fluxes was performed, enabling an investigation into the vineyard's carbon uptake and water dynamics. 

By examining these fluxes, we investigated the vineyard's capacity for carbon uptake and quantified its water use, gaining insights into its role in ecosystem dynamics. The results highlight how flux measurements can guide practical applications, such as optimizing irrigation scheduling, improving carbon budgeting, and supporting adaptive management practices to enhance agricultural sustainability. Notably, the findings suggest that the vineyard ecosystem in the Adige Valley can act as a carbon sink on an annual basis. By providing precise measurements of carbon uptake and water consumption, this research contributes to the development of equitable and science-driven solutions for reducing greenhouse gas emissions and conserving water resources in agricultural landscapes.

How to cite: Sankar, M. S., Carpentari, S., Giovannini, L., Zardi, D., and Vendrame, N.: Year-long measurements of CO2 and H2O fluxes above a vineyard in an Alpine valley, EGU General Assembly 2025, Vienna, Austria, 27 Apr–2 May 2025, EGU25-6254, https://doi.org/10.5194/egusphere-egu25-6254, 2025.

EGU25-6426 | Posters on site | BG8.8

Internet of the Environment (IoE) and Eddy Covariance-based Ecosystem Fluxes 

Frank Griessbaum, Gerardo Fratini, Sasha Ivans, Taylor Thomas, Daniel Singer, Andrew Parr, and Jason Hupp

The Internet of the Environment (IoE) represents a subset of the Internet of Things (IoT) where connected environmental monitoring sensors, that utilize edge computing and embedded power and communications, report on the state of the environment to improve scientific understanding via large-scale monitoring. 

The IoE approach offers several notable advantages compared to traditional methods:

  • It facilitates measurements in almost any location, including large-scale deployments and remote, hard-to-reach areas.
  • It supports consistent measurement techniques that are scalable from field to landscape to continental levels, all while reducing operational costs.
  • It leads to cost savings and minimizes data loss through enhanced operations, utilizing predictive maintenance powered by machine learning.
  • It integrates various external datasets into a unified cloud platform, enabling automated post-processing and advanced data analytics.

This presentation covers the integration of an eddy covariance (EC) sensor with an IoE Module, transforming it into a node within the IoE system. Other sensors, measuring different environmental parameters, can serve as additional nodes.

Once the data from these nodes is transmitted to the cloud, it can be utilized for automated quality assurance/quality control, gap filling, forecasting, accumulation, and spatial extrapolation, leveraging external datasets and statistical/machine learning tools.

This integration enables users to construct dynamic virtual networks of real measurements from various research sites and nodes, facilitating scientific research and fostering collaboration between institutions and groups.

An illustrative example of this approach is presented through a network of actual evapotranspiration EC sensors, which collect flux data across diverse irrigated and rain-fed agricultural landscapes for immediate societal applications.

How to cite: Griessbaum, F., Fratini, G., Ivans, S., Thomas, T., Singer, D., Parr, A., and Hupp, J.: Internet of the Environment (IoE) and Eddy Covariance-based Ecosystem Fluxes, EGU General Assembly 2025, Vienna, Austria, 27 Apr–2 May 2025, EGU25-6426, https://doi.org/10.5194/egusphere-egu25-6426, 2025.

EGU25-6552 | ECS | Posters on site | BG8.8

Virtual Tall Towers: First test results for the German Integrated Greenhouse Gas Monitoring System 

Lediane Marcon-Henge, Alexander Graf, Marius Schmidt, Dagmar Kubistin, Matthias Lindauer, Jennifer Müller-Williams, Patrizia Ney, Anne Klosterhalfen, Matthias Peichl, and Harry Vereecken

Continuous accurate monitoring of greenhouse gas concentrations on a large number of tall towers (TT, approximately 100 m above ground level and higher) is increasingly becoming a tool to independently quantify regional emissions (top-down approach). However, installing or finding and equipping tall towers is costly. To densify the existing monitoring network as efficiently as possible, a secondary use of existing eddy-covariance flux stations (EC, typically 2 to 50 m above ground level depending on plant canopy height) as “virtual tall towers” (VTT) has been suggested. The basic idea is that the additional flux and turbulence information available at an EC station can be utilised to correct the near-surface concentration measurement, which is heavily influenced by local sinks and sources, towards an estimate that is more representative of the well-mixed part of the atmospheric boundary layer, and thus more indicative of regional emission sources. In the framework of the ITMS (https://www.itms-germany.de/) project, we aim to evaluate the feasibility of such methods on selected pairs of existing EC and TT stations in the ICOS (https://www.icos-cp.eu/) network. For this the EC gas analyzer needs to be calibrated directly or indirectly to the same reference as the TT gas analyzer, which is not commonly the case. Our first tests comprise one pair of an EC (DE-RuS, 2.5 m measurement height) and TT (AS-Jue, 120 m) stations approximately 5.6 km apart in Germany, as well a second pair on a single, tall tower in Sweden (SE-Svb) where EC measurements and shallow TT measurements are available on the same level (35 m). This latter unique situation allows us to estimate the higher TT measurement on the same tower (150 m) without requiring an additional calibration of the EC sensor. Together, the two test cases allow to separate calibration and spatial representativity issues on the one hand, from the actual VTT performance on the other hand. Our first results indicate that accurate, stable calibration at EC sites is crucial but difficult to achieve. In addition to an existing VTT technique (Haszpra et al. 2015), we also test a novel approach based on conditional sampling of eddies carrying air characteristic of the atmospheric boundary layer, building up on earlier work with temperature measurements (Graf et al. 2010).

Haszpra, L., Barcza, Z., Haszpra, T., Patkai, Z. and Davis, K.J., 2015. How well do tall-tower measurements characterize the CO2 mole fraction distribution in the planetary boundary layer? Atmospheric Measurement Techniques, 8(4): 1657-1671. https://doi.org/10.5194/amt-8-1657-2015

Graf, A. et al., 2010. Boundedness of Turbulent Temperature Probability Distributions, and their Relation to the Vertical Profile in the Convective Boundary Layer. Bound.-Layer Meteor., 134(3): 459-486. https://doi.org/10.1007/s10546-009-9444-9

How to cite: Marcon-Henge, L., Graf, A., Schmidt, M., Kubistin, D., Lindauer, M., Müller-Williams, J., Ney, P., Klosterhalfen, A., Peichl, M., and Vereecken, H.: Virtual Tall Towers: First test results for the German Integrated Greenhouse Gas Monitoring System, EGU General Assembly 2025, Vienna, Austria, 27 Apr–2 May 2025, EGU25-6552, https://doi.org/10.5194/egusphere-egu25-6552, 2025.

Quantifying carbon and water dynamics as well as their interaction (water use efficiency: WUE) fluxes will help in evaluating alternate irrigation practices. This study is aimed at understanding the role of two partial root zone drying irrigation methods practiced in two dominant soils (red sandy and black cotton) on WUE dynamics observed at two spatial scales, i.e. leaf and plant. To achieve this, maize plants were grown in controlled pots for two seasons (monsoon and winter) with three irrigation treatments i.e. conventional irrigation (CI), alternate partial root zone drying irrigation (APRD) and fixed partial root zone drying irrigation (FPRD) in two soils, i.e. red sandy soil and black cotton.  Leaf gas exchange parameters such as: net CO2 assimilation rate (An), stomatal conductance (gs), transpiration (Tr), vapor pressure deficit of leaf (VPDL), and leaf temperature (Tleaf) were monitored along with the plant parameters such as: biomass, soil moisture and leaf area index (LAI). Results showed that highest WUEL of 272.76± 20.51 µmol CO2 mol-1 H2O is observed with APRD irrigation in red sandy soils which is 1.2 to 1.33 times higher than in black cotton soils. At plant level, biomass in black cotton soils is 1.67 to 1.70 times higher than in red sandy soils. In contrast, water consumption in back cotton soils was 1.70 to 1.72 times higher than in red sandy soils. Red sandy soils showed a higher WUEP of 197± 10.5 g L-1. Stomatal conductance, leaf temperature and vapor pressure deficit of leaf are found to be the controlling drivers of WUEL.  Similarly, irrigated water and leaf area index are found to be the key drivers of WUEP. Results conclude that, APRD irrigation can significantly improve WUE both at leaf and plant scales. Of the two soils, red sandy soils outperformed in achieving higher WUE at both spatial scales. Our results concluded that consideration irrigation practices, and soil characteristics is indispensable for accurate and simultaneous characterization of WUE.

How to cite: Chintala, S. and kbvn, P.: Dynamics of carbon, water, and water use efficiency (WUE) fluxes for Maize crop under partial root zone drying irrigation, EGU General Assembly 2025, Vienna, Austria, 27 Apr–2 May 2025, EGU25-7139, https://doi.org/10.5194/egusphere-egu25-7139, 2025.

EGU25-7305 | Posters on site | BG8.8

A Cloud-Based Post-Processing Pipeline for Eddy Covariance Flux Datasets: From Actual Evapotranspiration Measurements to Spatial Water Balance 

Taylor Thomas, Tyler Barker, Gerardo Fratini, Jason Hupp, George Burba, Frank Griessbaum, Kunal Kshatriya, and Erich Roth

Eddy covariance stations collect in situ high frequency (10 Hz) measurements of wind speed and direction in three dimensions alongside high frequency (10 Hz) measurements of water vapor concentration. Raw high frequency data undergo processing onboard field-deployed sensor systems to provide flux measurements at 30-minute averaging intervals. The processed flux data are then transmitted via message queue telemetry transport (MQTT) to a cloud-based platform where post-processing can occur. This presentation provides an overview of a post-processing pipeline built on 30-minute fluxes and ancillary meteorological data inputs to arrive at cleaned and gap-filled evapotranspiration fluxes over multiple timeframes. The steps to arrive at these intermediate data products include physically plausible threshold detection, quality-control based on error condition for the flux averaging interval, statistical outlier detection, and gap filling using the marginal distribution sampling (MDS) method. Drivers for MDS gap filling shown include vapor pressure deficit (VPD), incoming shortwave radiation (SWin), and air temperature (Tair). Accumulated fluxes are then spatialized based on the flux footprint associated with the accumulation period, using inputs from flux sensors and global weather models as well as ancillary remote sensing multispectral imagery from the European Space Agency (ESA) Sentinel2 constellation. The provenance associated with this pipeline is available to promote scientific reproducibility.

How to cite: Thomas, T., Barker, T., Fratini, G., Hupp, J., Burba, G., Griessbaum, F., Kshatriya, K., and Roth, E.: A Cloud-Based Post-Processing Pipeline for Eddy Covariance Flux Datasets: From Actual Evapotranspiration Measurements to Spatial Water Balance, EGU General Assembly 2025, Vienna, Austria, 27 Apr–2 May 2025, EGU25-7305, https://doi.org/10.5194/egusphere-egu25-7305, 2025.

EGU25-8435 | Orals | BG8.8

Exploiting a natural disaster for a comprehensive evaluation of different ecosystem recovery strategies: the example of Castelporziano network 

Gabriele Guidolotti, Dario Papale, Michele Mattioni, Giacomo Nicolini, Simone Sabbatini, Giulia Bonella, Carlo Calfapietra, Giorgio Matteucci, and Giuseppe Scarascia Mugnozza and the CastelPorziano Presidential Natural Reserve Research Team

Costal pine Italian forests, like mostly monospecific plantations, are much more vulnerable than natural and multi-specific stands. This fragility was completely expressed in the Castelporziano Presidential Natural Reserve in Italy (west coast of central Italy), where, in only 6 years, the combined action of the alien pathogens Toumeyella parvicornis with the native one Tomicus destruens led to the disappearance of the stone pines (Pinus pinea L.) that were covering more than 250 hectares of monospecific stands. The subsequent removal of standing dead trees left large open areas where various ecosystem restoration strategies can be applied including reforestation to natural recolonization and different options for grazing control. An ICOS station was already present inside the natural reserve and now, thanks to the fruitful collaboration of three European Research Infrastructures (ICOS, eLTER and LifeWatch), five additional monitoring plots will be established. At moment of the present abstract submission three station plots have been already implemented and started to measure in mid-August 2024, while the other two are under implementation with the start of the measurements planned for spring 2025. The different plots, covering each a different post-pine option with a different ecosystem structure, are all equipped with an eddy covariance system for CO2, water and energy continuous exchange measurement. Beyond the functionality in terms of carbon absorption, other investigation activities will be carried out in the plots with a specific focus on vegetation and soil characteristics, biodiversity evolution and hyperspectral and SIF local measurements among others. In this presentation the first preliminary results will be illustrated, together with the plan and the activities on-going. The data, collected in the context of the European Research Infrastructures, are open access and FAIR and will be fundamental for better evaluating and understanding different restoration options and the consequent vegetation dynamics from a holistic point of view including carbon storage, water balance, plants and animal biodiversity, with a link to the remote sensing for their possible upscaling.

How to cite: Guidolotti, G., Papale, D., Mattioni, M., Nicolini, G., Sabbatini, S., Bonella, G., Calfapietra, C., Matteucci, G., and Scarascia Mugnozza, G. and the CastelPorziano Presidential Natural Reserve Research Team: Exploiting a natural disaster for a comprehensive evaluation of different ecosystem recovery strategies: the example of Castelporziano network, EGU General Assembly 2025, Vienna, Austria, 27 Apr–2 May 2025, EGU25-8435, https://doi.org/10.5194/egusphere-egu25-8435, 2025.

    Agricultural activities play a critical role in the biogeochemical cycles of the Earth’s Critical Zone (CZ), encompassing the exchanges of carbon, water, nitrogen, and other essential elements between the atmosphere, soil, and ecosystems. Within this CZ system, field management practices directly influence microclimatic conditions and further alter water budgets and the emission or sequestration of greenhouse gases. These changes significantly affect the physical and chemical processes, and ecological balance within the agricultural CZ. Moreover, farmers’ field management behaviors are often shaped by their social networks, where past field experiences, technical knowledge, market dynamics, and policy frameworks influence their decision-making and filed applications. These behaviors, in turn, impact microclimatic conditions and biogeochemical cycles at different scales. Understanding these mechanisms is essential for ensuring the sustainability of agricultural production and environmental systems.

    In Asia, tea cultivation is a high-value agricultural activity that represents a complex social-ecological system (SES) involving farmers' social networks, biogeochemical cycles, and field microclimatic characteristics. To examine the mechanism in this complex system, we conducted the measurement with eddy-covariance flux system in two adjacent tea fields managed under two different practices (organic-certified and conventional) in a mountainous watershed in northeastern Taiwan. The preliminary findings from the past few years show that these two plantations exhibit distinct microclimatic characteristics, influenced by the differing management approaches. The results from the flux measurements have significant scientific implications. First, the contrasting microclimatic patterns demonstrate the substantial impact of local stakeholders and their associated social networks on field management behaviors and regional biogeochemical processes. Second, the results provide valuable data for stakeholders, including farmers, local government, and water resource administration, guiding them toward strategies that align with agricultural and environmental sustainability objectives. These findings offer actionable insights to optimize resource use, reduce environmental impacts, and enhance resilience in agricultural systems.

    This study demonstrates the value of integrating research on agricultural activities, field management behaviors, and social networks to comprehensively understand the interplay between human behavior and natural processes within the agricultural CZ, offering a robust scientific basis for promoting sustainable development.

How to cite: Juang, J.-Y.: Exploring the Impact of Different Field Management Practices on Fluxes in Tea Field within a Social-Ecological Systems Framework, EGU General Assembly 2025, Vienna, Austria, 27 Apr–2 May 2025, EGU25-9507, https://doi.org/10.5194/egusphere-egu25-9507, 2025.

EGU25-9741 | Posters on site | BG8.8

Carbon and water fluxes in urban forest: improving human well - being for a more sustainable society 

Terenzio Zenone, Carlo Calfapietra, Gabriele Guidolotti, Teresa Bertolini, Marco Ciolfi, Michele Mattioni, Negar Rezaei, and Emanule Pallozzi

The constant growth of population living in urban areas creates new opportunities for urban forest to provides ecosystem services for human wellbeing such as, cooling effect, and carbon neutrality of cities. Studies related to urban forest involve transdisciplinary fields that include environmental, social, and economic aspects, at a range of different spatial and temporal scales. Nevertheless, experimental observation of carbon and energy exchange in urban forest have been so far fragmented, limited to short period of time, and never spatially distributed. While a considering amount of remote sensing and modelling studies indicates the potential cooling capacity and carbon uptake of urban forest, the impact of climatic extreme events on it is still unclear. Through multiple years of unique Eddy Covariance (EC) observations of a mature urban forest located in southern Europe we highlighted how carbon and water fluxes respond differently, almost as if uncoupled, with evaporative cooling maintained during the climatic drought and net carbon sequestration reversed. A long term EC observation, coupled with  modeling simulations, highlight   the role of urban forest as potential tool for climate and microclimate mitigation with and without drought limitations. Our results have important policy implications for urban forest management and planning and more generally for strategies, on urban forest, in relation to carbon neutrality and thermal comfort. While the urban forest had an annual net loss of CO2 to the atmosphere, its above- and below- ground biomass and the soil represent a relevant carbon reservoir, and its summer uptake of atmospheric CO2 enabled evaporative cooling of the microclimate. However, the impact of summer drought reduced the levels of cooling benefits compared to non-drought summers. We identified a need for drought tolerant species selection to ensure their ability to tolerate future climate and provide needed ecosystem services such as maintained assimilation rates or survival during drought. Our results represents the first long term, and continuous experimental observation to demonstrate that the urban forest cooling capacity in warm seasons can decouple from net CO2 uptake and will be limited by the amount of water available, either from precipitation or irrigation sources.

How to cite: Zenone, T., Calfapietra, C., Guidolotti, G., Bertolini, T., Ciolfi, M., Mattioni, M., Rezaei, N., and Pallozzi, E.: Carbon and water fluxes in urban forest: improving human well - being for a more sustainable society, EGU General Assembly 2025, Vienna, Austria, 27 Apr–2 May 2025, EGU25-9741, https://doi.org/10.5194/egusphere-egu25-9741, 2025.

EGU25-9879 | ECS | Orals | BG8.8

Determining the controlling factors for carbon sequestration in two contrasting forests in the Boreal region and the semi-arid Mediterranean 

Laura Rez, Timo Vesala, Pasi Kolari, Eli Tziperman, Rachamim Rubin, and Dan Yakir

Evergreen-needle forests are among the most adaptive ecosystems, spanning from the cold-wet Boreal to the hot-dry Mediterranean, and can provide insights into differential responses in productivity and carbon storage potential across a geographic range. Using 20 years of flux-tower data from contrasting Boreal (Hyytiälä, Finland; HYY) and semi-arid (Yatir, Israel; YAT) conifer forests, NEE sensitivity to key environmental and climate drivers was examined. We analyzed both the seasonal and the variability-driven changes in NEE with Machine Learning modeling (Random Forest; RF) and SHAP analysis and compared the results against baseline GLM and GAM outputs.  All models explained the seasonality in NEE well (RMSE<0.17, R2>0.95). However, the RF model had the advantage of capturing complex feature interactions on variability-driven NEE, with the simplicity in interpretability of the GLM (R2 values of 0.59-0.67 for RF, 0.63-0.67 for GAM, and 0.34-0.55 for GLM; with similar results in RMSE). Both forests share the sensitivity of the variability-driven changes in NEE to short- and long-wave radiation and precipitation (57%-82% of mean SHAP), but are predominantly limited by radiation duration (HYY) or intensity (YAT) in the productive season. Seasonal variations in NEE were uniquely dominated by soil water content (SWC) at the 45 cm layer in YAT (55% of meanSHAP) and by VPD in HYY (69% of meanSHAP). Based on these controlling factors, we demonstrate that observed trends in rain events that recharge deep soil layers in YAT lead to a reduction in carbon sequestration potential of 5.5 g-C/m2/year (3% of the annual mean). In contrast, no discernible trends in VPD, rainfall events, nor radiation in the productive season in HYY indicated any such changes in sequestration potential during this period. Yet, the compounding effects of a hot-dry month in tandem with a wet and warm month could reduce mean sequestration by ~70% (194 g-C/m2) in HYY, as demonstrated in summer 2020. The results indicate that across large climatic gradients, conifer forests show a shift in the predominant factor influencing NEE in the productive season between soil moisture and atmospheric moisture on the seasonal time scale, yet the variability response is consistently controlled by radiation-limiting factors.

How to cite: Rez, L., Vesala, T., Kolari, P., Tziperman, E., Rubin, R., and Yakir, D.: Determining the controlling factors for carbon sequestration in two contrasting forests in the Boreal region and the semi-arid Mediterranean, EGU General Assembly 2025, Vienna, Austria, 27 Apr–2 May 2025, EGU25-9879, https://doi.org/10.5194/egusphere-egu25-9879, 2025.

EGU25-10298 | Posters on site | BG8.8

New streamlined, reduced-cost CO2/H2O Flux Sensor & Node open a new era for eddy covariance measurements and applications 

Gerardo Fratini, James C. Kathilankal, George G. Burba, Doug Lynch, Jonathan Welles, Stephen Osborn, Bob Eckles, Isaac Fuhrman, David Franzen, Frank Griessbaum, Sasha Ivans, Rocco Tuccio, Adam Roth, Tia Barth, and Johnathan McCoy

From academic research to carbon MMRV/MRV/dMRV/aMRV frameworks and across many industrial sectors, high-quality direct measurements of CO2 fluxes between the earth surface and the atmosphere are emerging as strategic assets of unique usefulness. Correspondingly, demand for simple-to-use automated instrumentation to perform such measurements is growing fast.

The LI-720 is a new CO2/H2O “flux sensor”, designed to achieve performances comparable to traditional high-end EC systems but at significantly reduced costs, maintenance needs, and power consumption. Recently, LI-COR Environmental released the Carbon Node, which combines the LI-720 with a power/IoT communication box. The result is a wireless, lightweight instrument more akin to a meteorological sensor than to a traditional EC system, which delivers flux data directly to a cloud-based data management system where flux time series are further consolidated with automatic quality control and gap-filling procedures. The Carbon Node represents the most streamlined CO2/H2O flux system available to date.

Here we present the technical features of this new system and showcase its field performance against high-end EC systems across a variety of ecosystems and climates, discussing benefits, trade-offs and limitations. We find that, when unit-to-unit variability and other uncertainties are taken into account, the LI-720 performance is comparable to traditional open-path (LI-7500-based) and enclosed-path (LI-7200-based) EC systems, most notably when fluxes are aggregated over daily, weekly or monthly cumulates.

We also discuss the use of the new sensor in both traditional academic applications focused on process-level studies, and new commercial applications focused on decision-making for immediate societal benefits.

How to cite: Fratini, G., Kathilankal, J. C., Burba, G. G., Lynch, D., Welles, J., Osborn, S., Eckles, B., Fuhrman, I., Franzen, D., Griessbaum, F., Ivans, S., Tuccio, R., Roth, A., Barth, T., and McCoy, J.: New streamlined, reduced-cost CO2/H2O Flux Sensor & Node open a new era for eddy covariance measurements and applications, EGU General Assembly 2025, Vienna, Austria, 27 Apr–2 May 2025, EGU25-10298, https://doi.org/10.5194/egusphere-egu25-10298, 2025.

EGU25-10592 | ECS | Posters on site | BG8.8

Supporting Next-Generation Agriculture in the Alps: Direct Evapotranspiration Measurements for Smarter Water Management 

Sofia Koliopoulos, Chiara Guarnieri, Daria Ferraris, Paolo Pogliotti, Francesco Avanzi, Denise Chabloz, Gianluca Filippa, Martina Lodigiani, Maddalena Nicora, Federico Tagliaferro, and Marta Galvagno

Measuring evapotranspiration (ET) is crucial for understanding the complex interactions among the atmosphere, vegetation, and land. In the context of global climate change, distributed quantification of actual ET has become even more important, as alterations in the hydrological cycle affect water availability, ecosystem dynamics, and thus agriculture.

In this study we present a network to directly measure ET across different land uses in the Aosta Valley (Western Italian Alps) in the context of the Agile Arvier project. Supported by funding from the European Union’s economic recovery plan, the Agile Arvier project aims to transform the small village of Arvier into a hub for climate change research in the Alps. This activity is part of one of the five work packages (or “Laboratories”), the Green Lab, which includes studies on water use and smart agriculture, among other activities.

Typically, ET is a modelled component in irrigation water requirement (IWR) models, with estimates derived from meteorological data or crop coefficients. While these models provide valuable insights, they often lack the accuracy provided by direct measurements. Measuring actual ET, e.g., by means of the eddy covariance technique, is crucial for improving water management strategies, especially in regions characterized by diverse landscapes and land uses.

To this end, in 2025, seven LI-710 Evapotranspiration sensors (from LI-COR) will be installed to directly measure ET across different agricultural lands in the Aosta Valley region. We selected seven monitoring sites representative of the typical crop types in the region, including a vineyard, an apple orchard, and five meadows and pastures ranging from 500 to 1950 meters above sea level (m a.s.l.). To enhance the value of the data collected by the LI-710 sensors, we will integrate into the network decadal ET measurements already available from two ICOS (Integrated Carbon Observation System) associated sites located in the same region: an abandoned pasture and a larch forest at 2150 m a.s.l. (IT-Tor, IT-TrF).

Data from the ET network will be compared with IWR data available for the entire region to validate and refine the accuracy of IWR estimates using direct ET measurements. The results of this comparison will be used to inform policymakers and provide the Regional Agricultural Department with an enhanced tool for irrigation management.

Finally, by the end of the year, we aim to create an online open-access dataset for ET data consultation and download, available for scientists and policymakers.

How to cite: Koliopoulos, S., Guarnieri, C., Ferraris, D., Pogliotti, P., Avanzi, F., Chabloz, D., Filippa, G., Lodigiani, M., Nicora, M., Tagliaferro, F., and Galvagno, M.: Supporting Next-Generation Agriculture in the Alps: Direct Evapotranspiration Measurements for Smarter Water Management, EGU General Assembly 2025, Vienna, Austria, 27 Apr–2 May 2025, EGU25-10592, https://doi.org/10.5194/egusphere-egu25-10592, 2025.

EGU25-11875 | Posters on site | BG8.8

Climatic impacts of different vegetable oils: A measurement-based life cycle analysis 

Vilna Tyystjärvi, Ana Meijide, Cristina de la Rua, Sergio Aranda-Barranco, and Enrique P. Sánchez-Cañete

The production of vegetable oils takes up a considerable portion of global arable land and has steadily increased during the 21st century. In the European Union, the growing of oil crops covers approximately 17% of arable land but the region also relies heavily on imports, particularly of palm oil and sunflower seed oil. So far, there are only few measurement-based estimates of the greenhouse gas budgets of agricultural systems, including the growing of vegetable oil crops. In this study, we evaluate and compare the global warming potential of cultivating four commonly used vegetable oils. Two of the oils, palm oil and soybean oil, are largely imported to the EU while the other two, olive oil and rapeseed oil are largely produced within the region. We use a comprehensive measurement-based Life Cycle Analysis (LCA) framework, combining the traditional LCA (using OpenLCA software and data from Ecoinvent database) with detailed greenhouse gas flux measurements of carbon dioxide (CO2), methane (CH4) and nitrous oxide (N2O) from existing agricultural fields. We selected existing measurement sites in Indonesia for palm oil, Spain for olive oil, Argentina for soybean oil and Germany for rapeseed oil. Measurements of ecosystem CO2 fluxes were done using eddy covariance while chamber methods were used for N2O and CH4 fluxes. This approach allows us to provide a detailed assessment of the emissions from the cultivation, including all the inputs and field emissions, to the production of these oils. These results contribute to understanding the climatic impacts of vegetable oil production, providing valuable insights for policy-making, agricultural management, and consumer choices aiming at mitigating the environmental footprint of agriculture, both from the production and consumer’s point of view.

How to cite: Tyystjärvi, V., Meijide, A., de la Rua, C., Aranda-Barranco, S., and Sánchez-Cañete, E. P.: Climatic impacts of different vegetable oils: A measurement-based life cycle analysis, EGU General Assembly 2025, Vienna, Austria, 27 Apr–2 May 2025, EGU25-11875, https://doi.org/10.5194/egusphere-egu25-11875, 2025.

EGU25-12406 | Posters on site | BG8.8

Land Cover Change and Its Impacts on Land-Atmosphere Interactions in Africa: Bridging Critical Gaps Using a Mobile Field Lab 

Dan Elhanati, Yasmin Bohak, Diriba-Bane Nemera, Fedor Tatarinov, Sung-Ching Lee, Eyal Rotenberg, and Dan Yakir

Land cover change is a major driver of anthropogenic climate change, contributing to increasing CO2 emissions and altering the exchanges of water, energy, and gases between the land surface and the atmosphere. As these changes can subsequently affect both regional and global climate feedback mechanisms, much attention has been invested into their quantification. While global observation networks of biosphere-atmosphere interactions have provided valuable data in this context, their spatial coverage is uneven, with substantial data gaps in critical regions. Africa, despite its ecological and climatic importance, remains one of the least represented regions in these networks. Furthermore, the continent hosts diverse ecosystems—from arid deserts to wetlands—that deliver essential environmental services and undergo rapid land use changes due to both natural and anthropogenic factors. The scarcity of field measurements in Africa has resulted in a heavy reliance on satellite remote sensing, which often lacks high-resolution ground validation. For example, remote sensing analysis in South and East Africa reveals that the net difference between carbon sequestration and increasing shortwave radiation forcing in drylands undergoing afforestation is not spatially uniform. While some African drylands are expected to show a net cooling effect over an 80-year forest lifetime, others are expected to exhibit a net warming effect. We will deploy a mobile biosphere-atmosphere laboratory to gather direct ground-based measurements to validate such remote sensing estimates, in currently underrepresented areas. The mobile lab integrates advanced methodologies, including eddy covariance flux measurements, multispectral radiation sensors, soil and leaf gas analyzers, and sun-induced fluorescence. Our preliminary studies demonstrated that short-term campaign data combined with local, continuous meteorological data can produce seasonal and annual-scale assessments of water, carbon, and energy budgets. The combination of advanced field measurements with remote sensing validation will fill critical observational gaps in Africa and enhance predictions of ecosystem resilience under future climate scenarios.

How to cite: Elhanati, D., Bohak, Y., Nemera, D.-B., Tatarinov, F., Lee, S.-C., Rotenberg, E., and Yakir, D.: Land Cover Change and Its Impacts on Land-Atmosphere Interactions in Africa: Bridging Critical Gaps Using a Mobile Field Lab, EGU General Assembly 2025, Vienna, Austria, 27 Apr–2 May 2025, EGU25-12406, https://doi.org/10.5194/egusphere-egu25-12406, 2025.

EGU25-12743 | ECS | Posters on site | BG8.8

Simultaneous monitoring of soil water content and vegetation with cosmic-ray neutron sensors: novel findings and future opportunities 

Cosimo Brogi, Heye Reemt Bogena, Johan Alexander Huisman, Jannis Jakobi, Marius Schmidt, Carsten Montzka, Jordan Bates, and Sonia Akter

Accurate and continuous monitoring of soil water content (SWC) and plant development provides significant benefits in various contexts, including long-term environmental observatories, the development and validation of environmental models and remote sensing products, as well as practical applications like digital and sustainable agriculture. Cosmic-Ray Neutron Sensors (CRNS) are becoming increasingly popular for continuous and non-invasive monitoring of SWC, and recent advancements have demonstrated their potential for vegetation monitoring. CRNS use a moderated detector to measure epithermal neutron intensity (En) and estimate SWC over a radius of approximately 200 m. An additional bare detector measures lower-energy thermal neutron intensity (Tn), which is more sensitive to vegetation biomass than to SWC. However, the benefits of simultaneous monitoring of SWC and vegetation properties with CNRS for monitoring networks such as ICOS and ILTER have not been investigated yet.

In this study, a CRNS that is part of the COSMOS-Europe network measured En and Tn over a 10-year period at the ICOS Class 1 ecosystem station in Selhausen, Germany (integrated into the already-present TERENO station in 2019). En and Tn were compared to a large dataset of a) SWC obtained from multiple point-scale sensors within 30 m of the CRNS, b) gross primary productivity (GPP) obtained with the eddy covariance (EC) method, and c) manual and drone-based measurements of plant height (PH), leaf area index (LAI), and dry aboveground biomass (AGB).

Discrepancies between the CRNS and the point-scale SWC measurements were observed (RMSE of 0.063 cm3/cm3). These were attributed to the periodic reinstallation of the point-scale sensors that sometimes led to abrupt changes in measured SWC, and to the fact that the CRNS, like the EC station, measures over a much larger area. Thanks to the co-location of the CRNS and EC station, a comparison of Tn and GPP showed a clear co-development during cropping periods and the lower responsiveness of Tn during senescence and desiccation indicated that factors such as plant structure and other hydrogen pools (e.g., below-ground biomass) may affect Tn. Crop-specific or annual models were used to estimate plant traits from Tn. The accuracy of plant traits predicted by the CRNS was relatively lower compared to manual and destructive methods (RMSE of 0.13 m for PH, 1.01 m for LAI, and 0.27 kg/m2 for dry AGB). However, the effortless nature of the CRNS outweighs this reduction in accuracy, opening the possibility of generating continuous time series of plant traits with only a few manual measurements.

This study showcases the potential of CRNS for simultaneous field-scale monitoring of SWC and vegetation, which is of great interest for monitoring platforms and environmental modelling. Moreover, the novel findings obtained by comparing Tn and GPP showed that strengthened collaboration between observatories and networks such as COSMOS, TERENO, and ICOS, can provide information that is not only useful for researchers but also for instruments manufacturers. In fact, the possibility to extend the usage of CRNS beyond SWC and toward monitoring of plant traits could increase the interest towards thermal neutron detection and vegetation monitoring.

How to cite: Brogi, C., Bogena, H. R., Huisman, J. A., Jakobi, J., Schmidt, M., Montzka, C., Bates, J., and Akter, S.: Simultaneous monitoring of soil water content and vegetation with cosmic-ray neutron sensors: novel findings and future opportunities, EGU General Assembly 2025, Vienna, Austria, 27 Apr–2 May 2025, EGU25-12743, https://doi.org/10.5194/egusphere-egu25-12743, 2025.

EGU25-13537 | ECS | Orals | BG8.8

Evaluating Restoration Effects on Net Ecosystem Exchange (NEE) of CO2 in an Irish Peatland 

Md Shamsuzzaman, Shane Regan, Mark O'Connor, Imelda Casey, Ultan MacCarthy, Mika Korkiakoski, and Owen Naguhton

In Ireland, peatlands cover around 20% of the land area, holding more than 50% of the country's soil carbon. Unfortunately, over 85% of Ireland's peatlands have already been drained due to a long history of peat extraction, drainage, and conversion to agriculture and forestry. Degraded peatlands have become sources of carbon emissions, raising awareness of the need for peatland restoration as a critical strategy for climate change mitigation. Though there has been extensive and ongoing research on peatland ecohydrology, restoration, and Net Ecosystem Exchange (NEE) of CO2 in Ireland, holistic ecosystem research is limited and has largely been carried out on a short-term basis as part of discipline-specific or restricted multidisciplinary research projects. There remains significant gaps in our understanding in the specific causal relationships between ecohydrological conditions and carbon sequestration. The study was conducted at a degraded, peat-extracted raised bog previously used as a horticultural site with significant drainage. In order for the expansive national peatland restoration schemes to deliver the optimal climate, ecological, hydrological, and environmental benefits, a clear understanding of the trajectory of NEE of a degraded raised bog undergoing restoration is required, and of equal importance are the causal ecohydrological processes influencing this trajectory.  A large-scale engineering restoration has been carried out at the site by constructing contour bunds and water level control stations. To address the restoration effectiveness, the Net Ecosystem CO2 Exchange (NEE) and environmental data were collected from 2021 to 2024 using the Eddy Covariance (EC) technique, which is a direct, ecosystem-based measurement method. The analysis revealed that yearly cumulative NEE exhibited variable trends, rising from 114 g C m⁻² in 2021, 207 g C m⁻² in 2022, 221 g C m⁻² in 2023, and 237 g C m⁻² in 2024. The findings indicated that the site is still emitting carbon even after restoration efforts. Further analysis aims to explore the seasonal and temporal trends in emissions, considering the key biotic and abiotic factors. This study will provide insights into restoration effectiveness to support the national peatland restoration and conservation strategies for the degraded peatland scheduled for restoration.

How to cite: Shamsuzzaman, M., Regan, S., O'Connor, M., Casey, I., MacCarthy, U., Korkiakoski, M., and Naguhton, O.: Evaluating Restoration Effects on Net Ecosystem Exchange (NEE) of CO2 in an Irish Peatland, EGU General Assembly 2025, Vienna, Austria, 27 Apr–2 May 2025, EGU25-13537, https://doi.org/10.5194/egusphere-egu25-13537, 2025.

EGU25-13575 | Orals | BG8.8

Facilitating the accessibility of in-situ datasets and their integration with Remote Sensing activities: the FLUXNET products in the datasets STAC catalogue of the OEMC project 

Simone Sabbatini, Leandro Parente, Milenkovic Milutin, Gilberto Pastorello, Giacomo Nicolini, Luca Di Fiore, Tomislav Hengl, and Dario Papale

With recent advancements of satellite images in terms of spatial resolution and feature-specific bands, the need for high quality in-situ datasets for calibration and validation activities is growing proportionally, together with the definition of sensor standards, setup and sampling design. In this context, the Open Earth Monitor Cyberinfrastructure (OEMC) project, funded by Horizon Europe, aims at building operational, cloud-optimized and open tools, and Earth Observations datasets in support of environmental policies. That also includes a wide range of in-situ datasets for supporting 32 OEMC use cases. The global network of flux tower stations FLUXNET is contributing to the OEMC with in-situ measurements of GHG fluxes based on the eddy covariance (EC) technique, using a comprehensive list of highly-standardized meteorological variables. This involves two types of challenges: from the one side, there is the need for the definition of a catalogue for the in-situ domain of the OEMC project, to be integrated with the other services; from the other, it is desirable to have an implementation of an even more accessible tool for FLUXNET datasets, and its integration with a new EC footprint product characterized by higher temporal resolution for an even better integration with remote sensing (RS) activities. In this presentation we illustrate the rationale that guided us in the implementation of a STAC catalogue for the in-situ datasets of the OEMC project, and its first version now released. We also present the new “Shuttle” system for accessing the FLUXNET datasets, and a new output for representing the EC footprint at half-hourly scale, currently implemented only for the Integrated Carbon Observation System (ICOS), but potentially extensible to other networks.

How to cite: Sabbatini, S., Parente, L., Milutin, M., Pastorello, G., Nicolini, G., Di Fiore, L., Hengl, T., and Papale, D.: Facilitating the accessibility of in-situ datasets and their integration with Remote Sensing activities: the FLUXNET products in the datasets STAC catalogue of the OEMC project, EGU General Assembly 2025, Vienna, Austria, 27 Apr–2 May 2025, EGU25-13575, https://doi.org/10.5194/egusphere-egu25-13575, 2025.

Accurate estimates of annual carbon uptake for global ecological zones, as defined by the United Nations’ Food and Agriculture Organization (FAO), are essential for preparing national greenhouse gas (GHG) inventories in the Agriculture, Forestry, and Other Land Use (AFOLU) sector. The Intergovernmental Panel on Climate Change (IPCC) 2019 guidelines emphasize the need for precise estimates of CO2 fluxes between land and atmosphere. Traditional methods, such as the “gain-loss” approach, calculate annual carbon changes from repeated carbon stock inventories, but these methods often carry significant uncertainties, omit unobservable carbon pools, and rely on biomass-to-CO2 conversion factors. The eddy covariance technique, developed in the late 1980s, offers a complimentary and potentially more direct measure of net ecosystem CO2 exchange, encompassing both vegetation and soil contributions. Using data from over 400 eddy covariance sites in the global FLUXNET network, we compiled annual carbon uptake estimates across 14 FAO ecological zones and compared them to IPCC default values derived from the gain-loss method. Our analysis reveals that IPCC default inventory estimates are, on average, less than 50% of the FLUXNET-based values and are lower in 12 of 16 ecological zones. This discrepancy suggests that many GHG inventories may significantly underestimate terrestrial carbon uptake. Furthermore, the continuous and geographically diverse FLUXNET measurements capture interannual variability more effectively, providing an opportunity to refine emission factor estimates.. Incorporating FLUXNET data into national inventories could improve the accuracy and realism of GHG accounting in the AFOLU sector, though eddy covariance data is biased towards European and North American regions.

How to cite: Moore, D., Novick, K., and Papale, D.: Estimating IPCC emission factors for Agricultural and Forest Ecosystems using a multi-decade standardized eddy covariance data record (FLUXNET)., EGU General Assembly 2025, Vienna, Austria, 27 Apr–2 May 2025, EGU25-13745, https://doi.org/10.5194/egusphere-egu25-13745, 2025.

EGU25-14073 | Posters on site | BG8.8

The FLUXNET Shuttle: accessing current global flux data 

Gilberto Pastorello, Peter Isaac, Cove Sturtevant, Carlo Trotta, You-Wei Cheah, Stefan Arndt, David Durden, and Dario Papale

Regional flux networks, including AmeriFlux, ICOS, NEON, and OzFlux, are now regularly generating and updating FLUXNET data products for their sites. With that, flux data availability is considerably expanded, with an increased number of sites with data and addition of recent site-years. Other improvements include continued extension of variables and metadata supported and collected, deployment and operationalization of the jointly maintained ONEFlux pipeline, better integration of network-level data quality control processes, and expansion of adoption of open data policies, mainly based on the CC-BY data license. To facilitate access to these newer data, we are making available the FLUXNET Shuttle, a tool supporting the automated compilation of FLUXNET data products published by the regional networks. The tool supports creating the equivalent of global FLUXNET datasets on-demand, allowing more timely access to new data, while still offering replicability functionality through the use of versions. In this presentation, we show a demonstration version of this new tool, showcasing its mode of operation and the products made available through it. A production version of the tool is slated for release by the end of 2025. Based on the data access made possible by the FLUXNET Shuttle, we will show a short summary of the current FLUXNET data availability compiled from the regional network data published products. We also discuss approaches to continue properly assigning credit to site teams, fully following regional network data policies.

How to cite: Pastorello, G., Isaac, P., Sturtevant, C., Trotta, C., Cheah, Y.-W., Arndt, S., Durden, D., and Papale, D.: The FLUXNET Shuttle: accessing current global flux data, EGU General Assembly 2025, Vienna, Austria, 27 Apr–2 May 2025, EGU25-14073, https://doi.org/10.5194/egusphere-egu25-14073, 2025.

EGU25-17703 | Orals | BG8.8

Laying footprints on a new path: proper accounting af biogenic fluxes makes viticulture carbon neutral 

Andrea Pitacco, Luca Tezza, Isabella Ghiglieno, and Nadia Vendrame

To limit the acceleration of global warming we need to reduce GHG emissions, making our production processes more C efficient and optimizing absorptions. Viticulture, and agriculture in general, is a sector with great and real possibilities of improving its environmental impact, with significant and cost effective GHG mitigation potential.

Recently, vineyards, and in general orchards, have been shown to be a significant C sinks in the short and medium term, especially due to the peculiar management of the soil in a life cycle of decades. But are these sinks comparable to the GHG emissions by field management? This was the first multi-annual study combining carbon footprint (emissions of CO2) and vineyard NEE (CO2 absorptions, assessed by eddy covariance) of wine making field phase.

The results indicate high variability in the comprehensive annual C balance and its components (anthropogenic emissions, vineyard absorption and harvest), with usually, but not always, negative net balance (i.e. absorptions greater than emissions). This study suggests that optimizing processes in agriculture, at least tree crops, with strategies focused on C management that minimize emissions and optimize absorption, is a possible, effective and high value option. The calculation of the complete C footprint in the agricultural sector can be very useful in the perspective of carbon farming initiatives and for directing the management of perennial crops towards neutrality, with a better addressing of environmental issues.

How to cite: Pitacco, A., Tezza, L., Ghiglieno, I., and Vendrame, N.: Laying footprints on a new path: proper accounting af biogenic fluxes makes viticulture carbon neutral, EGU General Assembly 2025, Vienna, Austria, 27 Apr–2 May 2025, EGU25-17703, https://doi.org/10.5194/egusphere-egu25-17703, 2025.

EGU25-17896 | ECS | Posters on site | BG8.8

Year-round eco-hydrological monitoring of a high-elevation Alpine grassland 

Davide Gisolo, Alessio Gentile, Tanzeel Hamza, Stefano Bechis, Davide Canone, and Stefano Ferraris

The carbon and water balances of high-elevation (>2500 m) Alpine grasslands still offer important open questions. Understanding whether those grasslands act as a net carbon either source or sink, and quantifying the evapotranspiration – also depending on the meteorological and soil conditions - is still a challenge. In this analysis, a focus on two years of measurements (dry year 2022 and closer to normal conditions 2023) collected at a high elevation grassland site (2600 m a.s.l.) is presented. The interannual variations of ecosystem respiration, gross primary production (GPP), net ecosystem exchange (NEE) and actual evapotranspiration (ETa) give insights on how the ecosystem reacts to different atmospheric and soil conditions, including the Winter snowpack coverage extent, depth and duration. First results show that the greater duration and depth of 2023 Winter snowpack may influence the grassland behaviour, being characterised by a higher emission in early growing season just after the snowmelt. Hence, the grassland sink ability in 2023 (-1.5  gC m-2 ) is strongly reduced, if compared to the 2022 one (-73.4  gC m-2) even if the 2023 year was more wet if compared to very dry 2022. Limiting the analysis to the period January-October (end of the very late growing season), results indicate that the cumulative ecosystem respiration reaches 420.0 gC m-2 in 2023 whereas in 2022, the cumulative value is 345 gC m-2. GPP cumulative values are instead -454 gC m-2 and -469.1 gC m-2 in 2022 and 2023, respectively.

Considering the most important part of the growing season (June-September), the cumulative ETa does not show particular differences among the two years. In addition, the ETa and NEE drivers can be analysed. Results indicate that the most significant drivers are net radiation, air temperature, wind speed, matric potential and ground heat flux for ETa. Photosynthetic photon flux density, vapour pressure deficit, soil temperature and soil water content are the most important drivers for NEE.


This work was supported by the NODES project, funded under MUR - M4C2 1.5 of the PNRR with resources from the European Union - NextGenerationEU (Grant Agreement no. ECS00000036) as well as the MUR PRIN Project SUNSET (202295PFKP_003).

How to cite: Gisolo, D., Gentile, A., Hamza, T., Bechis, S., Canone, D., and Ferraris, S.: Year-round eco-hydrological monitoring of a high-elevation Alpine grassland, EGU General Assembly 2025, Vienna, Austria, 27 Apr–2 May 2025, EGU25-17896, https://doi.org/10.5194/egusphere-egu25-17896, 2025.

EGU25-18134 | Posters on site | BG8.8

FloraFlux - Collaborative AI-Based Plant Data Collection at Flux Tower Sites 

Susanne Tautenhahn and the FloraFlux team and participants

FloraFlux is a collaborative initiative to collect plant species occurrence data from flux tower sites worldwide. The project is open and inclusive, requiring no botanical expertise and minimal time and costs for participants. Only a smartphone is needed, leveraging automated plant identification via the Flora Incognita app (Mäder et al., 2021). Participants are encouraged to "take pictures of as many species in the footprint as you like, the more the better", while we also facilitate optional additional information. FloraFlux complements and extends traditional, resource-intensive vegetation surveys, enabling widespread data collection across a global network of sites. The data collected by FloraFlux will be shared with participants and ultimately the scientific community by a joint publication in an open access format, enhancing the collective knowledge of plant diversity and ecosystem functions. More information on FloraFlux can be found on the FloraFlux website (https://floraincognita.com/floraflux/).


How to cite: Tautenhahn, S. and the FloraFlux team and participants: FloraFlux - Collaborative AI-Based Plant Data Collection at Flux Tower Sites, EGU General Assembly 2025, Vienna, Austria, 27 Apr–2 May 2025, EGU25-18134, https://doi.org/10.5194/egusphere-egu25-18134, 2025.

EGU25-18712 | ECS | Posters on site | BG8.8

Evaluating the DNDC Model for Predicting N₂O Emissions in Integrated Crop-Livestock Systems: Insights from Inoculant and Nitrogen Fertilizer Management in Brazil 

Priscila S. Matos, Johnny R. Soares, Márcia T. M. Carvalho, Bhaskar Mitra, Ed Jones, Beata E. Madari, Antônio C. R. Freitas, Bruno J. R. Alves, Ryan R. Silva, Wilker A. Araujo, Matheus M. B. Siqueira, Pedro L. O. A. Machado, and Jagadeesh Yelupirati

Integrated crop-livestock systems (ICL) hold significant potential as greenhouse gas sinks in Brazil, offering a promising avenue for mitigating climate change impacts. The DNDC (DeNitrification-DeComposition) model, a robust tool for simulating biogeochemical processes, provides an advanced framework for modelling nitrous oxide (N₂O) emissions. This capability is crucial for assessing the effects of nitrogen (N) management within ICL systems, enabling the optimization of agricultural sustainability by balancing productivity with environmental stewardship.

Field data were obtained from an ICL experiment conducted at the ‘Capivara Experimental Farm’ by Embrapa Rice and Beans, located in Santo Antônio de Goiás, GO, Brazil (16°28´S; 49°17´W; 823 a.s.l.). The ICL experiment was evaluated over four years (2019–2022) using the following crop rotation sequence: common beans (Phaseolus vulgaris) - aerobic rice (Oryza sativa) - forage grass (Urochloa spp). The soil was classified as clayey Ferralsol with 2% organic matter content. All crop phases were conducted under zero tillage.

N₂O emissions were measured using manual static chambers during the bean phase. The experiment included four treatments: Control (No N), Inoculated (No N + Ino), Urea (UR), and Inoculated + Urea (Ino + UR), with four replicates each. N₂O emissions were recorded during 30 sampling events over nearly 70 days throughout the bean cycle. Nitrogen was applied at a rate of 119 kg/ha.

The above treatments were used to parameterize the DNDCv.CAN model, which demonstrated satisfactory performance in predicting N₂O emissions in the ICL system, showing a significant correlation with observed data (r = 0.57, p < 0.001), a MAE of 0.011, and a RMSE of 0.016. The average daily observed N-N₂O fluxes were 0.017 kg ha⁻¹ day⁻¹, compared to 0.012 kg ha⁻¹ day⁻¹ simulated by the DNDC model.

Accumulated N₂O emissions were 0.770, 0.399, 0.808, and 0.991 kg ha⁻¹ for Control, No N+Ino, UR, and Ino+UR, respectively. Simulations by DNDC for these treatments were 0.636 (UR and Ino+UR) and 0.237 kg ha⁻¹ (No N+Ino). In general, the model showed a good fit with daily N₂O fluxes but tended to underestimate accumulated emissions. Moreover, the model requires improvements to more accurately capture the influence of using inoculants. Further model parameterization and calibration is currently in progress to improve predictions. Using inoculants to substitute N significantly reduces N2O emissions in bean production, enhances soil health, and lowers costs for farmers, contributing to food security. This practice aligns with Brazil’s environmental policy and strengthens its leadership in sustainable agriculture.

How to cite: Matos, P. S., Soares, J. R., Carvalho, M. T. M., Mitra, B., Jones, E., Madari, B. E., Freitas, A. C. R., Alves, B. J. R., Silva, R. R., Araujo, W. A., Siqueira, M. M. B., Machado, P. L. O. A., and Yelupirati, J.: Evaluating the DNDC Model for Predicting N₂O Emissions in Integrated Crop-Livestock Systems: Insights from Inoculant and Nitrogen Fertilizer Management in Brazil, EGU General Assembly 2025, Vienna, Austria, 27 Apr–2 May 2025, EGU25-18712, https://doi.org/10.5194/egusphere-egu25-18712, 2025.

EGU25-20617 | Orals | BG8.8

Carbon Real: a land conservation model in which nature benefits from carbon markets and highly reliable greenhouse gas measurements 

Taryn Fuentes-Castillo, Jorge Pérez-Quezada, Felipe Escalona, Aarón Grau-Neira, Eduardo Morales-Santana, Franco Cereceda-Espinoza, Deelan Rus Valledor, David Trejo, Rafael Suarez, Fabián Matus, Boris Muñoz, Lourdes Salinas, and Adrián Pascual

Generating methodologies to make high-integrity carbon offsets  is a global challenge. This requires accurate techniques to measure both ecosystem carbon stocks and fluxes. Even though some of these technologies have been available for some time, such as Eddy Covariance and LiDAR, the market is still in need of a model that integrates them and can be trusted by both carbon offset buyers and society. Here we present the Carbon Real model, which is based on accurate on-site measurements of aboveground biomass, real-time monitoring of CO2 fluxes and comprehensive traceability and transparency, to generate high-quality carbon offsets that can help the conservation of nature. The conservation of private lands is secured by the signature of a land conservation easement for a minimum of 25 years, while part of the economic benefits is aimed at funding local community projects. We present the first results of applying our conservation model in the well-preserved forests of the Chilean Patagonia, one of the last pristine areas in the world.

How to cite: Fuentes-Castillo, T., Pérez-Quezada, J., Escalona, F., Grau-Neira, A., Morales-Santana, E., Cereceda-Espinoza, F., Rus Valledor, D., Trejo, D., Suarez, R., Matus, F., Muñoz, B., Salinas, L., and Pascual, A.: Carbon Real: a land conservation model in which nature benefits from carbon markets and highly reliable greenhouse gas measurements, EGU General Assembly 2025, Vienna, Austria, 27 Apr–2 May 2025, EGU25-20617, https://doi.org/10.5194/egusphere-egu25-20617, 2025.

EGU25-20685 | Orals | BG8.8

Carbon-water relations of drought management in annual crops in California 

Kosana Suvocarev, Olmo Guerrero Medina, Emma Ware, Rex David Pyles, Yanxin Xie, Emma Falk, Ellie Park, and Kyaw Tha Paw U

Under pressure to avoid irrigation water use in California’s drought-prone environment, growers of annual crops are considering changing the crop types, avoiding crops or doing deficit irrigation. We are addressing the knowledge gap in the carbon-water relations of these new practices by doing water balance of the whole fields and carbon-water fluxes using eddy covariance and deep soil moisture monitoring at 6 different fields. Our area of interest is in Sacramento-San Joaquin Delta in California where soils are high in organic matter and the changes in management might exacerbate soil subsidence. We designed the experiment with 3-year duration plan and this talk will present our first full year of data collected throughout different crop drought management, seasons and locations.

Wet winter in the first year supported the drought management to be based on no irrigation for growing safflower, corn, sorghum, pasture and natural vegetation within our study. During winter time, some growers were even flooding their fields for wildlife and birds habitat. This rich dataset allowed us to quantify annual water and carbon balance based on the seasonal fluxes and soil moisture. In addition, we were able to evaluate remote sensing products for evapotranspiration estimates that are recommended in California (OpenET). Our results will benefit growers that host our experiments, State water managers, Carbon accounting for the State’s Carbon neutrality goals, university students research and education and cooperative extension outreach among others. We welcome constructive feedback and collaboration as we are trying to develop the best knowledge for direct societal benefits.       

How to cite: Suvocarev, K., Guerrero Medina, O., Ware, E., Pyles, R. D., Xie, Y., Falk, E., Park, E., and Paw U, K. T.: Carbon-water relations of drought management in annual crops in California, EGU General Assembly 2025, Vienna, Austria, 27 Apr–2 May 2025, EGU25-20685, https://doi.org/10.5194/egusphere-egu25-20685, 2025.

Enhanced rock weathering (ERW) – the introduction of finely crushed alkaline minerals into agricultural soils – could in principle remove billions of tonnes of carbon dioxide annually at the global scale. However, questions remain over processes leading to the formation and persistence of soil inorganic carbon via ERW, especially amidst the complexity of conditions across Earth’s cropland soil. Here we present a new model, a COUpled Soil Inorganic-organic carbon model for eNhanced wEathering (COUSINE), which mechanistically simulates carbon dioxide removal (CDR) via ERW across diverse climate and soil conditions. COUSINE considers the dynamics of 20 chemical species in the soil system that are driven by soil CO2 dynamics, parent material, soil cation exchange, secondary mineral formation, strong and weak acid weathering, plant and microbial activity, and leaching of elements from the soil system. Principles of mass and charge conservation are maintained across all reactions. We applied the model to various climate and soil conditions – from fertile temperate Alfisols to highly and extremely weathering subtropical Ultisols and tropical Oxisols – to examine the key controls over weathering rates and CDR rates. Our simulations reveal three key limitations in regulating the timing and potential of carbon sequestration under ERW. First, organic acids and clay colloids in fertile soils retain cations in environments with low base saturation and relatively high CEC, creating strong cation sinks, thus delaying increased pore water alkalinity in response to alkaline mineral additions. This lag can be substantial, lasting for over 80 years in Alfisols with high CEC capacity to less than 20 years in Oxisols, which lack cation exchanging organic matter and minerals. Second, competition between carbonic acid and other sources of protons can limit the efficacy of CDR. This is apparent in net nitrogen acidity from nitrogen fertilizer applications, which results in strong acid weathering. Third, climate conditions related to excess moisture and soil temperature control reaction kinetics, which affects the rate at which cations are released into solution and can thus participate in bicarbonate formation. COUSINE informs matrix simulations across soil properties, climates, and application rates, thereby elucidating optimal conditions for maximizing soil carbon sequestration via ERW, providing a new tool for CDR verification

How to cite: Tao, F. and Houlton, B.: Key limitations in enhanced weathering to remove carbon dioxide across agricultural soils, EGU General Assembly 2025, Vienna, Austria, 27 Apr–2 May 2025, EGU25-5064, https://doi.org/10.5194/egusphere-egu25-5064, 2025.

EGU25-7491 | Orals | BG8.11

The agronomic impact of enhanced weathering deployments in Sub-Saharan Africa: Insights from a smallholder field trial in Kisumu County, Kenya 

Fatima Haque, Vincent J. Clementi, Benjamin Möller, Laura Bastianini, Cavince Odhiambo, Susan Sagina, and Sam Davies

Warm and humid climatic conditions in tropical regions can optimise the efficiency of enhanced rock weathering (ERW) as a carbon dioxide removal pathway. However, the potential of agronomic co-benefits (e.g., yield, nutrition, soil health) that might result from treating crops with silicate rock powder are less constrained, particularly in the context of smallholder farming that is ubiquitous throughout tropical regions like Sub-Saharan Africa. In March 2024, Flux coordinated with the United Nations Convention to Combat Desertification (UNCCD) on a pilot study to assess the impact of ERW on crop performance at 56 smallholder farms in Kisumu County, Kenya using standard farming practices. Selected plots consisted of maize and baseline measurements indicate that soils were slightly acidic (6.4 on average). Each plot was divided into control and treatment sections, with the latter amended with mafic feedstock (0-4 mm) at a rate of 20 tonnes ha-1. Differences in soil parameters (e.g., pH, nitrogen, organic carbon, phosphorus) and crop metrics (e.g., grain yield, cob length, kernels per cob) between control and treatment plots were assessed. Yield data was collected at harvest, ca. 14 weeks after rock powder application and sowing, Our findings demonstrate significant agronomic benefits, with an average yield increase of 71.17% ± 15.5% and an aggregate yield increase of 47.47% ± 5.73% in maize yield on treatment plots compared with the control plots. While confirmation via post-application soil sampling is still outstanding, the observed yield increase is potentially attributable to the liming effect of the rock powder and to the contained mineral nutrients, in particular phosphorus. The monetary value of the yield increase is substantial, exceeding on average $326 USD ha-1. Collectively, our preliminary data from the UNCCD trial appear to demonstrate rapid impacts from ERW on agronomic performance in Kenya, translating to robust economic benefits at the community level.

How to cite: Haque, F., Clementi, V. J., Möller, B., Bastianini, L., Odhiambo, C., Sagina, S., and Davies, S.: The agronomic impact of enhanced weathering deployments in Sub-Saharan Africa: Insights from a smallholder field trial in Kisumu County, Kenya, EGU General Assembly 2025, Vienna, Austria, 27 Apr–2 May 2025, EGU25-7491, https://doi.org/10.5194/egusphere-egu25-7491, 2025.

Achieving targets of net-zero carbon emission requires a large-scale drawdown of carbon dioxide from the atmosphere. A sustainable solution provided through rock weathering of silicate and carbonates at glaciers has shown some carbon drawdown potentials, yet we still lack to fully understand this natural process for mitigating climate change. Conventional view of rock weathering recognizes carbonic acid mediated weathering of silicate and carbonate minerals as CO2 sink, yet we emphasize that weathering of sulphur bearing minerals (i.e., FeS2) counterbalance this CO2 sink for mountain glaciers. We studied the Dokriani glacier basin, central Himalaya as model system for long-term (1992-2018) and tested the CO2source or sink mechanism. Our results suggest a clear trend of CO2 release from Himalayan glaciers. Results suggests atmospheric CO2 sink driven through carbonic acid-mediated reactions during the early ablation periods, while a clear CO2 source through sulfuric acid-mediated reactions superseding the CO2 sinks during peak and late ablation periods was observed. The former tips the balance of the CO2 budget of the Himalayas from sink-to-source. The other glaciers of the central and western Himalayas are in good agreement with the present estimates. We surmise that these patterns are broadly applicable to the other orogenic systems of the world. These findings enhance our understandings for CO2 release potentials of mountain glaciers through glacial weathering, atmosphere and terrestrial systems.

How to cite: Shukla, T.:  Carbon release potential from enhanced sulfuric acid-mediated weathering is alarming for retreating Himalayan glaciers , EGU General Assembly 2025, Vienna, Austria, 27 Apr–2 May 2025, EGU25-8178, https://doi.org/10.5194/egusphere-egu25-8178, 2025.

EGU25-10422 | ECS | Orals | BG8.11

Modelling the impacts of enhanced rock weathering on soil-plant-carbon cycle: develop and benchmark on mesocosm and field experiments 

Ziyan Zhang, Gregory Jones, Salvatore Calabrese, Matteo Bertagni, Bonnie G Waring, and Athanasios Paschalis

Enhanced rock weathering (ERW) is a method of carbon dioxide removal (CDR) that relies on the weathering of mineral feedstock in the soil upper layers. Current ERW models, estimating CDR potential from the local site, primarily examine mineral dissolution and ion exchange processes via abiotic pathways within soil columns at mesocosm/plot scale. These models often simplify or overlook the interactions between soil, plants, and carbon dynamics under rock applications. Here, we present a novel integrated modelling approach, coupling an ERW model, SMEW (Bertagni et al., 2024), with the mechanistic ecohydrological model T&C-BG (Fatichi et al., 2019). Our coupled model T&C-SMEW can explicitly represent the hydrological, vegetation dynamics and soil biogeochemical cycling of carbon, nitrogen, phosphorus, potassium and micro-nutrients (Ca2+, Mg2+, Si) with the aid of T&C-BG, while incorporating mineral dissolution dynamics of SMEW. Additionally, T&C-SMEW accounts for key mechanisms such as a) biological weathering related to the release of H+ following realistic plant cation uptakes under varying environmental conditions, and b) strong acid weathering due to N fertiliser applications on crop field. Validated against both mesocosm and field experiments, T&C-SMEW can capture soil mineral exchanges and ecosystem carbon dynamics, demonstrating its reliability for representing ERW application in practical scenarios. By utilising T&C-SMEW, the direct CDR potential (e.g., mineral weathering) of ERW, its co-benefits (e.g., enhanced plant productivity), and associated environmental risks (e.g., phosphorus leaching) can be comprehensively assessed.

How to cite: Zhang, Z., Jones, G., Calabrese, S., Bertagni, M., Waring, B. G., and Paschalis, A.: Modelling the impacts of enhanced rock weathering on soil-plant-carbon cycle: develop and benchmark on mesocosm and field experiments, EGU General Assembly 2025, Vienna, Austria, 27 Apr–2 May 2025, EGU25-10422, https://doi.org/10.5194/egusphere-egu25-10422, 2025.

EGU25-11872 | ECS | Posters on site | BG8.11

Utilising soil centrifugation for accurate carbon dioxide removal estimates via enhanced rock weathering   

Gregory Jones, Ziyan Zhang, Katherine Clayton, Athanasios Paschalis, and Bonnie G Waring

Enhanced rock weathering (ERW) is emerging as a promising scalable carbon dioxide removal (CDR) strategy. However, the lack of methods for in situ quantification of rock weathering currently limits the ability to monitor, verify, and report CDR via ERW. Given the technical challenges of durable carbon sequestration in heterogeneous ecosystems where ERW is applicable, accurate and reliable validation of ERW is essential. Therefore, we propose a novel aqueous-phase extraction approach, the centrifugation pore water extraction sampling method, to obtain and analyse soil pore waters. Using a large-scale, replicated field trial of ERW combined with tree planting at an afforestation site in mid-Wales, we demonstrate that soil centrifugation provides a reliable method for extracting pore water necessary for accurate CDR estimations. This method was particularly effective during periods of low precipitation and associated low soil water content when conventional aqueous-phase methodologies fail to obtain sufficient pore water samples. Additionally, soil centrifugation provided estimates of potential CDR by analysing weathering products accumulating within soil micropores, an aspect not adequately addressed by conventional aqueous-phase methodologies. 

How to cite: Jones, G., Zhang, Z., Clayton, K., Paschalis, A., and Waring, B. G.: Utilising soil centrifugation for accurate carbon dioxide removal estimates via enhanced rock weathering  , EGU General Assembly 2025, Vienna, Austria, 27 Apr–2 May 2025, EGU25-11872, https://doi.org/10.5194/egusphere-egu25-11872, 2025.

EGU25-12326 | Orals | BG8.11

Agronomic co-benefits of enhanced rock weathering (ERW) with basalt applied to sugarcane grown on acidic soil in Brazil 

Philipp Swoboda, Christina S. Larkin, Mayra M. Rodrigues, Junyao Kang, Marcelo Santoro, Matthew O. Clarkson, and Mariane Chiapini

Enhanced weathering (EW) of silicate rocks such as basalt is a promising carbon dioxide removal (CDR) technology1. Various potential agronomic co-benefits are suggested for silicate rock powders in the tropics2 but there are few studies conducted under commercial field deployment conditions. 

In this study we report the effects of basalt rock powder applied to sugarcane grown on an oxisol in Brazil, SP. The experiment was directly embedded within the commercial fields of the farm and set up in August 2023 as a randomized block design with four treatments (0, 10, 50, 100t/ha; surface applied) and four replicates. Agronomic management was kept identical to the operations of the farm. Soil samples were analyzed for various soil health parameters including cation exchange capacity, pH, organic matter, and macro- and micronutrients. Different biometric parameters and nutrient uptake were measured in the sugarcane. Additionally, CO2 emissions were monitored and soil water was analyzed for pH, EC, DIC, and nutrients. Detailed multi-parameter results from one year of post-application monitoring of the experiment are presented, drawing comparison to positive yield results across the commercial scale deployment.


1 David J. Beerling et al., Nature 583, no. 7815 (July 2020): 242–48

2 Philipp Swoboda, Thomas F. Döring, and Martin Hamer, Science of The Total Environment 807 (February 10, 2022): 150976

How to cite: Swoboda, P., Larkin, C. S., Rodrigues, M. M., Kang, J., Santoro, M., Clarkson, M. O., and Chiapini, M.: Agronomic co-benefits of enhanced rock weathering (ERW) with basalt applied to sugarcane grown on acidic soil in Brazil, EGU General Assembly 2025, Vienna, Austria, 27 Apr–2 May 2025, EGU25-12326, https://doi.org/10.5194/egusphere-egu25-12326, 2025.

Enhanced Rock Weathering (ERW) has emerged as a scalable carbon dioxide removal (CDR) strategy, but its widespread adoption is limited by the lack of cost-effective and accurate Monitoring, Reporting, and Verification (MRV) methods. To address this challenge, we have developed a novel in-situ alkalinity-efflux sensor capable of real-time monitoring of carbon removal in ERW fields. The proprietary sensor measures alkalinity efflux directly and continuously in soil leachates, transmitting high-resolution data via IoT integration.
 
Ongoing pilot deployments of these sensors are generating unprecedented alkalinity efflux data, providing a new level of temporal resolution for ERW monitoring. Initial findings offer unique insights into the dynamics of alkalinity efflux following mineral application, the effects of precipitation events, and spatial heterogeneity of alkalinity efflux. These data represent a critical advancement in understanding ERW processes, and key analyses will be presented at the conference.
 
This sensor-based MRV solution significantly reduces measurement costs and improves scalability while enabling precise optimization of ERW project designs and robust assessments of CDR potential. By addressing key barriers to ERW adoption, our work positions sensor-based monitoring as a transformative enabler for carbon credit markets and broader climate solutions, advancing the global carbon removal portfolio.

How to cite: Michel, P.: In-Situ Alkalinity Efflux Monitoring: A Novel Sensor for ERW Applications, EGU General Assembly 2025, Vienna, Austria, 27 Apr–2 May 2025, EGU25-12475, https://doi.org/10.5194/egusphere-egu25-12475, 2025.

EGU25-12717 | Orals | BG8.11

Synergistic effects of co-application and co-pyrolysis of biochar and enhanced weathering materials for CO2 removal in an Oxisol 

Maria-Elena Vorrath, Thorben Amann, Tobias Linke, Johannes Meyer zu Drewer, Nikolas Hagemann, Cierra Aldrich, Janine Börker, Maria Seedtke, Mathilde Hagens, Annette Eschenbach, and Jens Hartmann

To achieve the 2°C climate goal various carbon dioxide removal (CDR) technologies are being developed. Biochar obtained from biomass pyrolysis contains persistent carbonaceous compounds and offers benefits when applied to soil, including enhanced soil fertility, and improved water retention. Additionally, the application of natural rocks for enhanced rock weathering (ERW) in agricultural soil is gaining attention for its potential to sequester CO2, while increasing soil pH and providing essential nutrients. Given the promising potential of both biochar and ERW as CDR technologies, their combined application could offer synergistic effects, making it crucial to understand their interaction. However, research on their co-application of biochar and rock powder as well as co-pyrolysis of biomass with rock powder (yielding rock enhanced biochar) remains limited.

This study quantified alkalinity and ion releaseOxisol soil columns after addition of wood and straw biochar, rock-enhanced biochar or co-application of biochar and rock powder. In total 9 treatments were incubated for 27 weeks under elevated CO2 conditions with 10 leachate sampling events. First results show high initial fluxes of total alkalinity and dissolved inorganic carbon as well as dissolved organic carbon and nutrients, which decrease over time. Notably, pCO2 has minimal impact on the pyrogenic carbon, while it doubles the total alkalinity flux from ERW. While biochar alone creates a larger carbon sink, co-applying rock powder enhances mineral fertilization and increases the weight of biochar pellets. Soil amendments with biochar further prevent a water logging of the clayey Oxisol, enabling rock weathering and alkalinity fluxes to continue.

How to cite: Vorrath, M.-E., Amann, T., Linke, T., Meyer zu Drewer, J., Hagemann, N., Aldrich, C., Börker, J., Seedtke, M., Hagens, M., Eschenbach, A., and Hartmann, J.: Synergistic effects of co-application and co-pyrolysis of biochar and enhanced weathering materials for CO2 removal in an Oxisol, EGU General Assembly 2025, Vienna, Austria, 27 Apr–2 May 2025, EGU25-12717, https://doi.org/10.5194/egusphere-egu25-12717, 2025.

EGU25-13189 | Posters on site | BG8.11

 “Long effects of enhanced rock weathering: the first two years of The Decade Experiment” 

Cian Evans, Sean Meagher, Chu-Hsien Tsai, and Benjamin Houlton

Enhanced rock weathering - the introduction of alkaline minerals into agricultural soil - is a promising atmospheric carbon dioxide removal technology that could scale to billions of tonnes of carbon sequestration annually. However, many questions remain over the speed and magnitude of ERW’s efficacy and the longer term consequences of repeated rock dust applications for sustained carbon removal, soil health benefits, and improved crop yields. A number of studies have tested the effect of alkaline mineral additions under field settings, indicating potential for CDR and improved cropping conditions and soil properties. These studies were performed for one to a few years, however global ERW potential will require applications over the majority of Earth’s croplands for decades. Here we present the results from the initial two years of a ten year trial, The Decade Experiment, involving ERW with metabasalt (CaSiO3, MgSiO3) in cropland soil planted with Zea mays (field corn) in upstate New York. We also present results from agriculture lime additions in the same setting to ascertain the differences between ERW with silicate rocks vs. direct carbonate rock additions. The study was initiated over three acres in 2023 following a systematic step-down model whereby rock dust amendments will be applied annually for up to ten years, with individual rows spanning between zero (control conditions) to ten years of annual rock dust amendments. This entails plots receiving only one year of amendment, followed by two years, traversing all annual increments to ten years of annual rock dust additions for the final plots. With this approach we seek to investigate the effects of single rock dust additions compared to multiples of years of amendments systematically spanning a full decade of continuous measurements from all treatments. 

Carbon dioxide removal was examined by extracting soil pore water with negatively pressurized porous ceramic lysimeters. Lysimeters were installed at two depths, 15 cm and 30 cm, and continuously monitored over the 2023 and 2024 growing season, with 1192 samples collected across all treatments. Measured dissolved inorganic carbon (DIC) and calculated alkalinity of the soil pore water were used to determine carbon removal efficiency, since the initial step in weathering involves silicate minerals reacting with dissolved CO2 to form bicarbonate following Holzer et al. 2023. Bicarbonate concentrations of soil pore waters increased by 10% in the two year amended plots compared to control at the 15 cm sampling depth. Soil pH and cation exchange capacity (CEC) were higher on average in amended soils compared to untreated controls, indicating soil chemical transformation due to ERW. Yield of Zea mays was observed to increase in plots amended with 44.8 t/ha for two years relative to control and the plot only treated for one year. Metabasalt amendments increased yields with repeated application, improved soil quality, and sequestered carbon. These initial two year results will continue to be explored over the next ten years to understand the long-term consequences of ERW, including benefits and risks for carbon removal, soil health and crop yields in The Decade Experiment. 

How to cite: Evans, C., Meagher, S., Tsai, C.-H., and Houlton, B.:  “Long effects of enhanced rock weathering: the first two years of The Decade Experiment”, EGU General Assembly 2025, Vienna, Austria, 27 Apr–2 May 2025, EGU25-13189, https://doi.org/10.5194/egusphere-egu25-13189, 2025.

EGU25-14165 | ECS | Orals | BG8.11

Mineral Formation during Ocean Alkalinity Enhancement Laboratory Experiments 

Mohammed Hashim, Frieder Klein, Matthew Hayden, and Adam Subhas

Ocean alkalinity enhancement (OAE) is a potential ocean-based carbon dioxide (CO2) removal approach that involves the addition of alkaline substances to the marine environment to increase seawater buffering capacity and allow it to absorb more atmospheric CO2. Increasing seawater alkalinity can trigger mineral precipitation, consuming the added alkalinity and decreasing OAE efficiency. To explore mineral formation as a result of alkalinity addition, we present results from laboratory experiments conducted by adding alkalinity as an aqueous solution of either NaOH or Na2CO3 to unfiltered seawater collected from Vineyard Sound near Woods Hole, Massachusetts, USA. The seawater used in the experiments is characterized by an average total alkalinity (TA) value of 2158 µmol/kg and an average dissolved inorganic carbon (DIC) value of 2043 µmol/kg.  The amount of alkalinity added was 2000, 5000, and 10000 µmol/kg. The carbonate chemistry was monitored through time by measuring TA and DIC, which were used to calculate the saturation state Ω with respect to a number of minerals including carbonates and brucite. The amount and mineralogy of the precipitate through time were determined in order to monitor the mineralogical changes of the precipitated phases. Results show that mineral precipitation took place in all experiments where alkalinity was enhanced except in the experiment where 2000 µmol/kg was added as Na2CO3. In all experiments where precipitation was visually observed, TA and DIC decreased with time. In the NaOH experiments, TA decreases while DIC remained constant for a period of time, followed by the decrease of both TA and DIC in a 2:1 ratio. In the Na2CO3 experiments, TA and DIC decreased in a 2:1 ratio throughout the duration of the experiment. These trends are interpreted to reflect the initial precipitation of brucite followed by carbonate minerals in the NaOH experiments and the precipitation of only carbonate minerals in the Na2CO3 experiments. Raman Spectroscopy data confirmed the formation of brucite, aragonite, and vaterite in the NaOH experiments and aragonite in the Na2CO3 ones. Thermodynamic modeling results are consistent with these observations and show that alkalinity addition makes seawater supersaturated with respect to all the minerals that are observed to precipitate. Collectively, our data indicate that adding alkalinity to seawater induces the precipitation of various minerals and that the mineralogy of the precipitate is dependent on the form of alkalinity addition (i.e., as NaOH or Na2CO3). Moreover, the precipitate mineralogy changes through time, pointing to a dynamic system characterized by mineral precipitation, dissolution, and transformation. Importantly, determining what minerals form under what conditions is critical to evaluate the efficiency of OAE at sequestering CO2.

How to cite: Hashim, M., Klein, F., Hayden, M., and Subhas, A.: Mineral Formation during Ocean Alkalinity Enhancement Laboratory Experiments, EGU General Assembly 2025, Vienna, Austria, 27 Apr–2 May 2025, EGU25-14165, https://doi.org/10.5194/egusphere-egu25-14165, 2025.

EGU25-15975 | Orals | BG8.11

Novel extraction method designed to estimate the topsoil pore water reservoir of carbon dioxide removal through enhanced weathering of silicate minerals 

Kirstine Skov, Anezka Radkova, Yit Arn Teh, Mike Kelland, Tom Reershimius, David Manning, Amy Frew, Giulia Gazzagon, Tzara Bierowiec, Erin Chen, Sophie Harrity, Kitty Agace, Rosalie Tostevin, Will Turner, and XinRan Liu

Enhanced weathering (EW) of silicate minerals on agricultural fields is a promising natural carbon dioxide removal (CDR) method that has potential co-benefits for soil health and crop safety. However, the scalability of EW is suffering from labor-intense requirements of soil pore water extraction for monitoring, reporting and verification (MRV) of carbon credits. Furthermore, in-field extraction of soil pore water for MRV can be challenging as existing methods, such as rhizon samplers or ceramic suction cups, may lose vacuum or be ineffective at low moisture levels, leading to insufficient volumes of sample obtained for chemical analysis. Critically, the volume of soil from which pore water is drawn using these conventional methods will differ depending on soil moisture content and pore connectivity, making it difficult to determine the precise volume of soil sampled and consequently adding further uncertainty to CDR estimates. Here, a novel method for extracting weathering products from soil for determination of EW and CDR (termed “SAT-C”) is presented. SAT-C attempts to alleviate some of the limitations of traditional soil pore water extraction by obtaining weathering products from a known soil volume. In the SAT-C approach, a soil sample is saturated using de-ionized water and subsequently centrifuged in order to separate the sample into aqueous and solid phases, both of which are later analyzed for weathering products. In this study, SAT-C was applied to cores extracted from the upper 5-10 cm of the soil profile at two different EW deployment sites, where conventional rhizon and ceramic suction cups are also installed at 10 and 5-10 cm depths, respectively. Base cation and anion concentrations for all three methods were in the same order of magnitude. Estimated bicarbonate from the charge balance of major cations and anions correlated well with measured alkalinity across the two different soil types. In addition to comparable pore water chemistry, the SAT-C method offers the quantitative estimation of water filled porosity (which is needed for a direct measure for the field wide pore water reservoir of CDR at that point in time) that conventional methods lack. Furthermore, the method is not inhibited by low levels of field moisture during the crop growing season.

How to cite: Skov, K., Radkova, A., Arn Teh, Y., Kelland, M., Reershimius, T., Manning, D., Frew, A., Gazzagon, G., Bierowiec, T., Chen, E., Harrity, S., Agace, K., Tostevin, R., Turner, W., and Liu, X.: Novel extraction method designed to estimate the topsoil pore water reservoir of carbon dioxide removal through enhanced weathering of silicate minerals, EGU General Assembly 2025, Vienna, Austria, 27 Apr–2 May 2025, EGU25-15975, https://doi.org/10.5194/egusphere-egu25-15975, 2025.

EGU25-16173 | Posters on site | BG8.11

The relative importance of grain size and mineral weatherability for enhanced rock weathering rates: a comparison of glacial rock flour and basaltic feedstocks 

Christiana Dietzen, Franky Barton, Eric Oppong Danso, David Foster, Jens Hammes, Malgorzata Rizzi, and Minik Rosing

There is currently no consensus in the literature as to whether the mineralogical composition and theoretical weatherability or grain size and surface area of feedstock materials used for carbon capture via enhanced rock weathering are stronger determinants of weathering rates of silicate minerals applied to agricultural soils. Felsic source rocks have typically been discounted for enhanced rock weathering in favor of more easily weatherable mafic and ultramafic rocks. However, previous work has indicated that Greenlandic glacial rock flour, a potential feedstock with an exceedingly fine grain size (d50 = 2.6 µm) but a felsic composition, can weather at sufficiently rapid rates to be effective for carbon capture and improving crop yields through the release of nutrients during weathering. Here we present initial experimental results comparing the use of Greenlandic glacial rock flour and several sources of basaltic material as feedstocks for enhanced rock weathering. Two field trials installed in Ghana and South Carolina demonstrate the varying effects of these materials on maize yield, and two flow-through laboratory experiments, one with plants and one without, assess the differences in alkalinity generation and cation release between these feedstocks over time. Among the tested basalts, chemical composition seems to be a stronger driver of weathering rates than differences in grain size. However, none were as finely ground as the glacial rock flour, which was found to weather at a rate comparable to or, in some cases, higher than the basaltic materials, despite being composed of less chemically reactive minerals. These results suggest that mineral weatherability is an important predictor of weathering rates, but with a large enough difference in grain size the amount of surface area available for reaction can be equally important.  

How to cite: Dietzen, C., Barton, F., Oppong Danso, E., Foster, D., Hammes, J., Rizzi, M., and Rosing, M.: The relative importance of grain size and mineral weatherability for enhanced rock weathering rates: a comparison of glacial rock flour and basaltic feedstocks, EGU General Assembly 2025, Vienna, Austria, 27 Apr–2 May 2025, EGU25-16173, https://doi.org/10.5194/egusphere-egu25-16173, 2025.

EGU25-18005 | ECS | Posters on site | BG8.11

Contribution of dissolved organic carbon to total alkalinity  

Lukas Rieder, Mathilde Hagens, Reinaldy Poetra, Alix Vidal, Tullia Calogiuri, Anna Neubeck, Abhijeet Singh, Thomas Corbett, Harun Niron, Sara Vicca, Siegfried Vlaeminck, and Jens Hartmann

Multiple measurements can be used to quantify the carbon dioxide (CO2) captured during enhanced rock weathering (ERW) applications. In most terrestrial applications, CO2 is dominantly stored as carbonate alkalinity inside the water. Total alkalinity (TA) is often taken as a measure of the CO2 stored in the water. However, the contribution of acids other than carbonic acid to mineral dissolution and, thus, to the generated alkalinity must be studied closely to reliably quantify CO2 capture.
 
In this study, we test how dissolved organic carbon (DOC) impacts non-carbonate alkalinity and the charge balance error of leached waters from a microcosm experiment using organo-mineral mixtures under ambient conditions. Furthermore, we quantified the concentrations of several low-molecular-weight organic acids to assess which conjugate base anions impact TA.
 
Our results reveal a substantial contribution of DOC to non-carbonate alkalinity, yielding a ratio of 3.5 mol DOC per eq of non-carbonate alkalinity. Moreover, we found a positive correlation between DOC levels and charge balance error, indicating that some of the conjugate base anions of the organic acids remained deprotonated in the titration procedure. Acetate anions found in the DOC-rich water samples further support the notion that organic acids have impacted mineral dissolution. The microcosm experimental data show parallels to natural ERW processes in organic-rich soils, demonstrating that organic acid contributions are relevant in mineral dissolution dynamics. These insights are relevant for carbon accounting in terrestrial ERW practices, where TA is often assumed to be solely carbonate alkalinity despite varying environmental conditions.

How to cite: Rieder, L., Hagens, M., Poetra, R., Vidal, A., Calogiuri, T., Neubeck, A., Singh, A., Corbett, T., Niron, H., Vicca, S., Vlaeminck, S., and Hartmann, J.: Contribution of dissolved organic carbon to total alkalinity , EGU General Assembly 2025, Vienna, Austria, 27 Apr–2 May 2025, EGU25-18005, https://doi.org/10.5194/egusphere-egu25-18005, 2025.

EGU25-18512 | Orals | BG8.11

Enhanced rock weathering for improved farmer welfare in the Global South: An at-scale case study for rice agriculture in India 

Jacob Jordan, Anikendra Das, Jonah Bernstein-Schalet, Shantanu Agarwal, Noah Planavsky, and David Beerling

Mati Carbon uses basalt-based Enhanced Rock Weathering (ERW) to supplement the income of smallholder farmers while promoting climate resilience. In facilitating future participation in carbon markets for smallholder farmers, Mati provides opportunities for agronomic benefits for individual partnered farmers while paving the way towards economically viable, gigaton scale CDR in regions throughout the Global South.    

Currently, Mati operates at scale (100,000 tons of basalt deployable per annum) at centralized locations within Chhattisgarh and Madhya Pradesh. These states of India have a large number of smallholder rice paddy farmers. The regional Indian farming practice involves flooding and vigorous wet tilling of rice paddies, creating homogenized soil ideal for basalt integration. Rice paddies have two primary growing seasons: Rabi (winter, dry season) and Kharif (summer, monsoonal season). 

For each deployment, Mati monitors the crop yield for all enrolled farmers. Many of our partnered farmers do not deploy basalt on all of their fields, which allows for comparison of the crop yield in deployed versus control plots.  Along with biomass measurements and crop density estimations, we conduct detailed farmer surveys to monitor the agricultural practices of each enrolled farmer and the performance of their crops after ERW deployment. Additionally, rice yield estimates from farmers are reported to the Indian government.

In 2024 Mati deployed 22,402 metric tons of basalt with 344 farmers at the Madhya Pradesh site and 49,880 metric tons with 711 farmers in Chhattisgarh.  In 2023 Mati deployed 7,898 metric tons of basalt with 293 farmers in Chhattisgarh.  Here, we compare mean yield changes for rice production across the Kharif (summer monsoonal season).  Combining internally collected survey data and rice yield figures reported to the government, we conduct a meta-analysis of the rice yield data from our partnered farmers. We report significant mean production increases for rice yield.  Throughout the Chhattisgarh Kharif in 2023 the mean increase for rice productivity (kg/ac) was 14.39% (n=162).  In the 2024 Kharif, the mean increase in rice yield at Chhattisgarh was 27.79% (n=44).  In the 2024 Kharif season at Madhya Pradesh, the mean measured yield increase was 18.79% (n=18).  We estimate that partnered smallholder farmers in India benefitted by an integrated income increase of over one million dollars through our 2024 ERW deployments.  This income increase is due to both incremental increases in productivity and reduced input costs. 


How to cite: Jordan, J., Das, A., Bernstein-Schalet, J., Agarwal, S., Planavsky, N., and Beerling, D.: Enhanced rock weathering for improved farmer welfare in the Global South: An at-scale case study for rice agriculture in India, EGU General Assembly 2025, Vienna, Austria, 27 Apr–2 May 2025, EGU25-18512, https://doi.org/10.5194/egusphere-egu25-18512, 2025.

Keywords: Enhanced Rock Weathering, Carbon Dioxide Removal, Life Cycle Analysis, Sustainable Supply Chain, Southeast Asia

Enhanced Rock Weathering (ERW) carbon credit development practices have predominantly been conducted in non-tropical regions, often hindered by the lack of robust Measurement, Reporting, and Verification (MRV) methodologies. In response to the pressing demand for scalable and durable carbon removal solutions, this research investigates the deployment of ERW on agricultural land in Southeast Asia to generate high-quality carbon credits. Using Life Cycle Analysis (LCA) to assess emissions and Techno-Economic Analysis (TEA) for credit generation, we evaluated key processes including feedstock processing, transportation, deployment, MRV, and post-application activities. Addressing debates surrounding the potential overestimation of ERW’s carbon removal capabilities, we incorporated MRV into the credit life cycle—a component surprisingly overlooked in existing literature despite its substantial contribution to emissions and costs. Furthermore, our study goes beyond conventional carbon offsetting by integrating ERW within supply chains to enable carbon insetting, offering added benefits to both upstream and downstream stakeholders. Ultimately, this research lays a critical foundation for refining ERW carbon credit methodologies by improving Scope 3 emissions quantification, thereby advancing sustainable supply chains and contributing to global climate mitigation objectives.

How to cite: Zhang, Y. and Redfern, S.: Potentials of Enhanced Rock Weathering (ERW) Carbon Insetting in Southeast Asia to Form a More Sustainable Supply Chain: Life Cycle Analysis and Techno-Economic Analysis, EGU General Assembly 2025, Vienna, Austria, 27 Apr–2 May 2025, EGU25-18551, https://doi.org/10.5194/egusphere-egu25-18551, 2025.

EGU25-18780 | ECS | Posters on site | BG8.11

Evaluating Total Cation Accounting (TCA) as an MRV Approach for Enhanced Rock Weathering - Insights from a trial in Ontario, Canada 

Amanda Stubbs, Rosalie Tostevin, Matthew Healey, Kirstine Skov, Will Turner, Giulia Cazzagon, Talal Albahri, Tzara Bierowiec, Lucy Jones, Zoe Couillard, Josh Couillard, Courtney Stadtke, Gabrielle Janfield, Logan Wisteard, Declan DeJordy, Daniel Chaput, and XinRan Liu

Enhanced rock weathering is a promising carbon dioxide removal (CDR) technology that involves the dissolution of silicate minerals (e.g., wollastonite). This process releases elements such as calcium, which can remain in solution and be charge balanced by bicarbonate, or be stored as pedogenic carbonate or on soil exchange sites. To verify carbon removal credits, robust monitoring, reporting, and verification (MRV) approaches are essential. In this study, we explore total cation accounting (TCA) as a novel method for MRV. TCA involves conducting a total digest of a soil-feedstock mixture in the near-field zone (NFZ; here defined as 15 cm) and analysing the major cation content via Inductively Coupled Plasma Optical Emission Spectroscopy. The resulting data include baseline cations in the soil (pre-spread), residual feedstock (post-spread), and weathered cations bound to exchange sites or forming carbonate minerals (post-spread). The major cations (Ca, Mg, K, Na) are summed to calculate total cations, and net cation loss from the NFZ is used to determine CDR.

This study uses data from a small plot monitoring site (SPMS; 4x10 m) in Ontario, Canada, where Canadian Wollastonite feedstock was applied at four different densities (0, 5, 50, and 100 t/ha) in November 2023. Soil samples were collected across the SPMS using a 20:1 composite of 15 cm soil cores. The soils were finely crushed to preserve the distribution of larger feedstock particles, ensuring homogeneity and maintaining a representative soil-to-feedstock ratio.

Prior to spreading, cation concentrations in both treatment and control groups were clustered around a similar mean, representing the baseline soil composition. Samples collected post-spread show an increase in cation content on treatment plots, demonstrating that the addition of our feedstock is resolvable, even in settings with unusually high background soil Ca content. All subsequent samples show cation content decreasing relative to the post-spread levels, indicating cations have been exported into the far-field zone (FFZ) or lost via plant uptake or solid transport. The results are consistent with other MRV approaches applied on the same field trial, although our results suggest that other methods can underestimate CDR. One advantage of TCA over competing MRV methods is that the results are time-integrative, meaning the signal-to-noise ratio improves with longer sampling intervals. These first field trials using this approach demonstrate its potential as a scalable, robust methodology for MRV in ERW trials.

How to cite: Stubbs, A., Tostevin, R., Healey, M., Skov, K., Turner, W., Cazzagon, G., Albahri, T., Bierowiec, T., Jones, L., Couillard, Z., Couillard, J., Stadtke, C., Janfield, G., Wisteard, L., DeJordy, D., Chaput, D., and Liu, X.: Evaluating Total Cation Accounting (TCA) as an MRV Approach for Enhanced Rock Weathering - Insights from a trial in Ontario, Canada, EGU General Assembly 2025, Vienna, Austria, 27 Apr–2 May 2025, EGU25-18780, https://doi.org/10.5194/egusphere-egu25-18780, 2025.

EGU25-19360 | ECS | Orals | BG8.11 | Highlight

Evaluating the performance of ion-exchange resin devices as an MRV tool in mesocosm-scale weathering experiments 

Tamara Michaelis, Gabrielle Faria, Christian Bisping, Wolf-Anno Bischoff, Andreas Schwarz, and Tony Oehm

Despite increasing scientific interest in Enhanced Rock Weathering (ERW) and a rapid growth of commercial operations in this field, reliable and affordable methods for Monitoring, Reporting and Verification (MRV) remain a critical challenge for upscaling. Soil-based MRV methods provide an upper-bound estimate for Carbon Dioxide Removal (CDR) established through the quantification of feedstock weathering rates. However, robust CDR calculations require accounting for various cation loss pathways, such as plant uptake and soil sorption, necessitating extensive and costly measurements, each with the potential to introduce uncertainty into the CDR estimate. Porewater-based MRV methods, which aim to quantify the export of CDR-relevant aqueous-phase weathering products, also present challenges. These methods typically rely on specialized water extraction instruments that can be expensive to procure, install and maintain, and may not function reliably under low soil moisture conditions. Furthermore, solute flux calculations derived from discrete porewater samples are dependent on accurate water balance estimates, and often involve interpolating data gaps, potentially introducing uncertainty. As commercial ventures continue to explore ERW, developing reliable and scalable MRV methodologies is essential for ensuring the credibility and widespread adoption of this CDR strategy.

We propose the use of ion-exchange resin devices, known as Self-Integrating Accumulators (SIAs), as a potential improvement for MRV of ERW. Originally developed to determine nutrient leaching in soils1, SIAs offer the potential for cost-effective and robust time-integrated measurements of subsoil cation and anion fluxes relevant to CDR quantification. The performance of SIAs adapted for this purpose was evaluated in a series of mesocosm-scale weathering experiments, primarily designed to assess the adsorption efficiency and recovery rates of major ions used for MRV.

Preliminary experiments, utilizing basaltic feedstock (applied at an equivalent rate of 200 t/ha) and agricultural soil sourced from western Germany, demonstrated high (>90%) major ion adsorption efficiencies by SIA devices, despite the induction of strong weathering fluxes. The second phase of this research employed a lower application rate (100 t/ha) to more closely simulate feasible operational deployments. We present here initial findings from this series of experiments, aiming to demonstrate the applicability of SIAs for large-scale ERW deployments, which we believe could significantly improve the accuracy, cost-effectiveness, and efficiency of MRV.

References

1Bischoff, Wolf-Anno. 2007. “Development and Applications of the Self-Integrating Accumulators: A Method to Quantify the Leaching Losses of Environmentally Relevant Substances.” PhD Thesis, Berlin, Germany: Technische Universität Berlin. https://depositonce.tu-berlin.de/items/64e16848-244b-4b50-920c-8d835efda918.

How to cite: Michaelis, T., Faria, G., Bisping, C., Bischoff, W.-A., Schwarz, A., and Oehm, T.: Evaluating the performance of ion-exchange resin devices as an MRV tool in mesocosm-scale weathering experiments, EGU General Assembly 2025, Vienna, Austria, 27 Apr–2 May 2025, EGU25-19360, https://doi.org/10.5194/egusphere-egu25-19360, 2025.

EGU25-19914 | Posters on site | BG8.11

The Impact of Soil Texture on Basalt-Enhanced Rock Weathering: Insights from a Field Mesocosm Study in a Temperate Climate. 

Giulia Cazzagon, Kirstine Skov, Anezka Radkova, Amy Frew, Amanda Stubbs, Matthew Healey, Erin Chen, Sophie Harrity, Kitty Agace, XinRan Liu, and Tzara Bierowiec

Enhanced rock weathering is a promising carbon removal technique that uses the natural process of silicate minerals weathering to capture atmospheric CO₂. This research investigates the relationships between soil texture and the dynamics of basalt-enhanced rock weathering products in a controlled mesocosm experiment. Mesocosms were constructed with three soils of distinct textures: sandy silty loam, sandy loam, and clay, each treated with 0-4 mm crushed basalt rock at an application rate of 100 tons per hectare, alongside control treatments. The duration of the experiment is one year, with pore water collected biweekly using rhizon samplers at depths of 10 cm and 20 cm, as well as leachate samples taken from 30 cm at the bottom of the cores. The crop grown on the soil mesocosms was perennial rye grass at a seeding rate similar to agronomic best practice densities. Results from the experiment include a comprehensive analysis of pore water, solid soil samples (after termination of the experiment), as well as crop uptake. The results indicate that basalt weathering is happening in amended samples compared to control mesocosms across all soil types, however with different responses in pore water concentrations between each soil type. Towards the end of the experiment clear differences between treatment and control are observed in the pore water concentrations of cations in the sandy and loamy soil types, whereas the concentration of cations appears to be similar in the clayey soil type. The variation in response is likely driven by the water retention capacity and cation exchange capacity of each soil type. Understanding the patterns for each soil type is important for accurately measuring MRV and evaluating carbon capture potential in different environments. This research provides an important empirical understanding that can aid in advancing weathering predictions through geochemical models.

How to cite: Cazzagon, G., Skov, K., Radkova, A., Frew, A., Stubbs, A., Healey, M., Chen, E., Harrity, S., Agace, K., Liu, X., and Bierowiec, T.: The Impact of Soil Texture on Basalt-Enhanced Rock Weathering: Insights from a Field Mesocosm Study in a Temperate Climate., EGU General Assembly 2025, Vienna, Austria, 27 Apr–2 May 2025, EGU25-19914, https://doi.org/10.5194/egusphere-egu25-19914, 2025.

EGU25-20138 | Posters on site | BG8.11

Quantifying Carbon Dioxide Removal using Pore Water Data from Enhanced Rock Weathering Field Trials in Scotland 

XinRan Liu, Kirstine Skov, Amanda Stubbs, Joey Betz, Peter Wade, Talal Albahri, Giulia Cazzagon, Matthew Healey, Anezka Radkova, Utku Solpuker, Will Turner, and Jez Wardman

Enhanced rock weathering (ERW) has emerged as a promising carbon dioxide removal (CDR) strategy, with tens of dedicated EW commercial entities having been set up in the last three years. UNDO is one of these, with commercial operations across the Northern United Kingdom and Eastern Canada.

Commercial entities selling CDR, like UNDO, are required to measure, verify and report how much CO2 has been removed at regular time intervals. However, different methods of CDR quantification are likely to produce different numbers, depending on where the measurement has taken place (e.g., soil-based measurement vs a pore-water sample). 

We propose an approach that uses pore water concentrations in conjunction with climate data to more robustly estimate CDR per unit area of land, as new pore water data is generated. This approach allows us to estimate the amount of charge-balanced bicarbonate/carbonate ions that are transported past a certain depth point. 

Furthermore, our method is compared against other indicators of weathering processes, such as exchangeable cations and carbonate precipitation. For these calculations and comparisons, we will use data from a field trial that has been running for 2 years. 


How to cite: Liu, X., Skov, K., Stubbs, A., Betz, J., Wade, P., Albahri, T., Cazzagon, G., Healey, M., Radkova, A., Solpuker, U., Turner, W., and Wardman, J.: Quantifying Carbon Dioxide Removal using Pore Water Data from Enhanced Rock Weathering Field Trials in Scotland, EGU General Assembly 2025, Vienna, Austria, 27 Apr–2 May 2025, EGU25-20138, https://doi.org/10.5194/egusphere-egu25-20138, 2025.

EGU25-21583 | ECS | Posters on site | BG8.11

Can Enhanced Rock Weathering become a significant component of Urban Farming?  

Zhaofeng Ouyang and Simon Redfern

Enhanced Rock Weathering (ERW) has emerged as a promising climate mitigation strategy, with many studies recommending annual application rates of 40–50 tonnes per hectare to maintain high, observable weathering rates. However, our analysis of 23 ERW field deployments reveals that such substantial application volumes may not significantly improve net carbon dioxide removal efficiency and could pose potential ecological risks to farmland and aquatic ecosystems1,2. As an alternative, we propose integrating ERW into urban farming systems as a sustainable carbon dioxide removal (CDR) technology.

Urban farming systems, such as hydroponic and vertical farms, increasingly considered in future food production, offer unique opportunities for ERW deployment3. With 68% of the global population projected to live in urban areas by 20504, these systems are positioned to stabilise food security while supporting climate mitigation efforts. Incorporating ERW into these controlled environments offers several advantages. Unlike conventional field applications, the closed-loop cycling of carbon dioxide and water within urban farming systems enables precise monitoring and adjustment of key variables, including weathering products such as alkalinity and dissolved inorganic carbon (DIC) levels. These parameters can be efficiently tracked using cost-effective Monitoring, Reporting, and Verification (MRV) methods, potentially outperforming traditional field-based MRV methodologies in terms of accuracy and affordability.

This approach not only enhances the carbon dioxide removal efficiency of ERW but also aligns with the sustainable intensification of food production. By integrating ERW into urban farming systems, we propose a novel pathway for simultaneously mitigating climate change and addressing food security challenges.

References:

Calabrese, S. et al. (2022) ‘Nano- to Global-Scale Uncertainties in Terrestrial Enhanced Weathering’, Environmental Science and Technology. Available at: https://doi.org/10.1021/acs.est.2c03163.

Strefler, J. et al. (2018) ‘Potential and costs of carbon dioxide removal by enhanced weathering of rocks’, Environmental Research Letters, 13(3), p. 034010

United Nations(2018). 2018 Revision of World Urbanization Prospects 2018. https://www.un.org/en/desa/2018-revision-world-urbanization-prospects (Accessed: 2025/1/13)

Specht, K. et al. (2014) ‘Urban agriculture of the future: an overview of sustainability aspects of food production in and on buildings’, Agriculture and Human Values, 31(1), pp. 33–51. Available at: https://doi.org/10.1007/s10460-013-9448-4

How to cite: Ouyang, Z. and Redfern, S.: Can Enhanced Rock Weathering become a significant component of Urban Farming? , EGU General Assembly 2025, Vienna, Austria, 27 Apr–2 May 2025, EGU25-21583, https://doi.org/10.5194/egusphere-egu25-21583, 2025.

EGU25-21723 | Posters on site | BG8.11

Investigating the impact of three nitrogen fertilisers on enhanced weathering outcomes with limestone 

Kelsey Leet, Ruadhan Magee, Luke Crehan, and Maurice Bryson

The weathering of limestone (CaCO3) by carbonic acid (H2CO3) consumes atmospheric CO2, and due to weathering kinetics that are orders of magnitude faster than silicate rocks, is increasingly seen as a promising enhanced weathering material (Hamilton et al., 2007; Holden et al., 2024). In agricultural settings, however, lime is typically applied to counteract the soil acidifying effects of nitrogenous fertilisers and is therefore thought of as a CO2 source.. In brief, the nitrification of ammonium (NH4+) generates protons (H+) that, when neutralised by CaCO3, can result in direct CO2 emissions (Raza et al., 2021). However, not all nitrogen fertilisers are made equal and the net CO2 impact of lime differs according to fertiliser type and application rate. This study investigated the impact of three common fertiliser types on enhanced weathering outcomes in a 45-pot mesocosm experiment using homogenised loam soil planted with a spring barley crop. In order of most to least acidifying, the fertilisers investigated were protected urea (PU), calcium ammonium nitrate (CAN) and calcium nitrate (CN). In April 2024, lime was applied to ‘treatment’ pots at a rate of 5 tonnes hectare-1 in combination with PU, CAN and CN at two application rates (75 kg N hectare-1  and 150 kg N hectare-1),  while lime-only and fertiliser-only pots were established as controls. Leachate samples were collected from the bottom of each pot at bi-weekly intervals over a period of 8-months and measured for pH, total alkalinity, cations and anions to track weathering and CO2 uptake. Cation uptake in the barley crop and on soil exchange sites was measured at the end of the experiment to assess potential CO2 loss pathways. Finally, the dry weight of grain, leaf and stem, from the harvested barley crop was measured to assess the agronomic impacts of different treatment combinations. Preliminary results indicate that while nitrogen application rate had a significant impact on crop yield, neither fertiliser type nor application rate had a significant impact on net CO2 impact.

How to cite: Leet, K., Magee, R., Crehan, L., and Bryson, M.: Investigating the impact of three nitrogen fertilisers on enhanced weathering outcomes with limestone, EGU General Assembly 2025, Vienna, Austria, 27 Apr–2 May 2025, EGU25-21723, https://doi.org/10.5194/egusphere-egu25-21723, 2025.

EGU25-3138 | Orals | BG8.13

A novel metric for estimating the climatic effect of natural mire ecosystems 

Janne Rinne, Juha-Pekka Tuovinen, and Annalea Lohila

Mire ecosystems, i.e. peat forming wetlands, have sequestered carbon (C) from the atmosphere for millennia, storing it in peat and thus creating a negative perturbation on the atmospheric carbon dioxide CO2 content. At the same time the mires emit methane (CH4) into the atmosphere, creating a positive perturbation on the atmospheric content of this powerful greenhouse gas. Thus, the exchange of these greenhouse gases (GHG) by mires creates opposing radiative forcing (RF) components, with CO2 perturbation cooling and CH4 perturbation warming the climate.

The current methods for commensuration of climatic effects of these greenhouse gases, such as global warming potential (GWP) or sustained GWP-based approaches, are not applicable for quantification of the current climatic effect of natural mires, as they fail to consider the effect of accumulated carbon. We have developed a novel approach to quantify the current climate impact of these systems, based on accumulated carbon and methane emission (ACME). With certain assumptions it can be shown, both by simulations with an RF model and by analytical solutions of the governing equations, that the current RF of a mire ecosystem can be closely approximated by its carbon storage and average methane emission during the last 50 years.

The ACME metric is applicable for natural mires which have accumulated a significant part of their C storage more than 1000 years ago and have not experienced major disturbances within the last 500 years. The minimum requirement for input data for the ACME metric are the estimate of total C storage density and annual methane emission. The former can be obtained from one or more peat cores taken from peat surface to the mineral soil below. The annual methane emission can be obtained by eddy-covariance measurements or by chamber measurements. The ACME metric can be further elaborated by including the data on current annual CO2 exchange and N2O emission.

We demonstrate the feasibility of the ACME metric by applying it to a set of northern mire systems. The ACME based RF indicates the mires to have a cooling effect on climate, with C storage dominating their climatic effect. This is an opposite to the warming effect estimated by GWP-based approaches. Furthermore, we applied the ACME approach globally to the mires north of 45°N, using their estimated C storage and CH4 emission leading to their current RF to be between –0.45 and –0.23 W m-2.

How to cite: Rinne, J., Tuovinen, J.-P., and Lohila, A.: A novel metric for estimating the climatic effect of natural mire ecosystems, EGU General Assembly 2025, Vienna, Austria, 27 Apr–2 May 2025, EGU25-3138, https://doi.org/10.5194/egusphere-egu25-3138, 2025.

EGU25-6349 | Orals | BG8.13

Systematic Review of Greenhouse Gas Emissions from Peat and Organic-Rich Soils under Grassland and Cropland Management 

Örjan Berglund, Alena Holzknecht, Magnus Land, Jacynthe Dessureault-Rompré, Lars Elsgaard, and Kristiina Lång

Peat and organic-rich soils are critical carbon stores but are also major sources of greenhouse gas (GHG) emissions when drained for agriculture. In temperate and boreal regions, the conversion of cropland to grassland has been proposed as a strategy to mitigate emissions of carbon dioxide (CO₂), methane (CH₄), and nitrous oxide (N₂O). However, the effectiveness of this approach remains uncertain due to the complex interactions between soil properties, land management practices, and environmental conditions. This systematic review synthesises evidence from peer-reviewed field studies to assess the impact of grassland conversion on GHG emissions from peat and organic-rich soils.

Out of 10,352 records initially screened, 28 studies comprising 34 comparisons met the inclusion criteria, focusing on GHG fluxes under comparable field conditions. The analysis revealed that grassland systems do not universally reduce CO₂ or CH₄ emissions compared to croplands, with no statistically significant differences observed. In contrast, N₂O emissions showed a mean reduction of 7.55 kg N₂O ha⁻¹ yr⁻¹ in grasslands. However, this reduction was not robust across all scenarios and was influenced by key factors such as crop type, fertilisation, and drainage management. For example, excluding root crops from the cropland comparator significantly narrowed the observed differences in N₂O emissions, highlighting the critical role of cropping systems.

Grasslands with fertilisation often exhibited higher net ecosystem exchange (NEE) and net ecosystem carbon balance (NECB), indicating increased carbon losses that could counteract the benefits of reduced N₂O emissions. Furthermore, the findings challenge the Intergovernmental Panel on Climate Change (IPCC) guidelines, which assume consistently lower emissions from grasslands on organic soils. These results emphasise the need to reassess emission factors and refine policy recommendations for managing peatlands.

The review underscores the complexity of GHG fluxes in managed organic soils and highlights the limitations of grassland conversion as a standalone mitigation strategy. The variability in outcomes demonstrates the importance of considering site-specific factors, such as soil properties, hydrology, and climate, alongside management practices. Strategies like optimised water table management, reduced fertiliser inputs, and mixed cropping systems could complement grassland conversion to enhance its effectiveness in reducing GHG emissions.

Future research should prioritise long-term field experiments incorporating detailed soil and environmental characterisation, consistent methodologies, and comprehensive management data. Emphasis on cross-regional studies would also help address gaps in understanding how local conditions influence GHG dynamics. These efforts are essential for developing tailored, evidence-based strategies for mitigating emissions from peat and organic-rich soils.

This review provides valuable insights into the trade-offs and opportunities associated with grassland conversion, offering guidance for policymakers and land managers aiming to balance agricultural productivity with climate goals.

How to cite: Berglund, Ö., Holzknecht, A., Land, M., Dessureault-Rompré, J., Elsgaard, L., and Lång, K.: Systematic Review of Greenhouse Gas Emissions from Peat and Organic-Rich Soils under Grassland and Cropland Management, EGU General Assembly 2025, Vienna, Austria, 27 Apr–2 May 2025, EGU25-6349, https://doi.org/10.5194/egusphere-egu25-6349, 2025.

The agricultural sector contributes by approximately 22% of the global greenhouse gas emissions. Private carbon certification and emerging carbon markets offer farms a remuneration for sustainable, carbon-reducing and -sequestering practices (carbon farming). However, adopting carbon farming practices (e.g., inter- and cover cropping) requires a costly reorganization of the farm crop portfolio. This process carries uncertain elements such as additionality, leakage, and permanence of the carbon sequestration and thus future profitability of the altered portfolio (e.g., Paul et al. 2023). 

In fact, farms need to balance agricultural productivity, efforts (costs) for carbon sequestering, and respective certification and pricing for carbon. Scientific evidence on how the private carbon market may incentivize farms’ adopting carbon farming practices, however, appears limited. This research addresses the gap and explores how German farms would adjust their production programs in different carbon credit pricing scenarios. We surveyed 93 German arable farms to identify their current economically optimal (revenue maximizing) production program without carbon credit pricing. Afterwards, we simulated for each farm a new optimum for different price scenarios for carbon credits using a linear programming approach and the farms’ land and labor constraints as indicated in the survey.

Our results suggest that relative to the farms’ baseline, an emission reduction of about 5 kg carbon dioxide equivalent (CO2e) per hectare is realistically to be achieved at the current price level of €35 per ton of CO2e. The reduction of carbon emissions increases with carbon prices as farms’ optimum shifts towards more carbon farming practices - however, this is disproportionate in terms of CO2e per hectare. In the scenario with the highest carbon credit price (€680 per ton of CO2e), the decrease in emissions compared to the baseline approaches 3 tons CO2e per hectare, suggesting net negative emissions from arable farming. This study demonstrated how production management strategies of farms responds to varying prices for carbon credits. Our study, however, was limited to the production portfolio of arable farms in Germany. Extending this approach to other regions and agricultural systems, such as on former peatlands, could provide a useful starting point for future research. For instance, little is known yet how carbon markets, certification and the carbon credit price may incentivize rewetting and reconversion of agricultural land back into peatlands.

Reference: Paul, C., ... , Helming, K., 2023. Carbon farming: Are soil carbon certificates a suitable tool for climate change mitigation? J. Environ. Manage. 330, 117142. https://doi.org/10.1016/j.jenvman.2022.117142

How to cite: Hüttel, S., Hermann, D., and Vielhauer, J.: Carbon emission reduction in arable farming: Farmer crop portfolio responses to varying carbon credit pricing scenarios, EGU General Assembly 2025, Vienna, Austria, 27 Apr–2 May 2025, EGU25-7122, https://doi.org/10.5194/egusphere-egu25-7122, 2025.

EGU25-7401 | Posters on site | BG8.13

Methods for greenhouse gas accounting of peatlands: A comparative analysis of EU and German approaches 

Patricia Borel, Stephan Bosch, Harald Kunstmann, Jennifer Kunz, Stefan Kurz, and Peter Fiener

Peatland restoration is a key climate mitigation strategy due to the high carbon storage capacity of peat soils. In the European Union (EU), more than half of peatlands have been drained - primarily for agriculture and forestry - resulting in significant greenhouse gas (GHG) emissions. Rewetting these areas can substantially reduce emissions and support the EU’s goal of net-zero CO₂ emissions by 2050. Essential for tracking progress toward mitigation targets is the precise accounting of GHG emissions from peatlands. While EU countries already report peatland emissions under the UNFCCC, comprehensive accounting for managed wetlands (including peatlands) will only become mandatory in 2026. However, comparability is limited: Peatland emissions are reported across diverse (land-use) categories, soil types, and GHGs, resulting in fragmented reporting with incomplete coverage by many countries. Additionally, countries employ diverse methods, datasets, and emission factors, leading to inconsistencies. This study analyses the methods EU countries use to report GHG emissions from peatlands, focusing on Germany and its neighbouring countries. Specifically, it addresses (1) the methodological differences between and within countries, identifying major inconsistencies, and (2) the extent to which these differences affect reported emissions and their comparability. Using a standardized evaluation framework, we quantify the impact of methodological differences on GHG inventories and visualize variations in CO₂-equivalent emissions per hectare of peatland. We also apply these methodologies conceptually to peatland sites with varying characteristics to demonstrate how methodological choices shape reporting outcomes. The results provide a detailed quantification of the discrepancies in reporting for peatland emissions and their effects. This study thus contributes to advancing research to harmonize peatland GHG reporting across the EU and improve comparability.

How to cite: Borel, P., Bosch, S., Kunstmann, H., Kunz, J., Kurz, S., and Fiener, P.: Methods for greenhouse gas accounting of peatlands: A comparative analysis of EU and German approaches, EGU General Assembly 2025, Vienna, Austria, 27 Apr–2 May 2025, EGU25-7401, https://doi.org/10.5194/egusphere-egu25-7401, 2025.

Rewetting of organic-rich agricultural soils is a management strategy to reduce CO2 emissions and meet policy targets for agricultural GHG emissions. Denmark has committed to support the rewetting of at least 100,000 ha of agricultural peat soils by 2030. The climate benefits of this initiative depend on emissions before and after rewetting, particularly CO2 emissions, which have been assessed using national emission factors. However, recent studies suggest that modelling CO2 emissions as a function of mean annual water table depth (WTD) provides a more accurate assessment than fixed emission factors. Despite these advances, large uncertainties and knowledge gaps remain in the estimation of GHG emissions from agricultural peat soils, particularly in relation to the effect of land use and environmental factors such as peat depth, organic carbon (OC) content, water table depth and soil moisture. 

Most controlled studies of GHG emissions from drained peat soils have focused on the topsoil where microbial activity is higher than in the subsoil. However, drained subsoils contribute to overall GHG fluxes, but the controlling factors need to be clarified. Some studies suggest that CO2 emissions increase proportionally to WTD, i.e., with equal importance of drained topsoil and subsoil compartments, while other data suggest that deeper  WTD have progressively less effect on CO2 fluxes. In addition, topsoil and subsoil may differ in their sensitivity to environmental changes, such as temperature and moisture fluctuations, influenced by climate change. Therefore, understanding how topsoil and subsoil differ in their contribution to GHG fluxes is critical for developing predictive models and supporting climate-smart peatland management strategies.

Drained OC-rich soils are hotspots for CO2 emissions, but the continued microbial mineralization means that the OC content transitions to that of mineral soils. Yet, it remains unclear how the residual OC content controls the rate of CO2 emissions. The Danish definition of organic soils includes soils with >6% OC, while other countries use thresholds of >12% OC or higher. Hence, soils with 6-12% OC are part of the Danish GHG inventory, but there is a lack of data on the CO2 emissions from these soils. Recent studies suggest that soils with 6-12% OC can emit CO2 at similar rates as soils with >12% OC, and that emissions from soils with 6-12% OC may be underestimated. The refinement of CO2 emission estimates for 6-12% OC soils is critical for the accuracy of national inventories, but also for crediting the climate benefits of initiatives to rewet drained organic soils.

In brief, this poster invites discussion on the progress and knowledge gaps in estimating CO2 emissions from agricultural peat soils, e.g., in relation to the role of subsoils and the OC content.

How to cite: Elsgaard, L.: Progress and knowledge gaps in estimating CO2 emissions from organic-rich agricultural soils, EGU General Assembly 2025, Vienna, Austria, 27 Apr–2 May 2025, EGU25-9488, https://doi.org/10.5194/egusphere-egu25-9488, 2025.

EGU25-11999 | ECS | Posters on site | BG8.13

Evaluating Carbon Dynamics and Carbon Credits of Peatland Restoration in Switzerland 

Qing Sun, Laurel Faher, and Édouard Davin

However, due to slow biogeochemical processes, the carbon accumulation in peatlands typically occurs at a low rate. In addition, peatlands that have been degraded or drained from land-use conversion become net carbon sources, as is the case with 82 % of the peatlands in Switzerland.

Restoring drained peatlands is therefore widely recognised as a nature-based solution for carbon removal. With the development of carbon market, carbon credits from rewetting peatlands are often issued based on generalised estimates on avoided emissions. However, information on long-term greenhouse gas (GHG) exchanges in restored peatlands remains scarce, with limited spatiotemporal coverage and inconsistent outcomes likely stemming from varying climate conditions, initial states, vegetation types, and restoration approaches. Consequently, there is an urgent need to account for site-specific carbon dynamics and improve the methodologies for assessing the GHG balance when evaluating carbon credit schemes for peatland restoration.

In this study, we use simulations of the well-established Terrestrial Biosphere Model, LPX-Bern, to investigate peatland carbon dynamics in Switzerland. Combined with empirical estimates based on field measurements, the modelled peatland carbon storage from the preindustrial period to the present day is analysed under natural processes, land use, and different restoration scenarios to assess the peatland restoration potentials. The results are compared with a carbon credit scheme using max.moor, a conservative estimate on avoided emissions following rewetting according to a generalised carbon density (56 kg C m-2) for a peatland in Niremont, Switzerland.

We demonstrate that, over a 50-year timeframe, the dynamically simulated peatland carbon storage indicates a substantial overestimation, up to 43 %, of avoided emissions by the max.moor approach for the Niremont site. This highlights the necessity of incorporating approaches with increased accuracy on estimating peatland restoration impacts on carbon dynamics and GHG exchanges. Moreover, future climate change is expected to exacerbate the uncertainties associated with these estimates. This work thus contributes to advancing the understanding of peatland restoration impacts on GHG exchanges and feedback to climate change.

How to cite: Sun, Q., Faher, L., and Davin, É.: Evaluating Carbon Dynamics and Carbon Credits of Peatland Restoration in Switzerland, EGU General Assembly 2025, Vienna, Austria, 27 Apr–2 May 2025, EGU25-11999, https://doi.org/10.5194/egusphere-egu25-11999, 2025.

EGU25-13823 | ECS | Posters on site | BG8.13

Assessing Agricultural Peatland Emissions of Nitrous Oxide in Ireland 

Wenxuan Shi, Owen Fenton, Karl Richards, and Matthew Saunders

Peatland is an important storage of carbon (C) and nitrogen (N) on the earth surface. They have played a vital role in regulating the global climate through their capacity for C and N sequestration. Human activities including peatland drainage, burning, and conversion for agriculture transform peatlands from C sinks into greenhouse gas (GHG) sources. In Ireland, approximately 20% of the land area is peatland, over 95% of them have been degraded through anthropogenic activities. To assess the impact of peatland management on nitrous oxide (N2O) emission, this study utilised the LICOR auto chamber and smart chamber coupled with state-of-the-art portable gas analysers to determine the N2O emissions from grass-based agricultural peatland in Ireland. The site-specific characteristics that drive GHG production and can act as proxies for emissions (water table height and nutrient status) were also explored. Refined emission factors (EFs) were developed for N amendments applied in both drained and rewetted peatland. N amendments including mineral N fertiliser, cattle urine and sheep urine were applied to simulate real agricultural activities on peatland. The results obtained so far showed that peak N2O emissions occurred on the day of N application and in the presence of rainfall. The cumulative N2O emission showed significant difference between both drained and rewetted peatland. The outputs of this work will directly contribute to the Ireland National Inventory Report and provide insight for climate mitigation and peatland rehabilitation activities.

How to cite: Shi, W., Fenton, O., Richards, K., and Saunders, M.: Assessing Agricultural Peatland Emissions of Nitrous Oxide in Ireland, EGU General Assembly 2025, Vienna, Austria, 27 Apr–2 May 2025, EGU25-13823, https://doi.org/10.5194/egusphere-egu25-13823, 2025.

EGU25-13958 | Posters on site | BG8.13

CO₂, CH₄, and Water Fluxes of a Drained Peatland in W-Iceland 

Asra Salimi, Brynhildur Bjarnadóttir, Hlynur Óskarsson, and Bjarni D.Sigurðsson

The release and uptake of greenhouse gases (GHGs), including CO₂, CH₄, and N₂O, are closely tied to land use practices, with drained peatlands representing significant emission sources. According to Iceland’s National Inventory Report to the UNFCCC, emissions from drained peatlands are the largest single contributor to the country's total GHG emissions. While international research highlights peatland restoration as an effective strategy for reducing GHG emissions, the validity of such actions in Iceland has been limited due to a lack of country-specific data.

This study seeks to fill this gap by measuring the GHG dynamics of a drained and subsequently restored peatland at the farm Lækur in W-Iceland. Drained for livestock pasture 65 years ago but never cultivated, this site represents the dominant land use category for drained peatlands in Iceland. In this research, GHG, water, and energy fluxes are measured using the eddy covariance method, complemented by additional data on climatic variables, groundwater levels, soil moisture, and soil temperature.

The eddy covariance system was installed in January 2023. Preliminary results for 2023 indicate an annual net CO₂ emission of 1734.87 g m⁻² y⁻¹, negligible net CH₄ flux, an annual evapotranspiration of 420,416.10 g m⁻² y⁻¹, and equivalent rainfall of 420.42 mm y⁻¹.

The project uses a two-phase research approach: (1) baseline assessment of GHG fluxes under drained conditions and (2) ongoing monitoring post-rewetting (2025 onward). The study provides a comprehensive analysis of diurnal, seasonal, and annual GHG flux dynamics in drained peatlands and evaluates the initial impacts of rewetting. By generating high-quality, site-specific data, this research aims to inform the development of effective peatland restoration strategies as a GHG mitigation measure in Iceland and beyond.

How to cite: Salimi, A., Bjarnadóttir, B., Óskarsson, H., and D.Sigurðsson, B.: CO₂, CH₄, and Water Fluxes of a Drained Peatland in W-Iceland, EGU General Assembly 2025, Vienna, Austria, 27 Apr–2 May 2025, EGU25-13958, https://doi.org/10.5194/egusphere-egu25-13958, 2025.

EGU25-14038 | Orals | BG8.13

Mapping soil CO2 efflux to identify hot spots in temperate peatlands based on UAV remote sensing 

Yanfei Li, Maud Henrion, Angus Moore, Sébastien Lambot, Sophie Opfergelt, Veerle Vanacker, François Jonard, and Kristof Van Oost

The emission of CO2 from peatlands varies significantly across space and time which renders accurate quantification and modeling of carbon fluxes challenging. In this study, we combined in-situ measurements with Unmanned Aerial Vehicle (UAV) remote sensing (RS) to investigate soil respiration patterns across a temperate peatland landscape (0.32 ha) located in the Belgian Hautes Fagnes plateau. The primary objective was to evaluate the potential of multi-sensor UAV RS for characterizing soil CO2 efflux and studying the importance of hotspots within peatland ecosystems.

The carbon emissions show large spatial and temporal variations during the monitoring period. The CO2 fluxes were significantly higher at the summit (3.16 ± 3.25 μmol m⁻² s⁻¹) and shoulder positions (dry: 2.81 ± 3.22 μmol m⁻² s⁻¹; wet: 2.33 ± 2.36 μmol m⁻² s⁻¹) compared to the footslope (1.25 ± 1.00 μmol m⁻² s⁻¹) and backslope (1.11 ± 1.03 μmol m⁻² s⁻¹) positions (ANOVA, p < 0.05). Our findings reveal that UAV data can produce reliable high-resolution maps (resolution = 0.15 m) of soil respiration rates across heterogeneous landscapes, achieving an RMSE of 0.64 μmol m⁻² s⁻¹ and an R² of 0.74. These maps allowed us to pinpoint CO2 efflux hotspots, whose locations and magnitudes varied over time. Despite occupying less than 10% of the landscape, these hot spots contributed disproportionately to the total CO2 efflux, accounting for up to 40% during the hot summer and early autumn periods, highlighting their significant role in peatland carbon emissions.

Our study demonstrates that integrating UAV RS with field surveys improves the accuracy of peatland carbon efflux monitoring and assessments. This provides valuable insights into carbon dynamics and supports peatland conservation and climate change mitigation efforts.

How to cite: Li, Y., Henrion, M., Moore, A., Lambot, S., Opfergelt, S., Vanacker, V., Jonard, F., and Van Oost, K.: Mapping soil CO2 efflux to identify hot spots in temperate peatlands based on UAV remote sensing, EGU General Assembly 2025, Vienna, Austria, 27 Apr–2 May 2025, EGU25-14038, https://doi.org/10.5194/egusphere-egu25-14038, 2025.

EGU25-15660 | ECS | Orals | BG8.13

Estimation of greenhouse gas emission mitigation and atmospheric carbon dioxide sequestration in restored peatlands (raised bogs) in Latvia 

Aldis Butlers, Arta Bārdule, Andis Lazdiņš, and Mārtiņš Vanags Duka

Peatlands play an important role in global climate regulation and carbon (C) cycling. To evaluate the potential effect of peatland restoration on greenhouse gas (GHG) emission mitigation, and preservation of peat C stock or enhancement of atmospheric carbon dioxide (CO2) sequestration, we used a manual chamber method to measure soil heterotrophic respiration CO2 emissions (Rhet) and ecosystem GHG emissions. Ecosystem emission measurements included methane (CH4), nitrous oxide (N2O) emissions and forest floor CO2 emissions (Rfloor) in forested peatlands or ecosystem CO2 emissions (Reco) in peatlands without tree cover. Measurements of Reco and Rfloor were conducted using chambers that included all vegetation present in the ecosystem or ground vegetation, respectively. Rhet measurements were performed after the removal of ground vegetation and litter layer and trenching of the roots. In addition to GHG emission measurements, C input into the soil with vegetation litter was estimated, and environmental variables (including soil temperature and moisture, groundwater level, water chemistry and others) that potentially can affect the magnitude of GHG emissions were monitored. The monitoring was initiated in 2023 and continued in 2024 at seven study sites located in raised bogs within the hemiboreal vegetation zone of Europe, specifically in Latvia. Study sites included different habitats of pristine peatlands, restored peatlands through rewetting, and areas in both strong and weak drainage impact zones where the development of woody vegetation characteristic of the forest ecosystem has occurred. Preliminary results of GHG emission measurements show that the annualized monthly mean ecosystem gross GHG emissions, expressed in CO2 equivalents (excluding C sequestration by vegetation), ranged from 9.7 to 45.9 t CO2 eq. ha−1 year−1 in degraded (drained) peatlands, while in restored (including rewetted) peatland GHG emissions ranged from 11.0 to 25.3 t CO2 eq. ha−1 year−1.

Acknowledgements: The research was conducted within the scope of the European Commission LIFE Climate Action Programme Project “Peatland restoration for greenhouse gas emission reduction and carbon sequestration in the Baltic Sea region” (LIFE21 - CCM - LV - LIFE PeatCarbon, Project number: 101074396).

How to cite: Butlers, A., Bārdule, A., Lazdiņš, A., and Vanags Duka, M.: Estimation of greenhouse gas emission mitigation and atmospheric carbon dioxide sequestration in restored peatlands (raised bogs) in Latvia, EGU General Assembly 2025, Vienna, Austria, 27 Apr–2 May 2025, EGU25-15660, https://doi.org/10.5194/egusphere-egu25-15660, 2025.

EGU25-19224 | Posters on site | BG8.13

Aggregate baselines for tropical peatland restoration and conservation projects 

Alex Cobb, René Dommain, Joshua Ng, Fradha Intan Arassah, Arief Darmawan, Alfred Amo Bediako, Julius Hartmann, Fitra Jaya, Hannah Markant, Fiedje Moritz, and Paula Sánchez-Alandete

Baselines are a critical factor in peatland conservation or restoration projects in the voluntary carbon market, because a project's climate impact is measured by the difference between realised emissions and a baseline representing business-as-usual. Because business-as-usual encompasses a range of possible outcomes, the baseline is inherently uncertain. Baselines for peatland carbon projects present additional challenges because land use change at one location can drive greenhouse gas emissions elsewhere in the peatland. These effects occur because of the critical role of waterlogging in protecting peatland belowground carbon stocks, and imply that not only the area of land converted but also its spatial distribution exerts an important control on anthropogenic CO2 emissions from peatlands.

To avoid bias and over-crediting, it is desirable to derive a baseline for peatland carbon projects that represents a weighted average across the range of possible outcomes, while considering the hydrological impacts of changing mosaics of land use on peatland greenhouse gas balances. We describe a pixel-matching approach to peatland baseline emissions that uses land use change modelling to produce an ensemble of land use trajectories collectively representing business-as-usual.  Emissions are then averaged across these realisations to produce an approximation of expected business-as-usual emissions.  We discuss the challenges involved in implementing this scheme while balancing rigor, simplicity, robustness and ease-of-use.

How to cite: Cobb, A., Dommain, R., Ng, J., Arassah, F. I., Darmawan, A., Bediako, A. A., Hartmann, J., Jaya, F., Markant, H., Moritz, F., and Sánchez-Alandete, P.: Aggregate baselines for tropical peatland restoration and conservation projects, EGU General Assembly 2025, Vienna, Austria, 27 Apr–2 May 2025, EGU25-19224, https://doi.org/10.5194/egusphere-egu25-19224, 2025.

EGU25-19334 | ECS | Posters on site | BG8.13

Indicative mapping of peat and other hydromorphic organic soils across Austria with legacy data 

Stefan J. Forstner, Thomas Brunner, Irene Schwaighofer, Thomas Weninger, Michael Weiß, Gerhard Egger, Monika Tulipan, Axel Schmidt, Marlon Schwienbacher, Raphael Müller, Stephan Glatzel, David Kessler, Franz Starlinger, Elias Kapitany, Thomas Wrbka, Hans-Peter Haslmayr, Christina Hummel, Michael Englisch, and Andreas Baumgarten

Understanding the spatial distribution of peat soils and other hydromorphic organic soils is essential for terrestrial carbon storage, biodiversity, and sustainable land management. In addition to these overarching purposes, there is now an urgent need to better localize these soils in the wake of the recently adopted European Nature Restoration Law (NRL). The NRL requires EU member states to formulate plans for the restoration of organic soils under agriculture (and other land-uses such as forest) constituting drained peatlands from 2026 onwards. A comprehensive, high-resolution map of peat and other hydromorphic organic soils covering the entire Austrian territory (i.e. land-uses other than agriculture) to support this objective is currently lacking.

To model the distribution of these soils across Austria, we propose a strategy based on regression and machine learning (ML), driven by legacy occurrence data and spatial covariates. Owing to the nature of the legacy data, we define six operational classes of peat and other hydromorphic organic soils, derived from the Austrian Soil Taxonomy in conjunction with the IPCC 2013 Wetlands Supplement. Response variables (i.e., expected soil classes) are constructed by re-classifying 14 legacy datasets containing land-use specific information on soils and/or vegetation. These include the Agricultural Soil Map of Austria, the Austrian Soil Taxation Survey, the Austrian Soil Information System BORIS, various forest site and vegetation mapping projects and the currently updated Austrian moorland protection database. In the process, real point data is supplemented by synthetic points generated by sampling from input polygon maps.

Separate occurrence probability models are built for each response class using (ensembles of) Environmental Niche Models (ENMs, also known as Species Distribution Models). These models predict the likelihood of occurrence for each peat soil type based on spatially explicit, high-resolution predictor variables (100m and higher). Covariates include soil properties, climate, relief features from Digital Elevation Models (DEMs), vegetation indices from remote sensing, and parent material, following the well-established SCROPAN approach of Digital Soil Mapping. The final indicative map is created by combining predictions from individual models. We employ cross-validation to tune ML hyperparameters and assess predictive model performance. Additionally, external evaluation will be carried out through a field campaign in spring 2025. A total of 90 transects will be established to collect data on soils and vegetation which will serve map validation and iterative model refinement.

The resulting indicative map will depict peat and hydromorphic organic soil distribution across Austria at high spatial resolution. Amongst others, it will serve as valuable guidance for field campaigns that likely will precede any targeted restoration measures under the NRL.

How to cite: Forstner, S. J., Brunner, T., Schwaighofer, I., Weninger, T., Weiß, M., Egger, G., Tulipan, M., Schmidt, A., Schwienbacher, M., Müller, R., Glatzel, S., Kessler, D., Starlinger, F., Kapitany, E., Wrbka, T., Haslmayr, H.-P., Hummel, C., Englisch, M., and Baumgarten, A.: Indicative mapping of peat and other hydromorphic organic soils across Austria with legacy data, EGU General Assembly 2025, Vienna, Austria, 27 Apr–2 May 2025, EGU25-19334, https://doi.org/10.5194/egusphere-egu25-19334, 2025.

EGU25-19793 | Orals | BG8.13

Using historical mapping to identify former peatland boundaries 

Terry Morley, Lisa Coleman, Louis Gilet, and John Connolly

Governments are tasked with identifying lands suitable for restoration under the new Nature Restoration Law and meeting binding carbon reduction targets under the Paris Climate Agreement. It is widely recognised that peatland restoration can help meet these targets. In Ireland, agencies are tasked with the identification of over 80,000ha of grassland on peat to better manage carbon emissions, however identification of these former peatlands remains challenging. In the early 1800’s a detailed survey of large peatlands was commissioned to exploit these resources. The Bog Commissioners Reports identified and mapped over 0.5M ha of peatland (ca. 34% of all peatlands) across Ireland. In this study we ascertained the accuracy of these maps and used them to assist in the identification of areas suitable for carbon management. We found the maps to be highly accurate (18.7m RSME) for site-specific and landscape planning, found that over 85% of peatland exist in degraded status, and identified extensive areas of grassland over organic soils. This study will assist agencies to coordinate national efforts to establish management of these resources. 

How to cite: Morley, T., Coleman, L., Gilet, L., and Connolly, J.: Using historical mapping to identify former peatland boundaries, EGU General Assembly 2025, Vienna, Austria, 27 Apr–2 May 2025, EGU25-19793, https://doi.org/10.5194/egusphere-egu25-19793, 2025.

EGU25-20654 | Orals | BG8.13

Method for Assigning Emission Factors to Mapping Units Based on Modelling the Spatial Structure and Functions of Peatland Ecosystems 

Tatiana Minayeva, Timofey Orlov, Gennady Suvorov, Oxana Cherednichenko, Nyam-Osor Nandintsegtseg, Cristina Rengifo Faiffer, Livio Pierro, and Matvey Tarkhov

The assignment of emission factors (EFs) to land classes is vital for evaluating and reporting the effectiveness of rewetting drained peatlands in mitigation projects. This process currently relies on developing land class catalogues with assigned EFs based on extensive datasets, known as GEST catalogues. However, the GEST method, which assigns EFs based on vegetation types, often fails to provide satisfactory results in heterogeneous sites or in projects aimed at reducing emissions from multiple sources beyond drainage.

We propose to assign EFs to mapping units by modelling the spatial structure and functions of peatland ecosystems. This method was tested in several peatland restoration projects conducted in Russia (2011-2022), Peru (2023-2024), and Mongolia (2023-2024).

Our spatial modelling approach is founded on the observation that most chamber emission measurements typically occur at the microform level (10-4 to 10-2 ha). However, microforms are too small for practical mapping at the project scale (from 102 ha). To overcome this limitation, we employed a hierarchical landscape classification to upscale chamber measurement outcomes. Landscape units at the facies level comprise various combinations of elementary microform units, represented by phytocoenoses or complexes thereof. These facies collectively define peatland areas (10-1 to 102 ha), making them suitable mapping units for typical peatland restoration projects. Notably, GEST does not clearly define spatial boundaries; it may refer to either facies or peatland areas, according to different authors.


To derive the EFs at the facies level, the area of each microform type is multiplied by its corresponding EF. The cumulative value theoretically yields the desired emission factor for the facies. This procedure can similarly be applied to calculate EFs for the spatial scale of peatland areas, aligning with classes identified in the IPCC guidelines.

Like many methods for calculating EFs, our proposed approach includes inherent uncertainties. A key question remains regarding the relationship between ecosystem function quantification (in this case, greenhouse gas emission factors) and the proportional area of the land cover class for which specific assessed values have been derived.

At the Orshinski Mokh peatland (Tver, Russia), we validated our calculated fluxes against direct measurements from an Eddy-Covariance tower. Preliminary calculations incorporating the area fractions of each facies resulted in net ecosystem exchange (NEE) values of 4.8 tCO2/ha and methane emissions of 7.8 kg CH4/ha over 157 days, while initial readings from the Eddy Covariance method indicated 4.6 tCO2/ha and 18.4 kg CH4/ha for the same duration. Further detailed calculations will refine these values.

In 2024, we set up a similar experiment in Mongolia's Khurkh peatland, with expectations for preliminary results in 2026.

Another methodological challenge encountered in assigning EFs for restoration projects in Mongolia and Peru involved factors and processes that complement drainage, notably nitrification and carbonisation, which significantly increase emissions. We propose to investigate these processes' impacts on peat under various conditions by summing up the outcomes of ex-situ published laboratory experiments. The resulting fluxes will be averaged over the duration in the nature of the conditions studied and incorporated into the GEST or calculated EFs for the drainage-rewetting process.

How to cite: Minayeva, T., Orlov, T., Suvorov, G., Cherednichenko, O., Nandintsegtseg, N.-O., Rengifo Faiffer, C., Pierro, L., and Tarkhov, M.: Method for Assigning Emission Factors to Mapping Units Based on Modelling the Spatial Structure and Functions of Peatland Ecosystems, EGU General Assembly 2025, Vienna, Austria, 27 Apr–2 May 2025, EGU25-20654, https://doi.org/10.5194/egusphere-egu25-20654, 2025.

EGU25-21117 | Orals | BG8.13

Geospatial technology for mapping and monitoring peatlands 

John Connolly, Lois Gilet, Wahaj Habib, Charmaine Cruz, Terry Morley, and Raymond Flynn

Although peatlands cover only 3% of the land area, they contain 33% of all terrestrial soil organic carbon stocks. In addition, they support a broad range of Nature’s Contributions to People (NCPs) such as water quality and biodiversity. Anthropogenic activity, particularly drainage and land use change has degraded many peatlands, impacting NCPs. This has long been the case in Ireland and across Europe and more recently in tropical regions.

This degradation leads to reductions in carbon (C) storage and increases in greenhouse gas emission, reduced water quality and biodiversity. It can lead to fire, dissolved and particulate matter emissions and, heavy metal mobilisation with consequences for human health and the environment.

The extent and condition of peatlands nationally, regionally and globally is not clear. In Ireland, peatlands have undergone extensive degradation through land use change. Recent studies estimate that peat soil extent, including shallow peat soil, is 1.66 million hectares with about 2 billion tonnes of Carbon stored in the soil. Much of this soil is located under a variety of different land cover types and in different drainage states. This leads to some uncertainty regarding greenhouse gas emissions.

This presentation focuses on the geospatial techniques that we have used to refine and quantify the spatial extent and condition of peat soils in Ireland and offer methods that could be useful for refining higher tier methods, facilitating widescale monitoring, assessing changes in emissions post land use change and accounting for land use change related to infrastructure.

How to cite: Connolly, J., Gilet, L., Habib, W., Cruz, C., Morley, T., and Flynn, R.: Geospatial technology for mapping and monitoring peatlands, EGU General Assembly 2025, Vienna, Austria, 27 Apr–2 May 2025, EGU25-21117, https://doi.org/10.5194/egusphere-egu25-21117, 2025.

EGU25-21373 | Orals | BG8.13

Crediting peatland rewetting for carbon farming: Some considerations amidst optimism 

Jens Leifeld, Miriam Gross-Schmölders, Yuqiao Wang, and Chloé Wüst

Peatland drainage is worldwide a major human-induced greenhouse (GHG) source and rewetting increasingly considered a silver bullet to not only reverse the climate burden of peatland management, but also recover other ecosystem functions. Peatland rewetting is therefore one key measure in the evolving frameworks for carbon farming projects and an important nature based solution. However, with regards to the time horizon of rewetting projects and possible project failure the climate effect of rewetting has not yet been systematically analysed. Here we simulate the radiative forcing of peatland rewetting, based on impulse response functions, by using exemplary calculations addressing different time horizons, GHG fluxes and duration of project success. Water table drawdown during or after a rewetting project displaces GHG emissions into the future, meaning that rewetting projects that at some stage fail provide no climate benefit in the long run. This has important repercussions for the creditability of peatland projects and underpins that the value of peatland rewetting as a mitigation instrument strongly depends on successful and permanent implementation of a high water table. Furthermore, we show that linking radiative forcing with project duration and GHG emission patterns allows rational calculation of biophysical discounting and propose how such discounting can be used to account for the risk of project failure in payments to carbon farming schemes.

How to cite: Leifeld, J., Gross-Schmölders, M., Wang, Y., and Wüst, C.: Crediting peatland rewetting for carbon farming: Some considerations amidst optimism, EGU General Assembly 2025, Vienna, Austria, 27 Apr–2 May 2025, EGU25-21373, https://doi.org/10.5194/egusphere-egu25-21373, 2025.

Wetlands are dynamic ecosystems where land and water environments intersect, playing a vital role in maintaining ecological balance. These areas are critical for the conservation of biodiversity and regulation of water regime. The Kızılırmak Delta, is recognized as a wetland complex consisting of rivers, lakes, swamps, coastal, and marine regions is recognized as one of the "Strictly Protected Areas" and listed on the UNESCO “World Heritage Tentative List” due to the presence of wetlands and its significance as a crucial bird migration route. 

The Holocene evolution of the Kızılırmak Delta (Northern Türkiye) is controlled by accumulation and alongshore transportation of sediment flux by the largest river of Anatolia draining to the Black Sea. The distinct successive beach ridges (~2 km length) formed along the eastern part of the delta (north and east) form the geomorphological boundaries of the wetland systems. The formation of these beach ridges reflects the variations of sediment influx, alongshore transport, and coastal dynamics. Optically Stimulated Luminescence (OSL) dating revealed that the formation of the beach-ridge system initiated during the last millennium.

Since the mid-20th century, a dense network of drainage canals (~1400 km) have been constructed to drain the delta for agricultural purposes. The successive construction of large-scale dams along the river have caused interconnected issues, such as decrease of sediment flux and negative balance underground water table of the delta. 

In this regard, we have conducted an analysis of wetland changes over the past 10 years, during which climate change and anthropogenic impacts have been heavily observed. Sentinel-2 imagery (#92) and meteorological data (daily) were used to classify, map and understand the spatiotemporal hydrological dynamics of the wetlands and anthropogenic control. The present study aims to contribute to the analysis of the geomorphological development and evolution of the delta and its recent hydrological dynamics.


How to cite: Salman, I. and Erturaç, M. K.: Monitoring the natural and anthropogenic environmental changes in the Kızılırmak Delta using remote sensing methods over the last 10 years, EGU General Assembly 2025, Vienna, Austria, 27 Apr–2 May 2025, EGU25-1070, https://doi.org/10.5194/egusphere-egu25-1070, 2025.

EGU25-1110 | ECS | Orals | OS2.4

Sedimentary nitrogen removal processes across coastal, lagoon and open waters of the Baltic Sea 

Pratha Sivasamy, Beata Szymczycha, and Magdalena Diak

Denitrification and anammox (anaerobic ammonium oxidation) are the main nitrogen removal pathways. Denitrification is a microbial process in which NO3- is sequentially reduced to dinitrogen gas (N₂) while anammox is the anaerobic microbiological process in which NO2- and NH4+ are converted to N2 under anoxic conditions. Both processes are critical in regulating nitrogen (N) availability in marine ecosystems, particularly in the stratified and oxygen-depleted aquifers such as Baltic Sea. The Baltic Sea, highly complex and semi-enclosed marine ecosystem that contains brackish water due to high freshwater discharge and limited water exchange with the North Sea. The sedimentary nitrogen cycling was studied extensively in the Baltic Sea but still, understanding the nitrogen loss process, especially in the coastal area is challenging. Additionally, studies usually use different methods to assess the N removal rates which disables the comparison of obtained rates and limits the overall understanding of the N cycle. The main aim of the study was to quantify denitrification and anammox rates in surface sediments from various locations in the Baltic Sea. Three coastal sites MP2 (Puck Bay), PB3 (Puck Bay under submarine groundwater discharge (SGD) impact),  lagoon MS2 (Szczecin lagoon) and two open-sea sites IDEAL, P1 (Baltic Proper) were selected for this study. Slurry incubation experiments were conducted at each site with the addition of labelled substrates ¹⁵NO₂⁻ and ¹⁵NH₄⁺ to measure denitrification and anammox rates. The addition of ¹⁵NO₂⁻ produced ¹⁴N¹⁴N, ¹⁴N¹⁵N, and ¹⁵N¹⁵N for denitrification, while ¹⁵NH₄⁺ produced ¹⁴N¹⁴N and ¹⁴N¹⁵N for anammox. The denitrification rate in the coastal sites ranged from 1440.82 to 7.21 nM N L-1 d-1, for the open sea sites (IDEAL) 533.42 nM N L-1 d-1  and at P1 consumption of N2 was observed. Apart from MP2, anammox activity was detected at PB3 (32.67 nM N L-1 d-1), MS2 (0.41 nM N L-1 d-1), IDEAL (0.46 nM N L-1 d-1), and P1 (0.67 nM N L-1 d-1). The anammox rates were lower than denitrification at all sites, indicating its minor role in nitrogen removal in the surface sediments of Baltic Sea. However, the presence of anammox highlights the contribution of a diverse microbial community that can increase with the future expansion of anoxic areas in the Baltic Sea. The observed spatial variability in N removal rates is likely influenced by site-specific factors such as organic matter availability, nutrient discharge, and oxygen conditions. However, hypoxic submarine groundwater discharge (SGD), enriched in nutrients and dissolved organic carbon appears to be a key driver of nitrogen removal. Further studies employing similar methodological approaches are essential to better understand nitrogen cycling in marine ecosystems, particularly in coastal areas.

Acknowledgments

The results were obtained within the framework of the statutory activities of the Polish Academy of Sciences Institute of Oceanology and the research project IDEAL (2019/34/E/ST10/00217) funded by the Polish National Science Centre.

How to cite: Sivasamy, P., Szymczycha, B., and Diak, M.: Sedimentary nitrogen removal processes across coastal, lagoon and open waters of the Baltic Sea, EGU General Assembly 2025, Vienna, Austria, 27 Apr–2 May 2025, EGU25-1110, https://doi.org/10.5194/egusphere-egu25-1110, 2025.

EGU25-1123 | ECS | Posters on site | OS2.4

Claiming Prestige: Shaping the Future of Artificial Coastal Development" 

Dhritiraj Sengupta, Dominique Townsend, Sally Brown, Ivan D Haigh, and Ian Townend

Prestige reclamation is defined as coastal reclamation carried out for the purpose of high-end real estate development and luxury recreation. The planiforms of these reclamations are often highly complex ideograms, showcasing the investor’s wealthand maximising the number of waterfront properties. Over time, increasingly elaborate designs are being built, leading to ever more complex coasts of which the wider impact to the coast is poorly understood. 

As these constructions are becoming more common, we raise a series of critical questions on the ecological, societal and environmental status of these highly anthropomorphised coasts. In this presentation we highlight ten key global prestige reclamation sites; showcasing trends in design, diversity of symbolic representation and resource demands, to demonstrate common themes found widely across the existing prestige reclamations. Time series analysis of reclamation shows both the construction timeframes, but also the large gap in time between construction and further development, questioning the drivers for development. This presentation aims to spark conversations on these unique coastlines, and bring further attention and global collaboration to collectively study their impact on the wider coastal environment. 

How to cite: Sengupta, D., Townsend, D., Brown, S., Haigh, I. D., and Townend, I.: Claiming Prestige: Shaping the Future of Artificial Coastal Development", EGU General Assembly 2025, Vienna, Austria, 27 Apr–2 May 2025, EGU25-1123, https://doi.org/10.5194/egusphere-egu25-1123, 2025.

The large radial sand ridge (RSR) system located in the southern Yellow Sea near the Jiangsu coast, China, is highly impacted by tropical cyclones (TCs). However, the temporal and spatial variations of sediment dynamics and associated morphodynamics in this region under the influence of TCs have been little explored due to the difficulty of implementing direct observation during these extreme events. Taking typhoon Lekima in August 2019 (No. 1909) as an example, this study simulated and comprehensively investigated the dynamic processes in the RSR area under the impacts of TCs based on the Finite Volume Coastal Ocean Model (FVCOM). During the passage of Lekima, the spatial patterns of residual flow (RF), sediment flux (SF) and morphology changes in the RSR area were totally different from that during the pre- and post-Lekima periods, especially in the offshore areas (the seaward edge of sand ridges). This is because TC Lekima can generate strong wind-driven currents and waves, increasing the bottom stress and influencing the sediment transport. Due to the shallow water depth of RSRs, wave height decreased significantly towards the coast, and tidal effects gradually dominated the nearshore sedimentary dynamic processes instead of wave effects. Furthermore, the effects of TCs with different tracks and intensities were discussed in this study, and we found that TCs passing the west/east side of the study domain can induce opposite directions of sediment transport and lead to the spatial asymmetry of geomorphological evolution. This research can contribute to an improved understanding of sedimentary dynamic processes during extreme events and indicates the importance of exploring sediment dynamics response to TCs with different characteristics for reducing TC-induced coastal risks in future climate change scenarios.

How to cite: Yang, G.: Impact of tropical cyclones on the hydrodynamics and sediment dynamics of the radial sand ridge system in the southern Yellow Sea, EGU General Assembly 2025, Vienna, Austria, 27 Apr–2 May 2025, EGU25-1614, https://doi.org/10.5194/egusphere-egu25-1614, 2025.

The increasing demand for marine sand, driven by urbanization, infrastructure development, and coastal defense against sea-level rise due to climate change intensifies environmental pressures on marine ecosystems. Large-scale sand extraction disrupts benthic habitats and alters hydrodynamics by modifying water depth and current velocities. These changes weaken natural tidal mixing processes, increasing susceptibility to thermal stratification. Such stratification limits oxygen and nutrient exchange between water layers, affecting local phytoplankton dynamics and benthic communities.

To investigate the potential occurrence of thermal stratification in sand pits, we applied the Simpson-Hunter method, originally developed for predicting tidal mixing fronts, to establish a theoretical framework for determining the critical depth at which well-mixed waters may stratify within sandpits in mid-summer. Using this method, we developed a map for the southern North Sea that identifies the maximum allowable sandpit depths before stratification occurs.

To further refine our findings, we conducted one-way nested, high-resolution numerical modeling of the hydrodynamics using the Delft3D model, incorporating boundary conditions derived from the existing GETM model of the Northwest European Shelf. Simulations were performed for various sandpit sizes and depths under realistic hydrodynamic conditions for mid-summer. The results agreed with the theoretical predictions but in addition revealed a strong dependence on sandpit size, showing that larger pits are more prone to stratification related to a relative reduction in mixing at the pit’s edges.

This research highlights the critical role of sandpit depth and size in influencing stratification dynamics. Understanding and preventing these processes is essential for minimizing ecological risks and ensuring the sustainable extraction of marine sand in dynamic shelf seas like the North Sea.

How to cite: Daliri, M. and van der Molen, J.: Thermal Stratification Dynamics in Sandpits: Impacts of Marine Sand Extraction in the Southern North Sea, EGU General Assembly 2025, Vienna, Austria, 27 Apr–2 May 2025, EGU25-2287, https://doi.org/10.5194/egusphere-egu25-2287, 2025.

EGU25-2593 | ECS | Posters on site | OS2.4

Sediment deposition in riparian zones exacerbates saltwater intrusion 

Hayden Tackley, Barret Kurylyk, Craig Lake, Danika van Proosdij, and Rob Jamieson

Coastal farmland is becoming increasingly exposed to flooding due to climate change. Inundation can lead to groundwater and soil degradation through saltwater intrusion. Much of the research investigating saltwater intrusion is focused along the marine coast; however, as storm intensity and sea levels rise, transitional coastal areas not previously susceptible to salinization may be at risk. Flood-derived sediment deposits may provide an overlooked salinity source in estuarine and upriver areas, even where floodwater salinity is relatively low. This study was conducted to evaluate the impact of subaerial flood deposits on underlying soil and porewater. A parcel of agricultural land in an estuarine floodplain in Nova Scotia, Canada, was selected to assess the subsurface response to repeated, low-salinity flooding. The site experienced inundation by fortnightly tidal floodwater following a managed dike realignment, resulting in dynamic surficial alteration. A three-year field campaign, including soil and water monitoring, geophysical surveying, and drone-based LiDAR surveying, was conducted to monitor changes to the site geomorphology and water and sediment chemistry. A one-dimensional numerical solute transport and vertical water flow model informed by field data was applied to investigate the hypothesis that saline sediment deposits can drive downward saltwater intrusion in areas experiencing brackish or low-salinity flooding. Results revealed that the soil concentrations exceeded that of the brackish floodwater by up to 50 times, with the highest salinization occurring preferentially in areas experiencing persistent deposition. Model results showed that soil salinization may persist for decades longer than the duration of flooding; however, removing these deposits through erosion resulted in soil and groundwater recovery. This study highlights the potential importance of flood-derived sediments for exacerbating saltwater intrusion in riparian areas along estuaries, which were not previously thought to be at risk of saline flooding.

How to cite: Tackley, H., Kurylyk, B., Lake, C., van Proosdij, D., and Jamieson, R.: Sediment deposition in riparian zones exacerbates saltwater intrusion, EGU General Assembly 2025, Vienna, Austria, 27 Apr–2 May 2025, EGU25-2593, https://doi.org/10.5194/egusphere-egu25-2593, 2025.

EGU25-4284 | Posters on site | OS2.4

Assessing the impact of past environmental change on fjord biodiversity using sedimentary ancient DNA 

Katrine Husum, Ingrid Saetersdal, Magdalena Lacka, Bjørg Risebrobakken, Haflidi Haflidason, Micah Dunthorn, Tristan Cordier, Aud Larsen, Øystein Varpe, Stijn de Schepper, and Agnes Weiner

Fjords are strongly affected by climate change and direct anthropogenic impacts. Their location at the land-ocean interface makes them particularly vulnerable to a wide range of stressors. Rapid changes, such as increasing water temperatures, changes in oxygen conditions, increased run-off from land and decreasing sea ice in the Arctic will inevitably have profound effects on marine biodiversity and productivity. However, so far, our knowledge on the impact of these changes on marine communities remains limited, despite their important roles in food webs and nutrient cycling. To understand ongoing and future changes in fjord ecosystems and the resilience of marine communities, it is essential to assess their response to past changes in environmental conditions. To date, such studies are limited to lineages with a fossil record, leaving an incomplete picture of the remaining diversity. To address this issue, in the project PASTIME we are now applying sedimentary ancient DNA as a new tool for reconstructing past changes in entire marine communities in relation with past environmental changes. We focus on marine sediment cores from Arctic and western Norwegian fjords and assess environmental and biodiversity changes over the last centuries. Our work extends the timescales far beyond traditional observational data and allows assessing the impact of various environmental factors (e.g. temperature, freshwater inflow, sea ice, oxygen) under in-situ conditions to elucidate key drivers of change. In addition, the high sedimentation rates in fjords allow for high temporal resolution sampling and thus for tracing the rate of ecosystem change. Here, we will present preliminary data on one sediment core collected in Kongsfjorden, Svalbard, and one core from Masfjorden, Western Norway. Both cores cover the last three centuries with a high vertical resolution and show marine community responses to past environmental changes.

How to cite: Husum, K., Saetersdal, I., Lacka, M., Risebrobakken, B., Haflidason, H., Dunthorn, M., Cordier, T., Larsen, A., Varpe, Ø., de Schepper, S., and Weiner, A.: Assessing the impact of past environmental change on fjord biodiversity using sedimentary ancient DNA, EGU General Assembly 2025, Vienna, Austria, 27 Apr–2 May 2025, EGU25-4284, https://doi.org/10.5194/egusphere-egu25-4284, 2025.

EGU25-4575 | ECS | Orals | OS2.4

Coastal Foredune Notches – Adoption, Constructed Morphology and Classification 

Thomas Pagon, Thomas Smyth, Ryan Wilson, and Bethany Fox

Coastal sand dunes are critical components of coastal zones, delivering essential ecological, 
geomorphic, and societal services. Over at least the last 100 years, climate change and shifting 
land use patterns have driven widespread “dune greening,” characterised by increasing 
vegetation cover and, subsequently, stabilisation of dune systems. While this stabilisation can 
be beneficial for some management objectives, in some locations, it has reduced the 
availability of valuable bare sand and early successional habitats, as well as diminished the 
resilience of dune systems to environmental and climatic changes. To address these 
challenges, constructed foredune notches have been increasingly implemented as coastal 
management interventions. These notches aim to restore dune dynamism, promote sediment 
movement, and (re)create habitats by providing a pathway for aeolian sediment transport from 
beaches into the middle and back dune areas. 
Despite their growing application, research on the design, functionality, and long-term impacts 
of foredune notches remains limited, particularly at a global scale. In this study, we 
systematically identified and analysed 133 foredune notches across four countries using aerial 
imagery to assess variations in their constructed morphology. Our findings reveal significant 
regional differences in notch dimensions: notches in France and New Zealand tend to be 
smaller and more uniform in design, while those in the United Kingdom and the Netherlands 
exhibit larger and more variable morphological characteristics. These regional variations, 
especially notable in the Netherlands, are underexplored in current literature, leaving important 
gaps in understanding how initial design influences the performance and persistence of these 
features.
To complement this analysis of the constructed morphology of foredune notches, this study 
also investigates how the identified differences in constructed morphology affect notch 
evolution over time, using a time series of aerial imagery from selected sites in Europe. Initial 
results suggest that constructed morphology significantly impacts the spatial dynamics and 
longevity of foredune notches, with important implications for achieving ecological and 
geomorphic management objectives.
To improve the consistency and transferability of research and management practices, this 
study proposes a standardised classification framework for foredune notches based on key 
morphological characteristics. The proposed framework provides a systematic approach to 
describing and comparing notches across sites and regions, allowing existing and future 
research to be better applied across notches and sites, therefore hopefully enabling 
researchers and practitioners to design notches with a better understanding of their likely long-term impact.

How to cite: Pagon, T., Smyth, T., Wilson, R., and Fox, B.: Coastal Foredune Notches – Adoption, Constructed Morphology and Classification, EGU General Assembly 2025, Vienna, Austria, 27 Apr–2 May 2025, EGU25-4575, https://doi.org/10.5194/egusphere-egu25-4575, 2025.

EGU25-4809 | ECS | Posters on site | OS2.4

Unravelling groundwater salinization and flushing in the Canterbury Bight during glacial-interglacial cycles: Insights from paleo-hydrogeochemical modeling 

Chong Sheng, Aaron Micallef, Mark Schmidt, Thomas Müller, and Christian Hensen

Offshore freshened groundwater (OFG) is well-documented in the shelf sediments of Canterbury Bight (New Zealand), with an estimated maximum volume of 213 km³, extending up to 60 km offshore from the coast. However, the evolution and emplacement dynamics of the OFG system remains poorly constrained. To advance the current state of understanding OFG systems, this study seeks to utilize the previously underutilized IODP geochemical and geological data from the Canterbury Bight to constrain the timing and emplacement mechanisms of the OFG system. Specifically, the main objectives of this paleo-hydrogeochemical transport-reaction modelling study are: (1) to identify key factors/processes influencing groundwater salinization and flushing in the continental shelf; (2) to improve understanding of the influences of OFG on subseafloor biogeochemical processes by transport-reaction modelling; (3) to explore the interactions between paleo-groundwater system and seawater; and (4) to propose a conceptual mode for shelf groundwater system evolution in relation to glacial/interglacial processes.

Preliminary results suggest that present-day recharge does not fully account for the OFG, particularly in the outer shelf, which is the fossil groundwater emplaced during the lowstands since the late Pleistocene. The intensified sulphate depletion observed in freshening sections is attributed to enhanced anaerobic oxidation of dissolved organic matter brought by the OFG. Modern salinity conditions are not in equilibrium with present-day sea level conditions, as the OFG is gradually being salinized through downward solute transport from overlying seawater. Submarine groundwater discharge and OFG volume are interconnected components of the offshore paleo-groundwater system, both closely tied to sea-level fluctuations. The findings from this study are expected to enhance our understanding of the Canterbury Bight’s offshore groundwater system and provide broader insights into OFG formation and evolution under changing climatic and sea-level conditions worldwide.

How to cite: Sheng, C., Micallef, A., Schmidt, M., Müller, T., and Hensen, C.: Unravelling groundwater salinization and flushing in the Canterbury Bight during glacial-interglacial cycles: Insights from paleo-hydrogeochemical modeling, EGU General Assembly 2025, Vienna, Austria, 27 Apr–2 May 2025, EGU25-4809, https://doi.org/10.5194/egusphere-egu25-4809, 2025.

EGU25-5126 | Posters on site | OS2.4

Morphodynamics and Evolution of a Coastal Sand Dune in Northwestern Taiwan 

Tsung-Yi Lin, Shao-Ping Lu, and Jyun-Min Liou

Topographic change, its dynamic mechanism, and the long-term evolution of a coastal sand dune in northwestern Taiwan was discussed through the monitoring of the seasonal and interannual topographic changes and sedimentological studies. The strong northeast monsoon in winter often blows up the dry sand on the back beach, and transports the sand landward  along the coast. The sedimentary structure analysis of the foredunes also shows that different types of parallel and cross laminations are dominant at different dune locations.

In summer, the foredune is susceptible to the influence of typhoon waves and storm surges, and often erodes the fore slope to form dune scarp. However, in the following winter, the scarp can gradually return to the dune slope through the accumulation of the dune ramp and the slope slumping. Overall, the foredune ridge has been moving inland toward southeast over the decades. Several sites of sand encroachment onto the windbreak forests are identified. The artificial sand fences on the fore slope make the surrounding sand surface piled up, and the fore slope becomes steeper that more likely to cause large-scale slumping.

The results of the ground penetrating radar survey showed that the surface sediments of the foredunes were about 5-10 meters thick, showing low-angle parallel bedding. Below the existing dune sediments, the distribution of the strata under the dunes (i.e. algal reef layer, old dune sediments, and salt marsh mud) can be observed. Vibration sediment core samples also show that there is an algal reef platform below the beach and dune deposits in this area, which is exposed at the lower fore beach and could extend at least few hundred meters to the inland side. The sea level at the time of the formation of the algal reef platform (about 3,000-4,000 years ago) may have been higher, and the secondary sand dunes on the current inland side may be the foredunes at that time.

How to cite: Lin, T.-Y., Lu, S.-P., and Liou, J.-M.: Morphodynamics and Evolution of a Coastal Sand Dune in Northwestern Taiwan, EGU General Assembly 2025, Vienna, Austria, 27 Apr–2 May 2025, EGU25-5126, https://doi.org/10.5194/egusphere-egu25-5126, 2025.

The coastal zone of the sea is a dynamic and complex environment where geological and geomorphological processes interact, shaping both terrestrial and marine landscapes. Understanding these processes is essential for sustainable coastal zone management, particularly in the face of climate change and increasing human activity.

The aim of this study is to develop a holistic framework for geological integrated coastal zone mapping that encompasses both the terrestrial and marine components of the coastal zone.

The research employs advanced methods, including geological mapping, 3D modeling, and data integration techniques, combined with predictive modeling of erosion-accumulation processes and shoreline changes. These methodologies are supported by state-of-the-art visualization tools to enhance the interpretation and usability of the data.

The main results of the study include detailed geological maps, 3D models, and specialized analyses that provide new insights into the structure and dynamics of the southern Baltic coastal zone. The research identifies key geohazards and offers predictive models for shoreline evolution, contributing to a more comprehensive understanding of the region.

This innovative approach is unique in its integration of terrestrial and marine aspects of the coastal zone, addressing the entire system as a cohesive unit. By bridging this gap, the study offers practical tools for sustainable management and risk mitigation.

The implications of this work extend beyond the Baltic region, providing a transferable methodology for integrated coastal zone management globally. The results contribute to bridging the gap between scientific research and practical application, equipping policymakers and stakeholders with actionable insights for addressing contemporary coastal challenges.

How to cite: Uscinowicz, G.: Innovative Holistic Approach to Studying and Managing the Coastal Zone Environment: A Case Study from the Southern Baltic Sea, EGU General Assembly 2025, Vienna, Austria, 27 Apr–2 May 2025, EGU25-5494, https://doi.org/10.5194/egusphere-egu25-5494, 2025.

EGU25-5803 | ECS | Orals | OS2.4

Using ocean color satellite data to examine spatial and temporal coastal CO2 dynamics in the North Sea 

Andrea van Langen Rosón, Clémence Goyens, Alizée Roobaert, Peter Landschützer, and Griet Neukermans

The coastal ocean is a key component of the global carbon cycle, transferring carbon from land to the open ocean and supporting blue carbon accounting and climate change mitigation efforts. Coastal carbon dynamics remain however poorly constrained. This results from the complex biological and physio-chemical processes that occur in coastal seas which drive the spatial and temporal variability of the exchange of carbon dioxide (FCO2) between the coastal seas and the atmosphere. To address this knowledge gap, region-specific and highly resolved analyses in time and space are required.

The dense network of in-situ measurements of seawater partial pressure of CO2 (pCO2) obtained from e.g. buoys and research vessels in the North Sea offers a unique opportunity to study coastal FCO2 dynamics. Here, we combine high-resolution satellite observations of ocean colour (ESA Ocean Colour Climate Change Initiative, OC-CCI) and sea surface temperature with all available in situ pCO2 observations (Surface Ocean CO2 Atlas, SOCAT) to study the spatial and temporal variability of pCO2  in the North Sea over the past decade. Using regionally optimized retrieval algorithms, we estimate key biogeochemical drivers of pCO2 dynamics, including chlorophyll-a, suspended particulate matter and particulate organic carbon. Our findings suggest the presence of distinct biogeochemical regions within the North Sea, detectable from remote sensing data, shaped by primary productivity, riverine plume inputs, and sediment dynamics. These processes have varying impacts on regional pCO2 dynamics, from locally enhancing the CO2 uptake to degassing CO2. Overall, this study advances our understanding of the complex processes driving coastal carbon dynamics and demonstrates a framework that can be applied beyond the North Sea in coastal regions globally.

How to cite: van Langen Rosón, A., Goyens, C., Roobaert, A., Landschützer, P., and Neukermans, G.: Using ocean color satellite data to examine spatial and temporal coastal CO2 dynamics in the North Sea, EGU General Assembly 2025, Vienna, Austria, 27 Apr–2 May 2025, EGU25-5803, https://doi.org/10.5194/egusphere-egu25-5803, 2025.

EGU25-6107 | ECS | Posters on site | OS2.4

New coasts emerging from the retreat of Northern Hemisphere marine-terminating glaciers in the 21st century 

Malgorzata Szczypinska, Jan Kavan, William Kochtitzky, Louise Farquharson, Matte Bendixen, and Mateusz Strzelecki

Accelerated climate warming has caused the majority of marine-terminating glaciers in the Northern Hemisphere to retreat significantly during the 21st century. While glacier retreat and changes in mass balance are widely studied on a global scale, the impacts of deglaciation on adjacent coastal geomorphology is often overlooked. We examined changes in proglacial zones of marine-terminating glaciers across the Northern Hemisphere in period 2000-2020 to provide a complete GIS dataset of new coastline released from glacial ice on the hemisphere during that time as well as coastline lost due to glacier advance. We identified a total of 2466 ± 0.8 km of new coastline, giving an average length of 123 km every year. Two-thirds of this coastline was exposed in Greenland. At the same time, only 53.1 ± 0.1 km of coastline present in 2000 was covered by glaciers in 2020. We analyse the results by region and compare them with retreat areas of the corresponding glaciers. Additionally, we identified 35 new islands larger than 0.5 km2 that were completely uncovered or which lost their glacial connection with the mainland during the period 2000-2020. Finally, we characterize these juvenile coasts by rock type, recent climatic conditions and location in particular permafrost zone. These environmental factors affect recently initiated paraglacial coastal evolution and enable to show hotspots in terms of expected geomorphological coastal dynamics.

Funding: The research is supported by the National Science Centre in Poland (project: ‘GLAVE- transformation of paraglacial coasts by tsunamis - past, present and warmer future’ No. UMO-2020/38/E/ST10/00042).

How to cite: Szczypinska, M., Kavan, J., Kochtitzky, W., Farquharson, L., Bendixen, M., and Strzelecki, M.: New coasts emerging from the retreat of Northern Hemisphere marine-terminating glaciers in the 21st century, EGU General Assembly 2025, Vienna, Austria, 27 Apr–2 May 2025, EGU25-6107, https://doi.org/10.5194/egusphere-egu25-6107, 2025.

EGU25-6108 | ECS | Posters on site | OS2.4

Post-Little Ice Age evolution of Svalbard's lagoon systems – types, changes, and responses to storms 

Zofia Owczarek and Mateusz Strzelecki

Lagoon coasts are regarded as among the most vulnerable ecosystems to the effects of climate change, serving as conduits for interconnectivity between terrestrial, marine, and atmospheric systems. The stability of lagoons is contingent upon several factors, including the influence of storm waves, ocean currents, sediment supply, and sea level changes. To date, however, little research has been conducted on the processes shaping the evolution of Arctic coastal lagoon systems (Smith et al., 2020). The present study utilises a comprehensive array of remote sensing data sources, encompassing aerial photographs from the 1930s, orthophotographs from 1936–1938, and satellite imagery from 2021, to identify lagoon formation and systematically classify their typology.

The construction of a database comprising over 430 lagoons revealed that at least 98 of these were formed after 1936, with eight disappearing within a century. Since the end of the last ice age (LIA), at least 98 new lagoons have been formed, resulting in the current Svalbard coastal environment comprising 434 lagoons spanning 147 km2. A new lagoon type currently rapidly forming across the archipelago, is the moraine-controlled paraglacial lagoon. These lagoons form as a consequence of glacial retreat and subsequent inundation of the area between moraines and glacier ice-cliffs by the sea. The majority of observed lagoons are characterised by resistant barriers capable of withstanding strong storms. In general, the factors controlling the stability of Svalbard lagoons remain poorly understood. This is partly due to the fact that permafrost has not yet been thoroughly studied in the area and partly due to the fact that the distribution of sub-lagoon permafrost is not yet fully understood.

Keywords: lagoon systems, moraine-controlled paraglacial lagoons, coastal change,
glacier retreat, Svalbard, Arctic.

Funding: This research was funded in whole by the National Science Centre in Poland (project: Arctic storm impacts recorded in beach-ridges and lake archives: scenarios for less icy future “ASPIRE” – UMO-2020/37/B/ST10/03074)

How to cite: Owczarek, Z. and Strzelecki, M.: Post-Little Ice Age evolution of Svalbard's lagoon systems – types, changes, and responses to storms, EGU General Assembly 2025, Vienna, Austria, 27 Apr–2 May 2025, EGU25-6108, https://doi.org/10.5194/egusphere-egu25-6108, 2025.

EGU25-6649 | ECS | Orals | OS2.4

Extreme events shapping Svalbard coast: emergence of new coastal landscapes 

Jan Kavan and Mateusz Strzelecki

The High Arctic, and Svalbard in particular, is currently experiencing rapid warming, which has serious consequences for various geosystem components, especially the cryosphere. Coastal areas are especially sensitive to these changes due to their position at the interface of marine and terrestrial geosystems. Retreating glaciers, degrading permafrost, prolonged sea ice-free seasons, and increasing weather extremes are all key factors influencing the development of coastal areas. In this study, we focus on the accumulation of coastal features and their stability during the instrumental record period following the Little Ice Age. We demonstrate that, despite abrupt climatic changes, the major features of the coastal landscape are surprisingly stable, unlike their counterparts in Greenland. We argue that the most dramatic development of coastal areas occurred in the Early Holocene, during the melting of the massive Barents Sea Ice Sheet. The current deglaciation, however, is not producing sufficient meltwater or releasing enough sediments to form new accumulation coastal landforms. On the contrary, we observe episodic rapid events connected to glacier dynamics, such as glacier surges or glacial lake outburst floods, where new deltas can form within weeks or months. We provide a regional overview of Svalbard delta systems, highlighting the most striking examples of their current dynamics, and propose a conceptual model for the development of coastal areas in this region.

How to cite: Kavan, J. and Strzelecki, M.: Extreme events shapping Svalbard coast: emergence of new coastal landscapes, EGU General Assembly 2025, Vienna, Austria, 27 Apr–2 May 2025, EGU25-6649, https://doi.org/10.5194/egusphere-egu25-6649, 2025.

EGU25-7442 | ECS | Orals | OS2.4

Living Dunes: a trait-based modelling approach to optimize dune-based Nature-based Solutions 

Frederik Van Daele and Dries Bonte

To protect vulnerable coastal dunes from the growing pressures of climate change and human activities, effective and sustainable management through Nature-based Solutions (NbS) is essential. The Living Dunes Python package (https://users.ugent.be/~frevdael/) is a novel spatially explicit, process-based model that simulates coastal dune dynamics by coupling vegetation dynamics with aeolian transport and key environmental drivers. Developed in collaboration with the Dunefront and SUSANA projects, which aim to enhance coastal protection through NbS, Living Dunes is being parameterized with trait data from dune-building plant species, which are at the basis of bio-geomorphological feedbacks. Species-specific parameters for key life stages, including germination, growth, dispersal, and mortality, are incorporated to represent the diversity of coastal dune communities and their role in delivering NbS. These demographic processes are driven by environmental variables derived from global datasets and online APIs, enabling the simulation of fine-grained vegetation dynamics under various climate change and NbS implementation scenarios. By integrating trait data, process-based modeling, and global datasets, the Living Dunes package demonstrates how computational tools can be used to understand and predict coastal dune responses to environmental change, directly informing the design and optimization of NbS for dune restoration and coastal protection in the face of climate change and anthropogenic pressures.

How to cite: Van Daele, F. and Bonte, D.: Living Dunes: a trait-based modelling approach to optimize dune-based Nature-based Solutions, EGU General Assembly 2025, Vienna, Austria, 27 Apr–2 May 2025, EGU25-7442, https://doi.org/10.5194/egusphere-egu25-7442, 2025.

The Bohai Sea, a semi-enclosed inland sea located in China, has experienced a notable decline in bottom water oxygen levels over the past decade. This phenomenon is linked to the inadequate replenishment of oxygen, which is constrained by the formation of summer thermoclines that impede water renewal. The impact of global climate change on oceanic thermoclines has been pronounced. This research employs a sophisticated three-dimensional hydrothermal model in conjunction with a vertical water age model to investigate the formation and spatiotemporal characteristics of thermoclines in the Bohai Sea, as well as their response to climate change, including shifts in wind patterns and air temperature. Water age is conceptualized as the duration since a water parcel last contacted the free surface. Findings indicate that the bottom water age in the Bohai Sea remains less than 2 days in spring, suggesting that the cold bottom waters are not remnants from the winter season. The intensified surface heat flux during summer points to a thermal lag as the underlying mechanism for thermocline formation, with bottom waters warming at a slower rate than surface waters. The study reveals marked spatial heterogeneity and seasonal fluctuations in the thermocline’s distribution within the Bohai Sea. Over time, the thermoclines have exhibited a vertical descent towards the seafloor and a horizontal shift from the continental slope towards the central basin. Regarding the impacts of climate change, a trigonometric function fitting method was utilized to discern a trend of increasing wind speeds and temperatures in the Bohai Sea over the past forty years. The temperature rise leads to a downward shift of the thermocline and an intensification of its strength. Moreover, enhanced wind speeds facilitate greater vertical mixing of water masses, culminating in a weakening of the strength of the thermocline.

How to cite: Wu, M. and Sun, J.: Spatiotemporal Distribution and Climate Change Sensitivity of Thermoclines in a Semi-Enclosed Sea, EGU General Assembly 2025, Vienna, Austria, 27 Apr–2 May 2025, EGU25-7788, https://doi.org/10.5194/egusphere-egu25-7788, 2025.

EGU25-7828 | ECS | Posters on site | OS2.4

Reconstruction of the Cenozoic Paleocoastline and Evolution of the Qiongzhou Strait 

Chaoqun Wang, Xiaoxiao Yang, and Daogong Hu

To understand the evolution of the Qiongzhou Strait and ancient coastlines in the Beibu Gulf - Leiqiong area since the Cenozoic era, and to reveal its implications for regional land-sea pattern changes and global climate change. This article reconstructs the changes of ancient coastline and the evolution process of Qiongzhou Strait in the Beibu Gulf - Leiqiong area since the Cenozoic era based on borehole data. In the Paleogene, the Beibu Gulf formed a NEE trending disconnected fault basin and filled with river lake sedimentary facies. In the late Oligocene, seawater intermittently invaded the ancient Beibu Gulf lake and connected the isolated fault basin;In the Early-Middle Miocene(23.3~10.4 Ma), the coastline in the northwest of the South China Sea rapidly retreated, and the ancient lake in the Beibu Gulf evolved into the ancient Qiongzhou Strait. In the Late Miocene to Pliocene (10.4~2.58 Ma), the coastline continued to retreat, forming a wide ancient Qiongzhou Strait, Early Pleistocene regression and volcanic eruptions led to the shrinkage of the ancient Qiongzhou Strait;Frequent climate fluctuations during the late Early Pleistocene to late Pleistocebe controlled the continuous transformation of fjords and land. The significant regression during the last glacial maximum directly led to the transformation of the Beibu Gulf-Leiqiong area from sea to land; Since 15 ~ 12 ka BP, the coastline has rapidly retreated and briefly stopped between 12 and 11 ka BP, and the Beibu gulf has once again transitioned from land to sea, Afterwards, the sea level continued to rise, and the Qiongzhou Strait fully opened from west to east at 11 ka BP. By 6 ka BP, the sea level reached about 2 meters above the current sea level, forming the current sea land pattern. The results indicate that the Beibu Gulf - Leiqiong Area underwent four evolutionary stages in the Cenozoic, including the Paleogene Beibu Gulf ancient lake, the Neogene to Early Pleistocene ancient Qiongzhou Strait, the late early Pleistocene to late Pleistocene fjords, and the Holocene Qiongzhou Strait.

How to cite: Wang, C., Yang, X., and Hu, D.: Reconstruction of the Cenozoic Paleocoastline and Evolution of the Qiongzhou Strait, EGU General Assembly 2025, Vienna, Austria, 27 Apr–2 May 2025, EGU25-7828, https://doi.org/10.5194/egusphere-egu25-7828, 2025.

EGU25-7842 | ECS | Posters on site | OS2.4

Projected Decline in Arctic and Subarctic Commercial Fish Catches: Insights from Reconstructed Ocean Biogeochemical Modeling 

Eunyoung Kim, Jong-Yeon Park, and Hyung-Gyu Lim

Climate change is driving significant temperature increases in the Arctic region—over four times the global average—impacting fish populations that are highly sensitive to thermal variations. Elevated water temperatures enhance the metabolic oxygen demands of fish while simultaneously decreasing oxygen solubility in seawater. This dual effect may force fish to migrate to more favorable habitats or face higher mortality rates. While previous studies have primarily focused on the relationship between water temperature and fish catches, the influence of dissolved oxygen has remained understudied due to limited data availability. In this study, we utilized reconstructed ocean biogeochemical data from the Geophysical Fluid Dynamics Laboratory Earth System Model (GFDL-ESM2) covering the Arctic and Subarctic Exclusive Economic Zones (EEZs) from 1970 to 2017 to calculate a metabolic index that integrates both temperature and dissolved oxygen levels. Our findings demonstrate a strong correlation between the metabolic index and the catches of large demersal fish species. Permutation importance analysis revealed that dissolved oxygen often plays a more critical role than temperature in determining fish catches across numerous regions. Additionally, fish catches in subsurface areas with higher dissolved oxygen importance exhibited longer lead times in predictability, likely due to the prolonged persistence of biogeochemical conditions. Projecting into the future under various Shared Socioeconomic Pathway (SSP) scenarios up to 2100, our results consistently indicate a continued decline in fish catches across all scenarios. These outcomes highlight the urgent need to incorporate the physiological characteristics of fish into sustainable fisheries management practices to mitigate the adverse effects of changing ocean conditions in the Arctic and Subarctic regions.

How to cite: Kim, E., Park, J.-Y., and Lim, H.-G.: Projected Decline in Arctic and Subarctic Commercial Fish Catches: Insights from Reconstructed Ocean Biogeochemical Modeling, EGU General Assembly 2025, Vienna, Austria, 27 Apr–2 May 2025, EGU25-7842, https://doi.org/10.5194/egusphere-egu25-7842, 2025.

Particle pollution is a well-recognized threat to air quality, but its impacts on aquatic, coastal and marine environments remain poorly understood. Among the sources of particle pollution, blasted rock particles—mineral fragments generated e.g. during tunnel or road construction—are an emerging and relatively unknown contributor. When deposited in coastal areas, these mineral particles may pose unique challenges due to their potential to alter a.o. sediment dynamics, introduce contaminants, and disrupt the ecological balance. Today, blasted rock is frequently utilized in coastal applications such as land reclamation, erosion control, flood prevention, or as foundation material. While the effects of nitrogen and plastic particles associated with the blasting explosives are comparatively well-studied, the role of rock mineralogy, particle morphology, and the leaching of mineral-associated metals on coastal waters and ecosystems remains largely unexplored. This review focuses on the impacts of blasted rock disposal on coastal environments, synthesizing findings from peer-reviewed scientific literature and publicly available reports to Norwegian authorities. Specifically, we (1) analyze the mechanisms by which blasted rock particles affect coastal ecosystems, (2) place Norwegian findings into a global context, (3) propose preliminary thresholds for ecological impacts on coastal environments, (4) suggest improvements in management practices for coastal particle disposal, and (5) identify key research gaps requiring further investigation. Our analysis emphasizes knowledge advancements over the past decade while incorporating foundational studies and reports to ensure a comprehensive evaluation.

How to cite: Deininger, A., Eek, E., Sætre, C., Skretting, E., and Totland, C.: Impacts of Blasted Rock Disposal on Coastal Environments: A review and Norwegian perspective on Pollution Mechanisms, Ecological Impacts, and Management Practices, EGU General Assembly 2025, Vienna, Austria, 27 Apr–2 May 2025, EGU25-8283, https://doi.org/10.5194/egusphere-egu25-8283, 2025.

EGU25-9356 | ECS | Orals | OS2.4

Enhancing coastal flood mitigation through hybrid defences integrating hard engineering and nature-based solutions  

Constantinos Matsoukis, Marta Payo Payo, Amani Becker, Claire Evans, Jennifer Brown, and Laurent Amoudry

Coastal flooding affects the lives and prosperity of millions of people living by the sea, and rising sea levels will only increase this risk. Coastal defences are already subject to more extreme and frequent storm events and may not be able to withstand future conditions. Consequently, designing suitable flood protection policies and schemes is becoming ever more crucial. Coastal practitioners across sectors have started to champion ‘greener’ nature-based solutions as alternatives to traditional hard coastal defences. Coastal wetlands (e.g., salt marshes, mangroves) can act as buffers and help mitigate storm impacts because their vegetation dissipates wave energy. Multiple studies have confirmed that wetlands effectively attenuate short period waves (i.e., wind waves), but their efficiency against long period waves (e.g., tidal waves, storm surges) remains in doubt. It is generally assumed that tens of kilometres of wetland width are required to achieve sufficient storm attenuation in these cases. However, coastal squeeze and urbanization often limit the creation of such large wetlands, and the necessary conversion of agricultural land causes social resistance to nature-based solutions. In this study, the effectiveness of hybrid solutions was tested as an alternative. A 2D numerical model is built in Delft3D-FM to simulate flooding in the inner Forth Estuary (UK), in an area that suffers from frequent flooding. The hybrid defence scheme comprises an existing embankment enhanced by vegetation patches of various sizes and locations in front, on top and behind the embankment. In the model, the vegetation consists of grasslands including salt tolerant plants of substantial height and density. Model simulations were designed to replicate conditions during the December 2013 storm, which devastated the study area. The results indicate that vegetation can significantly increase the energy dissipation already provided by the embankment and, in turn, reduce water depths and flood extents.

Our results also show that combining vegetation and embankment requires vegetated zones with less cross-shore width to achieve desired protection. In this specific example, this reduces the loss of agricultural land, and more generally points at limiting necessary land use conversion. It also lowers repair and maintenance costs of seawalls and dikes. The effectiveness of vegetation in storm attenuation is enhanced when it interferes with the main flow path and alters flow circulation.  As such, the location of vegetation is a key consideration when implementing these solutions. Finally, this study suggests that wet grasslands can be a viable option for flood mitigation as an alternative to salt marshes and mangroves when implemented aside of hard engineering solutions. These findings offer valuable insights for coastal managers and practitioners interested in implementing hybrid or composite defences and highlight the potential benefits of these approaches, including testing more socially acceptable solutions.

How to cite: Matsoukis, C., Payo Payo, M., Becker, A., Evans, C., Brown, J., and Amoudry, L.: Enhancing coastal flood mitigation through hybrid defences integrating hard engineering and nature-based solutions , EGU General Assembly 2025, Vienna, Austria, 27 Apr–2 May 2025, EGU25-9356, https://doi.org/10.5194/egusphere-egu25-9356, 2025.

EGU25-9999 | ECS | Orals | OS2.4

The future of the Portuguese most vulnerable coastal areas under climate change – shoreline evolution and future extreme coastal flooding from downscaled bias corrected ensembles 

Gil Lemos, Ivana Bosnic, Carlos Antunes, Michalis Vousdoukas, Lorenzo Mentaschi, and Pedro MM Soares

Some of the most disruptive effects of climate change are projected to be felt along the coastlines. The combined effects of future changes in water levels and wave climate along the coastal areas constitute one of the most serious threats to their sustainable evolution, compromising critical infrastructures, resources, ecosystems, and communities. Understanding long-term changes in coastal areas remains challenging, however, due to their multivariate and multi-time-and-space-scale nature. In this study, we propose an innovative methodology for a complete vulnerability assessment of sandy low-lying coastal areas, based on dynamic, ensemble-based projections from the Coupled Model Intercomparison Project phase 5 (CMIP5). The effects of sea level rise (SLR) and nearshore wave climate changes on future shoreline evolution are firstly assessed at five key-locations along the Portuguese coastline. Longshore sediment transport (LST) projections are computed, and sedimentary imbalances are quantified. Robust shoreline retreat of up to 300 m is projected, especially along the Portuguese northern and central coastal areas, with continued erosion driven mainly by sediment imbalance and SLR. The projected decrease in future nearshore wave energy is responsible for a slight alleviation in erosion trends, up to 6.33%, whereas the increase of northerly incoming waves is expected to lead to northward beach rotations along western Mainland Portugal. The resulting shoreline evolution is responsible for the loss of up to 0.786 km2 of dry land by 2100 along the 14 kilometers of analyzed coastline. Based on the shoreline projections, new digital terrain models are built for the five key-locations, and future extreme total water levels are obtained through a probabilistic approach, defining wave events considering high wave energy thresholds in a changing climate. The results reveal that extreme coastal flooding is projected across several urbanized sections along the Portuguese coastline, especially in areas without artificial protection infrastructures. As dune erosion is expected along the sandy stretches, the natural protection against extreme coastal events is projected to be reduced by up to 13.3%, promoting widespread overtopping, leaving populations more exposed. Future projections reveal the episodic flooding of up to 1.47 km2 of land across the five key-locations (and up to 604 km2 at a national scale), threatening households and commercial hubs, besides services and communication routes. Overall, as physical and human losses may increase substantially in the future, our results call for the implementation of adequate coastal management and adaptation plans, strategically defined to withstand changes until 2100 and beyond.

This work is supported by the Portuguese Fundação para a Ciência e Tecnologia, FCT, I.P./MCTES through national funds (PIDDAC): UID/50019/2025 and LA/P/0068/2020 https://doi.org/10.54499/LA/P/0068/2020).

How to cite: Lemos, G., Bosnic, I., Antunes, C., Vousdoukas, M., Mentaschi, L., and MM Soares, P.: The future of the Portuguese most vulnerable coastal areas under climate change – shoreline evolution and future extreme coastal flooding from downscaled bias corrected ensembles, EGU General Assembly 2025, Vienna, Austria, 27 Apr–2 May 2025, EGU25-9999, https://doi.org/10.5194/egusphere-egu25-9999, 2025.

EGU25-10042 | Posters on site | OS2.4

Inundation levels and vegetation:  keys to control peak flows in wetlands 

Marianna Soler, Jordi Colomer, Andrew Folkard, and Teresa Serra

Wetlands serve as coastal protection structures via hydrological and biogeochemical processes (Junk et al., 2013), preventing soil erosion (Barcelona et al., 2018) and promoting sedimentation and soil stabilization (Montakhab et al., 2012).  Wetlands contribute to mitigate the impacts of peak flows caused by pluvial or fluvial floods or storm surges. The increase in global warming will affect coastal areas with an increase in sea level and erosive processes (Reed et al., 2018), and an increase in the frequency of hydrometeorological phenomena such as coastal flooding and maritime storms (Hoggart et al., 2014). Inland wetlands are also to be increasingly affected by pluvial and fluvial floods (Kundzewicz and Pinskwar, 2020). It is then necessary to add knowledge on the impacts of both the wetland inundation level and the vegetation water resistance on hydrodynamics and sedimentary patterns in front of a peak flow to know the wetland benefits in front of flooding events. In this study, particle ladden floods were reproduced by flume experiments were a peak flow (of water height H) flowed into a wetland with a water height h (where H > h) populated with two natural species (Juncus maritimus and Arthrocnemum fruticosum). The peak flow was found to pass through different regimes with different sedimentation patterns: peak flow adjustment; peak flow; drag-dominated peak flow; ending to the gravity current regimes. During the peak flow regime, low-inundated wetlands induced higher sedimentation rates for the coarse sediment fraction than for the fine sediment fraction, while high-inundated wetlands resulted in similar settling rates for both sediment fractions, coarse and fine. Because the coarse portion has already settled, at greater distances sedimentation rates corresponded to the fine fraction and dropped monotonically along the flume.  It was also found that the presence of vegetation enhanced the sedimentation rates compared to bare soil conditions.

This finding demonstrates how crucial vegetation is to protect the bed and prevent bed erosion in coastal regions when facing peak flows and how higher inundation levels reduces the harmful effect of the front pass by enhancing the sediment deposition.

References

Barcelona, A., Serra, T., Colomer, J., 2018. Fragmented canopies control the regimes of gravity currents development. J. Geophys. Res-Oceans, 123, https://doi.org/10.1002/2017JC01314

Hoggart, S.P.G., Hanley, M.E., Parker, D.J., Simmonds, D.J., Bilton, D.T.,  Filipova-Marinova, M., Franklin, E.L., Kotsev, I., Penning-Rowsel, E.C., Rundle, S.D., Trifonova, E., Vergiev, S., White, A.C., Thompson, R.C., 2014. The consequences of doing nothing: The effects of seawater flooding on coastal zones. Coast. Eng. 87, 169–182. https://doi.org/10.1016/j.coastaleng.2013.12.001

Junk, W.J., An, S., Finlayson, C.M., Gopal, B., Kveˇt, J., Mitchell, S.A., Mitsch, W.J., Robarts, R.D., 2013. Current state of knowledge regarding the world’s wetlands and their future under global climate change: a synthesis. Aquat. Sci. 75, 151–167. https://doi.org/10.1007/s00027-012-0278-z.

Kundzewicz, Z.W., Pinskwar, I., 2022. Are Pluvial and Fluvial Floods on the Rise? Water 2022, 14, 2612. https://doi.org/10.3390/ w14172612

Montakhab, A., Yusuf, B., Ghazali, A. H., Mohamed, T. A., 2012. Flow and sediment transport in vegetated waterways: a review. Rev. Environ. Sci. Bio. 11(3), 275-287. https://doi.org/10.1007/s11157-012-9266-y

How to cite: Soler, M., Colomer, J., Folkard, A., and Serra, T.: Inundation levels and vegetation:  keys to control peak flows in wetlands, EGU General Assembly 2025, Vienna, Austria, 27 Apr–2 May 2025, EGU25-10042, https://doi.org/10.5194/egusphere-egu25-10042, 2025.

EGU25-11715 | Posters on site | OS2.4

Chlorophyll variability in a Coastal Ecosystem: Insights from Recent Decades and Future Projections 

Florian Kokoszka, Camil Lefebvre, Sarah Asdar, Bruno Buongiorno Nardelli, Paola Mercogliano, Maurizio Ribera d'Alcalá, Francesca Margiotta, and Daniele Iudicone

Climate change is transforming coastal ecosystems by altering key processes such as freshwater inputs, salinity, and stratification, which drive nutrient dynamics, primary productivity, and carbon cycling. This study explores the dynamics of chlorophyll concentration (as a proxy for local planktonic biomass) in the Gulf of Naples (GoN) within the Mediterranean Sea. Leveraging long-term monitoring data and machine learning, we identify the local drivers of chlorophyll concentrations as a combination of physical and biogeochemical conditions. Notably, salinity emerges as a key predictor of chlorophyll, emphasizing the critical role of freshwater inflows and mixed layer dynamics. We develop an empirical model to estimate salinity based on freshwater discharge and stratification, which proves robust even with simplified inputs. By combining these predictors with future climate projections (RCP4.5 and RCP8.5), we assess the potential impacts of changing precipitation and wind patterns on salinity and chlorophyll. Results suggest increasing salinity and declining chlorophyll concentrations, particularly in spring, while uncertainties persist for autumn trends. Crucially, changes occurring on land may have a greater impact than those at sea (e.g., temperature) on coastal ecosystems, particularly their microbiomes, which form the foundation of the main trophic webs. These findings highlight the importance of long-term monitoring and infrastructure development to enhance ecosystem management under future climate scenarios.

How to cite: Kokoszka, F., Lefebvre, C., Asdar, S., Buongiorno Nardelli, B., Mercogliano, P., Ribera d'Alcalá, M., Margiotta, F., and Iudicone, D.: Chlorophyll variability in a Coastal Ecosystem: Insights from Recent Decades and Future Projections, EGU General Assembly 2025, Vienna, Austria, 27 Apr–2 May 2025, EGU25-11715, https://doi.org/10.5194/egusphere-egu25-11715, 2025.

Global warming is expected to increase the frequency and severity of compound weather, ocean and climate events. These can lead, due the interplay of multiple climate drivers and/or hazards, to far greater societal and environmental impacts than the sum of the isolated individual events. Multiple strong consecutive tropical cyclones occurring in quick succession can be classified as temporally compounding events. These events are associated with heavy rainfall, river flooding and storm surges. In the ocean, they have a combined and cumulative impact on the local hydrodynamic conditions, e.g. reduced salinity by the increased freshwater input, which in turn affects local ecosystems.

This study aims to evaluate the combined effect of strong winds and increased freshwater input during those compound events on the local salinity and circulation, while focusing on the area around Dongshan Bay, Fujian (China). The bay serves as an ideal case study, as the northern South China Sea has been increasingly hit by two or more strong consecutive typhoons in recent years.

For the investigation, the regional shelf ocean circulation model HAMSOM is used to downscale global climate scenarios to an appropriate regional scale through a nested, uncoupled modelling approach. The outer model setup covers the southern East China Sea, the Taiwan Strait and the northern South China Sea (SCS). It resolves the most important oceanic features for this study, including the circulation in the SCS, the influence of the Kuroshio and the throughflow in the Taiwan Strait. The outer model provides the lateral boundary conditions for the inner model, which has a high resolution of approximately 400m to adequately resolve the area around Dongshan Bay to the west coast of Taiwan. The atmospheric forcing and river discharges are provided by an hourly East-Asia Cordex dataset, which has proven to reproduce past typhoon tracks in the SCS quite realistically. The model setup allows to run control simulations with and without freshwater input to assess the effect of strong consecutive typhoon events on the local salinity. The results can then be used to assess the vulnerability of local ecosystems to these type of compound events.

How to cite: Enneper, N. D. C.: The impact of consecutive typhoons on the hydrodynamic conditions in a small bay in the Taiwan Strait, EGU General Assembly 2025, Vienna, Austria, 27 Apr–2 May 2025, EGU25-12790, https://doi.org/10.5194/egusphere-egu25-12790, 2025.

This study examines how antecedent geology influences soil mechanics and consolidation in estuarine subsurface deposits, highlighting its potential as a marine geohazard in the context of large infrastructure projects. The Bolivar Roads Gate System is a proposed surge barrier extending across Bolivar Road, which is the mouth of Galveston Bay, to mitigate risks associated with increased storm surges and rising sea levels under a changing climate. Inspired by the Dutch Maeslant Barrier, this study investigates subsurface responses to such large structures, focusing on settlement and consolidation dynamics using existing borehole data and simplified one-dimensional soil calculations. Findings reveal that the saturated clays and cohesive soils at the Bolivar Roads site are prone to settlement rates exceeding those at the Dutch site by over 100-fold, driven by differences in geotechnical properties. Such elevated subsidence could disrupt the stability and operational integrity of the proposed Bolivar Roads navigational structure, potentially affecting land-sea interactions and storm surge protection efficacy. These changes underscore the need for adaptive management strategies, to mitigate differential settlement and ensure long-term functionality. This study contributes to understanding how engineered coastal management solutions interact with dynamic coastal processes, providing insights into sustainable infrastructure in the Anthropocene.


How to cite: Robbins, C.: The Role of Estuarine Antecedent Geology in Shaping Marine Geohazards and Storm Surge Infrastructure: A Comparison of the Dutch Maeslant Barrier and the Proposed Bolivar Gate System in Galveston Bay (USA), EGU General Assembly 2025, Vienna, Austria, 27 Apr–2 May 2025, EGU25-14178, https://doi.org/10.5194/egusphere-egu25-14178, 2025.

EGU25-15209 | ECS | Posters on site | OS2.4

Wind-induced residual current as a driver of sediment flux intensification in a shallow, micro-tidal bay 

Chae Yeon Eun, Sun Min Choi, Jun Young Seo, Jongseong Ryu, and Ho Kyung Ha

Wind-induced currents are the major forces responsible for sediment resuspension and transport in micro-tidal bays. The hydrodynamics and sediment transport mechanisms were investigated in Onsan Bay, a heavily contaminated, micro-tidal area on the southeastern coast of Korea, designated as a “Special Management Coastal Zone” due to severe pollution. At two mooring stations (M1: central part of the bay; M2: entrance of the bay), in-situ measurements using acoustic Doppler current profilers (ADCPs) were conducted to examine the impact of wind-induced residual currents on the sediment flux over four weeks. During the mooring period, residual currents (ū) in both stations showed classical estuarine circulation characterized by seaward (landward) flows at the surface (bottom) layers. The suspended sediments at both stations were transported seaward (landward) at the surface (bottom) layer mainly through the residual currents (mean-flow flux Fmean: > 70% of the total flux). Under northerly winds, the bottom ū at M1 and M2 strengthened, with a higher increment at M1. This result implies that the intrusion of alongshore currents through the bottom layer strengthened under northerly winds. The landward Fmean at M1 (M2) was 1.4 (1.2) times higher under northerly winds than southerly winds, resulting in the quadruple “intensification” of net sediment flux. This observation was attributed to the enhanced landward water transport and the weak sediment resuspension by wind-induced residual currents. This suggests that the northerly winds might be a primary factor intensifying the landward sediment fluxes, potentially resulting in the increased sediment deposition into the bay. The findings provide insights into managing sedimentation in contaminated coastal bays and highlight the importance of wind effects on sediment transport in micro-tidal bays.

How to cite: Eun, C. Y., Choi, S. M., Seo, J. Y., Ryu, J., and Ha, H. K.: Wind-induced residual current as a driver of sediment flux intensification in a shallow, micro-tidal bay, EGU General Assembly 2025, Vienna, Austria, 27 Apr–2 May 2025, EGU25-15209, https://doi.org/10.5194/egusphere-egu25-15209, 2025.

EGU25-15389 | Posters on site | OS2.4

Typhoon-induced sediment dynamics: Effects of extreme winds on resuspension and transport in Yeosu Bay, Korea 

Su In Kim, Sun Min Choi, Seong Woon Jeong, Jae-Hun Park, Pyeong Joong Kim, and Ho Kyung Ha

Typhoons significantly influence sediment resuspension through the mixing induced by strong winds, which alters the local current patterns and sediment dynamics. An acoustic Doppler current profiler was moored in Yeosu Bay from August 19 to September 20, 2022, to investigate the effects of typhoon on sediment transport mechanisms. Before the typhoon, the mooring station exhibited a strong stratification of water column caused by freshwater inflow from the Seomjin River. On September 6, 2022, Typhoon Hinnamor passed through the study area, disrupting the semi-diurnal current regime and associated sediment transport. Under the influence of the typhoon, the residual current profile transitioned from a two-layered structure to a fully mixed structure. Strong winds (~16 m s–1) affected the stability of bed sediments and stratification, resulting in significant differences in suspended sediment concentration (SSC) during spring tides before (SI) and after (SII) the typhoon. Despite similar current-induced bed shear stress, the SSC during the SII period reached up to 350 mg l–1, which was about four times higher than during the SI period (87 mg l–1). Near-bed sediment fluxes controlled by tidal pumping increased during the SII period (54%) compared to the SI period (29%) and transport landward. This suggests that suspended sediments advected from the Seomjin River due to the typhoon settled in Yeosu Bay, resulting in the bed stability decrease. Along with suspended sediments, the typhoon led to an input of terrestrial nutrients from the Seomjin River, which could affect the biological productivity of Yeosu Bay. The results from this study indicate that Typhoon-induced disturbances of coastal currents could significantly affect sediment resuspension and transport, highlighting the complex interactions between meteorological forcing and sedimentary processes in coastal environments.

How to cite: Kim, S. I., Choi, S. M., Jeong, S. W., Park, J.-H., Kim, P. J., and Ha, H. K.: Typhoon-induced sediment dynamics: Effects of extreme winds on resuspension and transport in Yeosu Bay, Korea, EGU General Assembly 2025, Vienna, Austria, 27 Apr–2 May 2025, EGU25-15389, https://doi.org/10.5194/egusphere-egu25-15389, 2025.

EGU25-15703 | ECS | Orals | OS2.4

Advanced Tools for Investigating the Marine Environment of the Southern Baltic Sea Using Model Data 

Dawid Dybowski, Maciej Janecki, Artur Nowicki, and Lidia Dzierzbicka-Głowacka

This presentation focuses on the introduction of newly developed tools for studying the marine environment of the Southern Baltic Sea using model-based data. The foundation of this work is the development of novel tools for monitoring and forecasting biochemical conditions within the 3D CEMBS-PolSea ecohydrodynamic model, which integrates hydrodynamic and biochemical components.

The biochemical component of the model represents key parameters, including phytoplankton and zooplankton biomass, living and detrital organic matter, chlorophyll-a concentration, dissolved oxygen (O₂), and chemical components such as nitrates (NO₃), phosphates (PO₄), and silicates (SiO₃). The implementation of environmental variables is achieved through the definition of source and sink functions for all biochemical variables, governed by a second-order partial differential equation describing turbulent diffusion with an advective term. This equation serves as the interface between the hydrodynamic and biochemical components of the model.

The presentation highlights several novel tools that provide new functionalities for marine research. These include the identification of habitats or regions with user-defined hydrodynamic, physicochemical, and biological parameters, utilizing numerical simulation results to deliver precise spatial information. Additionally, tools for tracking the trajectories of passive particles in the surface layer under varying hydrodynamic conditions are introduced. By employing numerical forecasts, the tools estimate metrics such as maximum transport range, transit time, and the predicted final location of particles based on their initial positions. These tools are designed for operational use and will be accessible to end-users in an open-access format.

We assume that analyses conducted using these tools will significantly enhance our understanding of the functioning of marine ecosystems, including those in coastal zones. The integration of biochemical and hydrodynamic modeling within the 3D CEMBS-PolSea framework improves the ability to predict and analyze the spatiotemporal dynamics of the marine environment in the Southern Baltic Sea. The model aims to provide a robust decision-support system for scientific research and environmental management.

This study was financed from the state budget under the program of the Minister of Education and Science under the name "Science for Society II" No. NdS-II/SP/0003/2023/01, funding amount PLN 1,996,763.77, total project value PLN 1,996,763.77.

How to cite: Dybowski, D., Janecki, M., Nowicki, A., and Dzierzbicka-Głowacka, L.: Advanced Tools for Investigating the Marine Environment of the Southern Baltic Sea Using Model Data, EGU General Assembly 2025, Vienna, Austria, 27 Apr–2 May 2025, EGU25-15703, https://doi.org/10.5194/egusphere-egu25-15703, 2025.

EGU25-15907 | ECS | Orals | OS2.4

CSI-POM 1 & 2: An Integrated System for Monitoring and Predicting Coastal Dynamics in the Southern Baltic Sea 

Maciej Janecki, Dawid Dybowski, Artur Nowicki, and Lidia Dzierzbicka-Głowacka

The Digital Information System for Polish Maritime Areas (CSI-POM) project is an advanced initiative aimed at monitoring and forecasting the environmental conditions of the Southern Baltic Sea, focusing on hydrodynamic, physical, chemical, and biological processes. Physical and hydrodynamic processes were implemented during the first stage of the project (CSI-POM 1), while biochemical processes are analyzed within the currently ongoing stage two (CSI-POM 2). This presentation will showcase the functionalities of this extended system on the marine environment, emphasizing its relevance to the dynamic coastal processes and human-climate interactions.

The project employs high-resolution 3D ecohydrodynamic model (CEMBS-PolSea) with a horizontal resolution of 575 m, incorporating satellite data assimilation for SST and chlorophyll-a concentration. This capability enables precise spatiotemporal analyses of key processes, such as nutrient distribution, primary production, and cyanobacterial blooms. The system features a dedicated tool for the automated detection of cyanobacterial blooms, combining satellite and model data to predict their spatial distribution and forecasted evolution. This tool is crucial for addressing the ecological and societal impacts of harmful algal blooms in coastal waters.

The CSI-POM system's tools provide vital insights into the ecological and physical interactions across coastal interfaces, aiding in understanding the variability of biochemical parameters like nitrate, phosphate, and silicate concentrations, dissolved oxygen levels, and chlorophyll-a distributions. Such tools not only enhance the predictive capacity for ecosystem management but also support decision-making in maritime economy sectors, such as fisheries, environmental protection, and coastal hazard mitigation.

The presentation will highlight the integration of advanced modeling techniques and observational data to create a holistic framework for monitoring coastal dynamics in the face of changing climate and human activities. By fostering interdisciplinary collaboration, the CSI-POM project aligns with the session's focus on sustainable coastal zone management and resilience-building.


This study is financed from the state budget under the programme of the Minister of Education and Science (Poland) entitled "Science for Society" No. NdS/546027/2022/2022, amount of funding PLN 1 702 130.65, total value of the project PLN 1 702 130.65 and "Science for Society II" No. NdS-II/SP/0003/2023/01, amount of funding PLN 1 996 763.77, total value of the project PLN 1 996 763.77.

How to cite: Janecki, M., Dybowski, D., Nowicki, A., and Dzierzbicka-Głowacka, L.: CSI-POM 1 & 2: An Integrated System for Monitoring and Predicting Coastal Dynamics in the Southern Baltic Sea, EGU General Assembly 2025, Vienna, Austria, 27 Apr–2 May 2025, EGU25-15907, https://doi.org/10.5194/egusphere-egu25-15907, 2025.

EGU25-16694 | ECS | Orals | OS2.4

AI-based animal monitoring for marine biodiversity conservation along the North Sea and Baltic Sea coasts 

Christian Sommer, Mathias Seuret, Nora Gourmelon, Mahsa Bahrami, Vincent Christlein, and Matthias Braun

Coastal and offshore areas are highly relevant in the context of globalized economies and their demands for fisheries, transport and sustainable energy production. However, the ecological impacts of increasing human activity, such as noise disturbance and sediment dispersal from construction works and shipping traffic, could pose a threat to the biodiversity of marine ecosystems. By balancing marine food webs, controlling pests and dispersing seeds, marine birds are not only important for the conservation of biodiversity, but are also often seen as an early warning indicators of environmental change, as behavioural and physiological characteristics of bird populations are linked to changes in habitat quality. Spatial obervations of the distribution and size of bird populations are therefore needed to conserve biodiversity. Due to the vast extents and sometimes inaccessible nature of coastal and offshore areas, repeated airborne remote sensing surveys provide an efficient means of monitoring marine birds. However, the detection and classification of features on the ocean surface, such as animals, waves or man-made structures, remains challenging and is often achieved through time-consuming manual image inspection and annotation by trained experts.

Here, we present first results of an AI-based approach to automatically detect and identify different features and facilitate the monitoring of marine bird species and populations: Our study is based on approximately 2.5 million optical images with a ground resolution of 2 cm from 60 airborne surveys which were conducted by the German Federal Agency for Nature Conservation (BfN) along the German North Sea and Baltic Sea coasts between 2017 and 2021. Previously, images with bird sightings from some surveys have been annotated manually, enabling the training of a deep learning algorithm. Technical challenges for AI-based bird detection include a wide range of image exposure conditions, from low to high brightness contrast between objects and background, insufficient spatial resolution for relatively small species and tracking specific birds that appear in successive overlapping images to avoid double counting. Thus, our method uses a neural network approach (Faster R-CNN) to localise potential object candidates (e.g. bird) within an entire image, while a subsequent network classifier identifies the broad classification category of the detected object. In addition, spatio-temporal tracking of the detected features is included by estimating the most likely object displacement within successive images based on flight speed and camera motion along each survey transect. This workflow allows relatively efficient processing of large amounts of high-resolution imagery, as well as general classification of objects at an early processing stage.

Ultimately, our automated analysis workflow will contribute to the preservation management of biodiversity in the German North Sea and Baltic Sea by facilitating the repeated monitoring of bird populations.

How to cite: Sommer, C., Seuret, M., Gourmelon, N., Bahrami, M., Christlein, V., and Braun, M.: AI-based animal monitoring for marine biodiversity conservation along the North Sea and Baltic Sea coasts, EGU General Assembly 2025, Vienna, Austria, 27 Apr–2 May 2025, EGU25-16694, https://doi.org/10.5194/egusphere-egu25-16694, 2025.

EGU25-16766 | Orals | OS2.4

 Resilience in Coastal Weltand Systems – Why it matters and how it can be determined 

Ronald Corstanje, Nikolaos Toumasis, and John White

Freshwater, marine, and terrestrial ecosystems are experiencing significant changes as a result of human activity and anthropogenic climate change. The ability of ecosystems to tolerate changes in state variables and processes while continuing to maintain core ecological functions in the wake of disturbances is defined as resilience. Tipping points are observed in systems with strong positive feedback, providing early warning signals of potential instability. These points can be detected through metrics associated to a theoretical notion described as critical slowing down (CSD), such as increased recovery time, variance, and autocorrelation. Here we present CSD analysis of the Coastwide Reference Monitoring System (CRMS) dataset which covers the extent of the Mississippi Delta and coastal area in Louisiana, USA. CRMS consists of a defined sampling schedule and standardised data collecting methods across 390 sites. The CRMS stations span the whole coast of Louisiana, situated across nine coastal basins. Four transects were selected, of which fifteen stations across 3 Transects along the coastline and another six stations located closer to the Mississippi river, located further inland. Using a set of quantitative, analytical methods based on the assessment of changes in variance and autocorrelation we determine the current state and likelihood to be at CSD, so to demonstrate how to operationalise what to date has been developed as a theoretical framework. We use wavelets as a measure of identifying changes in the variance term, and autocorrelation was modelled using a Bayesian dynamic linear model. We are able to describe the long term ecological impact of climate high energy disturbance events such as intense tropical storms or low energy events such as extensive droughts through the analysis of the spatio-temporal patterns in the long term water quality monitoring stations.


How to cite: Corstanje, R., Toumasis, N., and White, J.:  Resilience in Coastal Weltand Systems – Why it matters and how it can be determined, EGU General Assembly 2025, Vienna, Austria, 27 Apr–2 May 2025, EGU25-16766, https://doi.org/10.5194/egusphere-egu25-16766, 2025.

EGU25-17297 | Posters on site | OS2.4

Multi-technique approach for the reconstruction of rocky coast evolution 

Daniela Piacentini, Davide Torre, Giulia Iacobucci, and Francesco Troiani

Coastal areas are high dynamic environments which, especially considering the present climate conditions, are undergoing huge morphological changes mostly in terms of erosion. The retreat of coastal slopes, either progressive or sudden, is the result of the interaction between marine and terrestrial processes acting on specific litho-structural contexts.

The analyses of retreat style and relative rate can be lead combining field measurements and high-resolution remote sensing techniques. These approaches allow the quantification of erosion trend and the identification of the key factors driving the observed changes over time. The integration of multi-techniques measurement strengthens the evaluation of the interplay between terrestrial and marine processes and litho-structural factors, such as lithological variability, enabling a detailed understanding of how different coastal typologies respond to these processes.

Within the framework of the extended partnership RETURN (multi-Risk sciEnce for resilienT commUnities undeR a changiNg climate - Italy’s National Recovery and Resilience Plan), our study focuses on the evolution of a segment of the southern coast of the Lazio region (Italy). The study area is characterized by a soft-rocky cliff and shore platform system, partially emerged and partially submerged, where a high cliff retreat rate has been observed. To this end, multitemporal surveys were conducted using various remote sensing techniques, including optical photogrammetry via Unmanned Aerial Vehicle (UAVs), LiDAR surveys using UAV-mounted laser scanners, imagery captured with a MicaSense RedEdge-P multispectral camera equipped on a UAV, and portable laser scanner with Simultaneous Localization and Mapping (SLAM) technology (FJD TRION P1 model). Optical photogrammetry and LiDAR, both conducted via drones, enabled us to produce high-resolution 3D point clouds, orthophotos (<2 cm/pixel), and Digital Terrain Models (DTM, <5 cm/pixel). Through repeated surveys over two years, a multitemporal change detection analysis was conducted, revealing significant changes in response to storm events and providing rates of cliff retreat up to 1 m in localized sectors. SLAM technology allows to examine outcrop portion, less visible from UAV surveys, as the bottom of the rocky cliff. Here, the impact of storm waves was monitored, and the specific SLAM results were useful for unravelling the role of extreme event on the cliff retreating and associated rock-fall triggering along the cliff wall. The use of the multispectral sensor, particularly through the Green and Blue bands, provides useful data for better understanding the morphodynamics along the submerged portion of the shore platform. In particular, the submerged platform exhibits the same rock fracturing patterns observed in the emerged section and is composed of blocks that detach and partially slide into the sea, contributing to the retreating trend of the cliff and shore platform system.

The integration of multi-techniques not only enabled the quantification of the retreat rates of the cliff under analysis, but also allowed their correlation with predisposing and triggering factors, providing the foundation for the comprehension of potential future evolution in a changing climate context.

How to cite: Piacentini, D., Torre, D., Iacobucci, G., and Troiani, F.: Multi-technique approach for the reconstruction of rocky coast evolution, EGU General Assembly 2025, Vienna, Austria, 27 Apr–2 May 2025, EGU25-17297, https://doi.org/10.5194/egusphere-egu25-17297, 2025.

EGU25-17481 | Orals | OS2.4

 The first high-resolution dataset of Arctic coastal landforms and processes for the entire Svalbard archipelago, Western Barents Sea.  

Maria Ansine Jensen, Carlette N. Blok, Lena Rubensdotter, and Amandine Missana

Arctic coastlines are changing rapidly with warming climate. This has implications for land use, infrastructure, archeological heritage and impacts carbon and nutrient budgets for Arctic seas and nearshore wetlands. Despite the Arctic currently warming four times faster than the rest of the world, Arctic coasts are generally poorly monitored and lack baseline studies.

Our recently published dataset “Arctic landforms and processes around the coast of Svalbard” (Blok et al., 2024) is the first high resolution baseline dataset for coastal change in the Svalbard archipelago, at the junction between the western Barents Sea and the Arctic Ocean. The dataset is based on morphological mapping of landform assemblages around the entire coastline of the archipelago. Landform assemblages  are linked to dominant physical processes, based on extensive fieldwork on different coastal types in Svalbard. The coastal landform assemblages are categorized in 13 classes reflecting combinations of wave, tide, fluvial, glacial and gravity processes influencing the morphology and dynamics of the coastline. Mapping has been done in 1:30.000 scale on aerial images combined with satellite imagery. This open-source dataset adds regional high-resolution data to the western Barents Sea sector of the pan-Arctic Coastal Dynamics database (Lantuit et al., 2012; 2020).

Most of the Svalbard coastline is currently shaped by combined processes. The more dynamic parts of the coast by combinations of wave, tide and fluvial processes. With diminishing sea ice, shortened frozen ground season, deepening active layer, increased river runoff and open rivers duration, the balance between dominant processes at each site will determine future development of the coast. The coastal landform dataset allows to asess expected consequences with increase of individual processes or changing balance between processes at any site. We will present examples of use for cultural heritage mangement and for studies of carbonstocks in coastal wetlands and discuss use for remote assessment of coastal change.  


References:

Blok, Carlette N; Missana, Amandine F J M; Rubensdotter, Lena; Jensen, Maria A (2024): Arctic landforms and processes around the coast of Svalbard [dataset]. PANGAEA, https://doi.pangaea.de/10.1594/PANGAEA.973595 (DOI registration in progress)

Lantuit, H. , Overduin, P. P. , Couture, N. ,Wetterich, S. , Are, F. , Atkinson, D. , Brown, J. ,Cherkashov, G. , Drozdov, D. , Forbes, D. , Graves-Gaylord, A. , Grigoriev, M. , Hubberten, H. W. ,Jordan, J. , Jorgenson, T. , Ødegård, R. S. ,Ogorodov, S. , Pollard, W. , Rachold, V. , Sedenko, S. , Solomon, S. , Steenhuisen, F. , Streletskaya, I. and Vasiliev, A. (2012): The Arctic Coastal Dynamics database. A new classification scheme and statistics on arctic permafrost coastlines , Estuaries and Coasts., 35 (2), pp. 383-400 . doi: 10.1007/s12237-010-9362-6

Lantuit, Hugues; Overduin, Pier Paul; Couture, Nicole; Wetterich, Sebastian; Are, Felix; Atkinson, David; Brown, Jerry; Cherkashov, Georgy A; Drozdov, Dimitry S; Forbes, Donald Lawrence; Graves-Gaylord, Allison; Grigoriev, Mikhail N; Hubberten, Hans-Wolfgang; Jordan, James; Jorgenson, M Torre; Ødegård, Rune Strand; Ogorodov, Stanislav; Pollard, Wayne H; Rachold, Volker; Sedenko, Sergey; Solomon, Steve; Steenhuisen, Frits; Streletskaya, Irina; Vasiliev, Alexander (2020): The ACD Classification of Arctic Coasts [dataset]. PANGAEA, https://doi.org/10.1594/PANGAEA.919573

How to cite: Jensen, M. A., Blok, C. N., Rubensdotter, L., and Missana, A.:  The first high-resolution dataset of Arctic coastal landforms and processes for the entire Svalbard archipelago, Western Barents Sea. , EGU General Assembly 2025, Vienna, Austria, 27 Apr–2 May 2025, EGU25-17481, https://doi.org/10.5194/egusphere-egu25-17481, 2025.

EGU25-17669 | ECS | Posters on site | OS2.4

Monitoring beach nourishment evolution using satellite data: the case of Vale do Lobo (Portugal)  

Mariana Neves Silva, Afonso Vaz, Rui Taborda, Ana Nobre Silva, Celso Aleixo Pinto, Jacqueline Santos, Sebastião Teixeira, and Susana Costas

Increasing pressure on the coastal zone, driven by urbanization and related adoption of hard engineering protection structures, has frequently contributed to a gradual amplification of beach erosion. This is the case of Vale do Lobo beach (Algarve, Portugal), where sand retention caused by the Quarteira groin field and Vilamoura jetties led to soft cliff recession and reduction of the beach width downdrift (Teixeira, 2019). To mitigate these effects, an artificial beach nourishment program along with a monitoring plan have been implemented by the predecessor institution of the Portuguese Environment Agency since 1997 (Pinto & Teixeira, 2022), which involves systematic surveys of six beach profiles and has limited spatial scope and temporal resolution. These limitations could be overcome by satellite remote sensing (RS), which has been recognized as an alternative.

We aim to verify whether RS is suitable for measuring changes of beach width after beach nourishment operations, contributing to cost-effective monitoring with greater spatial and temporal coverage. The study was conducted along the Vale do Lobo coastline, focusing on the evolution of the average beach width from February 2000 to February 2024. During this period, the beach evolution was marked by a rapid increase in beach width following two beach nourishments and a gradual narrowing driven by a sediment deficit imposed by the updrift retention structures.

Images from the Landsat 5, 7, 8 and 9 satellites and Sentinel-2 Level 1C were obtained and classified, using the python toolkit CoastSat (Vos et al., 2019), which also made it possible to obtain the shorelines of the beach during the study period. The USGS DSAS (Himmelstoss et al., 2024) software was used to acquire beach width values, at the six profiles surveyed in the monitoring program. Although the relatively low spatial resolution of the images (30m and 10m), and the existing differences between the measured shoreline indicators (beach width at MSL and instantaneous water line in RS, which includes the effects of tide and swash signals), the relatively high temporal resolution of RS images allowed for the filtering of uncertainties. As a result, the time-averaged RS values were found to closely match those obtained from field monitoring. In response to the 2006 nourishment, the beach advanced 29m (33m for RS) followed by a gradual beach width reduction of 5.8m/yr (5.7m/yr for RS), while in the 2010 nourishment the beach advanced 29m (28m for RS) followed by a gradual reduction of 1.8m/yr (1.9m/yr for RS). The comparison between the data obtained showed congruence of field and RS results, proving evidence that remote sensing techniques and semi-automatic methods can be an asset for monitoring beach nourishment evolution. This work is supported by the Portuguese Fundação para a Ciência e Tecnologia, FCT, I.P./MCTES through national funds (PIDDAC): UID/50019/2025, UIDB/50019/2020 (https://doi.org/10.54499/UIDB/50019/2020) and LA/P/0068/2020 (https://doi.org/10.54499/LA/P/0068/2020). The work is a contribution to the CREST project, funded by FCT through Grant 2022.05392.PTDC (doi:10.54499/2022.05392.PTDC). Authors also recognize the support of national funds through FCT, under the project LA/P/0069/2020 (doi:10.54499/LA/P/0069/2020), granted to the Associate Laboratory ARNET, and UID/00350/2020 (doi:10.54499/UIDB/00350/2020) granted to CIMA.

How to cite: Neves Silva, M., Vaz, A., Taborda, R., Nobre Silva, A., Pinto, C. A., Santos, J., Teixeira, S., and Costas, S.: Monitoring beach nourishment evolution using satellite data: the case of Vale do Lobo (Portugal) , EGU General Assembly 2025, Vienna, Austria, 27 Apr–2 May 2025, EGU25-17669, https://doi.org/10.5194/egusphere-egu25-17669, 2025.

EGU25-17681 | ECS | Posters on site | OS2.4

Shoreline evolution of the Gulf of Cadiz through manually digitized and automated extraction methods 

Afonso Vaz, Mariana Neves Silva, Fátima Valverde, Rui Taborda, Ana Nobre Silva, Jacqueline Santos, and Susana Costas

Understanding the spatial and temporal variation of the shoreline position is key to both research and engineering projects contributing to an efficient management of the coast. Accelerated climate change and its related impacts can further destabilize coastal systems, highlighting the need for studies that quantify coastal evolution,  while discussing the application of satellite remote sensing datasets and GIS methods for coastline extraction, mapping, and analysis along regional coasts.

The Gulf of Cadiz is brimming with human intervention and as such has been the target of many studies. The focus of this work covers part of this region, extending from Olhos de Água (Portugal) to the mouth of the Guadalquivir River (Spain) (~180 km). The study area is characterized by a variety of coastal morphological features, including cliffs, beaches, foredunes and inlets. Regardless of its great diversity of landforms, sandy beaches still constitute the dominant coastal environment of this region. We aim to grasp a better understanding of the Cadiz Gulf coastal dynamics through the comparing two shoreline mapping methods and indicators, covering the time span between 2014-2024 for Portugal and 2016-2022 for the Spain coast.  The applied methods include 1) the manual digitation of Wet/Dry Line (WDL) and the Instantaneous Water Line (IWL) indicators within a GIS environment, and 2) the automatized extraction of the IWL using the CoastSat toolkit (Vos et al., 2019). The WDL Marks the darkest edge of the wet area of the beach, while the IWL is the line where the water meets the sand. The manually digitized shoreline was carried out in ArcGIS Pro 3.4.0 over the orthophotomaps obtained from “Direção Geral do Território” (Portugal) and “Instituto Geografico Nacional” (Spain) websites. CoastSat python toolkit (Vos et al., 2019) was used to extract shorelines from open-source satellite imagery (Landsat and Sentinel-2).

Overall, the Gulf of Cadiz has shown average end point rates (EPR) of 1.65 m/yr and 0.6 m/yr for the manually mapped WDL and IWL, respectively. The automated approach yielded a rate of 1.84 m/yr. All the methods show net shoreline accretion, with the results heavily influenced by the significant accretion observed in the downdrift  sector, Matalascañas to Guadalquívir. When all the sectors are analyzed individually it is possible better compare the methodologies, according to all indicators. Comparisons reveal that, in most cases, the automated shorelines align more closely with the manually identified WDL rather than the expected IWL. This discrepancy raises questions about the nature of the indicator detected by the automated tool. The findings suggest that the automated extraction may primarily capture the WDL, highlighting the need for further investigation into the physical significance of indicators identified by automated methods.

This work is supported by the Portuguese Fundação para a Ciência e Tecnologia, FCT, I.P./MCTES through national funds (PIDDAC): UID/50019/2025, UIDB/50019/2020 (https://doi.org/10.54499/UIDB/50019/2020) and LA/P/0068/2020 (https://doi.org/10.54499/LA/P/0068/2020). The work is a contribution to the CREST project, funded by FCT through Grant 2022.05392.PTDC (doi:10.54499/2022.05392.PTDC). Authors also recognize the support of national funds through FCT, under the project LA/P/0069/2020 (doi:10.54499/LA/P/0069/2020), granted to the Associate Laboratory ARNET, and UID/00350/2020 (doi:10.54499/UIDB/00350/2020) granted to CIMA.

How to cite: Vaz, A., Neves Silva, M., Valverde, F., Taborda, R., Nobre Silva, A., Santos, J., and Costas, S.: Shoreline evolution of the Gulf of Cadiz through manually digitized and automated extraction methods, EGU General Assembly 2025, Vienna, Austria, 27 Apr–2 May 2025, EGU25-17681, https://doi.org/10.5194/egusphere-egu25-17681, 2025.

EGU25-19440 | Orals | OS2.4

Impacts of changing climate and changing human activities on coastal wetlands in the Pacific Islands 

Jose Rodriguez, Patricia Saco, and Eliana Jorquera

Coastal wetlands in the Pacific Islands are extremely vulnerable to climate change, due to the combined effect of sea level rise (SLR) and the increasing activity of tropical cyclones (TC). They are also affected by human activities in the catchments, including agriculture and flood management. These wetlands have the capacity to accrete following SLR if they can capture enough sediment, which is determined by catchment processes. Increase TC activity and intensification of agricultural practices will potentially result in increased sediment load from the catchment, while flood control to protect populated coastal areas can reduce sediment loads.

In this contribution, we present a numerical framework to assess future morphodynamic changes in mangrove wetlands combining an ecogeomorphological model of the mangrove wetlands and a hydro-sedimentological catchment model to analyse effects of SLR and increased TC activity under different catchment management scenarios.  We first assess the contribution of TC to the annual sediment budget of the catchment using the hydro-sedimentological model and project increases by the end of the century based on expected increases in TC activity and changes in land use due to increased agricultural and flood control activities. We then run our ecogeomorphological wetland model over 100 years incorporating the changes in sediment supply from the catchments and due to the effects of SLR, TC and human activities.

How to cite: Rodriguez, J., Saco, P., and Jorquera, E.: Impacts of changing climate and changing human activities on coastal wetlands in the Pacific Islands, EGU General Assembly 2025, Vienna, Austria, 27 Apr–2 May 2025, EGU25-19440, https://doi.org/10.5194/egusphere-egu25-19440, 2025.

EGU25-19510 | Posters on site | OS2.4

Circulation patterns in the Adriatic Sea under a severe climate change scenario: projections from the AdriE ensemble. 

Davide Bonaldo, Lucia Bongiorni, Sandro Carniel, Renato Colucci, Cléa Denamiel, Michol Ghezzo, Angelica Pesce, Petra Pranić, Fabio Raicich, Antonio Ricchi, Lorenzo Sangelantoni, Ivica Vilibić, and Maria Letizia Vitelletti

The Adriatic Sea, located in the northeastern Mediterranean basin, is well representative of processes and pressures that typically affect mid-latitude coastal seas.

The Adriatic Ensemble (AdriE), a multi-decadal, kilometre-scale ocean model, has recently been developed to describe ocean processes in the Adriatic Sea under a severe (RCP8.5) climate scenario extending to the end of this century. Addressing 3-D circulation and thermohaline dynamics within the Regional Ocean Modelling System (ROMS), AdriE consists of 6 climatic runs encompassing the period from 1987 to 2100 in a RCP8.5 scenario forced by the SMHI-RCA4 Regional Climate Model, driven by as many different General Climate Models made available within the EURO-CORDEX Initiative. In the present contribution we complement eulerian and lagrangian analysis techniques to investigate how climate change will affect the main hydrodynamic processes in this basin, with particular reference to key features for this area such as dense water production, pollutant transport, and ecological connectivity.

This work lays the foundation for a deeper interdisciplinary assessment of future scenarios in the region and the development of potential management strategies.

How to cite: Bonaldo, D., Bongiorni, L., Carniel, S., Colucci, R., Denamiel, C., Ghezzo, M., Pesce, A., Pranić, P., Raicich, F., Ricchi, A., Sangelantoni, L., Vilibić, I., and Vitelletti, M. L.: Circulation patterns in the Adriatic Sea under a severe climate change scenario: projections from the AdriE ensemble., EGU General Assembly 2025, Vienna, Austria, 27 Apr–2 May 2025, EGU25-19510, https://doi.org/10.5194/egusphere-egu25-19510, 2025.

The N2 fixation and primary production rates were measured simultaneously using 15N2 and 13C incubation assays in the northern South China Sea influenced by the Kuroshio intrusion (KI) seasonally. The degree of KI (KI index, range from 0 to 1) was assessed by applying an isopycnal mixing model. The water column integrated N2 fixation and primary production for stations with KI index larger than 0.5 were 463 ± 260 μmol N·m−2·day−1 and 62 ± 19 mmol C·m−2·day−1, respectively, significantly higher than those for stations with KI index lower than 0.5 (50 ± 10 μmol N·m−2·day−1 and 28 ± 10 mmol C·m−2·day−1, respectively). Trichodesmium was the dominant diazotroph at stations with KI index larger than 0.5, with 2 orders of magnitude higher nifH gene abundance than that at stations with KI index lower than 0.5. However, the highest N2 fixation rates were found in waters with moderate KI index around 0.6, suggesting that frontal zone mixing might stimulate N2 fixation. Our results demonstrated that diazotrophs (mainly Trichodesmium) were tightly associated with the KI, which modulated the biogeographic distribution of N2 fixers. In summary, we found the transportation of Trichodesmium by KI, then, we quantified the fraction of KI and N2 fixation rates in the northern South China Sea. The results suggested that KI generated a new biogeographic regime which could significantly influence the carbon and nitrogen cycles far away from the main stream.

How to cite: Lu, Y.: Biogeography of N2 Fixation Influenced by the Kuroshio Intrusion in the South China Sea, EGU General Assembly 2025, Vienna, Austria, 27 Apr–2 May 2025, EGU25-20220, https://doi.org/10.5194/egusphere-egu25-20220, 2025.

EGU25-20663 | ECS | Orals | OS2.4

Effects of oyster reefs on back-barrier tidal flats on the local hydro- and morphodynamics 

Jan Hitzegrad, Carl Luis König, Aileen Brendel, Oliver Lojek, and Nils Goseberg

In response to the global decline of native bivalve populations, non-native Pacific oysters (Magallana gigas) are increasingly colonizing former habitats of native bivalves. In the Wadden Sea, M. gigas reefs replaced blue mussel beds (Mytilus edulis) as the predominant biogenic structure on the intertidal mudflats. These reefs, covering 2 – 6% of the tidal basin area, attenuate flow energy through frictional dissipation, affecting local hydro- and morphodynamics. Despite their potential to influence intertidal mudflat elevation and function as nature-based coastal protection against sea level rise, the spatio-temporal effects of oyster reef-induced frictional dissipation remain underexplored. This study evaluates the impact of oyster reef expansion in back-barrier tidal flats on hydro- and morphodynamics.

A generic tidal basin model was developed using the Delft3D framework, synthesizing average morphological and sedimentological characteristics of the seven tidal basins sheltered by the German East Frisian islands. The model features a convex-up hypsometry, five sediment fractions (mean grain size of d50,GTB  = 205 μm), and a fixed sediment roughness (Manning coefficient of n = 0.023 m- 1/3s), closely mirroring the input parameters. Oyster reef coverage scenarios were modeled for 2% (current average), 6% (current maximum), and 10% (projected future) of the tidal basin area. Reef roughness was parameterized by applying a drag coefficient CD = 0.025 and roughness length z0 = 7.8 mm. The distribution of oyster reefs within the tidal basin is determined by evaluating potential areas for reef distribution based on abiotic stressors (e.g., aerial exposure time and bed shear stress) and utilizing the Cahn-Hilliard equation to create realistic spatial patterns. A generic neap-spring tidal cycle, developed using the key tidal constituents for sediment transport, was applied at the seaward boundary.

The generic tidal basin and hydrodynamic boundary conditions are utilized to project the impact of oyster reefs on hydro- and morphodynamics. The results reveal substantial impacts of these reefs on hydrodynamic patterns and magnitudes. Furthermore, the oyster reefs cause alterations in sediment transport patterns and the resulting sea-bed level changes. The effects vary across scenarios, highlighting the diverse impacts of these reefs under spatio-temporally varying conditions.

The model presented provides a framework to estimate the biomorphodynamic feedback resulting from the bioinvasion of the Pacific oyster in the Wadden Sea, advancing the understanding of ecohydraulic processes, particularly in relation to sediment transport pathways. The results thus suggest that the presence of oyster reefs may contribute to the vertical growth of the intertidal mudflats of the Wadden Sea, providing a natural countermeasure to accelerating sea level rise.

How to cite: Hitzegrad, J., König, C. L., Brendel, A., Lojek, O., and Goseberg, N.: Effects of oyster reefs on back-barrier tidal flats on the local hydro- and morphodynamics, EGU General Assembly 2025, Vienna, Austria, 27 Apr–2 May 2025, EGU25-20663, https://doi.org/10.5194/egusphere-egu25-20663, 2025.

EGU25-21514 | Orals | OS2.4

Satellite-Derived Shoreline Analysis of the Emilia-Romagna Coast (Italy) from 1984 to 2023 

Enrica Vecchi, Matteo Meli, and Claudia Romagnoli

Understanding shoreline variability and trends over time is essential for effective coastal management. However, studying the dynamic nature of the shoreline, defined as the intersection of water and land surfaces, can be quite complex due to various non-linear processes that operate across different temporal and spatial scales. In this context, the advent of satellite imagery has created new opportunities for long-term shoreline analysis by providing global coverage with high temporal resolution and enabling the acquisition of historical datasets. Typical methodologies using these data sources commonly involve the creation of satellite-derived shorelines (SDS) time series, which offer multidecadal records of variability, trends, and changes with a cross-shore accuracy of approximately 10 m on microtidal beaches.

In this study, SDS positions along the Emilia–Romagna (ER) coast in the northern Adriatic Sea were reconstructed using the CoastSat toolbox, incorporating both Landsat (5–9) and Sentinel–2 images for the entire period from 1984 to 2023. The ER coast is not only a significant tourist destination in Italy, but it is also increasingly exposed to erosion and coastal flooding due to the combined effects of low average heights, subsidence, sea–level rise, and urbanization. Consequently, a large portion of the coastline is artificially protected through various defense strategies, including both defense structures and nourishment measures, and stacked by long piers and jetties. This setting was considered in the analysis since it introduces a main bias in the coastal evolution and in shoreline variability.

A dataset of 2200 cross-shore transects, spaced 50 meters apart, was automatically generated based on the local orientation of the beach, and shoreline positions were reconstructed from the cross-shore distances computed along each transect. In particular, the large number of available instantaneous shorelines was used to compute annually averaged positions. Corrections for tidal and wave setups were applied to reduce the main sources of error in SDS. To achieve this, the average beach face slopes were derived from available topo-bathymetric data by Arpae-ER. Local measurements from tide gauges (TG) in Marina di Ravenna and Porto Garibaldi and from the Nausicaa (I and II) buoys were used to derive the other processing parameters.

The resulting annually averaged shorelines enabled the analysis of long-term shoreline trends from 1984 to 2023, as well as the assessment of interannual shoreline variability. Shoreline advancement during the study period, despite sea-level rise and subsidence, is primarily due to repeated nourishment interventions aimed at preventing coastal erosion, which helped the maintenance of an “artificial stability” along the coastline.

To evaluate the reliability of the generated shoreline products, a technical validation process was conducted. Given the complex interpretation of an annually averaged shoreline position, accuracy was assessed through visual interpretation of the processed shorelines and comparisons with the datasets available for the same period from topo-bathymetric monitoring. The time-averaging strategy in this study provides reliable averaged shoreline positions, minimizing the effects of short-term fluctuations and temporary runup excursions. This highlights the potential of satellite-optical imagery for coastal applications.

How to cite: Vecchi, E., Meli, M., and Romagnoli, C.: Satellite-Derived Shoreline Analysis of the Emilia-Romagna Coast (Italy) from 1984 to 2023, EGU General Assembly 2025, Vienna, Austria, 27 Apr–2 May 2025, EGU25-21514, https://doi.org/10.5194/egusphere-egu25-21514, 2025.

EGU25-148 | Orals | CL3.2.1

A prudent planetary boundary for geological carbon storage 

Matthew Gidden, Siddharth Joshi, John Armitage, Alina-Berenice Christ, Miranda Boettcher, Elina Brutschin, Alex Koberle, Hans Joachim Schellnhuber, Carl-Friedrich Schleussner, Keywan Riahi, and Joeri Rogelj

Storing carbon for centuries to millennia in geological formations will be required if the world is to achieve net-zero CO2 emissions, and an even more critical feature of mitigation strategies if net negative CO2 or net-zero greenhouse gas emissions are to be achieved in order for global mean surface temperature to decline. The technical potential for carbon storage is commonly assumed to be vast, with estimates of available storage of around 10,000-40,000 Gt CO2 in the scientific literature. We reassess that assumption, providing a new spatially explicit estimation of carbon storage potential in sedimentary basins consistent with the principle of harm prevention which can help guide policy makers when updating their climate pledges and stay within safe planetary boundaries. 


We begin with current estimates of sedimentary basin volume and systematically apply a number of prudent, precautionary spatial and volumetric risk exclusions. These include minimum depths of ~1 km to ensure cap rock seal, maximum depths of ~2.5 km to avoid bedrock and limit potential seismic activation of deep rooted faults, areas with more than “moderate” historic seismic activity, environmental protection areas including the polar circles, offshore areas with >300m water depth based on current practices in the oil and gas industry, and built-up areas of human settlement under a high-population future scenario. Combining all of our risk spatial layers, we find that global storage potential declines from 11,314 Gt GO2 to 1,550 Gt CO2 of which 70% is onshore. 


We classify countries into four categories combining their historical contributions to cumulative emissions and their available prudent carbon storage potential. We find that number of countries with strong per-capita contributions to historical emissions also can potentially play a strong role in storing carbon in the future (e.g., USA, Australia, Saudi Arabia) whereas others have a strong responsibility but low storage capacity (e.g., the EU) implying the need to utilize storage outside their borders.


We then compare our prudent storage potential with mitigation pathways assessed by the IPCC. We find that, if carbon storage injection rates were to be held constant at their respective levels at the time of CO2 net-zero, scenarios in line with the 1.5C limit of the Paris Agreement would allow for approximately 250 years of continued storage time, whereas scenarios with a 50% chance of limiting warming to 2C would have approximately 100 years of storage capacity remaining. However, scenarios in general tend to increase their use of storage beyond net-zero CO2 in order to counterbalance continued fossil fuel use or to draw down temperature levels beyond their peak. Extrapolating geologic storage usage forward, we find that nearly all IPCC-assessed scenarios limiting warming to 2C or less would reach our assessed planetary boundary before the year 2200.


Our analysis has broad implications for national mitigation plan development and suggests a need for countries to explicitly state their plans for geologic carbon storage as they develop the next round of their Nationally Determined Contributions.

How to cite: Gidden, M., Joshi, S., Armitage, J., Christ, A.-B., Boettcher, M., Brutschin, E., Koberle, A., Schellnhuber, H. J., Schleussner, C.-F., Riahi, K., and Rogelj, J.: A prudent planetary boundary for geological carbon storage, EGU General Assembly 2025, Vienna, Austria, 27 Apr–2 May 2025, EGU25-148, https://doi.org/10.5194/egusphere-egu25-148, 2025.

EGU25-745 | ECS | Orals | CL3.2.1

Impact of timing differences in achieving emissions targets on global heatwaves 

In-Hong Park and Sang-Wook Yeh

Achieving carbon neutrality is a great challenge, and the pathways to this goal are critical. However, it is still uncertain how the climate system will respond to different pathways for achieving carbon neutrality, including the timing of achieving the goal, whether quickly or slowly. Here, we analyze the mean and extreme climate responses under fast (SSP5-8.5) and slow (SSP1-2.6) achievement of the Paris Agreement target (2.0C), based on a linear relationship between cumulative CO2 emissions and global mean surface temperature. Results from CMIP6 multi-model simulations show a difference of about 20 years between the two scenarios, with insignificant differences in global mean surface warming between the fast scenario (SSP5-8.5) and the slow scenario (SSP1-2.6). However, there are significant regional differences, particularly in land temperature. Furthermore, these differences in achieving timing have also affected the degree of exposure to heat waves, with clear regional differences in heat wave exposure. We will discuss the physical mechanisms involved, as well as the differences in regional climate responses to extremes and averages.

How to cite: Park, I.-H. and Yeh, S.-W.: Impact of timing differences in achieving emissions targets on global heatwaves, EGU General Assembly 2025, Vienna, Austria, 27 Apr–2 May 2025, EGU25-745, https://doi.org/10.5194/egusphere-egu25-745, 2025.

EGU25-4158 | ECS | Orals | CL3.2.1

Unpacking the bottlenecks of deploying Direct Air Capture at scale 

Leonardo Chiani, Pietro Andreoni, Laurent Drouet, Katrin Sievert, Tobias Schmidt, Bjarne Steffen, and Massimo Tavoni

Pathways limiting global warming to well below two degrees presume the transition to low-carbon energy sources and deployment of carbon dioxide removal technologies. Among these technologies, the modeling literature consistently shows the value of direct air capture (DAC) for achieving climate stabilization in the long run. DAC offers unique advantages from a policy perspective: it is modular, less land-intensive than many comparable technologies, and enables straightforward accounting of removed emissions. However, as a novel technology, significant uncertainties remain about the barriers to scaling DAC, especially for what concerns the financial and economic viability of supporting policies and their capacity to develop DAC at scale. In this study, we explore the sensitivity of DAC deployment in an ambitious but realistic mitigation pathway (the long-term strategies committed by all major economies, or LTS) using a detailed-process Integrated Assessment Model, WITCH, across four dimensions of uncertainty: technological characteristics, financing, market requirements, and policy environments. We use recently developed probabilistic estimates to endonegize technological learning in DAC. We focus on the global level and on two time periods, namely 2025-2050, the critical moment for DAC deployment at scale, and 2050-2075, the moment where most of the net-zero goals are set. Using formal methods in statistics and sensitivity analysis, we analyze the amount of removed emissions, the energy and storage consumption, as well as the cost of the policy.

How to cite: Chiani, L., Andreoni, P., Drouet, L., Sievert, K., Schmidt, T., Steffen, B., and Tavoni, M.: Unpacking the bottlenecks of deploying Direct Air Capture at scale, EGU General Assembly 2025, Vienna, Austria, 27 Apr–2 May 2025, EGU25-4158, https://doi.org/10.5194/egusphere-egu25-4158, 2025.

EGU25-4714 | ECS | Posters on site | CL3.2.1

Leveraging Internal Carbon Pricing (ICP) for Financial Institutions: A Framework for Aligning Profitability with decarbonization objectives. 

Iwen Liu, Tsai-Chia Tsai, Chai-Yi Chuang, Jung-Hsuan Tsao, and Hsin Hui You

This study reveals the potential of internal carbon pricing (ICP) as an essential tool for financial institutions to align their profitability goals with carbon reduction targets. The research aims to establish a practical framework for applying ICP in daily financial operations, such as loan approval processes and investment decision-making. By integrating ICP into these activities, institutions can effectively balance environmental sustainability with financial performance while advancing towards carbon reduction targets.

The implementation of ICP involves four key processes:

  • Establishing  internal carbon pricing : Utilizing scenario-based methodologies to calculate ICP by assessing external carbon costs and internal financial risks, providing a basis for carbon-related evaluations.
  • Incorporating ICP into Carbon Management Indicators: Embedding metrics such as absolute emissions, emission intensity, and reduction pathways into operational systems to assess and manage the carbon impact of financial portfolios.
  • Integrating ICP with Financial Metrics: Linking ICP with traditional indicators, such as risk-adjusted return on capital (RORAC), to assess the combined impact of carbon risks and financial returns, creating a comprehensive decision-making framework.
  • Evaluating Transformation Plans: Quantifying the carbon reduction potential and financial implications of long-term business transformation strategies, factoring in projected carbon costs and benefits.

The study demonstrates that ICP can serve as a practical mechanism for financial institutions to incorporate sustainability considerations into core business operations without compromising profitability. By linking carbon pricing to both operational and financial metrics, institutions can enhance their decision-making processes and gain a competitive edge in the transition to a low-carbon economy.


How to cite: Liu, I., Tsai, T.-C., Chuang, C.-Y., Tsao, J.-H., and You, H. H.: Leveraging Internal Carbon Pricing (ICP) for Financial Institutions: A Framework for Aligning Profitability with decarbonization objectives., EGU General Assembly 2025, Vienna, Austria, 27 Apr–2 May 2025, EGU25-4714, https://doi.org/10.5194/egusphere-egu25-4714, 2025.

EGU25-5387 | Orals | CL3.2.1

The role of historic global inequality in avoided climate destabilisation 

Chirag Dhara, Shrutee Jalan, Shoibal Chakravarty, Soumyajit Bhar, and Ashwin Seshadri

In assessing responsibility for climate change, conventional metrics like cumulative and per-capita emissions do not capture the consequences of evolution of affluent lifestyles. Our study introduces a novel framework to assess the global mean surface warming that would have resulted if the historical lifestyles of individual countries had been the norm for the entire global population. We refer to the resultant warming as the carbon footprint temperature, Tcf. We find that universalising the carbon-intensive lifestyles of industrialised countries would have pushed the world beyond the 1.5°C threshold as early as the 1950s in some cases, and by the 2000s for many others, thereby risking significant destabilisation of the Earth's climate system. Our analysis concludes that the modest lifestyles of the global majority have contributed substantially to the experienced planetary stability, offering humanity a dual advantage: averting potential planetary destabilisation and providing a critical window for climate action extending from decades to a century.  Accordingly, we argue that affluent entities with high carbon footprint temperatures ought to have transitioned to low or even negative emissions regimes already instead of consuming the remaining carbon space. Additionally, per capita emissions across the world need to converge to collectively self-determined levels that are well below those of current affluent lifestyles.

How to cite: Dhara, C., Jalan, S., Chakravarty, S., Bhar, S., and Seshadri, A.: The role of historic global inequality in avoided climate destabilisation, EGU General Assembly 2025, Vienna, Austria, 27 Apr–2 May 2025, EGU25-5387, https://doi.org/10.5194/egusphere-egu25-5387, 2025.

EGU25-5835 | ECS | Orals | CL3.2.1

Re-evaluating progress towards climate targets with consistent national carbon budgets 

Konstantin Weber, Cyril Brunner, Giacomo Grassi, and Reto Knutti

Country-level Remaining Carbon Budgets (RCBs) can act as tools for evaluating progress in climate policy under the Paris Agreement. However, current national RCB calculations often lack comparability with National Greenhouse Gas Inventories (NGHGIs), hindering accurate assessment of Nationally Determined Contributions and progress towards emission reduction targets. Here, we developed a NGHGI-compatible methodology for calculating RCBs, revealing a significant decrease in global RCB available for allocation to countries when aligned with NGHGI accounting principles.

Our analysis further demonstrates that over 50 countries have already exceeded their fair share of the 1.5°C-compatible RCB under this NGHGI-compatible framework, when considering responsibility for historical emissions. While developed countries with lower RCBs exhibit greater emission reduction ambitions, their efforts remain minuscule compared to their accrued carbon debt.

This research is particularly relevant in light of the recent European Court of Human Rights (ECHR) ruling in the KlimaSeniorinnen vs Switzerland case, which emphasized the importance of quantifying national GHG emission limitations, including through the establishment of national carbon budgets. We aim to highlight the need for a consistent and NGHGI-compatible approach to evaluate national climate policies and take a step towards aligning national RCB assessments with the realities of national emission reporting for more accurately assessing domestic climate action on a global scale.

How to cite: Weber, K., Brunner, C., Grassi, G., and Knutti, R.: Re-evaluating progress towards climate targets with consistent national carbon budgets, EGU General Assembly 2025, Vienna, Austria, 27 Apr–2 May 2025, EGU25-5835, https://doi.org/10.5194/egusphere-egu25-5835, 2025.

EGU25-6341 | ECS | Orals | CL3.2.1

Potential of Ocean Alkalinity Enhancement in Climate Stabilization scenarios at Different Warming Levels 

Hendrik Grosselindemann, Friedrich A. Burger, and Thomas L. Frölicher

Carbon dioxide removal (CDR) strategies, such as ocean alkalinity enhancement (OAE), are crucial for limiting global warming to below 2°C alongside strong emission reductions. However, the efficiency and temperature mitigation potential of OAE under different stabilization scenarios and on long timescales remain uncertain. This study employs the Adaptive Emissions Reduction Approach within a comprehensive fully coupled Earth System Model to address these gaps. Two sets of five-member ensemble simulations spanning 1861 to 2500 were conducted: (i) stabilization scenarios at 1.5°C, 2°C, and 3°C global warming levels, and (ii) simulations applying idealized and large-scale OAE globally of 0.14Pmol per year at the ocean surface following the CDRMIP-protocol from 2026 onward using the emissions pathways from (i). Our results show that adding alkalinity at the surface lowers surface air temperature by 0.014°C per decade (1.5°C scenario) to 0.018°C per decade (3.0°C scenario). The ocean’s additional carbon uptake per unit of added alkalinity ranges from 0.53 to 0.69, with higher efficiencies in the higher global warming scenarios. However, atmospheric CO2 reduction efficiencies are up to 0.2 lower due to anomalous release of carbon from the land. OAE efficiency remains stable until atmospheric CO2 peaks but declines thereafter, driven by changes in the pCO2 equilibration timescale, which shortens with reductions in buffer capacity before peak CO2, and lengthens during the stabilization phase where buffer capacity increases again as a result of declining atmospheric CO2. These findings highlight the complex dynamics of OAE in response to evolving climate and carbon cycle feedbacks, offering critical insights for the deployment of CDR strategies.

How to cite: Grosselindemann, H., Burger, F. A., and Frölicher, T. L.: Potential of Ocean Alkalinity Enhancement in Climate Stabilization scenarios at Different Warming Levels, EGU General Assembly 2025, Vienna, Austria, 27 Apr–2 May 2025, EGU25-6341, https://doi.org/10.5194/egusphere-egu25-6341, 2025.

EGU25-6848 | ECS | Posters on site | CL3.2.1

Co-benefits of efficient and climate friendly cooling in China 

Pengnan Jiang, Pallav Purohit, Fuli Bai, Xueying Xiang, Ziwei Chen, and Jianxin Hu

The cooling sector plays a pivotal role in the global economy but significantly contributes to global warming. In 2022, cooling-related emissions accounted for 13% of global greenhouse gas (GHG) emissions. China, in particular, played a substantial role in cooling accounting for 10% of its national emissions and consuming 15% of its total electricity. This substantial environmental impact stems largely from the sector's reliance on refrigerants with high Global Warming Potential (GWP) and energy-intensive equipment. The refrigeration and air conditioning sector widely adopted hydrofluorocarbons (HFCs) as replacements for ozone-depleting substances regulated under the Montreal Protocol. However, as potent GHG, HFCs significantly contribute to global warming and are now subject to a global phase-down under the Kigali Amendment to the Montreal Protocol. Improving the energy efficiency of cooling equipment alongside the phasedown of HFCs could potentially double the mitigation benefits of the Kigali Amendment. With the growing demand for cooling in China, it is essential to explore mitigation strategies that simultaneously reduce HFC emissions and enhance energy efficiency. This study evaluates the co-benefits of efficient and climate-friendly cooling solutions in China.

This study adopts a bottom-up approach to integrate the Refrigeration and Air Conditioning - Demand, Emission, and Cost (RAC-DEC) model with Greenhouse Gas and Air Pollution Interactions and Synergies (GAINS) models. The research focuses on four key cooling subsectors: room air conditioning, mobile air conditioning, commercial air conditioning, and cold chain. The analysis is conducted under three scenarios: Business-as-Usual (BAU), reflecting current policies and practices; Kigali Amendment with enhanced energy efficiency of cooling equipment (KAE); and Accelerated Transformational Energy Efficiency (ATE). This study projects medium- and long-term trends in refrigerant and energy consumption, driven by key demand drivers for each subsector. It then quantifies both direct refrigerant emissions following the IPCC inventory methodology and indirect emissions from energy consumption. Finally, it evaluates the combined emission reduction potential under the alternative KAE and ATE scenarios.

The preliminary results indicate that among China's cooling sector, the commercial refrigeration sector offers the highest potential for emission reduction, accounting for approximately 40% of the total cumulative emission reductions from 2023 to 2060. By 2060, China’s cooling sector could achieve cumulative emission reductions of approximately 11.5 Gt CO₂-eq in the KAE scenario and 16.5 Gt CO₂-eq in the ATE scenario. In the KAE scenario, emissions are expected to decline by 48% from 2022 to 2050. In contrast, the ATE scenario predicts a 70% reduction in annual emissions, dropping from 714–721 Mt CO₂-eq in 2022 to 217–218 Mt CO₂-eq by 2050. These significant reductions are primarily driven by the accelerated phase-out of HFC refrigerants, enhanced energy efficiency, and the deep decarbonization of the power system.

This study underscores the critical role of the cooling sector in contributing to global climate goals, including the COP28 Global Cooling Pledge and the Kigali Amendment. By providing a methodological framework, our findings offer essential scientific support for policymakers in China and beyond, facilitating coordinated efforts to actively reduce fluorinated GHGs and enhance energy efficiency within the cooling sector.

How to cite: Jiang, P., Purohit, P., Bai, F., Xiang, X., Chen, Z., and Hu, J.: Co-benefits of efficient and climate friendly cooling in China, EGU General Assembly 2025, Vienna, Austria, 27 Apr–2 May 2025, EGU25-6848, https://doi.org/10.5194/egusphere-egu25-6848, 2025.

Human- and nature-driven disturbances threaten the longevity of land-based carbon removal. However, even carbon that is temporarily stored still reduces global temperatures while said carbon remains stored. This temporary carbon storage can be measured in tonne-years, a metric that measures the time-integrated amount of carbon storage. Previous studies have identified two key findings: 1) that tonne-years of temporary storage are proportional to degree-years of avoided warming, and 2) that degree-years of avoided warming are proportional to climate outcomes that affect inertial components of the climate system, such as thermosteric sea level rise, ocean warming, and permafrost carbon loss. As a result, tonne-years of temporary carbon storage should also be proportional to climate outcomes influencing these inertial climate variables. Using the UVic Earth System Climate Model (UVic-ESCM), we simulate each Shared Socioeconomic Pathway (SSP) scenario, along with nine variations of each representing nine removal pathways with varying magnitudes and durations of carbon removal. Our results demonstrate that tonne-years of carbon storage are proportional to climate outcomes affecting inertial components of the climate system. This proportionality holds across a wide range of peak temperatures and temporary removal pathways, emphasizing that the impact of temporary carbon storage is path independent for some slow-responding climate variables.

How to cite: Dickau, M. and Matthews, H. D.: The proportionality between tonne-years of temporary carbon storage and inertial climate variables , EGU General Assembly 2025, Vienna, Austria, 27 Apr–2 May 2025, EGU25-7422, https://doi.org/10.5194/egusphere-egu25-7422, 2025.

EGU25-8318 | ECS | Orals | CL3.2.1

Combining and scaling up the application of terrestrial and marine CDR methods does not compromise CDR efficiency 

Yiannis Moustakis, Hao-Wei Wey, Tobias Nützel, Andreas Oschlies, and Julia Pongratz

Reaching the Paris Agreement’s 1.5°C climate goal will require the large-scale deployment of Carbon Dioxide Removal (CDR). Relying on single CDR methods, however, risks exceeding sustainability thresholds as compared to CDR portfolios that integrate both land- and marine-based methods. Therefore, Integrated Assessment Models have already started to include diverse CDR portfolios in modelled future pathways. While Earth System Models (ESMs) have been used to explore the climate and carbon cycle feedbacks under the deployment of individual methods, no study has yet examined the co-application of land- and marine-based CDR methods using an ESM.

Here, we use two fully coupled Earth System Models (MPI-ESM and FOCI) to investigate scaling up and/or combining land- and marine-based CDR methods under a high-emissions scenario (SSP3-7.0). Specifically, we examine the whole spectrum of Afforestation/Reforestation (AR) (0-927 Mha) and Ocean Alkalinity Enhancement (OAE) (0-16 Pmol) using a multifactorial setup encompassing seven scenarios and an ensemble of 42 simulations. The AR scenario includes ambitious forestation within the range of country pledges and has been developed based on 1,259 scenarios generated by Integrated Assessment Models, while considering biodiversity constraints and restoration potential maps. The OAE scenario includes the continuous application of alkalinity across ice-free coastline gridcells globally, with up to 16 Pmol applied – an amount sufficient to sequester as much carbon in the ocean as is the sequestration on land in the AR scenario.

Our results suggest that the efficiency of CDR, expressed as the fraction of removed carbon that remains out of the atmosphere, is ~0.85-0.87 for both AR and OAE and is independent of the magnitude of the CDR application. Overall, scaling up and/or combining the two CDR methods results in a linear scaling of carbon flux responses, despite the emerging feedbacks in the Earth system. Specifically, compared to a counterfactual no-CDR scenario, the simulated AR and OAE reduce atmospheric carbon by up to 429 and 503 GtCO2, respectively, and co-applying the two results in a reduction of 856 GtCO2. Halving the application of AR and OAE results in a reduction of atmospheric carbon by 220 and 225 GtCO2 respectively, while their combination yields 443 GtCO2.

Our findings suggest flexibility in designing CDR portfolios, as incorporating both land- and marine-based CDR methods does not compromise one or the other method’s efficiency in the two models applied. This may address sustainability concerns around large-scale deployment of single methods and can alleviate the pressure on the water-food-land nexus.

How to cite: Moustakis, Y., Wey, H.-W., Nützel, T., Oschlies, A., and Pongratz, J.: Combining and scaling up the application of terrestrial and marine CDR methods does not compromise CDR efficiency, EGU General Assembly 2025, Vienna, Austria, 27 Apr–2 May 2025, EGU25-8318, https://doi.org/10.5194/egusphere-egu25-8318, 2025.

EGU25-8791 | Orals | CL3.2.1

Detection and communication of climate changes under net zero emissions 

Andrew King, Tilo Ziehn, Eduardo Alastrué de Asenjo, Nerilie Abram, Amanda Maycock, Alexander Borowiak, Spencer Clark, and Nicola Maher

Under rapid global warming, changes in the climate system are increasingly evident and detectable, even for extremes and at the local scale. This, in part, has motivated countries to target achieving net zero emissions in the coming decades and to limit further global warming in line with the Paris Agreement. Climate changes under net zero emissions are projected to be substantial but may be harder to detect. It is critical that changes under net zero are well understood, both in terms of the effects of delay in emissions cessation and how these changes differ across timescales.

Here, we use a set of net zero 1000-year-long ACCESS-ESM-1.5 simulations to study the detectability of climate changes given a range of emission cessation years. We demonstrate that some local climate changes and changes in climate variability and extremes under net zero emissions may be significant enough to be detectable over human lifetimes. Some large-scale changes, especially in the cryosphere and oceans, and in the Southern Hemisphere, would be detectable within years or decades of emissions cessation. The benefits of earlier emissions cessation are also detectable even at the local scale.

This kind of analysis is not currently possible in a multi-model framework. A lack of planned coordinated net zero experiments on timescales beyond 300 years has the potential to undermine policymaking related to long-term climate changes. Using findings from the ACCESS-ESM-1.5 experiments, we demonstrate the problems that a lack of long net zero emissions simulations poses and call for coordinated 1000-year-long simulations.

We also argue that communication of ongoing climate changes under net zero emissions needs to go beyond projected global-average temperature changes (i.e. the Zero Emissions Commitment or ZEC) and emphasise other Earth System changes and local climate changes.

How to cite: King, A., Ziehn, T., Alastrué de Asenjo, E., Abram, N., Maycock, A., Borowiak, A., Clark, S., and Maher, N.: Detection and communication of climate changes under net zero emissions, EGU General Assembly 2025, Vienna, Austria, 27 Apr–2 May 2025, EGU25-8791, https://doi.org/10.5194/egusphere-egu25-8791, 2025.

EGU25-9028 | ECS | Posters on site | CL3.2.1

Warming versus land-intensive mitigation impact on biodiversity refugia across climate policy scenarios 

Ruben Prütz, Joeri Rogelj, Jeff Price, Rachel Warren, Nicole Forstenhäusler, Yazhen Wu, Andrey Lessa Derci Augustynczik, Michael Wögerer, Tamás Krisztin, Petr Havlík, Florian Kraxner, Stefan Frank, Tomoko Hasegawa, Jonathan Doelman, Vassilis Daioglou, and Sabine Fuss

Background: Biodiversity loss is expected to escalate with every increment of additional global warming. At the same time, land-intensive climate change mitigation strategies, such as afforestation and bioenergy (with or without carbon capture and storage), may further compound biodiversity loss. This duality of drivers of biodiversity loss in the context of climate change raises the question of how these drivers compare in terms of magnitude.

Objective: By combining spatial data on biodiversity refugia with spatial time series data on bioenergy crop plantations and afforestation for multiple scenarios with varying levels of climate action and overshoot, we compare land use-related and warming-related pressure on today’s biodiversity refugia. We evaluate different biodiversity recovery assumptions when returning from a temporary temperature overshoot, compare impacts across climatic zones, and explore differences between three different models, namely, AIM, GCAM, GLOBIOM, and IMAGE.

Preliminary results: We show how scenarios with more ambitious temperature outcomes result in higher potential land pressure on today’s biodiversity refugia areas as more land-intensive mitigation options are implied. Meanwhile, more decisive climate action, including more land-intensive mitigation options, substantially reduces the warming-related loss of today’s biodiversity refugia areas. Based on our analysis, we find that refugia loss due to warming is larger than refugia loss due to land-intensive mitigation if we assume no refugia recovery after peak warming. However, this changes towards the end of this century if we assume that temporarily lost refugia can be recovered and repopulated when returning from a temporary temperature overshoot.

How to cite: Prütz, R., Rogelj, J., Price, J., Warren, R., Forstenhäusler, N., Wu, Y., Derci Augustynczik, A. L., Wögerer, M., Krisztin, T., Havlík, P., Kraxner, F., Frank, S., Hasegawa, T., Doelman, J., Daioglou, V., and Fuss, S.: Warming versus land-intensive mitigation impact on biodiversity refugia across climate policy scenarios, EGU General Assembly 2025, Vienna, Austria, 27 Apr–2 May 2025, EGU25-9028, https://doi.org/10.5194/egusphere-egu25-9028, 2025.

EGU25-10033 | ECS | Orals | CL3.2.1

Likelihoods of European hottest temperatures in net-zero stabilised climates 

Eduardo Alastrué de Asenjo, Andrew King, and Tilo Ziehn

While projections of European heat extremes have been widely explored, only recent efforts address heat extremes specifically in net-zero emissions futures and with a global rather than regional focus. In addition, existing studies extend to net-zero futures spanning a few decades, but new Earth system model simulations point to substantial net-zero emissions changes over multi-centennial timescales. Therefore, we address the knowledge gap on characterising European heat extremes in long-term net-zero stabilised climates. We quantify and attribute yearly hottest temperatures (TXx) in European regions using extended Earth system model simulations with ACCESS-ESM-1.5. Analysing these 1000-year net-zero emissions simulations branched over the coming decades at different times of a transient scenario, we address the long-term effects of delayed mitigation on European heat extremes. After favourably evaluating our model for European hottest days against the ERA5 reanalysis using rank frequency analysis, we compare present-day hottest days to their long-term net-zero future likelihood. Across all European regions, any delay in achieving net-zero emissions shifts the distribution of yearly hottest days towards higher temperatures, and these extreme temperatures remain elevated for centuries. Most European regions show two- to five-fold frequency increases for heat events as strong as currently observed records, while the Mediterranean region could experience more than 30-fold increases for current records. When comparing extreme heat distributions at global mean temperature warming levels from transient periods to levels in early and late stabilised periods, we find warm shifts (about one degree) in transient climates, while colder distributions result from earlier mitigation at higher (3°C) global warming levels. We provide the first assessment of European hottest temperatures in net-zero stabilised climates, paving the way for further investigations of other extreme event types or regions in net-zero long-term timescales.

How to cite: Alastrué de Asenjo, E., King, A., and Ziehn, T.: Likelihoods of European hottest temperatures in net-zero stabilised climates, EGU General Assembly 2025, Vienna, Austria, 27 Apr–2 May 2025, EGU25-10033, https://doi.org/10.5194/egusphere-egu25-10033, 2025.

EGU25-10172 | ECS | Posters on site | CL3.2.1

Advancing Ocean Modelling Tools to Constrain Marine CDR Effectiveness by Testing Air-Sea Equilibration Timescales 

Yinghuan Xie, Paul Spence, Stuart Corney, and Lennart Bach

Most Marine Carbon Dioxide Removal (mCDR) methods rely on creating a deficit in seawater CO₂ concentrations and partial pressure (pCO₂), quantified as a deficit in dissolved inorganic carbon (DIC). This DIC deficit drives atmospheric CO₂ uptake or reduces CO₂ outgassing.

The success of mCDR depends on efficient air-sea CO₂ equilibration before the DIC deficit becomes isolated from the atmosphere through water mass subduction. Since equilibration spans vast ocean regions, in situ measurements are impractical, making numerical modeling essential.

This study utilizes the ACCESS-OM2 model at three resolutions (0.1°, 0.25°, and 1°) to investigate how equilibration timescales vary with resolution, ranging from non-eddying to eddy-rich. Inter-model comparisons with CESM2 and ECCO indicate that model resolution has limited impact in the tropics but a stronger influence in polar regions. Furthermore, intra-model differences (due to resolution) are smaller than inter-model differences.

To improve accessibility, we introduce a computationally inexpensive virtual particle tracking method. This innovative approach offers a low-cost alternative to traditional, HPC-dependent ocean modeling, enabling easier testing of air-sea equilibration timescales, particularly for non-specialists.

These findings advance model-based assessments of air-sea CO₂ equilibration timescales and provide a practical, accessible tool for enhancing mCDR effectiveness.

How to cite: Xie, Y., Spence, P., Corney, S., and Bach, L.: Advancing Ocean Modelling Tools to Constrain Marine CDR Effectiveness by Testing Air-Sea Equilibration Timescales, EGU General Assembly 2025, Vienna, Austria, 27 Apr–2 May 2025, EGU25-10172, https://doi.org/10.5194/egusphere-egu25-10172, 2025.

EGU25-10673 | ECS | Posters on site | CL3.2.1

Earth system climate-carbon response to pulses and continuous negative emissions 

Makcim De Sisto, David Hohn, and Nadine Mengis

Carbon Dioxide Removal (CDR) encompasses a wide range of anthropogenic activities to remove CO2 from the atmosphere to reduce its climate warming effect. The implementation of CDR technologies is necessary to achieve global climate-temperature goals. Commonly, negative emissions effects on the climate and carbon cycle have been thought to be nearly equal but opposite to those of positive emissions. This assumption was challenged recently, with results showing an asymmetric response of the Earth system to positive and negative emissions over a 1000-year timescale (Zickfeld et al. 2021). Positive emissions showed a more potent effect at increasing atmospheric CO2 concentration than negative emissions at reducing it. Yet, positive emissions had a less potent effect at increasing atmospheric temperature than negative emissions at decreasing it. Here we aim to re-evaluate the asymmetric climate-carbon response of the Earth system to negative emissions in a shorter-immediate timescale using an emissions-driven approach. Starting from a preindustrial spin-up the University of Victoria Earth system climate model (version 2.10) was forced with 10 PgC/yr emitted to the atmosphere until the cumulative carbon emission budget reached 1000 PgC (esmflat-10-1000PgC). Thereafter, pulses of positive and negative CO2 emissions ranging from ±50 to ±750 PgC were emitted or removed instantly. To assess the transient climate response to cumulative negative CO2 emissions a -10 PgC/yr was carried. Finally, a zero  emission simulation from pre-industrial served as a control. Our results show agreement with the temperature and carbon asymmetry shown in previous studies. However, we only observed relative large differences with regards to atmospheric temperature and carbon redistribution in the first 40 years of simulations. Later responses (>50 years) show much small differences between the mirrored atmospheric CO2 concentrations and temperatures to negative and positive emissions. The transient climate response to cumulative CO2 emissions and cumulative CO2 removal was found to be 1.81 and -1.79 K/EgC, respectively. These findings suggest that, while temperature asymmetry may remain undetectable in the first century of negative emissions deployment, carbon cycle dynamics could deviate significantly from symmetric assumptions. This highlights the importance of accounting for asymmetric carbon redistribution when designing negative emission strategies.


References:
Zickfeld, K., Azevedo, D., Mathesius, S. et al. Asymmetry in the climate–carbon cycle response to positive and negative CO2 emissions. Nat. Clim. Chang. 11, 613–617 (2021). https://doi.org/10.1038/s41558-021-01061-2

How to cite: De Sisto, M., Hohn, D., and Mengis, N.: Earth system climate-carbon response to pulses and continuous negative emissions, EGU General Assembly 2025, Vienna, Austria, 27 Apr–2 May 2025, EGU25-10673, https://doi.org/10.5194/egusphere-egu25-10673, 2025.

EGU25-10845 | ECS | Posters on site | CL3.2.1

Cost-effective climate benefits through fluorocarbon lifecycle management in China 

Ziwei Chen, Pallav Purohit, Fuli Bai, Thomas Gasser, Yue He, Lena Höglund-Isaksson, Pengnan Jiang, and Jianxin Hu

Achieving global climate goals requires heightened ambition and innovative measures. Banks of hydrochlorofluorocarbons (HCFCs) and hydrofluorocarbons (HFCs), potent non-CO2 greenhouse gases, represent a significant yet untapped mitigation opportunity. Globally, fluorocarbon refrigerant banks are estimated at 24 Gt CO2-eq and continue to grow, forming a massive and expanding reservoir of greenhouse gases that will eventually be released into the atmosphere if left unaddressed. While the Montreal Protocol and its Kigali Amendment regulate the production and consumption of fluorocarbons, emissions from existing stocks remain largely unregulated. Fluorocarbon lifecycle management (FLM) – encompassing leakage prevention, recovery, recycling, reclamation and destruction – presents a viable solution to mitigate these emissions. In China, the world’s largest producer and consumer of HCFCs and HFCs, implementing FLM could unlock substantial mitigation potential beyond current climate action, serving as a critical step toward net-zero goals. This study provides the necessary systematic evaluation to harness this opportunity.

To comprehensively assess the emission profiles of banked fluorocarbons with or without FLM, we developed the Extended Lifecycle Emissions Framework (ELEF), a refined emission modeling approach rooted in IPCC methodologies. ELEF expands conventional frameworks to cover both direct and indirect emissions across the entire lifecycle of fluorocarbons in equipment/product. A bottom-up cost analysis, adapted from the widely applied Greenhouse gas and Air pollution Interactions and Synergies (GAINS) framework to capture sector- and substance-specific treatment nuances, was conducted to assess the cost-effectiveness of FLM in China. Leveraging detailed activity data and localized emission factors, we reconstructed the country’s fluorocarbon banks and emissions from 2000 and projected them through 2060. Mitigation potential was then quantified across varying ambition levels defined by abatement cost cap, with climate impacts assessed using impulse response functions (IRFs) that incorporate climate-carbon feedback.

Our results reveal that China currently holds 3.6 ± 0.1 Gt CO2-eq of fluorocarbon banks, which are projected to peak at 4.5 ± 0.1 Gt CO2-eq by 2034. If unmanaged, emissions from these banks could contribute an additional 0.014℃ to global warming by mid-century. FLM, however, could prevent up to 8.0 Gt CO2-eq of cumulative emissions by 2060, reducing the peak temperature increase contribution by 62.4%. Notably, 57 out of 76 mitigation options analyzed exhibit average abatement costs below 10 USD/t CO2-eq, enabling 93.2% of the maximum mitigation potential at a total cost of 18.9 billion USD. These cost-effective measures could deliver additional mitigation equivalent to over 50% of the 13 Gt CO2-eq reductions pledged under the Kigali Amendment in China, or reduce the surface warming contribution of global HFC emissions in 2050 by more than 10%.

This study introduces a robust framework for assessing the costs and benefits of FLM. By applying it to China, we demonstrate the significant mitigation scale and feasibility of national-level implementation. Our findings highlight the substantial and cost-effective climate benefits achievable through FLM, offering policymakers an actionable pathway to bridge the emission gap and echoing recent international calls for immediate action.

How to cite: Chen, Z., Purohit, P., Bai, F., Gasser, T., He, Y., Höglund-Isaksson, L., Jiang, P., and Hu, J.: Cost-effective climate benefits through fluorocarbon lifecycle management in China, EGU General Assembly 2025, Vienna, Austria, 27 Apr–2 May 2025, EGU25-10845, https://doi.org/10.5194/egusphere-egu25-10845, 2025.

EGU25-11441 * | Orals | CL3.2.1 | Highlight

Updated IPCC emissions scenarios no longer limit warming to 1.5°C 

Chris Smith, Benjamin Sanderson, and Marit Sandstad

Ongoing failure to reduce anthropogenic greenhouse gas emissions rates has fuelled debate within scientific, policy and public discourses on whether the 1.5°C high-ambition Paris Agreement goal remains within reach. The Working Group III (WG3) contribution of the Sixth Assessment of the Intergovernmental Panel on Climate Change (IPCC) report provided global mean temperature projections from 1202 integrated assessment model derived emissions pathways. Of these, 97 were deemed to be consistent with the 1.5°C Paris goal, interpreted as limiting warming to 1.5°C with no or limited overshoot. Of these 87 temporarily overshoot 1.5°C and 10 scenarios remained below 1.5°C throughout the 21st century. 

However, the IPCC mitigation scenarios are rapidly becoming out of date, as most scenarios depend on rapid greenhouse gas emissions reductions after 2020 which have not occurred in reality. Furthermore, scenario warming outcomes were assessed using simple climate models calibrated in the 2010s, excluding recent observations and advances in understanding. When IPCC emissions scenarios are reharmonized to take into account recent emissions, and simple climate model calibrations are updated to incorporate recent observational constraints, no scenario in the IPCC WG3 database avoids overshooting 1.5°C, and only a handful of scenarios remain consistent with the IPCC definition of a low overshoot. This implies that the window for limiting warming to 1.5°C without overshoot has now closed.

How to cite: Smith, C., Sanderson, B., and Sandstad, M.: Updated IPCC emissions scenarios no longer limit warming to 1.5°C, EGU General Assembly 2025, Vienna, Austria, 27 Apr–2 May 2025, EGU25-11441, https://doi.org/10.5194/egusphere-egu25-11441, 2025.

EGU25-14557 | Orals | CL3.2.1

Quantifying the transient climate response to carbon dioxide removal 

Kirsten Zickfeld, Rachel Chimuka, and Sabine Mathesius

As anthropogenic greenhouse emissions continue to rise, limiting warming to 1.5°C has become elusive. Emissions pathways seeking to return to 1.5°C after overshoot will therefore require net negative emissions. A crucial question in this context is how much CO2 needs to be removed from the atmosphere to achieve a given amount of cooling (say 0.1°C). Studies seeking to answer this question often resort to the Transient Climate Response to Emissions (TCRE), a measure of the warming effect of cumulative CO2 emissions, neglecting that the climate may respond asymmetrically to CO2 emissions and removals. This contribution draws on CDRMIP pulse CO2 removal simulations to quantify the temperature response to CO2 emissions and removals in a range of Earth system models of full and intermediate complexity. We find that the temperature response to an equivalent amount of CO2 emissions and removals differs in magnitude, with the sign of this difference being model dependent. We investigate the cause for these inter-model differences by quantifying the contribution of carbon cycle and physical climate response differences to the overall temperature asymmetry. Establishing a robust metric of the transient climate response to CO2 removal is key to our understanding of how climate will respond to net negative emissions and to quantifying the amount of removal needed to restore a given temperature target.

How to cite: Zickfeld, K., Chimuka, R., and Mathesius, S.: Quantifying the transient climate response to carbon dioxide removal, EGU General Assembly 2025, Vienna, Austria, 27 Apr–2 May 2025, EGU25-14557, https://doi.org/10.5194/egusphere-egu25-14557, 2025.

EGU25-15423 | Posters on site | CL3.2.1

Critical freshwater requirements for meeting the Paris Agreement 

Lan Wang-Erlandsson, Fabian Stenzel, Dieter Gerten, Lauren Seaby Andersen, Miina Porkka, Lars Wiersma, Malin Lundberg Ingemarsson, and Johan Rockström

Intact land and freshwater ecosystems are a prerequisite for limiting global warming in accordance with the Paris Agreement. However, the critical co-dependence of climate mitigation outcomes and freshwater dynamics tends to be neglected in both research and policies. Here, we suggest a framework for systematically quantifying the indispensable freshwater requirements for mitigation measures, focused on natural and managed terrestrial systems upholding the land carbon sink. We assert that while huge freshwater volumes are involved in this biospheric service per se, a substantial fraction of these volumes and their spatial connectivity need to remain inside a certain variability corridor in order to maintain the current mitigation potential and to enable measures creating further ‘negative emissions’. Moreover, we highlight that the freshwater volumes and flows required are limited both by the equally substantial water requirements for other societal goals such as food security and by the potential resilience loss due to aggravating impacts of ongoing climate change. In view of high uncertainties and knowledge gaps regarding the underlying processes and feedbacks, coordinated inter- and transdisciplinary research is needed to comprehensively assess global freshwater flows and uses with explicit consideration of water-resilient climate mitigation.

How to cite: Wang-Erlandsson, L., Stenzel, F., Gerten, D., Seaby Andersen, L., Porkka, M., Wiersma, L., Lundberg Ingemarsson, M., and Rockström, J.: Critical freshwater requirements for meeting the Paris Agreement, EGU General Assembly 2025, Vienna, Austria, 27 Apr–2 May 2025, EGU25-15423, https://doi.org/10.5194/egusphere-egu25-15423, 2025.

EGU25-15467 | ECS | Orals | CL3.2.1

Asymmetry in Regional Land Carbon Cycle Feedbacks under CO2 Emissions and Removals 

Rachel Chimuka and Kirsten Zickfeld

Carbon cycle feedbacks regulate the CO2 concentration in the atmosphere, with higher atmospheric CO2 levels resulting in increased uptake, and higher temperatures resulting in reduced CO2 uptake globally. Under positive emissions, the magnitude and sign of these feedbacks vary regionally. Achieving the Paris climate goals requires the use of carbon dioxide removal to reach net-zero, then enter a net-negative emissions phase, where CO2 removal exceeds CO2 emissions. The magnitude of global carbon cycle feedbacks is expected to differ under emissions and removals due to nonlinearities and state dependence of the climate-carbon cycle response. However, the magnitude of this difference (asymmetry) is poorly understood, both globally and on a regional scale. This study uses an Earth system model to investigate the regional asymmetry in land carbon cycle feedbacks under CO2 emissions and removals. To this end, two symmetric concentration-driven simulations are initialized from a state at equilibrium with twice the preindustrial CO2 concentration, with CO2 concentration increasing by 280 ppm in the “emissions” run and decreasing by an equivalent amount in the “removals” run. Each simulation is run in fully coupled, biogeochemically coupled and radiatively coupled modes to allow separate quantification of carbon cycle feedbacks. We use the Boer & Arora (2010) framework, which utilizes a carbon budget equation to compute local contributions to the global carbon cycle feedbacks, then compare these contributions under emissions and removals to determine their asymmetry. Understanding regional asymmetry in land carbon cycle feedbacks is key for determining regions likely to play a significant role in enhancing or counteracting carbon dioxide removal efforts.

How to cite: Chimuka, R. and Zickfeld, K.: Asymmetry in Regional Land Carbon Cycle Feedbacks under CO2 Emissions and Removals, EGU General Assembly 2025, Vienna, Austria, 27 Apr–2 May 2025, EGU25-15467, https://doi.org/10.5194/egusphere-egu25-15467, 2025.

EGU25-16915 | Orals | CL3.2.1

Assessing Earth system feedbacks in deep mitigation scenarios with activity-driven simulation of carbon dioxide removal 

Jörg Schwinger, Leon Merfort, Nico Bauer, Raffaele Bernardello, Momme Butenschön, Timothée Bourgeois, Umar Farooq, Matthew Gidden, Shraddha Gupta, Hanna Lee, Nadine Mengis, Yiannis Moustakis, Lars Nieradzik, Daniele Peano, Julia Pongratz, Pascal Sauer, Etienne Tourigny, and David Wårlind

Assessing Earth system feedbacks arising from carbon dioxide removal (CDR) requires developing and simulating pairs of scenarios - a mitigation scenario with deployment of CDR and a corresponding no-CDR baseline. Both scenarios respect a specific long-term constraint on a carbon emission budget (i.e. emission reductions are pursued at the same level of ambition), but the latter describes a world where no CDR is deployed, such that net carbon emissions are larger and a given temperature threshold is missed. While over the past years a rich literature on deep mitigation scenarios with CDR has been emerging, the need for such no-CDR baselines has never been articulated explicitly. In idealized Earth system model (ESM) simulations of CDR, a no-CDR baseline is easy to imagine and implement, since socio-economic constraints are typically not taken into account. However, the deployment of CDR in deep mitigation scenarios, created by integrated assessment models (IAMs), is embedded in a consistent socio-economic description of plausible futures, and disallowing CDR may change many aspects of such scenarios, for example, the energy-system and land-use. Particularly, when moving towards an “activity-driven” representation of CDR in ESMs, where the activity that leads to a drawdown of CO2 is explicitly modelled (rather than prescribed by using removal fluxes from the IAM simulation), the creation of no-CDR baselines comes with challenges. Here, we conceptualize how carbon cycle and biophysical feedbacks of CDR deployment can be determined from scenario simulations and corresponding no-CDR baselines. We show that different options exist for the creation of no-CDR baselines, which offer different insights and have their specific advantages and limitations. We argue that for certain applications (e.g., the determination of regional biophysical feedbacks) the use of idealized no-CDR baselines is unavoidable to some extent, implying that we have to accept some degree of socio-economic inconsistency in no-CDR baselines.

How to cite: Schwinger, J., Merfort, L., Bauer, N., Bernardello, R., Butenschön, M., Bourgeois, T., Farooq, U., Gidden, M., Gupta, S., Lee, H., Mengis, N., Moustakis, Y., Nieradzik, L., Peano, D., Pongratz, J., Sauer, P., Tourigny, E., and Wårlind, D.: Assessing Earth system feedbacks in deep mitigation scenarios with activity-driven simulation of carbon dioxide removal, EGU General Assembly 2025, Vienna, Austria, 27 Apr–2 May 2025, EGU25-16915, https://doi.org/10.5194/egusphere-egu25-16915, 2025.

To achieve the goals of the Paris Agreement requires deep and rapid reductions in anthropogenic CO2 emissions, but uncertainty surrounds the magnitude and depth of reductions. Using the concept of TCRE—the transient climate response to cumulative carbon emissions—we can estimate the remaining carbon budget to achieve 1.5 or 2 °C. But the uncertainty is large, and this hinders the usefulness of the concept.

We are also entering an era where some of the regular metrics to monitor climate and carbon cycle change are changing if/when emissions stop increasing, begin to decline and may one day reach net zero or even globally net negative. The past behaviour of the global carbon cycle has seen a remarkably constant fraction (the airborne fraction) of CO2 emissions remain in the atmosphere each year – approximately half. But how will the Earth system behave under a new regime of decreasing and negative emissions? And is the TCRE relationship reversible – does the same gradient hold for negative emissions? We also need to understand the sequence of events which will be visible and detectable in observations of the carbon cycle if/when we achieve net zero.

Here we explore uncertainty in carbon budgets associated with a given global temperature rise as determined by the physical feedbacks in the Earth system and also by the carbon cycle response to elevated temperatures and CO2 levels.  Earth system models provide a means to quantify the link from emissions to global climate change, and here we explore multi-model carbon cycle simulations across three generations of Earth system models to quantitatively assess the sources of uncertainty which propagate through to TCRE.

We examine the sequence of changes in observational metrics such as the airborne fraction and sink rate and the eventual reversal of land and ocean carbon sinks as CO2 levels decline. Quantitative understanding of this sequence is vital as we enter an era where the qualitative behaviour of the climate-carbon cycle system may be fundamentally different.

How to cite: Jones, C. and Friedlingstein, P.: Quantifying process-level uncertainty contributions to TCRE and carbon budgets for meeting Paris Agreement climate targets, EGU General Assembly 2025, Vienna, Austria, 27 Apr–2 May 2025, EGU25-17298, https://doi.org/10.5194/egusphere-egu25-17298, 2025.

Exceeding atmospheric CO2 concentration of 350ppm for extended periods risks triggering climate tipping cascades, including permafrost thaw, ice sheet collapse, and ecosystem diebacks (Armstrong McKay et al., 2022). To prevent these irreversible changes, it is crucial to urgently bind at least 400 Gt of carbon from the atmosphere (Desing, 2022). Capturing CO2 and disposing it in the Earth’s crust under pressure carries uncertainties regarding long-term storage stability and potential leakage back into the atmosphere (Vica et al., 2018). Additionally, such methods lack economic incentives. Therefore, capturing CO2 and processing it into more stable carbon-dense solid materials that can be used in industrial applications offers both a solution to prevent leakage and an economic incentive.

Mining the Atmosphere (MtA) technologies provide a pathway to achieve this by capturing CO2 and converting it into high-value, long-term carbon-based products (Lura et al., 2025). To assess the scalability and sustainability of such processes, we develop a comprehensive model to optimize CO2 capture and conversion to minimize minimising grey and operational energy demand. We exemplify the approach on conversion to methane, and methane pyrolysis, with the resulting graphite bound in concrete. The model incorporates temporal and spatial differences in solar energy availability as well as local demand for C-based products. Two key scenarios are explored: in the first, MtA process are localized to meet local demand, operating when excess renewable energy is available. In the second, CO2 capture and methanation occur in solar-rich regions (e.g., deserts), with methane transported to solar-constrained regions (e.g., high latitude areas) for pyrolysis to provide carbon for concrete and hydrogen for energy supply.

By integrating material and energy dynamics, our model provides actionable insights for scaling MtA technologies to capture and store CO2 at multiple Gt/a scale. This aligns with planetary boundaries, minimizes the risk of tipping cascades, and enables long-term, economic-incentivised, decentralized carbon storage. Our work highlights MtA as a vital strategy to mitigate climate change and transition towards a carbon-neutral socio-economic metabolism.

Armstrong McKay, D.I., Staal, A., Abrams, J.F., Winkelmann, R., Sakschewski, B., Loriani, S., Fetzer, I., Cornell, S.E., Rockstrom, J., Lenton, T.M., 2022. Exceeding 1.5 degrees C global warming could trigger multiple climate tipping points. Science 377 (6611), eabn7950. https://doi.org/10.1126/science.abn7950.

Desing, H., Widmer, R., 2022. How much energy storage can we afford? On the need for a sunflower society, aligning demand with renewable supply. Biophys. Econ. Sust. 7 (3), 3. https://doi.org/10.1007/s41247-022-00097-y.

Lura, P., Lunati, I., Desing, H., Heuberger, M., Bach, C., & Richner, P. 2025. Mining the atmosphere: A concrete solution to global warming. Resour. Conserv. Recycl. 212, 107968-. https://doi.org/10.1016/j.resconrec.2024.107968

Vinca, A., Emmerling, J., Tavoni, M., 2018. Bearing the cost of stored carbon leakage. Front. Energy Res. 6. https://doi.org/10.3389/fenrg.2018.00040.

How to cite: Vingerhoets, R. and Desing, H.: A spatiotemporal modelling framework for Mining the Atmosphere: a scalable pathway to mitigate climate change, EGU General Assembly 2025, Vienna, Austria, 27 Apr–2 May 2025, EGU25-18437, https://doi.org/10.5194/egusphere-egu25-18437, 2025.

EGU25-19617 | ECS | Posters on site | CL3.2.1

Scaling Carbon Dioxide Removal in Germany: Insights from the CDRterra Framework and Scenario 

Felix Havermann, Tabea Dorndorf, Antonia Holland-Cunz, Yiannis Moustakis, Jessica Strefler, Kristine Karstens, Tobias Haas, Hao-wei Wey, Felix Schenuit, Lisa Voigt, Christian Baatz, Elmar Kriegler, Andreas Oschlies, and Julia Pongratz

To achieve the goals of the Paris Agreement, the European Union and Germany have committed to achieving net-zero greenhouse gas emissions by 2050 and 2045, respectively. This requires not only drastically reducing emissions but also scaling up Carbon Dioxide Removal (CDR) deployment and infrastructure. Large-scale implementation of CDR involves challenges related to feasibility (technological viability, resource availability, legal compliance, political feasibility) and fairness (inclusive decision-making, transparent communication), while the CDR deployment impacts individuals, society, the environment, and the ratio and distribution of these impacts. To enable legitimate, fair, and widely supported decision-making on the scaling-up process, a comprehensive framework is needed that compares CDR measures and additionally evaluates their trade-offs with other sustainability goals, necessitating transparent assessments of both, implementation processes and outcomes.

Existing assessments of CDR either analyze CDR methods or portfolios without considering the socio-economic context or focus on future scenarios that only cover a small set of CDR methods due to missing method implementation in the models. To address these gaps, we developed the CDRterra assessment framework (AF) and an ambitious, plausible future CDR scenario for Germany to which the AF is applied to. All works are part of the interdisciplinary CDRterra research program involving around 100 researchers who contributed to workshops, including stakeholder groups and colleagues from the partner program CDRmare to design the scenario and develop the AF.

The scenario is based on the SSP2 aligned with Germany's climate policies and combines cost-optimization and agent-based models, ex-post assumptions, and bottom-up calculations. It considers land, biomass, energy, and CO₂ transport and storage capacities in Germany to derive consistent deployment targets for nine CDR methods: afforestation/reforestation and forest management, agroforestry, cover cropping, BECCS, DACCS, PyCCS, enhanced rock weathering, artificial photosynthesis, and CO₂-negative building materials. Results indicate potential annual removal of 1-40 MtCO₂ per method by 2045.

We applied the CDRterra AF to the CDR measures of this scenario for the years 2030, 2045, and 2060, and evaluate both, the process and impact of such a large-scale CDR implementation which is embedded in a future socio-economic context, described by e.g., energy and biomass demand and supply, economic growth, and societal behavior. The data to fill the AF was generated by the research process within CDRterra. The structure of the AF itself builds on existing frameworks (esp. IPCC and German-specific assessment frameworks) but introduces key innovations: a clear distinction between feasibility and desirability, and between descriptive information and its normative assessment. The descriptive level is based on a data base of 120 variables, informing 90 indicators. The indicators are evaluated according to the 18 assessment criteria linked to societal norms, policy goals, and ethical considerations.

By applying the CDRterra AF to the German CDRterra scenario, we evaluated large-scale CDR implementation and identified key risks, benefits, barriers, and leverage points for each CDR method. This analysis provides a transparent knowledge base to inform societal debates and support evidence-based climate policy decisions on CDR deployment.

How to cite: Havermann, F., Dorndorf, T., Holland-Cunz, A., Moustakis, Y., Strefler, J., Karstens, K., Haas, T., Wey, H., Schenuit, F., Voigt, L., Baatz, C., Kriegler, E., Oschlies, A., and Pongratz, J.: Scaling Carbon Dioxide Removal in Germany: Insights from the CDRterra Framework and Scenario, EGU General Assembly 2025, Vienna, Austria, 27 Apr–2 May 2025, EGU25-19617, https://doi.org/10.5194/egusphere-egu25-19617, 2025.

99% of current anthropogenic carbon dioxide removals (CDR) happen on land, and land-based CDR such as re/afforestation or bioenergy with carbon capture and storage (BECCS) will likely play important roles on our way to net-zero/net-negative emissions while more novel methods need to be scaled up. However, the partly large estimates of the potentials of land-based CDR require a reality check, as obstacles to their implementation and non-negligible side-effects on society and ecosystems have not been comprehensively considered so far. Here, we present key results from an interdisciplinary project that scrutinized the feasibility of land-based CDR potentials at the national level of Germany and at global level applying a holistic approach to socio-ecological constraints.

Investigating the potentials for land-based CDR in Germany under different socio-economic scenarios shows that even optimistic scenarios that include extensive economic, lifestyle and dietary changes fall short of meeting both food demands and CDR requirements in line with the national LULUCF sector target. To implement CDR on a relevant scale, extensive land management and land use transitions in particular through afforestation of agricultural land are required. However, interviews with relevant stakeholders reveal diverse and extensive barriers in this regard, such as land use conflicts, changes to the landscape, knowledge gaps, limited human and financial resources and legal restrictions. Uncertainty about the political and economic future are also major obstacles, as afforestation needs a considerable investment of time before leading to economic viability. This highlights the need to assess not only the feasibility of CDR measures, but also their desirability.

Limited CDR potentials at national level draw the attention to compensating residual emissions through CDR in other parts of the world. However, CDR faces different but similarly severe constraints on global level: We not only find global land-use scenarios to be conflicting with key biodiversity areas, but [1]  implementation and persistence of land-based CDR faces severe challenges by a range of socioeconomic limitations, particularly in the Global South. We find that economic and technological factors such as poverty, costs, and infrastructures are the primary constraints for successful re/afforestation across the globe, with institutional factors also being important. This provides insights into key levers for up-scaling CDR.

When comparing land-based CDR methods, as needed to inform the design of CDR portfolios, we find a lack of consistent specification of assumptions and targets in the literature. We find that the efficiency of BECCS and its advantages over conventional methods like forest-based CDR in terms of carbon storage depends strongly on the timing not just of its implementation, but even more on the world’s capacities to deliver efficient CCS. On short term, we find that re/afforestation is the more efficient CDR method across a range of vegetation models. For a complete picture, we propose to compare CDR efficiency in terms of several measures: area required, time needed to break even, and the levels of CCS and fossil-fuel substitution. Future studies should deliver explicit information on the assumed CCS and fossil-fuel substitution, which proved a major source of sensitivity of CDR estimates.

How to cite: Pongratz, J. and the STEPSEC Team: Scrutinizing the feasibility of land-based CDR potentials under socio-ecological constraints , EGU General Assembly 2025, Vienna, Austria, 27 Apr–2 May 2025, EGU25-19740, https://doi.org/10.5194/egusphere-egu25-19740, 2025.

EGU25-19796 | ECS | Posters on site | CL3.2.1

Socioeconomic determinants of re/afforestation efforts 

Wenkai Bao, Wolfgang Obermeier, Yiannis Moustakis, Matthias Garschagen, and Julia Pongratz

Meeting the Paris Agreements’ climate target will require the large-scale deployment of Carbon Dioxide Removal (CDR) methods. Afforestation/reforestation (A/R) has been widely practiced and constitutes virtually all of CDR applied so far. However, implementing large scale A/R strongly depends on biophysical conditions and socioeconomic contexts defining the likelihood for implementation as well as maintenance of an A/R project. To date, biophysical enabling and constraining conditions have been extensively investigated, but studies on socioeconomic determinants remain largely confined to local scales and are primarily in the forms of qualitative evaluations. Hence, we lack a unified global understanding of socio-economic factors that have determined A/R success so far, despite the large potential of drawing on the growing database of global spatially explicit socioeconomic dimensions for a more comprehensive assessment. Here, we use machine learning to leverage multiple data streams and to explore why some countries succeed in A/R efforts while others fall short. We show that a country is likely to achieve better A/R outcomes (both in terms of absolute area and ratio of planted forest) when it has lower poverty rate, lower relative implementation cost and lower food insecurity, as well as strong institutions, adequate infrastructure and social acceptance of A/R. Economic factors (poverty, food security, implementation cost, forest road and workforce) play a key role in predicting A/R outcomes (accounting for ~70% of the relative importance), and institutional factors (governance and land tenure) contribute around 20%, while social factors (social acceptance and land use decision making) contribute only marginally (~10% ). Our  analysis revealed that a considerable number of countries–particularly in tropical regions–have significant potential but simultaneously face multiple socioeconomic constraints to upscaling implementation and maintaining the carbon sink. Our findings suggest that the A/R-based CDR potential could be overestimated when such socioeconomic barriers are not considered. This is likely the case in future scenarios generated by Integrated Assessment Models, as they typically do not explicitly consider many social, institutional and ethics-related factors. Our results suggest key entry points for effective mitigation policy that alleviates socioeconomic barriers, in particular via fighting poverty. Our study complements the extensive literature base on biophysical constraints to CDR by a unique compilation of the existing global datasets on socioeconomic determinants. This provides a vastly expanded basis of factors that can be considered when assessing the implementation likelihood and permanence of A/R and can guide the design of pathways that not only operate within safe socioeconomic boundaries, but also realizes the biophysical potential of CO2 removal.

How to cite: Bao, W., Obermeier, W., Moustakis, Y., Garschagen, M., and Pongratz, J.: Socioeconomic determinants of re/afforestation efforts, EGU General Assembly 2025, Vienna, Austria, 27 Apr–2 May 2025, EGU25-19796, https://doi.org/10.5194/egusphere-egu25-19796, 2025.

EGU25-20630 | Orals | CL3.2.1

Cooling after net zero 

Nathaniel Tarshish, Nadir Jeevanjee, and Inez Fung

Climate policy aims to limit global warming by achieving net-zero greenhouse gas emissions. Climate models indicate that achieving net-zero emissions yields a nearly constant global temperature over the following decades. However, whether temperatures remain stable in the centuries after net-zero emissions is uncertain, as models produce conflicting results. Here, we explain how this disagreement arises from differing estimates of two key climate metrics, governing the carbon system’s disequilibrium and the ocean’s thermodynamics, respectively. By constraining these metrics using multiple lines of evidence, we demonstratewith greater than 95% confidencethat global temperature anomalies decline after net-zero. In the centuries that follow net-zero, the global-mean temperature anomaly is projected to decrease by 40% (median estimate). Consequently, achieving net-zero emissions very likely halts further temperature rise, even on multi-century timescales.

How to cite: Tarshish, N., Jeevanjee, N., and Fung, I.: Cooling after net zero, EGU General Assembly 2025, Vienna, Austria, 27 Apr–2 May 2025, EGU25-20630, https://doi.org/10.5194/egusphere-egu25-20630, 2025.

Carbon budgets are quantifications of the total amount of carbon dioxide that can ever be emitted while keeping global warming below specific temperature limits. They are widely used to interpret and inform climate change mitigation actions, be it by countries or corporates. Estimates of these budgets for limiting warming to 1.5 °C and well-below 2 °C include assumptions about how much warming can be expected from non-CO2 emissions. These assumptions, however, are often poorly understood by users of carbon budget information. In this study, we clarify the non-CO2 emissions assumptions that underlie the remaining carbon budget estimates by the Intergovernmental Panel on Climate Change and quantify the implication of the world pursuing alternative higher or lower non-CO2 emissions trajectories. We consider contributions of methane, nitrous oxide, fluorinated gases, and aerosols and show how pursuing inadequate methane emission reductions causes remaining carbon budgets compatible with the Paris Agreement temperature limits to be exhausted today. A decision not to reduce non-CO2 emissions hence effectively puts the achievement of the Paris Agreement out of reach.

How to cite: Rogelj, J. and Lamboll, R. D.: The carbon budget might be smaller than you think: non-CO2 contributions to the quantification of remaining carbon budgets in line with the Paris Agreement, EGU General Assembly 2025, Vienna, Austria, 27 Apr–2 May 2025, EGU25-21101, https://doi.org/10.5194/egusphere-egu25-21101, 2025.

EGU25-1694 | ECS | Orals | SSS9.12

Mulching improves soil-plant water status and yield in experimental drought conditions 

Jeroen Schreel, Rémy Willemet, Guillaume Blanchy, Waldo Deroo, Sarah Garré, Peter Lootens, Isabel Roldán-Ruiz, Maarten De Boever, and Tom De Swaef

Climate change-driven drought events are becoming increasingly common across Europe. These events can dramatically affect crop production, leading to significant yield losses and an overall deterioration of yield quality. Furthermore, irrigation is often not possible or allowed during long drought periods due to water scarcity. This problem requires crop management adaptations that provide more stable yields during challenging environmental conditions. To this end, organic mulch materials are being used as an agroecological solution. However, the effects of this management practice are not always straightforward, which has led to contradictory observations regarding their effect on crop yield. Here, we investigate the effect of applying an organic grass-clover mulch layer on the soil-water relations of celery (Apium graveolens Tango L.) during an extreme drought event. A full-factorial setup was used with (i) plants growing on a rainfed field with supplementary irrigation and plants subjected to drought using a movable rainout shelter and (ii) soil with and without organic mulch. Based on soil moisture and soil water potential sensors, and below-ground ERT (Electrical Resistivity Tomography) measurements, it was observed that the soil below mulched areas maintained a higher soil water content for a longer period of time compared to the soil in areas without mulch. Plant growth was monitored over time by combining manual measurements and drone data. Plants subjected to drought with mulch were significantly larger compared to plants without mulch, resulting in yields comparable to rainfed fields without mulch. Furthermore, the stomatal conductance and leaf water content of plants in mulched fields tended to be higher compared to plants in fields with no mulch. However, rainfed fields with mulch provided an even higher yield, indicating that the positive effects of the organic mulch were probably also mediated by a buffered soil temperature and an additional nitrogen input. Overall, organic mulch appears to buffer the soil-plant water relations of celery during drought, providing more stable yields under a changing climate.

How to cite: Schreel, J., Willemet, R., Blanchy, G., Deroo, W., Garré, S., Lootens, P., Roldán-Ruiz, I., De Boever, M., and De Swaef, T.: Mulching improves soil-plant water status and yield in experimental drought conditions, EGU General Assembly 2025, Vienna, Austria, 27 Apr–2 May 2025, EGU25-1694, https://doi.org/10.5194/egusphere-egu25-1694, 2025.

Tea is a globally important crop, that is highly sensitive to variations in climate. While the UK has traditionally imported tea from regions such as China, India, and Sri Lanka, there are now several tea producers established across the UK. However, the potential impacts of future climate change on the suitability of different regions of the UK for tea cultivation is currently poorly understood.

This study evaluates the future climate suitability for tea cultivation across the UK. Comparing the current climate from various continental European tea growing regions with UKCP climate projections under the four representative concentration pathway (RCP) scenarios, we analyse where in the UK European cultivars could feasibly be grown over the century. A ranking approach was employed, incorporating closeness between European current, and UK future climates, including temperature (Tmin and Tmax), precipitation, and humidity projections, to identify regions most conducive to tea growth. Results indicate that the southeast of the UK may provide optimal growing conditions in the future, contrasting with the west, where current tea farms are predominantly located.

These findings have implications for the strategic planning of tea farming in the UK, particularly due to the long lifespan of tea plants, highlighting the need for potential adaptation to shifting climate conditions such as importing cultivars that are more suitable for the future UK climate. Furthermore, the methodology offers a framework that could be extended to assess the viability of tea gardens outside the UK, and other crops under changing climatic regimes, supporting resilient agricultural practices.

How to cite: Howard, H.: Exploring the suitability of European tea cultivar growth in future UK climates., EGU General Assembly 2025, Vienna, Austria, 27 Apr–2 May 2025, EGU25-3253, https://doi.org/10.5194/egusphere-egu25-3253, 2025.

EGU25-3287 | Orals | SSS9.12

Balancing agronomic production, farm economics and water quality with precision conservation 

Douglas Smith, Kabindra Adhikari, and Chad Hajda

Sustainable farms must balance agronomic production, farm economics and environmental concerns. Nutrient losses from agriculture are known to degrade downstream water quality. Many practices and technologies have been used to minimize the impact agriculture has on water quality, but few studies have been able to demonstrate how precision agriculture can accomplish such benefits. This presentation will demonstrate how precision agriculture was used to improve runoff water quality and farm gate returns through the adoption of precision conservation. At a research farm near Riesel, Texas, USA, ten cropped fields were managed with various levels of conservation adoption. Precision agriculture technologies were adopted for planting, fertilizing, and harvesting equipment in 2017. A baseline of data was captured from 2018-2021 to determine crop yield stability for each field. Starting in crop year 2022, the crop yield stability was used to implement precision conservation on four fields: two fields received reduced inputs to 60-80% of recommended rates in unprofitable zones, while two fields eliminated production in unprofitable zones. Water quality monitoring occurs in six of the ten fields. Preliminary data indicated decreased in soluble P loads of 90% following adoption of precision conservation, due to lower or eliminated P applications. Precision conservation seems to be able to balance production, economics and environmental concerns greater than traditional agriculture.  

How to cite: Smith, D., Adhikari, K., and Hajda, C.: Balancing agronomic production, farm economics and water quality with precision conservation, EGU General Assembly 2025, Vienna, Austria, 27 Apr–2 May 2025, EGU25-3287, https://doi.org/10.5194/egusphere-egu25-3287, 2025.

EGU25-3752 | ECS | Posters on site | SSS9.12

Climate Twin Methodology for Assessing the Future Viability of European Vineyards: A Bioclimatic and Topographic Approach 

Héloïse Allaman, Stéphane Goyette, and Jérôme Kasparian

The repercussions of climate change on viticulture are a matter of increasing concern, particularly in Europe, where vineyards are intrinsic to both the economy and cultural heritage. In order to facilitate a more profound comprehension of the spatial change of the climate, the climate twin method [1] is employed to analyse the case of European vineyards. The methodology involves the use of a climate twin model, which matches future vineyard climates with those of other regions. This provides insights into how shifting climates may influence the suitability of current and potential vineyard regions. The approach enables an understanding of both current and future climate conditions in wine-producing regions, offering prospective insights into the potential shift of suitable vineyard locations. The employment of the climate twin method facilitates the identification of regions within Europe that will retain their suitability for viticulture under future climate conditions, whilst concomitantly enabling the discovery of new areas with wine-growing potential in the future.

We rely on several bioclimatic indices, that consider climate conditions in the context of vineyard growth and disease development. The Huglin index and the number of heat and frost days are employed to describe the optimal conditions required for vine growth. The Scaphoideus titanus, the vector of Flavescence dorée, as well as the downy and powdery mildew, which are the main threats to European vineyards, are also considered. The climate twins are computed using these bioclimatic indices, as well as the raw climate data, namely temperature, precipitation, humidity and solar radiation. Results show that using the bioclimatic indices yields consistent mappings region by region, with a specific region being reliably associated with another under future climate conditions. 

Topography is a pivotal factor in viticulture, with vineyards frequently situated in hilly regions with south-facing slopes to maximise sunlight exposure. These topographic characteristics modify temperature, thereby influencing vine growth and disease dynamics. In this study, we analyse the impact of topography by calculating temperature corrections based on slope orientation and altitude. We show that the influence of these adjustments plays an important role on the identification of climate twins, and subsequent predictions for vineyard viability under future climate scenarios.

The findings of this study offer a more robust understanding of how European viticulture will need to adapt to climate change, with a particular focus on spatial shifts in suitable regions. This will assist winegrowers in making informed decisions regarding vineyard locations, culture management strategies, and future investments in viticulture. Our study underscores the significance of the climate twins approach to understanding climate impacts on viticulture, taking into account both bioclimatic variables and topographic factors. The overarching objective of this research is to provide a scientific foundation for the sustainable viticulture practices that will be required in the face of ongoing climate change, thereby safeguarding the future of European winemaking.


[1] G. Rohat, S. Goyette, J. Flacke, International Journal of Climate
Change Strategies and Management (2017)

How to cite: Allaman, H., Goyette, S., and Kasparian, J.: Climate Twin Methodology for Assessing the Future Viability of European Vineyards: A Bioclimatic and Topographic Approach, EGU General Assembly 2025, Vienna, Austria, 27 Apr–2 May 2025, EGU25-3752, https://doi.org/10.5194/egusphere-egu25-3752, 2025.

EGU25-6950 | ECS | Posters on site | SSS9.12

Mulch Type Matters: The Impact of Mulch Biodegradability on Potato Crop Development Under Wet Conditions in Belgium 

Rémy Willemet, Jeroen Schreel, Tom De Swaef, Wim Cornelis, and Maarten De Boever

In Europe, future summers are expected to bring both droughts and periods of excessive rainfall, highlighting the need for adaptable agronomic strategies across varying climatic scenarios. While mulch is well-documented for its ability to reduce soil evaporation and enhance tolerance against drought, its effects under wet conditions remain unclear.

In this study, we investigated the efficacy of three types of organic mulch - hay, miscanthus, and woodchips - for potato cultivation (Solanum tuberosum L.) during the wet summer of 2024 in the Flemish region of Belgium. Mulch was applied as a 6-cm layer on a sandy loam field. To gain insights into the impact of mulching on soil processes and crop development, we measured soil water content, matric potential, temperature, microbial activity, nitrogen in both soil and plant, and crop growth through a combination of manual and UAV measurements.

Our findings indicate that mulch biodegradability was the main factor affecting crop development during the wet 2024 growing season. At the final harvest, the average tuber yields under hay and miscanthus treatments were 33.2±3.0 t/ha and 29.2±4.5 t/ha, respectively, surpassing the control group yield of 28.1±3.3 t/ha. In contrast, the woodchip treatment resulted in a lower tuber yield of 24.4±4.4 t/ha. The best-performing mulch thus led to an 18% increase in tuber yield, while the worst-performing mulch induced a 13% decrease compared to the control treatment.

We assume that rapidly decomposing mulches provided a nitrogen boost mediated by soil microbial activity, thereby enhancing crop growth. In contrast, slowly decomposing materials might have caused nitrogen immobilization, reducing crop development and yield compared to the control group. The study underscores that the effectiveness of mulching is context-dependent and shaped by the interplay of mulch characteristics, environmental conditions, and crop-specific requirements.

How to cite: Willemet, R., Schreel, J., De Swaef, T., Cornelis, W., and De Boever, M.: Mulch Type Matters: The Impact of Mulch Biodegradability on Potato Crop Development Under Wet Conditions in Belgium, EGU General Assembly 2025, Vienna, Austria, 27 Apr–2 May 2025, EGU25-6950, https://doi.org/10.5194/egusphere-egu25-6950, 2025.

EGU25-7186 | Posters on site | SSS9.12

Telomere Length as a genomic biomarker of well-being in grapevines: preliminary results in Aglianico grapevine 

Alessandra Iannuzzi, Arturo Erbaggio, Rossella Albrizio, Filippo Accomando, Andrea Vitale, and Ramona Pistucci

In recent years, molecular biomarkers have emerged as important tools in modern agriculture, facilitating the monitoring of plant health and providing objective assessments of resistance and susceptibility to environmental factors. Within the realm of grapevines (Vitis vinifera L.), genomic biomarkers hold promise owing to their ability to integrate multifaceted, context-dependent information.

In this context, telomere length emerges as a promising, rapid, and cost-effective genomic biomarker, as observed in other species such as mammals and other plants. Telomeres, repetitive DNA sequences situated at chromosome ends, play a central role in safeguarding genetic material from damage and have been widely used in processes related to health, aging, and stress in mammalian models.

Quantitative real-time PCR (qPCR) enables precise quantification of telomere length relative to an internal reference gene specific to grapevines, ensuring stable measurements across diverse environmental conditions. Implementation of this novel protocol will facilitate the evaluation of telomere length dynamics in grapevines under varying conditions, thereby providing a valuable tool for assessing the vine's health status.

This contribution presents the first results on the Aglianico vine subjected to different levels of water stress (irrigated and non-irrigated) under the same soil in an area of southern Italy devoted to the production of high-quality wines (Taurasi DOCG area) in the Tenuta Donna Elvira winery (Montemiletto—AV).

The results were be achieved within the BeViteLo project.

How to cite: Iannuzzi, A., Erbaggio, A., Albrizio, R., Accomando, F., Vitale, A., and Pistucci, R.: Telomere Length as a genomic biomarker of well-being in grapevines: preliminary results in Aglianico grapevine, EGU General Assembly 2025, Vienna, Austria, 27 Apr–2 May 2025, EGU25-7186, https://doi.org/10.5194/egusphere-egu25-7186, 2025.

EGU25-7215 | Orals | SSS9.12

Assessing the Impact of Climate Change on Vineyard Ripening and Water Dynamics: A Case Study from the Taurasi DOCG in Southern Italy 

Angelo Basile, Rossella Albrizio, Antonello Bonfante, Maurizio Buonanno, Roberto De Mascellis, and Marialaura Bancheri

Climate change poses long-term risks to agriculture, driven by shifts in temperature, precipitation, and increased extreme weather events. Rising temperatures shift growing seasons, while altered precipitation affects water availability. Extreme weather, including intense rainfall, increases the risk of soil erosion and runoff. These changes are particularly important for vineyards, where grape ripening timing, crucial for wine quality, is affected. Vineyards, often located in hilly regions, also face soil degradation, impacting not only production but sectors like eno-tourism.

In this study - under the AGRITECH PNRR project - an experimental vineyard at Tenuta Donna Elvira in Montemiletto (AV), located in the Taurasi DOCG district (southern Italy), was used to assess the impact of climate change on soil and vineyard dynamics. The research included the following activities: i) identifying functional homogeneous zones (fHZs) in the vineyard using lidar-derived Digital Terrain Models (DTM), electromagnetic induction (EMI) sensor data, and vegetation indices derived from UAV flights; ii) Monitoring soil water content, agro-meteorological variables, leaf water potential, and leaf area index (LAI) over two years; iii) Conducting soil analysis on two distinct but adjacent soil types, evaluating their chemical, mechanical, and hydrological properties.

For both soils, the agro-hydrological model FLOWS was first calibrated and validated. Subsequently, simulations were conducted to assess conditions under the current climate (ACT: 2016–2023), near future (NEAR: 2025–2049), mid-future (MID: 2050–2074), and far future (FAR: 2075–2099) across three climate scenarios. These scenarios were derived from datasets provided by the 6th phase of the Coupled Model Intercomparison Project (CMIP6), utilizing three General Circulation Models (GCMs)—MPI-ESM1-2-LR, MRI-ESM2-0, and GFDL-ESM4—and three Representative Concentration Pathways (RCP2.6, RCP7.0, and RCP8.5). The models were locally validated against ground data (precipitation and mean temperature) for the period 2006–2023 and bias-corrected using a linear technique with 10 years of data (2014–2023) from a weather station located approximately 10 km from the study site in Luogosano (PZ).

The results indicated that under the RCP2.6 scenario, the ripening date remains stable, while under RCP7 and RCP8.5, ripening advances by up to 6 weeks. The increase in groundwater recharge due to climate change is minimal, with an increase of less than 6% in the far future for both soils. Soil 1 is, on average, 50% more effective at preventing runoff and flooding than Soil 2. Runoff increases from the RCP2.6 scenario to the RCP7 scenario and further under the RCP8.5 scenario.

Challenges with GCMs include inconsistencies in predicting climate variables, emphasizing the need for ensemble approaches. Despite these challenges, process-based models have proven reliable for predicting agricultural outcomes, especially in managing vineyard ecosystems under climate change.

How to cite: Basile, A., Albrizio, R., Bonfante, A., Buonanno, M., De Mascellis, R., and Bancheri, M.: Assessing the Impact of Climate Change on Vineyard Ripening and Water Dynamics: A Case Study from the Taurasi DOCG in Southern Italy, EGU General Assembly 2025, Vienna, Austria, 27 Apr–2 May 2025, EGU25-7215, https://doi.org/10.5194/egusphere-egu25-7215, 2025.

The assessment of soil functions and ecosystem services requires reliable eco-physiological indicators that capture the complexity of soil processes across scales. Long-term field experiment provides unique insights into soil carbon dynamic and functions under varying agricultural management practices and environmental conditions. In this study, we plan to conduct a meta-analysis of self-obtained field data from several long-term field experiments in Bad Lauchstädt, central Germany, to evaluate the applicability of both basic and novel eco-indicators in assessing soil health and carbon sequestration.
Our analysis includes traditional indicators such as metabolic quintet (qCO2) and microbial biomass carbon to soil organic carbon ratio (MBC:SOC), alongside some potential novel indicators like active microbial fractions, particulate organic matter to soil organic matter ratio (POM/SOM), soil pore characteristics, and soil fauna. These long-term field experiments represent varying land use practices, climatic conditions, and management strategies, offering a robust dataset for testing indicator sensitivity and effectiveness.
The primary objective of this research is to identify which indicators are most responsive to land use, climate variability, and seasonality at the field scale, and to explore their potential for evaluating soil functions and ecosystem services. While our data analysis is ongoing, we hypothesize that integrating basic and novel indicators will provide a comprehensive framework for soil assessment, enabling better predictions of ecosystem resilience and carbon storage potential. We look forward to presenting our findings and discussing the implications of eco-indicator-based assessments for sustainable soil management and climate change mitigation at the conference.

How to cite: Wang, S. and Blagodatskaya, E.: Meta-analysis of soil eco-indicators to assess soil functions and ecosystem services in long-term field experiments in Bad Lauchstädt, Central Germany, EGU General Assembly 2025, Vienna, Austria, 27 Apr–2 May 2025, EGU25-7372, https://doi.org/10.5194/egusphere-egu25-7372, 2025.

EGU25-7657 | ECS | Posters on site | SSS9.12

RICE-MAP: A Prototype Decision Support System for Climate-Informed Rice Security in Southeast Asia 

Chen Zhao, Yaomin Wang, Chao Zhang, and Xiaogang He

Southeast Asia is a cornerstone of global rice security, contributing substantially to regional and international food supply chains. Accurate and timely information on rice yield is essential for effective agricultural planning, trade policy formulation, and food security management. However, conventional approaches to yield estimation, which often rely on historical trends or sparse in situ observations, are insufficient for capturing the complex interplay between climate variability, extreme weather events, and crop dynamics. The increasing frequency and intensity of climate shocks, including droughts, floods, and heatwaves, underscore the need for an advanced rice yield forecasting system. The development of a decision support system--RICE-MAP (Rice Information & Climate Evaluation- Monitoring And Prediction), integrates state-of-the-art climate forecasts with machine learning techniques to provide dynamic, high-resolution predictions of rice yield under current and future climate scenarios. RICE-MAP synthesizes satellite-derived datasets, global climate model outputs, and agricultural statistics to monitor and predict yield variability across rice-growing regions in Southeast Asia. By leveraging spatially and temporally resolved climate variables with machine learning models, the system provides lead-time-specific yield predictions, accompanied by rigorous evaluations of forecast performance using established metrics. The system’s capabilities are accessible through a user-friendly dashboard, designed to facilitate decision-making for policymakers, agricultural planners, and other stakeholders. Case studies in Southeast Asia demonstrate the system’s potential of integrating climate science and artificial intelligence to enhance climate resilience and adaptive capacity in the agricultural.

Keywords: Decision Support System; Rice yield forecast; climate shocks.

How to cite: Zhao, C., Wang, Y., Zhang, C., and He, X.: RICE-MAP: A Prototype Decision Support System for Climate-Informed Rice Security in Southeast Asia, EGU General Assembly 2025, Vienna, Austria, 27 Apr–2 May 2025, EGU25-7657, https://doi.org/10.5194/egusphere-egu25-7657, 2025.

The agricultural sector faces increasing pressure to meet global food demand due to population growth. Challenges such as climate change, resource scarcity, and environmental degradation will further increase this problem. These issues are particularly critical in the Mediterranean region, which is characterized by water-limited conditions and soils poor in organic matter and mineral nutrients. As a step toward ensuring food security, optimized resource utilization strategies and actionable plans for stakeholders are necessary. Reliable estimation of crop growth parameters and yield prediction under different climatic and agronomic scenarios have emerged as critical tools in driving these changes.

Various conventional crop growth parameter estimation and yield prediction methods have emerged as methods for optimizing resource utilization, identifying risks, and enabling effective decision-making. However, conventional methods, including empirical, statistical, and process-based models, often face limitations such as co-linearity among predictor variables, assumptions of stationarity, and the inability to capture complex biophysical and biochemical interactions at large scales. These shortcomings highlight the need for more robust and adaptable approaches. Advanced technologies, particularly Artificial Intelligence (AI) and Remote Sensing (RS) have revolutionized agriculture by uncovering hidden patterns, enabling large-scale monitoring, and improving prediction accuracy. This research evaluates the state-of-the-art in the synergized use of AI and RS for crop growth parameter estimation and yield prediction in Mediterranean agroecosystems.

A systematic literature review was conducted following the Preferred Reporting Items for Systematic reviews and Meta-Analyses (PRISMA) guidelines. Keywords and Boolean operators were used to search titles, abstracts, and keywords in selected databases, including Web of Science and Scopus. The review included English and French publications focusing on the Mediterranean region, encompassing Southern European, Middle Eastern, and North African countries bordering the Mediterranean Sea. Publications that were duplicated, unrelated to the study objectives, or outside the geographical focus were excluded. Out of 551 initial publications retrieved, 117 met the inclusion criteria and were selected for detailed review.

The findings reveal a rising interest in integrating AI and RS for estimating crop growth parameters and predicting yield. Multispectral RS products, such as Landsat-8 and Sentinel-2, are the most frequently utilized data sources. Additionally, Sentinel-1 microwave sensors and Unmanned Aerial Vehicle (UAV)-based imagery are increasingly employed alongside ground-based sensors. Among AI methodologies, Machine Learning (ML) algorithms like Random Forest (RF), Artificial Neural Networks (ANN), and Support Vector Machines (SVM) dominate, while Deep Learning (DL) techniques such as Convolutional Neural Networks (CNN) and Long Short-Term Memory (LSTM) networks have gained prominence since 2020. Most publications were produced between 2020 and 2024, with Italy, Spain, and France being the most studied regions.

The study underscores the transformative potential of integrating AI and RS for crop growth parameter estimation and yield prediction in Mediterranean agroecosystems. By leveraging diverse data sources, algorithms, and sensor technologies, these advancements address the limitations of traditional models, enhance scalability and accuracy, and support sustainable agriculture in resource-limited environments.

This research is performed in the framework of the PhD program in Agrobiosciences, Scuola Superiore Sant'Anna, scholarship: PNRR “Digital and environmental transitions” (M4C1, Inv. 3.4) ex MD 629/2024.

How to cite: Demissie, W., Sebastiani, L., and Rossetto, R.: Synergizing Artificial Intelligence and Remote Sensing for Enhanced Crop Growth Parameter Estimation and Yield Prediction in Mediterranean Agroecosystems: A Systematic Literature Review, EGU General Assembly 2025, Vienna, Austria, 27 Apr–2 May 2025, EGU25-8207, https://doi.org/10.5194/egusphere-egu25-8207, 2025.

EGU25-8877 | ECS | Orals | SSS9.12

Silicon fertilizer increased potato drought tolerance and reduced soil N2O emissions in two Danish soils at field scale  

Yvonne Madegwa, Yihuai Hu, Jörg Schaller, and Klaus Butterbach-Bahl

Potatoes, with their small, shallow roots, are one of the most drought-sensitive crops. Silicon (Si) fertilizers have the potential to increase the drought tolerance of potatoes by modulating soil and plant properties. We investigated the effect of Si fertilizers on potato production and greenhouse gas emissions (N2O and CH4) under drought stress. The experiment was conducted on 2 soils (orthic haplohumod-sand and typical Agrudalf-clay) with drought intensity as main plot (acute drought and severe drought) and Si fertilizers as split plots (amorphous silica-ASi, diatomaceous earth-DE and no-Si addition-Control). For drought intensity treatments, acute drought had higher total yields compared to severe drought, while Si fertilizer treatments (ASi and DE) had higher total yields as well as higher soil moisture and leaf P content compared to the Control in both soils. Overall, Si-based fertilizers (ASi and DE) significantly reduced cumulative N₂O emissions in both sand and clay soils compared to Control treatments. More specifically Si-based fertilizers recorded an average reduction of 31% in N₂O emissions compared to Control. For CH₄ emissions, Si-based fertilizers led to an 8% increase in CH₄ uptake in clay soils and a 3% increase in sand soils (with DE) compared to Control, although these values were not significant. Our results indicate that, at field scale, Si fertilization has the potential to be a sustainable solution for maintaining potato production while reducing agricultural N2O emissions under drought stress in Denmark. 

How to cite: Madegwa, Y., Hu, Y., Schaller, J., and Butterbach-Bahl, K.: Silicon fertilizer increased potato drought tolerance and reduced soil N2O emissions in two Danish soils at field scale , EGU General Assembly 2025, Vienna, Austria, 27 Apr–2 May 2025, EGU25-8877, https://doi.org/10.5194/egusphere-egu25-8877, 2025.

EGU25-9409 | Posters on site | SSS9.12

Neglected and underutilized plant species to enhance productivity of marginal lands in the Mediterranean basin 

Cristina Da Lio, Marta Cosma, Luna Al-Hadidi, Abdelmadjid Boufekane, Sandra Donnici, Alaa El-Din Abdin, Amal ElRawy, Lorenzo Frison, Luca Galeazzi, Taoufik Hermassi, Maria Lopez-Abelairas, Dalila Loudyi, Simona Castaldi, Micòl Mastrocicco, Luigi Tosi, Eleni Maloupa, Katerina Grigoriadou, and Vassilis Aschonitis

The Mediterranean region is experiencing severe environmental pressures due to climate change, population growth, agricultural intensification, and desertification. Impacts will be exacerbated in the coming decades and require adaptation strategies to increase the resilience of ecosystems and counteract land degradation. Throughout the Mediterranean, desertification combined with reduced freshwater availability will be the main factors limiting agricultural production, driving the need for alternative low-water demanding crops. Some Neglected and Underutilized Species (NUS), typical of the Mediterranean area and already used by rural populations, are adapted to grow under drought conditions, in combination with other soil limiting factors, such as high salinity, reduced nutrient inputs, and desertification. These species have the potential to ameliorate soil quality and to be a viable alternative for farmers, especially smallholders, to generate economic value.

The VENUS project (i.e. ConVErting marginal lands of the Mediterranean basin into productive and sustainable agroecosystems using low water demanding Neglected and Underutilized Species) aims to demonstrate the environmental potential of introducing NUS, known for their resilience under extreme conditions, and their economic potential as marketable products, including food, cosmetics, and energy applications. Specifically, 10 pilot sites have recently been established in 7 Mediterranean countries (Greece, Italy, Morocco, Tunisia, Egypt, Jordan and Algeria) to collect data on biotic and abiotic factors regulating the NUS production systems, to test the suitability and sustainability of NUS, and to assess the impact of their cultivation on soil health quality. The local results obtained at the pilot sites, combined with an analysis of the distribution of the most recent databases available in the literature of key abiotic/climatic factors across the Mediterranean, will be useful for the scalability and transferability assessment of NUS production systems to a wider scale. Furthermore, NUS production system at each site will be analysed to assess their quality for various market applications (i.e., food, cosmeceutical and pharmaceutical, and energy production), and social acceptance with the final aim of producing a set of commercially viable and sustainable business models at partners’ pilot regions and countries, providing alternatives to farmers struggling with water scarcity and other limiting factors.

Funding

This work was conducted in the framework of the project VENUS - “ConVErting marginal lands of the Mediterranean basin into productive and sustainable agroecosystems using low water demanding Neglected and Underutilized Species” funded by the PRIMA programme (Grant Agreement No. 2312) supported by the European Union’s Horizon 2020 research and innovation programme.

How to cite: Da Lio, C., Cosma, M., Al-Hadidi, L., Boufekane, A., Donnici, S., El-Din Abdin, A., ElRawy, A., Frison, L., Galeazzi, L., Hermassi, T., Lopez-Abelairas, M., Loudyi, D., Castaldi, S., Mastrocicco, M., Tosi, L., Maloupa, E., Grigoriadou, K., and Aschonitis, V.: Neglected and underutilized plant species to enhance productivity of marginal lands in the Mediterranean basin, EGU General Assembly 2025, Vienna, Austria, 27 Apr–2 May 2025, EGU25-9409, https://doi.org/10.5194/egusphere-egu25-9409, 2025.

EGU25-9410 | ECS | Orals | SSS9.12

Integrated digital solutions for sustainable farm-scale water allocation in Mediterranean environments 

Andrea Borgo, Marta Debolini, Guido Rianna, and Simone Mereu

Agriculture represents the most water-demanding sector in the Mediterranean, constituting 72% of total water demand, but exceeding 80% in most Southern Mediterranean countries. Moreover, climate change is expected to threaten water resources, by increasing evapotranspiration rates and changing precipitation regimes, with more heavy rains and prolonged long-term droughts. For these reasons, improving irrigation efficiency through policies like the Integrated Water Resource Management (IWRM) is critical for sustainable development. The digitalization of the irrigation sector can constitute a strategic solution to overcome the issue of water scarcity, as it integrates the latest technological advancements (Internet of Things – IoT, innovative water and weather sensors and actuators) in conventional irrigation systems. For this purpose, this work aims to develop and implement a real-time irrigation model, which acts as a decision-support tool for accurate irrigation management in Mediterranean environments. By integrating sensor-based data (soil moisture sensors, water meters and weather stations), weather forecasts (from meteorological models) and user inputs (crop, soil and irrigation management indications), the irrigation model provides accurate scheduling of irrigation events, according to crop water needs. The model runs at hourly scale, performing a soil water balance over the soil profile of the field and assessing the irrigation requirements, given the inputs (precipitation and irrigation) and outputs (deep percolation and crop evapotranspiration) of the system. The model schedules the days and volumes of future irrigation events, considering the scenarios of optimal irrigation (Early), moderate (Late) and high (Limit) water stress, in the case of full and deficit irrigation. One of the key features of the presented irrigation model is its ability to calibrate future irrigation events by analyzing the performance of past irrigations and checking the presence of deep percolation or water deficit in the lowest level of the soil profile. This model can constitute a powerful tool for the support of farmers in precision irrigation, considering the real-time monitoring of crop water needs and the scheduling of future irrigation events. Moreover, its user-friendly interface, with a very limited and easy-to-get set of input data allows an accessible management and visualization of the model’s outputs. This work is part of the PRIMA-founded ACQUAOUNT (Adapting to Climate change by QUantifying optimal Allocation of water resOUrces and socio-ecoNomic inTerlinkages - https://www.acquaount.eu/ ) project, which aims to apply innovative tools, smart water services and digital solutions, to improve sustainable irrigation and contribute to climate resilience in agriculture.

How to cite: Borgo, A., Debolini, M., Rianna, G., and Mereu, S.: Integrated digital solutions for sustainable farm-scale water allocation in Mediterranean environments, EGU General Assembly 2025, Vienna, Austria, 27 Apr–2 May 2025, EGU25-9410, https://doi.org/10.5194/egusphere-egu25-9410, 2025.

EGU25-10094 | ECS | Orals | SSS9.12

Assessment of soil health indicators in a regional strategy for climate change adaptation in agricultural land in Navarre (Spain). 

Miguel Itarte, Rodrigo Antón, Alberto Enrique, Isabel de Soto, and Iñigo Virto

Due to expected climate change effects, and with the aim of improving the resilience of the region of Navarra (N Spain), the Life Nadapta project has developed different studies on diverse knowledge fields. One of them is related to agriculture, more specifically to soil heath and the capability of improving its resilience through different agricultural managements.

These managements are conservation agriculture, organic amendments and crop rotation and the goal of this work was to assess the effect of these practices on three previously defined soil quality indicators (bulk density, water holding capacity and organic carbon storage).

To measure the effect of this practices over the agricultural soils of Navarra, previously a zonification process took place, considering the agroclimatic distribution and different bioregions. As result of this, the region of Navarra was split into 12 zones. Subsequently, for each zone, the more representative agricultural soil managements were selected in a network of more than 150 agricultural plots. On these, paired comparisons on plots with on the same soil unit and contrasting management were conducted to determine the effect of the selected management strategies on soil health.

Result of an extensive plot selection, 11 plots were chosen out of the 150 in the network to continue the study several years after the first assessment, comparing the effect of a conventional management with the adaptative ones on soil health indicators.

In addition, to account for all aspects of the sustainability of these managements in real life, the study took into consideration the economic yield and cost of each management strategy in these 11 plots.  

The groups of plots that showed significant differences in bulk density between adaptive and conventional management were those located in study zone 3 (semi-arid transition area). The plot under conservation agriculture management displayed higher values than the conventional one and the plot with organic amendments obtained a lower density.

Regarding carbon concentration, the same plot under conservation agriculture mentioned above performed worse than its conventional equivalent. On the other hand, in study area 1 (arid Mediterranean), the plot with organic amendments achieved a higher concentration than the conventional plot.

Finally, no differences were observed in any of the groups of plots studied, in terms of the water retention capacity indicator.

The economical balances showed that not all situations leading to improved soil quality resulted in a better economical behavior, which suggests that improving soil resilience may induce additional costs to producers.

Our results offer a first approximation of actual changes in agricultural fields when adaptive strategies are adopted at the regional level.

How to cite: Itarte, M., Antón, R., Enrique, A., de Soto, I., and Virto, I.: Assessment of soil health indicators in a regional strategy for climate change adaptation in agricultural land in Navarre (Spain)., EGU General Assembly 2025, Vienna, Austria, 27 Apr–2 May 2025, EGU25-10094, https://doi.org/10.5194/egusphere-egu25-10094, 2025.

The plant pathogen Xylella fastidiosa (Xf) is a significant threat to various economically important tree cash crops. Although previously found only in the Americas, the bacterium responsible for olive quick decline syndrome was detected in Apulia, Italy, in 2013. The primary vector of Xf in Italy is the spittlebug Philaenus spumarius. Several studies suggested that vector mobility has been a critical factor influencing the epidemic, along with the insect population density and the pathogen transmission rate. Since then, it has spread to approximately 54,000 ha of olive trees in the region, causing dramatic concern throughout the Mediterranean basin. As a result, it is crucial to comprehend its distribution and forecast its potential diffusion. While a large contribution to the “olive quick decline syndrome” (OQSD) study has been focused on the insect-bacterium characteristics as well as on the climate, phenological and epidemiological Xf-driving factors, to date, the effect of the anthropogenic pressure on the distribution of OQDS has been neglected, notwithstanding some authors hinted to the importance of human mobility and settlements on the vector dissemination, and on the actual spread of insect pests over short and medium distances. To fill this research gap, we analyzed the spatiotemporal patterns of the OQDS epidemic in Apulia using an ecological niche model to identify how different land uses, used as proxies of different levels of human pressure across the Apulia territory, impacted the distribution of the Xf-infected olive trees in 2015–2021. Results demonstrated that the anthropogenic component significantly contributed to the epidemic, with the road system representing the main driver of diffusion and natural/seminatural areas hampering Xf spread at the landscape scale. This evidence highlighted the importance of explicitly considering the effects of the anthropogenic landscape when modelling Xf distribution and support the design of landscape-informed monitoring strategies to prevent Xf spread in Apulia and other Mediterranean countries.

How to cite: Raparelli, E., Bregaglio, S., and Bajocco, S.: Assessing the driving role of the anthropogenic landscape on the distribution of the Xylella fastidiosa-driven “olive quick decline syndrome” in Apulia (Italy), EGU General Assembly 2025, Vienna, Austria, 27 Apr–2 May 2025, EGU25-10182, https://doi.org/10.5194/egusphere-egu25-10182, 2025.

Viticulture in Trentino Alto Adige (northern Italy) mainly focuses on wine quality rather than quantity, and it is well known that wine quality can be improved by applying moderate water stress during fruit ripening. But with climate change extreme drought periods are becoming more and more frequent, and longer often coupled with high air temperatures. This is challenging for farmers, since prolonged periods of water scarcity negatively affect the physiological activity of the vines, the yield and the increase of water demand from irrigation reservoirs. On the other hand, summer extreme precipitations cause, as well, crop loss, plant diseases, nutrient leaching and soil erosion. 

With appropriate precision irrigation practices the timing and the amount of water can be controlled to guarantee the optimal amount of water to the crops and ensure the best quality of the products, also avoiding water loss by runoff or deep percolation resulting from an excess of irrigation. In this perspective it is essential to accurately monitor the water status of the SPAC, which is the Soil-Plant-Atmosphere Continuum.

This study focuses on the comparison of two different irrigation regimes on a vineyard located in Mezzolombardo (Trentino Alto Adige, Italy), with the analysis of the water status of the field during the 2024 growing season and the comparison of the musts after harvest.

Four vines (Vitis vinifera L., Teroldego cv.) on the same vine row were chosen: two of them were kept without irrigation, and the others were treated as usual with irrigation scheduled by the irrigation consortia. The water state of the plant was monitored with microtensiometers (FloraPulse Co., Davis, USA) embedded in the trunk and measuring the stem water potential (Ψstem) allowing a continuous, non-invasive and remote monitoring of Ψstem. The amount of water in the soil was measured with tensiometers, located near each plant, and atmospheric parameters were given by a meteorological station nearby.

The start of the 2024 growing season has been extremely wet and limited the initial development of the vegetation, but August was characterized by almost no water income and particularly high temperatures. Despite the lack of water, the non irrigated plants never reached Ψstem values associated to water stress, whereas the irrigated plants were kept regularly irrigated even when the water in the soil was above field capacity, leading to a potential loss of water by deep percolation. The comparison of the musts between the two thesis highlighted no significant differences in the organoleptic properties and the Ravaz Index showed that the non irrigated vines were in a better vegetative-productive equilibrium with respect to the irrigated plants.

In order to adapt the agricultural production to the water imbalance given by the changing climate, it is more effective to provide irrigation only when needed, and not to rely on a scheduled calendar. It is confirmed that precision irrigation practices accurately support the crop needs and it should be one common practice to be developed and enhanced in the near future.

How to cite: Mattedi, C., Zottele, F., Centurioni, F., and Corradini, S.: Effects of deficit irrigation practices on the Soil-Plant-Atmosphere system: a case study on Vitis vinifera L. (Teroldego cv.) from Trentino Alto Adige, Italy, EGU General Assembly 2025, Vienna, Austria, 27 Apr–2 May 2025, EGU25-10812, https://doi.org/10.5194/egusphere-egu25-10812, 2025.

Grape downy mildew, caused by the pathogen Plasmopara viticola, is one of the most devastating diseases impacting grapevine cultivation globally. Its primary infection is highly influenced by weather conditions and the presence of airborne sporangia. Effective management of this disease relies on timely preventive fungicide applications, which depend on accurate forecasting. Traditional empirical forecasting methods often lack precision, leading to costly and less effective intervention decisions. Recently, the use of spore traps for monitoring airborne spores has shown promise in enhancing plant disease forecasting accuracy.

This study aims to enhance Rossi’s primary infection model and develop a spore data assimilation method to improve the forecasting of grapevine downy mildew infections. Additionally, we examine the impact of climate change on disease occurrence risks and evaluate adaptation strategies across different grape-growing regions in China. By integrating spore trap monitoring data with the mechanistic model, our data assimilation method improved primary infection predictions and disease management strategies.

From 2022 to 2024, we conducted multisite monitoring in Nanning, Hechi, Guilin, and Yangling to analyze sporangia splash patterns and concentration changes within orchards, as well as disease index variations across regions. The collected data were used for model verification and calibration. We employed data assimilation techniques and performed a model sensitivity analysis to determine relevant parameters. The enhanced model demonstrated high sensitivity, specificity, and accuracy across major grape-growing regions in China, correctly predicting primary infection dates with a coefficient of determination (R²) of 0.85 and a root mean square error (RMSE) of 8-16%. Notably, the model accurately forecasted infection dates across multiple years and sites, with only one instance of a 7-day delay. Furthermore, the model identified optimal fungicide spraying windows, potentially reducing management costs by 10-30% compared to traditional strategies used by farmers.

Our analysis of climate change scenarios revealed significant shifts in primary infection trends, with warmer and more humid conditions projected to increase the risk and frequency of downy mildew outbreaks in several key grape-growing regions. In response, we propose adaptation strategies including the adoption of resistant grapevine varieties, modification of irrigation practices to reduce humidity around plants, and the implementation of integrated pest management (IPM) approaches that combine biological control agents with optimized fungicide application schedules.

These results indicate that assimilating real-time spore counts allows the model to effectively simulate primary infection processes, enabling timely and informed decision-making to limit disease spread. Additionally, understanding the climate change-driven shifts in infection trends facilitates the development of robust adaptation strategies to sustain grapevine cultivation under evolving environmental conditions. This approach provides grape growers with location-specific, precise, and timely information essential for developing effective disease management and adaptation strategies, thereby enhancing the sustainability and productivity of grapevine cultivation in the face of climate variability.

How to cite: Yao, L., Zhao, G., Chen, B., and Yu, Q.: Optimizing Primary Infection Forecasting and Management of Grapevine Downy Mildew with Spore Trap Data Across Chinese Vineyards, EGU General Assembly 2025, Vienna, Austria, 27 Apr–2 May 2025, EGU25-12159, https://doi.org/10.5194/egusphere-egu25-12159, 2025.

Agricultural conservation practices (e.g. conservation tillage, cover crops) are critical measures to mitigate nutrient loss and greenhouse gas emissions, enhance soil organic carbon (SOC), and maintain crop yield. Despite these benefits, recent studies indicate that switching to conservation tillage (e.g. no-till) can inadvertently increase nitrate leaching, thereby degrading water quality.  This study presents a meta-analysis of field experiments to elucidate the conflicting outcomes of conservation tillage—increasing SOC levels but simultaneously exacerbating nitrate loss. For instance, SOC in the top 30 cm of soil under no-till (NT) was 14.2% and 4.7% higher than under high-intensity tillage (HT) and intermediate-intensity tillage (IT), respectively. In contrast, nitrate leaching under NT exceeded that under HT and IT by 4.9% and 0.6%, respectively.

By leveraging high-resolution datasets of soil characteristics, weather, water quality, land use, and topography, we utilized a comprehensive watershed model, the Terrestrial-Aquatic Sciences Convergence (TASC) to evaluate the combined effects of tillage and cover crops (e.g., winter wheat, rye, and oats) on SOC sequestration, nitrate loading, and crop yield in the Upper Mississippi River Basin (492,000km2). We found that conservation tillage  and cover crops could complement each other. The combined adoption significantly affects water availability, nitrate leaching, SOC, and crop yield. While the integration of cover crops enhances biomass production and SOC, their ability to absorb soil inorganic nitrogen during the non-growing season helps mitigate nitrate leaching. Notably, crop yield under scenarios combining tillage and cover crops surpasses those involving only tillage. However, cover crops can also enhance evapotranspiration, which could potentially aggravate the water availability issues for crop production under future climate conditions. These results underscore the critical need for careful evaluation of the trade-offs between conservation tillage and cover crops when developing policies to address environmental challenges in agricultural ecosystems over the coming decades.

How to cite: Liang, K., Zhang, X., and Zhao, K.: Trade-offs of Conservation Practices in the US Corn-belt: Balancing Soil Organic Carbon, Water Quality, and Crop Yield, EGU General Assembly 2025, Vienna, Austria, 27 Apr–2 May 2025, EGU25-12605, https://doi.org/10.5194/egusphere-egu25-12605, 2025.

EGU25-12701 | ECS | Orals | SSS9.12

Drivers of Spatial Variability in Corn Yield Sensitivity to Heat in the US Midwest 

Adarsh Raghuram and Ethan Coffel

Extreme heat is a growing threat to global agricultural production. Compound climate extremes, such as co-occurring hot and dry conditions driven by interactions between land and atmosphere, further exacerbate yield loss. Given the projected increase in such extremes, crop adaptation is becoming increasingly crucial to mitigate yield shocks and ensure food security. 

The US Midwest, responsible for about a third of global corn production, is a key region of focus. In this study, we find that the regional sensitivity of corn yields to extreme heat has shown an increasing trend over the past 6 decades. While this finding aligns with other studies indicating limited adaptation in the region, the spatial variations in sensitivity changes suggest more localized influences on crop yields. Using data from the USDA and ERA5, we explore the basis for this observed variability in sensitivity, with a particular focus on two management strategies—crop diversity and tillage practices—at the county scale to assess potential adaptation.

How to cite: Raghuram, A. and Coffel, E.: Drivers of Spatial Variability in Corn Yield Sensitivity to Heat in the US Midwest, EGU General Assembly 2025, Vienna, Austria, 27 Apr–2 May 2025, EGU25-12701, https://doi.org/10.5194/egusphere-egu25-12701, 2025.

Europe's commitment to sustainability drives the need for agricultural practices that are more environmentally friendly. This transition emphasizes the protection of biodiversity, reduction of environmental harm, efficient use of resources, and the simultaneous preservation of farming profitability and food security. To support this shift, various agroecological strategies are being examined for their impact on both productivity and environmental sustainability.

The presentation will show the results of a systematic review of existing research on multicropping (MC) to evaluate its potential to enhance the environmental sustainability of agro-ecosystems while maintaining or even increasing food production. MC is defined as the sequential cultivation of more than one crop on the same field within approximately 12 months.

While MC is widely practiced in developing countries, in the European region agriculture largely relies on single-cropping, with some exceptions in the Mediterranean region. Climate change will likely allow a future expansion of MC systems in Europe. As a result, MC practices are expected to play a more prominent role in future European agriculture, necessitating an evaluation of their broader implications. The review analyses the current knowledge on the impacts of MC system implementation for yields, soil water availability, soil properties and biodiversity.

How to cite: Fader, M.: Evaluation of multicropping systems (sequential cultivation) from an agroecological perspective, EGU General Assembly 2025, Vienna, Austria, 27 Apr–2 May 2025, EGU25-12931, https://doi.org/10.5194/egusphere-egu25-12931, 2025.

EGU25-13048 | ECS | Posters on site | SSS9.12

Rice N fertilization guided by plant nutritional status using proximal sensing 

Konrad Metzger, Léandre Guillod, Yvonne Fabian, and Thomas Guillaume

With warming climate, the conditions north of the alps become more favorable for growing paddy rice as a niche product to diversify the crop production, while simultaneously utilizing wetlands with their benefits for high biodiversity and the prevention of greenhouse gas emissions. However, growing paddy rice in these climatic conditions remains challenging, and therefore, the Nitrogen availability might not be a dominant limiting factor to reach the relatively low yield objectives of Swiss growers (3-4 t / ha). Here, we assess the occurrence of N deficiencies in paddy rice fields across Switzerland and the relative importance of the two main fertilizations (basal at transplantation and at panicle initiation) to reach the yield objectives. To achieve these goals, we used proximal sensing (SPAD (soil plant analysis development) and a near-infrared leaf spectrometer) to estimate the nitrogen nutrition index (NNI) as a fast and affordable method as needed for precision agriculture and targeted fertilization. We calibrated the methodology to determine N and chlorophyl critical values at panicle initiation for the short duration rice variety (Loto) grown in Switzerland. 

In nine paddy rice fields throughout Switzerland, proximal sensing measurements were done between transplantation and panicle initiation (determined as the best moment for the second application of fertilizer). In addition, in one paddy rice field we implemented an experiment consisting of four treatments: a standard practice, where the field was fertilized once at transplantation together with the plant (40 kg N/ha) and once before panicle initiation with a spreader (40 kg N/ha), zero fertilizer and two treatments of only one fertilizer application, namely one in which the fertilizer was applied with the transplantation, and one where the fertilizer was applied before panicle initiation.

Plant leaves were measured with two proximal sensing devices, (Hansatech SPAD meter and SpectraVue leaf spectrometer) before the second fertilization, and in the case of the experiment also one week after fertilizer application. In parallel, plant samples were collected to be analyzed for biomass, leaf N content and phenology.

Preliminary results of the SPAD values showed, that they tended to reach a maximum at ca. 18 ± 4 before panicle initiation, especially in the high yielding fields. In other fields, the SPAD values were much lower (ca. 9 ± 5), indicating the need for adapted fertilization even at low yield objectives.

In terms of yield, the experiment resulted in significantly different (p<0.05) grain yield differences between the treatment without fertilizer and with the two doses of fertilizer applied. The SPAD values showed significant differences after the second fertilizer application between the treatments that received the second fertilization and those who didn’t. No effect could be seen from the first fertilization in that case as the recent fertilization overrode the other differences.

This method could be used in the future to guide precision fertilization based on crop needs and to account for the high interannual variability.

How to cite: Metzger, K., Guillod, L., Fabian, Y., and Guillaume, T.: Rice N fertilization guided by plant nutritional status using proximal sensing, EGU General Assembly 2025, Vienna, Austria, 27 Apr–2 May 2025, EGU25-13048, https://doi.org/10.5194/egusphere-egu25-13048, 2025.

EGU25-13091 | ECS | Posters on site | SSS9.12

Hydrochar as an emerging solution for soil health improvement: Insights from a pot trial 

Teresa Di Santo, Rossana Marzaioli, Elio Coppola, Giovanna Battipaglia, Simona Castaldi, Lucio Zaccariello, Maria Laura Mastellone, and Flora Angela Rutigliano

Anthropogenic soil degradation undermines essential ecosystem services such as food production, water purification, nutrient cycling and climate regulation. Unsustainable agricultural practices are among the main causes of soil degradation through pollution, soil loss and consequently lowering organic matter and nutrients. Adopting innovative solutions for agriculture soil management by adding low-decomposable organic amendments to the soil, such as hydrochar, can help reverse soil degradation. Hydrochar, derived from the hydrothermal carbonization of organic waste, may have the advantage of restoring the organic C stock in the soil, helping to mitigate climate change and improving soil health. Before using hydrochar at a large scale, a comprehensive assessment to exclude any potential adverse effects on the soil biotic community, playing a key role in the provisioning of ecosystem services, is needed.
This study, part of the interdisciplinary project ‘CHIMERA’ evaluating the impact of hydrochar on the soil-plant-atmosphere system, aims to investigate changes in the chemical and microbial properties of degraded agricultural soil following the application of hydrochar. Therefore, a controlled greenhouse experiment was conducted using pots (21 cm diameter, 16 cm height), each containing 1 kg of soil. Two types of hydrochar, produced by hydrothermal carbonization at 250 °C and 50 bar without oxygen, were tested: one derived from sewage sludge (HS) and the other from thistle (Cynara cardunculus L., HC) residues, respectively. Each hydrochar was applied at two doses (3 kg m and 6 kg m), and the resulting five treatments (four with hydrochar and one control) were assayed in five replicates. At different exposure times (from 18 to 517 days), the following soil properties were analysed: pH, total organic C (Corg) and its extractable fraction (Cext), microbial biomass (Cmic), activity (as respiration), the quotient of mineralization (qM) and genetic bacterial diversity (richness).
The results showed no toxicity to the soil microbial community; moreover, a general improvement of microbial biomass, activity and richness was observed, compared to control, at each exposure time, together with a significant decrease in qM, suggesting that C added as hydrochar was at least in part retained in soil. This ability highlights the positive hydrochar's role in improving soil structure and promoting resilience against erosion, drought and other climate-related challenges.
Our findings suggest that hydrochar could be a tool for sustainable agricultural practices in restoring degraded soils. However, the application of hydrochar on soils requires further studies to confirm these positive effects and whether these effects can be observed using hydrochar derived from other raw materials and for other soil types.

How to cite: Di Santo, T., Marzaioli, R., Coppola, E., Battipaglia, G., Castaldi, S., Zaccariello, L., Mastellone, M. L., and Rutigliano, F. A.: Hydrochar as an emerging solution for soil health improvement: Insights from a pot trial, EGU General Assembly 2025, Vienna, Austria, 27 Apr–2 May 2025, EGU25-13091, https://doi.org/10.5194/egusphere-egu25-13091, 2025.

EGU25-13590 | ECS | Posters on site | SSS9.12

The use of remote sensing techniques to determine the nitrogen uptake by oats on highly variable sandy soils 

Aleksandra Franz, Józef Sowiński, Arkadiusz Głogowski, and Wiesław Fiałkiewicz

Abstract

Precision agriculture has become a critical approach for achieving efficient crop production while addressing the challenge of sustainable management of natural resources. A key component of precision agriculture is optimizing plant fertilization to maximize yields while minimizing environmental impact. Traditional methods of assessing plant nutritional status and fertilizer needs, such as soil and plant sampling, can be costly and time-consuming. Remote sensing techniques offer an alternative, reducing both the cost and time required for accurate fertilizer dose determination. Additionally, these methods provide more comprehensive information with higher spatial resolution.

This study aimed to investigate the potential of remote sensing techniques, specifically satellite imagery from Sentinel-2, to determine the nutritional needs of oats grown on highly heterogeneous soils. Field studies and satellite data analysis were conducted on an oats cultivation field situated on sandy soil with significant spatial heterogeneity in southwestern Poland. Observations and measurements were performed during the BBCH growth stages 12, 31, 49, 77, and 99.

Nitrogen uptake was calculated based on biomass yield and nitrogen content in crop samples taken at 40 designated points within the field. The AGRICOLUS software and Copernicus services were used for remote sensing monitoring of oats growth, while satellite images were processed at specific intervals to calculate selected remote sensing indices using QGIS software. Spectral data were used to determine indices such as NDVI, GNDVI, SAVI, EVI, NDMI, and MCARI.

The results demonstrated that soil heterogeneity had a significant impact on oats development and its nutritional requirements. Base on outcomes the linear model for N uptake was developed, where GNDVI and percentage content of sand in the soil where used for estimation of the nitrogen uptake.  The study confirmed that remote sensing, particularly the GNDVI index, is a highly effective tool for managing fertilization during the early growth stages of oats on light soils with high spatial variability. Therefore remote sensing techniques can be used for real-time monitoring of spatial variability, facilitating precision management of the crops.

Research carried out as part of the OPUS-LAP project entitled "Sustainable nitrogen fertilization for agricultural crops based on open laboratory and field experiments with integrated near-real-time hydrological modeling" (grant number: 2022/47/I/ST10/02453)

How to cite: Franz, A., Sowiński, J., Głogowski, A., and Fiałkiewicz, W.: The use of remote sensing techniques to determine the nitrogen uptake by oats on highly variable sandy soils, EGU General Assembly 2025, Vienna, Austria, 27 Apr–2 May 2025, EGU25-13590, https://doi.org/10.5194/egusphere-egu25-13590, 2025.

EGU25-13591 | ECS | Posters on site | SSS9.12

Applying variable fertilization and irrigation to improve oats growth and reduce environmental impact 

Jagoda Radzimska, Izabela Michalak, Arkadiusz Głogowski, Wiesław Fiałkiewicz, and Bernard Gałka

Modern agriculture faces an urgent challenge of optimizing the use of fertilizers, especially nitrogen, which is essential for healthy plant growth. However, overuse of nitrogen fertilizers can lead to severe environmental consequences, including surface and groundwater contamination, soil degradation, and the release of harmful greenhouse gases. This study aims to investigate how different fertilization and irrigation strategies affect oats growth, with a particular focus on nitrogen distribution in the soil, straw, and grain, as well as the overall performance of the crop. The research was conducted under controlled conditions, both in a vegetation hall that simulated real field conditions and in actual field settings at the Lubnów Agricultural Farm, located in the Ślęganiana catchment area near Wrocław, Poland. Various fertilization doses were tested, along with several irrigation schemes designed to replicate extreme rainfall events. The simulated rainfalls of 10 mm and 20 mm were applied at intervals of 2, 4, and 6 days, reflecting the unpredictability of real-world weather patterns. Additionally, the experiment incorporated four distinct soil types with different granulometric compositions to assess how soil texture and structure influence the effectiveness of nitrogen uptake by crops and irrigation practices. This approach allowed to better understand the interactions between soil characteristics, fertilization, and irrigation in real agricultural systems. The results of this study are critical for advancing sustainable farming practices concerning future climate changes and costs of fertilizer itself. By examining key crop parameters, such as stem length, biomass, and grain weight, it was possible to gain valuable insights into how different management strategies impact overall crop productivity and nitrogen use efficiency with regard to crop production. As climate change continues to disrupt agricultural systems worldwide, optimizing fertilization and irrigation techniques will be essential to ensure food security while minimizing the environmental impact. This research not only contributes to improving oats cultivation, but also offers a broader perspective on how precision agriculture can address pressing global challenges in agriculture.

Research carried out as part of the OPUS-LAP project entitled "Sustainable nitrogen fertilization for agricultural crops based on open laboratory and field experiments with integrated near-real-time hydrological modeling" (grant number: 2022/47/I/ST10/02453).

How to cite: Radzimska, J., Michalak, I., Głogowski, A., Fiałkiewicz, W., and Gałka, B.: Applying variable fertilization and irrigation to improve oats growth and reduce environmental impact, EGU General Assembly 2025, Vienna, Austria, 27 Apr–2 May 2025, EGU25-13591, https://doi.org/10.5194/egusphere-egu25-13591, 2025.

EGU25-13636 | ECS | Posters on site | SSS9.12

 Regenerative agriculture as a tool for combating climate change in semi-arid Mediterranean regions 

Salvadora Martínez-López, Miguel López-Torres, Maria Isabel Motos-Alarcón, Nieves Baena-Navarro, Vanesa Núñez-Gómez, María José Martínez-Sánchez, Maria de los Ángeles Esteban-Abad, Maria Luz Tudela-Serrano, Imad El-Jamaoui, Manuel Hernández-Cordoba, and Camen Pérez-Sirvent

The term 'carbon farming' is currently used as a synonym for 'regenerative agriculture', which is explicitly based on improving soil fertility and farm productivity (EU, 2021).

The final aim of the complementary agri-food plan AGROALNEXT is to favour the double transformation, digital and sustainable of the agri-food sector, in order to increase its competitiveness and achieve the climate and environmental objectives set out in the Green Pact, while guaranteeing the supply of healthy, safe, sustainable and accessible food to the population, as pursued by the EU Farm to Table Strategy. Specifically, line 4 'Circular Economy' is developed with the aim of reducing losses, emissions and waste generated by the agricultural sector, and of those that cannot be avoided, generating opportunities for exploitation and win-win processes in their management, which are technologically transformed into value for the sector, increasing the circularity of the sector.

The RECEC research project, which started on the 1st of September 2024, aims to enhance the resilience of agricultural production to the impacts of climate change through the promotion of efficient circularity. This project is founded on the POST LIFE plan of the LIFE AMDRYC4 project, which was led by the University of Murcia and concluded in 2022.

The objective of the RECEC project is to ensure, through a series of agricultural practices, that CO2 is absorbed from the atmosphere and stored in plant material and soil organic matter. In order to achieve these objectives, the present research project aims to evaluate and determine the suitability of new organic products, for which no data are available, such as plant biomass removed from the Mar Menor coast (Murcia, Spain), to improve soil structure, increase its fertility and evaluate its capacity as a CO2 sink for these marine by-products. Recent data from the Regional Ministry of Environment of the CARM reveals that between 2017 and 2022, a total of 32,920 tonnes of marine biomass were removed. Other vegetable waste (broccoli, cabbage, almond, olive, grapefruit and fig tree pruning waste) from agricultural activity in the Region of Murcia that can be used as by-products for soil regeneration have also been incorporated.

The results obtained from this research will be useful to collaborate in the governance of the implementation of the European 'Carbon Farming' Strategy. These solutions would provide a common framework for the entire national territory, and the rest of the European regulations, thereby demonstrating the potential of Mediterranean rainfed agriculture to play a significant role as a tool for climate change mitigation, as a carbon sink and as a supplier of ecosystem services. The benefits obtained from this project translate into agricultural tools for climate change mitigation and adaptation through, for example, the fight against desertification, biodiversity conservation and socio-economic benefits, which would curb rural depopulation, in line with meeting the demographic challenge.

This study formed part of the AGROALNEXT programme and was supported by MCIN with funding from European Union Next Generation EU (PRTR-C17.I1) and by Fundación Séneca with funding from Comunidad Autónoma Región de Murcia (CARM).


How to cite: Martínez-López, S., López-Torres, M., Motos-Alarcón, M. I., Baena-Navarro, N., Núñez-Gómez, V., Martínez-Sánchez, M. J., Esteban-Abad, M. D. L. Á., Tudela-Serrano, M. L., El-Jamaoui, I., Hernández-Cordoba, M., and Pérez-Sirvent, C.:  Regenerative agriculture as a tool for combating climate change in semi-arid Mediterranean regions, EGU General Assembly 2025, Vienna, Austria, 27 Apr–2 May 2025, EGU25-13636, https://doi.org/10.5194/egusphere-egu25-13636, 2025.

EGU25-16383 | ECS | Posters on site | SSS9.12

AquaCrop assets and regional applications 

Louise Busschaert, Gabrielle De Lannoy, Dirk Raes, Shannon de Roos, Zdenko Heyvaert, Jonas Mortelmans, Samuel Scherrer, Maxime Van den Bossche, Sujay Kumar, Elias Fereres, Margarita Garcia-Vila, Pasquale Steduto, Theodore Hsiao, Lee Heng, Maher Salman, Jaemin Eun, Vincent Deketelaere, and Michel Bechtold

AquaCrop is a relatively simple crop model with a wide range of applications at the point, field, and regional to continental scales. Its four main assets, distributed by FAO (https://www.fao.org/aquacrop/en/), are: (i) the standard program with a graphical user interface (GUI), (ii) the open-source version-controlled Fortran90 code available on GitHub, (iii) the stand-alone programs for Windows, macOS, and Linux, and (iv) its integration into systems for efficient regional-scale modeling, satellite-based data assimilation, and climate impact simulations. Specifically, a parallelized Python wrapper is available to run the stand-alone program, and the Fortran90 code is integrated into NASA’s Land Information System Framework (LISF).

This poster introduces AquaCrop's four assets and focuses on two regional-scale applications in Europe. First, we demonstrate the use of the parallelized Python wrapper in the context of a climate impact study, where we evaluated current and future maize yields. AquaCrop simulations were performed at a coarse spatial resolution (0.5°) to assess future changes in yields, and yield gaps (difference between actual and potential yield, without stresses). Second, the use of AquaCrop within NASA’s LISF is presented through a data assimilation experiment, in which AquaCrop simulations were performed at a 0.1° resolution. A generic type of C3 crop was used over the entire domain, and the crop stage lengths were parametrized using the VIIRS global land surface phenology. The uncertainty in simulations was assessed by perturbing meteorological inputs and soil moisture in the upper soil layers. To correct plant water stress, SMAP-enhanced surface soil moisture observations (9-km resolution) were assimilated using an ensemble Kalman filter. Results highlight (i) the need for careful mapping between AquaCrop-simulated and satellite-retrieved soil moisture and (ii) how small updates in soil moisture can propagate to significant changes in biomass development.

How to cite: Busschaert, L., De Lannoy, G., Raes, D., de Roos, S., Heyvaert, Z., Mortelmans, J., Scherrer, S., Van den Bossche, M., Kumar, S., Fereres, E., Garcia-Vila, M., Steduto, P., Hsiao, T., Heng, L., Salman, M., Eun, J., Deketelaere, V., and Bechtold, M.: AquaCrop assets and regional applications, EGU General Assembly 2025, Vienna, Austria, 27 Apr–2 May 2025, EGU25-16383, https://doi.org/10.5194/egusphere-egu25-16383, 2025.

EGU25-16434 | ECS | Posters on site | SSS9.12

Assessing Water Retention Potential in Agricultural Drainage Systems in Lower Austria 

Katharina Fischer, Thomas Weninger, Abobakr Hussin, Thomas Brunner, and Peter Strauss

Agricultural drainage systems have been widely implemented to enhance crop productivity by managing excess water. However, with increasing weather extremes, including prolonged droughts and heavy precipitation, drained areas face new challenges, including the need for irrigation and a critical reassessment of water retention capabilities. Despite the importance of these systems, the extent of drained agricultural land in Austria, particularly in Lower Austria, remains largely unknown. Therefore, quantitative knowledge about the agrohydrological potential of drainage water management in the complex landscapes of Austria are urgently demanded.

This study aims to estimate the volume of water discharged through existing drainage infrastructure in agricultural regions of Lower Austria. By providing a foundational dataset, we seek to quantify the scale of drainage and evaluate its impact on soil water retention. The approach involves a two-step process. First, potentially drained agricultural areas are being identified by using existing resources such as the Austrian soil survey, cadastral soil assessments which provide spatial information on slope data, soil types, and land use.

Secondly, a raster-based water balance model is employed, using meteorological data and literature-based assumptions that attribute certain fractions of total runoff to drainage discharge. The model produces monthly estimates of drainage, emphasizing water retention beyond the vegetation period. These results are then upscaled to the identified drained areas.

Future repetitions of the model will incorporate increasing complexity, including detailed soil parameters and refined hydrological modelling techniques, such as the SWAP model. However, even initial estimations provide critical insights and serve as a starting point for understanding the interplay between drainage systems, water retention, and potential management strategies. This research underscores the importance of rethinking water management practices in agricultural systems to adapt to climate-induced challenges and improve sustainability.

How to cite: Fischer, K., Weninger, T., Hussin, A., Brunner, T., and Strauss, P.: Assessing Water Retention Potential in Agricultural Drainage Systems in Lower Austria, EGU General Assembly 2025, Vienna, Austria, 27 Apr–2 May 2025, EGU25-16434, https://doi.org/10.5194/egusphere-egu25-16434, 2025.

EGU25-16532 | Orals | SSS9.12

Soil management to mitigate climate change-related precipitation eXtremes - SoilX 

Annelie Holzkämper, Loraine ten Damme, Tommy D'Hose, Bano Mehdi-Schulz, Johannes Pullens, Heidi Leonhard, and Katharina Meurer and the SoilX researchers

With climate change, both drought and heavy precipitation are becoming more frequent. The EJPSOIL project SoilX investigated the possibilities to mitigate impacts of such extremes on crop productivity through improved soil management practices. To do that, we applied a multidisciplinaryresearch framework. Three methodological approaches were applied to derive complementary findings on the possibilities to alleviate impacts of increasingly frequent precipitation extremes on cropping systems in Europe through adaptations in soil and crop management: (1) sampling and measurement campaigns in long-term field experiments (LTE’s) along a north-south gradient through Europe, (2) simulation experiments with an ensemble of four agro-hydrological models and the development of a new model for dynamically simulating soil structural changes, and finally (3) socio-economic interviews within regional farming communities.

From the compiled results of this project, we conclude that while soil structural improvements have potential to buffer the effects of short-term droughts on crop productivity according to hypothetical agrohydrological simulation experiments. However, the adaptation benefits realized in the contrasting field treatments of LTE’s studied in this project (i.e. organic amendments / no-till vs. conventional management) are likely to be small under current and future climatic conditions as measured differences in physical, mechanical and hydraulic properties were mostly small. This can be explained by the fact that treatments implemented in current LTE’s are often conservative (i.e. relatively small differences between contrasting treatments; often only single and not combined measures are tested). This finding calls for the introduction of new LTE treatments with greater emphasis on soil health and climate resilience. The need for more efficient management strategies to maintain and improve these soil functionalities is clearly highlighted by the results from model-based studies of climate change impacts in SoilX: climate warming contributed to the degradation of soil organic carbon resources, potentially also leading to a deterioration of the soils’ ability to infiltrate water and to retain water in the crop root zone.

Based on analyses of farmer interviews across different LTE regions in Europe, we can say that, since viewpoints on and priorities in the selection of soil management choices differ, diverse strategies to promote the uptake of soil management improvements are likely to be most successful: farmers with a strong intrinsic motivation to maintain and improve soil functionalities are most likely to respond positively to educational measures and can best be supported by regulatory frameworks supporting flexibility in the choice of measures. Farmers with a stronger focus on economic and production targets, however, may better be addressed by information campaigns highlighting possibilities for reducing production cost and increasing yield benefits in combination with regulatory frameworks that buffer against economic risks and possible additional costs.

How to cite: Holzkämper, A., ten Damme, L., D'Hose, T., Mehdi-Schulz, B., Pullens, J., Leonhard, H., and Meurer, K. and the SoilX researchers: Soil management to mitigate climate change-related precipitation eXtremes - SoilX, EGU General Assembly 2025, Vienna, Austria, 27 Apr–2 May 2025, EGU25-16532, https://doi.org/10.5194/egusphere-egu25-16532, 2025.

EGU25-17079 | ECS | Orals | SSS9.12

How accurate are soil moisture profile sensors? – Results from a multi-sensor evaluation using a sandbox experiment  

Felix Nieberding, Johan Alexander Huisman, and Heye Reemt Bogena

Many precision farming applications rely increasingly on the near-real time provisioning of accurate root zone soil moisture measurements to enable the efficient and economical use of limited freshwater resources. Besides the established sensor manufacturers who have been around for decades, new companies are entering the market, often with a portfolio of sensors especially designed for agricultural applications. These so-called soil moisture profile sensors (SMPS) exhibit a high potential for agricultural use. Their elongated shape and the ability to measure simultaneously in different depths make them especially suitable for frequent changes of location as required during cultivation of field crops. These sensors measure the volumetric soil water content (VWC) by exploiting the highly different dielectric permittivity of the solid and liquid soil compounds.

I this study we use a sandbox experiment to determine the measurement accuracy of different SMPS under controlled moisture conditions. The sandbox is a 2 x 2 x 1.5 m container filled with well-characterized fine sand which is sealed watertight to all sides. The sandbox is equipped with a 20 cm drainage layer and the water level inside the sandbox can be controlled by pumping water in or out using piezometer tubes, which are open at the bottom in the drainage layer. The SMPS were installed into the sandbox and the measurements were compared against reference measurements using CS610 TDR probes connected to a TDR100 (Campbell Scientific) and SMT100 (TRUEBNER) measurements installed in triplicate at six different depths. The measurement accuracy of 10 different sensors were evaluated, with each sensor being tested in triplicate. Most SMPS performed with reasonable accuracy under very dry and very wet conditions. However, strong variation was observed with respect to slope, offset and spread of the measurements and non-linear behavior was observed with some SMPS in the intermediate soil moisture range. The high variability of the measurement accuracy (RMSE: 1.2 – 6.5 vol. %) highlights the importance of choosing a suitable sensor, especially for precision farming applications, where it is crucial to have accurate field data to make the best management decisions without the need for soil specific calibration.

How to cite: Nieberding, F., Huisman, J. A., and Bogena, H. R.: How accurate are soil moisture profile sensors? – Results from a multi-sensor evaluation using a sandbox experiment , EGU General Assembly 2025, Vienna, Austria, 27 Apr–2 May 2025, EGU25-17079, https://doi.org/10.5194/egusphere-egu25-17079, 2025.

EGU25-17505 | ECS | Orals | SSS9.12

From Vine to Wine: The Relationship Between Ecoclimatic Factors and Grape Yield in Italy 

Laura Massano, Benjamin Bois, Marielle Adrian, Giorgia Fosser, and Marco Gaetani

Viticulture is a key business for Italy, significantly contributing to the country's economy and cultural heritage. Italy is the largest world wine producer, with an estimated wine production of 41.0 mhL (2024 World Wine Production - OIV First Estimates). The relationship between climate variability and wine grape yield is a critical area of research, particularly considering ongoing climate change.

This study evaluates this relationship by employing ecoclimatic indices computed on key phenological periods that are crucial for grape development and specifically tailored to the life cycle of grapevines throughout the entire growing season. These periods have been identified using a validated phenological development model that accounts for various grape varieties. In addition to examining the effects of climate variability, this research also considers the risks posed by major cryptogamic diseases that can lead to significant crop losses.

To ensure the validity and relevance of the findings, the study actively engages with growers and obtains yield data from two prominent Italian wine consortia based in Lombardy and Tuscany. This localised approach allows the specific climatic and agronomic characteristics of each region to be considered, as well as the different grape varieties grown there.

The methodology developed correlates the ecoclimatic indices with the collected grape yield data through both single and multiple regression analyses, quantifying the proportion of total yield variability that can be explained by these predictors, both individually and in combination. The findings indicate that the ecoclimatic indices account for approximately 25% to 50% of the variance in grape yield.

By presenting a novel set of ecoclimatic indices derived from contemporary knowledge of climate impacts on grapevine development, this study contributes to filling a gap in the current research framework.

How to cite: Massano, L., Bois, B., Adrian, M., Fosser, G., and Gaetani, M.: From Vine to Wine: The Relationship Between Ecoclimatic Factors and Grape Yield in Italy, EGU General Assembly 2025, Vienna, Austria, 27 Apr–2 May 2025, EGU25-17505, https://doi.org/10.5194/egusphere-egu25-17505, 2025.

EGU25-18188 | Orals | SSS9.12

Tracking in-field progression of beet virus yellows using UAS remote sensing 

Toby Waine, John Beale, James Bell, Dion Garrett, Alistair Wright, Andrew Mead, and Taro Takahashi

Across Europe sugar beet farmers are experiencing unsustainable losses due the yield impact of beet virus yellows (VY). In 2020 losses of £43 M were experienced by UK growers, with some individual losses of more than £0.5 M. High forecasts of over 67% VY incidence without control measures, triggered the use of environmentally damaging neonicotinoid seed treatment in the UK for 2022 and 2023. Sustainable management of VY requires a better understanding the risk of virus transmission from adjacent fields and field margins into sugar beet crops by the aphids that are the main vector.

A time sequence of images of sugar beet fields were collected over several weeks using a multispectral drone camera, from which several spectral indices were calculated, including mNDblue. In the 2022 season, a sample of plants within a field were inoculated with disease. In 2023, two fields were allowed to become naturally infected, with additional field sampling to directly measure the rate of infection, the presence of aphids and plant species at locations in the crop and the field margin.

2022 was a high disease pressure year where the natural infection arrived soon after inoculation and spread rapidly throughout the whole field. The frequency of observations was such that it was impossible to temporally separate the introduced and natural infections, by remote sensing, through some differences were seen on one image date for some vegetation indices, but surprisingly not in the mean value of mNDblue, between the areas around the inoculation and control sites. However, the standard deviation of mNDblue index was found to be correlated with infection rate as measured by ground sampling (R2 ≈ 0.5). This finding was confirmed in 2023 – a low disease pressure year -at Morley (R2 ≈ 0.4).

The images, ground sampling and disease testing showed that there was no reservoir of infection in the field margins and that the aphid numbers and infection rates were lower near the field margins. The presence of oilseed rape adjacent to one field did not result in any clear difference in infection rate or pattern.

How to cite: Waine, T., Beale, J., Bell, J., Garrett, D., Wright, A., Mead, A., and Takahashi, T.: Tracking in-field progression of beet virus yellows using UAS remote sensing, EGU General Assembly 2025, Vienna, Austria, 27 Apr–2 May 2025, EGU25-18188, https://doi.org/10.5194/egusphere-egu25-18188, 2025.

EGU25-18241 | ECS | Posters on site | SSS9.12

Full-Bayesian multi-level models for crop phenology in Germany 

Friedrich Busch

Full-Bayesian multi-level models for crop phenology in Germany

Friedrich Busch – Potsdam Institute for Climate Impact Research

Effective adaptation of agriculture to climate change requires detailed insights into all components of the agricultural system. Understanding the phenological development of crops is crucial not only for making informed management decisions, such as the timing of fertilizer or pesticide application and harvest but also for assessing future weather-related risks. With climate change, the timing and duration of phenological phases are expected to shift, and the likelihood of weather extremes during these phases may increase. Therefore, comprehensive phenological models with robust representations of uncertainties are essential.
Most current phenological models rely primarily on temperature-driven development units to predict crop phenology while neglecting other potential predictors. Since phenological observations are often limited, data is typically pooled to obtain seemingly robust parameter estimates. This structural decision, in combination with neglect of input data uncertainty, can lead to overconfidence in parameter estimates.
Hierarchical Bayesian models can address these issues. By employing a multi-level interpretation of the data (partial pooling), parameter estimates for varying groups within the data can be improved. In phenological data, one critical group level is the cultivar level, which is often omitted due to the limited availability of such data. For historical phenological observations of maize grown in Germany, cultivar data is partially available. To maximize the use of this data and minimize bias caused by missing information, a data imputation scheme is applied to reconstruct missing cultivar data. Subsequently, a full Bayesian statistical phenology model is calibrated, incorporating cultivar information and individual farm location as hierarchical levels.
Since phenological observations are typically collected by the local farmers, based on visual judgment, considerable uncertainty is inherent in the data. Incorporating this uncertainty into the model structure allows for more realistic parameter estimates. Furthermore, enhancing the development unit concept by incorporating additional predictors, such as radiation and soil moisture alongside temperature, has the potential to reduce unexplained variance in the data.
Model comparison and evaluation of the trade-off between predictive power and complexity are conducted using information criteria such as WAIC and Pareto-smoothed importance sampling. This work builds on recent advances in hierarchical Bayesian phenological modeling, providing new insights into key driving factors and relevant model structures. The models are developed using the Stan programming language, optimized for Bayesian analysis, and employ state-of-the-art Bayesian parameter sampling algorithms. In conjunction with climate scenarios these models can be used to estimate future changes in the phenological development of crops.

How to cite: Busch, F.: Full-Bayesian multi-level models for crop phenology in Germany, EGU General Assembly 2025, Vienna, Austria, 27 Apr–2 May 2025, EGU25-18241, https://doi.org/10.5194/egusphere-egu25-18241, 2025.

EGU25-18905 | Posters on site | SSS9.12

Harmonization of functional anatomical traits at the leaf and wood levels in grapevine in response to different soil and canopy management 

Veronica De Micco, Francesca Petracca, Angela Balzano, Nicola Damiano, Andrea Vitale, Arturo Erbaggio, Ilia Savo Valente, Chiara Amitrano, Maks Merela, Chiara Cirillo, and Antonello Bonfante

In the Mediterranean region, viticulture is challenged by climate change which is increasing the frequency and severity of summer drought events. Under limited water availability conditions, controlling plant hydraulics and gas exchanges is crucial for crop productivity. Functional anatomical traits at the leaf and wood levels play a fundamental role in the capability of acclimation to environmental stresses. Thus, understanding how environmental factors and cultivation practices influence such traits is fundamental, given that they establish the limits of physiological acclimation capability.

Within this framework, this study aimed to evaluate if anatomical traits at the leaf and wood levels are differently harmonized when vines are cultivated under various treatments of soil and canopy management, with possible consequences on eco-physiological behavior, growth, and productivity. The study was conducted in a vineyard at the Feudi di San Gregorio winery premises (Southern Italy), where vines of the 'Greco' cultivar were cultivated under three treatments of soil management (cover crops, natural coverage, and soil tillage) and two types of canopy management (double guyot and double guyot flipped) over a period of three years. Leaf and wood anatomy were analyzed through light and epi-fluorescence microscopy to quantify functional anatomical traits linked with the efficiency of gas exchanges and water flow. To better interpret the relations among wood anatomical traits, inter- and intra-annual environmental variability, and cultivation management, the knowledge of the precise timing of wood formation is fundamental. Therefore, xylogenesis analysis was applied too, by collecting microcores biweekly from the main stem, in order to model wood growth dynamics and relate them to climate variables.

The overall data analysis showed the degree of plasticity of the ‘Greco’ cultivar at the structural level and suggested that the combination of traits at different organ levels may influence the vines’ response to climate change also mediated by pedo-climatic and cultivation conditions.

How to cite: De Micco, V., Petracca, F., Balzano, A., Damiano, N., Vitale, A., Erbaggio, A., Savo Valente, I., Amitrano, C., Merela, M., Cirillo, C., and Bonfante, A.: Harmonization of functional anatomical traits at the leaf and wood levels in grapevine in response to different soil and canopy management, EGU General Assembly 2025, Vienna, Austria, 27 Apr–2 May 2025, EGU25-18905, https://doi.org/10.5194/egusphere-egu25-18905, 2025.

Surface wetness (SW) is a particularly relevant variable for plant growers as it is related to the incidence of microbial and fungal diseases, as well as to fruit cracking, especially in susceptible species (e.g. Prunus avium). Although knowledge of SW quantity and duration is key to discern and predict its impact on plant health status, monitoring of this variable is still based on sensors of which the output is a simple electrical voltage, rather than a water amount. Furthermore, the intrinsic heterogeneity of canopy conditions seems to play a major role on leaf microclimate and SW.

The presented study analyzes i) the effects of radiative conditions (also affected by the presence of a rain exclusion covers) on the main structural factors affecting SW and SW duration on cherry leaves and ii) the ability of a Leaf Wetness capacitive Sensors (LWS) to represent SW on real leaves. Cherry leaves grown under 4 different environmental conditions (sunlit/shaded x covered/uncovered) were simultaneously artificially wetted to various degrees and their surface water content measured immediately or after variable drying times. The leaf growing conditions appeared to be strongly associated to some leaf structural properties, such as leaf angle, in turn influencing the SW amount and duration. Concerning the LWS, their output signal was first calibrated in respect to their actual SW. Following, the LWS ability to represent the nearby real leaves SW was analyzed. The ability of the LWS to represent real leaves largely depended on the growing conditions of the latter, highlighting the limitations related to using a single sensor type to represent canopy parts affected by intrinsic ecophysiological plasticity. The present analysis provides key findings to support assessments of microclimate, SW, SW duration and its variability on fruit trees, and in particular on cherry.

The study was funded by the PRIN CHOICE project (Optimizing CHerry physiOlogIcal performanCE through the correct choice of multifunctional covers).

How to cite: Reyes, F. and Destefanis, C.: Tree protection covers affects microclimate, leaf structural properties and the suitability of leaf wetness sensors to monitor surface wetness in cherry, EGU General Assembly 2025, Vienna, Austria, 27 Apr–2 May 2025, EGU25-18958, https://doi.org/10.5194/egusphere-egu25-18958, 2025.

EGU25-19576 | ECS | Posters on site | SSS9.12

Multi-Temporal Electrical Conductivity and NDVI Analysis for Vineyard Functional Zone Mapping 

Andrea Vitale, Filippo Accomando, Maurizio Buonanno, Rosario Gonzalez Cascón, and Antonello Bonfante

Precise soil spatial identification and characterization is crucial for optimizing vineyard management and enhancing grape quality. Various approaches exist for characterizing spatial soil variability, all aimed at zoning and identifying areas that, despite experiencing the same climate, exhibit different crop responses and therefore require differentiated management. However, the complexity of soil-plant interactions and the dynamic nature of soil properties over time necessitates the optimization of existing zoning methodologies. For instance, electrical conductivity (EC) mapping is a common technique, but relying on single-date measurements often fails to capture the full extent of spatial and temporal soil variability, even within a single growing season. Furthermore, commonly used electromagnetic induction (EMI) instruments operate at multiple frequencies to analyze different soil depths, making it challenging to directly relate these measurements to the specific soil volume explored by plant roots. Focusing on a well-defined soil depth, even if coarsely related to the root zone, would be more relevant for plant-soil interaction studies. Identifying the optimal period for characterizing soil spatial variability is therefore a key objective.

In this context, within the Agritech National Research Center project (https://agritechcenter.it/it/),  we study the use of multi-temporal EC data, acquired with a GF Instruments CMD MiniExplorer 6L, for delineating functional homogeneous zones within an Aglianico DOC vineyard at Tenuta Donna Elvira, Grottoni (AV), Italy. The CMD MiniExplorer 6L, capable of measuring EC at up to nine depths within 2 meters by combining its horizontal and vertical dipole configurations, provided detailed soil information.

EC data were collected over five distinct days spanning from April to late August, capturing seasonal soil moisture variations. Concurrently, multi-spectral imagery was acquired using a DJI Phantom 4 RTK drone across a broader timeframe from April to late October. Normalized Difference Vegetation Index (NDVI) values were derived from the drone imagery to assess canopy vigor and variability.

A k-means clustering approach was applied to the daily EC datasets, exploring various depth combinations to generate 36 distinct clustering outputs for each acquisition date. This multi-depth approach allowed for a comprehensive assessment of soil variability at different scales. The resulting EC-derived clusters were then compared with the mean NDVI values extracted for each cluster. This comparison aimed to evaluate the relationship between soil electrical properties and vine vigor, as reflected by NDVI.

The analysis revealed a strong correlation between EC-derived clusters and NDVI, demonstrating the effectiveness of EMI measurements for differentiating soil properties relevant to vineyard performance. The study also highlighted the influence of acquisition timing on the efficacy of soil classification, identifying optimal periods and depth configurations for maximizing the differentiation of functional zones. This multi-temporal, multi-depth approach provides valuable insights for precision viticulture, enabling targeted management practices based on spatially explicit soil and canopy information. The results contribute to a better understanding of soil-vine interactions and offer a practical methodology for efficient vineyard zoning.

How to cite: Vitale, A., Accomando, F., Buonanno, M., Cascón, R. G., and Bonfante, A.: Multi-Temporal Electrical Conductivity and NDVI Analysis for Vineyard Functional Zone Mapping, EGU General Assembly 2025, Vienna, Austria, 27 Apr–2 May 2025, EGU25-19576, https://doi.org/10.5194/egusphere-egu25-19576, 2025.

EGU25-19862 | ECS | Posters on site | SSS9.12

Photoperiod and Light Intensity Impact on Wild Edible Vegetables Performance: From Controlled Environment Agriculture to Crop Resilience 

Dimitris Papadimitriou, Chistina Moschou, Ioannis Louloudakis, Michael Sabathianakis, Ioannis Christoforakis, Ioannis Livas, Ioannis Daliakopoulos, and Thrassyvoulos Manios

Climate change and urbanisation imposes substantial challenges on the agricultural sector, leading to various environmental and food security impacts. At the same time, there is a growing demand for high-quality, year-round, fresh vegetables which drives water and natural resources overexploitation. To mitigate these pressures, high-intensity cultivation strategies such as hydroponics and controlled environment farming systems are becoming more popular. In this context, given their substantial nutritional and culinary properties, wild edible vegetables are receiving renewed attention. Considering this background, here we investigate the impact of (a) photoperiod and (b) light intensity on yield performance of the wild edible green Scolymus hispanicus L (Asteraceae), wild relative of the domesticated globe artichoke (Cynara cardunculus var. scolymus), in indoor cultivation. Four treatments were applied including (a) a long photoperiod (16 hours of light and 8 dark), (b) short photoperiod (8 hours of light and 16 dark), (c) a low light intensity (40 μmol m-2 s-1) and (d) high light intensity (240 μmol m-2 s-1), using LEDs (Samsung SMD2835, Honglitronics) at a distance of one meter above the crop. Treatments were conducted in four growth chambers with adjustable photoperiod and light intensity regimes and constant temperature and air humidity levels. In each growth chamber, 15 Scolymus hispanicus L. plants were transplanted into 10 L pots and arranged on 3 gutters at a density of 9 plants m-2. Plants were fertigated daily (modified Hoagland nutrient solution), each with an individual emitter at a flow rate of 0.4 - 0.7 L plant-1 day-1. Results indicate that long photoperiod treatment was associated with increased rosette diameter (59.9±1.8 cm), and root fresh and dry weight (31.35±2.19 and 3.65±0.4 g, respectively) while high light intensity treatment increased shoot fresh and dry weight (118.58±6.34 and 7.55±0.38 g, respectively) and edible root hardness-firmness (1288.72±32.47 g), 90 days after transplant. Based on these results, we conclude that photoperiod and light intensity optimal management can increase marketable yield and quality traits of the wild crop Scolymus hispanicus L., in soilless indoor farming systems.

This work is supported by Optimus project [Grant Agreement ATTΡ4-0356837] with the co-funding of Greece and the European Union.

Reference

Appolloni, Elisa, et al. "Beyond vegetables: effects of indoor LED light on specialized metabolite biosynthesis in medicinal and aromatic plants, edible flowers, and microgreens." Journal of the Science of Food and Agriculture 102.2 (2022): 472-487.

Bantis, F. Light Spectrum Differentially Affects the Yield and Phytochemical Content of Microgreen Vegetables in a Plant Factory. Plants 2021, 10, 2182.

Papadimitriou, Dimitrios M., et al. "Effect of moderate salinity on Golden Thistle (Scolymus hispanicus L.) grown in a soilless cropping system." Scientia Horticulturae 303 (2022): 111182.

Voutsinos-Frantzis, O.; Karavidas, I.; Liakopoulos, G.; Saitanis, C.; Savvas, D.; Ntatsi, G. Can Long Photoperiods Be Utilized to Integrate Cichorium spinosum L. into Vertical Farms? Biol. Life Sci. Forum 2023, 27, 8.

How to cite: Papadimitriou, D., Moschou, C., Louloudakis, I., Sabathianakis, M., Christoforakis, I., Livas, I., Daliakopoulos, I., and Manios, T.: Photoperiod and Light Intensity Impact on Wild Edible Vegetables Performance: From Controlled Environment Agriculture to Crop Resilience, EGU General Assembly 2025, Vienna, Austria, 27 Apr–2 May 2025, EGU25-19862, https://doi.org/10.5194/egusphere-egu25-19862, 2025.

EGU25-20555 | ECS | Posters on site | SSS9.12

Cultivar-Specific Responses of Sweet Potato Leaf Nutritional Quality to Nitrogen Application Rate and Water Availability 

Shalin Mano, David Sampson Issaka, Gopika Shibu, Shimon Rachmilevitch, and Zipora Tietel

Sweet potato (Ipomoea batatas) is an important crop with moderate tolerance to water stress. Understanding its antioxidant properties and nutritional content under various environmental stressors is vital for optimizing their nutritional value and resilience. Antioxidants like carotenoids, anthocyanins, and polyphenols are health benefits of sweet potatoes. Although previous studies have examined the nutritional components of sweet potato leaves and roots, comparative analysis of antioxidant activity and nutritional content among different cultivars under environmental stress conditions remains limited. Our study examined the antioxidant properties and nutritional content of three sweet potato cultivars, Georgia Jet, Jasmin, and Line 11-88 (recently released by LSU AgCenter) under various environmental stresses including Control (100% Nitrogen +100% water), Nitrogen stress (60% Nitrogen + 100% water), Drought stress (100% Nitrogen + 60 water), and the Combined stress of nitrogen and water (60% Nitrogen + 60% water). Nutritional content was quantified across cultivars and treatments in the leaves. Anthocyanin content varied significantly across cultivars and treatments. Jasmin had the highest response under both nitrogen and combined stresses, Line 11-88 highest under control, and Georgia Jet remained relatively low and stable across all treatments. Flavonoid content was not significantly affected by stress treatments but was higher in Georgia Jet and Jasmin compared to Line 11-88. Polyphenol content was highest in Jasmin under Control and Combined stress but remained consistent across treatments for Georgia Jet and is generally lower content for Line 11-88. The results suggest that Jasmin is the most promising cultivar in terms of antioxidant properties, making it a potential source of nutritional and functional food in sweet potato leaves.

This study explores how nitrogen and water availability variations impact sweet potato leaves' nutritional quality. Our study shows that nitrogen and water as limiting factors can cause an increase in the nutritional content of sweet potato leaves.

How to cite: Mano, S., Issaka, D. S., Shibu, G., Rachmilevitch, S., and Tietel, Z.: Cultivar-Specific Responses of Sweet Potato Leaf Nutritional Quality to Nitrogen Application Rate and Water Availability, EGU General Assembly 2025, Vienna, Austria, 27 Apr–2 May 2025, EGU25-20555, https://doi.org/10.5194/egusphere-egu25-20555, 2025.

EGU25-20724 | Orals | SSS9.12

Development of a selective molecularly imprinted polymer composite electrospun nanofiber sensor for a multifunctional platform for monitoring fruit tree health 

Fabrizio De Cesare, Fabricio Nicolas Molinari, Riccardo Valentini, Antonio Agresti, and Antonella Macagnano

Studying volatile compounds emitted by plants is crucial in modern agriculture, providing insights into plant health, environmental interactions, and crop management. Plant volatile organic compounds (PVOCs) act as chemical signals, facilitating communication with pollinators, herbivores, and beneficial microorganisms. Understanding PVOC dynamics helps decode plant phenology events (e.g., flowering, fruit ripening), nutritional deficiencies, stress responses, and defence mechanisms. Terpenes are a class of PVOCs emitted during distinct growth stages as well as abiotic and biotic stresses.

Monitoring PVOCs (terpenes) allows for early detection of nutrient shortages, pest infestations, and disease outbreaks, enabling targeted interventions that reduce fertiliser and pesticide use, ultimately minimising crop losses. By leveraging PVOC monitoring, farmers can optimise resource allocation, enhance crop yield and quality, and reduce environmental impact, thus promoting sustainable agroecosystem management.

The MOSSA project integrated sensor technologies into IoT-based digital platforms for plant health monitoring. This project developed distinct interconnected units for each platform:

- TREE Unit – Tracks plant physiological parameters, including water consumption, biomass growth, and leaf stability.

- VOC Unit – Detects PVOC (terpene) emissions from lemon trees to monitor stress-related emission patterns.

- Power Unit – Powers the multi-sensing platform through energy harvesting.

Two different nanotechnological approaches were hired to achieve the VOC Unit goal. Electrospinning (ES) is a key nanotechnology for developing ultra-sensitive sensors, offering advantages in production efficiency and costs. The potential of ES technology to generate nanofibrous networks with various architectures featuring excellent specific surface area and remarkable porosity was combined with the exceptional selectivity of molecular imprinting technology (MIT) characterised by typical biological recognition mechanisms (e.g. enzyme-substrate, antibody-antigene, biological receptors) to developing highly sensitive and selective VOC (terpene) sensors, specifically for limonene, a key biomarker of plant biotic and abiotic stress. These sensors demonstrated extraordinary specificity, even distinguishing between stereoselective compounds. The VOC Unit, which incorporated MIT/ES sensors for limonene detection, allowed real-time monitoring of emission dynamics from lemon trees under simulated stress conditions, such as drought and pest injuries. 

The Tree Unit monitored plant health by recording sap flow, tree growth, trunk temperature, air conditions, and incoming radiation under the canopy. Sap flow, a key indicator of transpiration and water status, was measured using heat transport as a tracer within xylem tissue. After laboratory evaluation, the HPV method was selected, using a 6-second heat pulse at ~4W power.

A 4-chip ASM Osram sensor spectrometer measured incoming radiation across 28 spectral bands. An infrared dendrometer tracked tree growth, while an improved radial increment sensor achieved 0.46 m resolution with an absolute error <10 µm. A hygrometer recorded air temperature and humidity.

The Power Unit utilised a solar energy module based on a 450 nm 3D perovskite light harvester (1.65 eV band gap)between ETL and HTL layers. The ETL, composed of compact and mesoporous TiO₂, supported crystal growth and enhanced charge extraction. This solar cell module efficiently harvested solar energy, ensuring a continuous power supply for the sensing platform.

These innovations open new possibilities for plant health monitoring, contributing to precision agriculture and enabling more sustainable and efficient agrosystem management.

How to cite: De Cesare, F., Molinari, F. N., Valentini, R., Agresti, A., and Macagnano, A.: Development of a selective molecularly imprinted polymer composite electrospun nanofiber sensor for a multifunctional platform for monitoring fruit tree health, EGU General Assembly 2025, Vienna, Austria, 27 Apr–2 May 2025, EGU25-20724, https://doi.org/10.5194/egusphere-egu25-20724, 2025.

EGU25-21214 | Posters on site | SSS9.12

Assessing Biowaste-based Amendments for Enhancing Soil Hydraulic Properties in Arid Mediterranean Soils 

Ioannis Daliakopoulos, Marios Gaitanakis, Menno Pietersen, Ioannis Louloudakis, Dimitrios Papadimitriou, Fenia Galliou, Xiaomei Yang, and Aristeidis Koutroulis

Soil organic matter (SOM) plays a significant role in modulating soil water and therefore irrigation scheduling. This relationship is especially vital in arid regions like the Mediterranean, where both SOM and water resources are scarce and increasingly threatened by the climate crisis. Soil amendments based on agricultural biowaste (e.g., compost) or byproducts of pre-existing processes (e.g., biochar) offer a cost-effective solution to boost SOM levels. However, because of this less strictly managed production process, the variability in their properties and their long-term effects on soil hydraulic behaviour, particularly after weathering, remain poorly understood. Here we compare the effect of 3 soil amendment treatments to the hydraulic properties of clay loam soil: olive tree pruning compost at 1% (C1B0), biowaste-based biochar from at 1% (C0B1), and compost-biochar mix at 1% (C1B1) against a control treatment (C0B0). Amendments were incorporated in the soil at the prescribed rates to a depth of 15 cm. To quantify the impact of the amendments in hydraulic properties of soil such as clay loam we use a modification of the hydraulic property (HYPROP2, Meter, USA) analyser (Daliakopoulos et al., 2021) after application, and 6 months after application. The assessed van Genuchten parameters are used to estimate the movement of water soil in the soil profile with HYDRUS-1D (Kool & Van Genuchten, 1991) using two distinct profiles. Simulations were validated through irrigation experiments using in-situ soil moisture measurements at 2 depths (10 and 30 cm). As shown by changes Van Genuchten parameters, results show that, compared to compost applications, biochar had a more pronounced and lasting positive effect regarding soil porosity and structure, also decreasing hydraulic conductivity and increasing field capacity. These results highlight the potential of biochar and it’s mixes to improve soil water status and contribute to the reversal of desertification processes in arid Mediterranean soils.

Acknowledgements

This work has received funding from REACT4MED: Inclusive Outscaling of Agro-Ecosystem Restoration Actions for the Mediterranean. The REACT4MED Project (grant agreement 2122) is funded by PRIMA, a program supported by Horizon 2020. MP was supported by ERASMUS+ KA131 mobility (ID 1174266). Authors IND and AK thank MINERVA Ltd. and research project “Assessment of climate change impacts on olive oil production and implementation of sustainable agricultural adaptation practices in Greece” for its support.

References

Daliakopoulos, I., Papadimitriou, D., & Manios, T. (2021). Improving the efficiency of HYPROP by controlling temperature and air flow. EGU General Assembly Conference Abstracts, EGU21--13082.

Kool, J., & Van Genuchten, M. T. (1991). HYDRUS: One-dimensional Variably Saturated Flow and Transport Model, Including Hysteresis and Root Water Uptake, Version 3.31. US Salinity Laboratory.


How to cite: Daliakopoulos, I., Gaitanakis, M., Pietersen, M., Louloudakis, I., Papadimitriou, D., Galliou, F., Yang, X., and Koutroulis, A.: Assessing Biowaste-based Amendments for Enhancing Soil Hydraulic Properties in Arid Mediterranean Soils, EGU General Assembly 2025, Vienna, Austria, 27 Apr–2 May 2025, EGU25-21214, https://doi.org/10.5194/egusphere-egu25-21214, 2025.

EGU25-21391 | Orals | SSS9.12 | Highlight

CAVA: a user-driven climate service for the assessment of risks in the agriculture sector 

Rodrigo Manzanas, Riccardo Soldan, Hideki Kanamaru, Daniel San Martín, Max Tuni, Iván Sánchez, Ezequiel Cimadevilla, Josipa Milovac, and José Manuel Gutiérrez


Climate change impacts agricultural production globally, affecting food security and economic development at all scales. The Climate and Agriculture risk Visualization and Assessment (CAVA) framework has been co-designed by the University of Cantabria, Predictia Intelligent Data Solutions and the Food and Agriculture Organization (FAO) of the United Nations in response to the need for evidence-based climate information in formulating climate change adaptation projects (e.g. Green Climate Fund) and investment plans in the agriculture sector. 

Within this framework, CAVA Platform has been designed as a climate service which provides users with an easy access to state-of-the-art climate information through a web portal, with the aim to facilitate the assessment of risks in the agricultural sector at regional, national, and sub-national scales. In particular, this is done based on global gridded observations, reanalysis, and the ensemble of CORDEX-CORE simulations covering the period up to 2100. The tool provides immediate access to essential climate variables (temperatures, precipitation, wind, humidity, radiation), and a series of pre-computed climate-derived indices relevant to agriculture (e.g., number of days below/above temperature thresholds, number and length of dry/wet spells, frequency and intensity of heat waves, etc.), allowing the user to select his/her region, period and season of interest. Moreover, users are also allowed to conduct more sophisticated analyses on demand; e.g. by modifying the thresholds that define the aforementioned indicators, focusing on specific crops, etc. In addition, all this information can be downloaded via automatic reports. 

Concurrently to the CAVA Platform, CAVA Analytics is a cloud-based service that allows users with basic programming skills to access, process, and visualize most of the data CAVA Platform builds on. This computing environment, which is available via a web browser, relies on a Jupyter hub with a pre-installed version of the R package CAVAanalytics (https://github.com/Risk-Team/CAVAanalytics), which internally builds on the climate4R (https://github.com/SantanderMetGroup/climate4R) suite. 

How to cite: Manzanas, R., Soldan, R., Kanamaru, H., San Martín, D., Tuni, M., Sánchez, I., Cimadevilla, E., Milovac, J., and Gutiérrez, J. M.: CAVA: a user-driven climate service for the assessment of risks in the agriculture sector, EGU General Assembly 2025, Vienna, Austria, 27 Apr–2 May 2025, EGU25-21391, https://doi.org/10.5194/egusphere-egu25-21391, 2025.

EGU25-21543 | Orals | SSS9.12

Agro-environmental Potential of Novel Organic Fertilizers Derived from Fishery Waste  

Jingsi Zhang, Çağrı Akyol, Hongzhen Luo, Stefaan De Neve, and Erik Meers

The application of novel organic fertilizers derived from secondary raw materials has emerged as a promising  sustainable agricultural practice in recent years. This study investigates the potential of organic fertilizers produced from fishery waste to be applied as alternatives for synthetic nitrogen (N) fertilizers through comprehensive soil incubation and pot experiments. The N content of eight selected organic fertilizers ranged from 1.9% to 9.8%, in which some of them were rich in labile N such as protein fractions and amino acids. In a 120-day incubation trial, six of these labile N-rich organic fertilizers demonstrated a superior mineralization rate of 49-66% compared to 10-35% for the other fertilizing products, showcasing a high concentration of readily degradable N fractions. This increased mineralization led to enhanced N availability for crop, which is crucial for short-term agricultural productivity. Remarkably, when applied to spinach at a fertilization rate of 170 kg N ha⁻¹, the tested organic fertilizers performed comparably to the synthetic fertilizer, resulting in similar yields and statistically non-significant differences in N use efficiency over two months of spinach growth. Additionally, a follow-up experiment assessed greenhouse gas emissions, especially N₂O, from soils amended with the fertilizers under high-water condition. Notably, solid organic fertilizers exhibited lower N₂O emissions (0.5%-2.0%) compared to the liquid ones (2.6%-4.5%) even when soil moisture content reached 70% of water-filled pore space, which in line with the previous field studies (Aguilera et al., 2013), where solid organic fertilizers emitted less N2O than the liquid organic fertilizers ). Overall, these circular fertilizers matched the N-supplying efficacy of synthetic fertilizers, offering a sustainable alternative. Notably, solid organic fertilizers outperformed the liquid ones in terms of N2O emissions, highlighting their potential for more environmentally friendly agricultural practices.


Keywords: fishery waste; organic fertilizer; nitrogen mineralization; greenhouse gas emissions


Reference

Aguilera, E., Lassaletta, L., Sanz-Cobena, A., Garnier, J., Vallejo, A., 2013. The potential of organic fertilizers and water management to reduce N2O emissions in Mediterranean climate cropping systems. A review. Agriculture, Ecosystems & Environment 164, 32-52.https://doi.org/10.1016/j.agee.2012.09.006.

How to cite: Zhang, J., Akyol, Ç., Luo, H., De Neve, S., and Meers, E.: Agro-environmental Potential of Novel Organic Fertilizers Derived from Fishery Waste , EGU General Assembly 2025, Vienna, Austria, 27 Apr–2 May 2025, EGU25-21543, https://doi.org/10.5194/egusphere-egu25-21543, 2025.

Afforestation is an efficient strategy used to promote soil organic carbon (SOC) sequestration. Though the effects of afforestation on SOC sequestration have been investigated worldwide, the underlying mechanisms remain to be further explored. We adopted a space-for-time approach by comparing maize field and plantation forest at a regional scale in subtropical China, and explored the mechanisms underlying the effects of afforestation on SOC sequestration. Amino sugars and lignin phenols were used as biomarkers to indicate soil microbial and plant residual carbon. SOC stock was significantly promoted 20 years after afforestation with an accrual rate of 301.7 ± 43.3 g C m-2 yr-1. According to the 13C mass balance method, new carbon contributed 28.9 ± 2.8% of SOC pool in the plantation forest with the contribution much higher in the topsoil than in the subsoil horizon. The turnover time of SOC was comparable across the soil profile from 0 to 45 cm depth with the average being 130.8 ± 26.6 years. Afforestation promoted particulate organic carbon (POC) content more pronouncedly in the topsoil than in the subsoil horizon, but promoted bulk SOC and mineral-associated organic carbon (MAOC) content similarly across the soil profile from 0 to 45 cm depth. In the topsoil, microbial residue played a key role in stimulating SOC accumulation following afforestation, with the roles of lignin and mineral protection being much minor. In the subsoil, the roles of microbial residue and mineral protection in stimulating SOC accumulation were comparable, with the role of lignin being minor. For both POC and MAOC accumulation following afforestation, the role of microbial residue was much higher than that of lignin or mineral protection. The findings demonstrate that microbes may play a key role in promoting soil carbon accumulation following afforestation in the subtropical region.

How to cite: Li, D.: Key role of microbes in promoting soil carbon accumulation following afforestation in a subtropical region, EGU General Assembly 2025, Vienna, Austria, 27 Apr–2 May 2025, EGU25-1230, https://doi.org/10.5194/egusphere-egu25-1230, 2025.

EGU25-1330 | ECS | Posters on site | SSS5.6

Carbon Sequestration and its Effects on Ecosystem Services and Human Welfare 

Neha G Paswan and Shray Pathak

A significant approach for reducing the effects of climate change is carbon sequestration, which is the process of absorbing and storing atmospheric carbon dioxide. The potential for carbon sequestration to lower greenhouse gas concentrations has significant effects on human welfare and ecological services. The present study was designed to assess carbon storage and sequestration by using the InVEST model in Chandigarh, India. The study highlights the effects of carbon sequestration on ecosystem services and human well-being. While increases in CO2 levels may boost crop yields, they pose significant risks to long-term climate stability. Enhancing carbon storage in an urban environment can notably improve air quality and mitigate climate change impacts. In addition, carbon sequestration has a critical role in soil formation and nutrient cycling, which is essential for maintaining ecosystem health. The findings reveal a significant increase in built-up areas and a reduction in green spaces despite regulations implemented by authorities. The InVEST model results indicate a decrease in carbon storage from 5.8 × 10⁵ Mg in 2013 to 4.9 × 10⁵ Mg in 2023. This shift resulted in a decline in carbon storage and negative carbon sequestration. Total carbon sequestration for this period was -8.2 × 10⁴ Mg, suggesting carbon emissions exceeded sequestration. Chandigarh experienced a notable decrease in green cover and agricultural land, with built-up areas increasing by 21% from 2013 to 2023. Further, economic analysis through net present value indicated a financial loss for the city due to higher carbon emissions outweighing sequestration. It advocates the implementation of participatory sensing to raise awareness and prioritize multifunctional landscapes, ensuring sustainable ecosystems and mitigating adverse effects on ecosystem services. The results emphasize the simultaneous use of carbon sequestration as a socioeconomic and environmental instrument, supporting a well-rounded strategy that gives equal weight to ecological sustainability and community well-being. The present study contributes to the larger conversation on sustainable urban development in India by offering helpful information to environmental stakeholders, politicians, and urban planners.

How to cite: Paswan, N. G. and Pathak, S.: Carbon Sequestration and its Effects on Ecosystem Services and Human Welfare, EGU General Assembly 2025, Vienna, Austria, 27 Apr–2 May 2025, EGU25-1330, https://doi.org/10.5194/egusphere-egu25-1330, 2025.

EGU25-1431 | ECS | Posters on site | SSS5.6

Modeling biochar effects on soil organic carbon on croplands in a microbial decomposition model (MIMICS-BC_v1.0) 

Mengjie Han, Qing Zhao, Wei Li, Ying-Ping Wang, Philippe Ciais, Haicheng Zhang, and Daniel S. Goll

Biochar (BC) application in croplands aims to sequester carbon and improve soil quality, but its impact on soil organic carbon (SOC) dynamics is not represented in most land models used for assessing land-based climate mitigation, therefore we are unable to quantify the effects of biochar applications under different climate conditions or land management. To fill this gap, here we implement a submodel to represent biochar into a microbial decomposition model named MIMICS (MIcrobial-MIneral Carbon Stabilization). We first calibrate and validate MIMICS with new representations of density-dependent microbial turnover rate, adsorption of available organic carbon on mineral soil particles, and soil moisture effects on decomposition using global field measured cropland SOC at 285 sites. We further integrate biochar in MIMICS by accounting for its effect on microbial decomposition and SOC sorption/desorption and optimize two biochar-related parameters in these processes using 134 paired SOC measurements with and without biochar addition. The MIMICS-biochar version can generally reproduce the short-term (≤ 6 yr) and long-term (8 yr) SOC changes after adding biochar (mean addition rate: 25.6 t ha-1) (R2 = 0.79 and 0.97) with a low root mean square error (RMSE = 3.73 and 6.08 g kg-1). Our study incorporates sorption and soil moisture processes into MIMICS and extends its capacity to simulate biochar decomposition, providing a useful tool to couple with dynamic land models to evaluate the effectiveness of biochar applications on removing CO2 from the atmosphere. 

How to cite: Han, M., Zhao, Q., Li, W., Wang, Y.-P., Ciais, P., Zhang, H., and Goll, D. S.: Modeling biochar effects on soil organic carbon on croplands in a microbial decomposition model (MIMICS-BC_v1.0), EGU General Assembly 2025, Vienna, Austria, 27 Apr–2 May 2025, EGU25-1431, https://doi.org/10.5194/egusphere-egu25-1431, 2025.

EGU25-2078 | Orals | SSS5.6

Harnessing massive application of lignocellulosic inputs to fallow and regenerated soils 

Joan Romanya, Llorenç Cerdà-Péczely, Evan A.N. Marcs, Johana González -Coria, Carolina Jaime-Rodríguez, Marina Pérez-Llorca, Neus Solà-Bosch, and Alejandro Pérez-Ferrer

Soil management practices have led to a generalized decarbonization of agricultural soils' organic matter and carbon contents. Whereas mulching application of large amounts of organic matter (OM) on the soil surface, the incorporation of massive amounts of organic matter into the soil profile (e.g. 40-120 m3 ha-1) has been much less common, and has only been studied in a limited capacity, with effects varying depending on soil type, climate and origin of the incorporated lignocellulosic material. Large amounts of carboniferous materials applied to soil can provoke nutritional disequilibria, and potential nutritional deficiencies for plants. However, it has been shown that sweet potato (Ipomea batatas) may be able to overcome N limitation, though the exact mechanism is not clear.

            In a field experiment in Catalonia, we applied an equivalent of 150 t ha-1 ramial chipped wood (RCW) simultaneously with sweet potato cultivation. The experiment was set up in two adjacent in arable fields with a cold semi-arid climate (yearly precipitation ~ 400 mm) with contrasting previous management: one field had been abandoned for 15 years, while the other had been managed with regenerative farming techniques including organic manure application, limited tillage, and green cover since 2006. RCW was applied in March, sweet potato was planted in May, and the plants were harvested in October. Using a combination of techniques including mass balances of C and N in fine earth and large (> 2 mm) organic fractions, plant nutritional analysis, and 15N stable isotope natural abundance method, we examined C and N dynamics in the soil and plant nutrition.

            RCW incorporation increased both C and N in the plots where applied (Figure). However, absolute and relative gains were much greater in the regenerated plots, and the recovered C and N was much greater in the regenerated plots. Sweet potato N nutrition was not seen to be influenced by soil chemical properties (N fractions), pointing to other non-identified nutrition sources. Sweet potato leaf 𝛿15N also changed dramatically between samplings (March and October), indicating a change in N source.

            These first results give some indications about the potential for rapid soil recarbonization in soils under different management and crop appropriateness to make this transition.                                                                                        


How to cite: Romanya, J., Cerdà-Péczely, L., Marcs, E. A. N., González -Coria, J., Jaime-Rodríguez, C., Pérez-Llorca, M., Solà-Bosch, N., and Pérez-Ferrer, A.: Harnessing massive application of lignocellulosic inputs to fallow and regenerated soils, EGU General Assembly 2025, Vienna, Austria, 27 Apr–2 May 2025, EGU25-2078, https://doi.org/10.5194/egusphere-egu25-2078, 2025.

EGU25-2248 | Orals | SSS5.6

Efficiency of plant biomass processing pathways for long-term soil carbon storage 

Sonja G. Keel, Alice Budai, Lars Elsgaard, Brieuc Hardy, Florent Levavasseur, Zhi Liang, Claudio Mondini, César Plaza, and Jens Leifeld

The potential for soil carbon (C) sequestration strongly depends on the availability of plant biomass inputs, making its efficient use critical for designing net zero strategies. Here, we compared different biomass processing pathways and quantified the long-term effect of the resulting exogenous organic materials (EOMs) on soil organic carbon (SOC) storage. We estimated C losses during feed digestion of plant material, storage of manure, composting and anaerobic digestion of plant material and manure, and pyrolysis of plant material based on literature values. Then we applied the widely used SOC model RothC with newly developed parameters to quantify SOC storage efficiency, i.e., accounting for both processing losses and decomposition losses, of the different EOMs. Based on simulations for a 39-year long cropland trial in Switzerland, we found that the SOC storage efficiency is higher for plant material directly added to the soil (16 %) compared to digestate and manure (3 % and 5 % respectively). For compost, the effect was less clear (2 % ̶ 18 %; mean: 10 %) due to a high uncertainty in C-losses during composting. In the case of biochar, 43 % of the initial plant C remained in the soil, due to its high intrinsic stability despite C-losses of 54 % during pyrolysis. To provide robust recommendations for optimal biomass use, additional considerations such as nutrient availability of EOMs, environmental impacts of soil application, and life cycle assessments for the entire production processes should be included.


How to cite: Keel, S. G., Budai, A., Elsgaard, L., Hardy, B., Levavasseur, F., Liang, Z., Mondini, C., Plaza, C., and Leifeld, J.: Efficiency of plant biomass processing pathways for long-term soil carbon storage, EGU General Assembly 2025, Vienna, Austria, 27 Apr–2 May 2025, EGU25-2248, https://doi.org/10.5194/egusphere-egu25-2248, 2025.

EGU25-3339 | ECS | Orals | SSS5.6

Sustainability of Irrigated Bioenergy Sorghum Across the Continental USA 

Sagar Gautam and Umakant Mishra

Agroecosystem models are widely used to predict the impacts of agricultural management practices and environmental changes on biomass yields, soil organic carbon (SOC) dynamics and greenhouse gas (GHG) emissions from bioenergy crops. Applying irrigation to bioenergy crops can enhance carbon capture and storage but may also increase the net GHG emissions of produced biomass and bioenergy. The specific objectives of our study were to i) predict biomass yield, soil carbon changes, and GHG emissions of bioenergy sorghum under different irrigation scheduling across cultivated lands in the continental US, and ii) identify economically optimal, location-specific irrigation treatments for Sorghum cultivation in US. Using multi-location yield data of Sorghum, the process-based agroecosystem model DAYCENT was calibrated, validated, and employed to simulate biomass yield, GHG emissions, and changes in SOC. The DAYCENT model were setup at a 4-km grid scale across the continental US. Long-term weather data, including at least 30 years of temperature and precipitation records, were obtained from the nearest National Oceanic and Atmospheric Administration weather stations. Soil data, including major soil properties were extracted from the SSURGO database by defined soil layers. The model was calibrated using Sorghum yield and SOC data, and further work is under progress to analyze the impacts of irrigation and conduct suitability analysis. Further results including the assessment of irrigated biomass productivity and the economic sustainability of irrigated bioenergy cropping systems will be presented during the meeting. 

How to cite: Gautam, S. and Mishra, U.: Sustainability of Irrigated Bioenergy Sorghum Across the Continental USA, EGU General Assembly 2025, Vienna, Austria, 27 Apr–2 May 2025, EGU25-3339, https://doi.org/10.5194/egusphere-egu25-3339, 2025.

EGU25-3455 | Posters on site | SSS5.6

Soils as CO2 sinks? - The importance of dynamic disequilibria in soil systems 

Michael Sommer and Marisa Gerriets

Climate and land-use change induce dynamic disequilibrium in C cycling (Luo & Weng TREE 2011) as does soil erosion (Doetterl et al. ESR 2016) and soil meliorations, e.g. deep tillage (Alcantara et al. GCB 2016, Schiedung et al. GCB 2019). The effect of disequilibria on decadal  trends of SOC in arable soils is demonstrated in controlled, long-term field experiments, which include desurfacing as well as meliorative fractional deep tillage (mFDT). Our results show that soil systems well below equilibrium state induce a fast, significant and sustainable CO2 sink effect. Especially mFDT offers a realistic, practical option for 4p1000 as it increases crop yields and soil fertility in arable soils simultaneously.

How to cite: Sommer, M. and Gerriets, M.: Soils as CO2 sinks? - The importance of dynamic disequilibria in soil systems, EGU General Assembly 2025, Vienna, Austria, 27 Apr–2 May 2025, EGU25-3455, https://doi.org/10.5194/egusphere-egu25-3455, 2025.

Forestation is regarded as an effective strategy for increasing terrestrial carbon sequestration. However, its carbon sink potential remains uncertain due to the scarcity of large-scale sampling data and limited knowledge of the linkage between plant and soil C dynamics. Here, we conduct a large-scale survey of 163 control plots and 614 forested plots involving 25304 trees and 11700 soil samples in northern China to fill this knowledge gap. We find that forestation in northern China contributes a significant carbon sink (913.19±47.58 Tg C), 74% of which is stored in biomass and 26% in soil organic carbon, while soil inorganic carbon contributes minimally. Further analysis reveals that the biomass carbon sink increases initially but then decreases as soil nitrogen increases, while soil organic carbon significantly decreases in nitrogen-rich soils. A tradeoff between organic carbon (biomass + soil organic carbon) and inorganic carbon dynamics is also observed along water gradient. These results highlight the importance of incorporating plant and soil interactions, modulated by nitrogen and water supply in the calculation and modelling of current and future carbon sink potential.

How to cite: Hong, S. and Song, Y.: Tradeoffs between soil and plant carbon sink after forestation along water and nitrogen gradients, EGU General Assembly 2025, Vienna, Austria, 27 Apr–2 May 2025, EGU25-4926, https://doi.org/10.5194/egusphere-egu25-4926, 2025.

EGU25-5420 | Posters on site | SSS5.6

Humic Acid-Driven Soil Stability and Nutrient Absorption: Comparing Organic and Synthetic Fertilization in Maize Production 

Jeonggu Lee, Sihyun Park, Na- Hyun Kwon, Chang-dong Lee, Taehyeon Kim, and Jaeeun Jung

Soil organic matter (SOM) plays a pivotal role in enhancing soil's physical and biological properties, contributing to improved crop productivity and long-term agricultural sustainability. Among the components of SOM, humic acid (HA) is particularly important due to its capacity to enhance soil structure and promote nutrient availability. While previous studies have primarily focused on the impact of naturally derived HA on soil properties, this study investigates the effects of HA on soil aggregation and stability under different fertilizer regimes. The experiment was conducted during the summer cropping season with maize (Zea mays L.) grown under both organic and synthetic fertilizer treatments. The organic fertilizer treatment involved the incorporation of barley (Hordeum vulgare L.) and hairy vetch (Vicia villosa R.) residues five days prior to maize cultivation, whereas the synthetic fertilizer treatment applied recommended rates of NPK fertilizers in accordance with Korean agricultural guidelines. Results showed that the organic fertilizer treatment significantly improved soil aggregation and stability, as indicated by the mean weight diameter (MWD) of soil aggregates (p < 0.05), compared to the synthetic fertilizer treatment. This enhancement was largely attributed to the increased quantity and quality of HA derived from organic inputs. The organic treatment yielded nearly double the amount of HA compared to the synthetic treatment. Additionally, the organic treatment demonstrated a 140% increase in MWD and a 40% higher total phenolic content than the synthetic counterpart. Furthermore, maize cultivated under organic treatments exhibited significantly higher macronutrient absorption (p < 0.001), an 11% increase in above-ground biomass, and a 21% increase in grain yield compared to synthetic fertilizer treatments. These findings suggest that the incorporation of fresh organic residues can effectively enhance HA characteristics in soil, thereby improving soil structure and promoting sustainable crop productivity.

How to cite: Lee, J., Park, S., Kwon, N.-H., Lee, C., Kim, T., and Jung, J.: Humic Acid-Driven Soil Stability and Nutrient Absorption: Comparing Organic and Synthetic Fertilization in Maize Production, EGU General Assembly 2025, Vienna, Austria, 27 Apr–2 May 2025, EGU25-5420, https://doi.org/10.5194/egusphere-egu25-5420, 2025.

EGU25-5775 | ECS | Orals | SSS5.6

Is Backfilling a Sustainable Alternative to Reduce CO2 Emissions from Swiss Degraded Peatlands? 

Ciriaco McMackin, Luisa Minich, Stéphane Burgos, Frank Hagedorn, Guido Lars Bruno Wiesenberg, and Markus Egli

Peat soils in Western Europe play a crucial role in carbon storage and agriculture. However, these two functions are often incompatible, as draining of peatlands, to convert them into agricultural land, leads to emissions of stored carbon, turning these carbon reservoirs into significant carbon sources. In the Three Lakes region of Switzerland, peatlands have been drained for agriculture for the last about 100–150 years. While drainage has improved agricultural use of these peatlands, it has also accelerated peat decomposition, leading to the loss of more than 2 meters of peat thickness and causing substantial CO2 emissions.

Currently, there are no effective and sustainable measures to regenerate peatlands, aside from reflooding. In Switzerland, backfilling has emerged as an alternative approach to potentially reduce CO2 emissions without ceasing agricultural activities. Backfilling involves the deposition of mineral material from various sources onto the soil to disconnect the peat from the surface, thereby maintaining agricultural production while protecting the already degraded organic soils.

This method has been used for over 50 years in the region to improve access for machinery in areas prone to waterlogging caused by peat mineralization, but little research has been conducted on its long-term effects on the carbon cycle or overall soil functioning. With this study, we aim at better understanding the impact of backfilling on the carbon cycle in managed peatlands. To achieve this, we measured CO2 emissions and their radiocarbon content (14CO2) at three locations in the Three Lakes region to assign the source of the respired organic C. In addition, the quality (DRIFT) of soil carbon from drained and drained-backfilled peat soils was determined.

Initial summer measurements showed that CO2 emissions were over 40% higher in drained peatlands compared to their backfilled counterparts. The 14C content of the carbon respired also differed, with older carbon released from the original peatlands (up to -193 ‰, indicative of ~ 1,500 years) than from the backfilled sites (up to -115 ‰, ~ 800 years). Incubation experiments revealed that CO2 emissions predominantly originated from deeper horizons (>40 cm), which were richer in carbon and less degraded. Comparing the original drained peat to the peat buried beneath the backfilling, we observed lower carbon content and fewer easily degradable compounds in the buried peat. Compounds such as aliphatics were largely replaced by more resistant materials, like phenolics. The difference in emissions is then, primarily attributed to the quality and quantity of the remaining carbon, which is mainly dependent on the state of peat degradation at the time the backfilling was implemented. These findings highlight the critical role of the quality and quantity of the remaining carbon stock in this system. While backfilling may help reduce CO2 emissions by altering carbon availability in peat soils, it cannot fully stop the degradation process. Further research is needed to investigate spatio-temporal variability, potential peat compaction, and the influence of factors such as the groundwater table and the composition of the mineral layer.

How to cite: McMackin, C., Minich, L., Burgos, S., Hagedorn, F., Wiesenberg, G. L. B., and Egli, M.: Is Backfilling a Sustainable Alternative to Reduce CO2 Emissions from Swiss Degraded Peatlands?, EGU General Assembly 2025, Vienna, Austria, 27 Apr–2 May 2025, EGU25-5775, https://doi.org/10.5194/egusphere-egu25-5775, 2025.

EGU25-6100 | Orals | SSS5.6

Soil carbon sequestration after afforestation of former cropland: oak and Norway spruce chronosequences repeatedly sampled after 13 and 22 years 

Lars Vesterdal, Yamina Micaela Rosas, Carsten Werner Mueller, and Ming Yu

Afforestation of agricultural land is one of the main nature-based solutions to reduce emissions of CO2 to the atmosphere while possibly increasing soil carbon (SOC) stocks. However, information on high-resolution temporal dynamics in SOC are scarce. SOC sequestration after afforestation of former cropland has commonly been studied by the chronosequence approach. The advantage of such space-for-time substitution for estimating slow SOC change processes must be balanced against the spatial variation introduced. However, no previous studies extended the chronosequence approach with multiple repeated inventories for comparison and validation of observed SOC dynamics.

We conducted a long-term combined chronosequence/resampling study in a former cropland area afforested with oak (Quercus robur) and Norway spruce (Picea abies) over the past 50 years. Soil sampling was carried out in 1998, 2011 and 2022 in the same oak and spruce afforestation chronosequences to reveal inferred and true temporal trends in forest floor and mineral soil SOC to 25 cm depth. Sampling in adjacent cropland and a 200-year-old forest served as references for the overall SOC sequestration rates. The C sequestration in woody biomass was quantified to estimate the contribution of SOC stocks to ecosystem C sequestration. The objective was to study the decadal patterns in post-agricultural SOC change in afforested oak and Norway spruce by i) comparing chronosequence trends in forest floor and top mineral soil C stocks within and across the three sampling campaigns, ii) quantifying current rates of SOC stock change at stand level based on multiple sampling campaigns.

Forest floor C stocks followed a non-linear trend and levelled off after about 30 years towards 8.6 ± 1.2 Mg C ha-1 for spruce and 3.4 ± 0.9 Mg C ha-1 for oak. The chronosequence trajectory was largely validated by resampling, and decadal rates of forest floor C sequestration approached 0 after about 40 years. Chronosequence trends in topsoil SOC were similar for oak and spruce and increased across the three inventories by 0.29 ± 0.05 Mg C ha-1 yr-1 to a C stock equivalent to 75% of that in the 200-year-old forest after about 50 years. However, there was no detectable topsoil SOC change along the three chronosequences based on individual inventories. Repeated sampling revealed further temporal and species-specific dynamics. SOC sequestration rates in the periods 1998-2011 and 2011-2022 were positive in most stands, and particularly increased with stand age in the spruce stands older than 20 years. Norway spruce also sequestered most C in biomass.

We conclude that contrasting temporal change in forest floor and mineral soil C sequestration rates indicates a shift in C source-sink strength over 50 years. Three decades of forest floor C sequestration is shifted to increasing mineral soil C sequestration, and sequestration rates in both soil compartments were greater in Norway spruce than in oak. The chronosequence approach across all three inventories provided the best estimate of mineral soil C trajectories since afforestation, but repeated sampling revealed significant stand- and species-specific dynamics in soil C change even within a homogeneous former cropland area.


How to cite: Vesterdal, L., Rosas, Y. M., Mueller, C. W., and Yu, M.: Soil carbon sequestration after afforestation of former cropland: oak and Norway spruce chronosequences repeatedly sampled after 13 and 22 years, EGU General Assembly 2025, Vienna, Austria, 27 Apr–2 May 2025, EGU25-6100, https://doi.org/10.5194/egusphere-egu25-6100, 2025.

EGU25-6221 | ECS | Orals | SSS5.6

Assessing carbon sequestration along a natural carbon gradient impacted by short-term drought  

Sigrid Trier Kjær and Peter Dörsch

Carbon sequestration in soils has been proposed as a strategy to mitigate greenhouse gas emissions in the agricultural sector. However, there is still much uncertainty regarding how carbon is sequestered and accumulated in soils. We conducted a six-month soil incubation study amended with 13C-labelled plant litter to investigate carbon sequestration along a hillslope in southeast Norway. The field, cultivated with cereals, exhibits a natural gradient in soil organic matter (SOM) content, pH and soil moisture. Eight rain exclusion shelters (excluding ~50% of the rain) were installed along the gradient for four months, after which soils were sampled to investigate the impact of soil conditions and short-term drought on carbon sequestration. Carbon and nitrogen contents, as well as stable isotope ratios, were measured in bulk soil and in particulate organic matter/mineral-associated organic matter fractions at both the beginning and the end of the incubation. 13C-CO2 was measured continuously throughout the incubation and used for allocating 13C to a two-pool model. Exoenzymatic activity was also measured to provide insights into nutrient cycling in the soil. Litter decomposition was found to be highest in soils with low SOC, high pH and low moisture.

How to cite: Kjær, S. T. and Dörsch, P.: Assessing carbon sequestration along a natural carbon gradient impacted by short-term drought , EGU General Assembly 2025, Vienna, Austria, 27 Apr–2 May 2025, EGU25-6221, https://doi.org/10.5194/egusphere-egu25-6221, 2025.

EGU25-6311 | ECS | Posters on site | SSS5.6

Can secular stable soil organic carbon be isolated? An assessment of Zimmermann fractionation using a long-term bare fallow. 

Amicie Delahaie, Valérie Pouteau, Cédric Plessis, and Claire Chenu

The “42 plots of Versailles” site is a long-term bare fallow established in 1928. Over the course of almost 100 years, these plots have been carefully maintained without vegetation and enriched annually with various fertilizers and amendments (16 types x 2 replicate plots + 10 control plots), and sampled throughout the period. In particular, the control plots offer the opportunity to use elemental analysis to monitor the kinetics of soil organic carbon (SOC) evolution in the absence of carbon inputs.

Zimmermann fractionation (Zimmermann et al., 2007, DOI : 10.1111/j.1365-2389.2006.00855.x) is a granulo-densimetric separation protocol that separates SOC into 5 fractions: dissolved organic carbon (DOC), coarse particles > 63 µm consisting of particulate organic matter (POM) and “heavy” coarse matter containing sand and aggregates (S+A), and fine particles < 63 µm consisting of oxidation-sensitive fine fraction (sSOC) and oxidation-resistant organic matter (rSOC).

These 5 fractions are expected to have distinct mean residence times; in particular, the rSOC fraction is seen as a stable fraction, with aged carbon whose quantity changes little or not at all over time; conversely, the POM fraction is composed of very labile carbon. When applying this fractionation to control samples from the 42 plots at different times, we therefore expect to see strong variations in the size of the labile compartments, and on the contrary very little variation in the stable compartments.

In this study, we compare the results of this fractionation on 5 control plots at various dates (notably at the start of the experiment in 1929; at the present in 2021, which is the latest sampling date; and intermediate dates), in order to verify whether Zimmermann fractionation is indeed capable of separating SOC fractions with very distinct kinetics.

How to cite: Delahaie, A., Pouteau, V., Plessis, C., and Chenu, C.: Can secular stable soil organic carbon be isolated? An assessment of Zimmermann fractionation using a long-term bare fallow., EGU General Assembly 2025, Vienna, Austria, 27 Apr–2 May 2025, EGU25-6311, https://doi.org/10.5194/egusphere-egu25-6311, 2025.

EGU25-6738 | ECS | Orals | SSS5.6

High-C/N straw inputs lead to higher mineral association organic matter than low-C/N straws 

Xiaofang Ji, Gilles Colinet, and Wenting Feng

The formation of mineral-associated organic matter (MAOM) from plant litter decomposition is pivotal for climate change mitigation. However, the way in which plant litter of varying qualities influences MAOM formation and decomposition, particularly regarding the quantity of litter inputs, remains largely unclear. This study aimed to determine how the quality (C/N) of straw (low-quality (high-C/N) wheat (Triticum aestivum L.) versus high-quality (low-C/N)  milk vetch (Astragalus sinicus L.)) and its quantity (input level) affect MAOM formation and decomposition. We conducted a 420-day laboratory incubation experiment using low-quality wheat versus high-quality milk vetch straws added to artificial soil (pure quartz vs. soil with reactive minerals (sandy soil: 5% clay, 10% silt, and 85%)) at input levels of 0, 3, 6, 18, 26, 31, and 35 g C kg-1 soil. Contrary to the Microbial Efficiency-Matrix Stabilization theory, our research indicates that adding high-C/N (low-quality) wheat straw addition led to a significantly greater MAOM content than milk vetch. Notably, the MAOM stabilization efficiency declined at high input levels (26, 31, and 35 g C kg-1 soil) for wheat than for milk vetch. This is further supported by the evidence that reactive minerals slowed the decomposition rate of high-C/N (low-quality) wheat straw more effectively than that of low-C/N (high-quality) milk vetch. Moreover, the lower C:N ratio of the MAOM fraction, the reduced C:N ratio of dissolved organic matter (DOM), and a higher fluorescence index of DOM (higher values indicating greater contribution of microbial sources) after adding wheat straw than adding milk vetch straw suggest the significant role of plant-derived organic matter in MAOM formation. Our findings disclose that reactive minerals preferentially protect high-C/N (low-quality) litter over low-C/N (high-quality) litter through direct interaction with plant-derived organic matter, providing a critical pathway for MAOM formation distinct from microbial assimilation. This study highlights the key role of high-C/N (low-quality) straw in the efficient and long-term stabilization of soil C within agricultural practices.

How to cite: Ji, X., Colinet, G., and Feng, W.: High-C/N straw inputs lead to higher mineral association organic matter than low-C/N straws, EGU General Assembly 2025, Vienna, Austria, 27 Apr–2 May 2025, EGU25-6738, https://doi.org/10.5194/egusphere-egu25-6738, 2025.

EGU25-6864 | ECS | Posters on site | SSS5.6

Cost-Effective Maize Stover Biochar Production for Enhanced Soil Carbon Sequestration 

Barira Shoukat Hafiza, Sobia Bibi, Wolfgang Wanek, Magdeline Vlasimsky, Jason Mitchell, Mariana Rabello, Maria Heiling, Arsenio Toloza, Gerd Dercon, and Jonathan Burnett

Biochar, a stable carbon(C)-rich material produced via biomass pyrolysis under oxygen-limited conditions, has become a topic of increasing scientific interest for its potential to improve soil health and sequester carbon, thereby contributing to climate change mitigation. Maize stover, a globally abundant and often underutilized agricultural byproduct, represents a promising feedstock for biochar production, facilitating waste reduction and soil improvement. However, a deeper understanding of the dynamics of maize-based biochar in soil, including its C storage potential, stability, and effect on nutrient cycling, is crucial for optimizing its application in sustainable agricultural practices. This study aimed to develop a cost-effective, highly C-efficient and accessible laboratory-scale biochar production method using readily available porcelain crucibles and a high-temperature muffle oven, with the goal of applying it to 13C-labelled maize stover for the creation of 13C-labelled biochar.

Maize stover was pyrolyzed at temperatures ranging from 250 °C to 550 °C (in 50 °C increments) for 1 hour. The impact of temperature on biochar recovery rate, pH, electrical conductivity, and molecular stability via mid-infrared spectroscopy (MIRS) was investigated. Results showed that the biochar recovery rate decreased with increasing temperature, stabilizing at ~30% at higher temperatures (>500 °C). Biochar pH increased with temperature, reaching pH ~11 and  suggesting potential implications for soil acidity amelioration. MIRS analysis indicated optimal biochar stability at around 500 °C, crucial for long-term C sequestration, based on maximized aryl-C (C=C) absorption at 1620–1540 cm−1, minimized aliphatic C (C-H), and reductions in C=O stretching (1650–1800 cm−1) and O-H stretching (3000–3200 cm−1). Minimal variation among replicates highlights the method's high reproducibility and reliability for standardized lab-scale biochar production and comparative studies of biochar stability and soil interaction.

Further analysis, including elemental composition (C, N, H, and O), is underway to characterize the produced biochar and validate these findings. Based on these findings, the Soil and Water Management and Crop Nutrition (SWMCN) Laboratory team prepared a stable C isotope-labelled (13C) maize stover for biochar production. Utilizing 13C-labelled maize stover as feedstock will enable precise tracking of biochar-derived C in the soil, offering valuable insights into its fate and role in soil C dynamics. This isotopic labelling approach will enhance the understanding of biochar’s role in soil C cycling and support the development of evidence-based sustainable and climate-smart agricultural practices.

How to cite: Hafiza, B. S., Bibi, S., Wanek, W., Vlasimsky, M., Mitchell, J., Rabello, M., Heiling, M., Toloza, A., Dercon, G., and Burnett, J.: Cost-Effective Maize Stover Biochar Production for Enhanced Soil Carbon Sequestration, EGU General Assembly 2025, Vienna, Austria, 27 Apr–2 May 2025, EGU25-6864, https://doi.org/10.5194/egusphere-egu25-6864, 2025.

EGU25-6891 | ECS | Orals | SSS5.6 | Highlight

Changes in soil organic carbon stocks and quality on a national scale – Decadal trends of the German Agricultural Soil Inventory 

Marcus Schiedung, Laura Sofie Harbo, and Christopher Poeplau

Understanding changes of soil organic carbon (SOC) contents is important to estimate the role of soils as emission sinks or sources. Agricultural land use has led to substantial losses of SOC and recent projections indicate continuous decreases on a European scale, while main drivers remain elusive. The German Agricultural Soil Inventory is currently resampling around 3,000 sites to determine decadal SOC changes. Here we present the trends in SOC stocks of the first 800 analysed sites. We identified significant losses of SOC stocks in cropland and grassland soils by approximately 4% in the upper half meter. Most SOC was lost from overall carbon rich soils. Our analysis will extend to the role of past land use changes and management to identify key drivers of SOC dynamics. In addition, mid-infrared spectroscopy will be used to explore the role of SOC quality and composition for determining the decadal SOC changes. Recently, we used compositional information, for example the relative composition of aliphatic to aromatic compounds, to identify SOC change direction at land-use change sites. A large spectral library is being built to extend this approach to the national Soil Inventory and thereby improve our biogeochemical understanding of bulk SOC trends and establish new indicators of such.

How to cite: Schiedung, M., Harbo, L. S., and Poeplau, C.: Changes in soil organic carbon stocks and quality on a national scale – Decadal trends of the German Agricultural Soil Inventory, EGU General Assembly 2025, Vienna, Austria, 27 Apr–2 May 2025, EGU25-6891, https://doi.org/10.5194/egusphere-egu25-6891, 2025.

EGU25-8176 | Orals | SSS5.6

Soil mesofauna increases the persistence of soil carbon in agriculturally managed soils under ambient and future climates 

Gerrit Angst, Lisa Hinkelthein, Martin Schädler, Alfred Lochner, Stefan Scheu, and Nico Eisenhauer

Soil fauna can have strong effects on the formation and persistence of soil organic matter (SOM). However, whether these effects are consistent across land uses and modulated by climate change remains unknown. Moreover, experiments on faunal taxa other than earthworms are very scarce.

We thus performed litterbag exclusion experiments in the Global Change Experimental Facility, Germany, in two land uses (agriculture/grassland) and two climate treatments (ambient/future). Litterbags accessible to either macro-, meso-, and microfauna, meso- and microfauna, or microfauna only were filled with soil and 13C-labeled maize litter and incubated in replicated plots for ~4 months. At the end of the experiment, we fractionated the soils into less (particulate organic matter) and more persistent (mineral-associated organic matter) SOM, and performed elemental and isotopic analyses.

Our results indicate that the conversion of litter into more persistent SOM was fostered in treatments accessible to meso- and macrofauna but not in those accessible to microfauna only, with this effect being most pronounced for the treatments accessible to mesofauna. Processes such as feces production by earthworms and springtails, which dominated the sites, could have fostered the formation of persistent SOM via stimulating microbial growth and necromass production, which is enriched in persistent SOM. This effect was insensitive to climate change and only perceivable in agriculturally managed soils, in which faunal abundance was lower than in grassland soils. These findings highlight mesofauna as strong regulators of SOM persistence, indicate density-dependent, positive effects of soil fauna on SOM persistence, and hint to a partial insensitivity of these effects to future climates.

How to cite: Angst, G., Hinkelthein, L., Schädler, M., Lochner, A., Scheu, S., and Eisenhauer, N.: Soil mesofauna increases the persistence of soil carbon in agriculturally managed soils under ambient and future climates, EGU General Assembly 2025, Vienna, Austria, 27 Apr–2 May 2025, EGU25-8176, https://doi.org/10.5194/egusphere-egu25-8176, 2025.

EGU25-8320 | ECS | Orals | SSS5.6

The Effect of Biological Decomposers on Soil Carbon Sequestration to Mitigate Soil Degradation 

Tetiana Khomenko, Valentyna Bolokhovska, Vladyslav Bolokhovskyi, Arkadii Lunhul, Mykhailo Zhurba, Dmytro Yakovenko, Yaroslava Bukhonska, and Vira Boroday

Soil degradation is one of the most significant challenges in modern agriculture. The loss of humic substances leads to a decrease in soil fertility and resistance to water and wind erosion, making soils more prone to the impacts of global climate change. One of the key strategies to combat soil degradation is the implementation of soil conservation practices aimed at increasing organic matter content in the soil.

Under conditions of a long-term stationary field experiment on typical low-humus chornozem, the effect of microbial products — plant residues biodecomposers — on the sequestration of labile carbon compounds in the soil under prolonged monoculture maize cultivation was investigated. An increase in the labile carbon content in the soil was observed in variants using the biodecomposers Ecostern Classic and Ecostern Bacterial + Ecostern Trichoderma by 0.11% and 0.18%, respectively, compared to the control. The obtained data on the increase in labile carbon content were confirmed by the dynamic determination of the organic matter transformation coefficient, the increase of which indicates enhanced microbiological processes in the soil and the predominance of organic matter synthesis processes over its mineralization. Thus, when biodecomposers were used, this indicator was significantly higher than in the control throughout the study period.

Focusing on the survival of the fungal bioagent from the Ecostern Classic and Ecostern Trichoderma products in the soil, the dynamics of the Trichoderma genus fungi population were monitored. The results showed an increase in the population of this micromycete in variants with the application of Ecostern Classic by an average of 19 thousand CFU/g of soil and, with the combined application of Ecostern Bacterial and Ecostern Trichoderma, by 34 thousand CFU/g of soil, compared to 28 thousand CFU/g of soil in the control. This indirectly indicates the survival of this bioagent included in the bioproducts.

During the determination of the soil eco-physiological diversity index using the BIOTREX technology (Community-Level Physiological Profiling method), it was found that in the control soil samples, the index was 3.66, whereas with the use of biodecomposers, it increased to 4.87–5.61, depending on the studied variant. Additionally, according to the BIOTREX assessment, the use of biodecomposers not only enhanced soil biodiversity but also improved its biological activity. The application of biodescomposers ensured an increase in maize grain yield compared to the control by 3.2 t/ha in the variant with Ecostern Classic and by 1.76 t/ha with the combined application of Ecostern Bacterial and Ecostern Trichoderma.

It was found that the application of a biodecomposer on corn residues accelerates their transformation and ensures the sequestration of labile carbon compounds. Microbial decomposers also enhance microbiological processes in the soil, leading to a predominance of organic matter synthesis over its mineralization, which is crucial for mitigating soil degradation.    

How to cite: Khomenko, T., Bolokhovska, V., Bolokhovskyi, V., Lunhul, A., Zhurba, M., Yakovenko, D., Bukhonska, Y., and Boroday, V.: The Effect of Biological Decomposers on Soil Carbon Sequestration to Mitigate Soil Degradation, EGU General Assembly 2025, Vienna, Austria, 27 Apr–2 May 2025, EGU25-8320, https://doi.org/10.5194/egusphere-egu25-8320, 2025.

EGU25-8352 | ECS | Posters on site | SSS5.6

The enhanced rock weathering stages determine the fluxes and interactions of soil inorganic and organic carbon pools 

Kaiyu Lei, Franziska B. Bucka, Pedro Paulo Teixeira, Franz Buegger, and Ingrid Koegel-Knabner

Enhanced rock weathering (ERW) has emerged as a promising strategy for atmospheric CO2 removal via promoting inorganic carbon (IC) sequestration. Despite its impact on IC accrual that has been extensively studied and modelled, the lack of understanding of its impact on the largest terrestrial C stock - organic carbon (OC), and the overall C fluxes throughout the weathering stages impede the long-term assessment of ERW in C sequestration. Here, we conducted a 6-month microcosm study using fresh basalt (fine size) and weathered basalt (coarse and fine size) to simulate the impacts of basalt on C fluxes with weathering progressing in a temperate cropland topsoil. We also incorporated 13C-labeled straw to understand their effects on the turnover of new straw-derived organic matter (OM) and the native OM. Our findings show that both fresh and weathered basalt treatments increase IC through the release of exchangeable cations, with the fresh basalt contributing more exchangeable Mg and the weathered basalt shifting toward exchangeable Ca dominance as olivine minerals deplete. The fresh basalt treatments lead to a significant loss of soil OC, driven by soil alkalinity. Nevertheless, they concurrently reduce CO2 emissions by promoting IC accrual in soils and the leaching of dissolved organic carbon (DOC) and dissolved inorganic carbon (DIC). With the progress of weathering, the alkalinity effect diminishes. The weathered basalt (fine size) treatments demonstrate improved OC retention for both native soil organic matter (SOM) and straw-derived OM. This is accompanied by the reduced DOC and DIC leaching, attributed to increased specific surface area (SSA), low pH and SOM stabilization through Ca. However, the IC accrual can be labile to fresh biomass inputs, which enhance CO2 emissions and deplete the accumulated IC in bulk soils and DIC leaching. These findings suggest that in soils with continuous biomass inputs, the benefits of ERW (e.g. basalt) throughout the weathering stages lie in reducing OC loss driven by weathered ERW materials rather than sustaining IC accumulation, which can be easily lost by environmental fluctuations in temperate zones.

How to cite: Lei, K., Bucka, F. B., Teixeira, P. P., Buegger, F., and Koegel-Knabner, I.: The enhanced rock weathering stages determine the fluxes and interactions of soil inorganic and organic carbon pools, EGU General Assembly 2025, Vienna, Austria, 27 Apr–2 May 2025, EGU25-8352, https://doi.org/10.5194/egusphere-egu25-8352, 2025.

EGU25-9730 | Posters on site | SSS5.6

Effect of biochar as inoculum carrier on the fertility of sandy soils  

Márk Rékási, Tibor Szili Kovács, Takács Tünde, József Kutasi, Mónika Molnár, and Nikolett Uzinger

Increasing the fertility of sandy soils is a worldwide problem. A field experiment investigated the combination of two of fertility increasing methods, the application of biochar (BC) and a plant growth-promoting rhizobacteria inoculum in acidic and calcareous sandy soils from the temperate region. The treatments studied were BC alone; BC with inoculum; inoculum on BC carrier; and inoculum on conventional carrier at four dose levels. BC levels were 3, 15 and 30 t/ha. As a test plant maize was sown. Based on the chemical and biological changes observed in the soil, BC was the more decisive factor in the treatments. BC increased the pH and nitrification in acidic soil and the P and K availability in both soils. The survival of inoculated bacteria was better when it was added with BC. In acidic soil the small dose of BC inhibited arbuscular mycorrhizal fungal infection, probably due to its toxic organic contaminants. The growing season was extremely dry thus, the treatments did not affect maize yield, but the increase in total above-ground biomass showed that the combined application of BC and inoculum is more beneficial than their separate application. 


Acknowledgement: This work was funded by the Norway Grant HU09-0029-A1-2013 entitled “Combined application of biochar and microbial inoculant for deteriorated soils.”

How to cite: Rékási, M., Szili Kovács, T., Tünde, T., Kutasi, J., Molnár, M., and Uzinger, N.: Effect of biochar as inoculum carrier on the fertility of sandy soils , EGU General Assembly 2025, Vienna, Austria, 27 Apr–2 May 2025, EGU25-9730, https://doi.org/10.5194/egusphere-egu25-9730, 2025.

EGU25-10997 | Posters on site | SSS5.6

Flexible temperature-dependent differentiation of carbon fractions with the Elementar soli TOC® cube  

Calum Preece, Fabian Alt, and Almut Loos

Understanding how different soil types and land management practices can increase the quantity of carbon stored in soil is increasingly important for climate change mitigation efforts. Determining the total organic carbon (TOC) content in soils provides information on the soil health, carbon sequestration potential and soil fertility. This information allows improvements in agricultural applications, environmental monitoring and other land management practices. Another recent application for TOC analysis is assessing the quality and carbon sequestration potential of biochar, a carbon rich material produced via pyrolysis of biomass for the purpose of transforming the biomass carbon into a more stable form. Biochar has emerged as a potentially promising soil amendment as it captures carbon that would otherwise be released into the atmosphere and can improve soil fertility and improve water quality.

The Elementar soli TOC® cube has been developed for the measurement of total organic carbon (TOC) and total inorganic carbon (TIC) but also the residual oxidizable carbon (ROC). The soli TOC cube uses temperature ramped differentiation of the carbon factions with a crucible-based sample feeding system, gas switching and dynamic furnace. Alongside standard applications using a 3-step temperature programmes e.g. EN 17505, the soli TOC® cube also has the option for flexible programmes with up to 5 temperature steps offering new possibilities for differentiating carbon fractions or species and for studying the temperature-dependent decomposition of carbon compounds.

We present results from the new 5 - step temperature ramping method that gives users the ability to run flexible temperature programmes under combustion or pyrolytic conditions with up to five target temperatures between 150 and 900 ℃. Other adjustable parameters include the switching time between combustion and pyrolysis, temperature ramping time and temperature hold times. This enhanced flexibility gives the opportunity to address new scientific questions with an unrestricted analysis of the different carbon fractions.

How to cite: Preece, C., Alt, F., and Loos, A.: Flexible temperature-dependent differentiation of carbon fractions with the Elementar soli TOC® cube , EGU General Assembly 2025, Vienna, Austria, 27 Apr–2 May 2025, EGU25-10997, https://doi.org/10.5194/egusphere-egu25-10997, 2025.

EGU25-11591 | Posters on site | SSS5.6

Advancing soil carbon sequestration solutions: A decision-support tool for achieving net-zero goals 

Christhel Andrade Diaz and Lorie Hamelin

Soil carbon sequestration (SCS) is a promising approach to mitigate climate change by enhancing carbon storage in soils while simultaneously improving soil functioning. Despite its potential, the effectiveness and sustainability of SCS strategies are highly variable, contingent on location-specific environmental and management contexts, and are often constrained by risks of reversibility and potential soil quality degradation. This underscores the urgent need for robust, data-driven frameworks to guide the prioritization and implementation of SCS strategies, ensuring long-term benefits while minimizing trade-offs.

This study introduces an innovative multicriteria decision-support tool designed to evaluate and prioritize SCS strategies in croplands, considering their carbon sequestration potential, environmental co-benefits, and socio-economic implications. A comprehensive review of 264 meta-analyses was conducted, focusing on the impacts of 13 SCS strategies, grouped into seven families: crop diversification, land management, mulching, organic amendments, fertilization, biochar application, and agri-technologies. The developed tool integrates seven key performance indicators (KPIs): ease of implementation, SOC increase potential, co-benefits, negative effects, costs, permanence of carbon in soil, and additional crop yield. The prioritization tool integrates quantitative and qualitative data into a scoring matrix, providing a robust framework to evaluate the multifaceted impacts of SCS strategies. It accounts for variability in data quality and uncertainty, allowing users to adapt the weighting of KPIs to align with specific goals. This allows the identification of Pareto-efficient strategies that maximize SOC sequestration while minimizing trade-offs, supporting the adoption of contextually relevant SCS strategies in agriculture.

Preliminary results highlight biochar application and agroforestry as promising strategies, with average SOC stock increases of 34% and 32%, respectively, followed by crop rotation (20%), fertilization techniques (16%), cover cropping (12%), and mulching (8%). Biochar demonstrates particularly high sequestration rates (0.03–66 MgC ha⁻¹ y⁻¹), alongside substantial improvements in soil properties, such as porosity, aggregate stability, and water-holding capacity, and a 25% average enhancement in crop productivity. By systematically synthesizing evidence and scoring SCS strategies across multiple dimensions, this study bridges the gap between theoretical knowledge and practical implementation of SCS strategies. The tool facilitates targeted decision-making, promoting research and investment in the most effective and sustainable practices, advancing the integration of soils into climate change mitigation strategies.

How to cite: Andrade Diaz, C. and Hamelin, L.: Advancing soil carbon sequestration solutions: A decision-support tool for achieving net-zero goals, EGU General Assembly 2025, Vienna, Austria, 27 Apr–2 May 2025, EGU25-11591, https://doi.org/10.5194/egusphere-egu25-11591, 2025.

EGU25-11866 | Orals | SSS5.6

Soil C storage in productive grassland mixtures: the role of species traits and mixture composition 

Esben Mortensen, Leanne Peixoto, Kirsten Enggrob, Diego Abalos, and Jim Rasmussen

Productive perennial grassland systems can increase soil carbon (C) storage compared to annual cropping systems, but the effect of species mixture composition as a means to optimize soil C input and stabilization and aboveground biomass yield at low nitrogen (N) fertilizer inputs remains unexplored.

In a field experiment, we measured aboveground yield and soil C inputs in 2-species mixtures with grasses or forbs combined with red or white clover, and in multi-species mixtures with 6 and 18 species including all 3 plant functional groups (grass, forb, legumes). All mixtures were fertilized with 75 kg N ha-1 yr-1. Monoculture perennial ryegrass plots were established at low and high N application rates (75 and 300 kg N ha-1 yr-1). We assessed aboveground yield and the input to belowground C pools (i.e., root C and rhizodeposited C) using isotopic labelling with 13C and a tracer mass balance approach. Further, we measured the allocation of the rhizodeposited C into newly formed mineral-associated organic C (MAOC) and particulate organic C (POC) fractions and related these to root traits. Lastly, we quantified selected amino sugars as proxies for bacterial and fungal necromass along a species richness gradient (1, 2, 6, 18).

The mixtures with red clover (including the multi-species mixtures) had an aboveground yield between 19.0 and 20.8 t DM ha-1 (830 – 890 g C m-2), matching the yield of the high-fertilized monoculture perennial ryegrass. The 2-species mixtures with white clover yielded on average 27% lower than mixtures with red clover. Mixtures with higher species richness than 2 yielded similar aboveground biomass as the 2-species mixtures with red clover. The multi-species mixture, consisting of 6 productive, resource-acquisitive species, resulted in a total soil C input to 1 m depth of 425 ± 30 g root C m-2 and 70 ± 10 g rhizodeposited C m-2, which was higher than all other treatments. Red clover, tall fescue and chicory secured high root C, while white clover, perennial ryegrass and plantain contributed with high C rhizodeposition. The 18-species mixture had lower total C input to soil compared to the 6-species mixture, likely due to several extra species diluting the effect of the 6 productive species used in the 6-species mixture. Legumes (low C:N ratio in root biomass) increased the proportion of MAOC of total rhizodeposition, while grasses (high root length density and root surface area) increased total C rhizodeposition and the proportion of POC. Further, the mixtures with legumes had a higher content of fungal and bacterial microbial necromass in the soil at the end of the growing season compared to monoculture perennial ryegrass. This indicates that the stabilization potential of rhizodeposted C can be enhanced by mixtures with legumes compared to monoculture grasslands.

Our results showed how grassland mixture composition can 1) increase total C input to soil without compromising high aboveground yield, 2) regulate the relative proportion of MAOC and POC from root-derived C, and 3) increase microbial necromass formation and the potential persistence of newly formed soil C.

How to cite: Mortensen, E., Peixoto, L., Enggrob, K., Abalos, D., and Rasmussen, J.: Soil C storage in productive grassland mixtures: the role of species traits and mixture composition, EGU General Assembly 2025, Vienna, Austria, 27 Apr–2 May 2025, EGU25-11866, https://doi.org/10.5194/egusphere-egu25-11866, 2025.

EGU25-15185 | ECS | Posters on site | SSS5.6

Divergent impact of amorphous aluminum hydroxide and biochar on enhancing organic carbon accumulation in low-carbon alkaline Indian soil 

Ruohan Zhong, Han Lyu, Arisa Nishiki, Mayuko Seki, Soh Sugihara, and Tetsuhiro Watanabe

Enhancing soil organic carbon (SOC) accumulation is vital for improving agricultural productivity, soil health, and climate change mitigation, particularly in alkaline Indian soils with severe SOC deficiency. Amorphous Al (Am-Al) would be the major factor regulating SOC in volcanic and humid regions, and biochar has shown promise in improving SOC accumulation in temperate and tropical regions. Yet, their mechanisms and feasibility as amendments for enhancing SOC accumulation remain underexplored, especially in alkaline soils. This study investigates the effects of Am-Al and rice-husk biochar on the stabilization and mineralization of newly added plant materials in the alkaline Indian cropland soil (Inceptisol, 0-15 cm, pH: 8.8, SOC: 5.2 g kg1, clay: 21%) through a one-year incubation experiment at 25℃ and 60% of water holding capacity. Treatments included Am-Al (Al(OH)3·mH2O; pH: 7.0, oxalate extractable Al: 58 g kg1, BET specific surface area (SSABET): 290 m2 g1; 10 g kg1 soil) and biochar (formed at 550℃ for 4 hrs; SSABET: 180 m2 g1; 10 g kg1 soil) with and without washing (pH 9.2 and 6.9), with combination of plant residues (13C-labeled maize residue; 350 g C kg1; 34% of 13C; <1 mm powder; 1 g kg1 soil). The amounts and 13C ratios of respired CO2 and SOC during incubation were measured to quantify the mineralization and remaining added residues. The qualitative changes were monitored using 13C NMR and pyrolysis-GCMS.

Am-Al significantly reduced residue mineralization within the first 14 days, resulting in 27% versus 33% residue-derived CO₂ emissions for soils with and without Am-Al, respectively. Although this retardation diminished after 14 days, the legacy effect resulted in higher residue-derived C after one year, mostly in the <100 μm fraction (>90%). Am-Al preferentially stabilized plant residues directly, as indicated by a higher odd-over-even predominance of n-alkanes, reflecting a stronger plant contribution to lipids than microbial contributions. Minimal qualitative changes in residue decomposition patterns were observed in soils with and without Am-Al, as indicated by similar C functional group compositions. It suggests that stabilization may be primarily driven by adsorption rather than changing decomposition pathways, with some preferential stabilization of carbohydrate C (-C-O-) indicated by its smaller decrease among all functional groups. Biochar-amended soils also showed significant increases in remaining residue-derived C compared to controls. Still, they were lower than Am-Al treatments after one year, with stabilization effects becoming significant only in the later stages of incubation (post-day 168). This delayed effect is likely due to substrate substitution for soil microbes from residue to biochar rather than preferential stabilization. These findings highlight the divergent mechanisms of Am-Al and biochar in enhancing SOC accumulation, with Am-Al offering stronger stabilization from early stages and biochar contributing during later stages. Also, SSA may not be the only primary factor regulating the effectiveness of Am-Al and biochar in influencing SOC stabilization. This research underscores the potential of these amendments for SOC management in alkaline, low-carbon soils.

How to cite: Zhong, R., Lyu, H., Nishiki, A., Seki, M., Sugihara, S., and Watanabe, T.: Divergent impact of amorphous aluminum hydroxide and biochar on enhancing organic carbon accumulation in low-carbon alkaline Indian soil, EGU General Assembly 2025, Vienna, Austria, 27 Apr–2 May 2025, EGU25-15185, https://doi.org/10.5194/egusphere-egu25-15185, 2025.

EGU25-15512 | ECS | Orals | SSS5.6

Pushing the Limits of Soil Organic Carbon Storage: The Role of Land Use in Soil Carbon Dynamics 

Franziska B. Bucka, Alma R. Cantorán Viramontes, Christopher Just, Julien Guigue, and Martin Wiesmeier

Healthy soils with high carbon content not only enhance agricultural productivity but also serve as significant carbon sinks, by sequestering atmospheric carbon dioxide. Understanding soil organic carbon dynamics is paramount for devising effective climate change mitigation strategies. In our study we analyzed the effect of a continuous dissolved organic matter (DOM) input in a Luvisol under three different land uses: grassland (GR), miscanthus (MI) and bare fallow (BF). We wanted to test if we could observe a maximum carbon content in the smaller fraction (<20μm), comparing our results to our calculations based on regressions for theretical saturation limits taken from the literature. We used a DOM-rich solution and irrigated the samples twice per week for 6 weeks. The GR and MI treatments surpassed the calculated theoretical limit by approx. 20%, contrary to BF which only reached approx. 70% of this theoretical limit. By the end of week 4, even though the carbon input was never interrupted, we observed a limited microbial respiration. It implies that the microbial communities might have focused on POM transformation, contrary to the expectation of them choosing the provided DOM. We also analyzed the change in available specific mineral surface area (SSA) through the experiment and detected a decrease for all the treatments, in line with the results for carbon content. Finally, we calculated the approximated leached carbon for each treatment. Our findings challenge the conventional notion of carbon saturation and underscore the importance of considering soil management practices and environmental conditions, contributing to advancing knowledge in soil carbon dynamics and emphasizing the critical role of adequate soil management in building a sustainable and climate-resilient future.

How to cite: Bucka, F. B., Cantorán Viramontes, A. R., Just, C., Guigue, J., and Wiesmeier, M.: Pushing the Limits of Soil Organic Carbon Storage: The Role of Land Use in Soil Carbon Dynamics, EGU General Assembly 2025, Vienna, Austria, 27 Apr–2 May 2025, EGU25-15512, https://doi.org/10.5194/egusphere-egu25-15512, 2025.

EGU25-15768 | Orals | SSS5.6

Estimating the total soil organic carbon capturing potential of agriculture in Israel to inform country-wide carbon policy 

David Yalin, William Mlelwa, Eyal Rotenberg, Dan Yakir, Gil Eshel, and José M. Grünzweig

Carbon capturing using modified agricultural practices appears to be a prominent strategy for climate mitigation, because the accrual of soil organic carbon (SOC) and its maintenance also provide many agronomic advantages. Previous studies have estimated the global SOC capturing potential as the gap between the mineral-associated organic carbon (MAOC) capacity—considered the upper limit for long-term SOC accrual—and current MAOC stocks, providing promising results. State-level estimates of SOC capturing potential using this methodology can better inform policy on how to maximize C capturing. Here we aimed at quantifying the current potential for SOC capturing in agricultural soils in Israel. Gridded geographical information on soil texture and land use was compiled for an area of 390,000 ha, encompassing field crops (180,000 ha), orchards (90,000 ha) and rangeland (110,000 ha). A bulk density-texture function was derived from published literature; and the typical capacitance for MAOC of the soils in Israel was estimated at a value of 48 g C kg-1 silt+clay based on samples of the organic-rich top-soils in planted forest sites. The MAOC capacity to a depth of 20 cm in all the agricultural soils of Israel was estimated at a total of 25.1 Mt C (92 Mt CO2-eq). Field crops were associated with the highest capacity followed by rangeland and orchards. In the field crops, the regions with the highest capacity were the Northern Valleys where clay-rich soils are abundant and the semi-arid Negev region, where the expansive agricultural land area compensates for the abundance of sandy soils. Sporadic information published from trials on field crops in the Northern Valleys and the Negev show that current SOC there only amounted to 41% and 30% of the estimated MAOC capacity for those sites (respectively). While the low SOC filling in the semi-arid Negev might carry promise for a large capturing potential, it also raises questions whether the hot climate does not further limit SOC to values below the MAOC capacitance. For orchards, scant data exists regarding current SOC levels. However, we propose that the possibility of storing SOC in deeper soil layers in orchards might offer substantial carbon storage potential at the national scale, a topic still requiring investigation. Overall, despite the uncertainty involved in this work, our study provides a foundational framework for policymakers to develop carbon management strategies in Israel, while highlighting knowledge gaps to guide future research.


How to cite: Yalin, D., Mlelwa, W., Rotenberg, E., Yakir, D., Eshel, G., and Grünzweig, J. M.: Estimating the total soil organic carbon capturing potential of agriculture in Israel to inform country-wide carbon policy, EGU General Assembly 2025, Vienna, Austria, 27 Apr–2 May 2025, EGU25-15768, https://doi.org/10.5194/egusphere-egu25-15768, 2025.

EGU25-15842 | ECS | Orals | SSS5.6

Fostering Soil Organic Matter Stocks by Adapting Agricultural Management Practices   – A Model Analysis  

Lisa Bahlmann, Susanne Stadler, and Claus Florian Stange

As part of the EU-Interreg project ‘Blue Transition – How to make my region climate resilient’, this study targets the climate change resilience of organic matter stocks and soil fertility in agricultural soils in a study region in Lower Saxony, Germany. The Federal Institute for Geosciences and Natural Resources together with the regional water authority (Water authority of Oldenburg and East Frisia) investigates options to adapt agricultural management practices to change the trajectory of the observed organic matter losses at many agricultural sites in the region.

Considered adaptations include the optimization of fertilizer application, tillage practices, crop rotations and choices in catch crop as well as a one-time deepening of the topsoil layer depth by 5 cm to increase the soil volume for potential organic matter accumulation.

The long-term development of carbon stocks is estimated by simulating the carbon and nitrogen dynamics in the soil in response to site-specific soil and weather conditions, management practices and adaptations thereof. The dynamics are modeled using the Soil-Vegetation-Atmosphere-Transfer-Model Daisy. The model analysis highlights the potentials and limitations of different management adaptations. It also shines a light on the implications for the pollution of groundwater resources by nitrate leaching as a byproduct of efforts to increase soil carbon stocks.

How to cite: Bahlmann, L., Stadler, S., and Stange, C. F.: Fostering Soil Organic Matter Stocks by Adapting Agricultural Management Practices   – A Model Analysis , EGU General Assembly 2025, Vienna, Austria, 27 Apr–2 May 2025, EGU25-15842, https://doi.org/10.5194/egusphere-egu25-15842, 2025.

EGU25-16585 | ECS | Orals | SSS5.6

Understanding the legacy impact of biochar on soil function and carbon stocks – evidence from a 13-year field experiment 

Robert Brown, Wei Li, Clement Uguna, Will Meredith, Lee Stevens, David Chadwick, Colin Snape, and Davey Jones

Incorporation of biochar, a carbon (C) dense and stable (over centuries or millennia) product of pyrolysis of organic material, into soil (particularly agricultural soil) has been proposed as a potential method of atmospheric carbon dioxide removal (CDR). However, assessing the impact of biochar application on agricultural soils, particularly over time, will be key to understanding the wider impact on ecosystem function. Here, using one of the longest running biochar field experiments in the UK, we evaluate the soil biological, physical and chemical impact of biochar 13 years after the initial application, at a plot (bulk soil from 50 t ha-1 biochar application vs control) and ‘charosphere’ scale (soil brushed from the biochar surface, and the biochar surface itself), as well as the impact of field exposure on biochar C stability and textural properties.

The organic C density of the biochar plots (4.89 kg C m-3) was higher than the control (3.32 kg m-3) plots, confirming the persistence of both biochar and soil derived organic C. Stable polycyclic aromatic carbon (SPAC) content, a measure of the long-term chemical stability of biochar C, of the original (non-field aged char) and field aged biochar was determined by hydropyrolysis (HyPy). The original biochar had a higher SPAC content compared to the field aged biochar, driven by one outlier, suggesting the initial biochar may have been heterogeneous in its quality and stability. Gas chromatography-mass spectrometry analysis of the HyPy-released labile fraction showed no compositional changes among samples with similar SPAC contents, indicating negligible degradation.

16S and ITS rRNA sequencing revealed divergent trends in the beta diversity of bacterial and fungal communities. The 16S bacterial community associated with the biochar surface differed from the bulk control and biochar soils and soil brushed from the biochar surface. Conversely, the ITS fungal community was different in the bulk control soil compared to biochar associated soils (bulk biochar, soil brushed from the biochar surface and the biochar surface itself). Soil pH and nitrogen (N) availability seemed to be the drivers of differences in soil properties, with pH significantly higher in the soil brushed from the biochar surface (pH 6.67) and biochar (pH 6.79) itself than the bulk soil (pH 5.22 and pH 5.30 for the control and biochar bulk soil, respectively), while extractable and available N was highest in the soil brushed from the biochar surface.

Overall, we show that, after 13 years, biochar application had a positive influence on soil C stocks. The chemical stability of the biochar had diminished by very little, with even the low quality (low SPAC content) char persisting. Soil function at a bulk soil level was relatively unchanged between control and biochar plots. However, at the charosphere (biochar surface) level, changes in the composition of the fungal and bacterial community may drive some changes in function, likely driven by soil pH and the biochar’s ability to retain nutrients, specifically N. The results presented here reinforce the durability of biochar application to soil as a CDR method, in the medium term.

How to cite: Brown, R., Li, W., Uguna, C., Meredith, W., Stevens, L., Chadwick, D., Snape, C., and Jones, D.: Understanding the legacy impact of biochar on soil function and carbon stocks – evidence from a 13-year field experiment, EGU General Assembly 2025, Vienna, Austria, 27 Apr–2 May 2025, EGU25-16585, https://doi.org/10.5194/egusphere-egu25-16585, 2025.

Long-term field experiments on the soil C cycle are essential for understanding C dynamics in agricultural soils. However, such studies are limited in the humid tropics. This study quantifies the effects of chemical fertilizer application, organic matter application, and their combinations on soil C sequestration. Data was obtained from 4 sites of the 45-year long-term field experiments in Thailand. Furthermore, a structural equation model (SEM) was employed to visualize the relationships among organic matter application, soil carbon, basic chemical properties, and cassava yield.

Compared to the control without any application, soil carbon sequestration was 2.0 ± 2.1 and 2.8 ± 2.0 Mg C ha⁻¹ (0.2 m depth) for chemical fertilizer and crop residue incorporation, respectively. The largest soil C sequestration occurred when chemical fertilizers were combined with organic matter application. Specifically, when chemical fertilizer was combined with crop residue incorporation or compost application, soil C sequestration reached 5.6 ± 3.1 and 10.1 ± 6.5 Mg C ha⁻¹ (0.2 m depth), respectively. These findings underscore the importance of C contributions from crop biomass and direct C inputs from organic matter.

SEM showed that the effects of chemical fertilizer and organic matter application on soil C concentration in clayey soils were predominantly observed in the 0–0.2 m and 0.2–0.4 m surface layers. Conversely, treatment effects were significant in sandy soils at all depths up to 1.0 m. The increase in soil C in sandy soils also significantly improved basal soil fertility, such as soil pH, available phosphorus, and exchangeable potassium, resulting in higher cassava yields. In contrast, no significant relationship was found between soil C concentration and cassava yield in clayey soils.

Currently, soil C dynamics models for agricultural lands in low-latitude regions, such as Southeast Asia, are primarily based on databases from high-latitude areas (e.g., the RothC model). The findings from this study are expected to contribute to developing tropical-specific C dynamics models for agricultural lands in low-latitude regions. Furthermore, the standard set by the Intergovernmental Panel on Climate Change (IPCC) for calculating soil carbon sequestration (30 cm from the surface) may be insufficient for sandy soils, highlighting the importance of evaluating carbon sequestration at deeper soil layers.


How to cite: Iwasaki, S., Tancharoen, S., and Luanmanee, S.: Carbon Sequestration and Soil Fertility Management in Sandy and Clayey Soils Revealed by Over Four Decades of Long-Term Field Experiments in Thailand, EGU General Assembly 2025, Vienna, Austria, 27 Apr–2 May 2025, EGU25-17561, https://doi.org/10.5194/egusphere-egu25-17561, 2025.

EGU25-17737 | ECS | Posters on site | SSS5.6

Quantifying the effect of air pollution on soil carbon sequestration using an EU-wide thermal inversions dataset 

Felix Schaumann, Piero Basaglia, and Moritz Drupp

The harmful effects of air pollution on human health and well-being are well-studied. However, research on the effects of air pollution on the non-human environment is still sparse. We add to this by investigating the causal effect of particulate matter (PM2.5) on vegetation and soil invertebrates throughout Europe. To do so, we exploit the quasi-random variation in air pollution concentration caused by thermal inversion episodes in an econometric instrumental-variable setting, with the help of a dedicated new dataset of thermal inversion episodes across Europe. With this econometric technique, we can estimate the causal effects of an increase in air pollution on soil variables taken from the LUCAS database. We focus particularly on processes related to carbon sequestration. A pollution-induced reduction in soil carbon sequestration constitutes a reduction in ecosystem services which can be monetised by estimating the additional economic damages arising from this carbon cycle feedback and the climate change impacts it causes. Results from a preliminary analysis in the UK suggest that a 1 ug increase in PM2.5 concentrations would imply a reduction in topsoil carbon sequestration of up to 2 MtC across England, which is substantial compared to annual UK CO2 emissions of around 80 MtC. These results indicate that the effect of air pollution on soil biota and soil carbon sequestration might be a major overlooked damage which is to a large extent caused by the combustion of fossil fuels. Consequently, accounting for this effect allows us to economically quantify the co-benefit of increased soil health and carbon sequestration that arises from reducing fossil fuel emissions through climate change mitigation policies.

How to cite: Schaumann, F., Basaglia, P., and Drupp, M.: Quantifying the effect of air pollution on soil carbon sequestration using an EU-wide thermal inversions dataset, EGU General Assembly 2025, Vienna, Austria, 27 Apr–2 May 2025, EGU25-17737, https://doi.org/10.5194/egusphere-egu25-17737, 2025.

EGU25-18721 | ECS | Posters on site | SSS5.6

Disentangling the Effects of Minerals and Other Environmental Factors on Soil Carbon Stocks, and Capacity 

Leo Roßdeutscher, Mohammed Ayoub Chettouh, Marco Paina, Markus Reichstein, Marion Schrumpf, and Bernhard Ahrens

Soil organic carbon (SOC) is important for soil health and its accrual is discussed for carbon sequestration. The SOC fraction stabilized by mineral associations is of special interest, but limited reactive mineral surfaces comprise a natural boundary. The potential upper limit of soils to store SOC as mineral-associated organic carbon (MAOC), the mineralogical capacity, cannot be directly measured as MAOM formation is the result of a complex interplay between mineral properties, plant litter input, and microbial growth and transformation. Accordingly it, depends on a variety of environmental drivers. Current approaches use boundary line regression to identify the dependency of the mineralogical capacity on texture, mineral type, and other environmental conditions and thereby suffer from data sparsity and neglect interactions among the different drivers.
 To exploit multiple sources of data and combine them via common and expert knowledge, we developed a parameter learning framework that combines machine learning and mechanistic modeling. The spatial distribution of parameters (e.g. mineralogical capacity or litter decomposition rates) of a mineral and microbial explicit mechanistic model is inferred using a hybrid neural network, where the mechanistic model forms the final layer. The neural network learned the mechanistic parameters from observations of SOC and MAOC, using environmental covariates like texture, climatological and vegetational conditions as inputs. Influences from mineral properties and other environmental conditions can thereby be separated in an informed way.
 Bootstrapping and analyzing the distribution of mechanistic parameters revealed that relying solely on SOC observations from the Land Use and Land Cover Survey (LUCAS) is insufficient for stable results. Thus, the output space was further constrained by penalizing unrealistic predictions, using MAOC and other sparse observations, and restricting the degrees of freedom in the framework. The posterior parameter combinations per site were thereby limited, which reduces equifinality and assures physical consistency of all model parts.
 Results of the distribution of the mineralogical capacity, steady state MAOC/POC and sensitivities on mineral and environmental conditions can inform the carbon sequestration and soil health community about areas of interest. As rates of change and respective sensitivities are also of high interest, the framework should be extended in the future with a dynamic mechanistic model.

How to cite: Roßdeutscher, L., Chettouh, M. A., Paina, M., Reichstein, M., Schrumpf, M., and Ahrens, B.: Disentangling the Effects of Minerals and Other Environmental Factors on Soil Carbon Stocks, and Capacity, EGU General Assembly 2025, Vienna, Austria, 27 Apr–2 May 2025, EGU25-18721, https://doi.org/10.5194/egusphere-egu25-18721, 2025.

EGU25-19373 | Posters on site | SSS5.6

Soil Organic Carbon (SOC) Fraction Dynamics Influenced by the Enhanced Rock Weathering with Blast Furnace Slag and Mine Tailings 

Ye Lim Park, Yejee Ok, Junge Hyun, Inhye Seo, and Gayoung Yoo

Enhanced rock weathering (ERW) is a promising carbon dioxide removal (CDR) technology, capable of removing up to 95 t CO2 ha-1 yr-1 from the atmosphere. In recent research, not only natural rocks but also industrial by-products, such as blast furnace slag (BFS) and mine tailings (MT), have been found to exhibit ERW potential, highlighting the need for comprehensive evaluations of their effects. While the CDR potential of ERW is mainly assessed by the increase in soil or leachate inorganic carbon, its impact on soil organic carbon (SOC) dynamics remains underexplored. To address this gap, we conducted a 290-day greenhouse experiment to evaluate the effects of BFS and MT, representative industrial by-products, on SOC dynamics. The experiment consisted of a factorial design with three replicates, with or without plants (alfalfa, Medicago sativa L.), and applying BFS and MT at a rate of 60 t ha-1. SOC dynamics were analyzed through temporal changes in SOC fractions, including free particulate organic carbon (fPOC), occluded particulate organic carbon (oPOC), and mineral-associated organic carbon (MAOC). Additionally, we measured soil pH, available nutrients (NH4+, NO3-. and P2O5), microbial biomass carbon (MBC), and microbial activities (hydrolase and oxidase). Results showed decreased total SOC in BFS and MT after 290 days. The SOC fraction dynamics showed distinct temporal dynamics. The fPOC content declined rapidly within 122 days and continued to decrease slowly thereafter. In contrast, oPOC and MAOC showed minimal or statistically insignificant changes over time. Microbial parameters, including MBC and enzyme activities, significantly increased in response to BFS and MT applications. These results indicate that the high levels of (3127.3 mg kg-1), Na (4.0 mg kg-1), and Mg (12.6 mg kg-1) contained in BFS and MT stimulated microbial activity, thereby promoting the decomposition of labile SOC fraction (fPOC). Despite the SOC loss, BFS and MT significantly enhanced above- and below-ground plant biomass carbon. This augmented plant growth suggests the potential for increased carbon (e.g., plant residues) input to the soil, which may counterbalance the reduced SOC. These results highlight a complex interplay between ERW materials, soil microbes, and plant growth. To further explore these interactions, we plan to use synchrotron micro-CT to investigate the spatial arrangements between ERW materials, soil carbon, and microbial activity.

How to cite: Park, Y. L., Ok, Y., Hyun, J., Seo, I., and Yoo, G.: Soil Organic Carbon (SOC) Fraction Dynamics Influenced by the Enhanced Rock Weathering with Blast Furnace Slag and Mine Tailings, EGU General Assembly 2025, Vienna, Austria, 27 Apr–2 May 2025, EGU25-19373, https://doi.org/10.5194/egusphere-egu25-19373, 2025.

EGU25-19648 | ECS | Orals | SSS5.6

Change Drivers and Spatial Distribution of Soil Organic Carbon Concentrations in Croplands of Morocco 

Mohamed Bayad, Bruno Gerard, Abdelghani Chehbouni, Malcolm J. Hawkesford, Henry Wai Chau, Moussa Bouray, Abdellah Hamma, Manal El Akrouchi, and Asim Biswas

Soil organic carbon (SOC), a vital component of soil organic matter, plays a critical role in soil productivity, stability, and mitigating CO2 emissions. Factors such as climate, mineralogy, and vegetation influence SOC cycling, but its distribution patterns in Mediterranean arid croplands remain unclear. Using a spatiotemporal modeling approach, researchers analyzed a multi-year dataset of topsoil organic carbon concentrations from over 31,000 cropland sites in Morocco. These data were linked with environmental variables, including climate, vegetation, topography, and soil characteristics, to identify the drivers of spatiotemporal SOC changes.

The analysis revealed a low median SOC concentration of 11.71 g C kg⁻¹, with significant variability (Q1 = 8.46, Q3 = 16.24 g C kg⁻¹). Bioclimatic factors, particularly temperature seasonality and annual mean temperature, accounted for 57% of the variation in SOC content, along with contributions from vegetation and precipitation. This national dataset provides new insights into the environmental drivers of SOC variability in Morocco's arid croplands, shedding light on the mechanisms of SOC gain and loss and informing discussions about carbon cycling in arid soils and their response to climate change.

How to cite: Bayad, M., Gerard, B., Chehbouni, A., J. Hawkesford, M., Wai Chau, H., Bouray, M., Hamma, A., El Akrouchi, M., and Biswas, A.: Change Drivers and Spatial Distribution of Soil Organic Carbon Concentrations in Croplands of Morocco, EGU General Assembly 2025, Vienna, Austria, 27 Apr–2 May 2025, EGU25-19648, https://doi.org/10.5194/egusphere-egu25-19648, 2025.

EGU25-20331 | ECS | Orals | SSS5.6

 The effects of mammal and insect herbivory on above and belowground C allocation by tree seedlings in a temperate forest 

Lais Ferreira Maia, Holly Langridge, Ully Kritzler, David Johnson, Daniel E. Hidalgo, and Hannah Griffiths

Herbivory is a key ecosystem process in terrestrial systems that influences belowground processes. In forest environments, insect herbivory alone can lead to the loss of 2-15% of foliar biomass annually. When plants experience aboveground herbivory, they may change the amount of carbon allocated to the soil via their roots, either by increasing or decreasing root exudation and turnover. These changes in carbon allocation can influence the structure and activity of the root-associated microbial communities. Similarly, herbivory by mammals can affect soil communities by changing the input of easily accessible C through contributions like plant litter and excrement. However, how plants manage C allocation above and belowground in response to mammalian versus insect herbivory remain poorly understood. Therefore, we assessed if plants differentially respond to mammalian vs. insect herbivory via changes in the quantity of C entering the soil in root exudates, resulting in shifts in soil biotic communities with consequences for C cycling and storage. To do this, we carried out a field-based 13C pulse chase experiment in a temperate forest, in which we subjected 3-year-old oak seedlings (Q. robur) to simulated herbivory by insects and mammals followed by 13C enrichment. Following plant assimilation of the labelled carbon (13C) we tracked carbon allocation to root exudates, leaves, roots, rhizosphere soil, soil fauna and continuously monitored soil 13CO2 efflux for five days. During the two-month experimental period, conducted on 36 seedlings, we observed that soil carbon efflux increased over time across all treatments. This is likely because plants were at a later stage phenologically, better able to assimilate C and therefore more C available to allocate belowground. Further results are being analysed and will be presented at the conference. Quantifying these cascading and interactive above-ground, below-ground effects is a research priority given global change-induced changes in invertebrate communities, current forest management strategies and rates of change in mammal populations.

How to cite: Ferreira Maia, L., Langridge, H., Kritzler, U., Johnson, D., E. Hidalgo, D., and Griffiths, H.:  The effects of mammal and insect herbivory on above and belowground C allocation by tree seedlings in a temperate forest, EGU General Assembly 2025, Vienna, Austria, 27 Apr–2 May 2025, EGU25-20331, https://doi.org/10.5194/egusphere-egu25-20331, 2025.

EGU25-20541 | ECS | Posters on site | SSS5.6

Priming and organic carbon stability in soil parent materials 

Christopher McCloskey and Daniel Evans

Over the past decade, both national (UK) and multilateral (EU) climate legislation have significantly accelerated research efforts to mitigate soil carbon emissions, enhance soil organic carbon (OC) sequestration, and promote long-term OC storage. However, these efforts face substantial challenges. Increasing demands on land use and the resulting land-cover changes often lead to significant net losses of OC. Furthermore, climate warming exacerbates OC losses through accelerated decomposition processes. Although the soil carbon reservoir has a finite capacity, its potential is limited by an arbitrary boundary: the lower limit of soil profiles, separating them from the underlying zone of soil parent material. Soil parent materials consist of consolidated substrates (e.g., weathered rock) and unconsolidated ones (e.g., alluvium) from which soils primarily develop. Emerging evidence indicates that soil parent materials has stores of biogenic organic carbon. However, our understanding of the stability of carbon at the interface between soil parent materials and soils remains limited. This presentation explores the stability of organic carbon within soil parent materials, focusing specifically on the effects of priming on OC stability. 

How to cite: McCloskey, C. and Evans, D.: Priming and organic carbon stability in soil parent materials, EGU General Assembly 2025, Vienna, Austria, 27 Apr–2 May 2025, EGU25-20541, https://doi.org/10.5194/egusphere-egu25-20541, 2025.

EGU25-1108 | ECS | Orals | AS3.43

Field based greenhouse gas emission measurement from onsite containments in Nepal. 

Prativa Poudel, Sarana Tuladhar, Anish Ghimire, Guy Howard, Miller Alonso Camargo-Valero Camargo-Valero, Barbara Evans, Olivia Reddy, and Subodh Sharma

On-site sanitation systems (OSS) generate greenhouse gases (GHGs) during the decomposition of fecal matter. The reported measurements of these emissions are confined to a restricted number of research examining septic tanks in high-income nations. We conducted field measurements of onsite containments to generate emissions data for Nepal. This represents the first empirical investigation of greenhouse gas emissions from onsite containments in low- and middle-income countries. Emissions were recorded from a panel of pit latrines (n=18), holding tanks (n=6), septic tanks (n=3), between December 2021 and December 2022. A calibrated static flux chamber was designed was and deployed to collect gases samples at each containment site. Portable gas analyzers were employed to quantify methane (CH4), carbon dioxide (CO2), and nitrous oxide (N2O). Results will be provided in detail. Preliminary investigation showed a substantial range in emissions rates notably CH4 across different types of onsite sanitation containments. Statistical test indicated methane emission rates varied considerably within containment types (P value<0.05). N2O was not discovered in any of the sample containments. Our preliminary findings indicate that onsite containment emissions are greater than anticipated and may be a key area for improvement in order to get net zero emissions.

How to cite: Poudel, P., Tuladhar, S., Ghimire, A., Howard, G., Camargo-Valero, M. A. C.-V., Evans, B., Reddy, O., and Sharma, S.: Field based greenhouse gas emission measurement from onsite containments in Nepal., EGU General Assembly 2025, Vienna, Austria, 27 Apr–2 May 2025, EGU25-1108, https://doi.org/10.5194/egusphere-egu25-1108, 2025.

EGU25-1198 | Posters on site | AS3.43

Capturing and translating the dynamics of traffic emissions using a congestion-based framework 

Pak Lun Fung, Daniel Kühbacher, Tilman Hohenberger, Jia Chen, and Leena Järvi

Traffic congestion remains one of the biggest environmental and social issues in urban cities. Insights from traffic reports, modelling results, and real-world measurements show that traffic congestion would exacerbate vehicular emissions of up to 55%, compared to optimal driving conditions in highly congested urban areas.

To capture the dynamics of traffic patterns, we built our geospatial framework by utilising multiple sources of traffic data: traffic counts and speeds by local in-situ traffic counters, open-access aggregated floating car data (TomTom and Google Traffic), and a standardised functional road classification. The framework also incorporates meteorological parameters that affect the traffic capacity of urban road network to calculate the traffic density. Together with a projected fleet composition and its corresponding speed-dependent traffic emission factors, we computed the resulting dynamic traffic emissions of greenhouse gases (e.g. carbon dioxide CO2) and air pollutants (e.g. carbon monoxide CO and nitrogen oxides NOx) in gridded format. These can then be deployed in existing urban climate models to quantify climatic effects and air pollutant exposure induced by road transportation, and in particular congestion.

We applied the framework in two cities in Europe with distinct traffic behaviour: Helsinki and Munich. The preliminary results show relatively good performance in capturing the dynamics of traffic density in both cities (R2 = 0.78–0.88). The framework was further evaluated against their local emission inventory. However, this gave varying results for different emittants for different road classes in both cities. Beyond local applicability, we also explored the scalabilty of the framework. Applying the calibration coefficients trained in one city and testing in another, we found that road classes such as local connecting roads behaved similarly in both places (r = 0.70–0.96 ) while some others did not.

This initiative sheds light on the feasibility of translating the framework to a larger scale beyond a few cities in Europe. Our future step is to improve the scalability of the framework by including existing large-scale multi-city traffic datasets on urban roads worldwide to better model the heterogeneity of the traffic patterns and emissions in the world.

How to cite: Fung, P. L., Kühbacher, D., Hohenberger, T., Chen, J., and Järvi, L.: Capturing and translating the dynamics of traffic emissions using a congestion-based framework, EGU General Assembly 2025, Vienna, Austria, 27 Apr–2 May 2025, EGU25-1198, https://doi.org/10.5194/egusphere-egu25-1198, 2025.

EGU25-1263 | ECS | Orals | AS3.43

Drivers of CO2 emissions from road transport in U.S. urban areas 

Xavier Bonnemaizon, Philippe Ciais, Chuanlong Zhou, Simon Ben Arous, Nicolas Megel, Gunnar Berghaüser, and Steven J. Davis

Road transportation in U.S. urban areas accounts for roughly two-thirds of on-road CO2 emissions. Yet the drivers of those transportation emissions and differences among cities are not well-understood owing to limited availability of detailed data until recently. Here, we use high-resolution Floating Car Data to analyze street-level transportation emissions in 457 U.S. urban areas (hereinafter referred to as cities) in 2022, and decompose the key drivers of differences among them. Our study reveals that cities with greater population densities tend to have lower per capita road transportation emissions due to lower travel demand (R2 = 0.36) without significant increases in traffic congestion that represent only a fraction of the total (2-10%). Furthermore, we find that variations in vehicle fleets (e.g., electrification) are still a secondary driver of city-scale transportation emissions. These findings underscore the importance of tailored interventions to mitigate cities’ transportation emissions and may be used to support more sustainable urban transportation systems.

How to cite: Bonnemaizon, X., Ciais, P., Zhou, C., Ben Arous, S., Megel, N., Berghaüser, G., and J. Davis, S.: Drivers of CO2 emissions from road transport in U.S. urban areas, EGU General Assembly 2025, Vienna, Austria, 27 Apr–2 May 2025, EGU25-1263, https://doi.org/10.5194/egusphere-egu25-1263, 2025.

Detecting, reporting, and mitigating fugitive methane leaks has been identified as one way of  lowering national methane emissions in the United States.  To that effect, the United States Environmental Protection Agency has launched a new super emitter program that relies on technologies that can detect and report methane leaks for mitigation.  NOAA is exploring the option of utilizing its fleet of geostationary and polar-orbiting satellite sensors to operationalize the short wave infrared Multi Band Multi Pass methane detection algorithm developed by Harvard University.  Prior to transitioning the technology to NOAA operations, a careful evaluation of retrievals from the two sensors, Advanced Baseline Imager on GOES-R series and Visible Infrared Imaging Radiometer Suite on JPSS series is needed.  NOAA satellites can detect only large methane plumes (tons per hour) and benchmarking the capability is critical to work with stakeholders such as the EPA.  To do that, NOAA is partnering with facility operators that conduct timed large methane releases during pipeline blowdown events to validate satellite methane detections and quantification of emissions. NOAA, in partnership with the Pipeline Research Council International, conducted its first pipeline blowdown experiment on October 8, 2024, deploying methane-monitoring technologies across ground, air, and space to track a controlled methane release. Three NOAA geostationary satellites viewing the plume from different geometries detected the plume along with various ground and airborne instruments - all systems reported methane flux estimates that are closer to the values reported by the pipeline operator.  Results of this controlled release experiment will be presented along with plans to conduct additional experiments, jointly with NASA, to validate methane plumes from civilian satellite data as well as those detected by commercial plume mappers such as GHGSat, CarbonMapper, and MethaneSat.

How to cite: Kondragunta, S., Varon, D., and He, T.: Assessing Methane Detection Capabilities of Operational Satellite Sensors using Controlled Release Experiments, EGU General Assembly 2025, Vienna, Austria, 27 Apr–2 May 2025, EGU25-3293, https://doi.org/10.5194/egusphere-egu25-3293, 2025.

EGU25-4446 | Posters on site | AS3.43

Improving GHG emissions estimates and multidisciplinary climate research using nuclear observations: the NuClim project 

Susana Barbosa and Scott Chambers and the NuClim Team

Radon (Rn-222) is a unique atmospheric tracer, since it is an inert gaseous radionuclide with a predominantly terrestrial source and a short half-life (3.8232 (8) d), enabling quantification of the relative degree of recent (< 21 d) terrestrial influences on marine air masses. High quality measurements of atmospheric radon activity concentration in remote oceanic locations enable the most accurate identification of baseline conditions. Observations of GHGs under baseline conditions, representative of hemispheric background values, are essential to characterise long-term changes in hemispheric-mean GHG concentrations, differentiate between natural and anthropogenic GHG sources, and improve understanding of the global carbon budget.

The EU-funded project NuClim (Nuclear observations to improve Climate research and GHG emission estimates) will establish world-leading high-quality atmospheric measurements of radon activity concentration and of selected GHG concentrations (CO2, and CH4) at a remote oceanic location, the Eastern North Atlantic (ENA) facility, managed by the Atmospheric Radiation Measurement (ARM) programme (Office of Science from the U.S. Department of Energy), located on Graciosa Island (Azores archipelago), near the middle of the north Atlantic Ocean. These observations will provide an accurate, time-varying atmospheric baseline reference for European greenhouse gas (GHG) levels, enabling a clearer distinction between anthropogenic emissions and slowly changing background levels. NuClim will also enhance measurement of atmospheric radon activity concentration at the Mace Head Station, allowing the identification of latitudinal gradients in baseline atmospheric composition, and supporting the evaluation of the performance of GHG mitigation measures for countries in the northern hemisphere.

The high-quality nuclear and GHG observations from NuClim, and the resulting classification of terrestrial influences on marine air masses, will assist diverse climate and environmental studies, including the study of pollution events, characterisation of marine boundary layer clouds and aerosols, and exploration of the impact of natural planktonic communities on GHG emissions. This poster presents an overview of NuClim, outlines the project objectives and methodologies, and summarises the relevant data products that will be made available to the climate community.

Project NuClim received funding from the EURATOM research and training program 2023-2025 under Grant Agreement No 101166515.

How to cite: Barbosa, S. and Chambers, S. and the NuClim Team: Improving GHG emissions estimates and multidisciplinary climate research using nuclear observations: the NuClim project, EGU General Assembly 2025, Vienna, Austria, 27 Apr–2 May 2025, EGU25-4446, https://doi.org/10.5194/egusphere-egu25-4446, 2025.

 Thermoelectric coolers (TECs) differ from conventional cooling devices that use refrigerants in that they utilize the Peltier effect to convert electrical energy into thermal energy, generating a cooling effect [1]. Therefore, unlike conventional cooling devices that use refrigerants such as CFCs, which have a high global warming potential and emit greenhouse gases, thermoelectric coolers have a different environmental impact. Particularly during the usage phase, since electrical energy is converted into thermal energy during operation, it is important to assess the emissions during electrical energy generation. Particularly, the COP of thermoelectric coolers is currently much lower compared to conventional coolers [2], meaning that a greater amount of electrical power is required to achieve the same cooling amount.

 Additionally, during the production phase, the manufacturing of alumina plates generates 90.7% of greenhouse gas emissions, and the sintering process involved in the production of alumina plates contributes 87.3% of the emissions. The primary cause of greenhouse gas emissions during the sintering process is the high temperature and pressure, and the large amount of power used to compact the powder. Therefore, methods to reduce energy consumption should be considered to address the hotspots of the sintering process and reduce the greenhouse gases associated with alumina plates production phase.

 Consequently, possible methods and quantities of greenhouse gas reduction were aimed to be identified by improving the process to reduce energy consumption in the sintering process. In addition, since the main input material is electricity, there is a way for the grid mix to become more eco-friendly. For this purpose, a method of adding sintering aids and applying eco-friendly grid mix is considered. Sintering aids can reduce energy consumption by up to 1.4 times [3], resulting in 28.6% reduction in emissions during the sintering process, from 466.1 kg CO2-eq to 333.0 kg CO2-eq. Additionally, producing with the 2030 power grid mix, which reduces fossil fuel use and increases renewable energy, results in a reduction of 80.0kg CO2-eq, leading to a 38.6% decrease in emissions during sintering process.


Reference

[1] Newby, S., Mirihanage, W., Fernando, A., 2025. Body heat energy deriven knitted thermoelectric garments with personal cooling. Applied Thermal Engineering, 258 (A)., pp. 124546.

[2] Tian, M., Aldawi, F., Anqi, A.E., Moria, H., Dizaji, H.S., Wae-hayee, M., 2021. Cost-effective and performance analysis of thermoelectricity as a building cooling system; experimental case study based on a single TEC-12706 commercial module. Case Studies in Thermal Engineering, 27, pp. 101366.

[3] Heidary, D. S. B., Lanagan, M., and Randall, C. A., 2018. Contrasting energy efficiency in various ceramic sintering processes. Journal of the European Ceramic Society 38(4), 1018-1029.

How to cite: Kim, H. Y. and Wee, D.: Analysis on greenhouse gas reduction strategies for thermoelectric coolers using cradle-to-gate life cycle assessment, EGU General Assembly 2025, Vienna, Austria, 27 Apr–2 May 2025, EGU25-4694, https://doi.org/10.5194/egusphere-egu25-4694, 2025.

EGU25-4839 | Orals | AS3.43

Monitoring urban CO2 emissions from space: current status and future potential 

Abhishek Chatterjee, Doyeon Ahn, Dustin Roten, Matthaus Kiel, Robert Nelson, Thomas Kurosu, Dien Wu, John Lin, and Kevin Gurney

Cities with their large, dense populations are concentrated sources of CO2 emissions to the atmosphere. Although more than 60% of global fossil fuel CO2 emissions are from cities, yet we lack high-quality city-level emissions inventories and/or independent verification datasets across the majority of global cities. Several cities have also adopted ambitious goals of reaching net-zero emissions by 2030 or 2050. In fact, most recently at COP28, several cities, including those in non-Annex I countries, signed up to be part of the Coalition for High Ambition Multilevel Partnerships for Climate Action (CHAMP ; UNFCCC COP28), thereby obligating themselves to report emissions on a timely basis. So, how can we assist city-scale and local policy and decision-making entities to utilize information from space-based observations to monitor and track GHG emissions? In this presentation, I will show the application of OCO-2 and OCO-3 data across a suite of global cities worldwide. I will show that well-defined and robust mathematical frameworks can exploit the information content in dense, fine-scale, space-based CO2 data to deliver not only whole-city or total emission estimates but also attribute them to individual sectors, such as large point sources, on-road emissions, etc. I will also show some examples from recent studies that illustrate the value of exploiting co-located emissions of other species (such as CO, NO2, CH4) to obtain novel insights into sectoral emission characteristics. Examples from OCO-3, TROPOMI and EMIT data will be shown to demonstrate the value of assimilating information from disparate tracers for reliable source attributions. Even though there are methodological challenges in setting up a multi-species framework, the problem is not insurmountable. Development and refinement of such multi-species frameworks need to start now in order to unlock the true potential of space-based datasets. This is also crucial to optimally utilizing the information from future space-based CO2 emission monitoring sensors, such as Carbon Mapper, ESA’s CO2M, JAXA’s GOSAT-GW and other planned missions. The presentation will conclude with a discussion of implications of space-based datasets for tracking city- and country-level progress towards meeting proposed CO2 emission reduction goals and its value and benefit for advancing bottom-up emission inventories.

How to cite: Chatterjee, A., Ahn, D., Roten, D., Kiel, M., Nelson, R., Kurosu, T., Wu, D., Lin, J., and Gurney, K.: Monitoring urban CO2 emissions from space: current status and future potential, EGU General Assembly 2025, Vienna, Austria, 27 Apr–2 May 2025, EGU25-4839, https://doi.org/10.5194/egusphere-egu25-4839, 2025.

EGU25-5294 | ECS | Posters on site | AS3.43

Leveraging wide area XCO2 deep learning in estimating urban CO2 emissions from space 

Zeyu Wang and Feng Zhang

Urban areas account for more than 70% of fossil fuel carbon dioxide (CO2) emissions worldwide. Recent (OCO-3 released in 2019) and forthcoming (CO2M, TANSAT-2, and GOSAT-GW) greenhouse gas satellites can observe wide area column average dry air mole fraction of carbon dioxide (XCO2) of entire urban areas. Although top-down urban emission monitoring has improved in terms of spatial coverage and frequency, the challenge remains in how to utilize space-based observations to perform accurate inversion of source area’s emission. The high uncertainty mainly arises from XCO2 observations’ low signal-to-noise ratio due to non-anthropogenic fluxes and missing data due to sophisticated atmospheric conditions. 

To achieve accurate urban emission estimation from space, we propose a deep learning (DL) framework which can intelligently capture XCO2 patterns from wide area XCO2 observations. The synthetic CO2M dataset serves as model pre-training materials for its ideal XCO2 observations given by chemical transport model. Transformer is selected as the architecture of DL model for its ability to model global dependency across wide area observations. The proposed model has been validated on the Berlin city’s synthetic CO2M dataset and OCO-3 snapshot area map (SAM) mode observations. In both cases, the pre-trained DL model effectively interpolated missing XCO2 values throughout the XCO2 snapshot, and showed outperformance on urban plume signal identification compared to conventional algorithms. Furthermore, by incorporating DL model’s prediction results with inversion methods, we performed emission estimates for Berlin city on synthetic CO2M data and multiple cities globally on OCO-3 SAMs. Our top-down emission estimation results showed high consistency with prior bottom-up inventories. This study provides valuable insights into advancing intelligent methodologies for urban emission inversion from wide area satellite observations.

How to cite: Wang, Z. and Zhang, F.: Leveraging wide area XCO2 deep learning in estimating urban CO2 emissions from space, EGU General Assembly 2025, Vienna, Austria, 27 Apr–2 May 2025, EGU25-5294, https://doi.org/10.5194/egusphere-egu25-5294, 2025.

EGU25-5388 | ECS | Posters on site | AS3.43

The nitrous oxide budget in China 

Ziyuan Sun, Zimeng Li, and Songbai Hong

Nitrous oxide (N2O) is a kind of long-lived greenhouse gas. Since the Industrial Revolution, increasing atmospheric N2O concentrations have contributed to the depletion of the stratospheric ozone layer and climate change. China has been a hot spot for global N2O emissions, with a rapid growth. However, estimates of N2O emissions from China’s ecosystem remain largely uncertain. Therefore, here we provide a multi-method estimates (inventory, process-based model and atmospheric inversion) of terrestrial ecosystem N2O emissions in China. The process-based models were further modified based on observational datasets. Finally, we provide a comprehensive quantification of China's N2O emissions caused by natural and anthropogenic ecosystems from 1980 to 2023.

How to cite: Sun, Z., Li, Z., and Hong, S.: The nitrous oxide budget in China, EGU General Assembly 2025, Vienna, Austria, 27 Apr–2 May 2025, EGU25-5388, https://doi.org/10.5194/egusphere-egu25-5388, 2025.

EGU25-5425 | Orals | AS3.43

Quantify natural gas methane emissions from a city cluster in East China 

Yuzhong Zhang, Yujia Zhao, Xinlu Wang, Rui Wang, Botian Qiu, Shuang Zhao, Yanli Zhang, Zhengning Xu, Xiangyu Pei, Zhibin Wang, Youwen Sun, Cheng Huang, and Ying Zhou

The consumption of natural gas in China, predominantly in cities, has nearly tripled over the past decade. However, there is an absence of measurement-based assessment of methane emissions from natural gas consumption in Chinese cities. Moreover, it is challenging to separate the contribution of natural gas relative to other major urban methane sources (e.g., wastewater, landfills) using only methane observations. Here, we use in-situ and total-column ethane observations across the Yangtze River Delta, one of China’s most important metropolitan areas, between 2012 and 2021, to quantify methane emissions from the natural gas sector. Ethane is co-emitted with methane in natural gas and has no significant biogenic sources, and therefore serves as a tracer to separate the contribution of natural gas from other methane sources. To interpret ethane observations, we apply atmospheric chemical transport simulations with the GEOS-Chem model to account for transport, mixing, and chemical decay. Our analysis reveals that surface ethane concentrations have increased by 0.25–0.3 ppb a-1 at city-cluster sites, in contrast to a stable global background concentration and a slightly negative trend in regional total-column measurements. The simulation indicates that a substantial natural gas leakage rate (2.5–4.1%) is required to replicate the observed trend. This leakage rate implies that natural gas consumption emits 0.55–0.9 Tg methane emissions annually in the Yangtze River Delta, accounting for about 5.1–8.4% of the regional total emissions. Our findings indicate that natural gas usage is a substantial contributor to methane emissions and their growth in East China.

How to cite: Zhang, Y., Zhao, Y., Wang, X., Wang, R., Qiu, B., Zhao, S., Zhang, Y., Xu, Z., Pei, X., Wang, Z., Sun, Y., Huang, C., and Zhou, Y.: Quantify natural gas methane emissions from a city cluster in East China, EGU General Assembly 2025, Vienna, Austria, 27 Apr–2 May 2025, EGU25-5425, https://doi.org/10.5194/egusphere-egu25-5425, 2025.

EGU25-5703 | Orals | AS3.43

Inverse Modeling of High Global Warming Potential Perfluorinated Greenhouse Gases in Southeastern China 

Yuyang Chen, Bo Yao, Minde An, Ao Ding, Song Liu, Xicheng Li, Yali Li, Simon O'Doherty, Paul Krummel, and Lei Zhu

Sulfur hexafluoride (SF6), nitrogen trifluoride (NF3), and three types of perfluorocarbons (PFCs; PFC-14, PFC-116, and PFC-318) are perfluorinated greenhouse gases (PF-GHGs). PF-GHGs have long atmospheric lifetimes and global warming potentials thousands of times greater than carbon dioxide (CO2). Using high-frequency continuous in situ observations from the Xichong Monitoring station at Shenzhen, China and a Bayesian inversion framework, we assess the 2021-2023 PF-GHG emissions in southeastern China, a region featuring substantial growth in population and industries. We find a continued increase in emissions of all PF-GHGs. During 2021-2023, NF3 emissions show the highest annual growth rate of 40.38% yr-1, likely linked with the increasing demand in semiconductor industries in this region, while PFC-14 has the lowest of 5.87% yr-1. Regarding CO2-equivalent emissions, SF6 contributes the most to total PF-GHG growth (51.75%), followed by NF3 (30.86%). As for the seasonality in PF-GHG emissions in southeastern China, SF6 and PFC-116 emissions show significant seasonal variation. The seasonal variabilities in SF6 are likely associated with the high winter electricity demand, while the winter peaks in PFC-116 emissions may tie with semiconductor manufacturing. PFC-318 exhibits the largest seasonal variation, with a winter-to-spring and autumn emissions ratio of 5.10. The increased PFC-318 emissions in winter might be due to heightened HCFC-22 feedstock uses. The findings provide guidance for targeted mitigation strategies to address the rising emissions.

How to cite: Chen, Y., Yao, B., An, M., Ding, A., Liu, S., Li, X., Li, Y., O'Doherty, S., Krummel, P., and Zhu, L.: Inverse Modeling of High Global Warming Potential Perfluorinated Greenhouse Gases in Southeastern China, EGU General Assembly 2025, Vienna, Austria, 27 Apr–2 May 2025, EGU25-5703, https://doi.org/10.5194/egusphere-egu25-5703, 2025.

EGU25-6791 | ECS | Posters on site | AS3.43

Global Emissions of Tetrafluoromethane (CF4) Hexafluoroethane (C2F6) Determined by Inverse Modeling 

Benjamin Püschel, Luise Kandler, Martin Vojta, and Andreas Stohl

We determined global emissions of the perfluorocarbons (PFC) tetrafluoromethane (CF4) and hexafluoroethane (C2F6) from 2004 to 2023 using an inverse modeling approach. These PFCs are characterised by their exceptionally long atmospheric lifetimes (~50.000y for CF4 and ~10.000y for C2F6) and strong infrared absorption, making them some of the most potent greenhouse gases. Emissions of these gases are almost entirely anthropogenic, originating primarily from aluminium smelting and semiconductor manufacturing. Previous studies have highlighted significant discrepancies between bottom-up inventories, based on activity and industry data, and top-down estimates derived from atmospheric measurements. In this study, we use continuous and flask measurements combined the Bayesian inversion algorithm FLEXINVERT+ and the Lagrangian particle dispersion model FLEXPART to estimate global emissions of CF4 and C2F6 and their regional distribution. Our findings indicate a decline in emissions until approximately 2009, followed by an increase in subsequent years, contrasting with bottom-up inventories, which show a steady decrease over the study period. The largest emissions are located primarily in East Asia, with substantial potential emissions in South and Southeast Asia, followed by North America and Europe. India and Malaysia, with their growing aluminium (India) and semiconductor (Malaysia) industries, emerge as significant sources of uncertainty in our emission estimates due to limited observational coverage in these regions. While emission reduction measures in the aluminium industry appear to be effective, the impact of mitigation efforts by semiconductor manufacturers are likely overestimated.

How to cite: Püschel, B., Kandler, L., Vojta, M., and Stohl, A.: Global Emissions of Tetrafluoromethane (CF4) Hexafluoroethane (C2F6) Determined by Inverse Modeling, EGU General Assembly 2025, Vienna, Austria, 27 Apr–2 May 2025, EGU25-6791, https://doi.org/10.5194/egusphere-egu25-6791, 2025.

EGU25-6956 | ECS | Orals | AS3.43

Emissions of the powerful greenhouse gas HFC-23 suggest significant under-reporting since the implementation of the Kigali Amendment 

Ben Adam, Luke Western, Jens Muhle, Haklim Choi, Paul Krummel, Simon O'Doherty, Dickon Young, Kieran Stanley, Paul Fraser, Christina Harth, Peter Salameh, Ray Weiss, Ronald Prinn, Jooil Kim, Hyeri Park, Sunyoung Park, Alistair Manning, Anwar Khan, Dudley Shallcross, and Matt Rigby

HFC-23 (trifluoromethane) is a potent greenhouse gas, believed to be emitted to the atmosphere primarily as a by-product during the production of the refrigerant and feedstock HCFC-22 (chlorodifluoromethane). Due to the high global warming potential of HFC-23 (GWP100 ~ 14,700), the Kigali Amendment to the Montreal Protocol requires countries to limit their emissions of HFC-23 as much as possible and report these emissions to the United Nations Environment Programme. Global reported emissions have been in the range 2-3 Gg yr-1 since 2019 and reflect the near-total destruction of emissions from HCFC-22 production reported by the countries with major HCFC-22 manufacturers, such as China and India. However, atmospheric observations show that, whilst emissions fell from their maximum in 2019 of 17.3 ± 0.8 Gg yr-1 to 14.0 ± 0.9 Gg yr-1 in 2023, they remain many times higher than reported. In addition, regional inverse modelling was performed based on measurements from the AGAGE site at Gosan, South Korea, using three different Bayesian inverse models (FLEXINVERT+, InTEM and RHIME) to estimate emissions from eastern China. These inversions use the same observational data, but different transport models, baselines, priors and uncertainties. Results are compared to better quantify regional emissions and their uncertainties. The results suggest that emissions from eastern China are four to six times higher than reported for the whole of China.  

In addition, we examine the emission of HFC-23 as a by-product during the production of other hydrofluorocarbons and fluorochemicals. In-atmosphere HFC-23 production (from the breakdown of certain hydrofluoroolefins used as replacements for HFCs) is also investigated further using a 3D chemical transport model incorporating photolysis and ozonolysis reactions. Our results indicate that, based on currently available information, these potential alternative sources contribute less than 2.0 Gg yr-1 to global emissions. This suggests that HFC-23 emissions from HCFC-22 production have been consistently under-reported since the implementation of the Kigali Amendment. It therefore appears likely that abatement of HFC-23 emissions has not occurred to the extent reported in this period. Improved monitoring and verification of HFC-23 emissions from industrial sources is essential to the continued success and efficacy of the Kigali Amendment.

How to cite: Adam, B., Western, L., Muhle, J., Choi, H., Krummel, P., O'Doherty, S., Young, D., Stanley, K., Fraser, P., Harth, C., Salameh, P., Weiss, R., Prinn, R., Kim, J., Park, H., Park, S., Manning, A., Khan, A., Shallcross, D., and Rigby, M.: Emissions of the powerful greenhouse gas HFC-23 suggest significant under-reporting since the implementation of the Kigali Amendment, EGU General Assembly 2025, Vienna, Austria, 27 Apr–2 May 2025, EGU25-6956, https://doi.org/10.5194/egusphere-egu25-6956, 2025.

EGU25-8355 | ECS | Orals | AS3.43

Bridging the Fleet Distribution Data Gap with Satellite Imagery and Deep Learning for GHG Estimation 

Bilal Aslam, Toby Hocking, Pawlok Dass, Anna Kato, and Kevin Gurney

Precise quantification of greenhouse gas (GHG) emissions is important for better urban sustainability. Transportation is one of the primary contributing sources of greenhouse gas emissions. To quantify better on-road GHG emissions, it is essential to decode fleet distribution. However, globally, many cities do not have the infrastructure to calculate a fleet distribution. Therefore, there will always be an uncertain error in the on-road GHG emissions estimation. However, very high-resolution satellite data can be helpful to overcome this gap due to its global temporal coverage. Hence, this study proposes a deep learning method, Faster Region-based Convolutional Neural Network (Faster R-CNN), and You Look Only Once (YOLO) based vehicle detection to identify the vehicles and vehicle categories from the very high-resolution satellite data and estimate the fleet distribution. The results show that our model can identify, Passenger Cars, Buses, Trucks, and Large Passenger Cars with the precision of 93.30%, 79.50%, 78.90%, and 81.15%, respectively. We applied this model to temporally available satellite images of Phoenix and calculated the fleet distribution and calculated the FFCO2 based on that fleet distribution and compared it with FFCO2 estimated using CURB dataset fleet distribution. Results show that CURB data-based FFOC2 is over-predicting by 22%, while using fleet distribution estimated by this method, FFCO2 over-predicting by 17% w.r.t VULCAN. These findings demonstrate the effectiveness of satellite-based fleet distribution estimation for improving FFCO₂ quantification in cities lacking robust data infrastructure. This approach provides a scalable and data-driven pathway to more accurate urban emissions modeling, enabling better-informed urban planning and sustainability efforts.

How to cite: Aslam, B., Hocking, T., Dass, P., Kato, A., and Gurney, K.: Bridging the Fleet Distribution Data Gap with Satellite Imagery and Deep Learning for GHG Estimation, EGU General Assembly 2025, Vienna, Austria, 27 Apr–2 May 2025, EGU25-8355, https://doi.org/10.5194/egusphere-egu25-8355, 2025.

EGU25-8609 | Posters on site | AS3.43

Enhancing top-down HFC-134a emission estimates through parameter space exploration 

Seyed omid Nabavi, Martin Vojta, Anjumol Raju, Sophie Wittig, and Andreas Stohl

Bayesian inverse modeling is a widely used approach for estimating greenhouse gas (GHG) emissions from atmospheric measurements. However, this method is subject to various uncertainties, including errors in the transport model, inaccuracies in baseline mole fractions, and uncertainties associated with the parameters of the Bayesian inversion framework.

In this study, we investigated the impact of these uncertainties on the Bayesian inversion of a key hydrofluorocarbon contributing to climate change, HFC-134a. We first conducted a grid search to refine the nudging parameters for simulating three-dimensional initial HFC fields using the FLEXible PARTicle-Linear Chemistry Module (FLEXPART-LCM). Subsequently, we employed Latin Hypercube Sampling (LHS) to explore inversion uncertainties by sampling a broad parameter space within the Bayesian inverse modeling framework FLEXINVERT.

Through over 250 ensemble simulations for initial fields and 15,000 ensemble inversion runs, we identified the most influential parameters and optimized configurations for the inverse modeling of HFC-134a. These findings improve the reliability of HFC-134a emission estimates and provide insights into the role of inversion parameters, applicable to the inversion of other greenhouse gases.

How to cite: Nabavi, S. O., Vojta, M., Raju, A., Wittig, S., and Stohl, A.: Enhancing top-down HFC-134a emission estimates through parameter space exploration, EGU General Assembly 2025, Vienna, Austria, 27 Apr–2 May 2025, EGU25-8609, https://doi.org/10.5194/egusphere-egu25-8609, 2025.

EGU25-10046 | Orals | AS3.43

Measurement and modelling of Eddy-covariance fluxes of CO2 in the city of Zurich 

Dominik Brunner, Leonie Bernet, Lionel Constantin, Betty Molinier, Natascha Kljun, Rainer Hilland, Andreas Christen, Ingrid Super, Junwei Li, Jia Chen, Stavros Stagakis, and Lukas Emmenegger

The city of Zurich, Switzerland, aims to achieve net-zero greenhouse gas emissions by the year 2040. To support the city in monitoring its path towards this ambitious goal, an emission monitoring program has been established with two complementary approaches. The first involves a network of CO2 mid- and low-cost sensors in combination with atmospheric transport inverse modelling. The second, presented here, combines CO2 flux measurements from an Eddy-covariance system installed on a 17 m mast on top of a 95 m tall building in the city center with flux footprint modeling and a high-resolution emission inventory.

Here we present a detailed comparison between hourly simulated and observed CO2 fluxes for a period of two years (August 2022 – August 2024) to evaluate the inventory and its partitioning into source sectors. The simulated fluxes were obtained by multiplying the footprints with the sectorially resolved emissions from the inventory, all available on a 10 m x 10 m grid. The sectorial emissions were scaled by temporal factors describing diurnal, day-of-week and seasonal variability. Traffic emissions, for example, were scaled using actual traffic counts from 182 counters and heating emissions were scaled with a heating-degree-day factor based on outdoor temperatures. In addition to anthropogenic emissions, biospheric CO2 fluxes from trees, lawns and cropland were simulated at 10 m x 10 m resolution with the Vegetation Photosynthesis and Respiration Model (VPRM), driven by local temperature and radiation measurements and Sentinel-2 satellite observations.

The simulated hourly fluxes, which change in time due to the varying footprints and temporal scaling factors, were found to be strongly correlated with the observed fluxes but were, on average, higher, suggesting that the inventory overestimates the actual emissions from the city. The comparison also allowed us to improve the temporal scaling factors of certain sectors, for example, to better represent the reduced emissions during holidays or the heating demand during the transition periods between winter and summer. Accurately representing the temporal variability is important, as it allows disentangling source sectors that follow different temporal profiles. The results demonstrate the capability of tracking the CO2 emissions of a central part of Zurich with a single, well-placed flux tower with an accuracy that is suitable for evaluating the expected emission reductions in the coming decades.

How to cite: Brunner, D., Bernet, L., Constantin, L., Molinier, B., Kljun, N., Hilland, R., Christen, A., Super, I., Li, J., Chen, J., Stagakis, S., and Emmenegger, L.: Measurement and modelling of Eddy-covariance fluxes of CO2 in the city of Zurich, EGU General Assembly 2025, Vienna, Austria, 27 Apr–2 May 2025, EGU25-10046, https://doi.org/10.5194/egusphere-egu25-10046, 2025.

EGU25-10322 | ECS | Posters on site | AS3.43

 Utilizing tropospheric CO isotope observations from a low-latitude Atlantic sampling network to constrain the oxidative chlorine sink  

Chloe Brashear, Maarten van Herpen, Berend van de Kraats, Matthew Johnson, Luisa Pennacchio, Marie Mikkelsen, Alfonso Saiz-Lopez, Daphne Meidan, and Thomas Röckmann

The isotopic composition of CO can be used to detect enhanced oxidation of methane by atomic chlorine due to the strong kinetic isotope effect related to this reaction (KIECH4+Cl = 66 per mil). Importantly, this detection method has demonstrated the presence of a large ground-level North Atlantic chlorine source for the years 1996-1997, linked to the geographic distribution of iron-rich Sahara dust within the marine boundary layer (Mak et al., 2003; van Herpen et al., 2023). Here, we present 2023-2024 d13CCO and d18OCO data from an air sampling network established across the low-latitude Atlantic Ocean, including bi-weekly measurements from Tenerife (IEO and IZO), Cape Verde (CVAO), Barbados (RPB), and northern Brazil (ATTO). In addition, the network includes intermittent flask samples taken aboard commercial shipping vessels as they complete trans-Atlantic routes. Our analysis supports the existence of a large chlorine sink of methane in dust-associated regions, which varies seasonally. Underestimates in the occurrence of chlorine oxidation propagate to isotope-constrained top-down global methane models, shifting predicted contributions away from fossil fuels and towards biological sources. Ultimately, our results provide an opportunity to reconcile missing chlorine sources, which may have significant implications for global methane source estimations.

How to cite: Brashear, C., van Herpen, M., van de Kraats, B., Johnson, M., Pennacchio, L., Mikkelsen, M., Saiz-Lopez, A., Meidan, D., and Röckmann, T.:  Utilizing tropospheric CO isotope observations from a low-latitude Atlantic sampling network to constrain the oxidative chlorine sink , EGU General Assembly 2025, Vienna, Austria, 27 Apr–2 May 2025, EGU25-10322, https://doi.org/10.5194/egusphere-egu25-10322, 2025.

EGU25-10345 | ECS | Orals | AS3.43

Using NO2 satellite observations to constrain ffCO2 

Chlöe Schooling, Paul Palmer, and Liang Feng

Success of the Paris Agreement relies on rapid reductions in fossil fuel CO2 (ffCO2) emissions, which can be independently verified using atmospheric data. However, estimating changes in ffCO2 from atmospheric CO2 is challenging due to large and variable contributions from natural fluxes and background concentrations. Nitrogen oxides (NOx = NO + NO2), which are a major contributor to surface air pollution that have adverse effects on human health, are co-emitted with CO2 during incomplete fossil fuel combustion. Because atmospheric NOx has a relatively short lifetime (hours to days), low background concentrations, and limited natural sources, it is possible to link elevated NO2 satellite columns to their parent emissions.

We present results from an Ensemble Kalman Filter (EnKF) based model inversion using the GEOS-Chem atmospheric chemistry and transport model, along with NO2 TROPOMI observations, to estimate NOx emissions across mainland Europe. Leveraging sector-specific CO2:NOx emission ratios, we then convert the NOx posterior dataset to ffCO2. Additionally, we present preliminary findings for an alternative methodology that relies less on prior knowledge of emission ratios. This approach uses a combined CO2:NOx inversion, integrating TROPOMI NO2 and OCO-2 CO2 measurements to directly constrain ffCO2.

Our results describe a more accurate and direct approach for estimating fossil fuel CO2 emissions, which we anticipate will offer valuable insights for verifying national emission reductions and informing global climate mitigation strategies.


How to cite: Schooling, C., Palmer, P., and Feng, L.: Using NO2 satellite observations to constrain ffCO2, EGU General Assembly 2025, Vienna, Austria, 27 Apr–2 May 2025, EGU25-10345, https://doi.org/10.5194/egusphere-egu25-10345, 2025.

EGU25-10382 | ECS | Orals | AS3.43

Designing CO2 sensor networks for German cities: Insights from synthetic studies in Berlin and Munich  

Christopher Lüken-Winkels, Lukas Pilz, Simon Cello, and Sanam N. Vardag

Cities are major contributors to global anthropogenic CO2 emissions and their share relative to national emissions is increasing in many countries. This makes urban areas critical targets for effective CO2 mitigation strategies. To monitor and verify mitigation efforts, measurement-based emission estimates of anthropogenic CO2 emissions can be used. Many cities, however, lack the infrastructure to precisely constrain these emissions. 

To support the development of urban sensor networks within the Integrated Greenhouse Gas Monitoring System (ITMS) for Germany, we use Observing System Simulation Experiments (OSSEs). In these experiments, we evaluate synthetic in-situ sensor networks in Berlin and Munich with regards to their potential to constrain anthropogenic CO2 emissions. 

Our OSSEs use a Bayesian inversion framework, with atmospheric transport simulated by the Lagrangian Particle Dispersion Model FLEXPART-WRF and meteorology computed by the Weather Research and Forecasting (WRF) model at a 1 km resolution for urban areas over an entire year. 

We analyze the effect of number, location and precision of CO2 sensors, as well as of co-located CO concentration measurements.  We suggest favorable city-specific sensor network configurations and identify key factors for efficient network designs across the two cities. Our results support the deployment of efficient and effective sensor networks for measurement-based CO2 emission monitoring and verification in Berlin, Munich and similar cities and will be the basis for future planned sensor network installations in Germany. 

How to cite: Lüken-Winkels, C., Pilz, L., Cello, S., and Vardag, S. N.: Designing CO2 sensor networks for German cities: Insights from synthetic studies in Berlin and Munich , EGU General Assembly 2025, Vienna, Austria, 27 Apr–2 May 2025, EGU25-10382, https://doi.org/10.5194/egusphere-egu25-10382, 2025.

EGU25-10688 | Posters on site | AS3.43

Diversity and uncertainty in the assessment of GHG emissions in national inventories: a sectoral analysis of Northeastern European countries 

Iveta Steinberga, Ivo Vinogradovs, Agrita Briede, Zanda Peneze, and Kristine Ketrina Putnina

The correlation between estimated national GHG emissions and uncertainty is generally known. The causes and sources of the uncertainties are diverse and relate to source activity (field studies and research, census data), methodologies, variations in emission factors, and scientific studies/publications. Uncertainty has occurred due to a lack of knowledge of true values, in which uncertainty is assessed by the probability density function. Uncertainty analysis helps identify and prioritize activities (monitoring, inventory, evaluation methods, etc.) to improve the evaluation and reduce uncertainty. A quantitative uncertainty analysis is often performed for a 95% confidence interval. 
Different calculation methodologies are used in each sector (waste, energy, LULUCF, industry, transport, and agriculture); the mechanisms for producing emissions of emitted substances are complex and variable and require scientifically based research to update them. Regional differences are also essential, as climate, access to technologies, the possibility of introducing them, and other physio-geographic conditions have a significant impact. One of the challenging issues in the GHG emissions assessment relates to future emission projections related to future unpredictability due to climate change; changes in economic growth plans also create a lot of uncertainty. For example, in the forest management and land use sectors, the intensity of CO2 sequestration in the ecosystem must be assessed. Recent studies, including those informing Latvia's LULUCF emission factors, reveal significant uncertainties in estimating GHG emissions from organic-rich soils due to short-term measurements, limited sampling, and neglect of long-term soil carbon dynamics.  Another relatively more straightforward source of data uncertainty is identified in the waste management sector. In this sector, the analysis of methane emissions from landfills from disposed solid municipal waste requires a precise morphological composition of the waste, as the result of the calculation depends not only on the amount of waste but also on the content of organic matter and the intensity of aerobic or anaerobic degradation. It is self-evident that the composition of waste can be variable and monitored effectively today. Still, different waste fractions are characterized by different degradation intensities, and according to the assessment method, degradation should be assessed over a period of 100 years, which means that the historical morphological composition of waste is required. The lack of such data often leads to up to 150 % uncertainty. 
When analyzing the national reports of the Northeastern Region of Europe (Latvia, Finland, Estonia, and Lithuania), the most considerable uncertainties can be found in the LULUCF sector, which, in view of these countries' economic activities, is very substantial in the overall assessment. Reducing uncertainty in this area is of the utmost importance as it is closely linked to national climate plans and the measures taken to achieve climate neutrality. 

How to cite: Steinberga, I., Vinogradovs, I., Briede, A., Peneze, Z., and Putnina, K. K.: Diversity and uncertainty in the assessment of GHG emissions in national inventories: a sectoral analysis of Northeastern European countries, EGU General Assembly 2025, Vienna, Austria, 27 Apr–2 May 2025, EGU25-10688, https://doi.org/10.5194/egusphere-egu25-10688, 2025.

EGU25-10769 | Orals | AS3.43

EYE-CLIMA: A Horizon Europe project using atmospheric inversions to improve national estimates of greenhouse gas emissions 

Wilfried Winiwarter, Rona Thompson, Andreas Stohl, Philippe Peylin, Philippe Ciais, Hartmut Boesch, Tuula Aalto, Antoine Berchet, Maria Kanakidou, Glen Peters, Dmitry Shchepashchenko, Jean-Pierre Chang, Roland Fuß, Ignacio Pisso, Richard Engelen, Almut Arneth, Nina Buchmann, Stefan Reimann, Stephen Platt, and Nalini Krishnankutty

EYE-CLIMA is a Horizon Europe project that aims to improve estimates of emissions of climate forcers (CO2, CH4, N2O, SF6, HFCs, and black carbon aerosols) by using atmospheric observations. Atmospheric observations can be used, with the help of an atmospheric transport model, in a statistical optimization framework to estimate surface-to-atmosphere fluxes – a method known as atmospheric inversion. These fluxes can be used to estimate national and sub-national emissions (and removals) and can help support national monitoring and reporting and ultimately the Global Stocktake process.

One of the main goals of EYE-CLIMA is to develop atmospheric inversions into a useful tool for improving national greenhouse gas inventories (NGHGIs). This entails establishing good practice guidelines for atmospheric inversions (with a particular focus on the national scale) including a full assessment of the uncertainties, as well as developing the methodology to prepare sectorial emission estimates from atmospheric inversions and make these comparable to what is reported in national greenhouse gas inventories (NGHGIs). EYE-CLIMA collaborates with NGHGI agencies on pilot projects comparing and reconciling inventory and atmospheric inversion-based emission estimates, as well as on establishing a good practice for atmospheric observation-based verification of NGHGIs.

This presentation will present an overview of the EYE-CLIMA methodology and the pilot projects with NGHGI agencies. In particular, the pilot projects cover: i) land use, land use change and forestry (LULUCF) emissions and removals of CO2 in France, ii) N2O emissions from agriculture in Germany, and iii) CH4 emissions from agriculture and waste in France and Germany.

How to cite: Winiwarter, W., Thompson, R., Stohl, A., Peylin, P., Ciais, P., Boesch, H., Aalto, T., Berchet, A., Kanakidou, M., Peters, G., Shchepashchenko, D., Chang, J.-P., Fuß, R., Pisso, I., Engelen, R., Arneth, A., Buchmann, N., Reimann, S., Platt, S., and Krishnankutty, N.: EYE-CLIMA: A Horizon Europe project using atmospheric inversions to improve national estimates of greenhouse gas emissions, EGU General Assembly 2025, Vienna, Austria, 27 Apr–2 May 2025, EGU25-10769, https://doi.org/10.5194/egusphere-egu25-10769, 2025.

EGU25-10965 | ECS | Posters on site | AS3.43

Towards an urban CO2 and air pollution network in Heidelberg-Mannheim 

Kenneth Murai von Buenau, Pia Haas, Robert Maiwald, Veit Ulrich, Sebastian Block, André Butz, and Sanam N. Vardag

Cities have a great responsibility to mitigate CO2 emissions, as they contribute substantially to global anthropogenic CO2. To assist cities in efficient mitigation planning an independent data-driven approach to monitor emissions within urban areas is required. 

The Rhine-Neckar area comprises the cities of Mannheim and Heidelberg and is characterized by large emissions due to significant energy production and industry on the one hand, and by ambitious climate goals on the other hand. To monitor and support mitigation efforts of these cities, we are developing an urban monitoring network using mid-cost CO2 and air quality sensors for Heidelberg and Mannheim. The network will consist of 18 sensor nodes provided by the University of California, Berkeley. Each node is identical in construction to the sensors in the Berkeley Air Quality and CO2 Network (BEACO2N) (Shusterman et al., 2016) and measures CO2, CO, PM2.5 and NO2.

In conjunction with the measurement network, we use GRAMM/GRAL to model atmospheric transport in the domain on high resolution. GRAMM/GRAL is run following a catalog approach, in which hourly steady-state wind conditions are assumed. This way the computational costs can be reduced enabling the simulation of longer time scales on street canyon resolving spatial resolution (Berchet et al., 2017, May et al., 2024). We feed the model with high-resolution inventories of fossil fuel and biogenic emissions and compare the simulated enhancements to the measurements of the first deployed nodes.  We discuss the capability of the conjunction of high-resolution modeling and mid-cost observations to detect emission patterns within the Rhine-Neckar area.

Shusterman, A. A., et al., (2016). The BErkeley Atmospheric CO2 Observation Network: initial evaluation. Atmos. Chem. Phys., 16, 13449–13463., https://doi.org/10.5194/acp-16-13449-2016

Berchet, A., et al., (2017). A cost-effective method for simulating city-wide air flow and pollutant dispersion at building resolving scale. Atmospheric Environment, 158, 181-196., https://doi.org/10.1016/j.atmosenv.2017.03.030

May, M., et al., (2024). Evaluation of the GRAMM/GRAL Model for High-Resolution Wind Fields in Heidelberg, Germany. Atmospheric Research, 300, 107207., https://doi.org/10.1016/j.atmosres.2023.107207

How to cite: Murai von Buenau, K., Haas, P., Maiwald, R., Ulrich, V., Block, S., Butz, A., and Vardag, S. N.: Towards an urban CO2 and air pollution network in Heidelberg-Mannheim, EGU General Assembly 2025, Vienna, Austria, 27 Apr–2 May 2025, EGU25-10965, https://doi.org/10.5194/egusphere-egu25-10965, 2025.

EGU25-11020 | ECS | Orals | AS3.43

CHETNA-Brick Sector: Estimating GHG and Pollutant Emissions from Brick Kilns in India Using Sentinel-2 Imagery and Deep Learning 

Clément Goldmann, Sugandha Arora, Chuanlong Zhou, Philippe Ciais, Fabian Gieseke, Kushal Tibrewal, and Harish Phuleria

India, the world’s second-largest brick producer, operates over 100,000 kilns. These kilns emit 170 kt of PM2.5 (15% of the national total) and 120 Mt of CO2 (6% of the national total) annually, along with substantial SOx and NOx emissions. Transitioning from traditional Fixed Chimney Bull’s Trench Kilns (FCBTKs) to cleaner technologies, such as Zigzag Kilns (ZZKs), has the potential to reduce coal consumption by 20% and particulate matter emissions by 70%. However, comprehensive datasets for kiln locations across India remain scarce. This study contributes to the CHETNA project (City-wise High-resolution carbon Emissions Tracking and Nationwide Analysis), which leverages artificial intelligence and advanced datasets to deliver high-resolution, near real-time daily CO2 and air pollutant emissions data for over 100 Indian cities. 

To address this gap, we leveraged Sentinel-2 imagery, with a spatial resolution of 10–20 m, to develop a cost-effective and scalable approach. Most existing studies focus on specific geographic areas, such as northern India, and rely on expensive, high-resolution satellite imagery that is often not readily available, limiting their broader applicability. In contrast, our study represents the first nationwide mapping of brick kilns in India, using openly accessible satellite data and advanced machine learning models.

Using a curated dataset of 9,600 geo-tagged labels covering 18,000 km², we developed a method combining Sentinel-2 imagery with convolutional neural networks (CNN) to detect brick kilns and classify their operational technologies (e.g., FCBTK, Zigzag). Labels were annotated using Google Earth layers on QGIS and validated based on distinct visual features, such as oval or rectangular ochre-colored shapes. The model leverages RGB bands to detect active kilns, while the addition of NIR, SWIR, and NDVI metrics enhances its ability to identify abandoned kilns, often concealed by vegetation, and reduces false positives.

The model achieved a precision of 0.90, a recall of 0.89, and an accuracy of 0.91 on the test set. Detected kiln centroids were highly accurate, with precise GPS coordinates matching their actual locations. Nationwide, the model identified 44,000 brick kilns in India for 2022. We benchmarked multiple models to optimize false positive reduction and improve technology classification. Building on these results, we applied the model to neighboring countries in the Indo-Gangetic Plain (IGP), spanning Pakistan, Bangladesh, and parts of Nepal, which also contribute significantly to the brick kiln industry, identifying approximately 20,000 kilns in 2022.

Beyond location mapping, we are generating annual gridded emission maps for CO2 and pollutants such as PM2.5, black carbon, and NOx. These maps provide time-series insights into emission trends, reduce uncertainties in carbon and pollutant emissions, quantify reductions achieved through cleaner technologies, and identify regional hotspots. By focusing on underregulated, high-emission sectors like brick kilns, this study offers critical insights for targeted mitigation strategies and sustainable urban planning. It equips policymakers with tools to evaluate regulations and demonstrates the feasibility of using Sentinel-2 imagery for cost-efficient, large-scale monitoring. 

How to cite: Goldmann, C., Arora, S., Zhou, C., Ciais, P., Gieseke, F., Tibrewal, K., and Phuleria, H.: CHETNA-Brick Sector: Estimating GHG and Pollutant Emissions from Brick Kilns in India Using Sentinel-2 Imagery and Deep Learning, EGU General Assembly 2025, Vienna, Austria, 27 Apr–2 May 2025, EGU25-11020, https://doi.org/10.5194/egusphere-egu25-11020, 2025.

EGU25-11062 | Posters on site | AS3.43

Green4Clim: Making the University of Zurich a real-world laboratory for climate change mitigation 

Raleigh Grysko, Maria Santos, and Eugenie Paul-Limoges

Universities and other institutions are currently faced with the goal of utilizing responsible practices regarding carbon dioxide (CO2) emissions. At the University of Zurich, the initiative to start real-world laboratories inspired innovations and science-based studies to explore additional options for mitigating CO2 emissions from operations through both direct and indirect vegetation processes, i.e. direct sequestration and reduction in emissions from reduced energy consumption of buildings due to the shading and cooling effect of trees, respectively. As of now, it is unknown how much CO2 is sequestered by the vegetation on the University of Zurich Irchel campus and also which vegetated areas are possibly emitting CO2 (through soil respiration, decomposition, etc.). Within this initiative, the Green4Clim project monitors and quantifies the current CO2 sources and sinks on the Irchel campus and, in close collaboration with campus gardeners,determines options to optimize CO2 sequestration and cooling on campus. In this presentation, we present the preliminary results on (i) establishing a protocol for measuring direct and indirect effects of trees and other vegetation carbon sequestration, shading and cooling effects, and (ii) the measurements obtained on CO2 sources and sinks of natural areas on Irchel campus. Our measurements were taken at the leaf and soil level with a portable photosynthesis system and soil chamber systems to create an inventory of measurements, focusing on the four dominant tree species, green roofs, and the three dominant land cover types on campus (shrubs/bushes, short grass, and tall grass). Through this experiment we will identify the most suitable places and the most efficient plant species and communities to sequester CO2 on Irchel campus and suggest a management strategy that maximizes the CO2 reduction of the University of Zurich Irchel campus.

How to cite: Grysko, R., Santos, M., and Paul-Limoges, E.: Green4Clim: Making the University of Zurich a real-world laboratory for climate change mitigation, EGU General Assembly 2025, Vienna, Austria, 27 Apr–2 May 2025, EGU25-11062, https://doi.org/10.5194/egusphere-egu25-11062, 2025.

EGU25-11561 | Orals | AS3.43

Steps towards improved inverse modelling of GHG fluxes: recent work within ITMS 

Christoph Gerbig, Rachael Akinyede, Ðanilo Custódio, Michał Gałkowski, David Ho, Fabian Maier, Saqr Munassar, Yang Xu, and Thomas Koch

Within the Integrated Greenhouse Gas Monitoring System for Germany (ITMS), the main aim is to provide regular, accurate, observation-based emission estimates that will enhance the transparency in GHG emission reporting needed to build the necessary trust on the path to net zero emissions. Reliable inverse atmospheric transport modelling using atmospheric GHG observations is one of the main ingredients for this. However, multiple studies have shown rather large differences in GHG flux estimates from regional inverse modelling, related to differences in implementation of atmospheric transport processes such as vertical mixing and convective transport. Within the ITMS-M (modelling) project, a number of approaches are taken towards either improving atmospheric transport and mixing, or to reduce the impact of related uncertainties in atmospheric transport. These approaches include the utilization of vertical profiles from ICOS tall towers (using stable layer tracer enhancements during night time, expressed as partial columns as input to the inversion), profile information from IAGOS and mixing height information from ceilometer networks (diagnosing/correcting for uncertainties in daytime vertical mixing), but also multi-tracer inversions using correlated model-data-mismatch errors (utilizing independent knowledge on e.g. Radon surface fluxes in a Rn-CH4 inversion). We will give an overview of these approaches and current status of their developments within ITMS.

How to cite: Gerbig, C., Akinyede, R., Custódio, Ð., Gałkowski, M., Ho, D., Maier, F., Munassar, S., Xu, Y., and Koch, T.: Steps towards improved inverse modelling of GHG fluxes: recent work within ITMS, EGU General Assembly 2025, Vienna, Austria, 27 Apr–2 May 2025, EGU25-11561, https://doi.org/10.5194/egusphere-egu25-11561, 2025.

EGU25-11782 | ECS | Posters on site | AS3.43

Near-real-time CO2 traffic emission maps of 10 European cities based on high-resolution GPS-based data 

Qinren Shi, Philippe Ciais, Xavier Bonnemazion, Rohith Teja Mittakola, Nicolas Megal, and Chuanlong Zhou

On-road transportation is one of the major contributors to energy consumption and CO2 emissions in global megacities, and high-resolution CO2 traffic emission maps are needed to analyze emission patterns. In this study, commercial GPS-based data provides hourly, road-specific information on vehicle speed and traffic volume, and machine learning models are employed to address data gaps and transform sample counts into real traffic flux. Combined with COPERT, we developed on-road transportation CO2 emission maps for 10 selected cities in France, Germany, and the Netherlands. Our analysis offered insights into annual, per capita, and area-specific emissions for each city. Spatial emission patterns reflect urban structures and commuting behaviors, with cities such as Paris exhibiting concentrated hotspots along its ring road, whereas Berlin demonstrates a more uniform spatial distribution. Temporal variations reveal distinct weekly and seasonal trends, with more significant reductions during holidays and summer in French cities compared to German and Dutch cities. This approach enhances the spatial and temporal characterization of CO2 emissions in on-road transportation compared to the previous method used in Carbon Monitor, indicating the potential of GPS-based data for supporting future efforts in emission monitoring and developing emission reduction policies.

How to cite: Shi, Q., Ciais, P., Bonnemazion, X., Mittakola, R. T., Megal, N., and Zhou, C.: Near-real-time CO2 traffic emission maps of 10 European cities based on high-resolution GPS-based data, EGU General Assembly 2025, Vienna, Austria, 27 Apr–2 May 2025, EGU25-11782, https://doi.org/10.5194/egusphere-egu25-11782, 2025.

EGU25-12856 | ECS | Orals | AS3.43

Inverse modelling of N2O fluxes over Europe: An EYE-CLIMA initiative 

Nalini Krishnankutty, Rona Thompson, Antoine Berchet, Wilfried Winiwarter, Stephan Henne, and Ute Karstens

Nitrous Oxide (N₂O) is a long-lived and highly potent greenhouse gas, recognized as the third most significant contributor to radiative forcing, with a substantial proportion of its emissions originating from a large area source, agricultural soils, due to the application of mineral fertilizer and livestock manure. As part of the Horizon Europe project EYE-CLIMA, we performed atmospheric inversions to improve the estimates of N2O fluxes across Europe at two spatial resolution scales. The first inversion, spanning the period from 2005 to 2023, was performed at a resolution of 0.5° × 0.5°. The second inversion, covering the period from 2018 to 2023, was carried out at a higher resolution of 0.2° × 0.2°. The method integrates the Community Inversion Framework (CIF) with the Lagrangian particle dispersion model, FLEXPART v11 (CIF-FLEXPART), to estimate N2O emissions using ground-based measurements of atmospheric N2O concentrations. Comprehensive prior N2O flux estimates were generated by incorporating monthly data from key source categories, including agriculture, other anthropogenic activities such as combustion, industry or waste treatment, biomass burning, natural soils, and ocean fluxes. For consistency, observed atmospheric concentrations of N2O were sourced from a newly harmonized dataset for Europe, compiled collaboratively by EYE-CLIMA and the Horizon Europe projects AVENGERS and PARIS.

Following the inversion, the modelled concentrations showed improved agreement with observations, capturing the seasonal cycle and increasing trend from 2005 onward. Statistical analyses revealed high correlations between modelled and observed concentrations at most stations. The N2O emissions from the inversion differ from the prior estimates in intensity and spatial distribution with increased emissions in regions of specifically high agricultural activity and reductions in other areas. Monthly flux variations exhibited a consistent seasonal cycle, with peak emissions occurring in early summer (May–June) and lower emissions during winter months. Across all years, total posterior emissions were lower than the prior estimates. While the phase of the seasonal cycle remained consistent from year to year, interannual variability in the amplitude was observed.

How to cite: Krishnankutty, N., Thompson, R., Berchet, A., Winiwarter, W., Henne, S., and Karstens, U.: Inverse modelling of N2O fluxes over Europe: An EYE-CLIMA initiative, EGU General Assembly 2025, Vienna, Austria, 27 Apr–2 May 2025, EGU25-12856, https://doi.org/10.5194/egusphere-egu25-12856, 2025.

EGU25-13030 | ECS | Posters on site | AS3.43

 Evaluating ICON-ART’s Performance in Simulating Methane: A Benchmark Against aircraft observations, CAMS, and WRF Models 

Danilo Custódio, David Ho, Michał Gałkowski, and Christoph Gerbig

Methane (CH₄), a potent greenhouse gas, is a key player in atmospheric chemistry and climate forcing. Its spatial and temporal variability is driven by emissions, atmospheric transport, and chemical loss processes. Accurate modelling of CH₄ is essential for understanding its sources, sinks, and role in Earth’s energy budget. In this study, we evaluate the skill of forward methane simulations of ICON-ART (ICOsahedral Nonhydrostatic - Aerosols and Reactive Trace gases) implementation established at Max Planck Institute for Biogeochemistry in Jena. The ICON-ART model represents a cutting-edge atmospheric modelling system jointly developed by the consortium of German and Swiss institutes. Its proven capability to realistically simulate trace gases, aerosols, and chemical interactions makes it a versatile tool for regional-to-global atmospheric studies focusing on improving flux estimates of a variety of atmospheric compounds, including methane. This work was conducted within the framework of the ITMS project (Integrated Greenhouse Gas Monitoring System for Germany), designed to enable Germany to operationally monitor the source and sinks of the most import long-lived greenhouse gases.

In the study, we evaluate the performance of the ICON-ART simulations set over the ICON-EU domain at 7 km horizontal resolution and compare their results other, more established modelling systems, including CAMS (Copernicus Atmosphere Monitoring Service) inversion optimized product (v21r1), CAMS reanalysis (EGG4) and the WRF-GHG (Weather Research and Forecasting with GHG module) model run at 5 km horizontal resolution. Both ICON-ART and other models include realistic realizations of anthropogenic emissions, natural fluxes, and boundary conditions that allow for realistic representation of atmospheric methane. We further compare all model results to in-situ airborne observations performed with HALO (High Altitude and LOng Range) during CoMet Campaign in May-June 2018, providing high-resolution CH₄ measurements, including vertical profiles spanning from the planetary boundary layer (PBL) to the low stratosphere (LS). The comparability of the models was ensured through collocated data analysis and performance metrics. These methodological frameworks minimize biases arising from resolution differences, enabling a fair assessment of the models’ capabilities.

The results reveal that ICON-ART is able to capture uplift transport and strong vertical mixing processes with remarkable fidelity. Displaying only 1.8 ppb mean bias error (MBE) for CH4, it outperforms both WRF and global CAMS products, across the used metrics. In the PBL, ICON-ART resolves small-scale CH₄ variability better than CAMS and WRF. Similarly, in the free troposphere, ICON-ART successfully simulates CH₄ transport and mixing, aligning closely with aircraft observations. Notably, ICON-ART shows better agreement in the LS, which is linked to improved stratosphere-troposphere exchange processes, but also underlines the importance of realistic lateral boundary conditions.

How to cite: Custódio, D., Ho, D., Gałkowski, M., and Gerbig, C.:  Evaluating ICON-ART’s Performance in Simulating Methane: A Benchmark Against aircraft observations, CAMS, and WRF Models, EGU General Assembly 2025, Vienna, Austria, 27 Apr–2 May 2025, EGU25-13030, https://doi.org/10.5194/egusphere-egu25-13030, 2025.

EGU25-13577 | ECS | Orals | AS3.43 | Highlight

CHETNA-Overview: City-wise High-resolution Carbon Emissions Tracking and Nationwide Analysis 

Chuanlong Zhou, Philippe Ciais, Arnab Jana, Ahana Sarkar, Rohith-Teja Mittakola, Kushal Tibrewal, Kounik De Sarkar, Abhinav Sharma, Vipul Parmar, Fouzi Benkhelifa, Biqing Zhu, Clément Goldmann, and Harish Phuleria

We present the CHETNA (City-wise High-resolution Carbon Emissions Tracking and Nationwide Analysis) project, an innovative framework designed to generate near real-time high-resolution carbon emissions data for 100 Indian cities across five major sectors: power, traffic, residential, industrial, and aviation. Utilizing advanced technologies including artificial intelligence, large-scale open data scraping, satellite imagery, sophisticated energy models, and field surveys, CHETNA will address critical gaps in emissions tracking and modeling at the city level. CHETNA’s methodologies focus on regions with limited official datasets and inadequate high-resolution data, providing essential insights to support urban planning, climate mitigation, and sustainable urbanization efforts both in India and globally.

India, the world’s third-largest emitter of greenhouse gases (GHGs), plays a pivotal role in global climate mitigation efforts. Its rapidly urbanizing population, expanding economy, and coal-dominated energy structure present both challenges and opportunities for sustainable development. To meet its Paris Agreement commitments, India has pledged to reduce its GHG emissions intensity—emissions per unit of GDP—by 33%–35% by 2030, relative to 2005 levels. However, critical data gaps persist, particularly at the city level, hindering effective city-specific climate action and data-driven decision-making in India’s urban decarbonization. 

To ensure a robust and scalable system for sectoral high-resolution CO₂ emission tracking, CHETNA employs an integrated workflow that combines GHG emission inventories and high-resolution sectoral activity modeling. For sectors such as power, large industrial, and aviation, where reliable national or regional emission inventories are available from open data sources, we developed sophisticated downscaling models to generate gridded emission maps based on those open-source datasets. For sectors lacking comprehensive emission inventories, such as traffic and residential, we adopted a bottom-up approach. Activity models were developed for each sector using machine learning, field-collected data (e.g., traffic sensor and field survey data), and satellite imagery. These activity models were then coupled with advanced emission models. For instance, a fleet-speed-emission model was developed for the traffic sector, while a building-climate-energy model was implemented for the residential sector. In addition to CO₂ emissions, CHETNA provides air pollutant co-emissions by integrating detailed activity data with pollutant-specific emission factors. This approach allows for the assessment of air quality benefits resulting from GHG mitigation efforts, highlighting the co-benefits of reduced air pollutants. 

The dataset generated with the CHETNA project enables policymakers to develop city- and sector-specific strategies, contributing to India's sustainable urban development. Its sectoral high-resolution data would provide insights for guiding urban planning, air pollutant reduction, optimizing transportation systems, enhancing energy efficiency, and implementing effective industrial regulations. Representing a significant advancement in urban GHG emissions monitoring, CHETNA also offers a scalable and replicable framework for other counties or cities facing similar challenges. 

This presentation provides an overview of the CHETNA project, outlining its scope, general concept, workflow design, and simplified methodologies for each sector. At EGU25, we will also present detailed sectoral methodologies and results, including traffic, residential, power, and small industrial sectors.

How to cite: Zhou, C., Ciais, P., Jana, A., Sarkar, A., Mittakola, R.-T., Tibrewal, K., De Sarkar, K., Sharma, A., Parmar, V., Benkhelifa, F., Zhu, B., Goldmann, C., and Phuleria, H.: CHETNA-Overview: City-wise High-resolution Carbon Emissions Tracking and Nationwide Analysis, EGU General Assembly 2025, Vienna, Austria, 27 Apr–2 May 2025, EGU25-13577, https://doi.org/10.5194/egusphere-egu25-13577, 2025.

EGU25-14671 | Posters on site | AS3.43

Prospects of scientific monitoring ,verification and reporting to support national and subnational GHG inventories 

Andreas Ibrom, Konstantin Kissas, Anastasia Gorlenko, Ziqiong Wamg, Susanne Wiesner, and Charlotte Scheutz

Scientific monitoring, verification and reporting (MRV) is necessary to independently examine the quality of national greenhouse gas (GHG) inventories as assessment methods are inherently uncertain including systematic effects from biased input information and lack of knowledge. The atmospheric research community develops observation systems to monitor the large-scale net GHG exchange with remote sensing and tall tower based concentration field measurements and atmospheric transport model inversion techniques. Because the spatial and temporal scales of these approaches are too coarse for small nations and even more so for local government districts, we used an alternative direct method to estimate the GHG budget of an agricultural landscape in Denmark, the tall tower eddy covariance method. In the presentation, we will use this case study to illustrate the strengths and limitations of net GHG flux measurements to test against GHG inventories.

We compared our one year’s data set of continuous GHG (CO2, N2O and CH4) flux measurements  with the estimates from IPCC based emission methods that were refined for the Danish agricultural landscape. We calculated GHG emissions and their uncertainties using the IPCC methods and propagated those to annual estimates. Likewise, we estimated the uncertainty for annual budgets from turbulent flux measurements including a number of factors that are deemed most important for the quality of net flux estimates.

While the emission estimates for the non-CO2 GHG were at least similar, the IPCC inventory characterized the area as a net GHG source, whereas the measured fluxes determined a large GHG sink, owing to an overwhelming CO2 uptake.

In our presentation, we will resolve this apparent contradiction and conclude on the strengths and limitation of MRV from scientific net GHG exchange approaches.

Acknowledgement:

We acknowledge funding by the Free Danish Research Council (DFF, grant number 1127-00308B) and the contribution of MSc. Victoria Abelenda and MSc. Isabel Lopez in their MSc. Project “Comprehensive Assessment of Greenhouse Gas Emissions  (N2O, CO2, CH4) in Agricultural Practices: A Case Study from a Rural Area in Denmark”, Inst. of Resouce and Environmental Engineering, Technical University of Denmark (DTU) Kgs. Lyngby, Denmark (2024).

How to cite: Ibrom, A., Kissas, K., Gorlenko, A., Wamg, Z., Wiesner, S., and Scheutz, C.: Prospects of scientific monitoring ,verification and reporting to support national and subnational GHG inventories, EGU General Assembly 2025, Vienna, Austria, 27 Apr–2 May 2025, EGU25-14671, https://doi.org/10.5194/egusphere-egu25-14671, 2025.

EGU25-14965 | Orals | AS3.43

Public-Private Partnerships in Climate System Observations  

Vanda Grubišić and Colm Sweeney

Systematic – regular and routine – observations are vital for understanding and monitoring the Earth climate system. Systematic observation networks, traditionally built and operated by the public sector, provide relevant data that inform climate models and respective pathways, forecasts, products and services. Critical in that regard, in particular, are high precision, accurate, and comprehensive greenhouse gas measurements. Initiatives for enhancing such networks and observations for scaling up climate data collection and monitoring are important, as is doing this in a sustainable manner by leveraging opportunities and advancing cooperation though public-private partnerships. This presentation highlights recent NOAA initiatives in that regard, including recent partnerships with United Airlines and with Maersk for data collection from commercial aircraft and commercial shipping vessels. 

How to cite: Grubišić, V. and Sweeney, C.: Public-Private Partnerships in Climate System Observations , EGU General Assembly 2025, Vienna, Austria, 27 Apr–2 May 2025, EGU25-14965, https://doi.org/10.5194/egusphere-egu25-14965, 2025.

EGU25-15002 | ECS | Posters on site | AS3.43

Study on the influence of the origin region on the relationship between carbon dioxide and methane concentrations in South Korea 

Jaemin Kim, Yun Gon Lee, Sunju Park, and Ho-Yeon Shin

Greenhouse gases (GHGs) are the main cause of climate change, and their concentrations are steadily increasing due to continuous emissions from anthropogenic activities. To establish effective carbon emission reduction policies and mitigate climate change, monitoring changes in atmospheric GHG concentrations and identifying their origin regions is essential. In this study, we analyzed the regional characteristics of carbon dioxide (CO2) and methane (CH4) at the Global Atmospheric Watch (GAW) stations (AMY, GSN, and ULD) in South Korea and investigated regional differences in the relationship between the two substances. We also explored the relationship between the regional differences and the source regions of greenhouse gases. The STILT mode (a Lagrangian dispersion model) and the EDGAR (an anthropogenic emission dataset) were used to identify the source regions of GHGs. The relationships (correlation coefficient and ratio) between CO2 and CH4 at three stations showed regional differences (GSN > ULD > AMY). It was investigated that these differences were caused by differences in the characteristics of major airflow patterns and emission sources that affect CO2 and CH4 concentration changes in the corresponding regions. The results of this study can help identify the causes of regional greenhouse gas concentration changes.

How to cite: Kim, J., Lee, Y. G., Park, S., and Shin, H.-Y.: Study on the influence of the origin region on the relationship between carbon dioxide and methane concentrations in South Korea, EGU General Assembly 2025, Vienna, Austria, 27 Apr–2 May 2025, EGU25-15002, https://doi.org/10.5194/egusphere-egu25-15002, 2025.

EGU25-15020 | Posters on site | AS3.43

Toward Monitoring Greenhouse Gas Emissions from National to Regional and Urban Scales 

Hengmao Wang, Fei Jiang, and Shuzhuang Feng

Monitoring and verifying anthropogenic greenhouse gases (GHG) Emissions at high spatiotemporal resolution with observation-based evidence is desirable for climate policymakers. A multiple-scale nested GHG assimilation system, named GCASv3, was developed for quantifying anthropogenic GHG emissions at high spatiotemporal resolution. GCASv3 uses a four level nested scheme and consists of one global module and one regional module. The global model is capable of assimilating XCO2 and XCH4 data to infer global CO2 flux and CH4 emissions at 10x10 resolution, while the regional module is able to assimilate ground and satellite GHG observations to quantify anthropogenic GHG emissions on national, regional and urban scales at 27km, 9km and 1km resolution respectively. This presentation describes briefly the framework and the major components of GCASv3. Anthropogenic CO2 emissions and CH4 emissions inferred by GCASv3 at different scales are presented and discussed.

How to cite: Wang, H., Jiang, F., and Feng, S.: Toward Monitoring Greenhouse Gas Emissions from National to Regional and Urban Scales, EGU General Assembly 2025, Vienna, Austria, 27 Apr–2 May 2025, EGU25-15020, https://doi.org/10.5194/egusphere-egu25-15020, 2025.

EGU25-15759 | ECS | Orals | AS3.43

Assessing European HFC Emissions Using Inverse Modelling Systems 

Helene De Longueville, Daniela Brito Melo, Alice Ramsden, Alison Redington, Alexandre Danjou, Peter Andrews, Joseph Pitt, Brendan Murphy, Matthew Rigby, Stephan Henne, Alistair Manning, and Anita Ganesan and the other members of the PARIS team

Hydrofluorocarbons (HFCs) are potent greenhouse gases that contribute substantially to climate change. Their emissions are rapidly evolving due to changes in production and use that are driven by the Kigali Amendment to the Montreal Protocol and regional regulations. Atmospheric data and inverse modelling systems can be valuable for evaluating the effectiveness of these controls and the emissions reported to the United Nations Framework Convention on Climate Change (UNFCCC). Currently in Europe, the United Kingdom and Switzerland include atmospheric top-down emission estimates as part of their National Inventory Reports to the UNFCCC, and now the Horizon Europe project Process Attribution of Regional emISsions (PARIS) aims to expand similar inventory evaluation to several additional European countries. 

In this PARIS study, we derived HFC emissions for north-western Europe from 2012 to 2023 using the NAME transport model and three Bayesian inversion systems (InTEM, ELRIS, RHIME), focusing on HFC-134a, HFC-143a, HFC-32, HFC-125, HFC-23, HFC-152a, HFC-227ea, HFC-236fa, HFC-245fa, HFC-365mfc, and HFC-4310mee. Our results indicate an overall decline in HFC emissions in north-western Europe, broadly consistent with European F-gas regulations. Derived emissions trends are compared with National Inventory Reports, highlighting discrepancies. Moreover, we explore the driving factors behind these trends. These findings contribute to understanding emissions trends and improving inventory evaluations in Europe.

How to cite: De Longueville, H., Brito Melo, D., Ramsden, A., Redington, A., Danjou, A., Andrews, P., Pitt, J., Murphy, B., Rigby, M., Henne, S., Manning, A., and Ganesan, A. and the other members of the PARIS team: Assessing European HFC Emissions Using Inverse Modelling Systems, EGU General Assembly 2025, Vienna, Austria, 27 Apr–2 May 2025, EGU25-15759, https://doi.org/10.5194/egusphere-egu25-15759, 2025.

EGU25-16572 | ECS | Posters on site | AS3.43

Significant Overestimation in Anthropogenic Methane Emissions in China 

Shuzhuang Feng, Fei Jiang, Hengmao Wang, and Yongguang Zhang

China, as the largest contributor to global anthropogenic methane (CH4) emissions, has pledged to reduce its global CH4 emissions by 30% in 2030 compared to 2022 levels. Accurate estimation of CH4 emissions is crucial for climate prediction and mitigation policies but poses a significant challenge for methods relying solely on economic statistics and emission factors. In this study, we developed a regional carbon assimilation system (RegGCAS) to integrate TROPOMI XCH4 observations for inferring daily CH4 emissions across China. Our estimated national total CH4 emission for 2022 was 45 Tg·yr⁻¹, approximately 35% lower than the widely used EDGARv8 inventory (prior estimate). Notable reductions were primarily observed in Northern China, with only sporadic increases in Shanxi Province, which contributes one-third of China's coal production. Increases were primarily concentrated in the Sichuan Basin, the southeast coastal provinces, and Heilongjiang Province in Northeast China. The optimized CH4 emission estimate exhibited more pronounced seasonal variations, with a significant decrease in emissions during winter. However, constraints on emissions in summer were limited due to the lack of observational data. Posterior simulations demonstrated better consistency with both TROPOMI XCH4 observations and ground-based observations. These findings enhance our understanding of the spatiotemporal patterns of CH4 emissions in China.

How to cite: Feng, S., Jiang, F., Wang, H., and Zhang, Y.: Significant Overestimation in Anthropogenic Methane Emissions in China, EGU General Assembly 2025, Vienna, Austria, 27 Apr–2 May 2025, EGU25-16572, https://doi.org/10.5194/egusphere-egu25-16572, 2025.

The presence of CO2 in the atmosphere facilitates the maintenance of adequate levels of heat, which is essential for the establishment and sustenance of life on Earth. Although its concentration has varied dramatically throughout the planet's history, recent levels of atmospheric CO₂ are the result from a delicate balance among processes such as volcanism, weathering, photosynthesis, respiration and combustion. However, extensive use of fossil fuels has altered this balance causing atmospheric CO2 concentrations to rise, thereby intensifying global warming and accelerating climate change

While relatively few countries in the intertropical region release substantial amounts of CO2, nations in the northern hemisphere have been the primary contributors to CO₂ emissions over the past centuries, largely due to industrialization. Since the Industrial Revolution, urban development has concentrated several people around heavily industrialized cities, which have become central drivers of climate change. Global atmospheric circulation facilitates the rapid dispersion of CO₂ emissions originating from tropical latitudes throughout the troposphere. In contrast, emissions from mid- to high-latitude regions persist longer on a regional scale. Consequently, the latitude of CO₂ emissions significantly influences their climatic effects, with high-latitude emissions remaining in the atmosphere for longer time.  On the other hand, growing urban areas in the transitional mid-latitude regions are particularly vulnerable to the impacts of climate change, with Mediterranean cities being especially susceptible to extreme events. These include more frequent heatwaves, rising sea levels, droughts, and intense rainfall, all of which pose significant threats to infrastructure, public health, and urban ecosystems. Moreover, rising temperatures enhance social and economic inequalities, underscoring the urgent need for resilient and sustainable adaptation strategies. 

This study addresses the rationale for and development of a research infrastructure aimed at monitoring atmospheric CO₂ and its latitudinal variation within the Mediterranean region. The objective is to assess the impacts of actions taken to reduce anthropogenic CO₂ emissions as outlined in the European Green Deal. 

The proposed infrastructure is designed to collect and disseminate data for a comprehensive examination of the causes of latitudinal and temporal variations in atmospheric CO₂ across a north-south transect from the Alpine glaciers in Valle d’Aosta to the island of Lampedusa, both located in Italy. This system includes 12 automatic monitoring stations equipped to measure the concentration and isotopic composition of carbon and oxygen in atmospheric CO₂. Extensive research highlights the importance of monitoring carbon isotopes (e.g., ¹³C, ¹²C) to identify emission sources, as well as triple oxygen isotope ratios (¹⁶O, ¹⁸O, and ¹⁷O) to trace the fate of CO₂ within the interconnected carbon and water biogeochemical cycles.

The network’s high-frequency acquisition capability (minute intervals) enables near real-time evaluation, facilitating the identification and characterization of diverse CO₂ sources and the apportionment of their emissions. 

How to cite: Di Martino, R. M. R. and Gurrieri, S.: Monitoring Atmospheric CO₂ in the Mediterranean: A Strategic Infrastructure for Climate Action and Latitudinal Impact Assessment, EGU General Assembly 2025, Vienna, Austria, 27 Apr–2 May 2025, EGU25-16829, https://doi.org/10.5194/egusphere-egu25-16829, 2025.

EGU25-16892 | ECS | Orals | AS3.43

A Hybrid Approach to Carbon Monitoring in India by combining Satellite-based NO2 and CO2 mixing ratios 

Jithin Sukumaran, Dhanyalekshmi Pillai, Abhinav Dhiman, and Vishnu Thilakan

Quantifying carbon emissions in the Indian region is fraught with uncertainties, largely due to the limited availability of atmospheric trace gas observations and robust techniques. Atmospheric inverse modeling approaches, though highly potential, are often constrained by sparse observational datasets over India. To address these challenges, this study investigates a novel data-driven methodology that leverages satellite-based NO2 and CO2 concentrations for plume detection and associated emission quantification. Specifically, we utilize highly accurate and precise NO2 measurements from the TROPOMI instrument onboard Sentinel-5P to identify and trace emission hotspots, such as thermal power plants and densely populated urban centers, which significantly contribute to regional emissions. Using this NO2-driven plume detection as a proxy, we explore the potential of atmospheric dry-air column CO2 concentrations to quantify hotspot emissions. The present study utilises the modeled dry-air column CO2 concentrations, which observations can later replace. The focus is given to illustrate a methodology that can combine both  NO2 and CO2 concentrations derived from satellite instruments to infer the spatial distribution of  CO2 emission over a region that is rapidly evolving and industrialized, like India. The above task is particularly in preparation for upcoming satellite missions like CO2M, which will offer co-located NO2 and CO2 observations that can be utilized for cost-effective solutions for carbon monitoring. Hence, the study outcome will not only improve our understanding of regional emissions but also establish a framework for leveraging future satellite missions to assist in establishing carbon emission reduction policies.

How to cite: Sukumaran, J., Pillai, D., Dhiman, A., and Thilakan, V.: A Hybrid Approach to Carbon Monitoring in India by combining Satellite-based NO2 and CO2 mixing ratios, EGU General Assembly 2025, Vienna, Austria, 27 Apr–2 May 2025, EGU25-16892, https://doi.org/10.5194/egusphere-egu25-16892, 2025.

EGU25-17019 | ECS | Posters on site | AS3.43

A scalable approach to high-resolution, bottom-up GHG emission inventories using open data 

Sebastian Block, Veit Ulrich, Maria Martin, Kirsten von Elverfeldt, Kenneth Murai von Buenau, Pia Haas, Robert Maiwald, André Butz, and Sanam N. Vardag

Targeting and tracking climate change mitigation efforts requires accurate bottom-up inventories of GHG emissions, verified by independent atmospheric measurements. So far, most policy decisions have been based on annual emission inventories at national and city scales. Inventories with higher resolution in both space (sub-city) and time (daily to hourly), while generally more uncertain, have major advantages. First, they are a key input to inverse modelling of emission sources from atmospheric measurements, which offers a semi-independent approach to verify bottom-up estimates. Second, they can serve as simulation tools to assess the impact of specific interventions (from policy to industrial standards and household behavior) on GHG emissions and measured atmospheric concentrations. Third, by offering more localized emission estimates almost in real time, they may act as more powerful motivators of behavioral and policy change when used to communicate and track climate action. 

Here we present a simple approach to develop bottom-up inventories of carbon dioxide emissions from road traffic (at street level) and residential space heating (in a 100-m grid) using crowd-sourced data from OpenStreetMap and other publicly available data sources. Our approach can be easily scaled to all of Germany and, with some modifications, can be tailored to a wide range of contexts and applications. We demonstrate the approach for the cities of Mannheim and Heidelberg, in the Rhine-Neckar Metropolitan Area in Germany. 

Emissions from road traffic are derived from multiplying estimates of average daily traffic volume – based on road type information, number of lanes, and population density – by speed- and fuel-dependent emission factors and data about the national vehicle fleet composition. Space heating emissions rely primarily on gridded data from the 2022 German census on population density, living space per capita, heating energy carriers, and building age.

We validate our traffic volume estimates with independent traffic count data and compare our emission estimates to available inventories. Road traffic emissions in the Rhine-Neckar region were 1.6% higher than TNO estimates for the region (Super et al. 2021), a widely used inventory of disaggregated emission in Europe. Our residential space heating emissions estimates were slightly lower than estimates from emissions inventories for the cities of Mannheim and Heidelberg (12% and 8%, respectively), largely attributable to the type of emission factors used in the calculations. 

How to cite: Block, S., Ulrich, V., Martin, M., von Elverfeldt, K., Murai von Buenau, K., Haas, P., Maiwald, R., Butz, A., and Vardag, S. N.: A scalable approach to high-resolution, bottom-up GHG emission inventories using open data, EGU General Assembly 2025, Vienna, Austria, 27 Apr–2 May 2025, EGU25-17019, https://doi.org/10.5194/egusphere-egu25-17019, 2025.

EGU25-17412 | Orals | AS3.43

Beyond Bias: Radon-Based Technique for Reducing Uncertainty in Greenhouse Gas Verification Frameworks 

Dafina Kikaj, Craig Lils, Scott D. Chambers, Grant Forster, and Arnoud Frumau

The accuracy of greenhouse gas (GHG) emission estimates is significantly limited by uncertainties in atmospheric transport models (ATMs). These uncertainties largely arise from difficulties in accurately representing sub-grid turbulence and mixing processes. Furthermore, the use of modelled meteorological data to filter observations before inversion frameworks results in the exclusion of 40–75% of continuous GHG measurements, thereby reducing the reliability of emission estimates.

To overcome these challenges, we propose the use of radon measurements - a naturally occurring radioactive noble gas with well-characterised sources and sinks. Radon will be used as a metric to define atmospheric mixing classes, providing a novel approach to validate ATM performance and address its inherent uncertainties. These mixing classes, which reflect varying atmospheric stability conditions, offer a valuable benchmark for evaluating model parameterisations and meteorological inputs.

Our study utilises radon measurements from the Weybourne Atmospheric Observatory (UK) and Cabauw Tower (Netherlands) to assess the reliability of meteorological inputs and parameterisation in ATMs. Preliminary results demonstrate that radon-derived mixing classes can reduce biases in data filtering while improving the representation of atmospheric transport dynamics. This innovative method helps to bridge gaps in current inversion frameworks, enabling more accurate GHG emission estimates and supporting the development of evidence-based climate policies.

How to cite: Kikaj, D., Lils, C., Chambers, S. D., Forster, G., and Frumau, A.: Beyond Bias: Radon-Based Technique for Reducing Uncertainty in Greenhouse Gas Verification Frameworks, EGU General Assembly 2025, Vienna, Austria, 27 Apr–2 May 2025, EGU25-17412, https://doi.org/10.5194/egusphere-egu25-17412, 2025.

EGU25-17986 | ECS | Posters on site | AS3.43

Addressing uncertainties in top-down estimates of national-scale greenhouse gas emissions across different inversion systems 

Daniela Brito Melo, Alice Ramsden, Hélène De Longueville, Alison Redington, Alexandre Danjou, Peter Andrews, Brendan Murphy, Joseph Pitt, Eric Saboya, Matthew Rigby, Lukas Emmenegger, Alistair Manning, Stephan Henne, and Anita Ganesan

As part of the current international effort to limit global warming, signatories to the Paris Agreement are required to quantify their greenhouse gas (GHG) emissions. Former Kyoto Annex I countries thus report their emissions  annually to the United Nations Framework Convention on Climate Change (UNFCCC) . This assessment allows countries to evaluate their progress in reducing GHG emissions and their compliance with existing agreements.
The general approach to quantifying GHG emissions at the national level is to use activity data and emission factors  (bottom-up method). An independent  quantification can be achieved with inverse modelling, which makes use of an a priori estimate, atmospheric transport models (ATM), and atmospheric measurements of GHG concentrations (top-down method). However, the accuracy and uncertainty of inverse estimates are highly dependent on several parameters and modelling choices. Consequently, inter-model variability can be significant, potentially limiting the use of this technique in policy-relevant discussions.
A representative quantification of GHG emissions based on inverse modelling requires an in-depth understanding of different inverse model estimates, their uncertainties and model limitations.  An intercomparison of three inverse methods and a suite of sensitivity tests were performed. This exercise considered two fluorinated gases (HFC-143a and PFC-218), which are potent GHGs with very different emission characteristics (diffuse versus point source). Both are covered under the European F-gas regulation. Additionally, HFC-143a is expected to be phased-down under the Kigali Amendment to the Montreal Protocol.
We found that top-down estimates for Central and Western European countries are most sensitive to the ATM used. For gases with localised emission sources, such as PFC-218, the choice of a priori emissions and assigned model-data mismatch uncertainty are particularly relevant. For gases with widely distributed emission sources, such as HFC-143a, the emission estimates are more consistent and less sensitive to modelling choices. This detailed understanding of uncertainties in top-down estimates is then used to inform how inverse modelling can be used to support the reporting of halogenated GHG emissions at the national and European level.

How to cite: Brito Melo, D., Ramsden, A., De Longueville, H., Redington, A., Danjou, A., Andrews, P., Murphy, B., Pitt, J., Saboya, E., Rigby, M., Emmenegger, L., Manning, A., Henne, S., and Ganesan, A.: Addressing uncertainties in top-down estimates of national-scale greenhouse gas emissions across different inversion systems, EGU General Assembly 2025, Vienna, Austria, 27 Apr–2 May 2025, EGU25-17986, https://doi.org/10.5194/egusphere-egu25-17986, 2025.

EGU25-18706 | ECS | Posters on site | AS3.43

A Standardised Procedure for Estimating Greenhouse Gas Baselines Using Radon-222 

Craig Lils, Dafina Kikaj, Edward Chung, Scott Chambers, Alan Griffiths, Franz Conen, Paul Fukumura-Sawada, and Paul Krummel

Top-down verification methods are crucial for ensuring confidence in the bottom-up approaches used to report greenhouse gas emissions. These methods are reliant on robust baseline estimates, which can be calculated via several methods using a combination of meteorological data, transport models, and tracers such as CO and radon-222. In particular, high-quality radon measurements have been shown to reliably and consistently identify baseline airmasses across the globe, due to radon’s unique properties as a terrestrial tracer. However, the methodology used in this process differs between studies, as a result of variations in the location (e.g. remote, coastal, terrestrial), altitude, and atmospheric features of each observation site, as well as the sensitivity of the instruments available at the time/location.

This study aims to provide a universal procedure with which to calculate baseline estimates of greenhouse gases using radon, accounting for differences between stations. To evaluate and adjust this procedure, data from the Kennaook/Cape Grim (Tasmania), Mauna Loa (Hawaii), Jungfraujoch (Switzerland), Mace Head (Ireland) and Monte Cimone (Italy) observatories will be assessed, encompassing a range of locations and altitudes. This will include analysis of a variety of greenhouse gases, to understand whether alterations in the technique are required when estimating baselines of different gases and highlight how features such as low pollution spikes of N2O or sudden pollution events of SF6 influence our ability to estimate their baseline levels. Furthermore, using back trajectories obtained from the FLEXPART atmospheric dispersion model and high-frequency trace gas observations at each site, modelled baseline estimates will be derived to provide a direct comparison to the radon methodology. In doing so, this research will provide an unambiguous procedure for future baseline estimates, increasing the accessibility of this technique and improving comparability between studies.

How to cite: Lils, C., Kikaj, D., Chung, E., Chambers, S., Griffiths, A., Conen, F., Fukumura-Sawada, P., and Krummel, P.: A Standardised Procedure for Estimating Greenhouse Gas Baselines Using Radon-222, EGU General Assembly 2025, Vienna, Austria, 27 Apr–2 May 2025, EGU25-18706, https://doi.org/10.5194/egusphere-egu25-18706, 2025.

EGU25-19189 | ECS | Posters on site | AS3.43

High-resolution CO2 flux modelling on the building-scale using GRAMM/GRAL and in-situ measurements for the Paris metropolitan area 

Robert Maiwald, Hervé Utard, Michel Ramonet, Olivier Laurent, Theo Glauch, Hugo Denier van der Gon, Thomas Lauvaux, and Sanam N. Vardag

The city of Paris aims to reach net zero emissions by 2050, an ambitious target whose achievement will need to be verified. Atmospheric measurements of CO2 can provide independent information on the city emissions and therefore, play an important role in monitoring the effectiveness of emission reduction plans.   

To derive emissions from measured concentrations, an atmospheric transport model is needed. This model should cover long time periods to detect trends and emission patterns, and run at high-resolution to simulate the air flow around urban structures. We use GRAMM/GRAL to model CO2 transport over Paris at 10m resolution with a catalogue approach. The hourly occurring meteorological situation and its respective concentration field is selected from a catalogue of around 1000 precomputed meteorological conditions, which are representative of wind situations over Paris. The selection of the appropriate catalogue entry is based on minimizing differences to wind measurements in the modelling domain. Thus, long time series of concentration enhancement maps can be calculated with low computational costs. Our setup for Paris includes anthropogenic fluxes, biogenic fluxes from Sentinel-2-based VPRM, and boundary conditions derived from in-situ measurements to allow a direct comparison to the observed concentrations in the city. 

We compare the simulated CO2 concentrations to measurements for 2023 from the ICOS Cities project. The modelled signals generally capture the diurnal dynamics and agree with the measured CO2. There are certain meteorological conditions where GRAMM/GRAL fails to capture the measured signal. GRAMM/GRAL does not accurately capture meteorological situations with lower boundary layer heights which most often occur during nighttime and in winter. However, we present a method of estimating a time-dependent uncertainty using concentration distribution from multiple catalogue entries. This uncertainty can be used in an inversion.  

We determine the underlying emission patterns and analyse the importance of the resolution of the emission inventory for emission quantification and emission sector disaggregation. Such detailed sector-specific information can help to inform policymakers about progress towards reduction goals and the effectiveness of specific reduction measures. 

How to cite: Maiwald, R., Utard, H., Ramonet, M., Laurent, O., Glauch, T., Denier van der Gon, H., Lauvaux, T., and Vardag, S. N.: High-resolution CO2 flux modelling on the building-scale using GRAMM/GRAL and in-situ measurements for the Paris metropolitan area, EGU General Assembly 2025, Vienna, Austria, 27 Apr–2 May 2025, EGU25-19189, https://doi.org/10.5194/egusphere-egu25-19189, 2025.

EGU25-21706 | Posters on site | AS3.43

Enhancing Urban GHG Monitoring: Progress of the NIST test-bed system 

Israel Lopez-Coto, Tyler Boyle, Julia Marrs, Anna Karion, Kimberly Mueller, Annmarie Eldering, Hratch Semerjian, and James Whetstone

As the U.S. Metrology Institute, the National Institute of Standards and Technology (NIST) has responded to the measurements and standards challenge of monitoring, reporting, and verifying greenhouse gas (GHG) emissions from a broad range of sources, with an emphasis on urban environments, to: a) improve U.S. capabilities to measure GHG emissions accurately; b) demonstrate the capabilities of atmospheric urban monitoring networks (top-down or atmospheric measurement approaches) to determine quantitatively GHG fluxes from industrial, residential, transportation, power generation and other activities; c) complement such measurements with spatially explicit emissions modeling (bottom-up or emissions modeling) approaches based on socio-economic data; and d) demonstrate that the combination improves confidence in emission estimates while identifying areas of improvement. 

As part of these efforts, NIST established its first Urban Test Bed in Indianapolis, Indiana (the INFLUX Project) in 2010 with Purdue University, NOAA, and Penn State University collaborators. Additional testbeds were established in Los Angeles (2012) and the Northeast Corridor (2014) to test applicability of methodologies over a range of meteorological conditions and emissions profiles. In this talk, we summarize some of the results obtained where we demonstrated methodologies for biogenic emission and uptake processes estimation, network design and emissions quantification from dense tower-networks and aircraft measurements. In addition, we highlight current efforts to transfer the research to operations, facilitate the adoption of the techniques by developing lower cost monitoring stations, and promote transparency by consolidating the methods in open-source computational tools.

How to cite: Lopez-Coto, I., Boyle, T., Marrs, J., Karion, A., Mueller, K., Eldering, A., Semerjian, H., and Whetstone, J.: Enhancing Urban GHG Monitoring: Progress of the NIST test-bed system, EGU General Assembly 2025, Vienna, Austria, 27 Apr–2 May 2025, EGU25-21706, https://doi.org/10.5194/egusphere-egu25-21706, 2025.

EGU25-452 | ECS | Orals | AS3.34 | Highlight

Improving nitrous oxide (N₂O) emissions accounting in Kenya: Insights and measurement results relating to fertilizer practices, environmental drivers, and N isotopic composition  

Turry Ouma, Phillip Agredazywczuk, Matti Barthel, Abigael Otinga, Ruth Njoroge, Sonja Leitner, Yuhao Zhu, Collins Oduor, Kevin Churchil Oluoch, Guillaume Obozinski, Johan Six, and Eliza Harris

The use of mineral fertilizers in Sub-Saharan Africa (SSA) is crucial for enhancing agricultural productivity but also raises concerns about emissions of nitrous oxide (N₂O), a potent greenhouse gas. Despite their importance for agriculture, N₂O emissions remain poorly understood in SSA, limiting the development of accurate emissions inventories and the adoption of climate-smart agricultural practices.

In the N2O-SSA project, we quantified N₂O emissions from maize and potato cropping systems under nitrogen application rates of 50 kg N/ha and 100 kg N/ha, compared to control plots, using automated static chamber methods. Fertilizer treatments included urea and triple superphosphate (TSP), and control plots received no nitrogen. Preliminary results showed significant temporal and treatment-specific variability in N₂O emissions, with peaks following fertilizer applications and rainfall events, highlighting the interaction between nitrogen availability and soil moisture. Cumulative annual N₂O emissions were found to vary widely depending on nitrogen application rates and crop types, with fertilizer treatments driving the majority of emissions. Emission factors (EFs) were within ranges consistent with previous studies, highlighting differences between crops such as maize and potatoes. Control plots consistently showed negligible emissions, underlining the critical role of nitrogen inputs in driving N₂O fluxes.

These findings underline the importance of crop-specific nitrogen dynamics in shaping N₂O emissions, and the need for tailored nitrogen management strategies to balance agricultural productivity with environmental sustainability. In the next phase of the project, we will analyze soil samples for N₂O isotopic composition, measuring δ¹⁵N-NH₄ and δ¹⁵N-NO₃, in addition to analyzing gas samples to provide further insights into the sources of N₂O emissions. This will inform more efficient nitrogen management practices for sustainable agricultural systems in Sub-Saharan Africa.

How to cite: Ouma, T., Agredazywczuk, P., Barthel, M., Otinga, A., Njoroge, R., Leitner, S., Zhu, Y., Oduor, C., Oluoch, K. C., Obozinski, G., Six, J., and Harris, E.: Improving nitrous oxide (N₂O) emissions accounting in Kenya: Insights and measurement results relating to fertilizer practices, environmental drivers, and N isotopic composition , EGU General Assembly 2025, Vienna, Austria, 27 Apr–2 May 2025, EGU25-452, https://doi.org/10.5194/egusphere-egu25-452, 2025.

EGU25-1203 | Posters on site | AS3.34

Top-down estimation of ammonia emissions from pig farm area using Backward Lagrangian Stochastic model 

Yeonhoo Kim, Joonhyeok Choi, Jinsik Kim, Hyungdo Song, Chul Yoo, and Mijung Song

Ammonia (NH3) emitted into the atmosphere contributes to increase in fine particulate matter concentrations through secondary formation and affects human comfort through unpleasant odors. Pig farms are a significant source of ammonia, but the actual emissions are highly variable depending on facility types, meteorological conditions, and operational practices, causing high uncertainty in estimating emissions. In this study, hourly atmospheric ammonia concentrations were measured in Yongji, Gimje, South Korea, a region well known for its large-scale old pig farming, over all four seasons from September 2023 to July 2024. Using the data, seasonal ammonia emissions from pig farms were simulated with the WindTrax Backward Lagrangian Stochastic model. Our findings will be presented. This can provide a foundation for validating bottom-up estimates of ammonia emissions and valuable insights on reducing uncertainties associated with ammonia emissions from pig farms.

How to cite: Kim, Y., Choi, J., Kim, J., Song, H., Yoo, C., and Song, M.: Top-down estimation of ammonia emissions from pig farm area using Backward Lagrangian Stochastic model, EGU General Assembly 2025, Vienna, Austria, 27 Apr–2 May 2025, EGU25-1203, https://doi.org/10.5194/egusphere-egu25-1203, 2025.

EGU25-1240 | ECS | Posters on site | AS3.34

Seasonality and health risk assessment of anthropogenic volatile organic compounds (VOCs) in a rural Seosan, South Korea 

Avinash Shastri, Jayant Nirmalkar, Seunggi Kim, Sangmin Oh, Kwangyul Lee, and Mijung Song

Atmospheric volatile organic compounds (VOCs) were measured in this study during four seasons (winter, summer, spring, and autumn) between 2020 to 2022, using gas chromatography equipped with a photoionization detector (PID), at Seosan, South Korea. The mean concentration of ∑34VOCs was 21.2 ± 26.6 µg/m3, with the highest levels measured in autumn (33.6 ± 40.4 µg/m3). The toluene/benzene ratio indicated industrial activities dominated in winter and spring, while solvent use and agriculture were key in autumn, with biomass burning common in both seasons. The secondary organic aerosol formation potential (SOAFP) was highest during autumn and summer, significantly contributing to PM2.5 levels. The Monte Carlo simulation revealed benzene concentrations frequently exceeded the permissible carcinogenic risk threshold (1 × 10⁻⁶), suggesting potential health hazards. Meanwhile, the non-carcinogenic risks of seven selected VOCs remained within acceptable limits (hazard quotient [HQ] < 1). The outcomes of the study emphasized the importance of understanding VOC characteristics, sources, and implications for public health.

How to cite: Shastri, A., Nirmalkar, J., Kim, S., Oh, S., Lee, K., and Song, M.: Seasonality and health risk assessment of anthropogenic volatile organic compounds (VOCs) in a rural Seosan, South Korea, EGU General Assembly 2025, Vienna, Austria, 27 Apr–2 May 2025, EGU25-1240, https://doi.org/10.5194/egusphere-egu25-1240, 2025.

EGU25-2618 | ECS | Orals | AS3.34

Global ammonia emission could be halved with cost-effective measures 

Xiuming Zhang, Baojing Gu, Wilfried Winiwarter, Hans van Grinsven, Mark Sutton, and Shaohui Zhang

Excess ammonia (NH3) emissions from human activities pose critical risks to global ecosystems and human health. Despite the urgent need for NH3 emission controls, a comprehensive evaluation of the cost-effectiveness of mitigation strategies remains underdeveloped. In this study, we adopt a multi-model framework to assess the cost and impact of 32 mitigation measures across seven key sectors in 185 countries. Our results indicate that targeted implementation of these measures, particularly in the agricultural sector, could reduce global NH3 emissions by 49% (36–57%). The estimated implementation cost of $279±69 billion outweighs the projected environmental, health, and resource benefits of $568±182 billion. China and India emerge as critical regions for prioritizing NH3 mitigation, offering the highest societal returns, while Sub-Saharan Africa shows limited economic viability. Future scenario analysis reveals that sustainable policy pathways could reduce NH3 emissions by 55% by 2050. Conversely, weak climate action and inadequate nitrogen regulations may result in a 19% increase in emissions, exacerbating environmental degradation and hindering progress toward sustainable development goals. Our findings underscore the urgent need for coordinated global efforts and region-specific policies to establish and achieve effective NH3 mitigation targets.

How to cite: Zhang, X., Gu, B., Winiwarter, W., van Grinsven, H., Sutton, M., and Zhang, S.: Global ammonia emission could be halved with cost-effective measures, EGU General Assembly 2025, Vienna, Austria, 27 Apr–2 May 2025, EGU25-2618, https://doi.org/10.5194/egusphere-egu25-2618, 2025.

EGU25-3228 | ECS | Posters on site | AS3.34

The effect of post-harvest cover crop management on N2O emissions 

Harika Bommisetty, Lars Elsgaard, and Lars Juhl Munkholm

Agricultural soils are the primary source of nitrous oxide (N2O) emissions into the atmosphere, contributing 78% of total N2O emissions. These emissions are influenced by different tillage practices and types of plant cover that are left after harvest. Cover crops (CC) are widely used in agriculture to take up excess nitrogen from the fields, thereby reducing nitrate leaching and increasing soil carbon accrual. However, despite these benefits, agricultural soils containing cover crops have often resulted in high N2O emissions.

A two-year field study with measurement of N2O emissions was conducted in Denmark using a long-term conservation agriculture experiment, including cover cropping, no tillage and crop rotation. The study focused on the influence of soil tillage and cover cropping on soil physical properties and N2O emissions. The tillage systems included no tillage (direct seeding) and conventional ploughing; CC management included paired subplots with oil-seed radish (Raphanus sativus L.), where (i) the cover crop residues were terminated and removed in autumn (CC-rem), and (ii) the cover crop residues were killed by the frost and left in the field (CC-left). Bare soil treatment (i.e., without CC) is included as a reference. Spring oats (Avena sativa L.) grew as the main crop during the first year followed by spring barley (Hordeum vulgare L.) in the second year.

The first-year results for N2O fluxes showed that there were no significant differences in N2O emissions between the tillage practices. However, emissions varied significantly among CC treatments. Compared to the reference without CC, peak emissions (up to 74 µg N2O-N m-2 h-1) were observed for both cover crop treatments. During the cropping season, most of the emissions occurred after fertilization. Especially, +CC-left emitted more N2O than CC-rem during the main cropping season. Before establishing the main crop, CC-rem emitted more N2O than CC-left. Volume-effective porosity, air permeability, bulk density and gas diffusivity are critical soil physical properties that influenced N2O emissions among the cover crop treatments.

How to cite: Bommisetty, H., Elsgaard, L., and Juhl Munkholm, L.: The effect of post-harvest cover crop management on N2O emissions, EGU General Assembly 2025, Vienna, Austria, 27 Apr–2 May 2025, EGU25-3228, https://doi.org/10.5194/egusphere-egu25-3228, 2025.

EGU25-4260 | ECS | Posters on site | AS3.34

Decadal analysis of ammonia emission levels in the lowlands of eastern Germany using remote sensing data 

Christian Saravia and Katja Trachte

Ammonia (NH3) emissions play a significant role in air quality degradation, biodiversity loss, and human health risks by forming secondary pollutants such as fine particulate matter (PM2.5). This study presents a decadal (2013–2022) spatiotemporal analysis of NH3 emissions in the lowlands of eastern Germany, using data from the Infrared Atmospheric Sounding Interferometer (IASI-B) onboard the MetOp-B satellite. The region, characterized by predominantly agricultural land use (54.71%), offers a valuable case for understanding NH3 emission dynamics across diverse landscapes. Integrating satellite remote sensing, machine learning, and atmospheric modeling, this analysis reveals pronounced seasonal and spatial variations, with agricultural activities identified as the primary source of emissions. K-means clustering highlights the influence of cropland, grassland, and urban areas on NH3 emission patterns, identifying significant agricultural hotspots. Additionally, advanced geospatial analysis establishes significant correlations between NH3 concentrations and meteorological variables. NH3 emissions were positively associated with surface solar radiation, temperature, atmospheric boundary layer height, and convective available potential energy, while precipitation, moisture flux, and wind speed exhibited negative correlations. Backward trajectory dispersion modeling employing the HYSPLIT model provided insights into NH3 transport pathways. The results confirmed the influence of both, local sources and non-local contributions. These findings show the major role of meteorological conditions in NH3 dispersion and underscore the importance of sustainable agricultural practices in mitigating emissions.

How to cite: Saravia, C. and Trachte, K.: Decadal analysis of ammonia emission levels in the lowlands of eastern Germany using remote sensing data, EGU General Assembly 2025, Vienna, Austria, 27 Apr–2 May 2025, EGU25-4260, https://doi.org/10.5194/egusphere-egu25-4260, 2025.

Crop production is a major source of agricultural carbon emissions, yet the life cycle carbon footprints (LCCFs) of key global staple crops remain underexplored. This study quantifies the LCCFs of three major grain crops—maize, rice, and wheat—using a hybrid approach that integrates machine learning (ML) models and life cycle assessment (LCA) for the period from 2006 to 2019. We systematically calculated the cradle-to-farm-gate carbon footprint (CF), accounting for emissions from upstream inputs, transportation, and field operations. Emission factors (EFs) and CF compositions were assessed over different time periods. Additionally, we developed a novel Supply-Demand Balanced Carbon Allocation Model (SD-CAM) to trace the sources and flows of upstream CF. Our results reveal a steady increase in the CF of these crops over time, with significant regional variations in both EFs and CF composition. The primary carbon footprint of global rice production is mainly attributed to field carbon emissions, with nitrogen fertilizers as the secondary carbon source. In contrast, nitrogen fertilizers are the dominant carbon source for maize and wheat. Interestingly, while maize's total field emissions are a net carbon source, wheat production acts as a carbon sink. The majority of the CF is concentrated in a few key grain-producing countries, such as China, India, and the United States. Regarding the upstream carbon footprint (IUCCF), major producing countries like China and Canada have consistently been the primary sources of upstream carbon inputs throughout the study period. However, with the rise of global economic initiatives like the Belt and Road, emerging upstream contributors such as Morocco and Vietnam have increasingly become significant contributors in upstream carbon emissions. This study provides valuable insights into the environmental impacts of agricultural production over time, offering guidance for sustainable agricultural policies, carbon responsibility allocation, and international low-carbon cooperation.

How to cite: Liu, S., He, Y., Liu, Y., and Jiang, Q.: Tracing the life cycle carbon footprint of global staple crops: an integrated approach combining machine learning and life cycle assessment, EGU General Assembly 2025, Vienna, Austria, 27 Apr–2 May 2025, EGU25-4965, https://doi.org/10.5194/egusphere-egu25-4965, 2025.

EGU25-6101 | Orals | AS3.34

Ammonia emission estimates using CrIS satellite observations over Europe 

Jieying Ding, Ronald van der A, Henk Eskes, Enrico Dammers, Mark Shephard, Roy Wichink Kruit, Marc Guevara, and Leonor Tarrason

Over the past century, ammonia (NH3) emissions have increased with the growth of livestock and fertilizer usage. The abundant NH3 emissions lead to secondary fine particulate matter (PM2.5) pollution, climate change, and a reduction in biodiversity, and they affect human health. Up-to-date and spatially and temporally resolved information on NH3 emissions is essential to better quantify their impact. In this study we applied the existing Daily Emissions Constrained by Satellite Observations (DECSO) algorithm to NH3 observations from the Cross-track Infrared Sounder (CrIS) to estimate NH3 emissions. Because NH3 in the atmosphere is influenced by nitrogen oxides (NOx), we implemented DECSO to estimate NOx and NH3 emissions simultaneously. The emissions are derived over Europe for 2020 on a spatial resolution of 0.2°×0.2° using daily observations from both CrIS and the TROPOspheric Monitoring Instrument (TROPOMI; on the Sentinel-5 Precursor (S5P) satellite). Due to the limited number of daily satellite observations of NH3, monthly emissions of NH3 are reported. The total NH3 emissions derived from observations are about 8 Tg yr−1, with a precision of about 5 %–17 % per grid cell per year over the European domain (35–55° N, 10° W–30° E). The comparison of the satellite-derived NH3 emissions from DECSO with independent bottom-up inventories and in situ observations indicates a consistency in terms of magnitude on the country totals, with the results also being comparable regarding the temporal and spatial distributions. The validation of DECSO over Europe implies that we can use DECSO to quickly derive fairly accurate monthly emissions of NH3 over regions with limited local information on NH3 emissions

How to cite: Ding, J., van der A, R., Eskes, H., Dammers, E., Shephard, M., Wichink Kruit, R., Guevara, M., and Tarrason, L.: Ammonia emission estimates using CrIS satellite observations over Europe, EGU General Assembly 2025, Vienna, Austria, 27 Apr–2 May 2025, EGU25-6101, https://doi.org/10.5194/egusphere-egu25-6101, 2025.

EGU25-8327 | Posters on site | AS3.34

Predicting Enteric Methane Emissions in Dairy Cows Using Deep Learning Models 

Amir Sahraei, Deise Knob, Christian Lambertz, Andreas Gattinger, and Lutz Breuer

This study evaluates the potential of deep learning (DL) models to predict enteric methane (CH₄) emissions in dairy cows using data from automated milking and feeding systems, behavioral sensors, and public weather databases. Methane emissions were recorded for 52 cows from October 2022 to December 2023 using the sniffer technology at Gladbacherhof, an organic research farm run by the Justus Liebig University Giessen, Germany. Among the tested models, Long Short-Term Memory (LSTM) networks outperformed Convolutional Neural Networks (CNNs) and hybrid CNN-LSTM models given that data from all sources were available (Scenario S1), achieving an R² of 0.88 and a mean bias error (MBE) of 13.55 ppm CH₄. To assess model applicability under varying data scenarios, features were categorized as "rare," "moderate," or "public" based on their ease of acquisition. Using only public weather data (Scenario S2) resulted in poor predictions, while incorporating moderate-effort farm data (Scenario S3) improved accuracy (R² = 0.45, MBE = 17.60). Adding three rarely available feed-related features, namely feed efficiency, concentrate intake, and total dry matter intake considerably enhanced performance (Scenario S4: R² = 0.74, MBE = 14.36). Random forest analysis highlighted feed-related data as critical for improving prediction performance. These findings demonstrate the capability of DL models to accurately predict CH₄ emissions using readily accessible farm data integrated with a small set of high-impact feed-related features. This approach provides a valuable tool for developing targeted strategies to mitigate methane emissions in dairy farming.

How to cite: Sahraei, A., Knob, D., Lambertz, C., Gattinger, A., and Breuer, L.: Predicting Enteric Methane Emissions in Dairy Cows Using Deep Learning Models, EGU General Assembly 2025, Vienna, Austria, 27 Apr–2 May 2025, EGU25-8327, https://doi.org/10.5194/egusphere-egu25-8327, 2025.

EGU25-8992 | ECS | Orals | AS3.34

FERTIPAS: Emissions of organic FERTIlizers as Secondary Organic Aerosol Precursors 

Mostafa khazma, Henri Wortham, Julien Kammer, and Brice Temime-roussel

Agriculture is a major source of volatile organic compounds (VOCs), key precursors of secondary air pollutants such as ozone and aerosols. These VOCs react with atmospheric oxidants (e.g., hydroxyl radicals, ozone, nitrate radicals) to form more oxidized compounds with a low volatility that can condense to the particulate phase, driving the formation of secondary organic aerosols (SOA). SOA, a major component of atmospheric aerosols, significantly impacts air quality, climate, and human health. However, estimating SOA production remains highly uncertain due to the complexity of these processes and the diversity of precursors. The shift toward sustainable agriculture has increased the use of organic fertilizers, such as sewage sludge, compost, and animal waste. Given the vast agricultural land area, the spreading of organic fertilizers represents a potentially significant source of VOC emissions. However, their impact on the atmosphere remains poorly understood, mainly due to a lack of studies. The general aim of this work is to improve our knowledge on the impact of spreading these organic fertilizers on air quality, as a source of VOCs. Laboratory study was carried out to analyze VOC emissions from organic fertilizers (sewage sludge, compost and methanization digestate) and to assess the impact of temperature on these emissions. An experimental set-up combining a proton transfer reaction time-of-flight mass spectrometer (PTR-ToF-MS), an emission chamber and a multi-valve system was employed to assess VOC emission from three different organic fertilizers, at three temperatures (10°C, 20°C and 30°C).The analysis revealed a total emission of 118 VOCs from digestate, 99 from sewage sludge and 200 from compost. One notable observation is the perceptible diversity in the chemical composition of these three organic fertilizers. Specifically, each fertilizer presents hydrocarbon, oxygenated and nitrogenated compounds, with hydrocarbons and oxygenated compounds dominating in all three fertilizers. On the other hand, sulfur compounds are only present in sludge and compost, while digestate had a significantly higher prevalence of nitrogenated compounds. Acetone (C3H6O) is the most emitted compound from digestate and sewage sludge, while methanol (CH4O) predominates in compost emissions.  In addition, compounds such as monoterpenes (C10H16), cresols (C7H8O) and phenols (C6H6O), known SOA precursors, were among the most emitted compounds. Secondly, most compounds showed a positive response to temperature, with some increasing linearly and others exhibiting exponential response. Conversely, very few VOCs, such as acetic acid, unexpectedly decreased with rising temperatures. The impact of temperature variations on VOC emissions and the mechanisms driving these patterns will be discussed. Lastly, the potential of organic fertilizers to form ozone through VOC emissions has been estimated for each emitted molecule. Compost had the highest ozone-forming potential followed by sewage sludge and digestate. For digestates and composts, the primary species responsible for ozone formation were hydrocarbons (63% and 60%, respectively), even though oxygenated compounds dominated their emissions. In contrast, for sewage sludge, 56% of the ozone were produced by oxygenates. The results suggested that, from the perspective of air quality, digestate may be a preferable organic fertilizer compared to compost and sewage sludge.

How to cite: khazma, M., Wortham, H., Kammer, J., and Temime-roussel, B.: FERTIPAS: Emissions of organic FERTIlizers as Secondary Organic Aerosol Precursors, EGU General Assembly 2025, Vienna, Austria, 27 Apr–2 May 2025, EGU25-8992, https://doi.org/10.5194/egusphere-egu25-8992, 2025.

EGU25-9186 | ECS | Posters on site | AS3.34

Development of a Satellite-Based Algorithm for Detecting Methane Emission Changes from Rice Paddies  

Seongmun Sim, Ye-Seul Yun, Subin Cho, SeongWook Park, Boram Seong, Yeongho Kim, Myungseok Lee, and Keunhoo Cho

With the acceleration of climate change, there is an increasing focus on the management of greenhouse gases. Although carbon dioxide is a primary concern, methane and nitrous oxide significantly contribute to the overall greenhouse gas concentration in the atmosphere, necessitating research on their monitoring and quantification. More than 50% of methane emissions originate from sources including natural gas and oil processing, enteric fermentation, and landfills, making those industries the focus of intensive monitoring attempts, encompassing satellite-based observations for extensive and periodic assessment. Further, methane plumes can be detected and emission rates assessed using wind field data for high-concentration sources.


In agriculture, rice paddies are a major source of methane emissions. Nonetheless, a low emission rate per unit area frequently produces undetectable plumes, resulting in dependence on inventory-based simulations instead of measurement-based monitoring. Despite the low emission rate, the extensive expanse of rice fields implies that alterations in fertilizer application or agricultural methodologies can result in substantial changes in overall emissions, thereby requiring prompt monitoring. Moreover, rice cultivation is predominantly concentrated in Asia, which could significantly affect emissions if disrupted by climatic and meteorological changes in the region.


This research develops an algorithm to identify changes in methane emissions utilizing satellite-derived methane concentration data from TROPOspheric Monitoring Instrument (TROPOMI) onboard Sentinel-5p, TANSO-FTS-2 (Thermal And Near infrared Sensor for carbon Observation – Fourier Transform Spectrometer-2) onboard GOSAT (Greenhous gases Observing SATellite), and AIRS (Atmospheric Infrared Sounder) onboard Aqua. Through the analysis of over three years of aggregated data and its comparison with crop calendars, reference datasets named baseline data specifically designed for the growth and agricultural cycles of rice were developed with the valid value ranges. These were employed to identify increases or decreases in greenhouse gas emissions or alterations in emission timing by contrasting current observations with baseline data. The algorithm was implemented in principal rice cultivation regions of South Korea, effectively detecting substantial methane emissions during the irrigation phase causing anaerobic fermentations to soil under the water. This method illustrates the capability of satellite data to improve the comprehension and regulation of agricultural methane emissions. Additionally, guidelines for sustainable agricultural practices and the management of greenhouse gas emissions in agriculture will be feasible.

How to cite: Sim, S., Yun, Y.-S., Cho, S., Park, S., Seong, B., Kim, Y., Lee, M., and Cho, K.: Development of a Satellite-Based Algorithm for Detecting Methane Emission Changes from Rice Paddies , EGU General Assembly 2025, Vienna, Austria, 27 Apr–2 May 2025, EGU25-9186, https://doi.org/10.5194/egusphere-egu25-9186, 2025.

EGU25-9903 | ECS | Posters on site | AS3.34

Modeling the impacts of ozone deposition on wheat yields 

Manuela Harrel Njiki, Ronny Lauerwald, Jean-François Castell, and Raia-Silvia Massad

 In recent years, there has been a growing concern about the impacts of ozone pollution on crop
production, particularly in peri-urban cropping areas. As an oxidant, ozone affects plant
biochemical and physiological processes, which in turn disrupt crop development and result in
yield losses. Wheat, a staple crop that sustains billions of people worldwide, is particularly
susceptible to ozone pollution. Quantifying the effects of ozone on wheat yields is crucial for
shaping agronomic and environmental policies at both national and European levels, not only
for the present but also for future scenarios involving climate change, air quality, and
agricultural land management. Another key element to consider is the effect of ozone on soil
organic carbon sequestration in croplands. Crop models play a vital role in quantifying the
combined effects of ozone and management practices on crop growth, yield, biomass
accumulation, and soil carbon dynamics.
The CERES-O3 model developed in 2005 which extends from the CERES-EGC crop model
by integrating Farquhar’s photosynthesis model, efficiently fulfills these requirements.
CERES-O3 simulates the effects of elevated ozone concentrations on photosynthetic rates,
including Rubisco carboxylation efficiency, and consequently on biomass production and
yields.
We use new sets of experimental data obtained at the Grignon ICOS (Integrated Carbon
Observation System) site under varying pedoclimatic conditions against experimental data from
the literature to evaluate the model’s performance. Model simulations reveal that elevated
ozone concentrations reduce photosynthetic rates, stomatal conductance, and Rubisco
carboxylation efficiency, culminating in diminished biomass and grain yield. Furthermore,
parameterizations for two wheat cultivars (Premio and Soissons) show similar ozone effects on
both cultivars.
Although developed more than 20 years ago, CERES-O3 remains a promising tool to quantify
current and predict future ozone impacts at local and global scales. It has strong potential to
enable the exploration of mitigation strategies, including cultivar development, improved
agronomic practices, and policy interventions to curb ozone pollution. It can be used to better
understand the combined effects of ozone pollution and climate stress, which are essential for
ensuring food security in changing global environments. Future steps regarding the model
involve assessing the potential impacts of ozone on soil carbon sequestration in croplands,
which remains a little-known factor in nature-based solutions to mitigate climate change.
Keywords: Ozone, wheat, crop yield, photosynthesis, modeling, stomatal conductance,
CERES-O3

How to cite: Njiki, M. H., Lauerwald, R., Castell, J.-F., and Massad, R.-S.: Modeling the impacts of ozone deposition on wheat yields, EGU General Assembly 2025, Vienna, Austria, 27 Apr–2 May 2025, EGU25-9903, https://doi.org/10.5194/egusphere-egu25-9903, 2025.

EGU25-10491 | ECS | Posters on site | AS3.34

Surfatm-PM: a model of bi-directional particulate matter exchanges over a grassland 

Aubin Courty, Patrick Stella, Rachna Bhoonah, Didier Hébert, Philippe Laguionie, Denis Maro, Pierre Rouspard, Eric Lamaud, Denis Quelo, Erwan Personne, and Sébastien Saint-Jean

According to the Global Burden of Diseases, PM2.5 (particles with a diameter under 2.5 µm) is the leading cause of diseases and deaths in 2021 (Brauer et al., 2024). Along with decreased emissions, removal through deposition is used to reduce exposure to particulate matter (PM). With a leaf area index (m² of leaf per m² of land) usually higher than 1, plants allow for a higher deposition surface, hence more particle removal from ambient air. Thus, understanding and estimating PM deposition on vegetation is necessary to assess the impact of vegetation on air quality. In situ measurements above vegetation have shown that PM (vertical) deposition velocity can be positive and negative (Pellerin et al., 2017). No 1-dimensional PM deposition model can predict such values. The objective of this study is to implement a working bi-directional PM exchange scheme in the Surfatm exchange model (Personne et al., 2024), a 1-dimensional SVAT model, using a resistive scheme. The bi-directional fluxes are introduced using a compensation point approach, which can be interpreted as the PM surface concentration. This allows the concentration gradient to change signs depending on the difference of concentration between ambient air and the surface. Two PM exchange datasets above a grassland in Lusignan (France) are used to calibrate and validate the model respectively (Pellerin et al., 2017). The Surfatm-PM model can predict positive and negative deposition velocities, with notable differences attributable to the formation mechanism of the particles, such as the process of coagulation or nucleation or condensation between ambient air and (vegetated) interfaces.

How to cite: Courty, A., Stella, P., Bhoonah, R., Hébert, D., Laguionie, P., Maro, D., Rouspard, P., Lamaud, E., Quelo, D., Personne, E., and Saint-Jean, S.: Surfatm-PM: a model of bi-directional particulate matter exchanges over a grassland, EGU General Assembly 2025, Vienna, Austria, 27 Apr–2 May 2025, EGU25-10491, https://doi.org/10.5194/egusphere-egu25-10491, 2025.

EGU25-11422 | Orals | AS3.34

Nitrosat, a satellite mission concept for mapping reactive nitrogen at the landscape scale 

Pieternel Levelt and Pierre Coheur and the Nitrosat Team

Two key forms of reactive nitrogen (Nr) in the atmosphere are nitrogen oxides (NO+NO2) and ammonia (NH3). Both species are abundantly emitted from anthropogenic sources (fossil fuel combustion, agriculture) with devastating consequences on the environment, human health and climate. Complementing sparse ground-based measurements, current satellite sounders provide daily coverage of their global distribution. However, the spatial resolution of these instruments (>20 km² for NO2 and >100km² for NH3) is orders of magnitudes greater than the typical size of the main Nr sources (industries, farms, roads), which makes identification of the emitters, and corresponding quantification of their emission strengths particularly challenging.


To understand and address the impacts of a perturbed nitrogen cycle, and in response to the current observational gap, a dedicated satellite for the monitoring of NO2 and NH3 at high spatial resolution has been conceptualised, called Nitrosat. Its main objective is to quantify simultaneously the emission sources of NH3 and NOx at the landscape scale (<0.25 km²) and to characterize seasonal patterns (<1 month) in their emissions. The two imaging spectrometers onboard Nitrosat will operate respectively in the infrared for NH3 and the visible for NO2, offering gapless coverage in a single swath.


Starting from representative examples of measurement techniques that are presently used to derive emission fluxes from NH3 and NO2 satellite observations, we discuss the limitations of current sounders. We introduce the Nitrosat measurement concept and, exploiting both model simulations and aircraft campaign data, provide examples from the EE11 Phase 0 studies of how Nitrosat will enable retrieval of emission fluxes from local and diffuse sources in a way that will not be possible with other current or planned missions.

How to cite: Levelt, P. and Coheur, P. and the Nitrosat Team: Nitrosat, a satellite mission concept for mapping reactive nitrogen at the landscape scale, EGU General Assembly 2025, Vienna, Austria, 27 Apr–2 May 2025, EGU25-11422, https://doi.org/10.5194/egusphere-egu25-11422, 2025.

EGU25-13536 | ECS | Orals | AS3.34

Leveraging In Situ and Satellite Data to understand Changing Ammonia above an Agricultural Hotspot 

Lillian Naimie, Da Pan, Amy P. Sullivan, Kimberley A. Corwin, Katherine Benedict, Lena Low, and Jeffrey L. Collett

The Colorado Front Range urban corridor and the plains to the east are important source regions of ammonia (NH3), an unregulated pollutant primarily emitted from agricultural activities. Upslope flows driven by the mountain-plains circulation and synoptic scale storm circulations periodically transport these emissions into Rocky Mountain National Park located 50 km west, where excess reactive nitrogen (N) deposition is a historical problem with well documented impacts on the ecosystem. A combination of low-cost Radiello passive sampler NH3 measurements and NH3 total column retrievals from the Infrared Atmospheric Sounding Interferometer (IASI) are used to assess temporal and spatial variability in NH3 across three distinct land use categories in the region: agricultural, urban, and rural. The NH3 mixing ratio from passive measurements was strongly correlated with the number of confined animal feedlot operations (CAFOs) within a 12 km radius, confirming the importance of that emission source category. Ground-level passive NH3 measurements have a strong correlation with monthly gridded IASI satellite retrievals. Using satellite retrievals, we find an increasing NH3 trend of approximately 3% per year in agricultural and urban sub-regions. We attribute less than 0.2% of the increasing NH3 trend to reductions in particle sulfate. The absolute trend follows the spatial distribution of CAFOs. In the agricultural sub-region, the absolute NH3 trend is on average greater than 2 times larger than that observed in the urban sub-region. The ground-based observations do not have a trend. The lack of ground-based trend is attributed to increasing boundary layer height and dilution of concentrations, through analysis of ERA5 reanalysis data. Lofting NH3 higher into the atmosphere can increase atmospheric lifetime, associated with transport and deposition further from source regions and increased particle formation. Elevated NH3 from wildfire smoke was observed in August 2020, a period of active wildfire activity in northern Colorado, from IASI satellite retrievals. This elevation was less apparent in surface measurements, likely also due to the lofting of the smoke plume. Modeled smoke plumes from the Hazard Mapping System were used to assess the potential impacts of wildfires on observed NH3 trends.

How to cite: Naimie, L., Pan, D., Sullivan, A. P., Corwin, K. A., Benedict, K., Low, L., and Collett, J. L.: Leveraging In Situ and Satellite Data to understand Changing Ammonia above an Agricultural Hotspot, EGU General Assembly 2025, Vienna, Austria, 27 Apr–2 May 2025, EGU25-13536, https://doi.org/10.5194/egusphere-egu25-13536, 2025.

EGU25-15997 | ECS | Posters on site | AS3.34

Assessing the ammonia mitigation potential from the Indian agriculture sector for improving air quality in India 

Rakhi Chaudhary, Sagnik Dey, Gazala Habib, and Pallav Purohit

As an agrarian country, India heavily depends on fertilizers for food production to meet consumption demands, which contributes to a significant portion of global ammonia emissions. Ammonia is an essential precursor gas to form secondary PM2.5 by reacting with SO2 and NO2 and degrades air quality significantly. Thus, it is imperative to implement mitigation strategies to reduce ammonia emissions from the agricultural sector for air quality improvement. In this study, we have updated the sub-sectoral agriculture activity data for each state of India, using 2022 as the base year. Ammonia emissions from each sub-sectoral activity for each state were estimated in the GAINS model for baseline and future scenarios under the current policy framework. We estimated the mitigation potential for ammonia emissions in agriculture by applying different alternate control scenarios. Under the current baseline scenario, the ammonia emissions (in Kilotons) from urea application are the highest among all the states, followed by other livestock such as sheep and horses, other cattle (Beef), dairy cattle, poultry, nitrogenous fertilizer use and production, and agricultural waste burning. The major contributor states to annual ammonia emissions (in Kt/yr) from urea application are Uttar Pradesh (625 ), followed by Andhra Pradesh (290.67) and Madhya Pradesh (271.32). The major contributor states to NH3 emissions from livestock sectoral activities (other cattle, dairy cattle, sheep and horses, poultry, etc.) are Uttar Pradesh (827.73) followed by Andhra Pradesh (478.65) and Rajasthan (491.13). The NH3 emissions (kt/y) from nitrogenous fertilizer production and consumption was highest from Uttar Pradesh (23.28), followed by Gujarat (10.86) and Maharashtra (10.44), while the contribution from agriculture waste burning was estimated largely from Uttar Pradesh (61.10), followed by Andhra Pradesh (32.91) and Tamil Nadu (30.04).  We consider several strategies, such as deep manure placement, low nitrogen feed, scrubber for livestock housing, urea substitution, neem-coated urea, and biochar additives to reduce NH3 emissions and estimate their mitigation potentials in this work. To date, there are no specific regulations in India targeting agricultural ammonia emissions at the same level as those of other sector pollutants. Therefore, our results will be useful for policymakers for developing state-specific sub-sectoral mitigation strategies to address this critical issue.

Keywords: Ammonia, fertilizer, livestock, emissions, control scenarios

How to cite: Chaudhary, R., Dey, S., Habib, G., and Purohit, P.: Assessing the ammonia mitigation potential from the Indian agriculture sector for improving air quality in India, EGU General Assembly 2025, Vienna, Austria, 27 Apr–2 May 2025, EGU25-15997, https://doi.org/10.5194/egusphere-egu25-15997, 2025.

EGU25-17390 | Orals | AS3.34

Online fluxes of pesticides over bare soil in France with a PTRMS: results from French the Online-PTR4-Pest study 

Benjamin Loubet, Florence Lafouge, Céline Decuq, Raluca Ciuraru, Pauline Buysse, baptiste Esnault, and Valérie Gros

In agriculture, plant protection products (i.e. pesticides) protect crops from pests, weeds and diseases. However, pesticides introduced into our environment can also contaminate the air, partly due to volatilisation after pesticide application. Measuring volatilisation in field crops requires trapping techniques, which are costly and time-consuming. There is therefore a strong need for metrological developments to implement (1) analysers that can measure pesticide concentrations continuously over a short period of time, (2) the monitoring of pesticide emissions over a sufficiently long period to capture the entire volatilisation period and (3) the acquisition of data sets in little-explored situations, particularly in wine-growing practices.

The aim of the Online-PTR4-Pest project was to develop the measurement of concentration and volatilisation for three pesticides using proton transfer mass spectrometry (PTR-MS). This technique should eventually enable real-time measurement of pesticide concentrations in the air, as well as field measurement of pesticide volatilisation (using inverse modelling or possibly turbulent covariance methods).

Three pesticides were selected: Prosulfocarb, Pendimethalin (two herbicides used in field crops) and Cyflufenamide (a vine fungicide). Several analysers were used: gas chromatography with thermodesorption mass spectrometry (TD-GC-MS) and PTR-MS. Measurement of the two herbicides was validated using the highly sensitive PTR-Qi-TOF-MS (a time-of-flight mass spectrometer with a proton transfer ionisation source and quad used as an ion guide). Gas-phase calibration is a key stage in the metrological development of PTR-MS measurements. A permeation calibration system was developed and successfully tested, enabling the PTR-MS to be calibrated over a concentration range of 3 ppt to 10 ppb for prosulfocarb and 1 ppt to 3 ppb for pendimethalin.

A three-week field campaign was carried out at the ‘BioEcoAgro’ cross-border joint research unit of INRAE in Mons, with measurements on wheat plots. Air concentrations of Proculfocarb and Pendimethalin were quantified (using both analytical chains and a time step of 5 minutes). These air concentrations varied between 0 and 15 µg m 3 for Prosulfocarb and 0 to 3 µg m 3 for Pendimethalin. Volatilisation fluxes for these two herbicides were estimated using two different methods (aerodynamic gradient and inverse modelling). Over the first few days of field measurements, volatilization of Prosulfocarb was around ten times higher than that of Pendimethalin, regardless of the method used. However, the two methods gave different volatilisation values, as the inverse modelling method was made more uncertain by the applications of these pesticides in the surrounding fields. Finally, the Volt'air-Veg model of pesticide volatilisation was tested on the two datasets. The feasibility of measuring gaseous pesticides in the air in real time using a PTR-MS has been demonstrated.

How to cite: Loubet, B., Lafouge, F., Decuq, C., Ciuraru, R., Buysse, P., Esnault, B., and Gros, V.: Online fluxes of pesticides over bare soil in France with a PTRMS: results from French the Online-PTR4-Pest study, EGU General Assembly 2025, Vienna, Austria, 27 Apr–2 May 2025, EGU25-17390, https://doi.org/10.5194/egusphere-egu25-17390, 2025.

EGU25-17465 | ECS | Posters on site | AS3.34

Agricultural sources impact on NH3 and PM levels in the South-Central Anatolia  

Aykut Mehmet Alban, Seda Tokgoz, Serra Saracoglu, and Burcak Kaynak

Atmospheric ammonia (NH3) is a significant pollutant that rapidly reacts with atmospheric acids like sulfuric acid (H2SO4) and nitric acid (HNO3) to form fine particulate matter (PM2.5), which has negative effects on both the environment and public health. NH3 has several kinds of sources but main emitter is agriculture, which originates from crop production and livestock managements. Besides conventional emissions from agriculture, agricultural waste burning is also significant in some regions although prohibited.

Türkiye is an agricultural producing country, and the largest agricultural areas and livestock farms are located in South-Central Anatolia. This study aims to investigate the possible causes of high NH3 and PM levels in this region, focusing on agricultural activities such as crop production, livestock farming, and agricultural residue burning. Using IASI Level-2 NH3 retrievals, the spatio-temporal changes in NH3 levels was investigated over the region. Annual and seasonal changes in NH3 levels were evaluated together with meteorological parameters and ground-based PM10 and PM2.5 measurements. In order to understand the effect of agricultural burning on high NH3 and PM levels in fall season, biomass burning regions were determined with VIIRS S-NPP Fire Radiative Power (FRP) product and aerosol types were examined with CALIOP Level-1 and Level-2 VFM product. High NH3 levels were detected in the study area which has the highest agricultural activity in Türkiye. Seasonal distributions of the region showed that significant levels in fall season, unlike all other regions in Türkiye indicating highest summer NH3 levels. These findings indicated a different source causing high NH3 levels in the fall season other than the agricultural activities usually having highest impact in spring and summer seasons. In the fall seasons (2019-2023), the highest FRP values were observed with values three times or higher than of other seasons. Especially, the highest number of fires occurred in fall of 2020 and 2023, when higher NH3 levels were also observed. Additional to regional high values, hotspots of NH3 were identified in Konya–Eregli, Nigde–Bor, and Aksaray–Merkez. NH3 levels were also observed higher during winter seasons in these hotspots where livestock farms are frequently located. Therefore, effects of livestock farming and residual burning as a NH3 source stood out in this region rather than conventional fertilizer applications. It is important that these lesser known and investigated emission sources of NH3 need to be evaluated to understand their role in secondary particulate matter formation and their impact on public health in the region.

Keywords: Ammonia, Agricultural residue burning, Livestock management

Acknowledgements: IASI is a joint mission of EUMETSAT and the Centre National d'Etudes Spatiales (CNES, France). The authors acknowledge the AERIS data infrastructure for providing access to the IASI data in this study and ULB-LATMOS for the development of the retrieval algorithms. This study was supported by the Scientific and Technological Research Council of Türkiye under the grant number 123Y364.

How to cite: Alban, A. M., Tokgoz, S., Saracoglu, S., and Kaynak, B.: Agricultural sources impact on NH3 and PM levels in the South-Central Anatolia , EGU General Assembly 2025, Vienna, Austria, 27 Apr–2 May 2025, EGU25-17465, https://doi.org/10.5194/egusphere-egu25-17465, 2025.

EGU25-17924 | ECS | Orals | AS3.34

Long-Term NH3 Assesment with Meteorological Parameters to Obtain Temporal Profiles in Agricultural Regions 

Seda Tokgoz, Aykut Mehmet Alban, Serra Saracoglu, and Burcak Kaynak

The impact of climate change on agricultural emissions becomes important, and strongly affects pollutant levels such as NH3 in the atmosphere. Atmospheric NH3 levels and emission rates are very sensitive to meteorology factors such as temperature and precipitation. Being one of the major pollutants emitted from agriculture, NH3 becoming increasingly important, both because it is a pollutant itself and it contributes to the formation of secondary particulate matter. Long-term assessment of IASI NH3 retrievals showed localized consistent hotspots in some regions of Türkiye, often associated with agricultural activities. Although, the reported emission levels do not chance, there was significant temporal variation observed in the NH3 retrievals in those regions.

In this study, twelve years of NH3 retrievals were spatially processed to obtain annual, seasonal and monthly NH3 distribution maps with a 1x1 km2 gridded domain covering whole Türkiye. The results indicated significant temporal variability which also changes according to different regions. The temporal changes of NH3 for three localized hotspots with significant agricultural activity among the highest NH3 levels in Türkiye were selected and evaluated as; Igdir (Cold semi-arid), Izmir (Hot summer Mediterranean) and Samsun (Humid sub-tropical). The selection was performed to identify the different climatic conditions, crop and fertilizer types. Level-2 IASI NH3 retrievals, yearly agricultural statistics, and meteorological measurements were utilized for understanding the changes in NH3 levels. Among these hotspots, Igdir has the highest seasonal variation with maximum late spring to summer, and Samsun is with least seasonal variation. Within the years investigated, 2015, 2018-2019 and 2022-2023 showed highest number of extreme NH3 retrievals. This study aims to provide a new approach to the assessment of agricultural NH3 variability by the long-term assessment to obtain region-specific temporal profiles which the regional air quality models strongly depend on.

Keywords: ammonia, meteorological factors, temporal variation

Acknowledgements: IASI is a joint mission of EUMETSAT and the Centre National d'Etudes Spatiales (CNES, France). The authors acknowledge the AERIS data infrastructure for providing access to the IASI data in this study and ULB-LATMOS for the development of the retrieval algorithms. This study was supported by the Scientific and Technological Research Council of Türkiye under the grant number 123Y364.

How to cite: Tokgoz, S., Alban, A. M., Saracoglu, S., and Kaynak, B.: Long-Term NH3 Assesment with Meteorological Parameters to Obtain Temporal Profiles in Agricultural Regions, EGU General Assembly 2025, Vienna, Austria, 27 Apr–2 May 2025, EGU25-17924, https://doi.org/10.5194/egusphere-egu25-17924, 2025.

EGU25-20286 | ECS | Orals | AS3.34

 The use of open-path FTIR techniques to measure nitrous oxide, ammonia, and methane emissions from a sugarcane farm in Australia 

Pongsathorn Sukdanont, Mei Bai, Shu Kee Lam, Helen Suter, and Deli Chen

Intensive agricultural systems are a main source of greenhouse gas (GHG) emissions. The nitrogen (N) fertilizers that are applied to crops to increase crop productions during growing season can lose approximately half of the applied N to the atmosphere as nitrous oxide (N2O) and ammonia (NH3).This results in growers’ financial losses and can cause environmental pollutions. Quantification of gas emissions not only helps to develop inventories of regional and national emissions but also to improve management practices to mitigate the emissions. However, accurate quantification of the gas emissions at farm scale is challenging as the natural reactive ammonia gas is a “sticky” gas, and N2O has spatialand temporal variability. There is a need of proper techniques to continually measure a suite of gases including N2O and NH3simultaneously to reduce the complexity of using multiple gas sensors for measurements.

A trial was conducted in July 2024 to measure N2O, NH3, and CH4emissions following the fertilizer and fertilizer inhibitor applications at a commercial sugarcane farm in Queensland, Australia. Two separate plots were chosen, one plot was for a control plot with urea fertilizer and the second one was for the treatment plot applying urea and urea inhibitor. At each plot, a slant-path Fourier transform infrared spectrometer (slant-path FTIR) was deployed to measure a suite of gas concentrations for three weeks, including N2O, NH3, and CH4, simultaneously.Thirty-min averaged wind statistics and the coordinates of locations of equipment and experimental plots were collected. These measurements of gas concentration and wind statistics were used to calculate gas fluxes using a micrometeorological technique. The fluxes of N2O, NH3, and CH4from control and treatment plots showed that the effects of inhibitor on reduction of N2O and CH4 emissions were significant over the measurement period but NH3 flux reduction was only triggered by the irrigation event.

How to cite: Sukdanont, P., Bai, M., Kee Lam, S., Suter, H., and Chen, D.:  The use of open-path FTIR techniques to measure nitrous oxide, ammonia, and methane emissions from a sugarcane farm in Australia, EGU General Assembly 2025, Vienna, Austria, 27 Apr–2 May 2025, EGU25-20286, https://doi.org/10.5194/egusphere-egu25-20286, 2025.

EGU25-720 | ECS | Orals | NH1.7

How “leaky” should a leaky dam be? Insights from physical modelling at a white-water rafting course 

Anthony Jones, Julia Knapp, Sim Reaney, and Ian Pattison

Leaky dams, particularly those constructed from large woody material, are increasingly implemented in headwater streams to reduce runoff rates by enhancing channel roughness, slowing flow velocities, and creating temporary water storage during high-flow events to desynchronise flood peaks within catchments. Despite significant progress in modelling the hydraulic and hydrological effects of leaky dams through flume experiments and field studies, design guidance for the construction of leaky dams still needs to be improved. A key challenge in optimising designs is the limited availability of high-resolution pre- and post-intervention data in the field, particularly for extreme flood events, which constrains systematic evaluations of leaky dam performance. Enhanced observational studies are critical to validate the effectiveness of leaky dams and refine design strategies.

This study presents a controlled field experiment conducted at the Tees Barrage International White Water Centre, Stockton, UK, utilising a 300-meter white water rafting course to simulate flow events and evaluate the performance of three leaky dams under a range of flow conditions (up to 8.8 m³/s). Two dam designs were tested: (1) engineered dams constructed from pre-cut commercial timbers with consistent dimensions and (2) natural dams made from locally sourced pine timbers. The "leakiness" of the dams was systematically varied by adjusting timber spacings in increments of 10 mm to 100 mm.

Results demonstrate that both leaky dam designs effectively delayed flood peaks compared to the no-dam scenario. Engineered dams outperformed natural dams, delivering greater flood peak delays with better control of cross-sectional blockage. Smaller timber spacings further enhanced peak delays, with engineered dams achieving a 345-second delay and natural dams a 219-second delay relative to the no-dam scenario. Additionally, the study highlights the likely impact of debris accumulation over time on dam performance.

This research underscores the value of controlled artificial channels for generating precise, repeatable data on leaky dam performance under extreme flow conditions and provides a high-resolution dataset for in-channel hydrodynamic modelling. The findings advocate for further design-focused testing to optimise leaky dam configurations for improved flood mitigation, offering valuable insights for practitioners and researchers.

How to cite: Jones, A., Knapp, J., Reaney, S., and Pattison, I.: How “leaky” should a leaky dam be? Insights from physical modelling at a white-water rafting course, EGU General Assembly 2025, Vienna, Austria, 27 Apr–2 May 2025, EGU25-720, https://doi.org/10.5194/egusphere-egu25-720, 2025.

EGU25-833 | Orals | NH1.7

Assessing the Ecosystem Services of Urban Green Space Based on Vegetation Model: Nature-Based Solution Approach in Delhi, India 

Pallavi Saxena, Ronak Raj Sharma, Saurabh Sonwani, and Anju Srivastava

Urban green spaces, an important component of nature-based solutions play a significant role in maintaining urban ecosystem sustainability by offering some ecosystem services. In this study, high-resolution satellite images were used to acquire the spatial distribution of urban green space, an advanced pre-stratified random sampling method was used to collect the vegetation information of Deer Park (urban green space) located in southern part of Delhi, India and i-TREE Eco vegetation model is used to assess the vegetation structure and ecosystem services like air quality improvement, rainfall interception, carbon storage and sequestration that can be use as an important sustainable tool to mitigate climate change and air pollution in Delhi. The modelling results showed that there were 250 trees with 2.072 acres of tree cover in this area. The most common tree species are Azadirachta indica, Erythrina lysistemon and Cassia fistula and there are 21% of trees which are having diameter less than 15.2 cm. In 2024, all trees in urban green space, Deer Park, could store about 73.96 tons of carbon, sequester about 3.196 tons of gross carbon, remove 30 tonnes of air pollutants/year and avoid 1.528 thousand gallon/year of runoff and oxygen production of 8.522 tons/year. This study outlines an innovative and sustainable method to observe the advantage of urban green space in Delhi by taking the Deer Park as one of the site with various ecosystem services to better understand their roles in regulating urban environment. This nature-based solution approach could help urban planners and policymakers to adopt this urban green space structure approach in Delhi which will further help in mitigating climate change mitigation, air pollution mitigation and maximize ecosystem services provision.

How to cite: Saxena, P., Sharma, R. R., Sonwani, S., and Srivastava, A.: Assessing the Ecosystem Services of Urban Green Space Based on Vegetation Model: Nature-Based Solution Approach in Delhi, India, EGU General Assembly 2025, Vienna, Austria, 27 Apr–2 May 2025, EGU25-833, https://doi.org/10.5194/egusphere-egu25-833, 2025.

The increasing prevalence of impervious surfaces coupled with intense rainfall has exacerbated urban waterlogging, nonpoint source pollution, and ecosystem degradation. Nature-based solutions (NbS) have emerged as effective strategies for urban stormwater management. This study proposes a four-objective simulation-optimization framework, integrating the Stormwater Management Model (SWMM) with the NSGA-II algorithm, to optimize NBS layouts while accounting for ecosystem service value (ESV). Six NbS scenarios were evaluated in a case study in Beijing, China. Results indicated that rain garden scenarios outperformed others in maximizing ESV, particularly through enhanced net carbon sequestration. Sensitivity analysis revealed that pollution control rate exhibited greater variability than runoff reduction rate, and achieving simultaneous improvements in these metrics often incurred higher costs and reduced ESV. The optimal solution achieved a 51.95% runoff reduction rate, 87.35% pollution control rate, an ESV of 2.78 × 10⁵ CNY, and a cost of 40.14 × 10⁶ CNY. This framework provides a robust reference for harmonizing cost-efficiency, water quality and quantity control, and ecosystem service enhancement in urban stormwater management.

How to cite: Fang, D.: Multi-Objective Optimization of Nature-Based Solution Layouts for Enhanced Ecosystem Services, EGU General Assembly 2025, Vienna, Austria, 27 Apr–2 May 2025, EGU25-913, https://doi.org/10.5194/egusphere-egu25-913, 2025.

EGU25-1168 | Posters on site | NH1.7

Assessing Nature-Based Solutions using the HEC-RAS modelling system: a review  

Ramtin Sabeti, Thomas Rodding Kjeldsen, Matt Chambers, Hamed Moftakhari, Ioanna Stamataki, and Solomon Simmonds

Nature-based solutions (NBS) have gained increasing attention in flood management since the early 2000s as sustainable alternatives or complements to conventional flood defence strategies. Based on a systematic review of 1,080 published studies, we provide recommendations for implementing common NBS intervention types in flood management using the HEC-RAS modelling framework. The review considered published case studies ranging from small catchments of approximately 0.09 km² to large river basins exceeding 2,400 km².

The potential interventions explored include reforestation/afforestation, floodplain reconnection, wetland restoration, channel re-meandering, and the hybridization or removal of grey infrastructure. The recommendations detail how to adjust key parameters within HEC-RAS to effectively represent these interventions. For instance, increasing Manning's roughness coefficients can simulate the added vegetative roughness from reforestation. Likewise, modifying the digital elevation model allows for the representation of floodplain reconnection, benching, or channel modifications. By offering quantifiable methods and a clear linkage between interventions and hydraulic parameters, this work equips practitioners and researchers with the necessary tools to model flood mitigation strategies using NBS within HEC-RAS. To generalise the findings beyond HEC-RAS and make them applicable to other hydraulic modelling platforms, each intervention is linked to specific terms in the governing equations: conservation of mass and momentum equations, highlighting how parameters such as friction slope are affected.

How to cite: Sabeti, R., Rodding Kjeldsen, T., Chambers, M., Moftakhari, H., Stamataki, I., and Simmonds, S.: Assessing Nature-Based Solutions using the HEC-RAS modelling system: a review , EGU General Assembly 2025, Vienna, Austria, 27 Apr–2 May 2025, EGU25-1168, https://doi.org/10.5194/egusphere-egu25-1168, 2025.

EGU25-1420 | ECS | Orals | NH1.7

Nature-based solutions for coastal ecological restoration during rapid urbanization process under strategic planing and policy support: Case study of Chaoyang Port Coast, Weihai City, China 

Shasha Liu, Feng Cai, Michael Wagreich, Nelson Rangel-Buitrago, Yongzhi Peng, Tianyu Zhang, and Pengkai Wang

In Anthropocene, human activities have caused a lasting, substantial and often irreversible changes to the earth system. Coastal erosion and inundation are natural hazards that threaten the safety of humans’ properties and lives. Adaptive actions to combat coastal erosion generally rely on single method of Nature-based solutions (Nbs)—hard structures, soft engineering, or vegetation. However, instances of multiple Nbs being employed together are seldom studied, particularly in morphologically complex coasts. This paper briefly reviews the current governmental policy context in China (at national, provincial and urban levels) for climate adaptation in coastal zones and presents a local implementation process involving multiple Nbs applications at Chaoyang Port Coast in Weihai city. The analysis reveals that integrated policies and city orientation drive the coastline protection and necessitate the adoption of nature-based solutions. It also demonstrates that integrated management measures (including beach remediation, gabion seawalls, and coastal shelter belts) can create a relatively stronger ecological disaster risk reduction system in morphologically complex coastal regions. Furthermore, the paper discusses the impacts of strategic planning and policies on coastal environment, technical advancements for coastal protection, and future challenge for sustainable development. Recommendations for ensuring the success of long-term coastal environment recovery include sustained political support, active public participation in local economic growth, and the advancement of Nbs technologies. Through insights from coastal management policies and nature-based solutions, our study not only highlights China’s commitment to environment governance but also provides a practical paradigm for shoreline management applicableto coastal cities in China and other coastal nations worldwide.

How to cite: Liu, S., Cai, F., Wagreich, M., Rangel-Buitrago, N., Peng, Y., Zhang, T., and Wang, P.: Nature-based solutions for coastal ecological restoration during rapid urbanization process under strategic planing and policy support: Case study of Chaoyang Port Coast, Weihai City, China, EGU General Assembly 2025, Vienna, Austria, 27 Apr–2 May 2025, EGU25-1420, https://doi.org/10.5194/egusphere-egu25-1420, 2025.

EGU25-1422 | ECS | Posters on site | NH1.7

Gazelle Valley Park – A case study of a dual urban nature-based solution for flood mitigation in a Mediterranean climate 

Yoav Ben Dor, Galit Sharabi, Sabri Alian, Raz Nussbaum, Efrat Morin, Elyasaf Freiman, Amanda Lind, Inbal Shemesh, Amir Balaban, Faygle Train, and Elad Levintal

Due to increasing flood risks related to climate change and urbanization, solutions addressing environmental challenges must be more effectively integrated into urban environments. Green spaces and blue-green infrastructure, which combine water, vegetation, and recreational areas, can contribute to both flood risk mitigation while addressing the urban heat island effect, ultimately enhancing the quality of life in cities. These facilities also promote biodiversity and ecological resilience, supporting stable ecosystems while providing green and open recreational spaces even in the heart of bustling urban areas. The Gazelle Valley Urban Nature Park, located in the densely populated metropolitan area of Jerusalem, Israel’s capital, serves as a prime example of such efforts. The establishment of this park is considered a groundbreaking social and environmental achievement, made possible by the struggle of residents, local activists, social organizations, and the Society for the Protection of Nature in Israel. Built to the highest ecological design standards, the park has quickly become a popular destination for both residents and visitors, offering a model for integrating eco-hydrological solutions into urban landscapes. As part of an ongoing study, water inflow and its quality within the park’s water system are monitored. The park’s water system, which is fed by stormwater during the wet season (winter) and treated wastewater during the dry season (summer), is tracked through online monitoring using a low-cost open-hardware station. When combined with sampling and laboratory analyses, online measurement helps assess water composition and water quality dynamics in order to evaluate the impact of an urban nature-based solution on water quality. This study also tests the applicability of low-cost open-hardware technology for environmental monitoring in aquatic ecosystems, while examining the effectiveness of nature-based solutions in improving the water quality of stormwater and treated wastewater in urban settings.

How to cite: Ben Dor, Y., Sharabi, G., Alian, S., Nussbaum, R., Morin, E., Freiman, E., Lind, A., Shemesh, I., Balaban, A., Train, F., and Levintal, E.: Gazelle Valley Park – A case study of a dual urban nature-based solution for flood mitigation in a Mediterranean climate, EGU General Assembly 2025, Vienna, Austria, 27 Apr–2 May 2025, EGU25-1422, https://doi.org/10.5194/egusphere-egu25-1422, 2025.

EGU25-2521 | Posters on site | NH1.7

The feasibility studies of mitigation measures for landslides located above the Koroška Bela settlement in Northwest Slovenia 

Mateja Jemec Auflič, Tina Peternel, Yusuf Oluwasegun Ogunfolaji  , and Nejc Bezak

This study represents the feasibility study on landslide mitigation measures above the settlement of Koroška Bela in northwestern Slovenia. The settlement of Koroška Bela is very densely populated (about 2,100 inhabitants) and has a well-developed industry and infrastructure. The area above Koroška Bela has been recognized as one of the most active landslide-prone areas in Slovenia. It attracts attention due to historical evidence of past debris flows in recent geological history. The first recorded event occurred in the 18th century and caused the partial or complete destruction of more than 40 buildings and devastated cultivated areas in the village of Koroška Bela. In recent decades, two more events have occurred: In April 2017, part of the Čikla landslide turned into a debris flow, and in August 2023, the reactivation of the Urbas landslide led to the disruption of alarm systems and the triggering of emergency sirens. Each event was associated with prolonged and intense rainfall.

To reduce the landslide risk in Koroška Bela, a comprehensive engineering, geological and hydrogeological characterization of landslide-prone areas was required to prepare feasibility studies for mitigation and remediation strategies. So far, no specific remediation measures have been implemented, as the existing check dams do not have the necessary capacity to effectively manage sediment and debris flows.

Our findings highlight the need for holistic mitigation measures in order to protect residents and infrastructure. Key areas include stabilizing the Čikla and Urbas landslides and controlling sediment transport in the associated torrent systems. Given the complexity of these landslides, we propose a combination of traditional gray engineering (structural) measures alongside with hybrid solutions that integrate both gray and green elements. For debris- flow management, gray measures such as debris- flow barriers and flexible barriers are essential. To stabilize landslide-prone areas, hybrid solutions combining torrent channel works, drainage systems, and vegetative stabilization should be implemented.

As these landslides are situated in mountainous areas designated as Natura 2000 protected area, mitigation measures should incorporate green design principles that support both visual integration and ecological functions.

Acknowledgments: This research was funded by Slovenian Research And Innovation Agency through research project “J6-4628 - Evaluation of hazard-mitigating hybrid infrastructure under climate change scenarios” and research program “P1-0419 - Dynamic Earth”. Additional financial support was provided by the Ministry of Environment and Spatial Planning, and the Municipality of Jesenice.


How to cite: Jemec Auflič, M., Peternel, T., Oluwasegun Ogunfolaji  , Y., and Bezak, N.: The feasibility studies of mitigation measures for landslides located above the Koroška Bela settlement in Northwest Slovenia, EGU General Assembly 2025, Vienna, Austria, 27 Apr–2 May 2025, EGU25-2521, https://doi.org/10.5194/egusphere-egu25-2521, 2025.

EGU25-3855 | ECS | Posters on site | NH1.7

Nature-based solutions for attenuating hydrometeorological hazards in coastal regions: Effectiveness and quantification approaches 

Mohammed Sarfaraz Gani Adnan, Abiy S. Kebede, Kwasi Appeaning Addo, Ashraf Dewan, Tuhin Ghosh, Christopher J. White, and Philip J. Ward

Deltaic coasts, with their fertile soils and diverse ecosystems, are critical for agriculture, trade, fisheries, energy supply, and manufacturing. However, these regions are highly susceptible to hydrometeorological hazards, including storms, flooding, and extreme temperature events. Anthropogenic climate change has exacerbated the frequency and intensity of such hazards, posing significant societal and environmental challenges. While traditional hard engineering structures (e.g., levees, dykes, sea walls) have been the primary approach to coastal protection, these solutions often increase hazard complexity and risks while requiring substantial financial investments. In contrast, nature-based solutions (NbS) have emerged as cost-effective and sustainable alternatives or complements to traditional engineering approaches, demonstrating their potential to mitigate and adapt to coastal hydrometeorological hazards.
Quantifying the effectiveness and potential of NbS in attenuating hydrometeorological hazards in coastal regions remains challenging due to the complexity in spatiotemporal dynamics of hazards and variations in assessment methods (e.g., qualitative, quantitative, or mixed). Despite numerous studies on NbS in coastal and deltaic contexts, there is a lack of comprehensive evaluations addressing the types of NbS, their geographical applications, methodological robustness, and confidence in their effectiveness in addressing hydrometeorological hazards. This study bridges these gaps by systematically reviewing 330 peer-reviewed English-language articles published between 2008 and 2024, identified using the Preferred Reporting Items for Systematic Reviews and Meta-Analyses (PRISMA) protocol. The review focuses on five key hydrometeorological hazards in coastal and deltaic regions globally: storms, floods, extreme temperatures, extreme precipitation, and droughts. NbS are evaluated as substitutes, complements, or safeguards to hard engineering structures, considering both real-world and hypothetical case studies. A comprehensive framework, adapted from the Intergovernmental Panel on Climate Change (IPCC), is employed to evaluate NbS based on three criteria: (1) robustness of evidence (e.g., mechanistic understanding, model validation), (2) the level of agreement (e.g., consistency of findings supporting NbS effectiveness), and (3) confidence (integrating robustness and agreement). 
The findings provide key typologies of NbS applications across different hydrometeorological hazards, with a predominant focus on storms and floods, while extreme temperatures and droughts receive comparatively less attention. Most studies evaluate the effectiveness of NbS options such as mangroves, coastal wetlands, dunes, and coral reefs in safeguarding coastal areas from hydrometeorological threats, often drawing insights from real-world case studies. Studies on floods and storms frequently employ numerical or hydrodynamic modelling, using indicators such as flood depth, extent, velocity, wave height, and wave energy. These studies consistently demonstrate high confidence in the effectiveness of NbS in attenuating storm and flood hazards in coastal and deltaic regions, attributed to their robust methodologies and consistent findings. 
The study highlights the effectiveness of NbS in mitigating coastal hydrometeorological hazards varies geographically, influenced by local factors such as geomorphology, hydrology, and human activities. Numerical or hydrodynamic modelling, supplemented by cost-benefit analyses and validated with observational data, is recommended for robust quantification of NbS benefits and trade-offs. These findings provide a foundation for future research and offer actionable insights for policymakers and practitioners, facilitating the integration of NbS into coastal hazard management as viable substitutes or complements to hard engineering measures.

How to cite: Adnan, M. S. G., Kebede, A. S., Addo, K. A., Dewan, A., Ghosh, T., White, C. J., and Ward, P. J.: Nature-based solutions for attenuating hydrometeorological hazards in coastal regions: Effectiveness and quantification approaches, EGU General Assembly 2025, Vienna, Austria, 27 Apr–2 May 2025, EGU25-3855, https://doi.org/10.5194/egusphere-egu25-3855, 2025.

EGU25-4245 | ECS | Posters on site | NH1.7

Using remote sensing to parameterise a leaky barrier hydraulic unit   

Hannah Champion, Elizabeth Follett, Barry Hankin, and Mike Hopkins

A canopy-resistance based debris factor, CA (Follett et al., 2020), can be used to model the head-loss from flows passing through and over a leaky barrier. The advantage over a Mannings coefficient typically used in hydraulic modelling is the debris factor is a direct construct from physical factors characterising the bulk properties of the woody debris, including frontal area and bulk density. The debris factor has been established to be a robust predictor of head-loss across a range of flows. The aim here has been to quantify CA from remotely sensed data based on photogrammetric techniques estimating the required physical characteristics. To do this we have worked with a leading specialist UK surveyor, Storm Geomatics, who surveyed two small watercourses (Nethercote and Paddle brook) near Shipston-on-Stour, England.    

A HEC-RAS 2D-only hydraulic model driven by design rainfall has been setup with 37 features in Nethercote Brook. The debris factor was first estimated based on photographic lookup and then refined to be based on analysis of photogrammetric data. For each unit a rating equation is generated given the estimate of CA which governs the head losses. The intention is that this process will become automated, such that a hydraulic unit for the leaky barrier can be generated automatically.  

An equivalent reach-scale Mannings roughness (see Follett and Hankin, 2022) is also considered with a view to using in other catchments more easily based on the type of modelling typically undertaken. In a further UK case study, in the intensively monitored Eddleston Water catchment, the reach-scale roughness approach was also tested for leaky barriers in Middle Burn, applying a Mannings uplift based off photographs taken of the leaky barrier construction. Here CA is estimated and the equations to convert to a reach-scale equivalent Mannings is used.  

As 3d point-cloud data from photogrammetry becomes more widely available, the intention is to make it easier to quantify CA and use the canopy resistance-based equations to generate a hydraulic unit for use in e.g. HEC-RAS 2D directly. This will help quantify the effectiveness of a range of nature-based solutions from large wood to woody debris barriers to slow the flow.  

Follett, E., Schalko, I., & Nepf, H. 2020. Momentum and energy predict the backwater rise generated by a large wood jam. Geophysical Research Letters, 47, e2020GL089346. https://doi.org/ 10.1029/2020GL089346 

Follett, E., Hankin, B., 2022. Investigation of effect of logjam series for varying channel and barrier physical properties using a sparse input data 1D network model. Environmental Modelling & Software, Volume 158, 2022, 105543, ISSN 1364-8152, https://doi.org/10.1016/j.envsoft.2022.105543 

Hankin, B., Hewitt, I., Sander, G., Danieli, F., Formetta, G., Kamilova, A., Kretzschmar, A., Kiradjiev, K., Wong, C., Pegler, S., and Lamb, R. 2020: A risk-based, network analysis of distributed in-stream leaky barriers for flood risk management. Nat. Hazards Earth Syst. Sci., 20, 2567–2584, 2020 https://doi.org/10.5194/nhess-20-2567-2020 . 

How to cite: Champion, H., Follett, E., Hankin, B., and Hopkins, M.: Using remote sensing to parameterise a leaky barrier hydraulic unit  , EGU General Assembly 2025, Vienna, Austria, 27 Apr–2 May 2025, EGU25-4245, https://doi.org/10.5194/egusphere-egu25-4245, 2025.

EGU25-4972 | Orals | NH1.7 | Highlight

An Integrated Catchment-Scale Approach to Urban River WaterQuality Using Constructed Wetlands 

Ana Mijic, Fangjun Peng, Saumya Srivastava, Barnaby Dobson, and Leyang Liu

Urban catchments include land, groundwater, sewer, river, and other water components. Together, these elements form a complex, integrated urban water system. Managing river water quality in such systems is particularly challenging due to built (grey) infrastructure, which increases pollutant impact through impervious surfaces and increases stormwater runoff, limiting natural filtration processes. In response, many cities have begun to adopt constructed wetlands (CWs) as natural (blue-green) infrastructure to improve river water quality at the catchment scale. Despite their growing use, several challenges persist, including how to quantify the impact of CWs on river water quality, optimise the design of multiple wetlands, and apply these insights to catchment[1]wide planning. This study addresses these challenges by introducing an integrated planning and design framework for CWs aimed at improving water quality across urban catchments. Specifically, the framework focuses on (1) assessing pollutant removal by CWs, (2) designing CWs locally, and (3) integrating CWs into larger catchment plans.

To develop and test this approach, we first created a CW module within the Water Systems Integrated Modelling (WSIMOD) framework, enabling the simulation of interactions between CWs and other water components in urban catchments. We then applied this module to the Pymmes and Salmon Brook catchments in the UK to evaluate river water quality before and after constructing CWs. Next, we used the model to explore various design variables (e.g., area, size, configuration) for placing new CWs within each sub-catchment, quantifying their effectiveness in improving river water quality. Finally, we propose a guiding principle for CW planning based on these findings, illustrating how different spatial layouts affect the achievement of nitrogen and phosphorus targets within sub-catchments.

How to cite: Mijic, A., Peng, F., Srivastava, S., Dobson, B., and Liu, L.: An Integrated Catchment-Scale Approach to Urban River WaterQuality Using Constructed Wetlands, EGU General Assembly 2025, Vienna, Austria, 27 Apr–2 May 2025, EGU25-4972, https://doi.org/10.5194/egusphere-egu25-4972, 2025.

EGU25-5705 | ECS | Orals | NH1.7

Modelling the effect of a vegetated mid-channel bar on large wood accumulation at bridge piers 

Elisabetta Persi, Wafae Ennouini, Dana Karimikordestani, Diego Ravazzolo, Gabriella Petaccia, and Stefano Sibilla

Wood is a key-component of river ecosystems, but it is also regarded as a detrimental element that may increase the hydraulic risk. For example, large accumulations of wood and fine vegetation at bridge piers can reduce the bridge span and generate afflux, potentially extending flooded areas. Such vegetation is generally transported during floods, originating from landslides, debris-flow and bank erosion. Additionally, river re-naturalization and nature-based solutions like large wood addition or the building of vegetation patches, may inadvertently contribute to wood transport. Therefore, both natural events and human interventions can increase the amount of transported wood, potentially increasing associated hydraulic risks.

While several studies have addressed the risks related to wood accumulation at bridge piers, significantly less attention has been given to wood accumulation processes at natural structures, like vegetated bars. Similarly to bridge piers, stable vegetated islands can trap wood, fostering its accumulation, reducing or delaying its mobility and protecting the downstream areas.

The present contribution analyses the influence of a mid-channel vegetated bar on large wood transport in the Adda River (Italy) employing the two-dimensional hydrodynamic numerical model ORSA2D_WT, which includes large wood transport dynamics. The vegetated island is located just upstream of a four-pier bridge. Its effect in terms of trajectory deviation, accumulation at the bar, and wood-pier interaction is analyzed by simulating different scenarios of flow, and large wood abundance and positioning.

The results highlight that the presence of stable non-erodible vegetation on a bar upstream of the bridge reduces the interaction between the wood and the piers, thus reducing the probability of accumulation. In addition, the ORSA2D_WT model aids in identifying which piers are most subject to impacts from transported wood, thus facilitating maintenance strategies. The proposed approach could be applied to other natural or human structures, to assess their efficacy in sheltering downstream critical sections from wood accumulation.

How to cite: Persi, E., Ennouini, W., Karimikordestani, D., Ravazzolo, D., Petaccia, G., and Sibilla, S.: Modelling the effect of a vegetated mid-channel bar on large wood accumulation at bridge piers, EGU General Assembly 2025, Vienna, Austria, 27 Apr–2 May 2025, EGU25-5705, https://doi.org/10.5194/egusphere-egu25-5705, 2025.

EGU25-6088 | Posters on site | NH1.7

Evaluating the Effects of Different Adaptation Strategies to Climate and Land Use Change upon Water Fluxes in the Ave Watershed, Portugal 

Morteza Zargar, Zryab Babker, Tim G. Reichenau, and Karl Schneider

The increasing variability and extremes of hydrological cycles driven by climate change present critical challenges to water resource availability, raising the likelihood of floods and droughts. Understanding the potential impacts of changing climate patterns on future water resources is essential for developing effective adaptation strategies. Within the framework of the DISTENDER project (EU Horizon-ID 101056836), we focus on assessing the resilience of European watersheds to climate stressors by modeling future water scenarios and identifying sustainable water management practices.

This research comprehensively examines the impact of climate and future land use changes on extreme events in Ave Watershed in Northern Portugal using the MIKE SHE hydrological model. Future climate change projections (2021 to 2050) and Shared Socioeconomic Pathways (SSPs) were obtained from CMIP6 and were statistically downscaled. Annual 1-day and 3-day high runoff were used as a proxy for the extreme high runoff characteristics. We then evaluate three adaptive strategies for those impacts:

  • Nature-based solutions: Restoring wetlands identified in the "Extended Wetland Ecosystem data," implementing sustainable agricultural practices, and adopting low-impact development methods like green and sponge cities.
  • Technical solutions: Introducing new reservoirs in sub-watersheds lacking reservoirs to simulate cumulative effects of rainwater retention, check dams, or other storage infrastructures.
  • Hybrid approach: Combining nature-based and technical solutions to maximize the benefits of water resources management.

The climate effects show an increase in the future 1-day and 3-day flood magnitudes across all gauges and return periods. The 100-year 1-day flood in Ave River is projected to range between 496 m³/s (33% increase in SSP 3-7.0) and 721 m³/s (94% in SSP 5-8.5), compared to 372 m³/s during the reference period (1980-2020). Future land use maps for 2020–2050 were generated using the CORINE land cover and the iCLUE model based on different SSPs. Incorporating these maps into the hydrological model shows further intensification of extreme events. For instance, using the 2050 land use map, the 100-year 1-day flood is expected to range 664 m³/s (77% in SSP 3-7.0) and 866 m³/s (133 % in SSP 5-8.5) compared to the reference period. Simulations of the adaptation strategies show that nature-based solutions can reduce flood peaks by 22–32%, while technical solutions achieve 20–46% reductions, depending on the SSP. The hybrid approach demonstrates the most efficient adaptation solution, reducing flood peaks by 37–67%. For SSPs 2-4.5 and SSP 3-7.0, the hybrid approach brings flood peaks close to those observed during the reference period.

By analyzing these strategies individually and collectively, the study identifies the hybrid approach as the most effective for enhancing resilience to extreme events and ensuring the sustainability of water resources. Efficacy analyses of adaptation options are essential to guide a stakeholder dialog and facilitate the necessary transformation. DISTENDER provides a methodological framework to identify and develop climate adaptation and mitigation strategies by integrating these results into a decision-support system.

Keywords: Adaptation strategies, Climate change, Land use, CMIP6 Climate Model, MIKE SHE, Ave catchment

How to cite: Zargar, M., Babker, Z., Reichenau, T. G., and Schneider, K.: Evaluating the Effects of Different Adaptation Strategies to Climate and Land Use Change upon Water Fluxes in the Ave Watershed, Portugal, EGU General Assembly 2025, Vienna, Austria, 27 Apr–2 May 2025, EGU25-6088, https://doi.org/10.5194/egusphere-egu25-6088, 2025.

Flooding is one of the great issues of our time and is the most damaging environmental hazard globally, costing over €40 billion a year in Europe alone. Solving the problem is a huge challenge. Climate change, resulting in wetter winters and more intense summer storms, is aggravating flooding. Meanwhile, demand for land to feed and house growing populations leads to increasing concentrations of people and assets in areas exposed to flooding, and ongoing land use change continues to increase the severity and frequency of flooding.

Traditionally flooding has been managed primarily through large, engineered structures, but these structures are costly to install and maintain, and often provide flood reduction benefits to the detriment of the environment, e.g., having a negative effect on wildlife and biodiversity. These consideration have, in recent years, driven a move away from such structures to multiple small-scale nature-based interventions distributed across the landscape, an example of which is the leaky barrier (LB). LBs can be used to mitigate flood risk and provide other benefits such as reducing diffuse pollution. Yet, LBs are poorly understood.

At present, there is no accepted way of representing LBs in models, although there have been attempts to put multiple LBs into hydraulic models of catchment systems. Modelling approaches include using high values of Manning’s n to represent LBs; modelling them as reductions in cross-sectional area; using combined weir/sluice gate equations; and using an equivalent ‘outlet pipe diameter’, defined by the amount of flow able to flow under, through or around the barrier as a parameter to represent leakiness. These models provide useful clues as to how combinations of features may behave in aggregate, but it is far from clear what sort of LBs they represent and there is high uncertainty associated with the results obtained.

The research discussed here combines physical and mathematical modelling to improve understanding of LB behaviour. Hydraulic flume experiments are conducted which model a range of naturally occurring and constructed LBs, including upright obstructions as a model of growing vegetation and horizontal obstructions as an analogue of log jams, woody debris barriers and beaver dams, all of which often form horizontal, or nearly horizontal, obstructions to the flow. Experiments show that barrier design has a big impact on the hydraulics. It is shown that some existing approaches, such as using an equivalent ‘outlet pipe diameter’ or a high Manning’s n were not able to capture the observed behaviour. This raises a series of questions about the sensitivity of hydraulic behaviour to various design parameters and what is required to model LBs adequately.

Data from the simplest design: the single horizontal barrier, was used to inform a finite volume model of the flume and LB. The combined weir/sluice gate equations are shown to provide a good model of a single horizontal barrier. However, the behaviour of the other LB designs is significantly different and cannot be represented adequately using this model.

How to cite: Hewett, C.: Unravelling the hydraulics of leaky barriers: physical and mathematical modelling, EGU General Assembly 2025, Vienna, Austria, 27 Apr–2 May 2025, EGU25-6152, https://doi.org/10.5194/egusphere-egu25-6152, 2025.

EGU25-6721 | ECS | Orals | NH1.7

Experimental insights into the abrasion of large wood in rivers 

Jiangtao Yang, Frank Seidel, and Mário J. Franca

When transported in rivers, large wood interacts with one another and with flow, sediment, and river boundaries, leading to their physical degradation. This degradation, causing mass of loss and changing of the geometry of the wood, is relevant to various fluvial processes, including bed morphology evolution, aquatic habitat variation, changes to the local environment, and the carbon cycle. The physical degradation of large wood can be categorized into two main types processes, based on wood types and the characteristics of the wood physical motion: abrasion and debranching. Field observations suggest that abrasion primarily occurs through collision and shearing during transport, affecting large trunks as well as fragmented branches. In contrast, debranching results from the rotation of large woods and collisions with the riverbed, with the extent of this process closely tied to the wood's structural properties.

Previous studies have largely focused on large wood transport, the formation of logjams, and the bio-chemical degradation of smaller wood components (such as sticks and leaves) within aquatic habitats. While these studies have deepened our understanding of wood characteristics and their interactions with the environment, physical wood degradation during transport remains underexplored. This degradation affects wood transportation, logjam formation and failure, and aquatic habitats. Therefore, a more detailed understanding of the physical degradation process is crucial for advancing research on large woods in rivers.

Here we introduce a laboratory-based tumbling machine experiment to investigate the abrasion process of large woods during river transport. Preliminary tests examine the relationship between wood abrasion and the potential energy of water flow. Wood samples, with diameters of 10–15 cm and a diameter-to-length ratio of 0.5, were selected from various tree species. Experiments were conducted under different water depths and flow velocities. Our methodology includes measuring the basic physical properties of the wood samples, using motion sensors, and combining 3D printed sensors to monitor their movement characteristics. Additionally, Surface from Motion (SfM) is employed to capture changes in the wood samples' Digital Elevation Models (DEMs) before and after the experiments, enabling precise quantification of degradation volume and patterns.

Preliminary results will be discussed considering the level of observed wood abrasion, size alterations, and debarking of the wood surfaces. Specifically, the influence of water depth and relative flow velocity on wood abrasion will be discussed. Wood abrasion will be quantified using specific indicators, allowing us to define distinct degradation patterns and their mechanisms. The potential findings will highlight the connection between river flow energy and physical wood abrasion, offering preliminary insights into the mechanisms underlying wood abrasion in rivers. 

Keywords: Large wood; wood abrasion; debarking process; experimental design; wood abrasion pattern

How to cite: Yang, J., Seidel, F., and Franca, M. J.: Experimental insights into the abrasion of large wood in rivers, EGU General Assembly 2025, Vienna, Austria, 27 Apr–2 May 2025, EGU25-6721, https://doi.org/10.5194/egusphere-egu25-6721, 2025.

EGU25-6733 | ECS | Orals | NH1.7

A Framework for Evaluating the Long-Term Efficiency of Coastal Nature-Based Solutions: Assessing Surface and Subsurface Processes 

Valentina Uribe Jaramillo, Arjen Luijendijk, and Perry de Louw

Nature-based Solutions (NbS) are widely known as effective strategies for enhancing coastal resilience to climate change. However, assessing their long-term efficiency remains challenging due to the complex interacting processes within coastal systems and the uncertainties associated with future climate scenarios.

Many existing frameworks for evaluating coastal NbS focus on single-domain systems, often simplifying key processes to reduce the complexity of modeling. However, coastal systems are inherently complex and include not only surface processes but also the subsurface groundwater domain. Therefore, to successfully integrate NbS into landscape planning and study their long-term efficiency, it is essential to understand the entire system, and to quantify the relevant interactions between surface and groundwater processes and their influence over the system’s resilience.  

This research introduces a framework to evaluate the long-term efficiency of coastal NbS by identifying key surface and subsurface (groundwater) processes and trade-offs and synergies within the system. The framework is designed for application in coastal systems characterized by sandy beaches and sedimentary aquifers and its applicability is demonstrated through a case study on the island of Terschelling. For the case study, two NbS are evaluated: (1) a beach nourishment from 1993 and (2) the potential implementation of Managed Artificial Recharge (MAR). The long-term efficiency and resilience to climate change of these solutions are quantified using ecosystem, geomorphological, and hydrological indicators through numerical modelling (using Delft3D and Modflow) and scenario-based analysis.

Additionally, the study highlights the importance of understanding how NbS may require time to enhance the system’s resilience or lead to unexpected impacts under future climate conditions. Providing a better overview of trade-offs and synergies can reduce the uncertainty related to the long-term component, facilitating the uptake of NbS as a sustainable coastal management solution.

How to cite: Uribe Jaramillo, V., Luijendijk, A., and de Louw, P.: A Framework for Evaluating the Long-Term Efficiency of Coastal Nature-Based Solutions: Assessing Surface and Subsurface Processes, EGU General Assembly 2025, Vienna, Austria, 27 Apr–2 May 2025, EGU25-6733, https://doi.org/10.5194/egusphere-egu25-6733, 2025.

EGU25-9562 | ECS | Orals | NH1.7

Evolution and evaluation of Stormwater Parks in Sweden 

Sofia Hallerbäck, Erik Persson Pavlovic, Cecilia Alfredsson, and Magnus Johansson

This study addresses the challenge of balancing ecosystem needs with rapid urban expansion by evaluating the relatively new phenomenon in Sweden of Stormwater Parks. These blue-green infrastructure parks are proposed as solutions for flooding and water pollution by enhancing ecosystem services and creating green recreational spaces. However, it is crucial to assess the potential and pitfalls of any new type of infrastructure, as well as to evaluate the effects from a multispecies justice perspective. This study presents a novel mixed methods approach to critically assess the multifunctionality of green infrastructure and nature-based solutions. The methods include data collection from implemented Stormwater Parks across Sweden, analysis of past and present aerial photos, field visits, and policy analysis. The study demonstrates the potential of using Carole Bacchi’s “What’s the problem represented to be?” approach to deconstruct nature-based solutions. The findings from the review highlight the importance of problematizing which issues and whose challenges a nature-based solution overlook or address.

How to cite: Hallerbäck, S., Persson Pavlovic, E., Alfredsson, C., and Johansson, M.: Evolution and evaluation of Stormwater Parks in Sweden, EGU General Assembly 2025, Vienna, Austria, 27 Apr–2 May 2025, EGU25-9562, https://doi.org/10.5194/egusphere-egu25-9562, 2025.

EGU25-10713 | ECS | Posters on site | NH1.7

A symbolic regression approach to illuminate the water-energy-food-ecosystem interlinkages in a rainwater harvesting system 

Kyriakos Kandris, Nikolaos Markatos, Chrysanthi Elisabeth Nika, and Evina Katsou

Nature-based solutions (NBS) are increasingly considered as components of strategies aiming to address climate-related challenges, since their impact expands across more than one aspect of the water, energy, food, and ecosystems (WEFE) nexus. Therefore, searching for tangible evidence on the impact of NBS requires addressing the complexities of the WEFE nexus, which is characterized by dynamic and highly nonlinear relationships. These complexities may challenge traditional modeling approaches, which would rely heavily on human intuition and the cumbersome integration of individual sub-models.

Driven by the continuous improvement of monitoring capabilities, the increase of computational power, and the emergence of efficient algorithms, data-oriented solutions gather momentum in the efforts to identify dynamic systems in a multitude of domains. Nonetheless, such solutions are rarely adopted by the nexus community.

In this work we aim to investigate the potential of data-driven approaches to identify the underlying dynamics of systems that exhibit properties commonly encountered in many WEFE nexus systems, such as nonlinearity, high dimensionality and non-stationarity (e.g., the exposure to extreme events).

To unravel these complexities, we employed a symbolic regression (SR) approach within a case study of a rainwater harvesting system operating in Mykonos, Greece. This system is designed to collect, treat, and store rainwater for agricultural reuse. A sub-surface collection system captures rainwater, diverting it into two storage tanks. The collected water irrigates an agricultural field using precision irrigation, optimizing water usage and minimizing waste. The system integrates components of the WEFE nexus, enhancing water security through rainwater collection and treatment, promoting energy security by reducing reliance on groundwater abstraction, improving soil quality, and enhancing food security through sustainable agricultural practices.

A one-year long dataset was generated from a set of individual process-based sub-models that simulate diverse components of the nexus, including (a) the system’s water balances (comprising infiltration, surface runoff and evapotranspiration), (b) water quality dynamics in the storage tanks, (c) energy consumption, and (d) plant growth dynamics, based on the estimated water stress and nutrient limitations that affect growth and yield. To mimic real-world conditions, we introduced random noise and incorporated missingness, simulating the variability and incompleteness of observational data. SR was applied to the dataset, aiming to inversely estimate the equations that describe the functional behavior of the NBS. SR employs a multi-population evolutionary algorithm, which navigates within the space of analytic expressions in search of accurate and parsimonious models.

The results unveiled parsimonious expressions that captured the dynamics of the system across different external hydrometeorological forcings with reasonable accuracy. These equations provided interpretable insights into the mechanisms underpinning this rainwater harvesting system, resonating, at the same time, with existing scientific understanding. This approach is an example of the potential of data-driven methodologies to enhance the understanding of NBS and their capacity to address multifaceted challenges. Even if a globally valid analytical expression for such systems is probably infeasible, this work managed to set-up a data-driven methodology for deciphering the WEFE nexus at a local scale, providing also a tool for optimizing NBS performance and informing decision-making.

How to cite: Kandris, K., Markatos, N., Nika, C. E., and Katsou, E.: A symbolic regression approach to illuminate the water-energy-food-ecosystem interlinkages in a rainwater harvesting system, EGU General Assembly 2025, Vienna, Austria, 27 Apr–2 May 2025, EGU25-10713, https://doi.org/10.5194/egusphere-egu25-10713, 2025.

EGU25-10852 | ECS | Posters on site | NH1.7

Effect of engineered logjams on hydrodynamics and fish response 

Felix Broß, Clémence Dorthe, Kelken Chang, Filippo Coletti, and Isabella Schalko

Due to human interventions such as river channelization, the diversity of the flow, sediment, and wood regimes in rivers has decreased. A common measure to locally reestablish flow heterogeneity are nature-based solutions such as logjams with the aim to create or increase habitats for aquatic organisms such as fish. To optimize the design of nature-based solutions and to leverage the habitat creation for fish, we need to create a better understanding of the underlying flow and turbulence characteristics due to nature-based solutions. 

Laboratory experiments were conducted to investigate how different logjams affect the flow and turbulence properties. High-speed imaging was used to characterize the flow field at the surface and at a vertical plane at the channel centerline. The experiments investigated logjams differing in solid volume fraction, submergence level, as well as log alignment. All tested parameters altered the wake region. The results of the log alignment indicate that a random arrangement can lead to an evenly reduced velocity in the wake and lower turbulence levels. In contrast, a regular arrangement can lead to jets going through the structure and entering the wake unblocked, resulting in higher turbulence levels. The different turbulence levels may have implications for fish response. 

As a next step, field measurements are planned to complement laboratory experiments. Selected engineered logjams will be investigated at a restored river reach at the Emme River in Switzerland. Specifically, flow measurements will be obtained through drone images and Acoustic Doppler Velocimetry and compared to results of fish abundance. 


How to cite: Broß, F., Dorthe, C., Chang, K., Coletti, F., and Schalko, I.: Effect of engineered logjams on hydrodynamics and fish response, EGU General Assembly 2025, Vienna, Austria, 27 Apr–2 May 2025, EGU25-10852, https://doi.org/10.5194/egusphere-egu25-10852, 2025.

EGU25-11362 | ECS | Orals | NH1.7

Inorganic carbon unexpected driver of carbon sink response in an established beaver wetland 

Lukas Hallberg, Joshua Larsen, Annegret Larsen, Raphael d’Epagnier, Sarah Thurnheer, Natalie Ceperley, Bettina Schaefli, and Matthew Dennis

Riparian zones are critical links between terrestrial and aquatic ecosystems, controlling the biogeochemical fluxes and thus the fate of carbon (C) in stream networks. However, long-standing anthropogenic modifications of waterways have resulted in significant losses of riparian connectivity. Following re-introduction of beavers across Europe, the resulting reconnection of riparian interfaces shows a high potential for improving water quality and C sequestration. Beaver dam construction gives rise to sequential shifts in lotic and lentic conditions that support high capacities for C deposition and increase the C produced by aquatic primary producers. However, due to inconsistent system boundaries and the overlooking of certain C pathways, our current understanding of C budget dynamics in beaver wetlands remains incomplete.

In this study, we quantified the annual C budget in an established beaver-impacted reach in Switzerland. Inputs and outputs of dissolved organic carbon (DOC) and dissolved inorganic carbon (DIC) loads were modelled from biweekly water sampling and flow monitoring, in conjunction with measurements of gaseous C fluxes from soil, water and dead trees. Sediment storage of deposited C fractions was quantified in soil samples that were subsequently analysed with Rock-Eval pyrolysis. Biomass C storage was estimated at a plant species level by combining biomass surveys in field with multispectral imagery from drone remote sensing. Following hydrology and bathymetry measurements, the reach water balance was established by quantifying in- and outflow, wetland storage, subsurface storage and infiltration, and evapotranspiration.

We found large reductions in DIC loads along the reach, representing the main driver of the wetland's overall C sink response. The water balance partitioning further demonstrated that subsurface pathways were the primary sink of DIC, which was removed through transient and permanent storage, and deeper infiltration. Carbon dioxide (CO2) mineralisation in non-inundated soils was the dominant source of C emissions from the system. However, the limited release of CO2 from water surfaces showed that only a negligible fraction of DIC was released via this pathway. Instead, the annual accumulation of inorganic C in sediments suggests that DIC immobilisation in sediments, in conjunction with deeper infiltration, can be a significant C sink.

These results show that established, semi-confined beaver wetlands primarily regulate C dynamics via hydrological processes, overriding biogeochemistry and riparian feedbacks from primary productivity. It further stresses their high sensitivity to shifts in the C sink-source balance, and the importance of including inorganic C to elucidate their full impact on C sequestration in stream networks.

How to cite: Hallberg, L., Larsen, J., Larsen, A., d’Epagnier, R., Thurnheer, S., Ceperley, N., Schaefli, B., and Dennis, M.: Inorganic carbon unexpected driver of carbon sink response in an established beaver wetland, EGU General Assembly 2025, Vienna, Austria, 27 Apr–2 May 2025, EGU25-11362, https://doi.org/10.5194/egusphere-egu25-11362, 2025.

EGU25-11975 | ECS | Orals | NH1.7

Quantifying the impacts of rewilding on hydrological extremes (floods and droughts) 

Adam Hartley, Gemma Harvey, and Alex Henshaw

Rewilding is a type of Nature-based Solution and has increased in popularity in recent years with rewilding projects rapidly increasing in number across Europe. Different definitions of rewilding have been proposed but it generally refers to large-scale, whole-ecosystem approaches to landscape restoration which can include the reintroduction of missing species. Rewilding has the potential to influence hydrological extremes (floods, droughts), which are expected to intensify with climate change, but the evidence base is limited. To address this gap, this project combines systematic literature review and meta-analysis of published data, an audit of existing publicly available hydrological data for rewilding projects and hydrological and hydrodynamic modelling of rewilding scenarios, calibrated using real-world data from two UK projects.

In this presentation we will share an analysis of published studies that indicates rewilding-driven landscape changes are likely to slow the flow of water through landscapes and attenuate flood peaks. In contrast, research on low flow outcomes is limited and outcomes are more complex. We will also illustrate that existing hydrological monitoring networks in the UK need to be expanded in order to effectively monitor the impact of rewilding projects on hydrological extremes. Preliminary results from modelling rewilding outcomes at UK rewilding projects will also be discussed.

How to cite: Hartley, A., Harvey, G., and Henshaw, A.: Quantifying the impacts of rewilding on hydrological extremes (floods and droughts), EGU General Assembly 2025, Vienna, Austria, 27 Apr–2 May 2025, EGU25-11975, https://doi.org/10.5194/egusphere-egu25-11975, 2025.

EGU25-12732 | ECS | Posters on site | NH1.7

Nature-Based Solutions for Reducing Floods and Droughts in Small Rivers 

Elisie Kåresdotter, Amir Rezvani, and Zahra Kalantari

The increasing frequency and intensity of floods and droughts driven by climate change present significant challenges for water management. Small streams, which are crucial for maintaining ecosystem services, biodiversity, and local water management, are especially vulnerable to these changes. Nature-based solutions (NBS), including wetland creation and rewetting, stream meandering, and riparian zone restoration, have shown great potential for mitigating both floods and droughts by enhancing water retention and reducing hydrological connectivity. This case study focuses on Trelleborg, a coastal city in southern Sweden, where several community-driven NBS projects have been implemented to manage its small rivers and streams. By combining qualitative data from expert interviews with quantitative spatial data analysis, this study aims to evaluate the performance of various NBS in Trelleborg's unique environment. Focusing on Trelleborg’s small streams provides a valuable opportunity to understand how localized NBS initiatives can enhance resilience to climate change while delivering multiple co-benefits. The implemented interventions have not only reduced risks associated with hydrological extremes but also contributed to co-benefits such as improved biodiversity and the creation of new recreational areas. Additionally, the study highlights the importance of stakeholder involvement in understanding local socio-economic contexts and diverse perspectives, which is essential for assessing and designing effective NBS projects for future implementation. The findings can inform future NBS initiatives in similar contexts, offering actionable insights into their design, implementation, and performance.

How to cite: Kåresdotter, E., Rezvani, A., and Kalantari, Z.: Nature-Based Solutions for Reducing Floods and Droughts in Small Rivers, EGU General Assembly 2025, Vienna, Austria, 27 Apr–2 May 2025, EGU25-12732, https://doi.org/10.5194/egusphere-egu25-12732, 2025.

EGU25-12955 | ECS | Orals | NH1.7

A Novel Framework for the Assessment of the Nature-based Solutions (NbS) Effectiveness in the Reduction of Hydro-Meteorological Risks 

Luigi Brogno, Francesco Barbano, Laura Sandra Leo, and Silvana Di Sabatino

The identification of suitable and common methods and tools to evaluate the effectiveness of Nature-based Solutions (NbS) as adaptation measures for hydro-meteorological risks still remains an open challenge. NbS effectiveness is a complex concept whose evaluation needs to take into account also the reduction of the exploitation of both natural and economic resources, the achievement of the implementers’ and stakeholders’ intent at the design phase, and the provision of co-benefits. The following contribution aims to integrate the NBS concept in a novel hydro-meteorological risk framework reported by Brogno et al. (2024) 1. Starting from Crichton’s Risk Triangle, the framework allows the estimate of the risk as the sum of the economic losses and equivalent CO2 emissions resulting from hazardous events that may affect the healthcare system, social relationships, ecosystems, agro-food production, infrastructure safety, and cultural and natural heritage. The final output as a cost per day is a quantitative and pragmatic estimate to facilitate the decision-making process. In addition to presenting the framework, this contribution aims to show practical examples of how the proposed framework can be adopted as a tool for the assessment of NbS effectiveness in hydro-meteorological risk reduction. In particular, bio-geophysical quantities can be used to integrate the contribution of NBS intervention as a local modification of both the hazard characteristics and the predisposition of the exposed elements to be affected by the occurrence of hazardous events. These bio-geophysical quantities need to be directly influenced by NbS and affect in turn the targeted risk processes. The framework can also include the NbS life cycle into the risk assessment, accounting for the greenhouse gas emissions along with the implementation, maintenance, and restoration costs resulting from an NbS intervention. The comparison of the average framework outputs over several hazardous events before and after an NbS intervention can provide an assessment of the long-term NbS effectiveness.


1 Brogno, L., Barbano, F., Leo, L. S., Di Sabatino, S., (2024). A novel framework for the assessment of hydro-meteorological risks taking into account nature-based solutions. Environmental Research Letters, 19(7), DOI: 10.1088/1748-9326/ad53e6

How to cite: Brogno, L., Barbano, F., Leo, L. S., and Di Sabatino, S.: A Novel Framework for the Assessment of the Nature-based Solutions (NbS) Effectiveness in the Reduction of Hydro-Meteorological Risks, EGU General Assembly 2025, Vienna, Austria, 27 Apr–2 May 2025, EGU25-12955, https://doi.org/10.5194/egusphere-egu25-12955, 2025.

EGU25-15942 | ECS | Posters on site | NH1.7

Analyzing variability and possible trends in NDVI for urban water management: A remote-sensing approach for long term monitoring of green infrastructure 

Franziska Sarah Kudaya, Albert König, and Daniela Fuchs-Hanusch

The changing climate creates challenges for green spaces everywhere. A special case is presented by the urban tree, which has several harsh environmental conditions to deal with, i.e. compacted soil, polluted rainwater, etc. Climate adaptation strategies for cities involve the urban tree as a nature-based solution due to its high potential for heat island mitigation and reducing surface runoff. Managing water resources efficiently is receiving more attention with measures including alternative resources for irrigation or incorporating more drought-resistant species, while the effects of changing macro- and micro-climatic conditions on urban trees are only now becoming subject of scientific scrutiny. 

There are several important indicators for evaluating a tree’s living conditions and its water demand at a certain location. One such indicator is the start and end of the growing season. As temperatures rise, plants are seen to have shorter dormancy periods, resulting in earlier flowering and longer growing seasons, increasing both water demand and susceptibility to damage.  

In this study, we compare the growing cycles of urban trees across varying locations in the city of Graz during a period of over 20 years. Tree specific information is taken from the city’s tree register which gives important information about species, age and location of urban trees. Growing cycles are evaluated using a remote sensing approach where NDVI-timeseries are then calculated for the selected areas using openly available satellite imagery to identify changes in dormancy and evaluate a possible trend. The influence of parameters such as location, micro-climate, species and date of planting are investigated using statistical analysis. The generated knowledge is expected to help in the prediction of future urban green irrigation demand and choice of tree species.

How to cite: Kudaya, F. S., König, A., and Fuchs-Hanusch, D.: Analyzing variability and possible trends in NDVI for urban water management: A remote-sensing approach for long term monitoring of green infrastructure, EGU General Assembly 2025, Vienna, Austria, 27 Apr–2 May 2025, EGU25-15942, https://doi.org/10.5194/egusphere-egu25-15942, 2025.

EGU25-17085 | Posters on site | NH1.7

Sponge function: indicators and metrics to assess water retention in Nature-Based Solutions with application to UK fluvial and agricultural sites 

Alejandro Dussaillant, Neeraj Sah, James Blake, Ponnambalam Rameshwaran, and Gareth Old

Climate extremes like floods and droughts pose significant threats to both human communities and natural landscapes. The EU Horizon SpongeScapes and SpongeWorks projects aim to enhance landscape resilience against these hydrometeorological extremes by exploring "landscape sponge functions" – the natural ability of landscapes to absorb, store, and gradually release water. The SpongeScapes project investigates various nature-based solutions (NBS) across diverse European sites with varying climates, geographies, and soil conditions, to address three main questions: (i) what is the longer-term effectiveness of sponge measures (and what indicators/metrics are more adequate); (ii) what is the overall effect of all sponge measures in a catchment (i.e. sponge strategies); (iii) what are the main co-benefits and tradeoffs of sponge measures and strategies.

Here we will present a framework of context-specific 'Sponginess' indicators and metrics, in particular to assess the sponge function of water retention capacity in fluvial and agricultural sponge measures and strategies (catchment-wide combination of measures), with applications to SpongeScapes UK sites in the river Thames basin where work has been done since 2017 and is ongoing. These sites include the Littlestock brook, a headwater catchment in an agricultural landscape where a diversity of nature-based solutions (woody leaky dams, field corner bunds, wet woodland planting) have been implemented, as well as several farms where regenerative agricultural practices (RAPs) have been followed to improve soils, surface and ground water management.

Results on applying our sponge indicators framework will be presented and discussed based on ongoing field investigations, including analyses based on novel low-cost telemetered water level data in the fluvial site, as well as survey data for soil bulk density, water retention functions, infiltration and hydraulic conductivity for the agricultural fields.

How to cite: Dussaillant, A., Sah, N., Blake, J., Rameshwaran, P., and Old, G.: Sponge function: indicators and metrics to assess water retention in Nature-Based Solutions with application to UK fluvial and agricultural sites, EGU General Assembly 2025, Vienna, Austria, 27 Apr–2 May 2025, EGU25-17085, https://doi.org/10.5194/egusphere-egu25-17085, 2025.

EGU25-17250 | ECS | Posters on site | NH1.7

Finding suitable locations for in-stream wetland creation/restoration: comparing suitability analysis with machine learning approach  

Pamela Maricela Guamán Pintado, Merle Muru, and Evelyn Uuemaa

Wetlands are critical nature-based solutions (NbS) for addressing environmental challenges, playing an important role in sediment and nutrient retention, agricultural runoff mitigation, and carbon storage, contributing to climate change adaptation. However, agricultural intensification and land conversion have drastically reduced wetland coverage globally, necessitating the precise selection of sites for restoration/creation. Depending on fieldwork and expert judgment, traditional methods often struggle to scale effectively, highlighting the need for advanced geospatial techniques.

This study compares two approaches for in-stream wetland site selection, the Analytic Hierarchy Process (AHP) and the machine learning Random Forest (RF) algorithm, within the diverse hydrological landscape of Estonia. Both methods utilized environmental variables, including slope, topographic wetness index (TWI), flow accumulation, soil organic carbon (SOC), and clay content, to evaluate their influence on hydrological and soil conditions critical for determining suitable sites for in-stream wetland creation and restoration. These variables were selected for their ability to capture the key factors that drive wetland formation and functionality. Geospatial datasets, including local and global environmental variables, were processed at 10- and 50-meter resolutions to analyze how spatial resolution influences model performance, providing high-detail insights for localized assessments and broader, regional-scale perspectives.

The AHP framework integrates expert knowledge to prioritize variables, while the RF algorithm provides a data-driven, scalable alternative. The RF model was trained using data from existing wetlands, which were identified based on geospatial datasets and intersected with stream networks, channels, ditches, and rivers to focus on areas directly connected to water flow. Training points were randomly sampled within these wetlands to represent suitable areas. In contrast, points from non-wetland areas, such as forests, shrublands, grasslands, and arable land, were sampled to represent unsuitable areas. This approach ensured that the training data captured the variability of environmental conditions influencing wetland suitability

Validation was conducted using a historical map to evaluate model accuracy and reliability across varying scales and data conditions. Results indicate that the RF algorithm outperformed AHP in predictive performance, achieving an accuracy of approximately 0.8 at broader resolutions and slightly lower accuracy at finer resolutions. This underscores the influence of spatial resolution on model performance. However, AHP underscored the importance of structured decision-making and stakeholder input, ensuring practical applicability. This research advances the integration of NbS into wetland planning, bridging traditional expertise-driven methods and machine learning innovations to enhance precision, scalability, and cost-effectiveness.

How to cite: Guamán Pintado, P. M., Muru, M., and Uuemaa, E.: Finding suitable locations for in-stream wetland creation/restoration: comparing suitability analysis with machine learning approach , EGU General Assembly 2025, Vienna, Austria, 27 Apr–2 May 2025, EGU25-17250, https://doi.org/10.5194/egusphere-egu25-17250, 2025.

EGU25-17407 | ECS | Orals | NH1.7

A coupled mechanistic and in situ data approach to quantify the water retention potential of Nature-Based Solutions 

Katoria Lesaalon Lekarkar, Stefaan Dondeyne, and Ann van Griensven

EGU NH1.7

A coupled mechanistic and in situ data approach to quantify the water retention potential of Nature-Based Solutions


The increasing frequency and intensity of droughts poses great challenges to water availability and the functioning of natural ecosystems. In response to this, nature-based solutions (NbS) have emerged as a promising alternative to traditional infrastructure. NbS offer multiple benefits, including water retention, improved water quality, biodiversity conservation, and carbon sequestration. However, despite the growing recognition of their potential, the hydrological benefits of NbS remain poorly understood. The hydrological effects of NbS, such as water retention and groundwater recharge, are complex and require an integrated understanding of surface and groundwater interactions. However, current models for assessing water retention benefits are either too complex or not specialized to capture the unique features of NbS interventions. As such, the hydrological benefits associated with NbS are not fully understood. Furthermore, long-term in situ data that provides evidence of the benefits of NbS is also lacking. Consequently, the adoption of NbS remains limited due to the lack of clear evidence regarding their effectiveness in mitigating water scarcity.


In our study, we address these gaps by developing a simplified hydrological model designed to quantify water retention benefits of reclaimed and rewetted areas in a nature conservation area. The model is based on physically-based hydrological properties, which allow it to represent the fundamental water retention mechanisms of NbS. The model captures the interaction between the catchment area, the water retention zone (the NbS intervention), and the exchange between surface and groundwater. To validate the model and provide robust evidence, we complement the modelling approach with in situ data collected from a network of low-cost soil moisture sensors and groundwater piezometers. The deployment of these sensors allows for extensive monitoring at a relatively low cost, which is crucial for obtaining long-term data on the performance of NbS.

Our study demonstrates that NbS have the potential to mitigate water scarcity by enhancing both surface and groundwater storage, and the findings provide evidence that NbS can contribute to drought adaptation, with the added benefit of providing other ecosystem services. We also conclude that this coupled approach could serve as a useful tool for promoting the wider adoption of NbS in water resource management strategies as a multi-benefit alternative or companion to traditional infrastructure-based solutions.

How to cite: Lekarkar, K. L., Dondeyne, S., and van Griensven, A.: A coupled mechanistic and in situ data approach to quantify the water retention potential of Nature-Based Solutions, EGU General Assembly 2025, Vienna, Austria, 27 Apr–2 May 2025, EGU25-17407, https://doi.org/10.5194/egusphere-egu25-17407, 2025.

EGU25-17756 | Posters on site | NH1.7

Ex-ante evaluation of NbS effectiveness in mitigating water-related hazards at a catchment level 

Andrijana Todorović, Jasna Plavšić, Nataša Manojlović, Kelly Tseng, and Zoran Vojinović

Nature-based solutions (NbS) draw researchers’ attention as they can offer numerous co-benefits to the society and environment, as opposed to the traditional grey infrastructure, while having a potential to offer the same level of protection against water-related hazards, such as floods. Therefore, NbS are deemed a viable option to climate change adaptation. However, proof of their effectiveness in mitigating water-related hazards, especially at a large-scale level (i.e., at a catchment level), are still lacking. Ex-ante assessments, which are needed for initiating NBS projects, heavily rely on the modelling, mainly hydrological and/or hydrodynamical. The effectiveness of NbS is quantified through modelling exercises, by comparing simulated hazard levels simulated with- and without an NbS implemented. However, these assessments of NbS effectiveness are fraught with uncertainties, which primarily stem from the way they are accommodated in the models. Specifically, there are no clear guidelines on inclusion of NbS in the models, and evaluation of their effectiveness.

To learn about modelling of the NbS effects on reducing water-related hazards, a survey was distributed among the RECONECT (http://www.reconect.eu/) participants. The survey contained questions about the NbS and water-related hazards considered, and on the details on the models employed to simulate NbS effects, as well as on the indicators used to gauge NbS effectiveness. In most cases, flood hazard was considered, while the respondents reported various NbS (e.g., retention ponds, flood plain restoration, afforestation and reforestation). The respondents indicated that the NbS were included in the models by (1) changing model parameters (e.g., to represent afforestation or reforestation), (2) by including additional computational elements in the model (e.g., storage-type elements that represent retention ponds), or (3) by changing simulation settings to represent hydraulic structure operation. The way in which NbS are modelled was also dictated by the features of the model used. In some instances, some NbS could not be modelled, since they act at rather small-scale, and their effects could not be captured by a model (e.g., check dams in the headwater parts of a catchment). The respondents reported various indicators, but those related to flood hazard was most frequently reported one. Generally, all respondents agreed that the NbS modelling remains a great challenge, and that specific guidelines are needed.

To facilitate bridging this gap, a new survey on modelling of NbS effectiveness in reducing water-related hazards is launched. The new survey focuses on the “water” aspect of the NbS effectiveness, and delves into specific details on the model development and application. The main goal of this research is to target a wider audience (such as audience at EGU), and facilitate sharing knowledge on modelling of the NbS effects. It is the authors’ firm belief that sharing knowledge on modelling of NbS effectiveness can promote their wider implementation, and aid sustainable mitigation of water-related hazards, and adaptation to climate change.


Acknowledgements

This research received funding from the European Union’s Horizon 2020 Research and Innovation programme under Grant Agreement No. 776866 for the research RECONECT (Regenerating ECOsystems with Nature-based solutions for hydro-meteorological risk rEduCTion) project.

How to cite: Todorović, A., Plavšić, J., Manojlović, N., Tseng, K., and Vojinović, Z.: Ex-ante evaluation of NbS effectiveness in mitigating water-related hazards at a catchment level, EGU General Assembly 2025, Vienna, Austria, 27 Apr–2 May 2025, EGU25-17756, https://doi.org/10.5194/egusphere-egu25-17756, 2025.

EGU25-17771 | Orals | NH1.7

The potential of nature-based adaptation solution in municipal wastewater sector: willow planting systems as GHG emission reductants in Latvian villages 

Agrita Briede, Iveta Steinberga, Kristine Ketrina Putnina, Zanda Peneze, and Ivo Vinogradovs

Nature-based solutions (NbS) are known to be important measures that can help reduce climate change effects while providing environmental, social and economic benefits.

This study presents one of the evaluated examples of mitigation and adaptation in the wastewater management sector: the potential of willow (Salix spp.) plantations in different regions of Latvia. They are considered to be cost-effective and highly efficient solutions for recovering nutrients in wastewater and also provide biomass that can be used for energy production.  

The particular study approximated the number of persons in households not connected to centralised wastewater treatment plants or using poor quality biological treatment plants in different regions of Latvia according to Latvia`s National Inventory Report under the UNFCCC Greenhouse Gas Emissions in Latvia from 1990 to 2022. Overall, 24% of private persons discharge inadequately treated domestic wastewater into the environment, accounting for 99.8% of methane emissions in municipal wastewater sector.

It is known that willow plantations are used for wastewater treatment in Denmark, Sweden and southern Finland (https://doi.org/10.1016/j.scitotenv.2020.138620), but their use in northern regions may be limited due to climatic conditions, as the efficiency of wastewater treatment decreases at low temperatures. Taking this into account, regions in Latvia where willow plantations would be more effective were initially assessed.  Overall, trends in climate parameters gave reason to believe that the western regions of Latvia are already suitable for the establishment of willow systems.

The IPCC (2006) methodology for calculating GHG emission reduction was used.  Main assumptions used in the evaluation of the implementation of the measures: assumption that all households without appropriate domestic wastewater treatment are connected to the system; assumption that biological treatment plants of adequate quality and efficiency are in place.  The willow system is designed to accumulate as well reduce N & P and their efficiency depends on correct operation. It should be noted that the system requirements depend on the water consumption and pollution load.

The cost of installing such systems in the first year will be the highest, but as the indicative lifetime of the system is 20 years, the long-term average cost could be around €440/tCO2eq. Negative aspects or impacts as shown by studies  are most related to the cost of planning directly for biomass collection (on average 15 minutes mowing per 100 m2) as they should not be overgrown, to the approximately 12 hours of regular annual maintenance and to extreme rainfall events during which water levels have to be monitored.

From an adaptation point of view, there are several known positive aspects of willow planting, such as reducing flood risk. Willow plantations increase evaporation and slow down the spread of water in the floodplain. They also provide several ecosystem services, for example, they attract pollinators, supporting biodiversity, as well as improve the aesthetic value of the territory.

How to cite: Briede, A., Steinberga, I., Putnina, K. K., Peneze, Z., and Vinogradovs, I.: The potential of nature-based adaptation solution in municipal wastewater sector: willow planting systems as GHG emission reductants in Latvian villages, EGU General Assembly 2025, Vienna, Austria, 27 Apr–2 May 2025, EGU25-17771, https://doi.org/10.5194/egusphere-egu25-17771, 2025.

EGU25-17941 | ECS | Orals | NH1.7

Resilience of stormwater trees to temporary flooding: The case of Acer platanoides ‘Globosum’ 

Hayath Zime Yerima, Didier Techer, and Martin Seidl

High levels of urbanisation, combined with the effects of climate change, are affecting meteorological phenomena, leading to an increase in global urban rainfall anomalies and more flooding. This phenomenon is exacerbated in urban areas by the increasing imperviousness. As a result, flooding is one of the most devastating and widespread natural disasters in the world, affecting regions on all continents. Sustainable Urban Drainage Systems (SUDS) have emerged as a practical solution to mimic natural drainage processes and mitigate the adverse effects of flooding while providing other co-benefits. This is the case, for example with stormwater trees, which contribute to the sustainable management of rainwater and surface water runoff by optimising the processes of infiltration, retention and transpiration. However, in the case of extreme rain events or a fast succession of rain events, the soil or substrate surrounding these trees can remain in saturated conditions for longer periods of time, undermining their capacity to provide the ecosystem services needed. In order to evaluate the resistance of urban trees and in particular to better assess/understand the physiological limits of the stormwater trees, soil saturation assays were carried out in 2023 and 2024 on maple trees (Acer platanoides Globosum), a common street tree in European cities. The assays consisted of evaluating the morphological and physiological responses of 3 young maple trees subjected to water saturation of the planting soil during 21 days and comparing them with 3 reference maple trees under normal drainage conditions. At the tree level, the transpiration changes and the trunk pulsations were continuously monitored with sap flow sensors (Implexx Sense) and dendrometers (Ecomatik), respectively. At the leaf leaves level, the physiological responses following prolonged soil saturation conditions were monitored by instantaneous fluorescence-based measurements of leaf pigments and the nitrogen balance index (DUALEX®, Force-A,) as potential stress biomarkers, and leaf stomatal conductance and transpiration (LI-COR). The soil compartment was monitored using continuous soil moisture measurements (Campbell Sci.) and punctual measurements of pore water oxygen level and redox potential (WTW). 

The results showed a rapid fall in soil pore water oxygen level and redox potential, while the physiological effects of saturation were delayed and appeared only after 7 days of soil saturation. The most impacted tree measured parameter was the transpiration rate, followed by leaf ecophysiological traits such as phaeopigments. Remarkably, the prolonged soil saturation profoundly affected tree health, showing effects even after the winter dormant period during the following growing season This questions the extent to which stormwater trees could provide ecosystem services in the future. The presentation will focus on the impact of soil saturation on the various tree parameters measured and propose the definition of a “tolerance threshold” for stormwater trees in the context of runoff management.

How to cite: Zime Yerima, H., Techer, D., and Seidl, M.: Resilience of stormwater trees to temporary flooding: The case of Acer platanoides ‘Globosum’, EGU General Assembly 2025, Vienna, Austria, 27 Apr–2 May 2025, EGU25-17941, https://doi.org/10.5194/egusphere-egu25-17941, 2025.

EGU25-19299 | ECS | Orals | NH1.7

The impact of Nature-based Solutions (NbS) on hydrological processes in an agricultural catchment through their representation in a physically-based model 

Cristiane Fragata dos Santos, Andreja Jonoski, Ioana Popescu, Kwankamol Chittrakul, and Bruno Samain

Traditional water management practices, largely based on hard engineered infrastructure and highly optimized systems, are proving insufficient for adapting to the complex interplay of future climatic, environmental and socio-economic conditions. The increased frequency and magnitude of hydrological hazards in Europe, such as the multi-year drought during the period 2018-2020 and the subsequent summer flood that hit Central Europe in July 2021, have underscored the need for integrated water management. Nature-based Solutions (NbS) offer a promising alternative or complement to grey infrastructure by leveraging natural processes and ecosystem services to simultaneously mitigate flood and drought risks. Unlike traditional water management, which has a well-developed knowledge base and specialized modelling tools to represent structural measures (e.g., dikes, dams) as well as guidelines to assess their performance, knowledge on NbS representation, functioning and their impacts on catchment hydrology over time is still limited. The simulation of NbS requires modellers to identify relevant hydrological processes involved in their functioning and find reliable ways to represent them based on the capabilities and limitations of selected physically-based models and available data. Agricultural catchments, while highly vulnerable to shifts in climate due to their dependence on natural climate-sensitive resources, offer significant opportunities for implementing nature-based strategies such as wetland restoration, tree planting and infiltration ponds. This study analyses the impact of NbS representation on the hydrological processes related to both floods and droughts in one middle-sized agricultural catchment under temperate climate: the Handzamevaart catchment (Belgium). Using MIKE SHE, a fully distributed hydrological model, coupled with MIKE 11, a 1D hydraulic river model, we explore a wide range of parameters to represent different types of NbS. Changes in the total water balance and in the individual hydrological processes and variables related to discharge, overland flow, evapotranspiration, infiltration, and groundwater fluxes obtained as a result of the different NbS representation will be assessed at catchment scale, but also locally - immediately upstream and downstream of the modelled measures. This study can serve to build the foundational knowledge required for the representation of NbS in physical models, anticipating process understanding for designing flood and drought mitigation strategies. Key outputs include an evaluation of model robustness to NbS representation, identification of the most influential parameters in the representation of different types of NbS, and thereby guidance for empirical data collection to improve NbS representation in future studies.

Research is supported by the Horizon Europe research and innovation programme: the “FUTURAL project” (Grant No. 101083958).

How to cite: Fragata dos Santos, C., Jonoski, A., Popescu, I., Chittrakul, K., and Samain, B.: The impact of Nature-based Solutions (NbS) on hydrological processes in an agricultural catchment through their representation in a physically-based model, EGU General Assembly 2025, Vienna, Austria, 27 Apr–2 May 2025, EGU25-19299, https://doi.org/10.5194/egusphere-egu25-19299, 2025.

EGU25-19479 | ECS | Orals | NH1.7

LiDAR for Green Infrastructure: monitoring vertical greening with wooden support structures 

Anna Briefer, Andreas Tockner, and Rosemarie Stangl

Green infrastructures (GI) are key elements in urban areas for heat mitigation, carbon capture and providing of aesthetic reasons. However, there is currently limited knowledge about the effects of various plant compositions, arrangements and varying density of plant cover, because traditional measuring methods are expensive / labour-intensive, imprecise, and tall buildings pose accessibility challenges. The presented study proposes applying LiDAR measurements on GI to gain in-depth understanding of plant growth, inventory of vegetation cover and thereby providing a useful tool for sustainable urban hazard management.

The use of LiDAR (Light Detection and Ranging) technology has revolutionised forest monitoring by offering precise, efficient, and highly detailed spatial data for creating comprehensive 3D reconstructions of forest structures. The ability to capture fine details on both vegetation and structural surfaces is particularly advantageous for studying complex, vertical environments such as green façades. This study used static ground-based LiDAR (RIEGL VZ-600i) to capture the 3D structure of a vertical greenery with wooden support structures before and after harvesting. Defined squares of 1 m² were fully harvested, the biomass collected and dry weight was obtained. Reference measurements for vegetation height (distance from wall to the outermost part of the plant) were recorded on a grid for 40 measurement points. The reference measurements were related to LiDAR alpha-hull volumetric analysis and predictions of growing biomass could be derived.

By integrating point cloud analysis developed for forest monitoring into urban contexts, LiDAR facilitates a holistic analysis of natural and built environments. By analysis of LiDAR intensity and mapping further reference measurements for plant vitality and structural integrity, green wall health can be evaluated. Already established practices like alpha-hulling provide a successful tool to document green façades comprehensively. Combining LiDAR with traditional measures enhances our understanding of the interactions between vegetation and architectural surfaces, enabling improved design and maintenance of GI and NBS to enable better planning and maintaining of NBS to reduce the effect of urban heat islands. 

How to cite: Briefer, A., Tockner, A., and Stangl, R.: LiDAR for Green Infrastructure: monitoring vertical greening with wooden support structures, EGU General Assembly 2025, Vienna, Austria, 27 Apr–2 May 2025, EGU25-19479, https://doi.org/10.5194/egusphere-egu25-19479, 2025.

EGU25-20000 | ECS | Orals | NH1.7

Constructed Wetlands as Nature-Based Solutions: Resilience to Acid Rock Drainage and climatic seasonality in the Cordillera Blanca, Peru 

Vladimir León Menacho, Kiara Aguirre Falcón, Roy Pacchioni Carranza, Maximiliano Loarte Rubina, Carmen Hernández Crespo, Enrique Asensi Dasi, and Miguel Martín Monerris

Glacial retreat, accelerated by climate change, exposes rocks rich in metallic sulphides such as pyrite (FeS2) to geochemical weathering processes, resulting in Acid Rock Drainage (ARD) which releases H+, Fe, SO4-2 and trace metals that impact water bodies and ecosystems. This phenomenon has been evidenced in the Cordillera Blanca, where climatic seasonality is characterized by 2 periods, rainy and dry. In this context, Constructed Wetlands (CWs) emerge as Nature-Based Solutions (NbS) designed to mitigate effects of ARD. Although CWs have been extensively studied in acid mine drainages, their performance under seasonal and variable climatic conditions in glacial environments requires research.

In Recuay - Ancash, water quality of Negro river impacted by ARD which feeds a CW at ARD Pilot Treatment Plant was evaluated for 6 months every 2 weeks (rainy and dry periods) by taking in situ measurements and determining acidity, sulphates and heavy metals. In addition, modelling was carried out with different loads applied to size and determine average CW efficiencies.

Results of water quality in the river show higher concentrations in dry period compared to rainy period, where pH: 3.15±0.1 - 3.42±0.1, EC: 489.6±103.0 - 252.0±160.2 µS.cm-1, TDS: 275.5±63.4 - 121.0±78.4, SO4-2: 151.1±27.6 - 92.7±38.6, Fe: 16.8±2.3 - 8.5±3.6, Al: 3.5±0.3 - 2.2±0.7, Ni: 0.07±0.01 - 0.04 ± 0.02, Zn: 0.17±0.02 - 0.11±0.05, Mn: 0.79±0.09 - 0.48±0.20, Mg: 11.8±1.8 - 6.5±2.4, Ca: 17.8±2.2 - 11.5±4.5, Si: 4.3±0.4 - 3.5±0.5 and Na: 2.65±0.36 - 2.00±0.49 in mg.L-1. Cd, Fe, Mn, Al, Co, Zn, Mg, Si, Sr, Be, Ca and Na showed significant statistical differences (p<0.05) between periods.

Concentration in the CW effluent is: pH: 6.4±0.2 - 6.3±0.1, EC: 234.3±17.8 - 146.9±55.2 µS.cm-1, TDS: 130.2±33.5 - 70.1±26.7, SO4-2: 107.1±23.9 - 72.1±36.2, Fe: 1.3±0.3 - 1.1±0.6, Al: 0.05±0.01 - 0.06±0.01, Ni: 0.004±0.009 - 0.001±0.0, Zn: 0.005±0. 004 - 0.003±0.0, Mn: 1.12±0.11 - 0.83±0.38, Mg: 11.2±2.9 - 8.1±3.3, Ca: 32.7±5.5 - 19.6±11.2, Si: 6.5±0.6 - 5.7±0.8 and Na: 2.76±0.28 - 2.06±0.61 in mg.L-1 showing that there aren’t significant differences (p<0.05) between periods except for Si and Ca. Modelling results with 2 hydraulic operating loads (0.105 and 0.158 m.d-1) and residence times (0.079 and 0.118 d) at constant flow suggest that the CW is robust regardless of the hydraulic load. Maximum applied loads were 16.5, 26.9, 3.7, 0.7, 0.015 and 0.047 g.m-2.d-1 with average efficiencies of 50.4, 49.9, 90.6, 96.9, 97.9 and 98.9 % for acidity, SO4-2, Fe, Al, Ni and Zn, respectively. However, negative efficiencies were observed, primarily for  Mn, Mg, Ca, Si and Na due to anaerobic processes and CW substrate and metal chemistry. In this context, CWs have proven to be a resilient and adaptable solution to climatic seasonality.

How to cite: León Menacho, V., Aguirre Falcón, K., Pacchioni Carranza, R., Loarte Rubina, M., Hernández Crespo, C., Asensi Dasi, E., and Martín Monerris, M.: Constructed Wetlands as Nature-Based Solutions: Resilience to Acid Rock Drainage and climatic seasonality in the Cordillera Blanca, Peru, EGU General Assembly 2025, Vienna, Austria, 27 Apr–2 May 2025, EGU25-20000, https://doi.org/10.5194/egusphere-egu25-20000, 2025.

EGU25-20690 | Orals | NH1.7

Mainstreaming NbS: Experiences from the INTERREG ResiRiver initiative. 

Ralph Schielen, Geert van der Meulen, Stanford Wilson, Boris Bakker, and Yvo Snoek

Nature-Based Solutions (NbS) integrate natural processes to address societal challenges, such as climate change, disaster risk, and biodiversity loss. Mainstreaming NbS involves incorporating these approaches into policies, planning, and decision-making across sectors like urban development, agriculture, and infrastructure. Key elements include upscaling, cross-sectoral collaboration, capacity building, financing mechanisms, and robust monitoring. However, the mainstreaming process faces challenges, including limited awareness, fragmented governance, and a lack of comprehensive data on the effectiveness of NbS. Overcoming these barriers requires coordinated efforts across sectors and stakeholders to scale up NbS and ensure their integration into long-term sustainability frameworks. ResiRiver is a transnational project focused on resilience enhancement in river systems in North-West Europe through mainstreaming and upscaling NbS. By means of a range of project partners working on NbS in pilot sites, mainstreaming theory is tested in practice. This results in identification of diverse mainstreaming activities and objectives, creating opportunities to develop support for NbS mainstreaming tailored to pilots and organizational capacities to overcome mainstreaming challenges.

How to cite: Schielen, R., van der Meulen, G., Wilson, S., Bakker, B., and Snoek, Y.: Mainstreaming NbS: Experiences from the INTERREG ResiRiver initiative., EGU General Assembly 2025, Vienna, Austria, 27 Apr–2 May 2025, EGU25-20690, https://doi.org/10.5194/egusphere-egu25-20690, 2025.

BG9 – Earth System Remote Sensing and Modelling

EGU25-1111 | ECS | Posters on site | BG9.1

Assimilation of microwave backscatter to update modelled crop biomass and soil moisture: assessment and insights 

Shannon de Roos, Michel Bechtold, Louise Busschaert, Hans Lievens, and Gabrielle De Lannoy

We studied the potential of regional microwave backscatter data assimilation (DA) in AquaCrop, to improve surface soil moisture (SSM) and crop biomass estimates. The DA was performed in NASA’s Land information system, a software framework which allows for efficient model ensemble and DA runs. SSM and crop biomass simulations from AquaCrop were updated using Sentinel-1 synthetic aperture radar observations, over three regions in Europe in two separate DA experiments. The first experiment concerned updating SSM using VV-polarized backscatter, where the corrections were propagated via the model to the biomass. In the second experiment, the DA setup was extended by also updating the biomass with VH-polarized backscatter. Overall, the SSM evaluation showed that there is potential in using Sentinel-1 backscatter for assimilation in AquaCrop, but the present setup was not able to improve crop biomass estimates. Our study reveals how the complex interaction between SSM, crop biomass and backscatter affect the impact and performance of DA, offering insight into ways to optimize DA for crop growth estimation.

How to cite: de Roos, S., Bechtold, M., Busschaert, L., Lievens, H., and De Lannoy, G.: Assimilation of microwave backscatter to update modelled crop biomass and soil moisture: assessment and insights, EGU General Assembly 2025, Vienna, Austria, 27 Apr–2 May 2025, EGU25-1111, https://doi.org/10.5194/egusphere-egu25-1111, 2025.

EGU25-1632 | Posters on site | BG9.1

Shrub species, cover and biomass from affordable UAV observations 

France Gerard, ce Zhang, Rafael Barbedo, Charles George, Emily Upcott, Douglas Kelley, and Richard Broughton

Monitoring habitat condition is becoming increasingly important in light of the biodiversity crisis. Advances in UAV remote sensing and artificial intelligence are creating opportunities to complement field-based habitat monitoring or provide effective alternatives. As part of MAMBO, an EU-funded project, we aim to develop generic workflows that can deliver crucial habitat condition metrics using affordable drone remote sensing. Shrub cover and biomass in grassland, wetland, and shrub habitats are important for monitoring rewilding or habitat restoration efforts and above ground carbon. Here we describe a workflow, involving deep learning and allometry, developed to map the biomass of individual hawthorn shrub clumps. Our use case is a rewilded farm in Bedfordshire, UK. Results show that (i) U-Net variants are suitable for accurately mapping hawthorn within a complex shrub matrix, and (ii) allometry, based on structure-from-motion derived height, is an effective and affordable solution for shrub biomass mapping.

How to cite: Gerard, F., Zhang, C., Barbedo, R., George, C., Upcott, E., Kelley, D., and Broughton, R.: Shrub species, cover and biomass from affordable UAV observations, EGU General Assembly 2025, Vienna, Austria, 27 Apr–2 May 2025, EGU25-1632, https://doi.org/10.5194/egusphere-egu25-1632, 2025.

EGU25-1884 | Posters on site | BG9.1

Remote sensing of desert boundaries: Challenges, Concepts and Methods 

Maxim Shoshany

Hot deserts cover between 19 and 25 million square kilometers of the Earth land surface. Climate change together with impacts from anthropogenic activities which intensify with the growing world population are claimed to cause desertification. One interpretation of desertification processes concern shifting of the deserts’ boundaries into semi-arid zones. However, “ the delimitation of desert areas is difficult, particularly the location of the outer boundaries.... desert boundaries are often considered as shifting zones of transition rather than lines clearly demarcated by climate or by abrupt changes in species  or associations. Transitional boundaries may result from human impact or from decadal climatic fluctuations.” (Laity, 2008). In broad terms, desert boundary bounds  terrain which may not sustain natural vegetation growth. When considering herbaceous plants, such bound shifts locally in response to small amounts of rainfall. Shrubs’ extents are bounded by sub-surface water accumulation which is affected by hydrology, topography and yearly rainfall fluctuations. Drought tolerant  dwarf-shrubs may spread quickly into bare soils during rainy years and sustain there during long draughts. These growth forms’ and their  mixed patterns responses to periodic, seasonal and annual precipitation fluctuations are thus complex and highly vary in space and time. Adding to this complexity anthropogenic impacts, such as from grazing, wood cutting and fire, make the search for desert boundaries a challenging  task. Remote sensing offers  data and tools for  the search for such boundaries across wide regions. Landsat TM is instrumental for this purpose with its continuous coverage since 1985 at moderate resolution.  Seasonal / phenological vegetation cover fractions or NDVI allow  for differentiating between growth-form patterns and their transitions. The following four conceptual methods were developed utilizing multi-date Landsat TM imagery for discovering such transition zones across  desert fringes:

  • Extreme rainfall conditions:
    • Total (all growth forms) green cover at extremely high winter rainfall year: reveals the boundary between the maximal extents of vegetation and the areas which has very low rainfall  or cannot support vegetation growth.
    • Shrubs cover at years of extremely low rainfall: reveals the boundary of sustainable and resilient shrubs.
  • Vegetation drying rates at the beginning of the dry season (spring) indicate differences in soil chemical and physical properties . Transitions from clay soils and those of high organic matter to lithosols and rocky surfaces can be clearly detected.
  • Winter trends of green vegetation change as a function of the  progression of rainfall accumulation may reveal transition from phrygana to Mediterranean shrublands. 
  • Imagery spatial erosion and dilation of patchy vegetation patterns may allow differentiation  between  areas according to their draught  recovery potential: high for dense and large patches and low for small and sparse shrubs.

The conference presentation will demonstrate the results of applying these methods for years of average, high and low rainfall across  a Mediterranean to arid gradient  in the south-eastern side of the Mediterranean basin

How to cite: Shoshany, M.: Remote sensing of desert boundaries: Challenges, Concepts and Methods, EGU General Assembly 2025, Vienna, Austria, 27 Apr–2 May 2025, EGU25-1884, https://doi.org/10.5194/egusphere-egu25-1884, 2025.

EGU25-1900 | ECS | Orals | BG9.1

Biases in estimated vegetation indices from spectral below cloud reflectance measurements 

Kevin Wolf, Evelyn Jäkel, André Ehrlich, Michael Schäfer, Andreas Huth, Hannes Feilhauer, and Manfred Wendisch

Vegetation indices (VIs) derived from ground-based or unmanned aerial vehicle measurements use relative reflectance measurements obtained by flying over well-defined reflectance panels (RP). The RP overflights provide a form of transfer calibration to determine reflectances over the actual vegetated areas. It is assumed that environmental conditions, i.e., solar zenith angle (SZA) and cloud optical thickness (COT), remain constant between RP overflights. During typical 10-minute intervals between RP overflights, the COT varies especially during broken cloud conditions. Although days with low-level and mid-level clouds are avoided during vegetation remote sensing, even optically thin cirrus affects the radiation reaching the surface and therefore the reflectance measurements. The clouds change the absolute value of the incoming irradiance, but also the spectral signature by scattering radiation primarily in the visible–near-infrared wavelength range and absorbing radiation in the shortwave–infrared wavelength range. Consequently, a change in cloud cover between RP overflights distorts the measured reflectance. To systematically investigate the effects of COT changes on VI estimates between RP overflights, we present coupled radiative transfer simulations using the library for radiative transfer model (libRadtran) and the Soil Canopy Observation of Photosynthesis and Energy fluxes (SCOPE2.0) model. Simulations were performed for liquid water and ice clouds, and combinations of COT between the assumed state, i.e., during an RP overflight, and the true state, i.e., during the actual measurement. The COT was varied between 0 and 10, which is representative for cirrus. For comparability, the same range was used for the mid-level liquid water cloud.  In general, biases in estimated VI are most sensitive to COT, respond non-linear, and are further governed by the SZA. The simulations performed indicate that the normalized vegetation index (NDVI) is less sensitive to cloud effects than the enhanced vegetation index (EVI). For SZA less than 50°, a higher than assumed COT leads to an overestimation of the EVI, while for lower than assumed COT it leads to an underestimation of the EVI. For a more general assessment, the spectral effects on narrow-band ratios of the form (ρ(λ1) - ρ(λ2)) / (ρ(λ1) + ρ(λ2)), with ρ(λ) the spectral reflectance at wavelengths λ1,2 ∈ [400,2400~nm], were investigated. The proposed presentation will outline the raised problems and present the results from the coupled simulations. 

How to cite: Wolf, K., Jäkel, E., Ehrlich, A., Schäfer, M., Huth, A., Feilhauer, H., and Wendisch, M.: Biases in estimated vegetation indices from spectral below cloud reflectance measurements, EGU General Assembly 2025, Vienna, Austria, 27 Apr–2 May 2025, EGU25-1900, https://doi.org/10.5194/egusphere-egu25-1900, 2025.

EGU25-2381 | ECS | Orals | BG9.1

Diurnal responses of large-scale solar-induced chlorophyll fluorescence to varying heat and water stresses 

Dayang Zhao, Zhaoying Zhang, and Yongguang Zhang

Heat and water stress induce structural and physiological changes in plants that can become decoupled within a diurnal cycle due to faster physiological responses. Understanding these physiological responses can improve the large-scale modeling of photosynthesis and evapotranspiration. Satellite solar-induced chlorophyll fluorescence observations (SIFobs) provide both structural and physiological information and are recognized as a reliable indicator for monitoring plans heat and water stresses at large scales. However, the diurnal responses of large-scale SIFobs and its physiological component, fluorescence efficiency (Φf),  to heat and water stresses remain unclear. In this study, we used data from Orbiting Carbon Observatory-3 (OCO-3) and combined a machine learning technique with the near-infrared radiance of vegetation (NIRvR) approach to model four years of hourly SIFobs and Φf data for summer seasons across mainland China. Statistical analyses of the modeled outputs were conducted to investigate the diurnal variations of SIFobs and Φf under varying water and heat stress conditions. Additionally, by comparing modeled SIFobs variations at different times of the day, we also attempted to investigate the uncertainties in assessing changes in the daily average SIFobs (ΔSIFdaily) when using daily correction factors to convert polar-orbiting satellite SIFobs into the daily averages (SIFdaily). Our results revealed that SIFobs and Φf at different times of day exhibited different variations under water and heat stress conditions, both in magnitude and sign, especially in forests. Morning and afternoon SIFobs generally exhibited larger positive or smaller negative responses than the midday period. In contrast, the morning Φf also exhibited larger positive or smaller negative responses than the midday period, but the opposite pattern was found for the afternoon Φf. Such diurnal differences in SIFobs and Φf responses became more pronounced on days with higher water and heat stresses. Additionally, morning polar-orbiting satellite SIF observations tended to overestimate ΔSIFdaily, whereas midday observations tended to underestimate it. Such biases also intensified with rising daily water and heat stress levels. Our findings broaden the understanding of the diurnal responses of SIF and especially Φf to varying heat and water stresses. The results also highlight the importance of observation time in monitoring plant water and heat stresses from polar-orbiting satellite SIF observations.

How to cite: Zhao, D., Zhang, Z., and Zhang, Y.: Diurnal responses of large-scale solar-induced chlorophyll fluorescence to varying heat and water stresses, EGU General Assembly 2025, Vienna, Austria, 27 Apr–2 May 2025, EGU25-2381, https://doi.org/10.5194/egusphere-egu25-2381, 2025.

EGU25-2831 | Posters on site | BG9.1

Evaluating the vegetation biodiversity from space 

Guido J. M. Verstraeten and Willem W. Verstraeten

Creating an ideal environment to enrich biodiversity can be managed in two ways, i.e. by protecting rare and common species (i), and by improving the environmental conditions of the specific ecosystem (ii). The first measure results in an excellent balanced food pyramid with a sustainable cyclic biotic and mineral energy transition. The second measure, however, is connected to minimal entropy production according to Penrose´s claim that biologic life is lowering the entropy production rate of Earth. Minimum entropy implies maximum order so that any ecosystem tends to maximum biodiversity, at least to its local boundary conditions. Entropy production of an ecosystem, is linked to the Shannon entropy of the statistical species distribution of the respective ecosystem according to Stephan Hubbel´s Unified Neutral Theory of Biodiversity (2001). Hubbel put on the statistical ensemble of species situated in a mature vegetation area, a lognormal distribution of species according to the McArthur´s Island theory and confirmed by Fisher. The standard deviation decreases with entropy production increase and vice versa. This distribution contains one deficiency since it underestimated the contributions of rare species.

We derive Earth´s entropy production from the Stefan-Boltzmann law. Monthly land surface temperature (LST) are obtained from remotely sensed MODIS and SENTINEL data over the period 2003-2020 and monthly latent heat data from the FLUXCOM-X global fluxes collection for a one by one kilometer pixels. We analyse 11 ecosystems worldwide (mean of 3 x 3 pixels). Eight of them are National Parks where minimal anthropogenic stress can be assumed. Three control areas subjected to human economic activity nearby National Parks are added for comparison.

A decline in entropy production down to -3.7% per decade is observed in areas around the equator (Foz do Iguaço in Brazil, the Ngorongoro in Tanzania, and Gal Oya in Sri Lanka). The entropy production over the Mediterranean area (Spain) and northern Europe (Finland) is stable, while the entropy production is increasing dramatically up to +2.4% per decade over the western European National Parks (the Netherlands, Flanders). These areas are characterized by a very high anthropogenic environmental pressure. Differences in the trends of entropy production are observed when mean values are computed from 3 x 3 pixels or from 9 x 9 pixels. Generally, the more the pixels, the smoother, the smaller the absolute trend values. For the Landes in France, the trend switches from a small negative value on the larger scale to a more substantial positive value at the smaller scale. Generally, wetter ecosystems tend to lower the Earth´s entropy production thereby increasing the biodiversity of vegetation.

How to cite: Verstraeten, G. J. M. and Verstraeten, W. W.: Evaluating the vegetation biodiversity from space, EGU General Assembly 2025, Vienna, Austria, 27 Apr–2 May 2025, EGU25-2831, https://doi.org/10.5194/egusphere-egu25-2831, 2025.

EGU25-3422 | ECS | Posters on site | BG9.1

A GNN-RNN Framework for Rice Yield Prediction in South Asia 

Chao Zhang, Chen Zhao, and Xiaogang He

Climate change poses unprecedented risks to agriculture production, thus accurate and timely crop yield forecasting is pivotal for ensuring global food security and agricultural market stabilization, especially in South Asia, a key region for rice production and export. While a growing number of studies have explored the potential of machine learning-based models for rice yield prediction, these efforts are often limited to local scales and ignore the spatiotemporal nature of rice yield in the modeling process. In this study, we propose a graph-based recurrent neural network (GNN-RNN) framework for predicting district-level rice yields in South Asia using publicly available data. The model integrates multi-source datasets, including climate observations, satellite-derived phenological metrics, soil maps, and historical yield records. By aggregating these inputs at the district scale through rice distribution masks, we extract time-series features with a Convolutional Neural Network (CNN) and utilize a GNN-RNN model to process spatiotemporal embeddings. The GraphSAGE algorithm captures geographical relationships, while the RNN component enhances predictions by incorporating temporal dependencies. Validation against five baseline machine learning models (CNN, CNN-RNN, LSTM, gradient boosting, random forest) from 2000 to 2020 shows the GNN-RNN outperforms alternatives, achieving an average R2 of 0.75 and RMSE of 288 kg/ha for monsoon-season rice yields. Further tests confirm its robustness in both normal and extreme weather years, with leave-one-year-out RMSEs ranging from 234 to 366 kg/ha (11-18% of the long-term mean yield). The framework also quantifies uncertainty, with over 80% of observed yields falling within the 95% confidence interval, and prediction reliability improving throughout the growing season. This study demonstrates the potential of graph-based AI models for high-resolution crop yield forecasting, offering critical insights for food security and climate resilience. Future research could explore the model's application to extreme weather and pest impacts, as well as the integration of advanced remote sensing datasets to further enhance its predictive power.

How to cite: Zhang, C., Zhao, C., and He, X.: A GNN-RNN Framework for Rice Yield Prediction in South Asia, EGU General Assembly 2025, Vienna, Austria, 27 Apr–2 May 2025, EGU25-3422, https://doi.org/10.5194/egusphere-egu25-3422, 2025.

EGU25-4801 | ECS | Posters on site | BG9.1

Asymmetric sensitivity of boreal forest resilience to forest gain and loss 

Xiaoye Liu

Forest gains and losses may have unequal effects on forest resilience, particularly given their distinct temporal dynamics. Here, we quantify the sensitivities of boreal forest resilience to forest cover gain and loss using a resilience indicator derived from the temporal autocorrelation (TAC) of the kernel Normalized Difference Vegetation Index (kNDVI) from 2000 to 2020. Our findings unveil pronounced asymmetric sensitivities, with stronger sensitivity to forest loss (-4.26 ± 0.14 × 10⁻³; TAC increase per 1% forest cover loss) than to forest gain (-1.65 ± 0.12 × 10⁻³; TAC decrease per 1% forest cover gain). Locally, approximately 73% of the boreal forest exhibits negative sensitivity, indicating enhanced resilience with forest cover gain and vice versa, especially in intact forests compared to managed ones. This sensitivity is affected by various trajectories in forest cover change, stemming primarily from temporal asynchrony in the recovery rates of various ecosystem functions. The observed asymmetry underscores the importance of prioritizing forest conservation over reactive management strategies following losses, ultimately contributing to more sustainable forest management practices.

How to cite: Liu, X.: Asymmetric sensitivity of boreal forest resilience to forest gain and loss, EGU General Assembly 2025, Vienna, Austria, 27 Apr–2 May 2025, EGU25-4801, https://doi.org/10.5194/egusphere-egu25-4801, 2025.

EGU25-6188 | ECS | Posters on site | BG9.1

Towards a more reliable GPP estimation: A systematic assessment of using the photochemical reflectance index as a proxy for non-photochemical quenching 

Lorenz Hänchen, David Martini, Karolina Sakowska, Mirco Migliavacca, Javier Pacheco-Labrador, Gregory Duveiller, Albin Hammerle, Marta Galvagno, Tomasso Julitta, Felix Spielmann, Shari Van Wittenberghe, and Georg Wohlfahrt

Resolving the global terrestrial CO2 budget remains a pressing challenge with implications for achieving internationally agreed emissions targets. To this end, remote sensing of solar-induced chlorophyll fluorescence (SIF) is rapidly advancing in accurately estimating gross primary productivity (GPP) on a global scale. While to this date, matching flux tower footprints with remote sensing data provides some insights, current satellite missions are constrained by insufficient spectral, spatial, or temporal resolution. However, this limitation is expected to be addressed to some extent by the European Space Agency's (ESA) upcoming Fluorescence Explorer (FLEX) mission.


Despite these technical aspects, the relationship between SIF and GPP under diverse environmental conditions remains complex because non-photochemical quenching (NPQ), which dissipates excess light energy, competes for the same energy pool that drives photosynthesis. The challenge of disentangling these processes is especially pronounced during periods of vegetation stress which is increasingly observed with higher frequency of extreme weather events.


To determine NPQ, the photochemical reflectance index (PRI) has been employed in case studies but systematic assessments across diverse ecosystems and environmental gradients are lacking. To address this, we investigate the SIF-GPP relationship using a comprehensive dataset consisting of Fluorescence Box (FloX) spectrometer and chlorophyll fluorometers (PAM) measurements at seven European flux tower sites, spanning five growing seasons. These sites represent a diverse range of plant functional types, including forests, managed grasslands, an agricultural field, and a savanna.
Our results indicate that while PRI can serve as a sensitive proxy for NPQ at individual sites, the relationship does not hold universally across sites. This variability is likely due to an inability to fully separate structural influences from physiological effects and differences in scale. However, an investigation of physiology-structure interactions is underway using data from a controlled mesocosm experiment together with SCOPE simulations.

How to cite: Hänchen, L., Martini, D., Sakowska, K., Migliavacca, M., Pacheco-Labrador, J., Duveiller, G., Hammerle, A., Galvagno, M., Julitta, T., Spielmann, F., Van Wittenberghe, S., and Wohlfahrt, G.: Towards a more reliable GPP estimation: A systematic assessment of using the photochemical reflectance index as a proxy for non-photochemical quenching, EGU General Assembly 2025, Vienna, Austria, 27 Apr–2 May 2025, EGU25-6188, https://doi.org/10.5194/egusphere-egu25-6188, 2025.

EGU25-6343 | ECS | Posters on site | BG9.1

Mapping the land cover of a Northern Sweden watershed using Sentinel-1 & 2 data and an optimized Random Forest 

Romain Carry, Yves Auda, Dominique Remy, Jonas Gustafsson, Oleg Pokrovski, Erik Lundin, Alexandre Bouvet, and Laurent Orgogozo

Due to accelerating global warming [1], the polar regions, and in particular the Arctic, are subject to many changes and cascading effects [2]. Northern lands are facing a generalized rise in soil temperature causing changes in the surface cover [3], the hydrological and mechanical state of the subsoil including permafrost thaw [4], [5] and potentially triggering massive release of greenhouse gases [6]. As land cover is a key control parameter for permafrost state, the survey of surface changes is of great importance. Consequently, monitoring the evolution of surface boreal ecosystems over large time scales, satellite imagery combined with reliable and proven methodologies is crucial for understanding the impact of climate change on polar continental regions. In this study, we use a Random Forest algorithm to analyze satellite images from the Copernicus (ESA) Sentinel-1 and Sentinel-2 programs in combination with ground truth data collected in July 2024, to monitor changes in the surface ecosystem over a 480 km² area in the Abisko region (Arctic Sweden). Random Forest method applied to features derived from satellite images allows the production of reliable land cover maps (>87% accuracy). Our results demonstrate that radar imagery is a vital source of information for overcoming the inherent limitations of optical imagery caused by frequent and dense cloud cover, particularly in summer, when average monthly cloud cover can reach up to 85% [7]. Additionally, they highlight that combining optical and radar imageries with a robust machine learning approach enables the production of high-quality land cover maps, providing significant added value for long term and high temporal resolution monitoring of land cover changes in northern continental regions.


[1]           P. M. Forster et al, ‘Indicators of Global Climate Change 2023: annual update of key indicators of the state of the climate system and human influence’, 2024

[2]           Intergovernmental Panel on Climate Change (IPCC), The Ocean and Cryosphere in a Changing Climate: Special Report of the Intergovernmental Panel on Climate Change, 2022

[3]           M. Wenzl et al, ‘Vegetation Changes in the Arctic: A Review of Earth Observation Applications’, 2024

[4]           E. J. Burke et al, ‘Evaluating permafrost physics in the Coupled Model Intercomparison Project 6 (CMIP6) models and their sensitivity to climate change’, 2020

[5]           T. Xavier et al, ‘Future permafrost degradation under climate change in a headwater catchment of central Siberia: quantitative assessment with a mechanistic modelling approach’, 2024

[6]           R. M. Varney et al, ‘Evaluation of soil carbon simulation in CMIP6 Earth system models’, 2022

[7]           J. E. Kay et al, ‘Recent Advances in Arctic Cloud and Climate Research’, 2016


How to cite: Carry, R., Auda, Y., Remy, D., Gustafsson, J., Pokrovski, O., Lundin, E., Bouvet, A., and Orgogozo, L.: Mapping the land cover of a Northern Sweden watershed using Sentinel-1 & 2 data and an optimized Random Forest, EGU General Assembly 2025, Vienna, Austria, 27 Apr–2 May 2025, EGU25-6343, https://doi.org/10.5194/egusphere-egu25-6343, 2025.

EGU25-9555 | Orals | BG9.1 | Highlight

What can we learn about biodiversity with remote sensing approaches? 

Maria J. Santos
With the ongoing and aggravating pressures on Earth System biodiversity and its processes, there is a need to design and deliver information required for monitoring and for process understanding across scales of space and time.  Among the emerging tools to address these global information requirements, Earth Observation (EO) data has been showing growing potential to provide products to inform about biodiversity and understand its interactions with society. In this talk, I will provide an overview of the history of remote sensing biodiversity products, which sensors and data types have and are emerging, which methods and considerations are needed in terms of measurement and uncertainty, and what is fundamental and needed to link remote sensing to in situ data to answer outstanding biodiversity science questions and deliver monitoring capacity. I will focus on looking forward, by providing examples on some of the outstanding questions in terms of understanding biodiversity processes, identifying the drivers of change and the interaction between biodiversity and society, and highlight potential avenues where remote sensing may contribute.
 

How to cite: Santos, M. J.: What can we learn about biodiversity with remote sensing approaches?, EGU General Assembly 2025, Vienna, Austria, 27 Apr–2 May 2025, EGU25-9555, https://doi.org/10.5194/egusphere-egu25-9555, 2025.

EGU25-9963 | Posters on site | BG9.1

Understanding Arctic Greening Trends: A Multispectral Approach to Shrubification and Ecological Shifts 

Elias Koivisto, Anton Kuzmin, Logan Berner, Bruce C Forbes, Jeff Kerby, Tiina Kolari, Pasi Korpelainen, Anna Skarin, Teemu Tahvanainen, Mariana Verdonen, Miguel Villoslada, and Timo Kumpula

The Arctic tundra vegetation is going through major changes as global warming alters atmospheric functions and weather patterns. These changes have been shown to affect for instance phenological patterns, plant community structures, herbivory patterns as well as carbon storage in biomass. Extensive remote sensing research with multispectral sensors has revealed significant greening trends and events as well as shrub expansion, also known as shrubification, across the Arctic. These trends have been hypothesized to counteract increases in carbon content in the atmosphere. However, the magnitude of this effect as well as the shrub expansion rates are still unanswered due to low data availability as well as topographic and phenological differences across the region. This research was conducted on the Yamal Peninsula in Russian Arctic, where, in addition to climate change, vegetation is strongly influenced by the reindeer grazing practiced by the indigenous Nenets reindeer herders, as well as the expanding gas and oil drilling activities, which are accompanied by extensive infrastructure development. In this study our aim is to assess the opportunities of multispectral remote sensing data with varying spatial and temporal resolutions to examine shrubification in ecologically complex Arctic landscapes. Our research questions are the following: 1) Do Landsat-derived vegetation indices from a 30-year timespan show significant amount of greening in Arctic Russia; 2) How does image availability and phenology affect the way greening trends are analyzed; 3) Has shrub height and area increased during the study period and what implications does reindeer grazing have for shrub expansion and plant community structures; 4) Are greening trends associated with increased shrub height and area.

Methodologically, we first extracted several vegetation indices from Landsat-satellite collections to evaluate greening trends. After satellite sensor cross-calibration with Random Forests, we examined how phenology and imaging frequency affects these trends and the analysis. We then compared the results with high-resolution QuickBird-2 and WorldView-2/3 imagery from 2004, 2013, 2017 and 2023. Secondly, we utilized drone imagery and VHR images to upscale vegetation height field data collected in 2017, and to delineate shrub areas with GeoSAM AI algorithm. In the last part, we created a classification with machine learning to estimate shrub expansion and height as well as change in community structure. Our preliminary results suggest that Landsat maximum vegetation indices have increased slightly across the entire study area. However, we also found a connection between image availability and the amount of greening detected. In addition, we found that shrub area and height has increased during the study period which could potentially benefit herbivore grazing activity. We therefore suggest coupling plant community changes with herbivore dynamics in the future studies on shrubification in the Arctic tundra.

How to cite: Koivisto, E., Kuzmin, A., Berner, L., Forbes, B. C., Kerby, J., Kolari, T., Korpelainen, P., Skarin, A., Tahvanainen, T., Verdonen, M., Villoslada, M., and Kumpula, T.: Understanding Arctic Greening Trends: A Multispectral Approach to Shrubification and Ecological Shifts, EGU General Assembly 2025, Vienna, Austria, 27 Apr–2 May 2025, EGU25-9963, https://doi.org/10.5194/egusphere-egu25-9963, 2025.

EGU25-12085 | Orals | BG9.1

Seasonal and Diurnal Dynamics of Sun-Induced Fluorescence and Photosynthesis in Fagus sylvatica and Tilia cordata. 

Sebastian Wieneke, Gregory Duveiller, Teja Kattenborn, Javier Pacheco-Labrador, Ronny Richter, Christian Wirth, and Miguel D. Mahecha

Sun-Induced chlorophyll Fluorescence (SIF) is an emerging and promising remote sensing signal for monitoring photosynthetic activity across spatial and temporal scales. SIF offers insights into the functionality of photosystems, particularly through the quantum yield of fluorescence (ΦF), which encodes information on dynamic photosynthetic adaptations to ambient environmental conditions. However, interpreting plant physiology from top of the canopy SIF under stress conditions is aggravated by changes and differences in plant structure (e.g. leaf angle), and environmental conditions (e.g. heat, drought). These interacting processes must be disentangled in order to use the  SIF signal as a robust proxy for photosynthesis. 

During the growing season of 2022, we conducted continuous measurements of top of canopy SIF and reflectance factors, leaf electron transport rate, leaf angle, and meteorological conditions for two temperate tree species: European beech (Fagus sylvatica L.) and small-leaved lime (Tilia cordata MILL.). We characterized the seasonal and diurnal dynamics of SIF, ΦF, and associated photosynthetic parameters while analyzing the effect of structural and physiological changes.

Our findings highlight distinct differences in the diurnal SIF dynamics between Fagus sylvatica and Tilia cordata, particularly under heat and drought conditions. These differences, such as variations in the timing of peak emission, underscore the potential for individual- or species-specific variations in photosynthetic performance and the interpretation of fluorescence signals. By analyzing the influence of canopy structure, light distribution, and environmental factors on these dynamics, we improve our understanding of the relationship between SIF and photosynthesis. We will provide critical insights into its interpretation under varying stress conditions and discuss the remaining challenges in transforming SIF into a robust tool for monitoring plant physiological states across different scales.

How to cite: Wieneke, S., Duveiller, G., Kattenborn, T., Pacheco-Labrador, J., Richter, R., Wirth, C., and Mahecha, M. D.: Seasonal and Diurnal Dynamics of Sun-Induced Fluorescence and Photosynthesis in Fagus sylvatica and Tilia cordata., EGU General Assembly 2025, Vienna, Austria, 27 Apr–2 May 2025, EGU25-12085, https://doi.org/10.5194/egusphere-egu25-12085, 2025.

EGU25-12323 | ECS | Orals | BG9.1

Assessing C-band SAR-based VOD in forest ecosystems using physical scattering models 

Florian M. Hellwig, Thomas Jagdhuber, François Jonard, Anke Fluhrer, Konstantin Schellenberg, Markus Zehner, Thomas Weiß, David Chaparro, Clémence Dubois, Paul Vermunt, Moritz Link, Simon De Cannière, Johanna Kranz, Matthias Forkel, Jan Bliefernicht, and Harald Kunstmann

The dynamics of water, biomass, and structure of forest ecosystems are challenging to assess on larger spatio-temporal scales with ground-based measurement techniques, particularly beyond individual tree stands. Here, satellite-based remote sensing provides solutions to enhance these assessments.

Vegetation optical depth (VOD) is a remote sensing variable that measures the attenuation of microwaves by vegetation. The VOD signal contains information on dry biomass, structure, and water content of vegetation. These signal components can be disentangled using microwave scattering or emission models, depending on active or passive acquisition modes. Short-term variations in VOD time series primarily reflect water dynamics, while seasonal changes are associated with biomass variations. VOD is operationally retrieved globally, with a temporal revisit of 1-to-3 days, from passive satellite sensors like AMSR-2, SMAP, and SMOS, acquiring at a relatively coarse spatial resolution (~40 km) with enhanced interpolations providing ~10 km gridding products. Thus, coarse resolution limits studying forest stands at local scales with passive microwave techniques.

This study aims to estimate spatially high-resolution Synthetic Aperture Radar (SAR)-based VOD in forest ecosystems based on Sentinel-1 C-band (5.504 GHz) backscatter data (10 m) from March to September 2023 in Germany. The focus is on two primary study sites, characterized by a deciduous broadleaf ("Leinefelde") and an evergreen needleleaf forest ("Wetzstein"), contrasting the most common forest types in Central Europe.

Regarding the methodology, we disentangle C-band VOD in its core components to derive the water content of the upper tree canopy, where the C-band is most sensitive due to microwave penetration capabilities. For this purpose, we employ a combination of physically-based soil and vegetation scattering models (radiative transfer theory). Moreover, we compare our resulting SAR-based VOD time series, among others, against VOD estimates derived from Global Navigation Satellite System-Transmissometry (GNSS-T) at L-band (1.1-1.5 GHz), using in situ receivers, one at the top of the canopy and one on the ground. We further plan to validate our approach with in situ plant gravimetric moisture content (mg; [kgwater/kgwet biomass]) measurements of the tree canopy for both forest sites. Finally, our approach paves the way for further application in agriculture. This will be explored in the new Land-Atmosphere Feedback Initiative (LAFI) in detail.

Retrieved satellite-based VOD at such high spatial resolution allows for small-scale up to stand-based analyses of forest water dynamics, biomass changes, and leaf water potential variations. Consequently, these SAR-based VOD dynamics hold potential for monitoring forest health, detecting drought and water stress as well as assessing plant phenology, biomass, and carbon storage.

How to cite: Hellwig, F. M., Jagdhuber, T., Jonard, F., Fluhrer, A., Schellenberg, K., Zehner, M., Weiß, T., Chaparro, D., Dubois, C., Vermunt, P., Link, M., De Cannière, S., Kranz, J., Forkel, M., Bliefernicht, J., and Kunstmann, H.: Assessing C-band SAR-based VOD in forest ecosystems using physical scattering models, EGU General Assembly 2025, Vienna, Austria, 27 Apr–2 May 2025, EGU25-12323, https://doi.org/10.5194/egusphere-egu25-12323, 2025.

EGU25-12425 | ECS | Posters on site | BG9.1

Three-dimensional Habitat Characterisation for European Forest Bats Using High-resolution Point Clouds  

Lea Dammert, Marcela Suarez-Rubio, and Reuma Arav

The loss of biodiversity has been recorded globally at unprecedented rates. Among the various organisms under threat are the European forest dwelling bats, which experienced a significant population decline. One of the causes of this decline is the alteration and destruction of their habitat. To understand how bats interact with forests, a detailed characterisation of their habitat can help target conservation efforts. The common habitat characterisation approach in forests is to carry out field surveys. During these surveys the forest is visually described by qualitative indices of complexity and structure. This detailed surveying requires extensive time investment and highly depends on the field crew who conducts the survey. Naturally, an observer bias is inevitable. Some characteristic parameters, like the volume of gaps or foliage density, cannot be determined by conventional measuring approaches.

In recent years, LiDAR-based 3D point clouds are increasingly used to characterise habitats.  In forest environments, different vegetation density and layering, as well as the changing terrain, make the point cloud-based characterisation particularly challenging. Existing approaches resort to 2.5D raster data, disregarding the full potential of the three-dimensionality that point clouds provide. Given that bat species utilise both tree crowns and the ground, such information is of the utmost importance.

In this work, we present a full 3D point cloud analysis for forest habitats. We quantitatively characterise the habitat and provide a characterisation approach for complex environments. By analysing the acquired point cloud in 3D, we infer the forest structure as a whole. Such a characterisation allows us to assess how much area is potentially used by bats for flying and foraging. The quantitative nature of the characterisation enables the comparison between vegetation structures in different forest stands.

We demonstrate the proposed characterisation on different forest stand types, i.e., beech and mixed forests, in the Vienna Biosphere Reserve. Designated areas were captured with a handheld mobile laser scanner. We show that both for dense and sparse stands the proposed characterisation approach was successfully applied. Therefore, our analysis can be applied to all forested ecosystems, encompassing orchards as well as avenues. The analysis is performed in R and is easy to use. In this way, we can establish better conservation strategies for endangered forest species worldwide.

How to cite: Dammert, L., Suarez-Rubio, M., and Arav, R.: Three-dimensional Habitat Characterisation for European Forest Bats Using High-resolution Point Clouds , EGU General Assembly 2025, Vienna, Austria, 27 Apr–2 May 2025, EGU25-12425, https://doi.org/10.5194/egusphere-egu25-12425, 2025.

The accurate assessment of vegetation phenology, i.e. the seasonal changes in plant development status, is a critical step for the study of ecosystems’ performance and their response to the ongoing climate change. Satellite products have been used for a quite long time for this purpose, frequently with the combination of data from eddy flux towers. In recent years, the use of digital photography from properly parameterized cameras (phenology cameras), has been introduced as a very promising low-cost methodology for precise monitoring of vegetation phenology.

In this study, we provide an assessment of vegetation phenology for a five-year period (2019 – 2024) of a black locust plantation, located in the restored areas of the Lignite Center of Western Macedonia, Greece. During the study period, repeated RGB images in half – hourly time steps were automatically taken with the use of a phenology camera installed on the top of an eddy flux tower in the study site and timeseries of the Green Chromatic Coordinate (GCC) index were extracted. Furthermore, for the same period, high resolution Sentinel 2 satellite products were used for the estimation of four commonly used vegetation indices (NDVI, EVI, LSWI and SAVI). Finally, carbon flux phenology was assessed from the respective measurements of the eddy flux tower.

Our results indicate that the use of phenology cameras can provide an explicit representation of vegetation phenology and estimation of the respective phenological indices (start, end, peak and length of the growing season). GCC is well correlated with all the studied satellite vegetation indices, however it provides the advantage of the continuous measurements, as the results are not affected by the weather conditions, in contrary to satellite products.  Additionally, it can be used for the distinction of overstory and understory vegetation phenological status, which is very critical especially in deciduous ecosystems, but it cannot be assessed with the use of satellite products. Furthermore, it can provide valuable information for other phenological parameters, such as the start and length of the blooming period, which is also difficult to assess by other methods. Concerning the representation of carbon flux, GCC does not seem to provide any further direct advantages compared to satellite vegetation indices, however the ability of the distinction of understory and overstory vegetation phenology can provide other benefits, such as the more efficient parameterization of productivity models.

How to cite: Markos, N. and Radoglou, K.: Tracking vegetation phenology for a deciduous black locust plantation with the use of a phenology camera, satellite vegetation indices and eddy flux measurements – advantages and limitations, EGU General Assembly 2025, Vienna, Austria, 27 Apr–2 May 2025, EGU25-12849, https://doi.org/10.5194/egusphere-egu25-12849, 2025.

EGU25-13639 | Posters on site | BG9.1

The Biodiversity Observing System Simulation Experiment (BOSSE) v1.0 

Javier Pacheco-Labrador, Ulisse Gomarasca, Gregory Duveiller, Daniel E. Pabon-Moreno, Wantong Li, Ulrich Weber, Martin Jung, and Mirco Migliavacca

The Observing System Simulation Experiments are simulation tools that support the development, benchmarking, and evaluation of remote sensing missions and methods. The study of biodiversity, from remote sensing, and particularly that of plant diversity,  is an emerging topic with potentially beneficial outcomes for global-scale monitoring and conservation. However, advances in this field are limited by insufficient systematic, standardized, and global field datasets that enable a comprehensive linkage of the plant diversity aspects with the variability of the spectral signals captured by remote sensing instruments. This typically makes the findings site- and method-dependent, preventing the validation of new methods in a sufficiently wide range of ecosystems, seasons, and vegetation types. Pioneering modelling works have proven as valuable tools to answer methodological questions, screen potentially reliable methods, detect spuriousness, and identify strengths and limitations of remote sensing to infer plant diversity. However, these simulations have been develop using simplistic assumptions so far.

Here, we present the Biodiversity Observing System Simulation Experiment (BOSSE) v1.0, a simulation tool able to represent vegetation taxonomy and functional traits and a wide range of physically linked spectral signals and ecosystem functions in space and time. BOSSE simulates maps of vegetation species and their (functional) traits that evolve in time as a function of biometeorological drivers. From these dynamic scenes, BOSSE can simulate hyperspectral reflectance factors, sun-induced chlorophyll fluorescence, land surface temperature, and provide estimates of plant functional traits based on these signals. BOSSE can simulate observations of varying spectral configurations and spatial and temporal resolutions, mimicking current and future remote sensing missions. Remote sensing imagery can be generated with an hourly temporal resolution, and the spatial resolution can be degraded to assess the impact of this feature in the estimation of plant diversity. Ecosystem functions (mainly related to carbon, water, and energy fluxes) can be generated at hourly steps to develop robust methods that allow for testing the variability of biodiversity-ecosystem function (BEF) relationships, which is still an open question in ecological research.

BOSSE is an open-source Python model that we make available to the community to support the development of new remote sensing-based biodiversity products and assess the role of biodiversity in ecosystem functions. Moreover, it could also be useful to address other methodological questions regarding the study of vegetation. BOSSE does not aim to substitute the still-necessary observational data and studies but to support their design and interpretation.

How to cite: Pacheco-Labrador, J., Gomarasca, U., Duveiller, G., Pabon-Moreno, D. E., Li, W., Weber, U., Jung, M., and Migliavacca, M.: The Biodiversity Observing System Simulation Experiment (BOSSE) v1.0, EGU General Assembly 2025, Vienna, Austria, 27 Apr–2 May 2025, EGU25-13639, https://doi.org/10.5194/egusphere-egu25-13639, 2025.

EGU25-14011 | Orals | BG9.1

Detection of forest understory evergreen trees in a deciduous forest using UAV-LiDAR and RGB data during the deciduous period 

Yayoi Takeuchi, Hibiki Noda, Habura Borjigin, Hiroko Kurokawa, Michio Oguro, Mitsue Shibata, and Tohru Nakashizuka

Forest ecosystems play a critical role in maintaining key ecosystem services and functions. However, the impacts of climate change have become apparent in recent years. Long-term forest observation data suggest that deciduous forests are being replaced by evergreen tree species, potentially as a result of climate change. Detecting such ecosystem changes at an early stage is crucial for assessing the impacts of climate change and implementing effective management. In this study, we aim to develop a method for identifying evergreen trees in deciduous broadleaf forests where the effects of climate change are becoming apparent. Specifically, we employed cost-effective and efficient UAV-LiDAR technology. By focusing on the deciduous season, we effectively enhanced the detection of evergreen trees, as their presence becomes more distinguishable during this period.

The study was conducted in a 6-hectare plot within the deciduous broadleaf forests of the Ogawa Forest Reserve in Japan, a site where long-term forest monitoring has been conducted. This site harbors Pieris japonica subsp. japonica (hereafter, PJ), an evergreen shrub that has shown an increase in recent years. Other species that retain green leaves during the deciduous season, such as dwarf bamboo (Sasa) and epiphytic plants, are also present. To ensure effective detection of PJ, we first stratified the acquired LiDAR data into different canopy layers (upper canopy trees and multiple understory layers). We then determined the required point density for rational segmentation of PJ. Using RGB data, we extracted "green" points for each canopy layer. This method effectively excluded dwarf bamboo and epiphytic plants, enabling the accurate extraction of PJ. The study demonstrated that combining UAV-LiDAR with RGB data is highly effective for identifying understory evergreen trees. This approach facilitates the extraction of "green" objects by canopy layer in deciduous forests during the deciduous season. This method would be not only efficient for detecting forest changes but also applicable to identifying invasive species and enhancing forest management practices.

How to cite: Takeuchi, Y., Noda, H., Borjigin, H., Kurokawa, H., Oguro, M., Shibata, M., and Nakashizuka, T.: Detection of forest understory evergreen trees in a deciduous forest using UAV-LiDAR and RGB data during the deciduous period, EGU General Assembly 2025, Vienna, Austria, 27 Apr–2 May 2025, EGU25-14011, https://doi.org/10.5194/egusphere-egu25-14011, 2025.

EGU25-14924 | ECS | Posters on site | BG9.1

Spectral Band Adjustment and Data Fusion of Multiple Third-Generation Geostationary Satellites: Toward Hyper-Temporal Monitoring of the Biosphere 

Taiga Sasagawa, Kazuhito Ichii, Yuhei Yamamoto, Tomoaki Miura, Wei Yang, Masayuki Matsuoka, Hiroki Yoshioka, Weile Wang, Hirofumi Hashimoto, and Kenlo Nasahara

Satellite remote sensing with the third-generation geostationary satellites has recently gained significant attention. These satellites provide hyper-temporal datasets, enabling the mitigation of cloud contamination effects and the observation of diurnal changes in targets, in contrast to polar-orbiting satellites. Currently, several third-generation geostationary satellites, such as the Japanese Himawari series, the US GOES series, the Korean GK2A, the Chinese FY4 series, and the European MTG1, have been under operation, and their datasets are available. In contrast with polar-orbiting satellites, geostationary satellites cover the limited areas of the Earth due to orbital constraints. Consequently, collaboration among multiple geostationary satellites is required to cover the Earth comprehensively. For this collaboration involving satellites with different sensors, spectral band adjustments among sensors and subsequent data fusion based on these adjustments are indispensable. In this study, spectral band adjustments and data fusion were performed using band simulations with hyperspectral data from satellites, in situ observations, and a 3-D radiative transfer model. The spectral band adjustments and data fusion focused on the visible and near-infrared regions, which are critical for terrestrial ecosystem monitoring, including vegetation monitoring. Our simulations revealed linear relationships in the visible and near-infrared regions among the bands of each sensor after specific mathematical processes. Additionally, experimental data fusion using actual geostationary satellite datasets demonstrated the success of our spectral band adjustment approach. These results suggest that the proposed method can significantly contribute to environmental monitoring with third-generation geostationary satellites, mainly observation of the terrestrial ecosystem. Further research, such as applications for terrestrial vegetation monitoring, is anticipated.

How to cite: Sasagawa, T., Ichii, K., Yamamoto, Y., Miura, T., Yang, W., Matsuoka, M., Yoshioka, H., Wang, W., Hashimoto, H., and Nasahara, K.: Spectral Band Adjustment and Data Fusion of Multiple Third-Generation Geostationary Satellites: Toward Hyper-Temporal Monitoring of the Biosphere, EGU General Assembly 2025, Vienna, Austria, 27 Apr–2 May 2025, EGU25-14924, https://doi.org/10.5194/egusphere-egu25-14924, 2025.

EGU25-16181 | Orals | BG9.1

Addressing degradation and geometry effects to develop consistent global solar induced fluorescence records from GOME-2A and GOME-2B (2007-2023) 

Juliette Anema, Klaas Folkert Boersma, Gijsbert Tilstra, Ruben van 't Loo, Willem Verstraeten, and Olaf Tuinder

Space-based solar-induced fluorescence (SIF) observations provide critical insights into vegetation activity over time. The GOME-2A and GOME-2B instruments offer extensive global SIF data spanning 2007 to 2023. However, calibration issues and instrument degradation have complicated the generation of consistent long-term records. Combining SIF products with differing viewing geometries and spatio-temporal coverage remains challenging, even for similar satellite instruments GOME-2A and GOME-2B.

We present the SIFTER v3 algorithm, developed to deliver a more accurate and reliable SIF record for the 2007–2023 period. Using newly reprocessed level-1b R3 data from EUMETSAT ensures SIFTER v3 processes the GOME-2A and GOME-2B retrievals with consistent calibration settings. Despite the improvements in R3 reflectances, additional corrections for long-term degradation in the 734–758 nm retrieval window are necessary for both GOME-2A and GOME-2B. This concerns in-flight corrections that address time, wavelength, and scan-angle dependent reflectance degradation. 

After applying these corrections, the SIFTER v3 dataset exhibits enhanced consistency, aligning closely with NASA GOME-2A data and GPP estimates from FluxSat and FLUXCOM-X. To produce a coherent SIF record suitable for climate analysis, the algorithm addresses (1) spatio-temporal sampling differences and (2) viewing geometry dependencies. Co-sampling GOME-2A and GOME-2B significantly improves consistency and reduces inter-sensor SIF offsets by up to 15%. Notably, we demonstrate that GOME-2 measures up to 30% higher SIF in the orbit’s western regions, where vegetation is sunlit, compared to shaded vegetation in the east. By quantifying these geometry effects across regions and seasons, we propose corrections to make level-2 SIF data suitable for daily applications.

How to cite: Anema, J., Boersma, K. F., Tilstra, G., van 't Loo, R., Verstraeten, W., and Tuinder, O.: Addressing degradation and geometry effects to develop consistent global solar induced fluorescence records from GOME-2A and GOME-2B (2007-2023), EGU General Assembly 2025, Vienna, Austria, 27 Apr–2 May 2025, EGU25-16181, https://doi.org/10.5194/egusphere-egu25-16181, 2025.

EGU25-16697 | ECS | Orals | BG9.1

Hyperspectral imagery, LiDAR point clouds, and environmental DNA to assess land-water linkage of biodiversity across aquatic functional feeding groups 

Heng Zhang, Carmen Meiller, Andreas Hueni, Rosetta Blackman, Felix Morsdorf, Isabelle Helfenstein, Michael Schaepman, and Florian Altermatt

Functional feeding groups (FFGs) are key components sustaining ecosystem functioning in riverine ecosystems. Their distribution and diversity are tightly associated with surrounding terrestrial landscape through land-water linkages. Nevertheless, knowledge about the spatial extent and magnitude of these cross-ecosystem linkages within major FFGs still remains unclear. Here, we conducted an airborne imaging spectroscopy campaign and a systematic environmental DNA (eDNA) field sampling of river water in a 740-km2 mountainous catchment, combined with light detection and ranging (LiDAR) point clouds, to obtain the spectral and morphological diversity of terrestrial landscape and the diversity of major FFGs in rivers. We identified the scale of these linkages ranging from a few hundred meters to more than 10 km, with collectors and filterers, shredders, and small invertebrate predators having local-scale association, while invertebrate eating fish, grazers and scrapers having more regional-scale associations. Among all major FFGs, shredders, grazers and scrapers in the streams had the strongest association with surrounding terrestrial vegetation. Our research reveals the reference spatial scales at which major FFGs are in relation to surrounding terrestrial landscape, providing spatially explicit evidence of the cross-ecosystem linkages needed for conservation design and management.

How to cite: Zhang, H., Meiller, C., Hueni, A., Blackman, R., Morsdorf, F., Helfenstein, I., Schaepman, M., and Altermatt, F.: Hyperspectral imagery, LiDAR point clouds, and environmental DNA to assess land-water linkage of biodiversity across aquatic functional feeding groups, EGU General Assembly 2025, Vienna, Austria, 27 Apr–2 May 2025, EGU25-16697, https://doi.org/10.5194/egusphere-egu25-16697, 2025.

EGU25-17682 | Posters on site | BG9.1

Forest Assembly and Species Composition with AI and Earth Observation Data, a scalable approach 

Sergio Noce, Valeria Aloisi, Lorenzo Arcidiaco, Francesco Boscutti, Cristina Cipriano, Alessandro D'Anca, Italo Epicoco, Donatella Spano, Adriana Torelli, Piero Turrà, and Simone Mereu

An accurate spatial distribution of forest species composition is essential for biodiversity monitoring, management and protection. Combining this information with field structural metrics (e.g., basal area, species co-occurrences, canopy height) significantly improves our ability to estimate ecosystem functions and understand their relationship with biodiversity. These insights are crucial for regional biodiversity assessments, territorial planning, and forest management, contributing directly to nature conservation. A geospatial approach is particularly valuable when studying forest biodiversity dynamics, as it allows for the analysis of species composition and interactions within a community-based framework.

Recent advancements in high spatial resolution remote sensing have shown the effectiveness of machine learning algorithms, with rapid progress driven by developments in artificial intelligence. The integration of remote sensing data with AI-based methods has proven useful. In our study, we leverage Earth Observation (EO) data derived from Sentinel-2 satellite imagery, including maximum, minimum, median, and near-extremes percentiles of the NDVI and its standard deviation as a key index of forest canopy, density, health and irregularity. We also incorporate Sentinel-2 canopy height derived data, which is essential for understanding forest structure and vertical stratification. These combined metrics provide a comprehensive understanding of vegetation phenology and heterogeneity, supporting more accurate assessments of forest composition and structure.

Field data for this study are derived from forest inventory datasets, serving as the foundation for calibrating and validating the models, enabling precise estimations of species composition, basal area, and other structural parameters critical to biodiversity monitoring.

Mechanistic species distribution models (SDMs) and community assembly (JSDMs) models have driven substantial advancements in biodiversity research, offering insights into environmental filtering and competitive dynamics within ecosystems. In this study, we present a hybrid geospatial approach that combines SDM — specifically, Hierarchical Modeling of Species Communities — with AI algorithms to map forest species composition, relative abundance, and basal area across Italy. This approach is crucial for applications in biodiversity conservation and forest management, enabling more informed decision-making for land and forest management.

Our hybrid framework integrates EO-derived features from Sentinel-2 (e.g., canopy height, NDVI metrics) with pedological and bioclimatic variables, functional traits, Community Weighted Means, Functional Dispersion Index, and phylogenetic distances. By modeling these variables, we aim to capture the complex interrelations between forest species and their environment. To further enhance interpretability, we employ a Machine Learning algorithm based on association rule learning,

The integration of remote sensing data and AI methodologies, combined with field inventory datasets, can provide a powerful tool for biodiversity research and forest management. The incorporation of field data ensures the accurate calibration and validation of models, improving the reliability of predictions. This geospatial approach, leveraging Sentinel-2 EO data, not only advances our capacity to monitor species distributions but also contributes to understanding forest ecosystem dynamics in the context of nature conservation. By bridging remote sensing, AI, and field data, we offer a comprehensive framework to address the multifaceted challenges in biodiversity, ecosystem services, and sustainable land management.

How to cite: Noce, S., Aloisi, V., Arcidiaco, L., Boscutti, F., Cipriano, C., D'Anca, A., Epicoco, I., Spano, D., Torelli, A., Turrà, P., and Mereu, S.: Forest Assembly and Species Composition with AI and Earth Observation Data, a scalable approach, EGU General Assembly 2025, Vienna, Austria, 27 Apr–2 May 2025, EGU25-17682, https://doi.org/10.5194/egusphere-egu25-17682, 2025.

EGU25-18238 | Posters on site | BG9.1

Automated detection of wild plant indicators in agricultural fields: Integrating UAV technology and deep learning for result-based payments 

Caterina Barrasso, Robert Krüger, Anette Eltner, and Anna Cord

The decline of wild plant species across European agricultural landscapes threatens biodiversity and vital ecosystem functions. While result-based payments to farmers show promise for species conservation, implementing such programs has been hindered by the high costs of traditional biodiversity monitoring. Our study explored a novel solution using uncrewed aerial vehicles (UAVs) equipped with an RGB camera and deep learning technology to efficiently detect and monitor these important plant species.

We conducted our research across four winter barley fields in Germany under different management intensities. Using the YOLO deep learning model, we analysed UAV imagery to detect segetal flora species across multiple flight altitudes. To validate and enhance our detection methodology, we collected detailed field measurements of plant traits and species coverage, and investigated whether spatial co-occurrence patterns and canopy height variations could help predict the presence of species that are challenging to detect from aerial imagery.

Our findings revealed that UAV-based monitoring could successfully detect 50% of the observed species on-site, with optimal results achieved for developing manual annotations at a ground sampling distance of 1.22mm. Plant height emerged as a crucial factor in detection success, with detection probability increasing with plant height. Based on the trait analysis, we projected similar detection success rates for key indicator species not present in our study area. The YOLO models showed accuracy rates vary between 49% to 100% depending on the management type, and performed effectively at a flight height of 40m enabling rapid field surveys that required only eight minutes per hectare. Notably, we found that both the spatial co-occurrence with easily detectable species and variations in canopy height structure showed potential as predictors for the presence of harder-to-detect species. While these findings are promising, additional research is needed to validate these relationships across broader landscape scales.

This study demonstrates the feasibility of implementing large-scale, cost-effective monitoring of wild plant indicators in agricultural settings. Our results provide a foundation for developing sophisticated 'smart indicators' for future biodiversity monitoring practices. This technological approach could make result-based conservation payments more practical and widespread, ultimately supporting the preservation of vital plant species in agricultural ecosystems.

How to cite: Barrasso, C., Krüger, R., Eltner, A., and Cord, A.: Automated detection of wild plant indicators in agricultural fields: Integrating UAV technology and deep learning for result-based payments, EGU General Assembly 2025, Vienna, Austria, 27 Apr–2 May 2025, EGU25-18238, https://doi.org/10.5194/egusphere-egu25-18238, 2025.

Evapotranspiration (ET) and Gross Primary Productivity (GPP) are fundamental variables on land surfaces, and are important for understanding the response of vegetation and land surfaces to extreme weather. In particular, third-generation geostationary meteorological satellites such as Himawari-8/9 are effective for land monitoring, as they include observations of wavelength bands including visible and near-infrared light every 10 minutes. In addition, if geostationary meteorological satellites are used, monitoring with high temporal resolution such as 30 minutes can be done in quasi-real time. In this study, we attempted to monitor GPP and ET in the Asia-Oceania region using data from geostationary meteorological satellites, Himawari-8 and 9. We used the EC-LUE model for GPP and the PT-JPL model for ET, and verified the results using flux observation sites in Asia and Oceania. We also used data from Himawari-8/9, including solar radiation, surface temperature, surface reflectance, and albedo. This method can estimate GPP and ET in the Asia-Oceania region every 30 minutes, and it can reproduce observation well. In addition, the spatial outputs can be used to monitor vegetation changes during heat waves and dry events. Although each geostationary satellite observes a fixed hemisphere, combining data from multiple geostationary satellites can be used to develop high-frequency global observations.

How to cite: Ichii, K., Yamamoto, Y., Zhang, B., Li, W., and Sumii, S.: A hyper-temporal monitoring of terrestrial gross primary productivity and evapotranspiration across Asia-Oceania using third generation geostationary satellites, Himawari-8/9, EGU General Assembly 2025, Vienna, Austria, 27 Apr–2 May 2025, EGU25-18265, https://doi.org/10.5194/egusphere-egu25-18265, 2025.

Water-use strategies in arid regions operate across multiple scales, from individual plants to entire ecosystems, shaped by responses to drought. This Perspective contrasts isohydric and anisohydric strategies and introduces the ecological concept for the "long-distance interactions" and "structural overshoot," where ecosystems exceed their water-use capacity during prolonged droughts. We propose scalable vegetation cover indicators, such as fractional vegetation and biocrust cover, to monitor these dynamics. We also discuss the potential applications of plant water sources, biomass allocation, and functional traits in understanding arid ecosystems. By integrating remote sensing technologies with these indicators, we emphasize the need for advanced drought monitoring tools to enhance plant resilience, optimize water resource management, and improve our understanding of adaptive strategies in arid landscapes.

How to cite: xu, M.: Remote sensing for monitoring plant Water-Use Strategies across scales in Arid Ecosystems, EGU General Assembly 2025, Vienna, Austria, 27 Apr–2 May 2025, EGU25-19692, https://doi.org/10.5194/egusphere-egu25-19692, 2025.

The term "invasive noxious weed species” (INWS), which refers to noxious weed plants that invade native alpine grasslands, has increasingly become an ecological and economic threat in the alpine grassland ecosystem of the Qinghai-Tibetan Plateau (QTP). Both the INWS and native grass species are small in physical size and share a habitat. Using remote sensing data to distinguish INWS from native alpine grass species remains a challenge. High spatial resolution hyperspectral imagery provides an alternative for addressing this problem. Here, we explored the use of unmanned aerial vehicle (UAV) hyperspectral imagery and deep learning methods with a small sample size for mapping the INWS in mixed alpine grasslands. To assess the method, UAV hyperspectral data with a very high spatial resolution of 2 cm were collected from the study site, and a novel convolutional neural network (CNN) model called 3D&2D-INWS-CNN was developed to take full advantage of the rich information provided by the imagery. The results indicate that the proposed 3D&2D-INWS-CNN model applied to the collected imagery for mapping INWS and native species with small ground truth training samples is robust and sufficient, with an overall classification accuracy exceeding 95% and a kappa value of 98.67%. The F1 score for each native species and INWS ranged from 92% to 99%. In conclusion, our results highlight the potential of using very high spatial resolution UAV hyperspectral data combined with a state-of-the-art deep learning model for INWS mapping even with small training samples in degraded alpine grassland ecosystems. Studies such as ours can aid the development of invasive species management practices and provide more data for decision-making in controlling the spread of invasive species in similar grassland ecosystems or, more widely, in terrestrial ecosystems.

How to cite: Xing, F., An, R., Guo, X., and Shen, X.: Mapping invasive noxious weed species in the alpine grassland ecosystems using very high spatial resolution UAV hyperspectral imagery and a novel deep learning model, EGU General Assembly 2025, Vienna, Austria, 27 Apr–2 May 2025, EGU25-20351, https://doi.org/10.5194/egusphere-egu25-20351, 2025.

EGU25-20947 | Posters on site | BG9.1

A deep learning approach with dense time series imagery of PlanetScope for alpine wetland plant diversity mapping 

Ran Meng, Ping Zhao, Binyuan Xu, Jin Wu, Feng Zhao, Yanyan Shen, and Jie Liu

Dynamic monitoring of biodiversity in alpine wetlands is critical for addressing the threats posed by global climate change and species invasions. Comparing with expensive airborne hyperspectral measurement for limited spatial coverage, satellite multispectral data with high spatial and temporal resolutions (e.g., PlanetScope) provides an efficient alternative for monitoring wetland plant diversity (WPD). However, the capabilities of PlanetScope dense time series data for mapping plant diversity in alpine wetland landscapes remain unexplored. Here, with dense time-series PlanetScope data, we developed a novel network, called Self-Attention Wetland Plant Diversity Network (SAWPD-Net) for mapping plant diversity in Shennongjia Alpine Wetlands, one of global hotspots of wetland biodiversity. Additionally, the performances of a series of AI algorithms, including Self-Attention Wetland Plant Diversity Network (SAWPD-Net), Transformer, Long Short-Term Memory (LSTM), Recurrent Neural Network (RNN), and Random Forest (RF), were compared at different spatial and temporal resolutions with PlanetScope data. The results showed that: (1) Compared with other methods, our proposed SAWPD-Net achieved higher mapping accuracy at fine spatial resolution(9m × 9m ; R² = 0.57 ~ 0.72, RMSE = 0.24 ~ 0.19 ); RF achieved the highest mapping accuracy  with a temporal resolution of 1-day and a spatial resolution of 21m × 21m ( R² = 0.75, RMSE = 0.18 ); (2) WPD mapping accuracy is linearly correlated with the temporal resolution of the input data: when the temporal resolution increased from 120-day to 1-day, the R² of SAWPD-Net increased by 26.3%, while the RMSE decreased by 20.8%. This study uncovers the potential of high-resolution multispectral satellites and AI algorithms for tracking WPD dynamics, which can be vital for developing a new generation of global biodiversity monitoring networks.

How to cite: Meng, R., Zhao, P., Xu, B., Wu, J., Zhao, F., Shen, Y., and Liu, J.: A deep learning approach with dense time series imagery of PlanetScope for alpine wetland plant diversity mapping, EGU General Assembly 2025, Vienna, Austria, 27 Apr–2 May 2025, EGU25-20947, https://doi.org/10.5194/egusphere-egu25-20947, 2025.

Considering Arctic-Antarctic (North-South) carbon dioxide (CO2) dynamics over time, one can see a ripple of a Vegetation Signal [VRi] on an increasing baseline trend [BTr]. The VRi gradually disappears when moving southwards (towards the Antarctic). It is observed in CDIAC data that the [VRi], superposed on an increasing CO2 baseline trend increase disappears when traveling southwards. How so?

The observation is intuitively obvious, since the Northern hemisphere contains approximately 68% of the Earth's landmass and is home to about 90% of the global population. In contrast the Southern hemisphere is left with 32% landmass and a tiny 10% of the global population. Due to these differences in landmass and population, the North South dynamics of carbon dioxide mixing ratios is primarily determined by the differences in vegetation density, human population density, and atmospheric circulation patterns, including a variety of factors of less impact on atmospheric CO2 dynamics.

More sources of CO2 in the Northern hemisphere determine the global CO2 trend line over time on the condition that the atmosphere is well mixed in a short time interval. The Intertropical Convergence Zone (ITCZ)  acts as a barrier to the mixing of air masses from the Northern and Southern Hemispheres. This makes CO2 dynamics in each hemisphere more distinct in a short-term time frame (seasons). The [BTr] is determined more by long-term CO2 emissions from anthropogenic origin (years).

When comparing global trends in CO2 mixing ratios obtained with remote sensing estimates by NASA's Orbiting Carbon Observatory (OCO) with measurements from the CDIAC CO2 monitoring stations over several years, the separation of [VRi] from [BTr] leads to interesting results. 

Ensuring the data are consistent, one is required to remove outliers and perform gap-filling if necessary. Subsequently one has to decompose the CDIAC CO2 time series into its [VRi] and [BTr] components. This can be done using techniques such as seasonal numerical decomposition of time series. The seasonal component [VRi] represents a regular annual cycle driven essentially by vegetation photosynthesis and respiration. The increasing trend component [BTr], reflects the more long-term changes in CO2 mixing ratio’s driven by anthropogenic and other sources of CO2 emissions. A harmonic model is fitted to the deseasonalized and detrended data to quantify the seasonal amplitude and phase of [VRi]. The seasonal amplitude represents the strength of [VRi] due to carbon fixation, while the phase indicates the timing of maximum uptake and release of CO2, depending on the latitude in the Northern and Southern hemispheres. To validate atmospheric CO2 dynamics of remotely sensed CO2 mixing ratios, the CDIAC measured CO2 mixing ratios are used in a comparison of both types of CO2 data. Only then, factors, such as climate, land cover and human population densities, can be understood better. It may allow to model the forcing processes determining RS observed and measured trends and variations of CO2 mixing ratios, and their impact on changes in climate.

How to cite: Veroustraete, F.: A North-South gradient of CDIAC CO2 Mixing Ratios compared with Data from Atmospheric Remote Sensing of CO2 , EGU General Assembly 2025, Vienna, Austria, 27 Apr–2 May 2025, EGU25-21074, https://doi.org/10.5194/egusphere-egu25-21074, 2025.

EGU25-1560 | ECS | Posters on site | BG9.2

Virtual Laser Scanning of Dynamic Scenes (VLS-4D): A Novel Opportunity for Advancing 3D Forest Monitoring 

Hannah Weiser, William Albert, Ronald Tabernig, and Bernhard Höfle

Virtual laser scanning (VLS) [1] has been used intensively for method development and machine learning in forestry, e.g., for quantification of leaf angle distribution [2], aboveground biomass prediction [3], or leaf-wood segmentation [4]. So far, these applications have been limited to mono-temporal VLS acquisitions where scenes were simplified to being completely static. However, forests are inherently dynamic environments with processes occurring at different timescales and rhythms, such as wind-induced movement, response to varying water potential, seasonal changes, stress-induced changes or growth.

Given the increasing availability of multi- and hyper-temporal point cloud data [5] as well as the potential of cloud-to-cloud data fusion [6], we propose virtual laser scanning of dynamic scenes (VLS-4D) [7] to develop methods for monitoring vegetation movement, tree health, and forest growth. Unlike real-world data collection, which is limited by time or equipment to one or a few scenarios, VLS-4D allows the creation of many different scenarios. This is achieved by combining different scene compositions and dynamics, acquisition modes and sensor settings. Furthermore, VLS-4D includes perfect reference data of the underlying scene, including semantic labels, geometry and changes (e.g., as deformation/movement values or change labels). Such data is usually difficult, time-consuming or impossible to obtain when working with real point clouds, or it is associated with considerable errors or unknown ambiguities. The scenario building capabilities, together with the availability of reference data, make VLS-4D a promising data generation tool for the ever-growing pool of deep learning methods for the analysis of forest point clouds and point cloud time series.

We distinguish three concepts of how dynamic scenes can be implemented in LiDAR simulation [7]:

a) Few static representations of the forest scene at different epochs, e.g., one before and one after a forest disturbance event.
b) Many static snapshots sampled from an animated scene, e.g., daily snapshots to simulate a permanent laser scanning setup.
c) Animation within the scene, e.g., vegetation moving in the wind during a single terrestrial laser scan.

We will present simulation workflows for each of these concepts using the open-source software HELIOS++ [8], from animated 3D scene generation in Blender to final simulated point clouds and point cloud time series. With these simulation examples, we illustrate the research gaps that can be filled by such virtual experiments, address strategies and challenges in implementing VLS-4D, and discuss future directions. We expect VLS-4D data to play an essential role in the development of innovative methods for forest monitoring, complementing the still limited and typically unlabelled real-world multitemporal datasets.

References:

[1] Winiwarter, L., et al. (2022): DOI: https://doi.org/10.1016/j.rse.2021.112772

[2] Liu, J. et al. (2019): DOI: https://doi.org/10.1016/j.isprsjprs.2019.01.005

[3] Schäfer, J. et al. (2023): DOI: https://doi.org/10.1093/forestry/cpad061

[4] Esmorís, A. et al. (2024): DOI: https://doi.org/10.1016/j.isprsjprs.2024.06.018

[5] Eitel, J.U.H. et al. (2016): DOI: https://doi.org/10.1016/j.rse.2016.08.018

[6] Balestra, M. et al. (2024): DOI: https://doi.org/10.1007/s40725-024-00223-7

[7] Weiser, H. & Höfle, B. (2024): DOI: https://doi.org/10.31223/X51Q5V

[8] HELIOS++: https://github.com/3dgeo-heidelberg/helios

How to cite: Weiser, H., Albert, W., Tabernig, R., and Höfle, B.: Virtual Laser Scanning of Dynamic Scenes (VLS-4D): A Novel Opportunity for Advancing 3D Forest Monitoring, EGU General Assembly 2025, Vienna, Austria, 27 Apr–2 May 2025, EGU25-1560, https://doi.org/10.5194/egusphere-egu25-1560, 2025.

EGU25-1985 | Orals | BG9.2

AI-aided forest inventory with TerraScan: combining 3D and 2D features for tree species classification 

Anna Shcherbacheva, Ana Puttonen,, and Arttu Soininen

In recent years, numerous methods have been developed to automate tree species classification using Shallow and Deep Learning techniques. Traditional approaches often utilize scanner-measured data (e.g., intensity) and 3D geometric features to compute statistical descriptors, which are used to train algorithms like Random Forests or Support Vector Machines. Deep Learning approaches, such as convolutional neural networks, process 2D raster images of point clouds but may lose critical 3D geometric details. Graph-based methods and architectures directly processing unstructured 3D data have shown promise but are often computationally intensive and less practical for industry.

To address these challenges, we developed a method that combines 2D raster and 3D point cloud features, achieving over 90% average classification accuracy. Our approach leverages well-established techniques and integrates them into TerraScan software for industrial use. Data augmentation, including SMOTE, addresses class imbalances, while features extracted from multiple raster viewpoints enhance dataset diversity.

Using TerraScan, users can efficiently preprocess data, augment training examples, and train models for over 10,000 trees in under 40 minutes on a GeForce RTX 4080. The system provides confidence scores with predictions, enabling manual evaluation of low-confidence results. This versatile method shows potential for broader object classification tasks beyond tree species identification.

How to cite: Shcherbacheva, A., Puttonen,, A., and Soininen, A.: AI-aided forest inventory with TerraScan: combining 3D and 2D features for tree species classification, EGU General Assembly 2025, Vienna, Austria, 27 Apr–2 May 2025, EGU25-1985, https://doi.org/10.5194/egusphere-egu25-1985, 2025.

EGU25-2134 | ECS | Orals | BG9.2

Choosing the right close-range technology for measuring DBH in fast-growing trees plantations 

Michal Skladan, Juliána Chudá, Arunima Singh, Matej Masný, Martin Lieskovský, Michal Pástor, Martin Mokroš, and Jozef Vybošťok

Recently, the cultivation of fast-growing tree (FGT) plantations has gained importance due to the growing energy and climate crisis. FGT plantations have the potential to reduce carbon footprints and lower greenhouse gas emissions by utilization of local renewable energy sources. Effective monitoring of above-ground biomass (AGB) is crucial for the successful management of these plantations. Standard methods for estimating AGB rely on easily measurable parameters, such as Diameter at Breast Height (DBH) and tree height, which are highly correlated with AGB. Traditional methods for measuring DBH include measuring tapes and calipers; however, these techniques can be labor-intensive, time-consuming, and limited when assessing large areas. Innovative approaches, such as photogrammetry, terrestrial laser scanning (TLS), mobile laser scanning (MLS), and iPhone LiDAR scanning, can complement these traditional methods by generating point clouds that can be used for extracting dendrometric parameters. This study evaluates the effectiveness of TLS (RIEGL VZ-1000), MLS (Stonex X120 GO), iPhone LiDAR (iPhone 13 Pro MAX), and terrestrial photogrammetry (iPhone 13 Pro MAX) for estimating DBH in a Paulownia plantation. Each technology has limitations: while TLS offers high accuracy, it is also expensive and time-consuming. Similarly, MLS is relatively costly. On the other hand, iPhone LiDAR and terrestrial photogrammetry are more affordable alternatives; however, the iPhone LiDAR has a limited scanning range, and photogrammetry requires considerable time and expertise for data collection and processing. The primary objective of this study was to evaluate these technologies based on their accuracy in DBH estimation, ease of use, data collection, processing time, and cost within the ideal conditions of a Paulownia plantation (characterized by the absence of understory, level ground, and uniform tree shape and spacing). The aim was to determine whether traditional methods could be replaced with more efficient, quicker, easier, and cost-effective alternatives. Results indicated that TLS, MLS, and photogrammetry provided similar DBH estimation accuracies, with root mean square error (RMSE) values between 0.7 and 0.72 cm and relative RMSE values between 2.87 % and 2.95 %. In contrast, the iPhone LiDAR was the least accurate, with an RMSE of 1.7 cm and an rRMSE of 6.96 %. This study demonstrates that all evaluated technologies offer sufficient accuracy for DBH estimation, although TLS and MLS capture additional parameters at a higher cost. Therefore, TLS is impractical for DBH estimation in plantation environments due to its high cost, time, and labor demands. While less expensive, terrestrial photogrammetry also requires significant time investment and operator expertise. Despite its cost, MLS achieved the best results among all the evaluated technologies and proved to be the fastest and relatively simple. If cost is a concern, the best solution for DBH estimation in an FGT plantation environment would be iPhone LiDAR scanning. It represents the most affordable option with satisfactory accuracy and ease of use.

This abstract is based upon work from COST Action 3DForEcoTech, CA20118, supported by COST (European Cooperation in Science and Technology) and APVV 20 0391 Monitoring of forest stands in three-dimensional space and time by innovative close-range approaches.

How to cite: Skladan, M., Chudá, J., Singh, A., Masný, M., Lieskovský, M., Pástor, M., Mokroš, M., and Vybošťok, J.: Choosing the right close-range technology for measuring DBH in fast-growing trees plantations, EGU General Assembly 2025, Vienna, Austria, 27 Apr–2 May 2025, EGU25-2134, https://doi.org/10.5194/egusphere-egu25-2134, 2025.

EGU25-3984 | ECS | Posters on site | BG9.2

Deep learning for identification of 3D plant growth forms in Fractional Vegetation Cover 

Laura Sotomayor, Arko Lucieer, Darren Turner, Megan Lewis, Shaun Levick, and Teja Kattenborn

This study leverages deep learning to enhance the identification of trees, shrubs, grasses, and other vegetation as distinct plant growth forms, which are essential for deriving vegetation structural properties. These properties are crucial for improving the identification of Fractional Vegetation Cover (FVC) components and the structural elements contributing to FVC, such as separating non-photosynthetic vegetation (NPV) on the ground (litter and coarse woody debris) from standing wood or distinguishing grasses, shrubs, and tree canopies by incorporating 3D data. Fractional Vegetation Cover (FVC)—comprising green vegetation (GV), non-photosynthetic vegetation (NPV), and bare earth (BE)—is particularly challenging to discriminate and map in centimetre-scale Unoccupied Aerial Systems (UAS) imagery due to spectral similarities and environmental variability.

To address these challenges, this study combines LiDAR voxel data, transformed into 2D raster representations, with multispectral imagery. Each raster channel encodes aggregated attributes such as mean voxel height, point density, maximum height, and intensity. These inputs serve as the foundation for a 2D U-net deep learning model trained using reference datasets from Calperum Station in a semi-arid ecosystem in South Australia. By incorporating canopy and ground elements, such as NPV (e.g., litter and coarse woody debris), this approach aims to enhance the model’s capacity for accurate FVC classification.

Initial experiments yielded promising results. Site-specific models achieved high overall accuracies exceeding 89% and F1 scores above 0.9, but their performance declined to approximately 69% in dense vegetation. For the generic model, accuracy dropped further to 28.48%, highlighting significant challenges in generalisation across diverse vegetation types. These findings underscore the limitations posed by complex environments, limited reference data, and the low frequency of NPV as a minority class. To address these issues, further advancements are proposed, including integrating additional LiDAR data, expanding training datasets, and employing data augmentation techniques. Data augmentation, in particular, can address environmental and illumination variability, improving the model’s ability to learn underrepresented classes and increasing robustness across diverse ecosystems.

The anticipated outcomes include improved identification of plant growth forms, with the potential for more reliable estimates of vegetation structural metrics. These advancements support derived estimates of aboveground biomass, enhanced water content assessment, and the evaluation of other critical ecosystem services. This framework leverages voxel-projected features to support vegetation analysis and improve classification performance. Additionally, it aims to enable high-resolution mapping of FVC components under plant growth form, bridging the gap between fine-scale UAS observations and regional-scale satellite imagery to support ecosystem monitoring.

How to cite: Sotomayor, L., Lucieer, A., Turner, D., Lewis, M., Levick, S., and Kattenborn, T.: Deep learning for identification of 3D plant growth forms in Fractional Vegetation Cover, EGU General Assembly 2025, Vienna, Austria, 27 Apr–2 May 2025, EGU25-3984, https://doi.org/10.5194/egusphere-egu25-3984, 2025.

Wind is among one of the most frequent drivers of forest disturbance around the world. Wind disturbance (blowdown, windthrow) results from particular meteorological conditions, where wind gust speed is a key factor. Blowdown is conditioned also by wind direction together with local topography, and influence the soil disturbance due to tree uprooting.

We mapped and analyzed the large-scale 2020 blowdown in the spruce-fir subalpine forest on the western slope of the Front Range, Rocky Mountains (Colorado, US). The area of interest (AOI) is a 9 x 29 km rectangle (39.80° N, 105.77° W and 40.06° N, 105.67° W) located south of the Rocky Mountain National Park and north of the Berthoud Pass. The mapping focused on developing and automating the workflow based on Sentinel 2 data and Change Vector Analysis (CVA) and comparing its output with the Global Forest Change (GFC) data. The CVA mapping is based on 1) the difference image computed using post- and pre-event images, and 2) the parameters calculated using two bands of the difference image: magnitude (mgt) representing the amount of change, and direction (drct) referring to the type of change. To create the CVA output, we used bands 11 and 12, together with 40° < drct < 47° and mgt > 0.1. Both CVA output and GFC data have a true positive rate (TPR) of 66-67%, with a false positive rate (FPR) of 0.9% and 3%, respectively. The CVA can be adjusted to achieve TPR up to 75.5%, of which FPR was 5.8%. Our approach is based on an unsupervised method, and open-source data, and is fully automated using R. Using CVA, the blowdown area was estimated to 1379.7 ha. The comparison between GFC data and CVA output revealed the higher efficiency of CVA for small patches with intensive damage. GFC data were better for indicating the location of patches with lower damage intensity.

We also aimed to capture different environmental insights related to the meteorological conditions causing the blowdown, soil disturbance patterns, and the impact of topography. Large-scale blowdowns are infrequent in the Rockies and are usually associated with the occurrence of unusual meteorological conditions. The blowdown was caused by strong easterly winds (gusts of 30 m•s⁻¹) blowing on September 7th - 9th, 2020, associated with the passage of a cold front causing exceptionally early late-summer cooling. The blowdown patches distribution generally followed the run of the valleys and ridges (SE-NW), with large patches in southern and central parts, and smaller ones in the northern part. The blowdown caused soil disturbance, with root plate volumes of 0.1 – 0.8 m3. The bearings of uprooted tree stems followed the direction of the main wind currents reported in the climate time series. Our approach can be valuable for research on blowdown mapping and triggering factors, GFC data assessment, soil disturbance, and interplays with relief.

The study has been supported by the Polish National Science Centre (project no. 2019/35/O/ST10/00032) and by the Polish National Agency for Academic Exchange (agreement no. PPN/STA/2021/1/00081/U/00001).

How to cite: Godziek, J., Pawlik, Ł., and Buma, B.: The 2020 windstorm forest damage in the Colorado Rocky Mts. - satellite-based mapping automation and environmental insights, EGU General Assembly 2025, Vienna, Austria, 27 Apr–2 May 2025, EGU25-4582, https://doi.org/10.5194/egusphere-egu25-4582, 2025.

Accurate tree inventories are critical for monitoring forest resources and assessing ecosystem services, particularly carbon storage. This study presents the first airborne tree inventory for Cyprus, a climate change hotspot lacking a comprehensive national forest inventory. Using high-resolution orthophotos, we developed a novel method for tree segmentation and individual-level carbon stock estimation.

Tree identification and segmentation were performed using a published state-of-the-art convolutional neural network (CNN) model, previously applied in Denmark and Finland, which was completely re-tuned using local annotations to account for Cyprus’s specific conditions. This approach achieved 90% accuracy in tree crown delineation. Given the absence of suitable allometric equations for Cyprus' tree species, we developed novel, locally tailored allometric equations for above-ground biomass estimation, achieving 92% accuracy. These equations, derived from crown dimensions and height extracted through CNN models applied to canopy height maps (CHMs), enable accurate carbon stock estimation for individual trees.

The integration of orthophotos and CHMs proved highly effective in capturing detailed structural data across diverse forest landscapes. Our methodology is scalable, cost-effective, and robust, offering a valuable tool for forest management, climate change mitigation, and policy development in Cyprus. This project establishes a comprehensive baseline for Cyprus' forest resources and demonstrates the potential of combining remote sensing and AI technologies for national-scale environmental monitoring, including urban trees.

How to cite: Zenonos, A., Li, S., Brandt, M., Sciare, J., and Ciais, P.: Development of the First Airborne Tree Inventory for Cyprus and Novel Allometries for Carbon Stock Estimation Using AI Models and High-Resolution Remote Sensing Data, EGU General Assembly 2025, Vienna, Austria, 27 Apr–2 May 2025, EGU25-4730, https://doi.org/10.5194/egusphere-egu25-4730, 2025.

EGU25-4928 | ECS | Posters on site | BG9.2

Improving leaf area index (LAI) estimation by integrating forest inventory and remote sensing 

Muhammed Sinan and Hubert Hasenauer

The mission of this study is to improve the accuracy of leaf area index (LAI) using ground-based forest inventory 'bottom-up' LAI with satellite-derived 'top-down' LAI estimates. Specifically, we compared LAI values obtained using allometric equations applied to over 30,000 trees in the Austrian National Forest Inventory (NFI) with satellite-derived LAI estimates from MODIS (Moderate Resolution Imaging Spectroradiometer) and Sentinel data sets (Sentinel-3 TOC reflectance and PROBA-V). Our results indicate that satellite-derived LAI estimates often underestimate the actual LAI observed in terrestrial data. This discrepancy is mainly due to the inability of remote sensing technologies to account for the Crown Competition Factor (CCF), which significantly influences canopy structure. As LAI is a critical parameter in ecosystem modelling, accurate LAI estimates are essential for reliable model outputs. To address this issue, we developed a logistic correction function by incorporating bottom-up and top-down LAI to improve the accuracy of LAI estimates for a sustainable forest management.

How to cite: Sinan, M. and Hasenauer, H.: Improving leaf area index (LAI) estimation by integrating forest inventory and remote sensing, EGU General Assembly 2025, Vienna, Austria, 27 Apr–2 May 2025, EGU25-4928, https://doi.org/10.5194/egusphere-egu25-4928, 2025.

EGU25-5030 | Orals | BG9.2

Nationwide estimation of boreal forest above-ground biomass using ICESat-2 data 

Lauri Korhonen, Svetlana Saarela, Matti Maltamo, Petteri Packalen, Sorin C. Popescu, and Petri Varvia

Our objective was to train a nationwide ICESat-2 model for the estimation of above-ground biomass (AGB) and its uncertainty for the entire country of Finland. The model was trained using data from eight forest inventory areas from different parts of the country. The inventory areas had airborne laser scanning, Sentinel-2 data, and field plots publicly available, and these data were used to construct proxy models that were employed to predict AGB values for the ICESat-2 tracks overlapping with the inventory areas. The final ICESat-2 AGB model was based on n = 11676 track segments (90 x 15 m) from the eight training areas. Both day and night data were used in the construction of ICESat-2 model, but all data with snow or cloud cover were omitted.

The ICESat-2 model was applied to all forested ICESat-2 segments (n = 288391) obtained from Finland in year 2021. The total AGB for Finland and its uncertainty were estimated using a hierarchical hybrid approach that only used this sample of ICESat-2 tracks without wall-to-wall mapping. The uncertainty estimation considered tree biomass models, proxy models, the nationwide model, and sampling as  error components. The final biomass estimate was compared with the official statistic from the Finnish National Forest Inventory (NFI).

The total AGB estimated for Finland was 1063.0±114.9 million tons, while the reference value from NFI was 1308 million tons. Thus, our method resulted in clear underestimation of AGB. Probable reasons for the observed underestimation include averaging of large biomass values due to the long model chains, and misclassification of sparser canopies as noise. Nevertheless, our result shows that ICESat-2 is feasible for AGB estimation in large areas, but more research is needed to reduce the underestimation.

How to cite: Korhonen, L., Saarela, S., Maltamo, M., Packalen, P., Popescu, S. C., and Varvia, P.: Nationwide estimation of boreal forest above-ground biomass using ICESat-2 data, EGU General Assembly 2025, Vienna, Austria, 27 Apr–2 May 2025, EGU25-5030, https://doi.org/10.5194/egusphere-egu25-5030, 2025.

EGU25-5107 | ECS | Orals | BG9.2

Global Mapping of Forest Canopy Structural Complexity and Its Links to Ecosystem Productivity and Stability 

Xiaoqiang Liu, Yuhao Feng, Tianyu Hu, Yue Luo, Xiaoxia Zhao, Jin Wu, Eduardo E. Maeda, Weimin Ju, Lingli Liu, Qinghua Guo, and Yanjun Su

Forest canopy structural complexity (CSC), the intricate arrangement and occupation of canopy elements in three-dimensional space, plays a critical role in shaping forest ecosystem productivity and stability by regulating light and water distribution within the canopy. However, the relationship between forest CSC and forest ecosystem productivity and stability remains controversial in current regional-scale studies, necessitating further investigation at broader spatial scales. Here, we introduce a novel entropy-based metric, canopy entropy, to quantify forest CSC from light detection and ranging (lidar) data. This metric effectively captures forest CSC variations arising from both horizontal and vertical arrangements and occupations of canopy elements. Notably, canopy entropy estimates from multiplatform lidar data demonstrate strong agreement, establishing its suitability for large-scale applications. Leveraging these advantages, as well as airborne lidar data from 4,000 forest plots worldwide and spaceborne lidar data from the Global Ecosystem Dynamics Investigation, we map the global distribution of forest CSC and investigate its relationships with forest ecosystem productivity and stability. We find climatic factors, especially water availability, play a critical role in driving the global distribution of forest CSC, while biotic factors exhibit a strong coupling impact with climatic and edaphic factors. From a global perspective, forest CSC predominantly enhances productivity and stability, although substantial variations are observed among forest ecoregions. The effects of forest CSC on productivity and stability are the balanced results of biodiversity and resource availability. These results offer valuable insights into understanding controversies in regional-scale studies. Furthermore, we found that managed forests generally exhibit lower CSC compared to intact forests but demonstrate stronger positive effects of CSC on ecosystem productivity and stability, underscoring the urgent need to incorporate CSC into forest management strategies to enhance climate change mitigation efforts.

How to cite: Liu, X., Feng, Y., Hu, T., Luo, Y., Zhao, X., Wu, J., E. Maeda, E., Ju, W., Liu, L., Guo, Q., and Su, Y.: Global Mapping of Forest Canopy Structural Complexity and Its Links to Ecosystem Productivity and Stability, EGU General Assembly 2025, Vienna, Austria, 27 Apr–2 May 2025, EGU25-5107, https://doi.org/10.5194/egusphere-egu25-5107, 2025.

EGU25-5247 | ECS | Posters on site | BG9.2

Comparative analysis of SLAM and TLS LiDAR technologies for biodiversity relevant information extraction over two Natura 2000 Sites in Greece 

Vasileios Alexandridis, Ion-Anastasios Karolos, Konstantinos Bellos, Vassilios Tsioukas, Maria Diamantopoulou, Irene Chrysafis, and Giorgos Mallinis

Biodiversity monitoring is a critical global issue, requiring reliable and precise information on forest and tree attributes to ensure sustainable management and biodiversity conservation. Remote sensing (RS) technology has emerged as a powerful tool for forest monitoring, offering significant advantages over traditional methods. The advent of advanced LiDAR technologies has revolutionized the field, enabling high-resolution 3D data collection and capturing intricate forest structures. Despite advancements, efficiently monitoring dense and complex forest environments in three dimensions remains a challenging task. This study in processing and analysing Simultaneous Localization and Mapping (SLAM) and Terrestrial Laser Scanning (TLS) LiDAR datasets to estimate biodiversity relevant attributes in Greek Natura 2000 (N2K) forested areas. The study is implemented as part of the hELlenic BIOodiversity Information System (EL-BIOS). The EL-BIOS is the first national-scale EODC infrastructure, with the aim of advancing EO data and products use for biodiversity management and conservation over Greece. This research encompasses three 0.1 ha plots, distributed  in two distinctive protected areas: the Kotychi–Strofilia National Park  in south Greece and the Northern Pindos National Park in north Greece. Open-source tools such as LAStools and 3D-Forest were utilized for individual tree segmentation and the calculation of key forestry parameters. Optimal algorithm configurations and functional tools were explored to compute structural attributes such as tree height, diameter at breast height (DBH), and crown metrics. To evaluate the performance and accuracy of the SLAM and TLS datasets, the automatically derived parameters were compared against traditionally collected in-situ data using classification metrics, accuracy statistics, and precision measures. The findings indicate that both SLAM and TLS effectively captured detailed 3D point cloud data of the forested plots, albeit with differences in accuracy, resolution, and acquisition time. TLS consistently delivered higher-resolution data but required extended processing times, stationary positioning, and manual repositioning within the plot area. Conversely, SLAM offered greater mobility and efficiency, albeit with slightly lower resolution. TLS achieved an accuracy of approximately 75% in tree detection, while SLAM ranged between 60% and 65%, demonstrating its operational viability despite a slight reduction in precision. Overall, this study underscores the potential of advanced 3D modelling techniques and efficient parameter extraction methods for biodiversity relevant information extraction over forest protected areas.

How to cite: Alexandridis, V., Karolos, I.-A., Bellos, K., Tsioukas, V., Diamantopoulou, M., Chrysafis, I., and Mallinis, G.: Comparative analysis of SLAM and TLS LiDAR technologies for biodiversity relevant information extraction over two Natura 2000 Sites in Greece, EGU General Assembly 2025, Vienna, Austria, 27 Apr–2 May 2025, EGU25-5247, https://doi.org/10.5194/egusphere-egu25-5247, 2025.

EGU25-5526 | ECS | Posters on site | BG9.2

Mapping Forest Stand Characteristics Using Aerial LiDAR and Sentinel-1 Data: A Case Study from Slovenia 

Jernej Jevšenak, Mitja Skudnik, and Andrej Kobler

Advancements in remote sensing technologies have enabled comprehensive and detailed forest mapping, as demonstrated by recent initiatives in Slovenia. Such maps are essential for sustainable forest management, biodiversity conservation, and monitoring changes in forest structure and composition over time. A forest stand map was generated for the year 2023 in central Slovenia, encompassing 7,005 km², 62% of which is forested. We developed and calibrated two distinct models based on Sentinel-1 SAR data to map growing stock and the proportion of coniferous and broadleaved species in growing stock. In addition, we used the LiDAR-based canopy height model (CHM) to map forest stand height and canopy cover.

LiDAR data acquisition occurred in spring 2023, coinciding with varying levels of leaf development across deciduous forests. This led to heterogeneity in the point cloud data, affecting CHM-based estimations of forest stand height and canopy cover. Tree-top CHM heights were relatively unaffected, but the crown shapes of deciduous trees were heavily influenced by the state of leaf development. To mitigate these effects, the CHM’s horizontal resolution was reduced by aggregating the highest point within each 10-meter pixel, downsampled from the original 50 cm CHM. Forest stand height was calculated as the mean height of all 10-meter CHM pixels within forest stand polygons. Canopy cover was derived as the percentage of 10-meter pixels exceeding a height threshold of 20 meters.

Growing stock and the proportion of species were estimated using random forest models trained on field-measured forest stand data, and Sentinel-1 imagery. Field data were provided by the Slovenian Forestry Service and included forest stand data for quasi-randomly distributed forest management units. Vegetation indices were derived from Sentinel-1 daily data, including the Radar Vegetation Index (RVI = 4 × VV / (VV + VH)), the Normalized Radar Vegetation Index (NRVI = (VV - VH) / (VV + VH)), and the Radar Forest Degradation Index (RFDI = VV - VH), where VV and VH represent Sentinel-1 polarization modes. Monthly composites of these indices, spanning January 2022 to December 2023, were generated and smoothed using a 3 × 3 low-pass filter.

The random forest models, consisting of 100 regression trees each, were optimized based on R2 performance on unseen test data generated during the cross-validation process. The optimal tree depths were 20 and 15 for the growing stock and the proportion of species models, respectively, yielding R2 values of 0.34 and 0.57. Final model-based predictions were aggregated to forest stand polygons, providing spatially explicit estimates of growing stock and species composition.

Forest stands were delineated using the Segment Mean Shift image segmentation tool in ESRI ArcGIS Pro, applied to a set of Z-score standardized raster maps representing forest stand height, canopy cover, and the proportion of coniferous and broadleaved species. Further work is planned to include lidar data and optical data into the models.

How to cite: Jevšenak, J., Skudnik, M., and Kobler, A.: Mapping Forest Stand Characteristics Using Aerial LiDAR and Sentinel-1 Data: A Case Study from Slovenia, EGU General Assembly 2025, Vienna, Austria, 27 Apr–2 May 2025, EGU25-5526, https://doi.org/10.5194/egusphere-egu25-5526, 2025.

EGU25-5816 | ECS | Posters on site | BG9.2

Comparative modeling of subcanopy solar radiation: Evaluating PCSRT and r.sun with multi-source LiDAR data 

Daniela Buchalová, Jaroslav Hofierka, Jozef Šupinský, and Ján Kaňuk

Accurate modeling of subcanopy solar radiation is vital for ecological modeling, forest management, and urban planning, as it influences vegetation growth, energy balance, and environmental dynamics. This study provides a comprehensive evaluation of two solar radiation models: PCSRT and r.sun, leveraging LiDAR datasets from terrestrial (TLS), unmanned aerial (ULS), and airborne (ALS) scanning. The results demonstrate that the choice of modeling approach and data source substantially impacts the accuracy of solar radiation estimates, particularly in complex forested environments. PCSRT, with its voxel-based 3D modeling, excels in capturing intricate subcanopy radiation dynamics, especially when combined with high-density LiDAR data such as TLS and ULS. In contrast, the raster-based r.sun model, while computationally efficient and scalable, is better suited for broader regional analyses, particularly in less heterogeneous environments such as urban areas. This research underscores the critical role of LiDAR data density in determining model accuracy, with ULS providing the most reliable results, TLS capturing detailed local variations but facing coverage limitations, and ALS offering scalability but with reduced precision in dense canopy structures. Practical implications of this study include tailored recommendations for selecting modeling tools and LiDAR datasets based on the objectives and spatial scale of the study. PCSRT is recommended for high-resolution ecological studies requiring detailed subcanopy analysis, whereas r.sun is preferable for large-scale applications where computational efficiency is prioritized. However, limitations of each approach are acknowledged, including the computational intensity of PCSRT and the lower precision of r.sun in capturing canopy interactions.

Keywords: subcanopy solar radiation, solar radiation models, LiDAR, r.sun, PCSRT

How to cite: Buchalová, D., Hofierka, J., Šupinský, J., and Kaňuk, J.: Comparative modeling of subcanopy solar radiation: Evaluating PCSRT and r.sun with multi-source LiDAR data, EGU General Assembly 2025, Vienna, Austria, 27 Apr–2 May 2025, EGU25-5816, https://doi.org/10.5194/egusphere-egu25-5816, 2025.

Analyzing forest conversions and unraveling their drivers is a significant challenge for ecological research. The forests of northeastern China, including major temperate forest types in East Asia, constitute key ecological function zones. In this study, we investigated the changes in fractional forest cover (FFC) in Northeast China over the past 37 years using Landsat time series data and explored the underlying mechanism of FFC response to environmental changes with two methods: the partial correlation analysis between different time series and a SHAP-based explainable CatBoost algorithm at the point level. First, a probability-based random forest model was developed to classify forest and non-forest areas, achieving an average overall accuracy of 85% from 1987 to 2023. Pixel-by-pixel tracking of forest conversions over ten-year intervals revealed a significant net increase of more than 16×107 forest pixels. Notably, a declining trend in forest expansion (lost) was observed along altitude gradients above 200 m during four epochs. In the analysis of driving forces, our results indicated that FFC was positively correlated with temperature in 65% but negatively correlated with precipitation in 63% of the study region. Moreover, the impacts of temperature on increasing and decreasing FFC were contrasting: at altitudes above 200 m, increasing FFC exhibited a positive partial correlation with temperature, while decreasing FFC showed a nearly negative correlation with temperature. Furthermore, the predictive CatBoost model explained 58% of the increase in FFC, attributing it to variability in meteorology (mean annual temperature and precipitation), mean annual soil moisture, population density, and elevation. In comparison, these environmental factors accounted for 38% of the decrease in FFC. For total FFC changes (both increases and decreases), the optimized model achieved a precision of 40%. Among the driving factors, mean annual temperature played a predominant role in accounting for both total FFC changes and FFC increases. Meanwhile, mean annual precipitation was the most critical indicator triggering FFC decreases. Our findings provided valuable evidence and insights into the relationships between environmental factors and FFC dynamics in the context of sustainable development.

How to cite: Wang, X., Huang, F., and Gao, L.: Exploring spatiotemporal pattern of fractional forest cover in Northeast China from 1987 to 2023: Unraveling its change-driven factors, EGU General Assembly 2025, Vienna, Austria, 27 Apr–2 May 2025, EGU25-6074, https://doi.org/10.5194/egusphere-egu25-6074, 2025.

EGU25-6584 | Orals | BG9.2

Handling single-year big data in multi-temporal forest inventory and mapping systems 

Svetlana Saarela, Terje Gobakken, Hans Ole Ørka, Ole Martin Bollandsås, Erik Næsset, and Göran Ståhl

Abstract:

Data assimilation (DA) has been applied for several decades in areas such as meteorology and robotics, to predict the state of systems that evolve over time, by integrating model-based forecasting with repeated observations. Recently, DA has gained attention in forest inventory applications. For instance, study by Nyström et al. (2015) not only demonstrated the theoretical potential of employing dense time series of remotely sensed (RS) data but also identified several obstacles that must be overcome before the methodology can be practically adopted. Within the SmartForest project, we are further exploring the usefulness of DA techniques for forest inventory and mapping of forest attributes.

Recent studies have shown that DA has a potential to maintain the accuracy of plot and stand level information, obtained from accurate but expensive surveys, such as airborne laser scanning (ALS), by making use of inexpensive optical satellite data and DA throughout several subsequent years. However, with ever-increasing amounts of RS data, it is important to evaluate not only how to make assessments and growth updates through DA, but also how to best utilize huge amounts of RS data from within single years. For example, the European Space Agency’s Sentinel-2 satellites currently provide new data across boreal forests every second week.

In a study initiated within the Norwegian SmartForest programme, we evaluate whether building separate models for each RS dataset and applying composite estimation or merging all data into a single model through principles of partial least squares regression and random forest non-parametric regression, yields the best results in terms of prediction accuracy.

Our investigation was conducted within the Våler municipality of Norway and focused on growing stock volume as our primary target variable. The RS data were acquired in 2022 and included ALS point clouds, digital aerial photogrammetric point clouds, and Sentinel-2 spectral data. Alongside comparing prediction accuracies, we conducted a qualitative assessment to discern the practical advantages and disadvantage of each method in integrating them into a multi-temporal data DA system.

Reference:

Nyström, M., Lindgren, N., Wallerman, J., Grafström, A., Muszta, A., Nyström, K., Bohlin, J., Willén, E., Fransson, J.E., Ehlers, S. and Olsson, H., 2015. Data assimilation in forest inventory: first empirical results. Forests, 6(12), pp.4540-4557.

How to cite: Saarela, S., Gobakken, T., Ørka, H. O., Bollandsås, O. M., Næsset, E., and Ståhl, G.: Handling single-year big data in multi-temporal forest inventory and mapping systems, EGU General Assembly 2025, Vienna, Austria, 27 Apr–2 May 2025, EGU25-6584, https://doi.org/10.5194/egusphere-egu25-6584, 2025.

EGU25-6619 | ECS | Posters on site | BG9.2

Assessing Gonipterus sp. n. 2 defoliation levels using multispectral Unmanned Aerial Vehicle (UAV) data in Eucalyptus plantations 

Phumlani Nzuza, Michelle Schröder, Rene Heim, Louis Daniels, Bernard Slippers, Brett Hurley, IIaria Germishuizen, Benice Sivparsad, Jolanda Roux, and Wouter Maes

The locally invasive insect pest Gonipterus sp. n. 2 (Coleoptera: Curculionidae) threatens Eucalyptus plantations, causing defoliation and yield loss through adult and larval feeding. Early detection is important for early intervention to prevent pest outbreaks. As conventional insect pest monitoring methods are time-consuming and spatially restrictive, this study assessed the potential of UAV monitoring. Multispectral imagery was obtained with Unmanned Aerial Vehicles (UAVs) in South Africa’s Midland region across seven different sites in 14 datasets of young stands of Eucalyptus dunnii with varying levels of Gonipterus sp. n. 2 infestation. Reference damage levels were obtained through visual assessments of (n= 80-100) trees at each site. Across sites, a decrease in canopy reflectance in both the visual and the near-infrared domains with increasing damage levels was consistently observed. Several vegetation indices showed consistent patterns, but none showed site independence. XGBoost was used to predict damage levels. The best-performing models included reflectance, vegetation indices and grey-level co-occurrence matrix data. When data from a 10-band multispectral camera were used, the highest classification accuracy was 90% across all sites in classifying defoliation levels. With a classical 5-band multispectral camera, accuracy was 82%, but distinguishing medium damage from absence remained challenging. Regardless the sensor, the method was less reliable when the training and validation sets were completely separated. This study highlights the potential of UAV-based multispectral imagery to assess Gonipterus sp. n. 2 damage, demonstrating reliable upscaling from individual tree assessments to stand scale. However, larger training datasets across multiple damage levels and additional image corrections are required for broader applicability.

How to cite: Nzuza, P., Schröder, M., Heim, R., Daniels, L., Slippers, B., Hurley, B., Germishuizen, I., Sivparsad, B., Roux, J., and Maes, W.: Assessing Gonipterus sp. n. 2 defoliation levels using multispectral Unmanned Aerial Vehicle (UAV) data in Eucalyptus plantations, EGU General Assembly 2025, Vienna, Austria, 27 Apr–2 May 2025, EGU25-6619, https://doi.org/10.5194/egusphere-egu25-6619, 2025.

Land Use/Land Cover (LULC) monitoring is essential for understanding Earth's surface dynamics, particularly in assessing the impact of vegetation and land changes on hydrological systems, vulnerability to extreme climatic events, and forest health. In recent years, increasing forest dieback caused by climate change, pests, and diseases has raised global concerns about ecosystem stability and biodiversity. The rapid spread of tree mortality and the need to accurately capture its temporal evolution highlight the necessity of precise detection and monitoring of dead tree areas, which are crucial for effective forest management and mitigating related environmental impacts.

To address this, our study aimed to map LULC and identify areas of dead trees from 2018 to 2023 in the Harz Mountains and its surrounding regions in Germany, an area severely affected by bark beetle infestation. For this purpose, we trained a multi-modal U-Net architecture, a supervised learning model with an encoder-decoder structure designed to capture contextual features across multiple scales. The training applied multi-temporal optical (Sentinel-2) and radar (Sentinel-1) imagery acquired during the growing season (May-August) of 2020-2021 as the training dataset, with ESA 2020/2021 data, tree species distributions from the Thünen Institute of Forest Ecosystems, and manually annotated dead trees as the reference dataset. Annual LULC maps for 2018-2023 were generated by processing each image using the trained model and subsequently combining the predictions per image using a majority voting approach, considering seven LULC classes: cropland, grassland, built-up areas, water bodies, coniferous, deciduous, and dead trees. Furthermore, a change analysis was performed on the predicted maps from 2018 to 2023.

Accuracy assessment demonstrated the model’s robust performance, with an overall accuracy of 0.88. Additionally, a comparison between a European LULC map -ELC10- and our predicted LULC map for 2018 resulted in an overall accuracy of 0.86, further highlighting the reliability of this method. Among the classes, cropland achieved the highest F1-score (0.97), likely due to the higher number of training samples available (40% of the total training samples). In contrast, the dead tree class demonstrated the lowest F1-score (0.60), attributed to its limited sample size (1% of the total training samples) and confusion with coniferous trees. The model effectively mapped the other classes, with F1-scores exceeding 0.70. The analysis revealed an increase in dead trees and grassland areas, primarily at the cost of coniferous trees, which can be linked to tree mortality caused by bark beetle infestation and prolonged drought, particularly from 2018 to 2022. It also revealed deforestation patterns between 2018 and 2023, with dead tree areas initially concentrated near Brocken in the Harz Mountains. Over time, these areas steadily expanded from the southeast towards the western and central parts of the study area.

These findings, based on freely accessible satellite data, can support forest managers in monitoring landscapes and tree mortality and help identify effective control measures.

How to cite: Saba, F., Achanccaray, P., and Gerke, M.: Land use/Land cover mapping to monitor dead tree areas using multi-modal, multi-temporal Remote Sensing imagery and a deep learning model, EGU General Assembly 2025, Vienna, Austria, 27 Apr–2 May 2025, EGU25-6990, https://doi.org/10.5194/egusphere-egu25-6990, 2025.

EGU25-8125 | ECS | Orals | BG9.2

Detecting forest storm damage with multi-temporal Sentinel-1 InSAR coherence time series 

Tauri Tampuu, Elzė Buslavičiūtė, Mateo Gašparović, Ivan Pilaš, and Damir Klobučar

Extreme weather events pose substantial risks to forest ecosystems and forestry operations. Synthetic Aperture Radar (SAR) can address these challenges due to its ability to operate in all weather conditions and penetrate cloud cover. This study demonstrates, to the best of our knowledge, for the first time the potential of Sentinel-1 (S1) interferometric SAR (InSAR) coherence time series for rapid detection of windthrow-induced forest damage.

The study focuses on a severe storm near Otok (45°09′N, 18°53′E), Croatia, on 19 July 2023. We analyzed 84 forest plots, categorized into five damage classes: A – no damage (0–10%, 13 plots), B – minor (10–20%, 18), C – moderate (20–50%, 19), D – significant (50–80%, 22), and E – severe damage (80–100%, 12). Each plot represented a 50-meter radius area (~0.8 hectares).

Coherence magnitudes in VV and VH polarizations were calculated from consecutive image pairs for three S1 relative orbits (51, 73, 175). The pre-storm (25 June–18 July) and post-storm (1–24 Aug) periods were analyzed, each spanning 24 days and six S1 images (2 per orbit). Image pairs with second images from 19–31 July were excluded to avoid interference from the storm. Data were grouped by damage class, and statistical differences were assessed using the Mann-Whitney U test.

Post-storm, intra-group median VV coherence magnitudes differed significantly between no-damage and heavy-damage groups (e.g., A vs. D, and A vs. E). However, the coherence signal was near noise levels, reflecting the subtlety of the damage signature (Table 1). No significant differences were observed during the pre-storm period, underscoring VV coherence's sensitivity to storm-induced structural damage. VH coherence and VV and VH backscatter were not sensitive to windthrow.

This study highlights the potential of Sentinel-1 InSAR coherence in forest monitoring frameworks, supporting operational planning in forestry. The inclusion of Sentinel-1C will reduce the temporal baseline (from 12 to 6 days) further mitigating temporal decorrelation and enabling denser time series.

Table 1. Inter-group comparison (Mann-Whitney U test) and intra-group statistics.


Post-storm


Pre-storm


P-value (Significance ≤ 0.001)

A

D

E


A

D

E

D

0.0003

-


0.5799

-


E

7.0e-06

0.0903

-


0.5410

0.7479

-

Group size

78

132

72


78

132

72

Median coherence

0.145

0.196

0.227


0.127

0.129

0.136

IQR of coherence

0.096 

0.132 

0.141


0.103 

0.094 

0.108


How to cite: Tampuu, T., Buslavičiūtė, E., Gašparović, M., Pilaš, I., and Klobučar, D.: Detecting forest storm damage with multi-temporal Sentinel-1 InSAR coherence time series, EGU General Assembly 2025, Vienna, Austria, 27 Apr–2 May 2025, EGU25-8125, https://doi.org/10.5194/egusphere-egu25-8125, 2025.

EGU25-8679 | ECS | Orals | BG9.2

Investigating within-forest variability in the onset of tree height growth in a boreal Scots pine forest 

Taiga Korpelainen, Mariana Campos, Tuomas Yrttimaa, Samuli Junttila, Yunsheng Wang, and Eetu Puttonen

Tree growth is a key indicator of forest health and development, especially in the context of a changing climate. Interactions between abiotic and biotic factors influencing tree growth are highly complex, with their full magnitude still unknown. Even trees of the same species and within the same forest can present high variability in their growth, as they are affected by various macro- and micro-scale factors. In order to detect and quantify tree growth at tree level, close-range monitoring with high spatial and temporal resolutions is required. For this purpose, LiDAR (Light Detection and Ranging) data is widely recognized for its ability to produce high-resolution point clouds, which enable studying intricate changes in trees. 

The goal of our study is to explore the potential of daily LiDAR time-series for detecting the onset of tree height growth and quantifying the total growth in tree height, to help understand the biotic and abiotic factors contributing to height growth variability in Scots pine (Pinus sylvestris) trees. Here, we studied 97 Scots pine trees during the growing season of 2021 with dense spatiotemporal point cloud time series collected with LiDAR Phenology Station (LiPhe) in Hyytiälä forest research station, Finland. We developed a semi-automatic framework to extract individual tree height time-series, which includes point cloud registration, point cloud segmentation, and tree height estimation. Based on extracted height time-series derived from LiPhe, we detected the onset of tree height growth using a change point detection algorithm.  

We found up to 28 days of variability in the onset of height growth within the studied Scots pine trees. To investigate the factors influencing the variability in the onset of height growth, we used tree size, neighborhood characteristics, and topography as explanatory variables in a linear mixed-effects model. These variables were also estimated from LiDAR data. The best performing model for modelling the onset of growth combined Plant Area Index (PAI), Vertical Complexity Index (VCI), and Topographic Wetness Index (TWI), as fixed-effect terms.  

Our results suggest that higher density and complexity of neighboring trees leads to earlier onset of tree height growth, which can suggest competition for light and microclimate variability. Meanwhile, lower TWI led to earlier onset of tree height growth, indicating that trees located on a slightly higher slope with less water availability grew earlier in height. Lower areas may have a cooler microclimate, since they often retain more soil moisture and are less exposed to wind, which can lead to later growth onset.  

We conclude that daily LiDAR time-series enables measurements that are challenging to achieve using other techniques, such as detecting the onset of height growth. Our study suggests that the onset of height growth may be mainly influenced by light competition and microclimate, demonstrating the potential of tree-level LiDAR-derived metrics in studying how microclimatic changes affect forest adaptability in the context of a changing climate.  We will further continue to study the influence of the timing of growth on the amount of growth during the growing season.

How to cite: Korpelainen, T., Campos, M., Yrttimaa, T., Junttila, S., Wang, Y., and Puttonen, E.: Investigating within-forest variability in the onset of tree height growth in a boreal Scots pine forest, EGU General Assembly 2025, Vienna, Austria, 27 Apr–2 May 2025, EGU25-8679, https://doi.org/10.5194/egusphere-egu25-8679, 2025.

EGU25-9165 | ECS | Posters on site | BG9.2

Bayesian detection of non-stand-replacing forest disturbances in satellite image time series 

Daniel Schraik, Aku Seppänen, and Petteri Packalen

Non-stand-replacing forest disturbances are increasingly threatening Europe’s forests under climate change. Monitoring and mapping of these disturbances remain a challenge in remote sensing due to the small magnitude of change signals. We present a detection method for satellite image time series analysis based on the Kalman filter and the Neyman-Pearson lemma. The method (1) amplifies the spectral change signals from abrupt forest disturbances in time series data, and (2) compares the amplified change signal to a prior expectation. Through these improvements, detection performance is greatly improved, with initial results from six study areas across Finland showing an F1-score of 0.7 for non-stand-replacing disturbances. Stand-replacing disturbances are detected by this method at an equal rate as the European Forest Disturbance Atlas and the Stochastic Continuous Change Detection methods. We demonstrate the theory behind this detection method along with initial results, sensitivity to different priors and potential for further improvement.

How to cite: Schraik, D., Seppänen, A., and Packalen, P.: Bayesian detection of non-stand-replacing forest disturbances in satellite image time series, EGU General Assembly 2025, Vienna, Austria, 27 Apr–2 May 2025, EGU25-9165, https://doi.org/10.5194/egusphere-egu25-9165, 2025.

EGU25-9599 | Posters on site | BG9.2

Data and resolution requirements in mapping biodiversity and ecosystem services in boreal drained peatland forests 

Parvez Rana, Anwarul Islam Chowdhury, Kaapro Keränen, and Andras Balazs

Boreal drained-peatland forests provide a wide range of interlinked and overlapping biodiversity and ecosystem services (BES). Mapping BES is essential for informed decision-making to manage and conserve forest resources effectively. Centimeter-level resolution is often deemed necessary for mapping BES in complex landscapes like northern boreal drained peatland forests. However, systematic tests on the optimal spatial resolution, data combinations, and the impact of including or omitting specific datasets on mapping accuracy remain limited. In this study, we mapped several indices of BES, including biodiversity conservation, habitat suitability, non-timber forest products (e.g., bilberry and cowberry yield), scenic beauty, timber production and carbon storage, using multiple remote sensing (RS) data. These data sources included airborne laser scanning, unmanned aerial vehicle (UAV) data, and optical satellite data from PlanetScope, Sentinel-2, and Landsat 8-9. The specific objectives were: (1) to identify the best RS predictors for individual BES; (2) to develop random forest regression models for predicting BES; (3) to compare the performance of difference RS data and (4) to upscale the pixel-level distribution of BES across different canopy covers closed, partial, and open. Our preliminary findings indicate that BES can be accurately predicted using a set of height, density, and multispectral predictors, with explained variance ranging from 13% to 90% for individual BES. Model performance varied among individual BES and across different RS data sources. Furthermore, we successfully upscaled the BES predictions to map the spatial distribution of BES across the entire study area. Areas with closed canopies exhibited higher BES potential compared to partial and open canopies. These results demonstrate that RS data can be effectively used to predict BES on a spatial scale, providing a valuable tool for sustainable forest management.

How to cite: Rana, P., Chowdhury, A. I., Keränen, K., and Balazs, A.: Data and resolution requirements in mapping biodiversity and ecosystem services in boreal drained peatland forests, EGU General Assembly 2025, Vienna, Austria, 27 Apr–2 May 2025, EGU25-9599, https://doi.org/10.5194/egusphere-egu25-9599, 2025.

EGU25-10626 | ECS | Orals | BG9.2

Towards Estimating Vegetation Water Content in Boreal Forests Using Tower-Based Radar Observations 

Theresa Leistner, Albert R. Monteith, Lars M.H. Ulander, Patrik J. Bennet, and Jose Gutierrez Lopez

Estimation of vegetation water content (VWC) in forest ecosystems is essential for understanding and monitoring forest health, transpiration, and responses to environmental changes. Currently there exists no remote sensing method capable of observing VWC changes in forests.

The BorealScat-2 radar tower, constructed in the Svartberget Experimental Forest in northern Sweden, aims to address this challenge by investigating the relationship between radar backscatter and VWC in a boreal forest. The tower provides tomographic radar images at P- (435 MHz), UHF- (600 MHz), and L- (1270 MHz) across all polarization combinations, offering high precision measurements at 30-minute intervals. The high precision is made possible by moving the antenna frame along a 4-m horizontal baseline, followed by incoherent averaging of the tomograms. Complementary in situ measurements, including sap flow sensors, trunk moisture sensors, dendrometers, and an eddy covariance flux tower, enable detailed analysis of water dynamics across the soil-plant-atmosphere continuum within the radar footprint.

Time series results show that P- and UHF-band backscatter covaries (positively correlated) with VWC, with UHF-band backscatter capturing VWC trends over timescales from hours to months. L-band radar observations, however, reveal an unexpected diurnal backscatter pattern, where canopy backscatter increases during periods of decreasing VWC, suggesting a complex interplay of scattering and attenuation effects. This behaviour contrasts with the expectation that an increase in VWC leads to an increase in backscatter. We propose an inversion model, accounting for attenuation effects, for estimating VWC from L-band backscatter.

Results show that the model successfully estimates changes in VWC from canopy backscatter and attenuation measured by the tower over timescales of hours to weeks, demonstrating the possibility of using radar observations for estimating VWC changes in forests. The findings underscore the relevance of tower-based radar observations for refining remote sensing algorithms and for presenting new applications for upcoming L-band synthetic aperture radar missions for global forest monitoring.

How to cite: Leistner, T., Monteith, A. R., Ulander, L. M. H., Bennet, P. J., and Gutierrez Lopez, J.: Towards Estimating Vegetation Water Content in Boreal Forests Using Tower-Based Radar Observations, EGU General Assembly 2025, Vienna, Austria, 27 Apr–2 May 2025, EGU25-10626, https://doi.org/10.5194/egusphere-egu25-10626, 2025.

EGU25-10908 | ECS | Posters on site | BG9.2

A Framework for Assessing Tree Value and Forest Vulnerability Using UAV Remote Sensing  

Paul Eisenschink, Wolfgang Obermeier, Vinzenz Zerres, Annika Suerbaum, and Lukas Lehnert

Forests play a vital role in providing diverse ecosystem services, including recreational opportunities for the local population, climate regulation, and timber production, as well as by supporting biodiversity. In parts of Central Europe, the primary function of these forests is to provide a stable and sustainable income for foresters and forest owners. Regardless of the focus, the forests’ ability to provide these services are increasingly threatened by the effects of climate change through extreme events like droughts or floods and biological calamities caused by pests like the European spruce bark beetle. To ensure continuing forest health forest personal is required to maintain dense monitoring in the field in order to act against these dangers. However, such close monitoring using conventional methods can be very time consuming and difficult from the ground. To combat this, this work attempts to get a detailed overview of the economic value of a forest based on individual trees based on UAV remote sensing. Our previous work has proven the effectiveness of UAV LiDAR remote sensing for the delineation of tree stems and their diameter under ideal UAV flight parameters. Building on this, we present a framework combining UAV LiDAR and multispectral data to estimate individual tree value based on diameter, straightness of stem, tree height, and species. Further, the difficulty of harvesting can also be accounted for using information about terrain, density of understory vegetation, and distance to forest and logging roads. This method can further be used to analyse possible areas of increased economic risk for biological pests or extreme events. Overall, this would substantially reduce the amount of fieldwork necessary by foresters and allow for a much more accurate and less tedious method of ensuring continued economic and ecological prosperity.


How to cite: Eisenschink, P., Obermeier, W., Zerres, V., Suerbaum, A., and Lehnert, L.: A Framework for Assessing Tree Value and Forest Vulnerability Using UAV Remote Sensing , EGU General Assembly 2025, Vienna, Austria, 27 Apr–2 May 2025, EGU25-10908, https://doi.org/10.5194/egusphere-egu25-10908, 2025.

EGU25-14242 | Posters on site | BG9.2

Post-Fire (1983-2024) Boreal Forest Demography, Interior Alaska 

Santosh Panda

As one of the resilient and largest land biomes on Earth, boreal forest (comprising 30% of the global forest area) provides ecosystem services that benefit society at levels ranging from local to global including climate regulations. Nonetheless, stoked by arctic warming, wildfires are remaking the boreal forest. In recent decades’ boreal wildfires' extent and severity increased and reached record levels. In the last two decades (2001-2020: 31.4 million acres) wildfires in Alaska have burned more than twice as many acres than the previous two decades (1981-2000: 14.1 million acres). Severe fires lead to the most extensive regrowth of broadleaf shrubs and trees. Previous studies predict that broadleaf stands, which accounted for less than half of interior Alaska’s forests in 2001, will expand to cover two-thirds of the forested area. Some studies predict forests being permanently replaced by shrubland and grassland. Whatever the new shape of the forest, the change will ripple through wildlife. Given consensus on the value of boreal forest to the climate system, biodiversity, and society, data and policy-driven improvement in forest protection and management is needed. Current and reliable map products and up to date post-fire forest demography will be valuable to new policy formulation to sustain forest cover, and reduce fire risk. Given that fire frequency and severity are expected to increase the prevalence of early-successional broadleaf species, it is particularly important to monitor forest demography to better understand how changing climate conditions and wildfires are affecting overall forest health, resilience, and carbon drawdown. Post-fire forest cover changes from one type to another need to be mapped and documented every 2-5 years to support effective forest protection and management efforts. Satellite imaging provides a consistent, enduring record of the landscape, and repeated imaging has potential to map forest recovery and demography post-fire. In this study, we investigate the post-fire forest demography within select historic burn scars from the 1980s using satellite remote sensing. Our goal is to gain novel insights on post-fire forest recovery and composition i.e. post-fire what percentage of a burn scar is conifer vs broadleaf and how do their composition evolve with time? For a select historic fires from the 1980s, we will employ a time-series analysis of post-fire vegetation recovery by species at 2-5 years interval. We will use peak growing season spectral indices (NDVI, NBR) along with spring (leaf off) images for mapping vegetation by spices. We will use Random Forest image classifier to generate the final vegetation maps and composition statistics. The research will offer novel insights on post-fire forest recovery and composition, and its findings will provide a locally relevant record of forest change by (i) being spatially explicit, (ii) quantifying gross forest loss and gain, and (iii) quantifying trends in forest demography. The derived map products and statistics will empower the U.S. Forest Service, Alaska DNR, and private landowners to take measures for effective management of forest land and resources to sustain ecosystem services benefiting society and climate regulations.

How to cite: Panda, S.: Post-Fire (1983-2024) Boreal Forest Demography, Interior Alaska, EGU General Assembly 2025, Vienna, Austria, 27 Apr–2 May 2025, EGU25-14242, https://doi.org/10.5194/egusphere-egu25-14242, 2025.

EGU25-15790 | ECS | Posters on site | BG9.2

Optimizing point-cloud neighborhood calculation for classification 

Max Hess, Aljoscha Rheinwalt, and Bodo Bookhagen

The increasing global availability of dense point clouds provides the potential to better capture complex environments and their changes, e.g., forests state and growth, river erosion processes, city planing, etc. An important process for turning point clouds into useful datasets is their classification. The quality of classified point clouds relies on four critical processing steps: neighborhood definition, feature extraction and selection, quality of training data and classification model. Determining the optimal neighborhood for each point is essential for capturing local information, fast calculation, enhancing feature richness, and improving the quality of downstream processes.

We propose a novel method for constructing neighborhoods for geometric feature calculation using a kd-tree-based region-growing approach. We construct neighborhoods by selectively adding points guided by local point connectivity, normal orientations, and distance from the seed point. In particular, the local connectivity is determined by a nearest-neighbor graph, parameterized to connect only points belonging to the same object. Following this graph, points are added iteratively to the neighborhood if the angular difference between their normal orientations lies below a locally derived tolerance threshold. The growing process is limited by the distance from the seed point. The new neighborhoods maximize information gain while minimizing boundary crossings between classes, e.g., ground to wall (normal orientation) or branches to buildings (connectivity constraint). Our results demonstrate that this approach outperforms the classical spherical neighborhood and good classification results are more resilient to changes of the neighborhood size. 

Our analysis focus on the classification of urban areas, including ground, building, vegetation and other classes. We evaluate performance using datasets from various platforms, including airborne, mobile, and UAV systems and across different areas such as Berlin, Potsdam, and Paris. The effects of sensor characteristics and point-cloud densities are investigated as well as the improvement of individual features.

How to cite: Hess, M., Rheinwalt, A., and Bookhagen, B.: Optimizing point-cloud neighborhood calculation for classification, EGU General Assembly 2025, Vienna, Austria, 27 Apr–2 May 2025, EGU25-15790, https://doi.org/10.5194/egusphere-egu25-15790, 2025.

EGU25-16720 | ECS | Posters on site | BG9.2

The KIDA AI consultancy: Tree detection with satellite data 

Micha Schneider

The AI consultancy of the KIDA project is a collaboration between seven institutions within the area of the German Federal Ministry of Food and Agriculture. The members of the AI team solve service requests from the participating institutions on a cross-institutional basis. An advisory project is presented in which the AI team has trained a recurrent neural network (LSTM) to classify different tree species (e. g. deciduous trees, conifers) and tree species groups (e. g. oak, fir, ...) on time series of satellite images of sentinel-2. Several challenges as for example cloud covers had to be overcome. Finally, an accuracy of 97.9% was achieved for the classification of tree species, 98.4% for conifers and 91.6% for deciduous trees. The results show, how promising it is to carry out corresponding data collections in the future with the help of satellite data and AI to be able to recognise changes in the tree population quickly and efficiently in order to be able to react to them. In particular, large areas with relatively small sections (10m x 10m) could be monitored automatically. This opens up new opportunities in a rapidly changing world.

How to cite: Schneider, M.: The KIDA AI consultancy: Tree detection with satellite data, EGU General Assembly 2025, Vienna, Austria, 27 Apr–2 May 2025, EGU25-16720, https://doi.org/10.5194/egusphere-egu25-16720, 2025.

Accurate classification of forest types and tree species is an important aspect of forest monitoring but it requires vast amounts of spatio-temporal data. Remotely sensed data provides a viable solution for acquiring the necessary global-scale information. Historically multispectral data has been used for forest monitoring, but the limited number of spectrally-broad bands often do not provide sufficient differentiation between similar tree species, lowering classification accuracy. Hyperspectral data offers improved spectral resolution which enables to differentiate similar tree species. Nevertheless, the quality of ground truth data used for classification remains a challenge, as it is often limited and noisy.

This study presents a hierarchical, three-stage classification approach utilizing hyperspectral data, cascaded machine learning models and spectral unmixing algorithms to classify forest types and individual tree species. The approach integrates coarse level dataset for broad level classification and finer resolution hyperspectral imagery for fine-scale spectral and structural variability. Furthermore, to address the possibility of low quality ground truth labels we propose a semi-supervised training framework leveraging pseudo-labeling.

The cascaded three-stage architecture sequentially processes the data, with each stage consisting of an XGBoost model trained to address specific challenges. The first stage is a coarse classifier, classifying forest into three broad categories: Evergreen, Deciduous, and Mixed. This model is trained on coarse resolution 60m GSD EMIT data and supervised labels generated using the National Land Cover Database. The second stage further refines the three classes into 28 different forest group types labels as defined by the USDA Forest Service's Forest Inventory and Analysis (FIA). The third and the final stage classifies each of the forest pixels by its dominant tree species, leveraging the outputs from the previous stage and AVIRIS-NG high resolution 4m GSD hyperspectral data as additional input features. Non-dominant tree species are identified using Vertex Component Analysis based spectral unmixing and classified into pure tree species spectras using spectral similarity metrics. The abundances of dominant and non-dominant spectras are then mapped using the Fully Constrained Least Squares approach.

This method was tested over two regions: Shasta-Trinity National Forest, California, USA and Grand Mesa National Forest, Colorado, USA. The resulting tree distribution mapped 10 different individual tree species and were validated against USDA’s Treemap product . For these test regions the resulting overall accuracy from the entire 3-stage model is 80%. The individual stage accuracies for stage 1, stage 2, and stage 3 classification, were 94%, 92%,  and 92% respectively.

Despite these promising results, the approach is constrained by the availability of high-quality ground-truth data for supervised training. To address this, a pseudo-labeling technique that generates additional training data by iteratively assigning labels to unlabeled samples with high model confidence was explored. The preliminary results indicate that the inclusion of pseudo-labeled data training can enhance the classification accuracy of the proposed hierarchical cascaded approach for forest applications.

How to cite: Ambudkar, S., Kravitz, J., and Yeggina, S.: Hierarchical Classification of Forest Types and Tree Species Using Multi-Resolution Hyperspectral Data and Pseudo-Labeling for Enhanced Model Training, EGU General Assembly 2025, Vienna, Austria, 27 Apr–2 May 2025, EGU25-17277, https://doi.org/10.5194/egusphere-egu25-17277, 2025.

EGU25-17980 | Posters on site | BG9.2

Integrating ecological restoration and multi-temporal mobile laser scanning in a natural gas pipeline refurbishment: a case study in Veneto, Italy. 

Roberto Pierdicca, Mattia Balestra, Davide Moschini, and Marco Bonacoscia

Infrastructure development and environmental conservation are critical challenges in modern engineering. Although pipeline refurbishment projects are essential for maintaining the safety and reliability of energy transportation, can often lead to considerable environmental impacts. With our approach in Pieve di Soligo, Salgareda natural gas pipeline in the Veneto region (Italy) we adopted a sustainable approach to balancing industrial needs with ecological preservation. The pipeline route spans over 37 km across 12 municipalities. The pipeline company implemented a vegetative restoration plan across all the area, focusing on diverse interventions to ensure effective environmental recovery, employing grass planting techniques (hydraulic seeding and manual sowing) as well as reforestation, to reestablish forest or herbaceous cover. For restoration interventions, they planted tree and shrub species matching those present before the project began, placing protective measures such as anti-wild boar wire mesh, to mitigate external stressors. Moreover, they established a five-year cultivation care program, including irrigation, fertilization and pruning to support long-term success. To assess the effectiveness of these interventions, we employed the mobile laser scanner (MLS) FARO Orbis, equipped with SLAM (Simultaneous Localization and Mapping) technology, to capture high-resolution 3D data at four monitoring stations, mapping a total of 2300 m2 in approximately 25 minutes with a loop-close path. We conducted the surveys in July and October, obtaining a multi-temporal dataset which allows us for comparative analysis of trees growth over four months. The monitored areas included varied landscapes, from flat agricultural fields dominated by vineyards to moderately sloping wooded regions. We process the data using both FARO Connect and CloudCompare software. We aligned the two point clouds, acquired in different periods from the same area, by using the align command and then we isolated the monitored vegetation using the segment command. By using the CSF Filter plugin, we created the terrain meshes and from them we normalized the point clouds, obtaining the vegetation heights. We analyzed the tree growth patterns by measuring the differences in tree heights in the two survey periods, obtaining an index of the restoration’s effectiveness. Although we achieved vegetation-height assessments, it was not possible to extract variations in diameter at breast height (DBH) because the protective barriers around the trunks obstructed the LiDAR beams. Thanks to the MLS surveys, performed in different time of the year, we can effectively monitor the recovering process and understand if the choices made in the field are giving the expected results. This capability can also facilitate rapid corrective actions, where and if necessary. This study underscores the importance of integrating ecological principles with modern technological methods in infrastructure projects, which allow to extract measurements or observations that are difficult to obtain using traditional surveying techniques. Results from the analysis demonstrate effective recovery of vegetation, offering valuable insights into the long-term sustainability of restoration interventions.

How to cite: Pierdicca, R., Balestra, M., Moschini, D., and Bonacoscia, M.: Integrating ecological restoration and multi-temporal mobile laser scanning in a natural gas pipeline refurbishment: a case study in Veneto, Italy., EGU General Assembly 2025, Vienna, Austria, 27 Apr–2 May 2025, EGU25-17980, https://doi.org/10.5194/egusphere-egu25-17980, 2025.

EGU25-18078 | ECS | Orals | BG9.2

Validating tree inventory: Analysing tree structural properties from high-density airborne LiDAR point clouds and UAV imagery 

Sharad Kumar Gupta, Franz Schulze, Ulf Mallast, Ralf Gründling, Benjamin Brede, Anke Kleidon-Hildebrandt, Corinna Rebmann, Laura Dienstbach, and Patrick Schmidt

Forests are critical natural resources for human life and wildlife, as they sustain and protect biodiversity, and supply multiple ecosystem services. However, these ecosystems are vulnerable to human-driven climate change, necessitating automated systems to monitor structural changes at the individual tree level and assess forest responses to climate anomalies. Forest inventories, that contain accurate and detailed measurements of forest structure, are essential to improving our knowledge of ecosystem services and functions. UAV and LiDAR-based tree canopy detection is valuable for estimating essential ecosystem variables (EEVs). In this research, we have validated tree structural properties primarily diameter at breast height (DBH) and tree height obtained from UAV imagery and airborne LiDAR point cloud data using field measured data. We developed Drone4Tree, a user-friendly platform built on Streamlit and Flask that provides an end-to-end solution for processing UAV imagery. The platform processes UAV-acquired data to generate orthomosaics using OpenDroneMap, delineate tree crowns using U-Net based segmentation, and derive tree attributes such as tree height, canopy area etc.

The LiDAR data was processed using forest structural complexity tool (FSCT). This tool applies sensor agnostic semantic segmentation on the point cloud to obtain individual trees, stems and their structural properties. The LiDAR and UAV derived properties were joined with the field obtained parameters. Comparative analysis shows strong agreement between field DBH and LiDAR-derived DBH (R2 = 0.97), indicating reliable DBH estimation from LiDAR data. For tree height, the LiDAR-based measurements correlated well with field measured tree heights (R2 = 0.73), though comparisons with the UAV-based tree height (R2 = 0.97) obtained from canopy height models (CHM) revealed a lower correlation (R2 = 0.66). UAV-based tree height measurements show statistically significant relation with field measured height (R2 = 0.57). These results indicate that LiDAR and UAV data complement each other, with UAVs offering efficient monitoring capabilities while LiDAR providing additional precision.

These findings underscore the potential of integrating UAV and LiDAR technologies for accurate and efficient forest monitoring, enabling improved assessment of ecosystem functions and responses to climate change. By combining these complementary methods, platforms like Drone4Tree can support sustainable forest management and contribute to addressing the monitoring of global environmental changes.

How to cite: Gupta, S. K., Schulze, F., Mallast, U., Gründling, R., Brede, B., Kleidon-Hildebrandt, A., Rebmann, C., Dienstbach, L., and Schmidt, P.: Validating tree inventory: Analysing tree structural properties from high-density airborne LiDAR point clouds and UAV imagery, EGU General Assembly 2025, Vienna, Austria, 27 Apr–2 May 2025, EGU25-18078, https://doi.org/10.5194/egusphere-egu25-18078, 2025.

Persistent homology (PH) is a well-established mathematical approach that has been increasingly used to measure plant morphology. Stemming from topological data analysis, PH was developed as a mathematical framework to characterize topological relationships between data points. Structures are found by tracking topological features that persist across scales, making it resistant to noise and invariant to orientation and size.  The great advantage of PH lies in its ability to integrate several morphological features into a single metric value. In this way, it captures multiple and comprehensive measurements better than uni- or multivariate systems.  Consequently, PH enables an accurate quantification of phenological variations, quantifying the complete morphology of a plant, including growing branching structures. 

Most studies that use PH for plant morphology quantification use 2D images for the task. This is despite the fact that plants are essentially three-dimensional objects and should be analysed in that space. Studies that have explored PH in 3D focus on classification of man-made objects (e.g., toys or furniture). However, point clouds of trees that were acquired in their natural environment present a bigger challenge. There, the collected data is unevenly distributed, includes occlusions and highly depends on the season (leafing stage). All of these can vastly influence the topological analysis, and lead to incorrect structures. Not only that, but also the platform used to acquire the data might greatly affect the quantification. This is due to the point of view (i.e., from the air or terrestrially), which documents different parts of the tree. 

In this work, we test the applicability of PH for tree morphology characterization. We show how such an analysis enables us to describe various branching topologies. We use PH on individual trees that were acquired by different laser scanning platforms (i.e., UAV-borne and terrestrial), with and without leaves. This enables us to evaluate the potential of PH for 3D tree morphology characterization, test its limits, and explore its application in tree species classification.

How to cite: Arav, R.: Introducing persistence homology in 3D point cloud processing for tree morphology characterization, EGU General Assembly 2025, Vienna, Austria, 27 Apr–2 May 2025, EGU25-18085, https://doi.org/10.5194/egusphere-egu25-18085, 2025.

EGU25-18099 | ECS | Posters on site | BG9.2

Measuring Forest Inventory Attributes Using Faro Orbis Mobile Laser Scanner in Managed Boreal Forests 

Tuomas Yrttimaa, Lauri Liikonen, Aapo Erkkilä, Johanna Paakkari, Eetu Kotivuori, and Mikko Vastaranta

Forest and wood procurement planning requires detailed information about the quantities and characteristics of individual trees within forest stands. Stand-specific forest inventory data is increasingly being produced using remote sensing combined with accurately measured sample plots. In recent years, close-range sensing techniques such as terrestrial laser scanning (TLS) have been recognized as effective tools for providing precise measurements of tree characteristics—including features that cannot be directly measured nondestructively. To replace conventional field inventory methods using calipers and clinometers, there is a growing need for agile techniques that enable rapid and accurate measurements of all trees within inventoried sample plots. Mobile laser scanning (MLS) offers enhanced data acquisition speed by enabling detailed point cloud reconstructions of the surrounding forest environment on the move, making it an attractive technology for operational forest surveying, particularly for measuring forest sample plots. Previous studies have demonstrated the potential of MLS for individual tree characterization, but there remains a gap in understanding how its tree-level performance translates to plot-level accuracy under varying boreal forest conditions, where the presence of evergreen foliage often poses challenges for tree characterization.


The aim of this study was to evaluate how accurately MLS can measure forest stand attributes such as mean basal area (BA), tree density (number of trees per hectare; TPH), and basal area-weighted mean tree diameter and -height (Dg, Hg). Additionally, we investigated the scanning setups required to achieve accurate measurements of stand attributes across different forest types. The study was conducted in Heinävesi, Finland, where 50 plots (typically 30 m x 40 m in size) were measured tree by tree (n = 5227) in the field during the autumn of 2023. MLS data from these sample plots were collected using the Faro Orbis scanner in the summer of 2024. Trees were identified and their dimensions extracted from the point clouds, with plot-level forest stand attributes aggregated and compared to those measured using traditional caliper and clinometer methods.


Experiences from the data acquisition campaign highlighted the ease of MLS-based forest surveying, enabling agile data collection. Sample plots ranging from 370 to 2000 m² were captured within an average of 21 minutes, although more complex forest structures and walk paths increased the required time. Preliminary results indicate that, using semi-automatic tree detection methods, approximately 99.6% of trees with diameters greater than 5 cm were successfully identified. Diameter at breast height (DBH) and tree height were measured with RMSEs of 15.7% (2.5 cm) and 12.03% (2.9 m), respectively. At the plot level, these measurements provided unbiased estimates of basal area (G) and trees per hectare (TPH), while slightly overestimating Dg and Hg in more complex forests. These findings underscore the potential of MLS for operational forest inventory measurements.

How to cite: Yrttimaa, T., Liikonen, L., Erkkilä, A., Paakkari, J., Kotivuori, E., and Vastaranta, M.: Measuring Forest Inventory Attributes Using Faro Orbis Mobile Laser Scanner in Managed Boreal Forests, EGU General Assembly 2025, Vienna, Austria, 27 Apr–2 May 2025, EGU25-18099, https://doi.org/10.5194/egusphere-egu25-18099, 2025.

EGU25-18117 | Orals | BG9.2 | Highlight

TreeAI: a global database for tree species annotations and high-resolution aerial imagery 

Martin Mokros, Zhongyu Xia, Yan Cheng, Arthur Gessler, Teja Kattenborn, Xinlian Liang, Clemens Mosig, Stefano Puliti, Nataliia Rehush, Lars T. Waser, Verena C. Griess, and Mirela Beloiu Schwenke

Accurate and scalable tree species identification remains a critical challenge for global forest monitoring and management. Despite the increasing availability of remotely sensed data, the lack of standardized, high-quality ground truth datasets limits the potential of supervised machine learning models in capturing the tree diversity of forest ecosystems across different environmental and geographic contexts. Prior studies have highlighted the need for global-scale, high-resolution datasets to develop robust algorithms capable of capturing the diversity of forest ecosystems.

Towards a benchmark dataset for tree species identification in high-resolution aerial imagery. To address this critical gap, we introduce the TreeAI database, an open-access dataset designed to support advanced research in tree species identification and forest dynamics. The database comprises 53 datasets (47 publicly available) from 32 countries, representing 61,158 annotated trees across 5,000 ha of forest ecosystems, and it is still growing.

The TreeAI database provides annotations paired with high-resolution imagery (RGB and near-infrared bands at 1–10 cm spatial resolution, with an average of 3.5 cm). The database offers three key advancements. First, its global representation spans diverse ecosystems, climates, and species, enhancing its applicability across regions. Second, including centimetre-scale orthophotos ensures sufficient detail for identifying subtle differences between species. Finally, its community-driven design fosters ongoing contributions and ensures a dynamic dataset that evolves with the field's needs.

Preliminary tree species identification analysis using deep learning algorithms conducted for Switzerland, with very heterogeneous forest ecosystems and challenging topography, yielded promising results. The average F1-score for nine common species was 0.72, with Larix spp., Picea abies, and Tilia spp. exceeding 0.80. The mean average precision (mAP) across all the species was 0.76. These findings underscore the potential of the TreeAI. To further harness TreeAI’s potential, a scientific competition will be launched in 2025, challenging participants to develop deep-learning algorithms that maximize tree species identification accuracy across a broad range of forest ecosystems.

The impact of a global database for tree species annotations. The TreeAI database serves as a benchmark dataset for advancing artificial intelligence models, enabling automated forest inventory systems. This capability allows for the creation of high-resolution maps detailing tree species distributions, which can be used by researchers and practitioners for applications such as forest management, biodiversity monitoring, and ecosystem conservation. Moreover, the dataset complements existing National Forest Inventory (NFI) data, providing additional resources for point-based regional studies and enhancing ecological research at finer scales. Furthermore, the database promotes the refinement of AI models for practical forestry applications, fostering innovation in open science and collaborative research.

Further needs and collaboration potential: i.) expanding its geographic and tree species coverage, such as tropical forests, which remain inadequately sampled in existing datasets. ii.) integrating TreeAI with Earth observation platforms, such as Planet Scope, Sentinel-2, and GEDI. iii.) exploring methods to enhance data accessibility and interoperability, ensuring that the database meets the evolving needs of its users. Feedback from the broader forestry community will be instrumental in shaping these developments, emphasising addressing challenges related to data standardization, processing efficiency, and algorithm performance.

This contribution is based upon work from COST Action CA20118, supported by COST (European Cooperation in Science and Technology).

How to cite: Mokros, M., Xia, Z., Cheng, Y., Gessler, A., Kattenborn, T., Liang, X., Mosig, C., Puliti, S., Rehush, N., T. Waser, L., C. Griess, V., and Beloiu Schwenke, M.: TreeAI: a global database for tree species annotations and high-resolution aerial imagery, EGU General Assembly 2025, Vienna, Austria, 27 Apr–2 May 2025, EGU25-18117, https://doi.org/10.5194/egusphere-egu25-18117, 2025.

EGU25-18232 | ECS | Orals | BG9.2

Mapping Fractional Tree Mortality and Tree Cover at Global Scale Using Sentinel-1 and 2 

Clemens Mosig, Miguel Mahecha, Yan Cheng, Janusch Jehle, Samuli Junttila, Henrik Hartmann, Stéphanie Horion, David Montero, Mirela Beloiu Schwenke, and Teja Kattenborn

In the wake of extreme heat and drought events, excess tree mortality is increasing globally. While forest inventories provide valuable data for geolocating tree mortality, they are sparse and do not identify individual tree mortality. Aerial data captured by drones and airplanes provide precise centimeter-scale imagery that can be used to map individual tree mortality and fractional forest cover. The deadtrees.earth platform provides a comprehensive archive of annotated high-resolution orthoimages captured around the globe for different ecosystems and biomes. By using the imagery from deadtrees.earth, it is possible to detect and predict individual tree mortality and forest cover using high-resolution RGB orthoimagery at the regional scale. Here we present a methodology that allows generating global maps of tree mortality and fractional cover using satellite imagery from high-resolution aerial  orthoimagery. 
The Sentinel-2 satellite fleet, equipped with the MultiSpectral Instrument (MSI), covers the entire Earth within five days at spatial resolutions ranging from 10 m to 60 m. The Sentinel-1 satellite fleet offers global temporally continuous radar coverage that penetrates clouds.  Tree mortality and forest cover reference data in diverse ecosystems is obtained by using multiple segmentation models on the globally distributed high-resolution aerial orthoimagery database deadtrees.earth. Spatio-temporal signatures of Sentinel 1/2 satellites are then translated into forest properties by using novel Transformer architectures. In this study, we highlight how to map the share of standing deadwood and forest cover at 10 m resolution annually, generalizing to all ecosystems. This will enable us to map tree mortality and forest cover at a global scale at a new level of precision. 

How to cite: Mosig, C., Mahecha, M., Cheng, Y., Jehle, J., Junttila, S., Hartmann, H., Horion, S., Montero, D., Schwenke, M. B., and Kattenborn, T.: Mapping Fractional Tree Mortality and Tree Cover at Global Scale Using Sentinel-1 and 2, EGU General Assembly 2025, Vienna, Austria, 27 Apr–2 May 2025, EGU25-18232, https://doi.org/10.5194/egusphere-egu25-18232, 2025.

EGU25-18497 | ECS | Orals | BG9.2

Large-scale Monitoring of Forest Disturbances – a Future CLMS Prototype 

Linda Moser, Anna Grabatin-Homolka, Andreas Langner, Fahad Jahangir, Fabian Berndt, Stephanie Wegscheider, Bruno Menini Matosak, André Stumpf, Ines Ruiz, Martin Puhm, and Janik Deutscher

Forest change detection and monitoring is a key part of the Copernicus Land Monitoring Service (CLMS) (https://land.copernicus.eu/). Various methodologies already implement near real-time (NRT) forest monitoring in tropical regions (e.g. Reiche et al., 2021) with the focus on timely detection of deforestation activities. However, there is not yet an operational pan-European product tracking forest dynamics at such temporal frequency, which has moreover the capability to separate also subtle disturbances of the tree canopy from signal noise. This kind of product is under demand by the user community, hence a new CLMS prototype on “Continuous Forest Monitoring”, with the goal to capture natural and human-induced forest disturbances by detecting tree cover vitality loss on a monthly basis is tested and implemented within the Horizon Europe project Evolution of the Copernicus Land Service portfolio (EvoLand). In a second instance, the feasibility to detect disturbance agents, i.e., (i) windthrow/storm damage, (ii) wildfire, (iii) insect infestations, as well as (iv) human-induced disturbances (e.g., forest clearing, clear-cutting, and thinning activities) is tested.

Dense time series from Sentinel-2 serve as main input for both prototypes, supported by forest masks from the CLMS High Resolution Vegetated Land Cover Characteristics (HRL VLCC) and ancillary data on forest disturbance locations and agents. From a benchmarking of various tools, the Exponentially Weighted Moving Average (EWMA) – proposed by Brooks et al. (2014) for Landsat time series data and implemented as part of the JRC-NRT tool (https://github.com/ec-jrc/nrt) – yielded the most promising results, especially considering the balance between accuracy, NRT capability, and computational effort. It is an unsupervised data-driven approach using univariate input indices to detect location and timing of disturbances. A supervised classification to derive the disturbance agents is added on top.

This study describes the implementation and results of this prototype and compares the detected forest disturbance locations and dates to the radar-based Tree Cover Disturbance Monitoring (TCDM) product and the 3-yearly VLCC forest change product. Two large EvoLand European sites were chosen for a first phase implementation: one in Germany (analysis years 2019-2021) and another in Spain (analysis years 2020-2022). The evaluation is carried by disturbance agent, concluding to different effects on either the physical structure of the trees and/or the spectral signal of the canopy, and hence also on the suitability of a method of detection. Products are delivered at pixel level (10m spatial resolution), improving the 20m resolution of the currently available CLMS forest change products, while increasing the change frequency from 3-yearly or yearly to monthly.

The resulting information can be utilized to enhance forest management and planning, aid forest-related decision-making or contribute to reporting on forest-related EU policies. These two prototypes are proposed within EvoLand to enhance the CLMS forest portfolio and to meet or go beyond users' requirements and demands. 

How to cite: Moser, L., Grabatin-Homolka, A., Langner, A., Jahangir, F., Berndt, F., Wegscheider, S., Menini Matosak, B., Stumpf, A., Ruiz, I., Puhm, M., and Deutscher, J.: Large-scale Monitoring of Forest Disturbances – a Future CLMS Prototype, EGU General Assembly 2025, Vienna, Austria, 27 Apr–2 May 2025, EGU25-18497, https://doi.org/10.5194/egusphere-egu25-18497, 2025.

EGU25-18889 | ECS | Posters on site | BG9.2

Efficient derivation of allometric models using laser scanning for improved AGB estimations 

Benjamin Wild, Taskin Özkan, Florian Pöppl, Milutin Milenković, Florian Hofhansl, Jonas Lamprecht, Norbert Pfeifer, and Markus Hollaus

Above Ground Biomass (AGB), the total dry biomass found above the ground, plays a vital role in understanding the global carbon cycle and biodiversity. Recognized by international organizations as an Essential Climate Variable, AGB is a key component for carbon accounting and climate modeling. Despite its importance, accurately estimating AGB remains a challenge.

Allometric models have long been a central focus of research due to their critical importance in estimating variables such as AGB based on the relatively easy-to-measure single-tree parameters such as Diameter at Breast Height (DBH) and Tree Height (TH). This led to the development of numerous species- and biome-specific allometries. Many of these models are accessible through dedicated online platforms or published scientific studies. However, their derivation is resource-intensive, and they exhibit significant variability across different species and ecosystems, both limiting their broader applicability.

Terrestrial Laser Scanning (TLS), provides a non-destructive and highly accurate method for estimating AGB through volume calculation. TLS-generated point clouds can be processed into Quantitative Structure Models (QSMs) by fitting a hierarchy of cylinders to the 3D data, enabling precise AGB estimation. Additionally, these QSM-derived tree volumes can be used to optimize parameters for allometric models.

In this contribution, we explore the application of a novel toolbox to derive allometric models for diverse forest environments and species. The toolbox was employed to generate highly accurate single-tree volume measurements, which were combined with traditional measurements of DBH and TH to develop finely tuned allometric models. A key focus of the research is the investigation of an integrated workflow for enhancing traditional forest inventory practices. This workflow combines TLS-derived QSMs with in-situ measurements of DBH and TH, which, as demonstrated in various studies, can also be increasingly reliable obtained using smartphones. This approach introduces new possibilities for studying and monitoring AGB in forests with greater efficiency and broader accessibility.

How to cite: Wild, B., Özkan, T., Pöppl, F., Milenković, M., Hofhansl, F., Lamprecht, J., Pfeifer, N., and Hollaus, M.: Efficient derivation of allometric models using laser scanning for improved AGB estimations, EGU General Assembly 2025, Vienna, Austria, 27 Apr–2 May 2025, EGU25-18889, https://doi.org/10.5194/egusphere-egu25-18889, 2025.

EGU25-19718 | ECS | Orals | BG9.2

deadtrees.earth: tree mortality monitoring from local to global scales with AI and remote sensing 

Teja Kattenborn, Clemens Mosig, Janusch Vajna-Jehle, Yan Cheng, Henrik Hartmann, David Montero, Samuli Juntilla, Stéphanie Horion, Mirela Beloiu Schwenke, and Miguel Mahecha

Tree mortality rates are rising across many regions of the world. These are driven by the complex interplay of abiotic and biotic factors, including global warming, climate extremes, pests, pathogens, and other environmental stressors. Despite the urgency of understanding these dynamics, critical gaps remain in our ability to determine where trees are dying, why they are dying, and to predict future mortality hotspots. These knowledge gaps are primarily caused by missing data on tree mortality events. Ground-based observations, such as national forest inventories, are often sparse, inconsistent, and lack the spatial precision needed for comprehensive analysis. By contrast, satellite observations have a high temporal resolution, but their spatial resolution is often too coarse to identify individual trees. Earth observations combining drones and satellites, using machine learning, offer a promising avenue for mapping standing dead trees and uncovering the underlying drivers of tree mortality.

Here we  introduce deadtrees.earth, an initiative focusing on multi-scale remote sensing of tree mortality across scales. At its core, deadtrees.earth curates the largest archive of centimeter-scale RGB aerial imagery of forests, with over 2,000 orthoimages representing diverse forest biomes across continents and major forest types. Using extensive annotations of dead canopies, we develop computer vision models capable of automated semantic and instance segmentation of dead tree canopies in RGB orthoimages. These model variants demonstrate robustness across varying resolutions, biomes, and forest types, and can be applied to any orthoimage imagery submitted to the platform, enabling users to exploit these tools for their analysis.

These local-scale predictions derived from drone and airplane imagery form the foundation for training satellite-based AI models to monitor tree mortality and forest cover on a global scale. We showcase recent advancements in spatiotemporal transformer models utilizing Sentinel-1 and Sentinel-2 data to produce global-scale, annual maps of forest cover and standing deadwood fractions at 10-meter resolution.

A recent key functionality of the deadtrees.earth platform is its web-based annotation tools, which allow users to contribute additional training data or provide feedback on existing predictions. This crowdsourcing functionality promotes community engagement, facilitating continuous improvement and fostering trust in the provided aerial image-based and satellite-based models and products.

Future work will also include expanding the coverage of aerial imagery, particularly in underrepresented regions such as Asia and Africa, which remains a cardinal priority to ensure the inclusivity and representativeness of the platform’s global-scale analyses. Moreover, we aim to apply the data products in a range of use-cases, ranging from attribution and forecasting of mortality to calibrating mortality in dynamic vegetation models. By bridging local and global scales, this work offers a critical tool for monitoring forest mortality trends, contributing to climate change impact assessments, and enhancing predictive capabilities for ecosystem resilience.

How to cite: Kattenborn, T., Mosig, C., Vajna-Jehle, J., Cheng, Y., Hartmann, H., Montero, D., Juntilla, S., Horion, S., Beloiu Schwenke, M., and Mahecha, M.: deadtrees.earth: tree mortality monitoring from local to global scales with AI and remote sensing, EGU General Assembly 2025, Vienna, Austria, 27 Apr–2 May 2025, EGU25-19718, https://doi.org/10.5194/egusphere-egu25-19718, 2025.

EGU25-21636 | Orals | BG9.2

Sensor selection and 3D data representation in virtual forests 

Arnadi Murtiyoso, Normand Overney, and Deni Suwardhi

Advances in 3D reconstruction techniques have recently democratized point cloud generation methods in various domains, including forestry and general tree mapping. This in turn has been driving the development of the virtual forest concept. Despite its potential, this concept remains only vaguely defined within the forestry domain, often varying in meaning depending on its implementation. Recognizing this ambiguity, our work seeks to unify the diverse interpretations of virtual forests by proposing a standardized definition from a geomatics perspective. Two main ambiguities may be identified in the literature: first, which sensor to use in which case during the data acquisition phase of virtual forests. Second, how to represent the data in the virtual world. In an attempt to bridge these gaps, we introduce two critical concepts: the sensor-oriented Level of Scale (LoS) and the data-centered Level of Detail (LoD). The LoS concept aims to help 3D technology users in choosing which sensor is best suited for their purposes by using the scale of the scene and its complexity as the determining factors. This presents a very useful tool during the project planning phase, where balance between data quality and project budget is an important aspect. The LoD concept on the other hand, draws inspiration from established definitions in CityGML to represent trees in different complexities. In this study, the proposed LoD also incorporates an additional dimension to account for variations in data formats (e.g., mesh, point clouds, parametric models, etc.). These frameworks aim to clarify and structure the representation of virtual forests, addressing inconsistencies in their application across different contexts. A numerical analysis was also conducted to further highlight the practical implications of these concepts in improving the precision and utility of 3D vegetation mapping techniques. Although the findings of this study do not aim to establish an official standard—achieving this would require further collaborative efforts across disciplines—they provide a foundational framework for advancing standardization efforts. By offering a structured approach to defining and representing virtual forests, we hope to contribute to the broader development of practical, scalable guidelines that can be applied within forestry and related fields. This initiative marks a step forward in aligning geomatics with the needs of modern forestry applications.

How to cite: Murtiyoso, A., Overney, N., and Suwardhi, D.: Sensor selection and 3D data representation in virtual forests, EGU General Assembly 2025, Vienna, Austria, 27 Apr–2 May 2025, EGU25-21636, https://doi.org/10.5194/egusphere-egu25-21636, 2025.

EGU25-21885 | Orals | BG9.2

Benchmarking Software Solutions for Forest Inventory from Ground-Based Point Clouds 

Carlos Cabo, Natalia Rehush, Benjamin Wild, Arnadi Murtiyoso, Anna Iglseder, Markus Hollaus, and Martin Mokros

In the context of the COST Action 3DForEcoTech and an ISPRS scientific initiative, a benchmarking activity was conducted to evaluate the performance of 13 software solutions designed for automated forest inventory using ground-based point clouds. These tools, which serve as digital analogs to traditional forest inventories, were tested on 12 datasets from four distinct forest plots featuring diverse forest types and acquisition methods, including two different Terrestrial Laser Scanners (TLS) and a handheld laser scanner. The experiments, carried at TU Wien (Vienna, Austria) in September 2023, with 15 researchers working on identical computing environments, assessed each software’s ability to detect trees, extract the positions, and estimate DBH, along with computational efficiency. Results showed that while most solutions achieved good performance, a few significantly outperformed the rest in accuracy and processing time, whereas others struggled with larger point clouds, highlighting important differences in scalability and robustness. This study provides valuable insights into the current capabilities and limitations of automated forest inventory tools, guiding both researchers and practitioners in selecting the most suitable software for their needs.

Keywords: LiDAR, TLS, Forest Inventory, DBH Estimation, Software Benchmarking, Point Cloud Processing, 3DForEcoTech

How to cite: Cabo, C., Rehush, N., Wild, B., Murtiyoso, A., Iglseder, A., Hollaus, M., and Mokros, M.: Benchmarking Software Solutions for Forest Inventory from Ground-Based Point Clouds, EGU General Assembly 2025, Vienna, Austria, 27 Apr–2 May 2025, EGU25-21885, https://doi.org/10.5194/egusphere-egu25-21885, 2025.

EGU25-21887 | Orals | BG9.2

3DFin and 3DFos: Open-Source CloudCompare Plugins for Automated 3D Forest Inventory and Classification 

Cristina Santin, Diego Laiño, Celestino Ordoñez, Nuria Sánchez-López, and Carlos Cabo

Accurate forest inventories are crucial for sustainable management, but processing ground-based LiDAR and photogrammetric point clouds remains complex and inaccessible to many users. 3DFin addresses this gap as a fully automated, open-source software for extracting key tree metrics—tree height, diameter at breast height (DBH), and tree location—from Terrestrial Laser Scanning (TLS), Mobile Laser Scanning (MLS), and photogrammetry-derived point clouds. Unlike existing tools, 3DFin is designed for complete ease of use, requiring no technical expertise, allowing any user—regardless of experience—to generate forest inventory data with just two clicks. Integrated as a plugin in CloudCompare, the most widely used free software for 3D point cloud processing, 3DFin seamlessly fits into existing workflows without requiring additional installations or programming. Tested on publicly available datasets across diverse forest conditions, it achieves near-perfect tree detection rates and DBH estimations with RMSE <2 cm, all while processing plots in just 2–7 minutes. By bringing cutting-edge point cloud analysis to a broader audience, 3DFin makes advanced forest inventory processing accessible to all, bridging the gap between research and real-world application. In addition, we also introduce here 3DFos, a soon-coming open-source plugin in CloudCompare which automatically segments forest point clouds in vegetation classes such as stems, branches and leaves, understory and ground.

Keywords: CloudCompare, LiDAR, TLS, MLS, Photogrammetry, Tree Metrics, Open-Source, Forest Inventory

How to cite: Santin, C., Laiño, D., Ordoñez, C., Sánchez-López, N., and Cabo, C.: 3DFin and 3DFos: Open-Source CloudCompare Plugins for Automated 3D Forest Inventory and Classification, EGU General Assembly 2025, Vienna, Austria, 27 Apr–2 May 2025, EGU25-21887, https://doi.org/10.5194/egusphere-egu25-21887, 2025.

EGU25-826 | ECS | Posters on site | BG9.4

Global canopy temperature estimation by integrating satellite observations and ground measurements 

Hongliang Ma, Guy Schurgers, and Jing Tang

Canopy temperature is a vital indicator of plant-environment interactions, playing a key role in assessing drought impacts and water use efficiency and understanding the global carbon cycle. Despite existing efforts on ground measurements at FLUXNET and ICOS sites, satellite Land Surface Temperature (LST) has been widely used as a proxy for canopy temperature in studies at different scales. However, satellite-based LST represents a mixture of vegetation, snow and soil temperatures, leading to biases in estimating plant-related processes, particularly for temperature-limited regions. Up to now, there is still no available global canopy temperature product.

To bridge the research gap, this study first combines in-situ canopy temperature measurements (from outgoing longwave radiation and thermal camera), satellite LST into a machine learning model for global canopy temperature mapping. In the algorithm, vegetation cover, ERA5 soil and air temperatures as well as other auxiliary data were adopted for estimating canopy temperature, by removing the contributions of soil and air information to satellite LST. The primary validation results over more than global 130 sites, by separating training group (2/3) and evaluation group (1/3), indicated the retrieval of canopy temperature is encouraging, by achieving average RMSE (Root Mean Squared Error) of 2.80 K, Bias of 0.12 K and correlation coefficient (R) of 0.96, against ground measurements. In the next steps, more auxiliary data including net radiation, vegetation water, vapor pressure deficit, wind speed, soil moisture and vegetation parameters, will be included for the retrieving and final global product development. In the process, the interactions of these variables with the targeted canopy temperature will be also investigated. The final global daily canopy temperature for more than 20 years, with a spatial resolution of 0.25°, will be released and further used to evaluate the land surface version of the dynamic vegetation model, LPJ-GUESS, to assess the impacts of canopy instead of air temperature on influencing global terrestrial water-carbon cycles.

How to cite: Ma, H., Schurgers, G., and Tang, J.: Global canopy temperature estimation by integrating satellite observations and ground measurements, EGU General Assembly 2025, Vienna, Austria, 27 Apr–2 May 2025, EGU25-826, https://doi.org/10.5194/egusphere-egu25-826, 2025.

EGU25-1583 | Orals | BG9.4

Enhanced winter wheat LAI retrieval from Sentinel-2: asoil-informed radiative transfer based approach 

Sélène Ledain, Anina Gilgen, and Helge Aasen

Leaf Area Index (LAI) is a key trait related to several agronomic issues such as soil cover, plant health, crop productivity, biomass and yield estimation. Availability of high-resolution LAI information at large scale is crucial for monitoring and managing agricultural landscapes effectively [1], as it can help monitor growth conditions and adapt practices. However, its satellite-based assessment is confounded by several factors such as soil background, vegetation type and noise. Today, the retrieval of LAI through the inversion of a radiative transfer model (RTM) is state-of-the-art. Still, research investigating the performance of crop-type specific models compared to across-biome models such as the ESA’s Sentinel Application Platform (SNAP) and in-situ data is rare. 

In this research we propose to improve the combined leaf and canopy PROSAIL [2] RTM crop-specific reflectance simulations by integrating soil spectra into this model. We specifically sample Sentinel-2 spectra from fields over which we perform LAI retrieval. A neural network is trained to invert the RTM. To scale this strategy to larger areas (i.e. country scale) we exploit Sentinel-2 observations of bare soil and use clustering methods to generate a condensed soil dataset representing varying background conditions across space.

We use Switzerland to test the approach, with in-situ measurements of winter wheat from 2022 and 2023 available for validation. We focus on Sentinel-2 imagery for its high temporal and spatial resoltuions. Preliminary results show that a model trained on a data generated with a Switzerland-wide soil dataset and constrained for winter wheat (CH-LAI-WW model) outperformed predictions (nRMSE: 0.180) obtained from a classic setup without the soil inclusion (nRMSE: 0.201). Furthermore, prediction errors were improved compared to the across-biome SNAP LAI processor (nRMSE: 0.268). The proposed methodology demonstrates a way to improve the crop- and biome-specific prediction of key traits and consequently to improve the reliability for agricultural monitoring and management applications.

[1] B. Brisco, R. Brown, T. Hirose, H. McNairn, and K. Staenz, “Precision agriculture and the roleof remote sensing: A review,” Canadian Journal of Remote Sensing, vol. 24:3, pp. 315–327, 1998

[2] S. Jacquemoud, W. Verhoef, F. Baret, C. Bacour, P. J. Zarco-Tejada, G. P. Asner, C. François, and S. L. Ustin, “PROSPECT+SAIL models: A review of use for vegetation characterization,” Remote Sensing of Environment, vol. 113, pp. S56–S66, Sept. 2009.

How to cite: Ledain, S., Gilgen, A., and Aasen, H.: Enhanced winter wheat LAI retrieval from Sentinel-2: asoil-informed radiative transfer based approach, EGU General Assembly 2025, Vienna, Austria, 27 Apr–2 May 2025, EGU25-1583, https://doi.org/10.5194/egusphere-egu25-1583, 2025.

Understanding global patterns of tree water use is crucial for predicting forest resilience and ecosystem responses under climate change. Despite its importance, a high-resolution global assessment of tree water-use where observations are not available remains lacking. This study aims to create a global map of tree water use using machine learning approaches applied to sap flow measurements. Here we leverage the SAPFLUXNET database, a global repository of standardized sap velocity measurements, combined with remote sensing, meteorological, and tree characteristics data utilizing machine learning techniques to estimate global gridded sap velocity. We employ an ensemble learning approach with two distinct setups: site-level and plant-level setup. The site-level setup aggregates plant measurements at each location and incorporates site-level predictors, while the plant-level setup utilizes individual measurements with both site and plant-level variables. For each setup, we implement four machine learning algorithms: Support Vector Machine, Random Forest, XGBoost, Artificial Neural Networks and Long Short-Term Memory. To optimize predictor selection and prevent model complexity, we employ the Guided Hybrid Genetic Algorithm. The final ensemble estimate will be derived as the median of all predictions. This analysis yields two major outcomes. First, the ensemble learning approach produces a daily global dataset of sap velocity at 0.1 ° from 2000-2018 and reveal global patterns of tree water use, highlighting systematic variations across biomes and their relationship to environmental gradients. Second, our methodology identified the relative importance of predictors, and dominant climatic controls across different ecosystems. These findings will advance our understanding of forest ecosystem responses to environmental change and support more accurate predictions of forest resilience under future climate scenarios.

Key words: tree water-use, machine learning, SAPFLUXNET, climate change

How to cite: Luo, Y. and Gharun, M.: Predicting Global Patterns of Tree Water Use: An Ensemble Learning Approach Using SAPFLUXNET, EGU General Assembly 2025, Vienna, Austria, 27 Apr–2 May 2025, EGU25-2473, https://doi.org/10.5194/egusphere-egu25-2473, 2025.

EGU25-2597 | ECS | Orals | BG9.4

Next generation Arctic vegetation maps: Aboveground plant biomass and woody dominance mapped at 30 m resolution across the tundra biome 

Kathleen Orndahl, Logan Berner, Matthew Macander, and Scott Goetz and the The Arctic Plant Aboveground Biomass Mapping Team

The Arctic is warming faster than anywhere else on Earth, placing tundra ecosystems at the forefront of global climate change. Plant biomass is a fundamental ecosystem attribute that is sensitive to changes in climate, closely tied to ecological function, and crucial for constraining ecosystem carbon dynamics. However, the amount, functional composition, and distribution of plant biomass are only coarsely quantified across the Arctic. Therefore, we developed the first moderate resolution (30 m) maps of live aboveground plant biomass (g m-2) and woody plant dominance (%) for the Arctic tundra biome, including the mountainous Oro Arctic. We modeled biomass for the year 2020 using a new synthesis dataset of field biomass harvest measurements, Landsat satellite seasonal synthetic composites, ancillary geospatial data, and machine learning models. Additionally, we quantified pixel-wise uncertainty in biomass predictions using Monte Carlo simulations and validated the models using a robust, spatially blocked and nested cross-validation procedure. Observed plant and woody plant biomass values ranged from 0 to ~6,000 g m-2 (mean ≈ 350 g m-2), while predicted values ranged from 0 to ~4,000 g m-2 (mean ≈ 275 g m-2), resulting in model validation root-mean-squared-error (RMSE) ≈ 400 g m-2 and R2 ≈ 0.6. Our maps not only capture large-scale patterns of plant biomass and woody plant dominance across the Arctic that are linked to climatic variation (e.g., thawing degree days), but also illustrate how fine-scale patterns are shaped by local surface hydrology, topography, and past disturbance. By providing data on plant biomass across Arctic tundra ecosystems at the highest resolution to date, our maps can significantly advance research and inform decision-making on topics ranging from Arctic vegetation monitoring and wildlife conservation to carbon accounting and land surface modeling.

How to cite: Orndahl, K., Berner, L., Macander, M., and Goetz, S. and the The Arctic Plant Aboveground Biomass Mapping Team: Next generation Arctic vegetation maps: Aboveground plant biomass and woody dominance mapped at 30 m resolution across the tundra biome, EGU General Assembly 2025, Vienna, Austria, 27 Apr–2 May 2025, EGU25-2597, https://doi.org/10.5194/egusphere-egu25-2597, 2025.

EGU25-3300 | ECS | Orals | BG9.4

Advancing Soil Health Monitoring:  A Machine Learning Approach 

Matteo Dalle Vaglie, Federico Martellozzo, Gherardo Chirici, and Saverio Francini

Soil is fundamental to ecosystem services, agriculture, and climate regulation, serving as a medium for water and nutrient absorption, a habitat for biodiversity, and a major reservoir for organic carbon. Yet, soil faces increasing threats from degradation caused by intensive land use, deforestation, and climate change, which jeopardize food security and environmental sustainability.To address these challenges, this work harnesses recent advances in remote sensing and data analytics to create a comprehensive global soil dataset spanning from 1985 to 2023. This dataset covers five key properties: pH, salinity, nitrogen, phosphorus, and organic carbon content. By leveraging Google Earth Engine and machine learning algorithms, we generated global, high-resolution maps that enable researchers to monitor changes in soil health over time and predict future trends.The primary objective of this dataset is to support decision-making for sustainable land management, agriculture, and environmental conservation. It offers a critical tool for combating soil degradation and mitigating its impacts, empowering stakeholders with actionable insights to preserve and restore soil health on a global scale.

How to cite: Dalle Vaglie, M., Martellozzo, F., Chirici, G., and Francini, S.: Advancing Soil Health Monitoring:  A Machine Learning Approach, EGU General Assembly 2025, Vienna, Austria, 27 Apr–2 May 2025, EGU25-3300, https://doi.org/10.5194/egusphere-egu25-3300, 2025.

EGU25-5160 | ECS | Posters on site | BG9.4

An inland wetlands monitoring framework leveraging remote sensing and reanalysis-based datasets: a case study of 60 inland wetlands in south korea 

Seunghyun Hwang, Jongjin Baik, Seoyeong Ku, Jeemi Sung, and Changhyun Jun

Abstract

This research proposes a comprehensive and sustainable framework for wetland monitoring by evaluating the wetland environmental superiority index (WESI) of inland wetlands using a long short-term memory (LSTM) model. The WESI estimation method aims to establish a long-term and periodic monitoring system for extensive regions based on remote sensing and reanalysis data. To achieve this, exemplary wetland sites representing high-quality and vulnerable wetlands were selected, with a label of 1 assigned to high-quality wetlands and 0 to vulnerable wetlands. These exemplary wetland sites provide the target variables for training the LSTM-based WESI estimation model, while remote sensing and reanalysis datasets closely associated with the environmental characteristics of inland wetlands are utilized as input variables. In this study, a comprehensive database comprising 13 types of hydrometeorological, vegetation, topographic, and carbon-related remote sensing and reanalysis datasets was established. Additionally, 30 exemplary high-quality and 30 vulnerable inland wetlands—identified based on the field survey conducted by the National Institute of Ecology (NIE) in South Korea—were used to evaluate the applicability of the proposed framework. The WESI estimation method is expected to contribute to the establishment of a long-term, continuous monitoring system for inland wetlands by leveraging the stable data production capabilities of remote sensing and reanalysis data.


Acknowledgement

This work was supported by the National Research Foundation of Korea(NRF) grant funded by the Korea government(MSIT) (RS-2024-00334564) and in part by Korea Environmental Industry&Technology Institute (KEITI) through Wetland Ecosystem Value Evaluation and Carbon Absorption Value Promotion Technology Development Project, funded by Korea Ministry of Environment (MOE). (2022003640001)

How to cite: Hwang, S., Baik, J., Ku, S., Sung, J., and Jun, C.: An inland wetlands monitoring framework leveraging remote sensing and reanalysis-based datasets: a case study of 60 inland wetlands in south korea, EGU General Assembly 2025, Vienna, Austria, 27 Apr–2 May 2025, EGU25-5160, https://doi.org/10.5194/egusphere-egu25-5160, 2025.

The Qinghai-Tibet Plateau (QTP) harbors significant amounts of soil organic carbon (SOC) in the permafrost regions, which are at risk of release as carbon dioxide or methane under global warming, amplifying the greenhouse effect. Despite this, long-term investigations into the spatiotemporal dynamics of SOC in the QTP's permafrost regions remain scarce. Furthermore, spatial scale mismatches between SOC maps and thermokarst landscape maps hinder a comprehensive understanding of carbon cycling mechanisms in these landscapes. Hyperspectral data, with its superior spectral richness, offers the potential to more precisely capture soil spectral characteristics, enhancing the accuracy of SOC estimations. However, the limited availability of long-term hyperspectral datasets for the QTP presents a major challenge to leveraging this technology for SOC estimation.

In this study, we developed a physically constrained hyperspectral generative model that integrated spectral response functions and diffusion models, utilizing satellite data from Landsat 5 TM, Landsat 7 ETM+, Landsat 8 OLI, and EO-1 Hyperion imagery. This method generated high-accuracy hyperspectral data (MSSIM = 0.96, PSNR = 38.65) for the permafrost regions of the QTP from 2000 to 2020, with a spatial resolution of 30 m and a spectral resolution of 10 nm. Leveraging these generated hyperspectral data, we constructed spectral indices and incorporated climate, topography, and soil characteristics into a dual-input convolutional neural network model. This model enabled the mapping of the spatiotemporal distribution of SOC in the 0-3 m layer across the QTP’s permafrost regions from 2000 to 2020 with resolution of 30 m. Compared to existing approaches, our model achieved a 22.9% improvement in the accuracy of SOC estimation in permafrost regions, highlighting its potential for advancing carbon estimation.

How to cite: Ni, C. and Zhu, B.: Digital mapping of soil organic carbon in permafrost regions over the Qinghai-Tibet Plateau based on deep learning and hyperspectral imaging, EGU General Assembly 2025, Vienna, Austria, 27 Apr–2 May 2025, EGU25-7977, https://doi.org/10.5194/egusphere-egu25-7977, 2025.

The Integration of extensive user-generated data, for example, Points of Interest (POI), along with novel advances in machine learning that are applied in the analysis of satellite imagery, brings about a revolutionary approach toward urban land use classification bridging significant deficiencies in understanding the dynamics of urban life. POI data captures much of the various social and economic activities, whereas satellite imagery expresses spatial and physical context, but neither together captures the complexities of the urban setting. This paper proposes a new approach in which all these types of data are fused into a single text-based format through transformation of structured POI datasets and satellite images, thus enabling topic modeling for the classification and mapping of land use. The integration of these data formats addresses a variety of challenges, such as spatial heterogeneity, non-linear relationships, and extrapolation artifacts, to allow for a scalable and precise solution in urban data analysis. This methodology is in line with the challenges and opportunities that large-scale mapping presents, whereby machine learning algorithms can yield robust and spatially explicit predictions by connecting diverse datasets. This approach improves the accuracy and resolution of urban land use maps and thus offers insights into the interplay of human activities and physical spaces, which are very important for planning and policy-making in urban regions. The results demonstrate significant promise as the combination of POI data and satellite imagery enhances the understanding of complex urban systems and supports sustainable development with practical tools for designing more adaptable and resilient urban environments. Moreover, this contribution is aligned with the session focus on comprehensive mapping techniques addressing some of the biggest challenges in upscaling data; building representative measurement models; handling uncertainty; and ensuring robust validation. In so doing, it helps to further develop better policies for urban land use, besides contributing to overall goals of mapping environmental variables in diverse and dynamic environments. This methodology not only enhances the techniques of urban planning but also sets a benchmark for the incorporation of intricate datasets to improve comprehension and management of the difficulties faced by contemporary urban areas, thereby promoting a more profound relationship between human actions and the physical contexts in which they take place.

How to cite: Dabbanavar, R. S. and Biswas, A.: Integrating User-Generated POI Data and Satellite Imagery for Enhanced Urban Land Use Classification: A Topic Modeling Approach, EGU General Assembly 2025, Vienna, Austria, 27 Apr–2 May 2025, EGU25-8380, https://doi.org/10.5194/egusphere-egu25-8380, 2025.

EGU25-11949 | ECS | Orals | BG9.4

Evaluating the impact of multimodal climate and satellite time series in species distribution modeling using MaskSDM 

Robin Zbinden, Julie Charlet, Gencer Sümbül, and Devis Tuia

Species distribution models (SDMs) are vital tools for monitoring biodiversity. By relating environmental conditions to species occurrences, these statistical models enable the mapping of species distribution and provide insights into the key drivers influencing their patterns. In this context, the recently proposed MaskSDM approach presents a novel opportunity to highlight and interpret the influence of input variables and data modalities on the modeled outcomes. By leveraging masked data modeling during training, MaskSDM allows the flexible selection of any subset of input variables, based on their availability for the given location and their relevance to the target species. This flexibility enables the evaluation of both predictions and model performance dynamics across different subsets of variables.

In this study, we use MaskSDM to investigate the impact of using time series alongside traditional tabular data for modeling the distribution of plant species across Europe. The temporal dimension of ecological processes is crucial, with phenology playing a significant role in driving plant species behavior and distribution. Time series data effectively capture these dynamic processes, providing valuable insights to the model. For our analysis, we utilize the GeoPlant dataset, which comprises monthly climatic time series for temperature and precipitation, as well as satellite-derived time series spanning six spectral bands at a quarterly resolution. These satellite data capture local patterns, such as seasonal vegetation changes and the effect of extreme natural events like wildfires.

MaskSDM being based on a transformer model, we evaluate several approaches for tokenizing the time series data, and assess the individual contribution of each input. Our results show that the performance of different tokenization methods is comparable. We then examine the effect of incorporating various types of time series data on model performance and compare it to the use of tabular data only: adding satellite time series increases the AUC on the spatially separated test set by 2.4%. The addition of climatic time series yields a smaller improvement, likely because the tabular data already includes some aggregated form of statistics redundant to these time series. The best performance is achieved by combining all time series data with the tabular data, showing their complementary nature. 

Finally, we produce species distribution maps that consider different data types. The impact of adding time series data to the tabular data is evident after the analysis of the maps, which become closer to the spatial distribution of the presence observations. These findings emphasize the importance of incorporating time series data into SDMs, particularly satellite data, as it captures temporal dynamics that are difficult to represent through tabular data alone.

How to cite: Zbinden, R., Charlet, J., Sümbül, G., and Tuia, D.: Evaluating the impact of multimodal climate and satellite time series in species distribution modeling using MaskSDM, EGU General Assembly 2025, Vienna, Austria, 27 Apr–2 May 2025, EGU25-11949, https://doi.org/10.5194/egusphere-egu25-11949, 2025.

EGU25-12250 | ECS | Orals | BG9.4

Evaluation of Machine Learning Approaches and their Extrapolation for Flood Hazard Mapping 

Aman Arora, Olivier Payrastre, and Pierre Nicolle

This research has two primary aims: first, to assess the capability of machine learning (ML) techniques generally used for flood susceptibility mapping in replicating flood hazard maps derived from hydraulic modeling, and second, to apply the trained ML models to unseen catchments using a similar set of parameters. The study focuses on two catchments—Argens and Gapeau—located in South-Eastern France. Reference flood hazard maps were generated using the FLOODOS 2D hydraulic model at a 5-meter resolution, simulating water depths for a 1,000-year return period across 1,163.1 km of rivers. From these maps, a balanced dataset of flood and non-flood points was created and split into training and validation subsets (70:30) via random sampling. The analysis employed several geo-environmental factors as explanatory variables, including a 5-meter resolution Digital Terrain Model, Height Above Nearest Drainage, river slope, and river discharge data used in hydraulic modeling. Three advanced ML models—artificial neural networks, random forests, and extreme gradient boosting—were trained on this dataset. These trained models were then tested on the Gapeau region to evaluate their robustness and effectiveness in replicating flood hazards. Model performance was assessed using metrics such as the Area Under the Receiver Operating Characteristic Curve (AUROC) and the Critical Success Index, which measure prediction accuracy for flood extents. Results indicated that ML models effectively mapped flood hazards in complex geo-topographic regions like the Argens basin. Notably, two models achieved AUROC scores exceeding 0.9 when applied to the untrained Gapeau region, demonstrating good transferability and predictive accuracy.

How to cite: Arora, A., Payrastre, O., and Nicolle, P.: Evaluation of Machine Learning Approaches and their Extrapolation for Flood Hazard Mapping, EGU General Assembly 2025, Vienna, Austria, 27 Apr–2 May 2025, EGU25-12250, https://doi.org/10.5194/egusphere-egu25-12250, 2025.

EGU25-12808 | ECS | Orals | BG9.4

Space versus Time: Better Spatial Representation in Training Beats Longer Time Series for Predicting Global Land Carbon Uptake Variability 

David Hafezi Rachti, Christian Reimers, and Alexander J. Winkler

Land ecosystems play a crucial role in the global carbon cycle, absorbing large amounts of atmospheric CO2 through photosynthesis and releasing it back through decomposition and respiration. However, predicting the net carbon flux is a complex task, as meteorological variability affects these processes in different ways and at various timescales. Data-driven models, such as global upscaling methods based on local flux tower measurements, struggle especially to accurately predict the year-to-year fluctuations in the net terrestrial carbon uptake, known as inter-annual variability (IAV). These difficulties are often being attributed to a lack of observational data, however, do we need longer time series of terrestrial carbon flux observations or better spatial coverage to improve IAV predictions?

Here, we test the change in performance of an interpretable machine learning (ML) framework given growing training datasets of different properties created based on output from a global land surface model (JSBACH3.2). All training datasets have an initial setting comparable to the actual observational setting (FLUXNET sites). We scale the training datasets either by increasing the number of pixels in training (space model), or by extending the time series (time model), or both (space-time model), however, we keep the increment in additional training samples to each training dataset constant. The ML framework is trained on the training datasets of different sizes and characteristics and evaluated in predicting IAV on an independent test set. To take the various effective time scales into account, our ML framework* is based on a wavelet transform of the predictor variables and a convolutional neural network to jointly predict carbon and water fluxes.

Our results confirm that increasing the sample size in the training dataset substantially enhances the performance in predicting global IAV. Further, we find that increasing the spatial coverage during training improves model performance in predicting IAV more (space model; ΔR2=0.83) than increasing the length of the time series (time model; ΔR2=0.60) compared to the initial setup. Overall, the model trained with the largest number of pixels (space-model) outperforms the other models for the same total number of training samples but fewer pixels. Using the interpretable ML technique based on the wavelet transform, we investigate the differences among the three models towards their sensitivity to different meteorological factors. We focus this analysis part on test pixels where the space and time models show the largest performance discrepancy.

In conclusion, our study demonstrates that a large spatial representation in the observational training data is more important than longer observational time series for predicting year-to-year fluctuations in global land carbon uptake.

*Reimers, C., Hafezi Rachti, D. , Liu, G., & Winkler, A. J. (2024). Comparing Data-Driven and Mechanistic Models for Predicting Phenology in Deciduous Broadleaf Forests. arXiv preprint arXiv:2401.03960.

How to cite: Hafezi Rachti, D., Reimers, C., and Winkler, A. J.: Space versus Time: Better Spatial Representation in Training Beats Longer Time Series for Predicting Global Land Carbon Uptake Variability, EGU General Assembly 2025, Vienna, Austria, 27 Apr–2 May 2025, EGU25-12808, https://doi.org/10.5194/egusphere-egu25-12808, 2025.

  Due to the effects of global climate change, Korea is experiencing intensified heavy rainfall, leading a rapid runoff along with large amount of non-point source pollution flow into water bodies, posing a significant threat to the aquatic ecosystem and water supply system. Especially, stagnant water bodies are highly susceptible to eutrophication due to these pollutants, and warm water temperatures further cause the occurrence of the algal blooms. As such, developing accurate spatio-temporal monitoring of water quality parameters (WQPs) over water body become essential. In Korea, algae-related WQPs such as chlorophyll-a (Chl-a) and microcystin are mainly monitored using fixed observation stations. Korea operates 76 automated monitoring stations, but these methods have limitations in capturing the spatial distribution of WQPs. Furthermore, manual stations collect data once a week, resulting in the lack of spatio-temporal continuity.

  In this study, we developed and validated a Chl-a estimation model based on Random Forest Regression over Daecheong Lake using surface reflectance data from the Geostationary Ocean Color Imager-II (GOCI-II) onboard the Geo-Kompsat-2B (GK-2B) satellite. GOCI-II  provides surface reflectance eight times per day at a spatial resolution of 250 m. The point observation data consisted of hourly Chl-a concentrations obtained from the Korean Water Environment Information System. The study period spanned three years (January 2021 to December 2023). For model development, the dataset was randomly divided into a 7:3 ratio for training and testing. The model's input variables included the spectral bands of GK-2B GOCI-II, the normalized difference chlorophyll index, the normalized fluorescence height index, and the fluorescence line height. The dependent variable was the log-transformed Chl-a data. Furthermore, the study assessed the model's efficiency by sequentially removing input variables based on their feature importance rankings.

  As a result, the statistically optimal combination of input variables included all seven variables. The model's performance showed bias, Root Mean Square Error, and Correlation Coefficient values of -0.0041 ppb, 0.1649 ppb, and 0.91, respectively. Despite these favorable statistical results, uncertainties were observed during periods of extremely low or high Chl-a concentrations. Finally, the spatial distribution of Chl-a was estimated using the developed model demonstrated a clear spatial pattern with seasonal variations. However, uncertainties were evident at the boundaries between water bodies and land surfaces. These uncertainties likely arose due to the limited spatial resolution of 250 m, which was insufficient for capturing narrow lake widths.

  Future studies should address these limitations, focusing on spatial downscaling of surface reflectance to reduce boundary-related uncertainties, as well as minimizing the underestimation/overestimation of extreme Chl-a values through establishing seperate training based on the seasonal characteristics or temporal behavior of hydrometeorological variables.

Acknowledgement: This work was supported by the National Research Foundation of Korea(NRF) grant funded by the Korea government(MSIT)(RS-2024-00416443).

How to cite: Park, K. and Park, J.: Development and validation of chlorophyll-a estimation model using GOCI-II land surface reflectance and machine learning at Daecheong Lake in South Korea, EGU General Assembly 2025, Vienna, Austria, 27 Apr–2 May 2025, EGU25-14300, https://doi.org/10.5194/egusphere-egu25-14300, 2025.

EGU25-14472 | ECS | Orals | BG9.4

CMLR: A Mechanistic Global GPP Dataset Derived from TROPOMIS SIF Observations 

Ruonan Chen, Liangyun Liu, Xinjie Liu, and Uwe Rascher
Solar - induced chlorophyll fluorescence (SIF) holds great potential for estimating gross primary production (GPP). Nevertheless, currently, there is an absence of open-access global GPP datasets that directly utilize SIF with models clearly expressing the biophysical and biological processes in photosynthesis.
This study presents a new global 0.05° SIF - based GPP dataset named CMLR GPP (canopy - scale Mechanistic Light Reaction model), which is generated using TROPOMI observations. A modified mechanistic light reaction model at the canopy scale was utilized to create this dataset. In the CMLR model, the canopy qL (the opened fraction of photosynthesis II reaction centers) was parameterized by a random forest model.
In the validation dataset, the CMLR GPP estimates exhibited a strong correlation with tower - based GPP (R² = 0.72). Moreover, at the global scale, its performance was comparable to other global datasets such as Boreal Ecosystem Productivity Simulator (BEPS) GPP, FluxSat GPP, and GOSIF (global, OCO - 2 - based SIF product) GPP. Across various normalized difference vegetation index, vapor pressure deficit, and temperature conditions, different plant functional types, and most months of the year, the CMLR GPP maintained high accuracy.
To sum up, CMLR GPP is a novel global GPP dataset established on mechanistic frameworks. Its availability is anticipated to facilitate future research in ecological and geobiological fields.
 

How to cite: Chen, R., Liu, L., Liu, X., and Rascher, U.: CMLR: A Mechanistic Global GPP Dataset Derived from TROPOMIS SIF Observations, EGU General Assembly 2025, Vienna, Austria, 27 Apr–2 May 2025, EGU25-14472, https://doi.org/10.5194/egusphere-egu25-14472, 2025.

EGU25-18025 | ECS | Posters on site | BG9.4

Assessing SIF-GPP Relationships in Peatlands: Temporal Insights for FLEX Mission Validation 

Abdallah Yussuf Ali Abdelmajeed, M.Pilar Cendrero-Mateo, Michal Antala, Mar Albert-Saiz, Marcin Stróżecki, Anshu Rastogi, Tommaso Julitta, Andreas Burkart, Dirk Schuettemeyer, and Radosław Juszczak

The Fluorescence Explorer (FLEX) mission aims to monitor vegetation sun-induced chlorophyll fluorescence (SIF), a proxy for ecosystem health. Studying photosynthesis and its relationship with SIF provides valuable insights into the physiological responses of ecosystems to environmental stress. Peatlands are among the most valuable ecosystems in the carbon cycle, acting as carbon storage and sinks in normal conditions but becoming carbon sources in drought conditions.

This study investigates the correlation between SIF and Gross Primary Productivity (GPP) in the temperate peatland in Poland.  Measurements by the FloX system with a temporal resolution of ~30 seconds between June and October 2019 and CO2 fluxes measured by manual chambers were used for this purpose. GPP was calculated from the subsequent net ecosystem exchange and respiration measurements, and the gaps between measurements were modelled with a Michaelis-Menten rectangular hyperbola. SIF was retrieved using the Improved Fraunhofer Line Depth (iFLD) Spectral Fit Method (SFM) and Spectrum Fitting (SpecFit) algorithms in the O2-A and O2-B bands. The data were analysed at different time intervals (30 min, 1 h, 3 h, whole day, and the entire dataset).

Our results show that the strength of the SIF-GPP relationships changes significantly with time interval. Correlations tend to weaken or break (r2 <0.5) more frequently at shorter intervals, while stronger, more consistent relationships are observed over full-day periods or when the entire dataset is combined. This highlights the importance of temporal resolution when interpreting SIF-GPP relationships. Although exponential correlations have been observed at whole-day or dataset scales, these patterns may mask short-term physiological responses and stress dynamics under varying environmental conditions.

As the FLEX satellite will only provide one observation per day, our results emphasize the limitations of single daily measurements, which are influenced by transient weather conditions or plant stress. Therefore, continuous ground-based spectral data are essential to improve the reliability of SIF-based ecosystem monitoring.

This study emphasizes the importance of temporal resolution in SIF-GPP analyses and contributes to the validation efforts of the FLEX mission. Future research should validate these results across other ecosystems and integrate data from the ESA FLEXSense tandem campaigns (2018–2019) to improve global photosynthesis monitoring.


The National Science Centre, Poland, funded the 2020/39/O/ST10/00775 research.

How to cite: Abdelmajeed, A. Y. A., Cendrero-Mateo, M. P., Antala, M., Albert-Saiz, M., Stróżecki, M., Rastogi, A., Julitta, T., Burkart, A., Schuettemeyer, D., and Juszczak, R.: Assessing SIF-GPP Relationships in Peatlands: Temporal Insights for FLEX Mission Validation, EGU General Assembly 2025, Vienna, Austria, 27 Apr–2 May 2025, EGU25-18025, https://doi.org/10.5194/egusphere-egu25-18025, 2025.

EGU25-18186 | Orals | BG9.4 | Highlight

Advancements and challenges in estimating terrestrial vegetation biomass using satellite data 

Maurizio Santoro, Oliver Cartus, Samuel Favrichon, Shaun Quegan, Heather Kay, Richard Lucas, Arnan Araza, Martin Herold, Nicolas Labrière, Jérôme Chave, Åke Rosenqvist, Takeo Tadono, Kazufumi Kobayashi, Josef Kellndorfer, and Frank Martin Seifert

The above ground biomass (AGB) of woody vegetation is proportional to the amount of carbon stored primarily in the trunks and branches, with changes over time indicating sources or sinks of carbon. Accurate quantification of AGB is indispensable for climate studies and policy development, yet significant gaps persist due to limitations in current observational and modeling approaches. Satellite-based Earth Observation (EO) provides a promising avenue for global biomass estimation, particularly when a diversity of  data sources and advanced algorithms are used.

Recent initiatives, such as the European Space Agency’s (ESA) Climate Change Initiative (CCI) Biomass and BiomAP projects, have pioneered methodologies for generating time series of global maps of woody AGB at varying spatial resolutions. These efforts utilize multiple predictors derived from active and passive microwave data sources, including Sentinel-1, ALOS-2, SMOS, SMAP and ASCAT as well as LiDAR-based vegetation structural metrics. However, the absence of globally and evenly distributed AGB measurements acting as reference constrains retrievals to use fully physical models. These models are then calibrated using spatially explicit datasets from other satellite data (e.g., optical imagery) and AGB statistics. Evaluations of these maps with independent reference measurements not used in the retrieval process highlight the critical balance between data precision and algorithm design. The complexity of accurately mapping biomass at global scales is compounded by uncertainties in LiDAR sampling, satellite data uncertainty, and the dependence on high-quality reference data. Additionally, biases arise from the simplistic assumptions often required for model fitting, which can affect the reliability of AGB estimates. Temporal assessments of biomass change face additional hurdles, including uncertainties in AGB trends and a scarcity of reference data for validation.

Despite these challenges, EO-driven biomass mapping continues to advance, supported by improvements in sensor technologies and retrieval algorithms. Long-term maintenance of satellite missions suitable for AGB mapping is however essential as is the promotion of space-based LiDAR observations. Enhanced understanding of satellite signal characteristics will enable more accurate AGB retrievals, fostering the development of sophisticated retrieval models that may identify complex interactions not described by the physical models currently in use. Crucially, this progress must be complemented by spatially dense and continuous AGB measurements from local ground-based or airborne surveys.

The scope of this presentation is to emphasize the transformative potential of satellite EO in quantifying and monitoring AGB and detail efforts at quantifying and reducing uncertainties in retrieval. By reviewing existing data products and illustrating strategies to address data gaps and methodological challenges, this work aims to inform and guide future global biomass estimation efforts from existing, recently launched (e.g., ALOS-4 PALSAR, Sentinel-1C), and forthcoming (NASA/ISRO NISAR and ESA BIOMASS) missions.


How to cite: Santoro, M., Cartus, O., Favrichon, S., Quegan, S., Kay, H., Lucas, R., Araza, A., Herold, M., Labrière, N., Chave, J., Rosenqvist, Å., Tadono, T., Kobayashi, K., Kellndorfer, J., and Seifert, F. M.: Advancements and challenges in estimating terrestrial vegetation biomass using satellite data, EGU General Assembly 2025, Vienna, Austria, 27 Apr–2 May 2025, EGU25-18186, https://doi.org/10.5194/egusphere-egu25-18186, 2025.

EGU25-18335 | Posters on site | BG9.4

Transforming Low-Resolution CORINE Data into High-Resolution Landscape Maps with Semi-Supervised Deep Learning 

Krishnagopal Halder, Amit Kumar Srivastava, Kaushik Muduchuru, Liangxiu Han, Manmeet Singh, Thomas Gaiser, and Frank Ewert

Large-scale, high-resolution landscape mapping with precise classification is essential for understanding, managing, and protecting Earth's ecosystems. It provides granular spatial and thematic insights into land cover and land-use dynamics, allowing for a better representation of complex landscapes with multiple classes. By preserving fine-scale heterogeneity, such mapping enables the identification of subtle yet ecologically significant patterns, including habitat fragmentation, biodiversity hotspots, and land-use transitions. Despite the availability of several high-resolution global land cover products, there is a significant lack of detailed class information in these datasets. The existing classes are often too general and fail to accurately represent the inherent heterogeneity of landscapes. However, this task remains challenging due to intricate ground features, diverse landforms, and the limited availability of accurate training labels across extensive geographic regions.

In this study, we employed an efficient weakly supervised deep learning architecture to enable large-scale, high-resolution land cover mapping with detailed class distinctions. This was achieved by utilizing widely accessible and publicly available satellite products and global land cover (GLC) data, with a focus on Brandenburg, a federal state of Germany. We used the CORINE Land Cover (CLC) 2018 dataset as a low-resolution land cover label, alongside nine bands from Sentinel-2 MSI data and two bands (VV and VH) from Sentinel-1 SAR data, all at a 10-meter spatial resolution, organized into 256x256 pixel patches. While the CORINE dataset offers rich class information with 44 thematic classes (28 for Brandenburg), its coarse resolution (100 m) limits its utility for large-scale analyses. To address this, we enhanced the resolution of the dataset to 10 meters by integrating satellite data from hybrid sources. Additionally, we incorporated high-resolution global land cover databases, such as Dynamic World V1, into the model’s loss function to guide the generation of high-resolution data products while maintaining the same number of classes as CORINE. This framework addressed label noise resulting from the resolution mismatch between images and labels by combining a resolution-preserving CNN branch, a Transformer branch, a weakly supervised module, and a self-supervised loss function, enabling the automatic refinement of high-resolution land cover results without manual annotations.

Our results, obtained after running 30 epochs in the Google Colab Pro Python environment with a limited A100 GPU (~40 GB), show promising outcomes, with a gradual decrease in loss. The predicted validation data, aggregated into broader class categories, were compared with the Dynamic World dataset, yielding a match of 68%. Specific classes, such as cropland, vegetation, and grassland, demonstrated strong performance, with accuracy scores of 84%, 66%, and 55%, respectively. This framework generates high-resolution, detailed landscape maps with rich class information from accessible global land cover products, all without the need for manual annotation. It can also be applied across Europe, as the CORINE data covers the entire continent. While these results are encouraging, we are confident that further analyses, including additional training with more epochs and data, will improve performance even further.

How to cite: Halder, K., Srivastava, A. K., Muduchuru, K., Han, L., Singh, M., Gaiser, T., and Ewert, F.: Transforming Low-Resolution CORINE Data into High-Resolution Landscape Maps with Semi-Supervised Deep Learning, EGU General Assembly 2025, Vienna, Austria, 27 Apr–2 May 2025, EGU25-18335, https://doi.org/10.5194/egusphere-egu25-18335, 2025.

EGU25-294 | Orals | ESSI4.11

Enhancing Forest Change Detection Using Self-Supervised Learning with Multi-Source EO Data 

Ridvan Kuzu, Antony Zappacosta, Oleg Antropov, and Octavian Dumitru

This study presents advancements in forest change detection by leveraging self-supervised learning (SSL) methods with multi-source and multi-temporal Earth Observation (EO) data. Transitioning from traditional bi-temporal approaches, the developed methodology incorporates multi-temporal analysis and multimodal data fusion using Sentinel-1, Sentinel-2, and PALSAR-2 imagery. Key innovations include mapping the magnitude of forest changes rather than binary classifications, enabling nuanced assessment of disturbance severity.

Experiments demonstrate the effectiveness of SSL-pretrained backbones, such as ResNet architectures, in extracting features for change detection. The integration of multi-temporal Sentinel-1 time series further improved the reliability and accuracy of disturbance tracking over time. These advancements show the potential of SSL to enhance forest change monitoring, providing scalable solutions for continuous and precise assessment of forest dynamics.

How to cite: Kuzu, R., Zappacosta, A., Antropov, O., and Dumitru, O.: Enhancing Forest Change Detection Using Self-Supervised Learning with Multi-Source EO Data, EGU General Assembly 2025, Vienna, Austria, 27 Apr–2 May 2025, EGU25-294, https://doi.org/10.5194/egusphere-egu25-294, 2025.

Forest fragmentation disrupts habitat continuity, reshapes ecosystem processes, and threatens biodiversity. Effective conservation efforts in fragmented landscapes rely on precise monitoring of these changes. This study leverages remote sensing through vegetation indices to evaluate forest health and detect fragmentation-induced alterations over time. Focusing on the Tuchola Forest in Poland, an area increasingly affected by windstorms, we analyzed Sentinel-2 imagery from 2016 to 2024 using 19 vegetation indices. Machine learning classifiers—Extra Trees, Random Forest, and LightGBM—were employed to assess which indices best capture fragmentation stress. The Extra Trees classifier outperformed the others in accuracy and generalization, identifying NDWI and GNDVI as the most effective indicators. These indices were particularly responsive to shifts in vegetation water content and canopy density linked to fragmentation. Our findings underscore the utility of targeted vegetation indices for precise ecological monitoring and inform conservation strategies in fragmented forests.

How to cite: Dutt, S. and Kunz, M.: Uncovering Fragmentation Patterns: Optimal Vegetation Indices for Monitoring the Tuchola Forest Ecosystem, EGU General Assembly 2025, Vienna, Austria, 27 Apr–2 May 2025, EGU25-353, https://doi.org/10.5194/egusphere-egu25-353, 2025.

EGU25-670 | ECS | Orals | ESSI4.11

Integrating High-Resolution Thermal Mapping and Greenhouse Gas Emission Analysis for Climate Resilience in Urban, Peri-Urban and Rural Areas 

Naji El Beyrouthy, Mario Al Sayah, Rita Der Sarkissian, and Rachid Nedjai

Monitoring urban, peri-urban, and rural temperatures, along with greenhouse gas (GHG) emissions, is crucial for understanding local climate dynamics, especially in rapidly urbanizing areas. This study leverages advanced remote sensing techniques and environmental analysis to enhance high-resolution Land Surface Temperature (LST) mapping. It further investigates the relationship between LST and methane (CH₄) emissions - a significant driver of climate change - and their combined impact on Urban Heat Island (UHI) effects.

Leveraging multispectral atmospherically corrected imagery from LANDSAT 8-9 and SENTINEL-2 satellites, spectral harmonization techniques and Convolutional Neural Network (CNN)-based super-resolution models were applied to improve the spatial resolution and accuracy of LST calculation. These methods are further refined through the integration of key environmental indices, including soil characteristics, land cover, Normalized Difference Vegetation Index (NDVI), Normalized Difference Built-up Index (NDBI), and Normalized Difference Water Index (NDWI), which capture land use characteristics and their impact on thermal variations. The resultant LST at 1m was statistically validated against meteorological datasets by calculating Root Mean Squared Error and Mean Absolute Error, showing errors consistently below 2°C, with 75% of the values within 1°C. Making use of the accurate LST readings, air temperature (Ta) was derived using polynomial regression models, ultimately resulting in LST-derived air temperature maps with R² values exceeding 0.75.

Building upon this high-resolution thermal mapping, the study examines how agricultural zones are influenced by urban thermal dynamics exacerbated by GHG emissions creating a negative feedback loop where increased temperatures further impact agricultural practices and lead to additional GHG emissions. Seasonal and phenological variations in CH₄ emissions from major crops cultivated in the Loiret region including wheat, were analyzed. Results reveal that land use, crop phenology and soil characteristics significantly modulate LST, influencing both the intensity and distribution of urban heat anomalies. Moreover, the thermal contributions of these areas are analyzed within the context of their dual role. On one hand, these areas can act as potential moderators of UHIs by providing vegetative cover and cooling effects. On the other hand, they contribute to regional methane fluxes due to agricultural practices. This dual role highlights the complexity of peri-urban and rural zones, as they can simultaneously alleviate and exacerbate environmental challenges.

The presented framework can be considered as a contribution to bridging the gap between remote sensing advancements and climate science by providing actionable insights into the interactions between urban and rural thermal dynamics. The methodology not only offers a scalable approach for improving LST and Ta monitoring in data-sparse regions but also highlights the implications of land management practices for mitigating urban heat and reducing GHG emissions. By combining cutting-edge data processing techniques with environmental analysis, the study underscores the importance of integrating thermal mapping with greenhouse gas emission assessments to inform sustainable planning and climate adaptation strategies. In conclusion, this study contributes to the broader understanding of urban-rural thermal interdependencies and their role in shaping regional climate resilience, while also aiming to develop a new approach that leverages remote sensing to GHG emissions across wide areas.

How to cite: El Beyrouthy, N., Al Sayah, M., Der Sarkissian, R., and Nedjai, R.: Integrating High-Resolution Thermal Mapping and Greenhouse Gas Emission Analysis for Climate Resilience in Urban, Peri-Urban and Rural Areas, EGU General Assembly 2025, Vienna, Austria, 27 Apr–2 May 2025, EGU25-670, https://doi.org/10.5194/egusphere-egu25-670, 2025.

EGU25-1883 | ECS | Posters on site | ESSI4.11

Development of a Remote Crop Quality Sensor: Advancing Carotenoid Assessment with Raman Spectroscopy 

Miri Park, Annette Somborn, Dennis Schlehuber, and Volkmar Keuter

The accurate evaluation of crop quality is vital for sustainable agriculture and optimized production. Raman spectroscopy, renowned for its insensitivity to water interference and its ability to deliver molecular-specific information, presents significant potential as a remote sensing technology. This study explores the feasibility of adapting advanced Raman spectroscopy as a remote crop quality sensor for the precise assessment of carotenoids. Carotenoids were chosen due to their dual role as key stress indicators in crops and their well-established antioxidant benefits for human health.

To explore carotenoid variability, Arabidopsis thaliana and Spinacia oleracea were analyzed. Raman spectroscopy measurements were performed on two leaves per plant using a 785 nm laser. For the carotenoid quantification, Linear Discriminant Analysis (LDA) was adapted. The spectra were processed through smoothing, background removal, and normalization, followed by modification with an amplifying factor. This study evaluated the impact of these processing methods, particularly the application of the amplifying factor, on the accuracy of the model. High-Performance Liquid Chromatography (HPLC) was employed as the reference method for validation. Three-quarters of the samples were used to construct the model, while the remaining one-quarter was reserved for validation. As a result, the model utilizing spectra modified with the amplifying factor in most cases achieved higher validation accuracy compared to models based on unmodified spectra.

This study introduces a novel Raman spectroscopy-based remote sensing approach for crop quality assessment, establishing an enhanced model for interpreting spectral data. By enabling precise detection of stress-induced changes in plant chemical composition, including carotenoids, this technique paves the way for scalable, real-time monitoring through Raman-equipped machinery or drones, advancing sustainable agriculture practices.

How to cite: Park, M., Somborn, A., Schlehuber, D., and Keuter, V.: Development of a Remote Crop Quality Sensor: Advancing Carotenoid Assessment with Raman Spectroscopy, EGU General Assembly 2025, Vienna, Austria, 27 Apr–2 May 2025, EGU25-1883, https://doi.org/10.5194/egusphere-egu25-1883, 2025.

EGU25-1993 | Orals | ESSI4.11

Leveraging Satellite Earth Observation for Detecting Bloom Shifts and Phenological Patterns in California’s Almond Orchards 

Tarin Paz-Kagan, Oren Lauterman, Fadi Kizel, Maciej A. Zwieniecki2, Jessica Orozco, and Or Sperling

Given the impact of climate change on deciduous crop yields, our research focuses on leveraging earth observation remote sensing to accurately detect flowering periods in almond orchards and evaluate a climate-based dormancy model for predicting flowering times. This study addresses the challenge of monitoring almond flowering phenology by employing automated crop mapping techniques to support phenology monitoring across California's Central Valley. Using Sentinel-2 (S2) multispectral satellite imagery, we compare its effectiveness with the carbohydrate-temperature (C-T) dormancy model. The study area encompasses approximately 30,000 almond orchards, precisely identified using the Almond Industry Map. We utilized time-series analyses of the Enhanced Bloom Index (EBI) and the Normalized Difference Vegetation Index (NDVI) to quantify bloom periods and intensity and determine peak bloom times. Leveraging around 4,000 S2 tiles, enhanced vegetation indices, and in situ time-lapse camera data collected from 2019 to 2022, we developed a robust methodology for accurately identifying peak bloom periods. This process created a comprehensive phenological dataset, which was standardized and interpolated to daily resolution for improved time-series analysis. Our approach achieved a mean absolute error (MAE) of just 1.9 days in detecting peak bloom, demonstrating the accuracy of satellite-based phenological monitoring. This underscores both the advantages and limitations of remote sensing technologies in agricultural phenology. The dataset was then used to validate projections from the climate-based carbohydrate-temperature (C-T) dormancy model, offering valuable insights and supporting the refinement of this mechanistic approach. The study revealed significant spatial and temporal patterns in flowering phenology, emphasizing the role of regional climatic conditions in influencing crop development. Results highlight the potential of remote sensing and satellite imagery to detect the start, peak, and end of bloom in almond orchards with high precision, generate valuable phenological datasets, monitor patterns at both regional and field scales, and assess the reliability of dormancy models. This research has critical implications for improving agricultural practices and supporting decision-making in the almond industry. By advancing phenological monitoring techniques, our study presents a scalable and innovative approach to managing perennial crops in the face of climate change.

How to cite: Paz-Kagan, T., Lauterman, O., Kizel, F., Zwieniecki2, M. A., Orozco, J., and Sperling, O.: Leveraging Satellite Earth Observation for Detecting Bloom Shifts and Phenological Patterns in California’s Almond Orchards, EGU General Assembly 2025, Vienna, Austria, 27 Apr–2 May 2025, EGU25-1993, https://doi.org/10.5194/egusphere-egu25-1993, 2025.

Selecting the appropriate unmanned aerial vehicle flight height is beneficial for increasing the monitoring efficiency. We firstly used an unmanned aerial vehicle to explore the scale effect on monitoring rice aboveground biomass. The results confirmed the feasibility of using vegetation indices and textures from hyperspectral images to improve the estimations at different spatial resolutions. The monitoring accuracy of combining vegetation indices and textures was the highest, and exhibited a decreasing trend as the spatial resolution decreased with the greatest accuracy appearing at 13 cm. Two new concepts were proposed: “appropriate monitoring scale domain” to define the range of spatial resolution where the monitoring accuracy was less affected by scale effect, and “appropriate monitoring scale threshold” to define the spatial resolution where accuracy dropped noticeably. The appropriate monitoring scale domains varied at different growth stages and the appropriate monitoring scale thresholds of using vegetation indices and textures were lower than those using textures: 39 cm, 52 cm, and 65 cm at the pre-heading, post-heading, and entire growth stages, respectively when using textures, and 52 cm, 65 cm, and 78 cm at the corresponding growth stages when combining vegetation indices and textures. In terms of aboveground biomass level, growth stage and error value, the relatively lower aboveground biomass levels, earlier growth stages of the multi-temporal models, and overestimations were more likely to yield notable accuracy changes when the spatial resolution converted to lower level on both sides of appropriate monitoring scale threshold. Vegetation indices containing red-edge or near-infrared bands were effective for estimation. Yellow/green band textures and vegetation indices containing green bands with near-infrared/red-edge bands also obtained inspiring performances. MEA was indispensable in estimation while more diverse textures were incorporated into the models of the entire growth stages and models established at lower spatial resolutions. These findings are essential for understanding the scale effect in estimating rice aboveground biomass, facilitating efficient monitoring at field scale.

How to cite: Xu, T., Wang, F., and Shi, Z.: Multi-scale monitoring of rice aboveground biomass by combining spectral and textural information from UAV hyperspectral images, EGU General Assembly 2025, Vienna, Austria, 27 Apr–2 May 2025, EGU25-2093, https://doi.org/10.5194/egusphere-egu25-2093, 2025.

EGU25-2120 | ECS | Orals | ESSI4.11

A new framework for mapping time series rubber plantation in Southeast Asia 

Yaoliang Chen and Hongfeng Xu

Accurate yield estimation and appropriate planting management policies for rubber plantations require their precise information on spatiotemporal change data. Previous studies on mapping of rubber plantations did not employ the dynamic rubber phenology features and had difficulty in obtaining historical samples. Here we attempted to develop a new mapping framework through taking historical sample migration, dynamic phenology, and change detection variables into the classification procedure. An automatic sample migration algorithm was first proposed to generate historical samples. Then, two new variable types, dynamic phenology indices and change detection variables, were developed. Another four commonly used variable types -spectral bands, yearly composite spectral indices, terrains, and textures were also extracted. Five combinations of variable types were designed to explore key variable types. Subsequently, the framework with recommended variable types was applied at an experimental site in China and was finally evaluated to two test sites in Myanmar and Thailand for examining its transferability. Results showed that the average overall accuracy of historically migrated samples reached over 97% at the experimental site. Dynamic phenology indices and change detection variables were found as two crucial variable types for rubber plantations mapping. The average rubber plantations mapping accuracy during 2003-2022 reached 93.68%. Transferring the proposed framework to two test sites confirmed the independent roles of change detection variables and dynamic phenology indices. Their average rubber plantations mapping accuracy during 2003-2022 reached 94.34% and 93.73%, respectively. Good spatial consistency between the classified maps and Google Earth images was observed, displaying clear boundaries between rubber plantations and farmland, evergreen broadleaf forest, and shrub. Overall, the proposed framework has great potential for time series rubber plantations mapping in Southeast Asia.

How to cite: Chen, Y. and Xu, H.: A new framework for mapping time series rubber plantation in Southeast Asia, EGU General Assembly 2025, Vienna, Austria, 27 Apr–2 May 2025, EGU25-2120, https://doi.org/10.5194/egusphere-egu25-2120, 2025.

The snow cover occurrence index (SCOI), deffned as the ratio of the number of times that a pixel is classiffed as snow to the number of times that the pixel is observed in optical remote sensing data over a given year, can effectively mitigate the inffuence of clouds and holds great potential for extracting the annual snow duration and glacier extent in mountainous regions. The SCOI of the Qinghai–Tibet plateau (QTP) is calculated and analyzed on the basis of Landsat images from 1985 to 2021. The results indicate the following: 1) the evaluation based on station snow depth reveals that the SCOI is stable when the number of combined years reaches 5; 2) the SCOI has a strong correlation with snow cover days (SCD) determined from Moderate Resolution Imaging Spectroradiometer (MODIS) snow cover products; and 3) the SCOI has good potential for glacier extraction and exhibits a high level of consistency with glacier boundary survey data. Overall, owing to the higher spatial resolution and longer duration of the Landsat-based SCOI, it can accurately describe the distribution characteristics and changes in snow cover and glaciers in complex mountainous areas. 

How to cite: Wang, X.: A Novel Snow Cover Occurrence Index (SCOI) for the Dynamics of Snow Duration and Glacier Extent in Mountainous Regions, EGU General Assembly 2025, Vienna, Austria, 27 Apr–2 May 2025, EGU25-2205, https://doi.org/10.5194/egusphere-egu25-2205, 2025.

EGU25-2520 | ECS | Orals | ESSI4.11

Linking Citrus Fruit Cracking Intensity to Plant Water Status: Insights from UAV-Derived Metrics Validated by Ground-Based Data 

Moshe (Vladislav) Dubinin, Michael Morozov, Avi Sadka, and Tarin Paz-Kagan

Citrus fruit cracking, a physical failure of the peel, causes yield losses of 10% to 35%, peaking during October-November. Water status of the tree and water flow into the fruit influence this phenomenon. with excessive irrigation during critical fruit development stages exacerbates cracking. As part of the EU-Horizon CrackSense project, this study is aimed to link citrus tree plant water status (PWS) to fruit cracking, emphasizing how deficit irrigation can reduce yield loss due to cracking. Using UAV and eco-physiological measurements, we developed models to predict PWS and its relationship with cracking intensity early in the season. The study, conducted in 2023-2024 in a commercial orchard near Kfar Chabad, Israel, tested four irrigation treatments: control, defined as the standard irrigation, two deficits irrigations regimes (50% of control) early and late in the season, and excessive irrigation (150% of control) throughout the season. Ground-based measurements included fruit and trunk diameter, stem water potential (SWP), stomatal conductance, plant area index (PAI), and growth rate (TG). UAV flights integrated multispectral, thermal, and LiDAR sensors to capture spatial-temporal variability in PWS. Canopy metrics, such as height, volume, LiDAR-based PAI, and spectral and thermal indices, were incorporated into PWS models. Results revealed significant differences in TG, SWP, and stomatal conductance for 50% of early and late deficit irrigation treatments compared to other treatments. Random forest models demonstrated strong predictive performance for SWP (R² > 0.77) and TG (R² > 0.76). LiDAR-derived PA correlated highly with field optical measurements (R² = 0.92), yield (R² = 0.67), and cracked fruit percentages (R² > 0.50). This study underscores the importance of precise irrigation management in reducing fruit cracking. It highlights the potential of remote sensing systems for predicting cracking and managing water status at the tree level. The developed models equip farmers with tools to apply controlled water stress, minimizing cracking and improving yield.

How to cite: Dubinin, M. (., Morozov, M., Sadka, A., and Paz-Kagan, T.: Linking Citrus Fruit Cracking Intensity to Plant Water Status: Insights from UAV-Derived Metrics Validated by Ground-Based Data, EGU General Assembly 2025, Vienna, Austria, 27 Apr–2 May 2025, EGU25-2520, https://doi.org/10.5194/egusphere-egu25-2520, 2025.

EGU25-2532 | Orals | ESSI4.11

Cross-Year Crop Mapping with Thermal Calendar from Optical Satellite Image Time Series 

Mehmet Ozgur Turkoglu and Helge Aasen

Traditional approaches for crop type classification from optical satellite images typically evaluate algorithms using training and test datasets from the same year and based on calendar days. However, this experimental setup is not practical for real-world applications due to (i) year-to-year variations in crop growth caused by climate, which limit generalization, and (ii) the inability to apply a model to the current year if trained on current-year data. This work addresses these challenges by introducing a cross-year experimental setting and incorporating thermal calendars into our deep learning model. Specifically, we train an attention-based deep learning model on the 2021 Swiss crop dataset, validate it in 2022, and test it in 2023. Thermal calendars, derived from accumulated daily average temperatures, align crop growth with thermal time instead of calendar time, addressing temporal shifts caused by climatic variations. Our results demonstrate that integrating thermal calendars improves performance compared to baseline using standard calendar encodings, achieving better generalization across years and showcasing the potential for large-scale operational crop classification.

How to cite: Turkoglu, M. O. and Aasen, H.: Cross-Year Crop Mapping with Thermal Calendar from Optical Satellite Image Time Series, EGU General Assembly 2025, Vienna, Austria, 27 Apr–2 May 2025, EGU25-2532, https://doi.org/10.5194/egusphere-egu25-2532, 2025.

EGU25-2602 | ECS | Orals | ESSI4.11

LiDAR-based indices and machine learning efforts to model biophysical estimations of corn (Zea mays L.) 

K. Colton Flynn, Gurjinder Baath, Bala Ram Sapkota, and Douglas R. Smith

Light Detection and Ranging (LiDAR) in precision agriculture is gaining traction as the technology becomes both accessible and affordable, particularly for assessing biophysical characteristics of vegetation. This study investigates the potential of unmanned aerial vehicle (UAV)-based LiDAR data for modeling Leaf Area Index (LAI), a key indicator of crop health and productivity. We explore laser penetration indices to model LAI and compare these results with machine learning models using various LiDAR return types (e.g., ground, vegetation, first, last). In both approaches, in-situ LAI measurements obtained with a LiCOR LAI-2000 were used as ground truth. The study was conducted over two years with a multi-date planting of corn (Zea mays L.) in Temple, TX. Our findings indicate that LiDAR-based methods, both through penetration indices and machine learning, hold promise for accurately modeling LAI and other biophysical crop traits in precision agriculture.

How to cite: Flynn, K. C., Baath, G., Sapkota, B. R., and Smith, D. R.: LiDAR-based indices and machine learning efforts to model biophysical estimations of corn (Zea mays L.), EGU General Assembly 2025, Vienna, Austria, 27 Apr–2 May 2025, EGU25-2602, https://doi.org/10.5194/egusphere-egu25-2602, 2025.

Bananas are the tropical fruit with the largest global cultivation area, sales volume, and 
international trade. China is the world's second-largest producer and consumer of bananas. 
Rapid and accurate acquisition of banana planting range and spatial distribution information 
is crucial for promoting the sustainable development of the banana industry in China. 
Currently, research on banana classification and identification faces challenges such as 
insufficient mechanistic understanding, poor generalizability, and difficulties in large-scale 
application. Additionally, banana cultivation areas are often located in regions with cloudy 
and rainy climates, limiting the acquisition of optical imagery. To address this, this study 
constructs a banana identification model based on phenological characteristics: (1) Sentinel
1/2 imagery is utilized to obtain time series curves of banana spectral and scattering features, 
followed by interpolation and filtering of the time series data; (2)A phenological index based 
on optical and scattering features is developed according to banana phenological 
characteristics. By combining SAR with the index, the model's mechanistic understanding is 
enhanced while alleviating the challenges posed by cloud cover in tropical and subtropical 
regions; (3)Using the constructed phenological index alongside banana spectral, texture, and 
temporal features, a classification model is trained for banana identification in the study area. 
This banana forest identification model and the developed phenological index aim to resolve 
current issues in banana classification and provide theoretical and practical support for large
scale banana extraction and the study of tropical and subtropical economic crops.

How to cite: wang, Z.: Banana plantation identification using remote sensing data in tropical and subtropical regions, EGU General Assembly 2025, Vienna, Austria, 27 Apr–2 May 2025, EGU25-2709, https://doi.org/10.5194/egusphere-egu25-2709, 2025.

EGU25-4248 | Orals | ESSI4.11

Characterisation and Calibration of Low-Cost IoT Monitoring Systems for Extreme Environmental Conditions  

Laura Mihai, Cristina Toma, Razvan Mihalcea, Karolina Sakowska, Loris Vescovo, Luca Belelli Marchesini, Valerio Coppola, Francesco Renzi, and Riccardo Valentini

Monitoring forests in hard-to-reach locations and under extreme climatic conditions requires reliable, long-term data collection systems. Low-cost devices are increasingly being developed for this purpose; however, deploying these systems without thorough characterisation and calibration can compromise data quality. This work emphasises the importance of fully characterising and calibrating such systems prior to installation to ensure accuracy and reliability over extended periods. This study was conducted as part of the RemoTrees project, which aims to develop a unique IoT tree monitoring system equipped with satellite communication and designed to withstand extreme environmental conditions. A set of the alpha version prototypes, developed within the project, was evaluated in this work. The evaluation focused mainly on a set of low-cost environmental monitoring devices equipped with radiometric sensors measurements. The key performance parameters were assessed, including signal-to-noise ratio (SNR), irradiance sensor detector nonlinearity, sensitivity to temperature variations, and angular response influenced by the diffusive optics. Each parameter was analysed to determine system performance under close to real-world conditions, using both laboratory and in situ validation setups. Key findings revealed that without proper optics used the accuracy of irradiance measurements are significantly influenced. Improvements on the system design and on calibration procedures were implemented to address these issues, improving the overall accuracy and stability of the systems. By addressing these challenges, the systems demonstrated enhanced robustness and suitability for long-term environmental monitoring in extreme conditions. This study underscores the necessity of rigorous pre-deployment testing and calibration for low-cost monitoring devices, particularly when deployed in challenging environments. The findings contribute to advancing the development and deployment of cost-effective technologies for environmental monitoring, enabling more sustainable and accessible data collection practices in forests under extreme climatic conditions.

How to cite: Mihai, L., Toma, C., Mihalcea, R., Sakowska, K., Vescovo, L., Marchesini, L. B., Coppola, V., Renzi, F., and Valentini, R.: Characterisation and Calibration of Low-Cost IoT Monitoring Systems for Extreme Environmental Conditions , EGU General Assembly 2025, Vienna, Austria, 27 Apr–2 May 2025, EGU25-4248, https://doi.org/10.5194/egusphere-egu25-4248, 2025.

EGU25-4513 | ECS | Orals | ESSI4.11

A Machine Learning-based Surrogate Model for Optimization of Cropping Systems in Denmark 

Meshach Ojo Aderele, Edwin Haas, Klaus Butterbach-Bahl, and Jaber Rahimi

Process-based agricultural system models (PBMs) are pivotal tools for evaluating the environmental impacts of agricultural practices. However, their large-scale application is constrained by significant computational demands, extensive time requirements, and data availability. These challenges hinder policymakers and land managers in implementing sustainable agricultural practices at scales meaningful for decision-making. Recent advancements in machine learning (ML) offer a promising solution by providing computationally efficient alternatives, yet the lack of interpretability regarding agro-environmental processes remains a critical barrier.

In this study, we address this challenge by developing a machine learning-based surrogate model for LandscapeDNDC (LDNDC) framework. The surrogate model predicts key agro-environmental variables, including yield, nitrous oxide (N2O) emissions, nitrate leaching (NO3-), and soil organic carbon (SOC), at a national scale for Denmark. Synthetic data were generated using a factorial design based on observed crop practices in Denmark, utilizing field-level data collected across six Danish catchments between 2013 and 2019 as part of the National Monitoring Program for Water Environment and Nature (NOVANA; LOOP-program). This approach incorporated crop rotations as well as spatially disaggregated information on soils and weather, resulting in a dataset comprising approximately 2 billion rows. To enhance the dataset's versatility and account for potential future scenarios, factors like manure amount and synthetic fertilizer amount were extrapolated beyond its current observed ranges. The synthetic dataset was subsequently simulated using the LDNDC modelling framework, and the resulting outputs were employed to train a variety of machine learning algorithms utilizing multi-task learning, optimizing predictions for multiple agro-environmental variables of interest.

Our results demonstrate that the ML-based surrogate model not only significantly reduces computational cost and processing time but also enables the exploration of multiple cropping scenarios with greater efficiency. This approach facilitates rapid scenario testing and optimization, making it accessible to policymakers and farmers without the constraints imposed by traditional PBM frameworks. We propose this methodology as a scalable and practical tool for advancing sustainable agricultural decision-making.

How to cite: Aderele, M. O., Haas, E., Butterbach-Bahl, K., and Rahimi, J.: A Machine Learning-based Surrogate Model for Optimization of Cropping Systems in Denmark, EGU General Assembly 2025, Vienna, Austria, 27 Apr–2 May 2025, EGU25-4513, https://doi.org/10.5194/egusphere-egu25-4513, 2025.

EGU25-4726 | ECS | Posters on site | ESSI4.11

Combining geometric-optical and spectral invariants theories for modeling canopy fluorescence anisotropy 

Yachang He, Yelu Zeng, and Dalei Hao

The spectral invariants theory (p-theory) has received much attention in the field of quantitative remote sensing over the past few decades and has been adopted for modeling of canopy solar-induced chlorophyll fluorescence (SIF). However, the spectral invariant properties (SIP) in simple analytical formulas have not been applied for modeling canopy fluorescence anisotropy primarily because they are parameterized in terms of leaf total emissions and scatterings, which precludes the differentiation between forward and backward leaf SIF emissions. In this study, we have developed the canopy-SIP SIF model by combining geometric-optical (GO) theory to account for asymmetric leaf SIF forward and backward emissions at the first-order scattering and by modeling multiple scattering based on the p-theory, thus avoiding the dependence on radiative transfer models. The applicability of the model simulations especially over 3D heterogeneous canopies was improved by incorporating canopy structure through multi-angular clumping index, and by modeling single scattering from the four components of the scene in view according to the GO approach. The results show good consistency with both the state-of-the-art SIF models and multi-angular field SIF observations over grass and chickpea canopies. The coefficient of determination (R²) between the simulated SIF and field measurements was 0.75 (red) and 0.74 (far-red) for chickpea, and 0.65 (both red and far-red) for grass. The average relative error was approximately 3% for 1D homogeneous scenes when comparing the canopy-SIP SIF model simulations to the SCOPE model simulations, and around 4% for the 3D heterogeneous scene when comparing to the LESS model simulations. The results indicate that the proposed approach for separating asymmetric leaf SIF emissions is a robust way to keep a balance between satisfactory simulation accuracy and efficiency. Model simulations suggest that neglecting the leaf SIF asymmetry can lead to an underestimation of canopy red SIF by 16.1% to 43.4% for various canopy structures. This study presents a simple but efficient analytical approach for canopy fluorescence modeling, with potential for large-scale canopy fluorescence simulations.

How to cite: He, Y., Zeng, Y., and Hao, D.: Combining geometric-optical and spectral invariants theories for modeling canopy fluorescence anisotropy, EGU General Assembly 2025, Vienna, Austria, 27 Apr–2 May 2025, EGU25-4726, https://doi.org/10.5194/egusphere-egu25-4726, 2025.

EGU25-4910 | ECS | Orals | ESSI4.11

Mapping 10-m monoculture and intercropped maize of Kenya with phenology knowledge and Sentinel-2 data 

Yang Chen, Lijun Zuo, Xianhu Wei, Xiao Wang, and Jinyong Xu

In East Africa, lack of agriculture inputs and unstable climates lead to 50% yield gaps, making intercropping—the planting of more than one crop in the same parcel of land—a common agricultural management practice among smallholder farmers to improve land-use efficiency and reduce risks. In Kenya, where maize is the staple food, maize is often intercropped with beans, legumes, and potatoes. Despite its widespread, agricultural statistics on intercropping are currently sparse, and remote sensing approaches for large-scale crop monocultures are often unsuitable for intercropping monitoring. Mapping intercropping at national scale is extremely challenging because of heterogeneous landscapes, lack of cloud-free satellite imagery, and the scarcity of high-quality ground-based situ data in these regions. This study addressed these challenges using a phenology-assisted automated mapping framework on Google Earth Engine (GEE) to create 10m-resolution maps of monoculture and intercropped maize across Kenya for the long and short rainy seasons of 2023.
First, we computed 10-day median composites of Sentinel-2 optical reflectance data for each pixel in the region to build monoculture/intercropped/non-maize Random Forest (RF) classifiers. Several thousand crop ground labels were collected during field surveys in 2023, including monoculture maize (mono-maize), intercropped maize (in-maize), and other crops (e.g., wheat, rice, coffee, tea, sugarcane, potatoes, beans, etc.). To address the limited availability of intercropped maize samples, a novel phenology-based approach was implemented. Maize was first differentiated from other crops by analyzing TCARI and OSAVI during the vegetative phase and ARI during maturity. Additionally, lower greenness and moisture levels in intercropped systems, which have larger planting width and more short-term crops, were detected using the SWIR1/NDVI ratio, effectively distinguishing mono-maize from in-maize. Automatically derived monoculture/intercropped maize samples and 40% of ground samples were used for training, while the remaining ground data were used for accuracy assessment. 
For the long rainy season, the overall accuracy (OA) was 0.88, with an F1-score of 0.87 for mono-maize and 0.78 for in-maize. For the short rainy season, OA dropped to 0.85, with F1-scores of 0.82 for mono-maize and 0.72 for in-maize. Misclassification primarily arose from phenological similarities between mono-maize and in-maize and increased planting of other crops with similar patterns during the short rainy season. Results revealed that 854,432 hectares of mono-maize were concentrated in the Western region and Rift Valley plateau during the long rainy season, while 1,061,701 hectares of in-maize were widely distributed across the region, particularly near Mount Kenya and the Eastern region. In the short rainy season, reduced and erratic precipitation led to decreased maize planting, with more farmers opting for intercropped systems and short-term crops to reduce risks of crop failure. 
We are convinced that this study is a crucial first step to demonstrate the potential of Sentinel-2 data and phenology-based automated mapping for large-scale monitoring of intercropping, providing critical insights for agricultural monitoring in sub-Saharan Africa. It serves as a foundation for developing a regional archive of monoculture and intercropped crop systems and addressing key agricultural challenges across the region.

How to cite: Chen, Y., Zuo, L., Wei, X., Wang, X., and Xu, J.: Mapping 10-m monoculture and intercropped maize of Kenya with phenology knowledge and Sentinel-2 data, EGU General Assembly 2025, Vienna, Austria, 27 Apr–2 May 2025, EGU25-4910, https://doi.org/10.5194/egusphere-egu25-4910, 2025.

A study conducted in a northern Jordanian arid Mediterranean grassland between 2017 and 2021 examined the relationship between remotely sensed Normalized Difference Vegetation Index (NDVI) and modeled standing crop biomass. The research sought to determine the utility of high-resolution (10-meter) Sentinel-2 imagery, coupled with the PHYGROW model, for biomass estimation in this challenging environment, and to assess the potential of NDVI as a cost-effective alternative to traditional ground-based methods. Data were aggregated into 10-day intervals for temporal analysis. Results indicated a significant positive correlation (p < 0.001) between NDVI and standing crop (kg/ha), described by the linear model: Standing crop = 60.40 + 3567.56 × NDVI (R² = 0.52). This finding suggests that NDVI offers a reliable and time effective approach to biomass estimation in such settings.

The strong positive correlation between NDVI and standing crop highlights the potential of remote sensing for large-scale rangeland health monitoring. Tracking NDVI changes over time provides insight into vegetation responses to climate, grazing, and conservation efforts. This understanding supports decision-making for sustainable grazing, water management, and conservation strategies. Future research should validate these findings on larger scales and explore integrating NDVI with other data, like soil moisture, to refine predictive models and improve accuracy. The study advocates adopting NDVI-based monitoring in arid rangeland management.

How to cite: Alhamad, M. N.: Integrating Sentinel-2 Imagery and PHYGROW Model for Biomass Estimation in Arid Rangelands of Northern Jordan, EGU General Assembly 2025, Vienna, Austria, 27 Apr–2 May 2025, EGU25-5178, https://doi.org/10.5194/egusphere-egu25-5178, 2025.

EGU25-5892 | ECS | Orals | ESSI4.11

Assessment of bud flush and damage in young Norway Spruce trees through airborne high-resolution multispectral images 

Louisa Eurich, Sara López Fernández, Malin Elfstrand, María Rosario García-Gil, Jonas Bohlin, and Eva Lindberg

Scandinavia is facing climate changes with a predicted increase in mean temperature of 2-4°C. For Swedish forests to be adapted to this challenge, the Swedish tree breeding program aims to select trees that are adapted to different biotic and abiotic conditions. Information on spring phenology, damage and vitality are important variables in the Norway spruce selection process. Traditionally, the data is gathered through manual assessment of each tree, which requires significant resources and limits the number and frequency of variables that can be measured. As an alternative, Remote Sensing is a promising technology to evaluate bud flush and vitality in conifers, offering the advantage of scoring more trees in a shorter time with fewer resources while obtaining data for several time points during the vegetation season, and its use of algorithms to measure variables reduces the risk of human error.

This project aims to develop methods that can be used within the breeding program by collecting information on spring phenology, damage and vitality using high-resolution multispectral drone images of young Norway spruce trees. Data were collected during spring 2023 and 2024. Bud flush is estimated from the spectral values of the tree crowns using manual assessment of the flush in a subset of the trees as training data. The high-resolution multispectral images will also be used to assess the damage and vitality of the new shoots. To ensure capturing the bud flush at a high temporal resolution, images were taken before the vegetation season and up to twice weekly during the period with the most rapid flush. In the final step, the spatial pattern within the study sites will be analyzed and connected to damage and vitality of the young Norway Spruce trees.


How to cite: Eurich, L., López Fernández, S., Elfstrand, M., García-Gil, M. R., Bohlin, J., and Lindberg, E.: Assessment of bud flush and damage in young Norway Spruce trees through airborne high-resolution multispectral images, EGU General Assembly 2025, Vienna, Austria, 27 Apr–2 May 2025, EGU25-5892, https://doi.org/10.5194/egusphere-egu25-5892, 2025.

EGU25-5987 | ECS | Posters on site | ESSI4.11

Soil Moisture Retrieval Over Agricultural Fields Using Synthetic Aperture Radar (SAR) Data 

Nguyen-Thanh Son, Chi-Farn Chen, Cheng-Ru Chen, Yi-Ting Zhang, Shu-Ling Chen, and Shih-Hsiang Chen

Soil moisture is vital for agricultural fields as it determines water availability for crops, directly affecting plant growth and productivity. It regulates nutrient uptake, root development, and microbial activity, ensuring efficient use of fertilizers and soil resources. Proper soil moisture levels prevent water stress, reduce crop failure risks, and optimize water irrigation efficiency. Accurate soil moisture monitoring supports sustainable farming practices, helps mitigate drought impacts, and enhances climate resilience. By maintaining optimal soil moisture, farmers can improve resource use, boost crop yields, and promote long-term agricultural sustainability. This study aims to develop an approach for retrieving soil moisture from Sentinel-1 A Synthetic Aperture Radar (SAR) data. The SAR data were processed for the 2024 dry season using a triangle-based approach in the Mekong Delta, Vietnam, following three main steps: (1) data preprocessing to convert raw radar backscatter values into the sigma naught (σ₀) backscatter coefficient in decibels (dB). This involves radiometric calibration, noise removal, and logarithmic scaling to enhances data interpretability, allowing for better comparisons across different radar acquisitions and improved analysis accuracy, (2) soil moisture retrieval by means of a triangle-based method developed based on the dual-polarization modes of the vertical transmit and vertical receive polarization (VV) and vertical transmit and horizontal receive polarization (VH). This method employs the triangular feature space created by using change in VV backscatter coefficients and the radar vegetation index (RVI), in which RVI helps distinguish vegetation effects while VV backscatter provides information on soil moisture. Combining both parameters thus allows for more precise moisture estimation even in complex environments, and (3) error verification. The results of soil moisture retrieval compared with the reference data showed moderate positive correlation, with the values of correlation coefficient (r) greater than 0.5 and the root mean square error (RMSE) smaller than 0.05, respectively. The lower soil moisture levels were especially observed in coastal areas, where higher evaporation rates, saline intrusion, and limited rainfall contribute to drier soils. These conditions create challenges for agriculture in coastal regions, as crops are more susceptible to drought stress and water shortages. Consequently, managing soil moisture becomes crucial for maintaining crop productivity and ensuring sustainable farming in coastal provinces. Eventually, soil moisture data was spatially aggregated with cropping areas to improve management practices in the region, allowing precise monitoring of soil conditions relative to specific crops and enabling tailored irrigation and water management strategies. This approach, leveraging dual-polarization SAR data with aid of the triangle-based method, could enhance soil moisture monitoring in agriculture and is completely transferable to other regions across the globe for soil moisture monitoring.

How to cite: Son, N.-T., Chen, C.-F., Chen, C.-R., Zhang, Y.-T., Chen, S.-L., and Chen, S.-H.: Soil Moisture Retrieval Over Agricultural Fields Using Synthetic Aperture Radar (SAR) Data, EGU General Assembly 2025, Vienna, Austria, 27 Apr–2 May 2025, EGU25-5987, https://doi.org/10.5194/egusphere-egu25-5987, 2025.

EGU25-6071 | Orals | ESSI4.11

Sensor Spatial Planning Methodology for Optimal Coverage and Data Accuracy in Agricultural Parcels 

Efthymios Papachristos, Marios Vlachos, and Angelos Amditis

Accurate sensor placement is critical in precision agriculture to collect high-resolution data essential for effective monitoring and decision-making. This study presents a comprehensive methodology for optimizing the spatial placement of sensors, focusing on determining the number of sensors needed and their optimal positions to ensure data quality and adequate area coverage. This methodology addresses the challenges posed by terrain restrictions, cost constraints, and data resolution needs. It is versatile, supporting in-situ monitoring, UAV-based sensing, and soil sampling for applications such as soil health analysis and soil organic carbon prediction models.

In many Research and Innovation Labs (RILs), the resolution of Earth Observation (EO) data, such as Sentinel-5 imagery with a resolution of 5×3 km, is often insufficient for the specific needs of agricultural parcels. To complement EO data, additional information must be gathered using in-situ sensors or UAVs. These additional data collection methods can provide higher resolution and more diverse data types, which are crucial for localized agricultural applications. However, the placement of sensors significantly impacts the quality and adequacy of the collected data. Dense sensor deployment across an entire area is often infeasible due to terrain challenges, budgetary limits, and the specific nature of the data being collected.

The methodology developed to address these challenges combines convex optimization, soft clustering, and cost-minimization techniques. The process begins by analyzing the statistical properties of the dataset, such as maximizing variance and maintaining the mean value, to ensure comprehensive data representation. This approach identifies key locations within the parcel that can adequately describe distributed values, reducing the need for excessive sensor deployment while maintaining data integrity.

For areas with existing spatial maps or datasets, the methodology applies weighted subsampling and soft clustering to identify optimal sensor locations. Weighted distributions prioritize critical areas for data collection, ensuring that key zones receive sufficient coverage. In cases where spatial maps are unavailable, an in-house cost-minimization algorithm guides the placement of sensors or UAVs. This algorithm incorporates factors such as terrain, accessibility, and installation costs to balance logistical constraints with data coverage requirements.

This methodology is compatible with diverse data sources, including EO data, hyperfield data, and in-situ sensor data from IoT networks. For instance, it can leverage data from soil moisture monitoring systems. Additionally, the methodology can guide soil sampling strategies for soil health assessment and serve as input for soil organic carbon prediction models. Its adaptability allows it to meet the needs of various agricultural monitoring applications, ranging from broad-scale field evaluations to detailed soil property studies.

Moreover, it enhances data quality by ensuring optimal sensor placement that captures maximum variability within the monitored area and it reduces costs and improves efficiency by minimizing the number of sensors needed. The approach is scalable and flexible, accommodating parcels of varying sizes and adapting to different data collection requirements and its integration with multiple data sources provides a comprehensive and cost-effective solution for advancing precision agriculture and sustainable resource management.

Acknowledgement:

This research has been funded by European Union’s Horizon Europe research and innovation programme under ScaleAgData project (Grant Agreement No. 101086355).

How to cite: Papachristos, E., Vlachos, M., and Amditis, A.: Sensor Spatial Planning Methodology for Optimal Coverage and Data Accuracy in Agricultural Parcels, EGU General Assembly 2025, Vienna, Austria, 27 Apr–2 May 2025, EGU25-6071, https://doi.org/10.5194/egusphere-egu25-6071, 2025.

EGU25-6085 | Orals | ESSI4.11

Integrating UAV Multispectral Data into a Combined Crop-Radiative Transfer Model for Processing Tomatoes Using a Particle Filter 

Amit Weinman, Nitzan Malachy, Raphael Linker, and Offer Rozenstein

The proliferation of remote sensing (RS) data and advancements in mechanistic crop modeling and data assimilation techniques necessitate a framework that digitally represents cropping systems and their spectral properties. Such a framework would enable crop growth simulation, scenario testing, and timely prediction updates using RS data.

In this study, we develop a comprehensive coupling scheme that links a crop model (DSSAT-CROPGRO) with a radiative transfer model (RTMo module in SCOPE). This integration allows for the utilization of reflectance data from all measured spectral bands during data assimilation (DA) into the crop model.

We apply this coupled crop-radiative-transfer model in a DA experiment using a novel particle filter scheme. The assimilated data consists of observed reflectance measurements obtained by a multispectral camera mounted on an unmanned aerial vehicle (UAV). Using multispectral data with a high spatial resolution for analyzing a row crop required a dedicated analysis to fit model simulations to measurements. The suggested DA scheme was implemented in an irrigation and fertilization trial with processing tomatoes to evaluate its effectiveness.

The results showed that applying the DA scheme improved the NRMSE of the Leaf Area Index (LAI) from 59% to 41.8% and yield from 63.6% to 35.4%. The DA scheme performed best when the treatment that included the most severe stress was excluded from weight calculation, resulting in NRMSE of 34.1% and 15.5% for LAI and yield, respectively. After showing promising results, the suggested data assimilation scheme should be tested in large-scale, commercial fields using space-borne RS data to examine its applicability in various scenarios.

How to cite: Weinman, A., Malachy, N., Linker, R., and Rozenstein, O.: Integrating UAV Multispectral Data into a Combined Crop-Radiative Transfer Model for Processing Tomatoes Using a Particle Filter, EGU General Assembly 2025, Vienna, Austria, 27 Apr–2 May 2025, EGU25-6085, https://doi.org/10.5194/egusphere-egu25-6085, 2025.

EGU25-6149 | ECS | Posters on site | ESSI4.11

UAV-based disease and pest detection using AI: Time to reconsider our approach? 

Eline Eeckhout, Pieter Spanoghe, and Wouter Maes

Rapid advancements in technology, particularly the rise of artificial intelligence (AI) and the integration of uncrewed aerial vehicles (UAVs) equipped with RGB, multi- and hyperspectral sensors, have boosted agricultural research on crop disease detection. This has led to a surge in studies exploring high-technology approaches to detecting crop diseases. While numerous studies have demonstrated high accuracy in detecting specific diseases or pests in crops, concerns arise regarding their reproducibility and generalisability.

We conducted a meta-analysis of over 100 research papers to examine how models are trained and validated, with a focus on how datasets for training, validation and testing were handled. In principle, a model can only be considered robust and widely applicable if it performs well on an entirely new dataset, i.e., a dataset it wasn’t specifically trained one. Otherwise, AI models risk overfitting to specific datasets or fields, potentially detecting signals that are not universal or not related to the targeted pest or disease. This issue arises when datasets are randomly split in training, validation and test subsets.

Our analysis revealed significant limitation in current practices. Nearly half of the reviewed papers relied on a single dataset (one single field, one single flight) for both model training and validation. About one-quarter of the studies used data from a single field with repeated flights during the same growing season. Only another quarter utilized datasets from multiple fields; however, the majority of these studies still used a random split for training and testing, meaning their models were not evaluated on independent datasets. In addition, a handful of studies using RGB data, applied transfer learning, with models pretrained on public (non-UAV) datasets and then applied to UAV datasets.

Overall, only 10% of the reviewed papers validated their models on fully independent datasets, i.e, using transfer learning or using an independent (untrained) separate field to test the model. We found that particularly models constructed with multispectral or hyperspectral data did not use independent datasets. On top of that, none of the studies explicitly tested whether their models were pest- or disease-specific, i.e., whether the models were sensitive only to the pest or disease they were trained to detect.

These findings highlight a critical limitation in the robustness and scalability of current AI-approaches to crop disease detection with UAVs. To address this, we call on researchers to include independent test datasets in their studies, and urge journals and reviewers to prioritize this criterion during evaluations. Additionally, we advocate for the public sharing of datasets to enable the development of robust and generalisable methods.

How to cite: Eeckhout, E., Spanoghe, P., and Maes, W.: UAV-based disease and pest detection using AI: Time to reconsider our approach?, EGU General Assembly 2025, Vienna, Austria, 27 Apr–2 May 2025, EGU25-6149, https://doi.org/10.5194/egusphere-egu25-6149, 2025.

EGU25-6243 | ECS | Posters on site | ESSI4.11

Multisource data analysis at the catchment scale to quantify and map sustainable agricultural management practices 

Maria S. Vesterdal, Tommy Dalgaard, and René Gislum

Natural environments face substantial challenges from human activities related to food, feed, and energy production. Unsustainable nutrient management is a key issue, with excess nutrients leaching into the groundwater cycle or escaping intended cropland through other pollution pathways ending up in the atmosphere or in nearby coastal systems. This nutrient loss depletes soil health, contributes to the climate crisis and impacts water quality, especially when combined with intensive farming practices lacking conservation efforts. Innovative mitigation actions, such as the Nature-based Solutions framework, designed to enhance water quality and advance sustainability in agricultural management, require thorough assessment and monitoring to encourage stakeholder participation in these strategies. Conducting research to explore the extent of their effects is thus essential, with a deeper understanding of the nutrient cycle playing a pivotal role in achieving these goals.

With the cumulatively increasing availability of remote sensing data sources and advancements in machine learning technologies, automating monitoring and assessment efforts has become a hot and important topic. The challenge is to construct transparent and transferable models capable of working with real-time data to accurately predict crop types, crop status or other desired features. The primary goal of this study is to investigate how an automated multisource data analysis approach, with a focus on remotely sensed data, can support the quantification and mapping of sustainability efforts in agricultural crop management while enhancing the understanding of nutrient flow within large-scale agricultural catchments. Centered on the Hjarbæk Fjord in Denmark, the study also aims to assess the transferability of its models across different sites in Europe. This research is part of a broader project investigating the potential of integrating permanent grasslands into crop rotations as a Nature-based Solution in the catchments surrounding Hjarbæk Fjord. The project aims to develop a decision support tool to guide the planning and optimization of grassland implementation in terms of extend and location. This tool is designed to maximize benefits across various parameters, including the number of stakeholders impacted, economic considerations, crop yield, biodiversity, and other critical factors. The output of the current study, involving the training of a deep learning model to predict cropland trends related to grassland implementation, can in turn be integrated as input for the described decision support tool.

This is an explorative study that relies on the availability of accurate ground truth data to train and validate a deep learning model, providing insights into trends associated with the implementation of sustainable management strategies. A key challenge lies in acquiring knowledge of and access to comprehensive datasets that capture relevant parameters, such as actual yield values, quantitative values of nutrients in different stages of the growth season and different nutrient pools within the cropland environment, accurate accounts of management actions and other contributors to the nutrient cycle. Additional challenges involve preprocessing satellite data to establish a robust pipeline for the automated collection of satellite imagery, ensuring a coherent time series. This includes addressing temporal and spatial data gaps through extrapolated estimations to create a consistent dataset.

How to cite: S. Vesterdal, M., Dalgaard, T., and Gislum, R.: Multisource data analysis at the catchment scale to quantify and map sustainable agricultural management practices, EGU General Assembly 2025, Vienna, Austria, 27 Apr–2 May 2025, EGU25-6243, https://doi.org/10.5194/egusphere-egu25-6243, 2025.

EGU25-6285 | ECS | Posters on site | ESSI4.11

Can SuperDove Multispectral Satellite Data Optimize Citrus Orchard Monitoring? 

Lamia Rahali, Salvatore Pratico, and Giuseppe Modica

The increasing global demand for food and the pressing need for sustainable agricultural practices have made technological innovations essential in modern agriculture. Satellite imagery, as a cornerstone of precision agriculture (PA), provides valuable tools for monitoring crops and optimizing resource management. This study evaluates the potential of PlanetScope’s (PS) advanced 8-band multispectral sensor (SuperDove) for citrus orchard monitoring. The primary objectives are to investigate the effectiveness of PS data in assessing orchard health and dynamics and to explore its utility in detecting spatial variability within citrus orchards. The methodology involves preprocessing SuperDove data to derive key vegetation indices (VIs), such as NDVI, SAVI, and EVI, which are widely used to gain insights into the vigor and condition of citrus orchards. To assess the reliability and practicality of PS data, the study includes a comparison with free and open-source alternatives, such as Sentinel-2. This research emphasizes the importance of integrating high-resolution satellite imagery into citrus orchard management practices. While still in the early stages, the study aims to provide insights into how advanced satellite data can support sustainable agriculture.

How to cite: Rahali, L., Pratico, S., and Modica, G.: Can SuperDove Multispectral Satellite Data Optimize Citrus Orchard Monitoring?, EGU General Assembly 2025, Vienna, Austria, 27 Apr–2 May 2025, EGU25-6285, https://doi.org/10.5194/egusphere-egu25-6285, 2025.

EGU25-7430 | Orals | ESSI4.11

Improving satellite-based actual evapotranspiration estimations using data from local weather stations  

Offer Rozenstein, Jessey Kwame Dickson, and Josef Tanny

Evapotranspiration (ET) is crucial for water resource management, agricultural planning, and understanding land-atmosphere interactions. Numerous approaches are available for estimating ET at various spatial and temporal scales, including ground-based measurements, mechanistic models, and remote sensing. In this study, we aimed to enhance the accuracy and applicability of the Sentinel for Evapotranspiration (Sen-ET) plugin for estimating ET in diverse field crops in Israel. The primary objectives were to validate the Sen-ET method using eddy covariance (EC) measurements across various seasons and crop types, improve Sen-ET estimates by incorporating local weather station data, and illustrate the influence of weather station distance from measurement sites on Sen-ET accuracy.

The research was conducted across eight test sites in Israel, including fields with spring wheat, potato, cotton, and tomato. In applying Sen-ET model, we utilized high-resolution Sentinel-2 and Sentinel-3 imagery, along with ERA-5 meteorological data and local weather station inputs. The ET estimations by Sen-ET involved preprocessing satellite data, resampling meteorological data, and using a Two Source Energy Balance model to derive daily ET values. These estimates were compared against EC measurements.

The results demonstrated that incorporating local weather station data significantly improved the accuracy of the Sen-ET estimates, with most sites showing a substantial reduction in root mean square error (RMSE) of daily ET compared to the standard Sen-ET method. For example, at one of the wheat sites, the RMSE was reduced from 0.60 mm to 0.14 mm day-1. On the other hand, one of the tomato sites showed a slight deterioration, with an increase of 0.01 mm day-1 in RMSE when data from a weather station 7 km away was used. However, when a closer weather station at 1.17 km was used, the RMSE was reduced by 0.34 mm day-1, thus demonstrating the importance of employing representative weather data in the model.

This study underscores the contribution of localized meteorological data in refining satellite-based ET models and provides a robust approach for precise ET estimation in agricultural landscapes. The findings have significant implications for improving water resource management and irrigation practices.

How to cite: Rozenstein, O., Kwame Dickson, J., and Tanny, J.: Improving satellite-based actual evapotranspiration estimations using data from local weather stations , EGU General Assembly 2025, Vienna, Austria, 27 Apr–2 May 2025, EGU25-7430, https://doi.org/10.5194/egusphere-egu25-7430, 2025.

Abstract: The universal contamination of arable land with potentially toxic elements (PTEs) poses a severe threat to food security and jeopardizes worldwide efforts to meet the United Nations Sustainable Development Goals (SDGs). How to obtain information on PTEs in regional agricultural soils more reliably is a priority problem to be solved. Multispectral satellite remote sensing, with its advantages of high spatial and temporal resolution, broad coverage, and low cost, offers the potential to acquire distribution information of PTEs over large areas. However, owing to the complexity of soil environments and the insufficiency of spectral information, the mechanism for retrieving concentrations of soil PTEs via multispectral satellites is not yet clear, and the accuracy needs to be improved. In this study, we aimed to assess whether employing a fusion of spectral information and environmental covariates, results in more accurate predictions of PTEs, specifically chromium (Cr) and mercury (Hg), in croplands than does employing spectral information alone. Three machine learning algorithms—kernel-based support vector machine (SVM), neural network-based back propagation neural network (BPNN), and tree-based extreme gradient boosting (XGBoost)—were developed to retrieve soil Cr and Hg concentrations. The results showed that the fusion of spectral information and environmental covariates combined with the XGBoost model performed best in retrieving both Cr and Hg concentrations with coefficient of determination (R2) values of 0.73 and 0.74, respectively. Environmental covariates are important variables for determining Cr and Hg concentrations in agricultural soils, but the ability to retrieve these element concentrations by utilizing multispectral information alone is limited. High Cr concentrations occurred in central towns and southern hilly mountains. High Hg concentrations were detected in the northwestern region and southern hilly mountains. The potential of fusing multispectral data and environmental variables to precisely retrieve soil PTE concentrations can serve as a reference for agricultural information monitoring worldwide.

Keywords: Potentially toxic elements; Sentinel-2; Environmental covariates; Machine learning; Farmland

How to cite: Zha, Y.: Retrieval of chromium and mercury concentrations in agricultural soils: Using spectral information, environmental covariates, or a fusion of both?, EGU General Assembly 2025, Vienna, Austria, 27 Apr–2 May 2025, EGU25-7525, https://doi.org/10.5194/egusphere-egu25-7525, 2025.

EGU25-7922 | Posters on site | ESSI4.11

Machine Learning-Based Rice Disease Diagnosis Through Joint Utilization of Satellite, Drone, and Weather Data 

Jae-Hyun Ryu, Kyung-Do Lee, Young-ah Jeon, Geun-Ho Kwak, Soo-Jin Lee, and Lak-Yeong Choi

Remote sensing and machine learning techniques enable precise diagnosis of crop growth anomalies, providing an effective means to mitigate production losses caused by disease outbreaks while supporting sustainable agricultural management. This study aims to detect rice diseases using satellite, drone, and weather data in a timely manner. A random forest model for rice disease detection was developed using drone imagery collected in 2023 year, where disease-damaged pixels were classified through K-means clustering, and the corresponding damaged areas were used for rice paddy disease classification model training. This model has been applied to agricultural fields in 2024 year as follows. First, Sentinel-1 and Sentinel-2 satellite data were utilized to classify paddy rice fields, with irrigated areas identified through the normalized difference vegetation index, land surface water index, and VV polarization. Second, the risk of rice disease occurrence was calculated based on air temperature, relative humidity, and precipitation. These variables represent weather conditions that can cause crop diseases. Third, drone measurements were conducted to monitor the abnormal growth of paddy rice when the risk score increased. Fourth, the location of disease outbreaks was detected using the random forest model, which uses surface reflectance at blue, green, red, red-edge, and near-infrared wavelengths as input data. Subsequently, drone spraying operations were carried out to reduce crop damage caused by the identified diseases. These results highlight the potential of agricultural management using remote sensing techniques.

Acknowledgments: This research was funded by RDA, grant number RS-2022-RD010059.

How to cite: Ryu, J.-H., Lee, K.-D., Jeon, Y., Kwak, G.-H., Lee, S.-J., and Choi, L.-Y.: Machine Learning-Based Rice Disease Diagnosis Through Joint Utilization of Satellite, Drone, and Weather Data, EGU General Assembly 2025, Vienna, Austria, 27 Apr–2 May 2025, EGU25-7922, https://doi.org/10.5194/egusphere-egu25-7922, 2025.

EGU25-7950 | ECS | Orals | ESSI4.11

Detecting irrigation amount from the integration of remote sensing data in the soil water model  

Fatemeh Khamseh and Mohammad Danesh-Yazdi

Agriculture is one of the primary consumers of freshwater globally. However, precise data on irrigation water use (IWU) at the regional scale is often lacking, which hampers the development of effective water management plans. This information gap is particularly crucial in water-stressed regions, resulting in significant resource waste. Remote sensing datasets offer a valuable opportunity to monitor irrigation patterns over extended periods at a regional scale. Since irrigation affects both soil moisture (SM) and actual evapotranspiration (ET), increases in SM and ET values following irrigation events can be leveraged to frequently retrieve IWU from remotely sensed data. In this regard, we first developed an irrigation-free soil water model in the root zone to simulate SM dynamics during non-growing periods. We then computed the residuals between the modeled SM and the 9 km root zone SM retrieved from SMAP L3, as well as the residuals between the modeled ET and both 30-m OpenET and 500-m PML, to estimate IWU. We used annual IWU data from Arizona State, USA, in 2017 to examine model performance. The simulated SM by our soil water model showed strong agreement with SMAP, evidenced by R2 = 0.68 and RMSE = 0.015 [mm3/mm3]. The estimated IWU using OpenET closely aligned with benchmark data, showing a bias of -17%. However, IWU retrieved by PML led to a much higher bias of -56%, indicating the deficiency of course-resolution ET products in capturing irrigation signals. We further found that over 97 % of the estimated IWU was attributed to ET rather than SM residuals, which is due to SMAP’s low spatial resolution, which limits its ability to resolve farm-scale irrigation volumes.


How to cite: Khamseh, F. and Danesh-Yazdi, M.: Detecting irrigation amount from the integration of remote sensing data in the soil water model , EGU General Assembly 2025, Vienna, Austria, 27 Apr–2 May 2025, EGU25-7950, https://doi.org/10.5194/egusphere-egu25-7950, 2025.

EGU25-8008 | ECS | Posters on site | ESSI4.11

Modeling and managing erosion in arid ravines using high-resolution satellite imagery 

Amir Mor-Mussery, Eli Zaady, and Lior Blank

Abstract

Ravines in arid lands are affected by various soil erosion processes caused by inconsistent rainfall regimes, flooding patterns, and anthropogenic interventions. These effects are expressed in the geomorphological and vegetation patterns of the ravine's land segments. To address these changes, a study was planned with the following objectives: [1] Modeling the effects of ravine erosion processes on its land-segments vegetation using high-resolution satellite imagery; [2] Suggesting analysis schemes based on remote sensing to suit land management practices for the ravine parts.  The study site is located in Migda Ravine, Northern Negev, between Gerar and Patish ephemeral streams. Due to the loess soil and extreme arid conditions, the area suffers from soil erosion and land incision. Using imaging from PlanetScope® satellite constellation (spatial resolution: 3m pixel-1, temporal: Image per 3 days, and spectral: Red-Green-Blue-Near Infra-Red bands) between 2017 and 2024, from January to August each year, NDVI median and quartiles ranges of the ravine land segments were calculated and normalized against a stabilized reference plot. Thirteen erosion processes were defined, and classified into ravine surrounding areas, banks, and ephemeral stream water flow. The findings indicate erosional processes that dramatically decreased the Normalized Fresh Vegetation Reflectance (NFVR)in 2019, with a lighter decrease in 2020. Some erosion processes were characterized by a subsequent NFVR increase after the soil erosion event, while others, such as subsurface erosion, showed a continuous NFVR decrease. Stream plots were characterized by soil deposition, which resulted in vegetation flocculation. Using vegetation change patterns, NDVI normalization, and multi-year temporal analysis can aid in formulating land management practices for the ravine land segments and predicting long-term erosional patterns.

How to cite: Mor-Mussery, A., Zaady, E., and Blank, L.: Modeling and managing erosion in arid ravines using high-resolution satellite imagery, EGU General Assembly 2025, Vienna, Austria, 27 Apr–2 May 2025, EGU25-8008, https://doi.org/10.5194/egusphere-egu25-8008, 2025.

EGU25-8077 | Posters on site | ESSI4.11

Development of Cropping Pattern Product Using Sentinel-2 Satellite Data 

Lak-Yeong Choi, Jae-Hyun Ryu, Ho-Yong Ahn, Soo-Jin Lee, Geun-Ho Kwak, Young-Ah Jeon, and Kyung-Do Lee

Understanding cropland utilization is essential for improving agricultural productivity and efficiently managing cropland resources. Analyzing region-specific cropping systems enables the establishment of sustainable agricultural policies tailored to environmental conditions. However, conducting field surveys over extensive agricultural areas presents significant challenges. Satellite data for agricultural monitoring provides continuous and large-scale information for cropland. The purpose of this study is to develop a cropping pattern product for annual crops using satellite data. The study area is ‘Gimje-si’ in the Republic of Korea. Sentinel-2 Level-2 data was acquired from 2022 to 2024. The normalized difference vegetation index (NDVI) was calculated after eliminating cloud and contaminated pixels, and then the monthly mean NDVI was computed. Cropland was extracted using a farmland boundary map in vector file format. Types of cropping patterns were classified into single and sequential (e.g., double, triple) cropping, and non-cultivated land, based on the number of peaks in the time-series NDVI data. The threshold for NDVI peaks was set to 0.4, and the minimum distance between NDVI peaks was set to 3. The final product was generated in vector format and includes monthly NDVI values, cropping patterns, and peak month information for each field. The annual map for 3 years showed changes in cropping patterns. These products were useful for detecting changes in cropland and confirming whether it was being cultivated. There was an increasing trend in the number of fields with sequential cropping from 2022 to 2024. Our results help comprehend the use and change of cropland spatiotemporally.

Acknowledgments: This research was funded by RDA, grant number PJ01676802.

How to cite: Choi, L.-Y., Ryu, J.-H., Ahn, H.-Y., Lee, S.-J., Kwak, G.-H., Jeon, Y.-A., and Lee, K.-D.: Development of Cropping Pattern Product Using Sentinel-2 Satellite Data, EGU General Assembly 2025, Vienna, Austria, 27 Apr–2 May 2025, EGU25-8077, https://doi.org/10.5194/egusphere-egu25-8077, 2025.

Accurate cultivated land parcels (CLPs) information is essential for precision agriculture. Deep learning methods have shown great potential in CLPs delineation but face challenges in detection accuracy, generalization capability, and parcel optimization quality. This study addresses these challenges by developing a high-generalization multi-task detection network coupled with a specialized parcel optimization step. Our detection network integrates boundary and region tasks and design distinct decoders for each task, employing performance-enhancing modules as well as more balanced training strategies to achieve both accurate semantic recognition and fine-grained boundary depiction. To improve network's ability to train more generalized models, our study identifies the variations in image hue, landscape surroundings, and boundary granularity as the key factors contributing to generalization degradation and employ color space augmentation and attention mechanisms on spatial and hierarchy to enhance the generalization. Additionally, the parcel optimization step repairs long-distance boundary breaks and performs object-level fusion of delineated regions and boundaries, resulting in more independent and regular CLP results. Our method was trained and validated on GaoFen-1 images from four diverse regions in China, demonstrating high delineation accuracy. It also maintained stable spatiotemporal generalization across different times and regions. Comprehensive ablation and comparative experiments confirmed the rationale behind our model improvements and demonstrated our method's effectiveness over existing single-task models (SegNet, MPSPNet, DeeplabV3+, U-Net, ResU-Net, R2U-Net), and recent multi-task models (ResUNet-a, BSiNet, SEANet). 

How to cite: Zhu, Y. and Pan, Y.: A deep learning method for cultivated land parcels (CLPs) delineation from high-resolution remote sensing images with high-generalization capability, EGU General Assembly 2025, Vienna, Austria, 27 Apr–2 May 2025, EGU25-8391, https://doi.org/10.5194/egusphere-egu25-8391, 2025.

EGU25-8765 | ECS | Orals | ESSI4.11

Using Remote Sensing Spectral Image Dynamics for early prediction of biotic stress in wheat: lessons from Armenia and southern Russia 

Igor Sereda, Andrey Medvedev, Grigor Ayvazyan, and Shushanik Asmaryan

Winter and spring wheat are among key agricultural crops in the Republic of Armenia, and represent a significant share of grain production. However, their yield is threatened to substantially decline due to the negative impact of various biotic factors, including weeds and phytopathogens such as rust, powdery mildew, and tan spot. Remote sensing methods, particularly multitemporal dynamics of plant spectral imagery, offer opportunities for early detection and monitoring of these diseases. Early identification allows for timely management interventions to stabilize crop conditions, preserve yields, and enable mapping of problem areas before scheduled applications, allowing more effectively application of herbicides and fungicides.

Hyperspectral spectrometry of winter wheat crops under increased pathogen stress, together with control plots without increased pathogen stress, were studied in experimental fields in southern Russia (Krasnodar Krai) between 2017-2023. The results show that the temporal dynamics in reflectance during the spring-summer growth period of winter wheat likely indicate disease levels, where the period between stem elongation and heading was identified as crucial. A series of high-frequency spectral measurements (every 2–3 days) allowed the classification of areas with infected and healthy plants (accuracy of 70–88%) but also reasonably accurate predictions of the maximum development stage of various pathogens (R² = 0.48–0.55) 10–12 days before peak development. Moreover, these patterns were confirmed using data from ground-based spectrometry, UAVs, and satellite imagery.

Additionally, this methodology was tested on spring wheat fields in the Republic of Armenia (Aragatsotn, Nerkin Sasnashen) in 2024. Using a series of multitemporal UAV surveys, the fields were divided into zones based on the temporal behavior of spectral imagery that successfully identifies zones of weed emergence and negative consequences of agronomic errors. However, identification of more sensitive spectral regions with pathogen hotspots was hindered by the high heterogeneity of the fields.

Based on these methodologies, we defined the optimal dates for initiating phytosanitary monitoring for different regions in Armenia. This part of the investigation shows that zoning territories by the timing of the phenophase "stem elongation" with an error <10 days is crucial for the start of intensive spectral monitoring, and can be achieved by combining NDVI data with meteorological and topographical parameters.

Altogether, the results demonstrate the early diagnosis of biotic stress in plants is feasible using spectral data and can improve decision-making for field treatments in the long term. The early detection of biotic stress in plants enhances the potential of precision agriculture, as time is a crucial factor in addressing these challenges. Furthermore, the described methods have shown the capability to be scaled from local experiments, as is currently the case in most studies, to a regional scale.

How to cite: Sereda, I., Medvedev, A., Ayvazyan, G., and Asmaryan, S.: Using Remote Sensing Spectral Image Dynamics for early prediction of biotic stress in wheat: lessons from Armenia and southern Russia, EGU General Assembly 2025, Vienna, Austria, 27 Apr–2 May 2025, EGU25-8765, https://doi.org/10.5194/egusphere-egu25-8765, 2025.

EGU25-9499 | Posters on site | ESSI4.11

Spectral-based monitoring methods to optimise precision irrigation in maize 

Attila Nagy, Andrea Szabó, Gift Siphiwe Nxumalo, Erika Budayné Bódi, and János Tamás

Precision irrigation is one of the fundamental areas of modern agriculture that aims to manage water use more efficiently and sustainably. Continuous monitoring of crop status is essential for the optimisation of irrigation systems, in which spectral-based monitoring methods play a key role. These methods use the spectral properties of the light reflected or absorbed by plants to determine vegetation indices, soil moisture and other plant life parameters. Measurements in the optical and infrared (IR) wavelengths are particularly important as these wavelengths are sensitive to the biochemical and physical properties of plants, such as chlorophyll content, nitrogen levels and water content.

The primary aim of the study is to expand the area of remote sensing in agricultural monitoring using laboratory, field scale proximal sensors, field an UAV imaging by creating a new rapid non-invasive approach for predicting crop health and water demand using spectral data. The study seeks to close the gap where chlorophyll estimations are generally not plant-specific by offering an integrated and refined approach to improve reliability and accessibility in chlorophyll estimation. Besides Integrating VI and thermal imaging with UAV technology can be used in precision agriculture in a number of areas, such as crop monitoring, yield forecasting and optimisation of irrigation water allocation. Furthermore, using several VIs were found to be optimal in crop coefficient estimation, so as to more precise calculation of crop evapotranspiration The ultimate result is giving new approaches to farmers and agricultural stakeholders for more precise and dependable tools for measuring crop evapotranspiration, crop health while promoting sustainability, efficiency, and scalability in irrigation practices.

The research presented in the article was carried out within the framework of the Széchenyi Plan Plus program, with support from the RRF 2.3.1 21 2022 00008 project. This research was supported by the János Bolyai Research Scholarship of the Hungarian Academy of Sciences


How to cite: Nagy, A., Szabó, A., Nxumalo, G. S., Budayné Bódi, E., and Tamás, J.: Spectral-based monitoring methods to optimise precision irrigation in maize, EGU General Assembly 2025, Vienna, Austria, 27 Apr–2 May 2025, EGU25-9499, https://doi.org/10.5194/egusphere-egu25-9499, 2025.

EGU25-9634 | ECS | Orals | ESSI4.11

Assessing generalization of deep learning models for crop classification under climatic variability in Denmark 

Muhammad Rizwan Asif, Mehdi Rafiei, Rasmus Nyholm Jørgensen, Michael Nørremark, and Nima Teimouri

This study explores the impact of climatic variability on the generalization capabilities of a deep learning model for pixel-level crop classification using multi-temporal Sentinel-1 SAR data in Denmark. With agriculture accounting for 61% of Denmark’s land area, accurate and timely crop mapping is essential for providing insights into crop distribution, offering valuable information to advisors and authorities to support large-scale agricultural management, and address challenges posed by changing climatic conditions.

Our study leverages a novel deep learning architecture that combines a 3-D U-Net with a conv-LSTM module to effectively capture both spatial and temporal dependencies in crop growth patterns. We consider 14 crop types over an eight-year period (2017–2024) and growth season (May to August), with ground truth data derived from Denmark’s Land Parcel Identification System (LPIS). Our analyses reveal that climatic variables such as precipitation, temperature, and humidity significantly influence model performance across years. Notably, extreme years like 2018 (characterized by drought and high solar radiation) and 2024 (marked by record precipitation) challenge the model’s ability to generalize effectively. By correlating inter-annual model accuracy trends with climatic data, the study demonstrates the necessity of incorporating environmental context into AI-driven agricultural monitoring systems.

We also evaluate the benefits of training the model on multi-year datasets to enhance robustness against climatic variability. Our findings reveal that leveraging temporal diversity improves model performance but highlights persistent difficulties in generalizing to outlier years with extreme climate conditions. While training on multi-year datasets helps capture a broader range of crop phenological variations, the results underscore that this approach alone is not sufficient, and underscores the importance of integrating auxiliary data, such as local climatic variables, to enable models to better adapt to evolving crop growth patterns influenced by changing environmental conditions.

This work represents one of the most comprehensive evaluations of deep learning for crop classification, spanning eight years and covering over 1.5 million hectares of agricultural land. By linking model performance to climatic variability, this study provides critical insights for improving the generalization capabilities of deep learning models in precision agriculture. These findings not only pave the way for enhanced crop monitoring under diverse climatic scenarios but also emphasize the potential of integrating climate-resilient AI technologies to address global agricultural and environmental challenges.

How to cite: Asif, M. R., Rafiei, M., Jørgensen, R. N., Nørremark, M., and Teimouri, N.: Assessing generalization of deep learning models for crop classification under climatic variability in Denmark, EGU General Assembly 2025, Vienna, Austria, 27 Apr–2 May 2025, EGU25-9634, https://doi.org/10.5194/egusphere-egu25-9634, 2025.

EGU25-9672 | ECS | Orals | ESSI4.11

Barley Yield Estimation Using Regression Models and Spatial Pattern Analysis 

Faten Ksantini, Miguel Quemada, Andrés F. Almeida-Ñauñay, Ernesto Sanz, and Ana M. Tarquis

Precision agriculture (PA) has emerged as a key strategy for optimizing agricultural production. Using data-driven technologies such as sensors and satellite imagery, PA improves the efficiency of agricultural processes. Accurate crop yield estimation is an essential component of PA. An important aspect of yield estimation within PA is the ability to assess and map spatial variations in yield in an agricultural field. Understanding these spatial patterns enables more precise management decisions and targeted interventions.

Therefore, this study aimed to develop two regression approaches, multiple linear regression (MLR) and random forest regression (RFR), to estimate crop yield using sixteen input variables with a 6 m resolution. These variables were obtained using different sensors, reflecting the soil and crop spatial variability. The estimation performance of the studied approaches was assessed using the coefficient of determination (R²), showing very satisfactory results (R² > 0.85) for both approaches.

The spatial distribution of barley yield was assessed, focusing on identifying areas of high and low productivity within the field. RFR demonstrated its ability to capture yield patterns. By incorporating spatial factors, RFR effectively modelled the varying yield potential in the crop field.


Keywords—precision agriculture, multiple linear regression, random forest regression, spatial pattern, barley


Acknowledgments: Financed by Ministerio de Ciencia e Innovación, Spain (PID2021-124041OB-C22)


How to cite: Ksantini, F., Quemada, M., Almeida-Ñauñay, A. F., Sanz, E., and Tarquis, A. M.: Barley Yield Estimation Using Regression Models and Spatial Pattern Analysis, EGU General Assembly 2025, Vienna, Austria, 27 Apr–2 May 2025, EGU25-9672, https://doi.org/10.5194/egusphere-egu25-9672, 2025.

EGU25-9872 | ECS | Orals | ESSI4.11

Remote Sensing-based Wheat Area and Yield Estimation: Insights from Uttarakhand, India 

Priya Singh and Kritika Kothari

India is one of the world's leading exporters of wheat grain, making monitoring its growth and yield one of the country's top economic priorities. This study aimed to develop a methodology for delineating wheat cultivation areas and estimating wheat yields using Landsat 8 (30 m spatial resolution) data for the Nainital and Udham Singh Nagar districts of Uttarakhand, India. The cultivated wheat fields were identified using a supervised classification-based Random Forest (RF) algorithm during the growing season from November 2020 to April 2021. To characterize the wheat class, a total of 239 and 226 wheat points, along with 201 and 166 non-wheat geometry points, based on NDVI time series were allotted for Nainital and Udham Singh Nagar districts, respectively. The calculated wheat area was found to be 778.94 sq. km and 209.48 sq. km, compared to the actual reported areas by the Agriculture Department, Government of Uttarakhand of 1059.61 sq. km and 212.78 sq. km for Udham Singh Nagar and Nainital, respectively. The RF algorithm showed an underestimation for both districts, achieving a kappa coefficient of 0.97, producer accuracy of 0.97, user accuracy of 0.96, and overall accuracy of 0.98 for the Nainital district. For the Udham Singh Nagar district, the kappa coefficient was 0.89, with producer accuracy of 0.89, user accuracy of 0.93, and overall accuracy of 0.93. The study also utilized weather data along with Landsat 8 imagery as inputs for the Carnegie-Ames-Stanford Approach (CASA) to estimate wheat yields and get spatial wheat yield maps. The estimated mean yields were 3.73 t ha⁻¹ and 3.37 t ha⁻¹, whereas the actual mean yields were 3.82 t ha⁻¹ and 4.45 t ha⁻¹ for Nainital and Udham Singh Nagar districts, respectively. The study demonstrates the potential of combining remote sensing and supervised classification techniques for reliable wheat yield estimation in data-scarce regions, which can be a promising tool for agricultural policy and decision-making.

Keywords: Crop classification, Landsat 8, random forest, wheat, spatial yield map 

How to cite: Singh, P. and Kothari, K.: Remote Sensing-based Wheat Area and Yield Estimation: Insights from Uttarakhand, India, EGU General Assembly 2025, Vienna, Austria, 27 Apr–2 May 2025, EGU25-9872, https://doi.org/10.5194/egusphere-egu25-9872, 2025.

EGU25-10478 | ECS | Posters on site | ESSI4.11

Correlation between NDVI and soil sensor data collected by UAV 

Andrea Szabó, Erika Budayné Bódi, Ademola Blessing Blessing, Sándor Kun, Éva Nikolett Kiss, János Tamás, and Attila Nagy

The development of UAVs and the reduction in the weight of payload-bearing devices is making remote sensing of crops possible. This technology is cheaper, more time-efficient and produces higher resolution images in a non-destructive way. Another important feature of drone imagery is its ability to monitor crops on a regular basis. The raw data collected by drones can be integrated into models for analysis and further corrective measures can be created to improve crop yields. Drones are capable of assessing soil conditions, assisting in irrigation, fertilizer application and monitoring crop health. The Normalized Difference Vegetation Index (NDVI) was used to quantify the greenness of vegetation to assess changes in vegetation density and health. When near-infrared light reaches the leaves of a healthy plant it is reflected back into the atmosphere, as the amount of chlorophyll produced by the plant decreases, less near-infrared radiation is reflected back. The result can then be used to assess the overall health of the plant. The values are calculated for each pixel of your map, giving you an index in the range -1 to 1.


4 sampling points (A-D) were selected in the sample area Nyírbator, Hungary. Soil moisture and soil temperature probes were deployed at three depths in the points and data were downloaded during bi-weekly sampling and measurements. The vegetation monitoring of the irrigated and non-irrigated area was carried out by taking NDVI images every 2 weeks using UAV remote sensing. During the NDVI processing of the irrigated area, only the first half of the area was captured for the initial images, at the beginning of the vegetation. NDVI images were processed in Pix4D and ArcGIS Pro software. In ArcGIS Pro, the minimum, maximum, mean and standard deviation values for the study area were observed and subsequently evaluated separately point by point using a zonal statistics algorithm.


In the study area, a larger temperature variation is observed for the deployed soil probes at a depth of 10 cm, which underlines the sensitivity of the surface temperature to environmental conditions. With increasing depth, a gradual decrease in temperature is observed, indicating the influence of soil properties on heat retention and dissipation. Consistently fluctuating moisture levels near the surface (at a depth of 10 cm) were observed in response to precipitation or irrigation events. The fluctuation of the curves gradually decreases with increasing depth. At all depth levels, a more consistent linear gradient is observed, reflecting the prolonged drought conditions in the soil. This observation is consistent with the low mean NDVI values observed simultaneously in the same zone. The data show that the irrigated area tends to have higher average NDVI values than the non-irrigated area, which has significantly lower values.


This research was supported by the János Bolyai Research Scholarship of the Hungarian Academy of Sciences. The research presented in the article was carried out within the framework of the Széchenyi Plan Plus program with the support of the RRF 2.3.1 21 2022 00008 project.

How to cite: Szabó, A., Budayné Bódi, E., Blessing, A. B., Kun, S., Kiss, É. N., Tamás, J., and Nagy, A.: Correlation between NDVI and soil sensor data collected by UAV, EGU General Assembly 2025, Vienna, Austria, 27 Apr–2 May 2025, EGU25-10478, https://doi.org/10.5194/egusphere-egu25-10478, 2025.

EGU25-11964 | Orals | ESSI4.11

What influences alpine pasture productivity? Exploring the relation among topography, climate, and biomass using remote sensing. 

Fabio Oriani, Helge Aasen, Manuel Schneider, and Pierluigi Calanca

Mountain pastures are a biodiversity rich and heterogeneous ecosystem of the Alps influenced by a complex topography and a variable climate. Understanding the impact of these factors on pasture productivity is of primary importance for forage production and ecosystem preservation.

We present here a regional analysis covering the alpine pastures in the Grisons Canton (eastern Switzerland, 1997 sq. km), for which we developed a collection of high-resolution (10-m) annual growth indicators based on the Enhanced Vegetation Index (EVI) derived from Sentinel-2 images, from 2016 to 2024. We correlate our growth maps to a 1-km gridded climate dataset (Meteoswiss) and a 10-m digital elevation model (Swisstopo) to understand which weather factors - rainfall, temperature, or radiation - influence the most the growing season and from which period of the year. In addition, we explore the variability of these dependencies in space, in relation to elevation and derived topographic descriptors, e.g. slope or valley orientation.

This analysis shades light on the climate dynamics impacting the most the growing season in conjunction to a complex local topography. The results can be used to identify vulnerability levels along the elevation profile, influenced by soil depth and valley orientation, where growth varies the most from year to year in function of annual weather variations. In these zones, pasture management will need extra flexibility measures and real-time monitoring to adapt to annual fluctuations of a future climate change.

How to cite: Oriani, F., Aasen, H., Schneider, M., and Calanca, P.: What influences alpine pasture productivity? Exploring the relation among topography, climate, and biomass using remote sensing., EGU General Assembly 2025, Vienna, Austria, 27 Apr–2 May 2025, EGU25-11964, https://doi.org/10.5194/egusphere-egu25-11964, 2025.

Understanding and monitoring crop growth is crucial for addressing global food security challenges and promoting sustainable agricultural practices. Traditional methods of observing crop traits in plot experiments are labor-intensive, limiting their spatial and temporal resolution. While conventional satellite platforms like Sentinel-2 and Landsat have proven valuable for large-scale agricultural monitoring, their spatial resolutions and temporal gaps are insufficient for time series of small experimental plots. Recent advancements, such as PlanetLabs’ SuperDove constellation, provide an alternative by offering daily imagery at a 3 m resolution, making them suitable for small-scale plot-level analysis. Despite their high spatial detail, these images face challenges related to radiometric stability, spatial co-registration accuracy, and quality masks, which must be resolved for effective small-scale monitoring. Addressing these limitations, this research investigates the use of PlanetScope data to estimate canopy cover (CC) and leaf area index (LAI) in plot experiments. High-resolution Unmanned Aerial System (UAS) RGB imagery was used as a reference to estimate early-stage CC. By applying a machine learning-based segmentation technique, we distinguished foliage from background pixels. This segmentation enabled us to integrate UAS-derived CC estimates with 8-band multispectral imagery from PlanetLabs’ SuperDove constellation. After improving the radiometric stability and spatial accuracy of the satellite imagery, we used the multispectral data along with UAS-derived canopy cover estimates as inputs to identify the most sensitive satellite-derived vegetation indices (VIs) for estimating CC during the early growth stages. In conjunction with LAI, we generated model-based time-series growth curves covering all phenological stages. The method was validated on experimental plots in northern Switzerland, with varying soil compaction and fertilization treatments. The study demonstrates successful segmentation of high-resolution UAS-based RGB imagery, providing a robust baseline for validating satellite-derived data and training novel retrieval methods for canopy cover. Comparative analyses identify vegetation indices from PlanetScope imagery that correlate with early crop growth. This research highlights the potential of high-resolution satellite data for generating time-series growth curves, offering a valuable tool for improving crop management and optimizing resource use across diverse farming systems.

How to cite: Boos, T. and Aasen, H.: Using High-Resolution Satellite Data to Estimate Canopy Cover and Leaf Area Index in Plot Experiments, EGU General Assembly 2025, Vienna, Austria, 27 Apr–2 May 2025, EGU25-12456, https://doi.org/10.5194/egusphere-egu25-12456, 2025.

EGU25-12606 | ECS | Orals | ESSI4.11

Comparison of zonation approaches by means of remote sensing vegetation indices for agricultural applications  

Gunay Hasanli, Sadra Emamalizadeh, Riccardo Mazzoleni, and Gabriele Baroni

Remote sensing vegetation indices play a vital role in agricultural zoning by providing detailed insights into crop health, productivity, and environmental conditions. They enable researchers and professionals to monitor environmental changes, urban expansion, and natural events with exceptional accuracy and precision. This progress has been fueled by major technological developments in satellite sensors, data processing algorithms, and analytical methods, enabling the capture of more detailed information and increased observation frequency across expansive regions. Despite these excellent opportunities, numerous image processing techniques have been suggested, each customized for particular applications, datasets, and user needs, yet no widely recognized standard methods have been established. This absence of standardization creates difficulties of interoperability, reproducibility, and consistency in analytical results. Researchers and practitioners frequently encounter challenges choosing the most suitable methods, since the effectiveness of these techniques can fluctuate based on factors like spatial resolution, temporal frequency, and the type of landscape under examination. As a result, there is an increasing demand for the creation of thorough guidelines and uniform procedures that can facilitate the use of remote sensing instruments while ensuring dependable and comparable outcomes across various studies and fields. In this research, we analyze zonation outcomes obtained from remote sensing images captured at different times, using several vegetation indices and applying various clustering techniques. The objective is to evaluate how time-related changes, the selection of vegetation indices, and the use of different clustering methods affect the precision and dependability of land classification. Through the examination of these combination performance, this comparative examination underscores both the advantages and drawbacks of each approach while offering important insights for improving classification methods in varied and changing environments.

How to cite: Hasanli, G., Emamalizadeh, S., Mazzoleni, R., and Baroni, G.: Comparison of zonation approaches by means of remote sensing vegetation indices for agricultural applications , EGU General Assembly 2025, Vienna, Austria, 27 Apr–2 May 2025, EGU25-12606, https://doi.org/10.5194/egusphere-egu25-12606, 2025.

EGU25-13239 | Posters on site | ESSI4.11

LED-induced chlorophyll fluorescence during heat and drought stress as assessed in a microcosm experiment on sunflower 

Szilvia Fóti, Ádám Mészáros, Islam Guettala, Evelin Péli, Krisztina Pintér, Zoltán Nagy, and János Balogh

Like sun-induced fluorescence (SIF), LED-induced fluorescence (LEDIF) became frequently used to establish and analyze leaf- and canopy-level stress responses. Different plant phenotypes (trees, understory shrubs, crops, vineyards, etc.) were subjected to, in most of the studies, blue LED illumination during the night or in darkened boxes for assessing either the entire broad-band (650-850 nm) spectrum of LEDIF or one of the wavelength bands of the red (~ 690 nm) and far-red (~ 740 nm) peak emissions. It seems to be however less common to apply close to “white” LED lighting, mixed from different wavelength ranges all below 650 nm (to overcome spectral overlap of red excitation and emission) as a light source. Moreover, stress manipulation in microcosm experiments is also scarce within studies while detecting LEDIF signal changes.

In our study, we established a microcosm experiment with four treatments on sunflowers: well-watered – no heat stressed, well-watered – heat stressed, water-stressed – no heat stressed, and water-stressed - heat stressed. The plants were gradually exposed to the treatments during the two months of the experiment between October and December 2024. We captured reflectance and the broad-band fluorescence spectra above the canopy with a VIS-NIR spectrometer facing downwards toward the canopy between the LED panels. We followed the response of the plants to the imposed stress by weekly/bi-weekly measurements and analyzed the changes in the shapes of the curves. We also captured the canopy architecture with side-view photos and leaf area growth with top-view photos. There was a clear increase in the LEDIF signal during the canopy development, and then a heterogeneous response depending on the treatment.

How to cite: Fóti, S., Mészáros, Á., Guettala, I., Péli, E., Pintér, K., Nagy, Z., and Balogh, J.: LED-induced chlorophyll fluorescence during heat and drought stress as assessed in a microcosm experiment on sunflower, EGU General Assembly 2025, Vienna, Austria, 27 Apr–2 May 2025, EGU25-13239, https://doi.org/10.5194/egusphere-egu25-13239, 2025.

Accurate and timely seasonal yield predictions before harvest are becoming ever more relevant due to increasing pressure on the agricultural sector under climate change. Especially for agricultural planning, logistics, and food markets, seasonal predictions are of significant importance in the context of food security and price stability.

A novel approach to enhance early-season yield forecasts at the regional scale will be presented. Earth observation (EO) data from the Copernicus Sentinel-3 satellite are able to trace spatio-temporal vegetation dynamics (e.g., crop phenological status, crop growth, photosynthesis via FAPAR, or chlorophyll indices) in near real-time. By deriving daily satellite composites and combining these data with physical modelling using the Lund-Potsdam-Jena managed Land (LPJmL) dynamic global vegetation model (DGVM) in a newly developed assimilation process, enhanced yield forecasts can be achieved. There are currently no interfaces for continuous assimilation of EO data for the LPJmL model, thus, approaches such as parameter forcing and ensemble methods allowing for continuous parameter optimization during the course of the growing season are presented and compared conceptually to improve the LPJmL model for seasonal yield predictions. Existing methods for model parameter calibration and optimization with EO data using machine learning are applied to agricultural areas in the study area.

While these results focus on the study area of Bavaria, southern Germany, the approach is scalable also on national or European scale. For demonstration purposes, the year 2018 – a comparably dry year – was chosen due to the availability of detailed land use data. LPJmL was designed for global simulations, hence, a regional downscaling is necessary for its application at the regional scale.

Integrating different remote sensing data sources enables a more detailed picture of plant growth, which will allow a regional early warning system for food security and farmer’s turnover in the future. The combination of process- and data-based approaches is likely to improve accuracy and lag time.

How to cite: Jörges, C., Hank, T., and Fader, M.: Chances and Challenges of Data Assimilation for Seasonal Yield Predictions Using Sentinel-3 Satellite Data and the Agro-Ecosystem Model LPJmL, EGU General Assembly 2025, Vienna, Austria, 27 Apr–2 May 2025, EGU25-13318, https://doi.org/10.5194/egusphere-egu25-13318, 2025.

EGU25-14174 | Posters on site | ESSI4.11

Mapping Soil Organic Carbon Dynamics in Taiwan’s Agricultural Land Using Field and Remote Sensing Data. 

Miguel Conrado Valdez Vasquez, Chi-Farn Chen, Jien-Hui Syu, and Liang-Chien Chen

Soil organic carbon (SOC) stocks represent the second-largest natural carbon reservoir globally, surpassed only by the oceans. SOC plays a vital role in maintaining ecosystem health, offering numerous benefits such as enhancing soil structure, increasing nutrient availability, and boosting water retention capacity. Beyond its ecological significance, SOC is integral to climate change mitigation, given its ability to sequester atmospheric carbon dioxide effectively. Additionally, SOC contributes to improving the physical, chemical, and biological properties of soil, making it indispensable for sustainable land management. Taiwan, an island in the western Pacific Ocean, spans an area of approximately 35,800 square kilometers. Shaped like a tobacco leaf, the island extends 400 kilometers in length and 150 kilometers at its widest point. Taiwan’s landscape is characterized by a Central Mountain Range running north to south, steep slopes, and geologically fragile formations. In recent decades, Taiwan has experienced significant changes in land use and land cover, particularly in urban areas where cropland and forest land on city outskirts have been replaced by infrastructure development. These transformations have directly impacted SOC levels across the island, underscoring the need for accurate mapping to estimate SOC stocks and assess soil functionality, particularly in agricultural regions. Traditional ground sampling methods for estimating SOC, though precise, are often costly and labor-intensive. To address these limitations, alternative approaches, such as remote sensing, offer cost-effective solutions. Among various predictive modeling techniques, machine learning algorithms like Random Forest (RF) have emerged as highly effective tools for SOC estimation. RF models excel due to their ability to minimize correlation among individual decision trees and provide reliable error estimates, ensuring robust predictions.

In this study, we combined field sampling data (2010–2021) with remote sensing, topographic, and climatic datasets to estimate SOC stocks in the topsoil layer (0–30 cm) of Taiwan’s agricultural areas. Using the RF algorithm, we initially employed 23 explanatory variables and subsequently refined the model by eliminating less significant predictors, reducing the final set to 12 variables. The refined model demonstrated strong predictive accuracy, with R² values exceeding 0.70 for agriculture land in Taiwan. Our findings revealed spatial variations in SOC levels, with mountainous regions exhibiting higher SOC stocks compared to suburban and low-lying agricultural areas, where values were notably lower. SOC levels for agricultural lands ranged from a maximum of 7.14 kg/m² to a minimum of 2.55 kg/m², with an average value of 3.43 kg/m². Agricultural practices incorporating agroforestry techniques showed relatively higher SOC stocks, emphasizing the role of sustainable practices in enhancing soil carbon storage. The results of this study hold significant implications for long-term monitoring of SOC in Taiwan and provide a crucial reference for policymakers aiming to develop effective carbon sequestration strategies. By integrating field data with advanced modeling and remote sensing technologies, this research contributes to a deeper understanding of SOC dynamics and supports efforts to promote sustainable land management and climate resilience.

How to cite: Valdez Vasquez, M. C., Chen, C.-F., Syu, J.-H., and Chen, L.-C.: Mapping Soil Organic Carbon Dynamics in Taiwan’s Agricultural Land Using Field and Remote Sensing Data., EGU General Assembly 2025, Vienna, Austria, 27 Apr–2 May 2025, EGU25-14174, https://doi.org/10.5194/egusphere-egu25-14174, 2025.

Air pollution, particularly surface ozone, has become a significant threat to agriculture in China, severely impacting the productivity of essential staple crops like winter wheat. However, the spatiotemporal variability of ozone concentrations and its interactions with other environmental factors—such as temperature and droughts—remain inadequately understood regarding their impact on agricultural productivity. To address this gap in knowledge, this study integrates multi-source remote sensing data with advanced statistical analysis and machine learning techniques to quantitatively examine the spatiotemporal variation of ozone pollution and its interactions with climate change and other environmental factors on winter wheat productivity.

The study first employs the Geographically and Temporally Weighted Regression (GTWR) model, utilizing high-resolution remote sensing data from 2013 to 2019, to assess the spatiotemporal response of winter wheat productivity to ozone pollution. To further investigate the interactions between ozone and other environmental factors, an interpretable machine learning framework is applied, specifically using the eXtreme Gradient Boosting (XGBoost) algorithm augmented by SHapley Additive exPlanations (SHAP). Additionally, a structural equation model is developed to elucidate the underlying mechanisms of these interactions. The results indicate that the negative impact of surface ozone on winter wheat has intensified annually, with significant spatial variation. Particularly in high-pollution areas, such as eastern Henan and northern Anhui provinces, the effects of ozone on winter wheat are most pronounced. Furthermore, the study reveals that the impact of ozone on winter wheat productivity varies across different growth stages, with the most severe effects observed during the later stages in May. Additionally, the research reveals the complex interactions between ozone and other environmental factors, such as temperature and aerosol concentration. Notably, the harmful effects of ozone are exacerbated under conditions of high aerosol concentration and elevated temperatures. Interestingly, drought conditions were found to partially mitigate the negative impact of ozone on productivity.

This study provides a systematic and actionable analytical framework for quantitatively evaluating the effects of ozone pollution and its interactions with climate change and other environmental factors on crop productivity. The findings underscore the need for targeted agricultural measures and pollution control strategies, particularly in high-pollution regions and during critical growth stages. These results provide theoretical support for sustainable agricultural development and climate adaptation management. Furthermore, the study contributes valuable insights into the application of remote sensing technology for large-scale agricultural monitoring, thereby enhancing the management efficiency and adaptive capacity of agricultural ecosystems in response to environmental challenges.

How to cite: Du, C.: Evaluating Air Pollution Impacts on Agricultural Productivity in China: Insights from Remote Sensing Data and Geospatial Modeling, EGU General Assembly 2025, Vienna, Austria, 27 Apr–2 May 2025, EGU25-14198, https://doi.org/10.5194/egusphere-egu25-14198, 2025.

EGU25-14688 | Posters on site | ESSI4.11

Monitoring Methane Emissions from Rice Paddies in Middle Taiwan Using Remote Sensing Data. 

Cheng-Ru Chen, Chi-Farn Chen, Nguyen-Thanh Son, Liang-Chien Chen, Tsang-Sen Liu, and Yao-Cheng Kuo

Methane (CH₄) emissions from paddy rice fields significantly contribute to greenhouse gas emissions and global climate change. In Taiwan, rice cultivation occupies approximately 20% of agricultural land. This study utilizes Sentinel-2 and Sentinel-5P satellite data to monitor methane emissions from these fields. The research follows four key steps: 1) classifying rice cropping areas; 2) detecting the phenological stages of rice; 3) correlating spatial and temporal data with rice cultivation and methane emissions; and 4) validating the results with in-situ data. The preliminary findings identify methane emission hotspots during the rice-growing seasons, revealing substantial temporal variability linked to agricultural practices such as water management, organic matter application, and rice phenology. Peak emissions occur during the early to mid-growing stages. The adoption of satellite data for monitoring emissions offers a cost-effective and scalable alternative to traditional methods, which are often labor-intensive and geographically limited. The research can also enhance the sustainable agricultural management strategies for achieving local greenhouse gas reduction targets.

How to cite: Chen, C.-R., Chen, C.-F., Son, N.-T., Chen, L.-C., Liu, T.-S., and Kuo, Y.-C.: Monitoring Methane Emissions from Rice Paddies in Middle Taiwan Using Remote Sensing Data., EGU General Assembly 2025, Vienna, Austria, 27 Apr–2 May 2025, EGU25-14688, https://doi.org/10.5194/egusphere-egu25-14688, 2025.

EGU25-14999 | Orals | ESSI4.11

Early prediction of within-field variability wheat productive potential using Sentinel2 satellite data. 

Elena Pareja-Serrano, José González-Piqueras, and André Chanzy

Assessing agricultural production in the context of climate change is a global concern. In the recent decades, variable rate technology (VRT) for agricultural machinery has made it possible to adjust fertiliser rates on-the-go, allowing the within-field crop management. In this context, in order to select the most effective management practices, it is essential to identify the driving factors that determine yield variability, mapping the spatial distribution of these driving factors and to determine the local yield variability potential.

Mapping the homogeneous within-field areas of yield potential is used to define management zones. Remote sensing data provide a practical means of delineating these zones. The crop biophysical variable, cumulative evapotranspiration (ETccum), derived from NDVI time series and climate data, was analysed to evaluate its ability to estimate yield. In the semi-arid conditions of the Spanish Central Plateau, wheat ETccum maps were correlated with yield maps by non-linear regression with an R2 of 88%. ETccum serves as an effective proxy for yield estimation and the statistical analysis to determine the level of homogeneity within the field, the driving factors that determine yield variability, and mapping the spatial distribution of these driving factors. Nevertheless, the observed saturation effect in the biophysical variable highlights limitations that require further analysis.

Additionally, during the wheat season, expected potential yields can fluctuate in response to actual weather conditions. Consequently, updating yield predictions early in the season is critical for informed irrigation and fertilisation management decisions. The ability of ETccum to forecast yields at early phenological stages, such as flag leaf and flowering—key stages for yield formation—is examined. Finally, the stability of spatial variability patterns, compared to those derived from ETccum at maturity, is analysed as an indicator of the spatial distribution of yield drivers.

Acknowledgments: this work was supported by the research project NSBOIL (Horizon, GA 101091246).

How to cite: Pareja-Serrano, E., González-Piqueras, J., and Chanzy, A.: Early prediction of within-field variability wheat productive potential using Sentinel2 satellite data., EGU General Assembly 2025, Vienna, Austria, 27 Apr–2 May 2025, EGU25-14999, https://doi.org/10.5194/egusphere-egu25-14999, 2025.

Effectively tracking drought effects using satellite data can be conducted by combining atmospheric data with additional information of vegetation indices (VIs) from optical data. While VIs detect drought when plant damage is often irreversible, information about the plant physiological status can help detect drought effects much earlier. Remotely-sensed solar-induced chlorophyll fluorescence (SIF), emitted directly from the photosynthetic apparatus (Drusch et al., 2017), provides such information.  When abiotic stress occurs due to an increased dissipation of thermal energy through the process of non-photochemical quenching (NPQ), the fluorescence yield is decreased, which can be measured as SIF (Berger et al., 2022, Damm et al., 2018).

Top of canopy (TOC) SIF is available from Sentinel-5P’s TROPOMI sensor since 2018 (Guanter et al., 2021, Köhler et al., 2018). This data, however, is affected by incoming radiation and canopy structure. These effects need to be removed In order to calculate the fluorescence yield in form of the quantum efficiency at leaf level (ΦF), which provides the pure information on the actual physiological status of the plant. Equation (1) uses the vegetation index NIRv (NDVI*NIR (Badgley et al., 2017)) to serve as a combined proxy of the fraction of absorbed photosynthetically active radiation (fAPAR) and the fluorescence escape probability (fesc) (Dechant et al. 2020, Liu et al. 2023). Both SIF data at 743 nm and the reflectance used to calculate the NIRv come from TROPOMI, while the photosynthetically active radiation (PAR) is provided by MODIS.

ΦF = π*SIF743canopy/(NIRv*PAR) (1)

This study presents a new multi-year (2018-2023) ΦF dataset at 0.05° resolution covering Germany with daily temporal resolution. To assess ΦF’s potential as an early drought stress indicator for agricultural and forest ecosystems, it is compared to the anomaly of subsurface water storage (sss), which serves a reference parameter for plant water availability generated by combining the hydrological model PARFLOW and common land model (CLM) (Belleflamme et al., 2023). ΦF and sss anomaly data were split into periods of prolonged negative sss anomaly indicating drought events (cross-referenced as watch/warning periods using the Combined Drought Indicator (European Commission)). Cross-correlation coefficients for different time lags were calculated to compare the datasets. The data was spatially aggregated daily and temporally averaged using a two-day rolling average.

Results show that cross-correlation coefficients for ΦF and sss anomaly are highest at a 2-day lag, dropping again after 3 days, indicating that ΦF follows the negative sss anomaly trend with a 2-day delay in both agricultural and forest ecosystems. Non-normalized canopy SIF and vegetation indices (NIRv, NDVI) showed no pattern and low cross-correlation coefficients during the observed periods. Our findings prove that ΦF has the ability to detect insufficient plant water availability and thus can be used for early drought stress detection in agricultural and forest ecosystems. The comparison of the capabilities of ΦF and TOC SIF to track short-term changes in subsurface water storage illustrates that a proper downscaling and normalization of canopy SIF is essential to use SIF satellite measurements for the early detection of drought events.

How to cite: Herrera, D., Rascher, U., Belleflamme, A., and Siegmann, B.: On the Potential of a Novel Satellite-Based Time-Series of Normalized Far-Red Solar-Induced Fluorescence to Track Short-Term Changes in Subsurface Water Storage, EGU General Assembly 2025, Vienna, Austria, 27 Apr–2 May 2025, EGU25-15038, https://doi.org/10.5194/egusphere-egu25-15038, 2025.

EGU25-15653 | ECS | Posters on site | ESSI4.11

Comparing Different Unmixing Methods for weed detection and identification 

Inbal Ronay, Ran Nisim Lati, and Fadi Kizel

Herbicides are extensively used for weed management worldwide. However, their use is a significant cause 
of environmental pollution and human health problems. Efficient Site-Specific weed management (SSWM) 
practice attempts to reduce herbicide use and its negative impacts by adjusting herbicide application based 
on weed composition and coverage. Such an application requires high-resolution data in spatial and spectral 
domains, which is not always available. Consequently, Mixed pixels are likely to exist, creating a challenge 
to generate accurate weed maps. In this regard, Spectral Mixture Analysis (SMA) can mitigate this challenge
by exploiting subpixel information. This study assesses the potential benefits of four SMA methods for 
estimating weed coverage of different botanical groups. We examined four methods- Constrained Least 
Squares Unmixing (FCLSU), Sparse Unmixing via variable Splitting and Augmented Lagrangian (SUnSAL), 
Sparse Unmixing via variable Splitting and Augmented Lagrangian and Total variation (SUnSAL-TV) and 
the Vectorized Code Projected Gradient Descent Unmixing (VPGDU). Each suggests a distinct advantage 
for spectral unmixing. We used controlled hyperspectral and multispectral field datasets to compare the four 
methods. The controlled data included weed species characterized by distinct botanical groups, while the 
field dataset included a corn field with weeds at varying densities. We assessed the performance of the 
different methods in estimating weed coverage and composition at various spatial resolutions. Our results
demonstrated the advantages of the total variation regularization of SUnSAL-TV and the superiority of the 
SAM-based method, VPGDU, over other approaches. VPGDU was the best-performing method, with MAE 
values consistently lower than 8.6% at all resolutions, underscoring the advantage of its objective function 
in unmixing weed botanical groups and the significant effect of illumination on the results. This result was 
also consistent in the field data as VPGDU yielded the lowest MAE of 11.95%,

How to cite: Ronay, I., Lati, R. N., and Kizel, F.: Comparing Different Unmixing Methods for weed detection and identification, EGU General Assembly 2025, Vienna, Austria, 27 Apr–2 May 2025, EGU25-15653, https://doi.org/10.5194/egusphere-egu25-15653, 2025.

EGU25-15760 | ECS | Orals | ESSI4.11

Generally applicable method for unsupervised weed detection in row crops using UAV-based high-resolution RGB imagery 

Ambroos Van Poucke, Jan Verwaeren, and Wouter Maes

Advancements in sensing technology and in machine and deep learning have expanded UAV remote sensing applications in agriculture. Most of these applications rely on supervised techniques, but generalization remains a critical and underexplored challenge. Agricultural datasets often exhibit variability across fields, sensors, crops and growth stages. While models such as convolutional neural networks (CNNs) perform well when trained on millions of samples, this approach is impractical with UAV-based agricultural data. This suggests that a location-specific, unsupervised approach might be more effective.

This study proposes a generally applicable method to map weed densities in row crops using high resolution RGB UAV data. The workflow first starts with a vegetation masking based on the Excess Green index, followed by a novel row detection model that separates intra- and interrow vegetation. Pseudo-labels generated from this step are used to train the CNN segmentation model Deeplabv3.

The method was applied on 12 maize datasets collected across multiple locations in Belgium, at different growth stages, and using three different UAV cameras, leading to ranges in ground sampling distance (GSD). The model was also applied on a public sugar beet dataset, PhenoBench, covering 3 dates was used to validate the model. Model performance was evaluated against manually annotated ground truth segmentation maps from each field (n = 50).

Semantic segmentation of crops achieved consistent mean Intersection over Union (IoU) values, exceeding 0.7 (F1-score > 0.89). Weed detection performance was relatively low in very early growth stages (IoU>0.4, F1-score > 0.6) due to limited plant sizes, but improved as weeds grew, with IoU reaching 0.63 (F1-score = 0.83) in later stages. The model was equally performant on maize and on sugar beet.

Despite these early-season limitations, the lower weed detection accuracy had minimal impact on field-level weed density maps, which are primarily used for relative density comparisons to guide site-specific herbicide applications. Regression analyses of predicted crop and weed areas against ground truth annotations showed strong linear relationships. Early-season datasets exhibited slight underestimates of weed area, whereas later-season datasets demonstrated a near-perfect 1:1 relationship (R² > 0.80). GSD proved to be a reciprocal indicator of accuracy, with the highest accuracy at GSDs below 1mm/pixel. GSD above 3 mm/pixel showed a rapid decrease in accuracy.

Overall, the proposed approach effectively generates accurate field-level weed density maps, offering a robust tool for precision weed management in agriculture.

How to cite: Van Poucke, A., Verwaeren, J., and Maes, W.: Generally applicable method for unsupervised weed detection in row crops using UAV-based high-resolution RGB imagery, EGU General Assembly 2025, Vienna, Austria, 27 Apr–2 May 2025, EGU25-15760, https://doi.org/10.5194/egusphere-egu25-15760, 2025.

EGU25-16547 | ECS | Orals | ESSI4.11

Knowledge-encoded deep fusion for yield estimation under extreme climate stress 

Xingguo Xiong, Renhai Zhong, Qiyu Tian, Ioannis Athanasiadis, and Tao Lin

Accurately modeling the impacts of climate stress on crop growth and yield is crucial for ensuring food security. Data-driven models are increasingly utilized for yield estimation because they can learn effective crop growth features from vast amounts of remote sensing and meteorological data. However, extreme climate stress conditions have few yield labels available for these models to modeling the interaction in crop responses. The response of crops to extreme climate stress often exhibits varied delays which are captured in remote sensing observations. In this study, we explicitly encode the time lag effect quantified by remote sensing and climate stress indicators into a two-stream fusion framework for estimating crop yield under extreme climate stress. Each stream employs a pyramid structure that progressively aggregates remote sensing and climate time series into feature embeddings. A time-lag-encoded cross attention mechanism fuses feature embeddings between the two streams, while phenology-sensitivity-guided linear attention is applied on top of the pyramid structures for processing ultimate time-lag encoded features. The proposed model is evaluated across nine Midwestern states within the US Corn Belt at the county level from 2006 to 2012, simulating climate stress situations with fewer samples. End-of-season results demonstrate that the knowledge-encoded two-stream model (RMSE=1.17 Mg ha-1) outperforms both the feature-stacking-based two-stream model (RMSE=1.43 Mg ha-1) and random forest (RMSE=1.68 Mg ha-1) under extreme climate stress. The improved estimation performance indicates that knowledge-encoded data fusion is more effective than merely stacking multi-source input data. In-season results reveal that our model proficiently captures extreme events and effectively predicts yield 8 weeks in advance. The time-lag knowledge could be extended to other forms of climate stress. Also, cross attention enables integration with additional data sources to enhance the interaction modeling of complex biomass accumulation and yield formation.

How to cite: Xiong, X., Zhong, R., Tian, Q., Athanasiadis, I., and Lin, T.: Knowledge-encoded deep fusion for yield estimation under extreme climate stress, EGU General Assembly 2025, Vienna, Austria, 27 Apr–2 May 2025, EGU25-16547, https://doi.org/10.5194/egusphere-egu25-16547, 2025.

EGU25-16843 | Orals | ESSI4.11

Explainable Machine Learning for Forest Fire Detection with Remote Sensing for Effective Rescue Planning 

Octavian Dumitru, Chandrabali Karmakar, and Shivam Goyal

In the present decade, forest fires have become more common than ever [1]. Efficient strategies to cope with fire situations, and/damage assessments need efficient automatic forest fire detection model. In this research, we propose an unsupervised eXplainable machine learning model to assess the severity of forest fire with remote sensing data. The model, namely, Latent Dirichlet Allocation is a Bayesian Generative model, is capable of generating interpretable visualizations. LDA uncertainty quantifiable and explainable [2]. We do not need labelled data to train the model. Other usefulness of the model is that it is simple to combine any kind of input data (for example, UAV images, wind speed information). In the scope of this contribution, we use Sentinel-2 spectral bands to extract information to compute indices indicating severity of fire [1]. Uncertainty of each prediction of the model is computed to ascertain robustness of the model. As a use case, we have chosen the recent forest fire incident at Los Angeles, USA [6].

The methodological approach is as the following:

1) we acquire pre-fire, post-fire Seintinel-2 images, 2) compute three indices : Normalized Difference Vegetation Index (NDVI), Normalized Burn Ratio (NBR), and Burned Area Index for Sentinel (BAIS) based on state of the art literature and generate index maps, 3) compute difference between the pre-fire and post-fire index maps, 4) apply the unsupervised xAI LDA model to retrieve semantic classes in pre-fire and post-fire Sentinel-2 band images, general corresponding classification maps and plot a binary class-to-class change map,  5) Analyze the maps with visual tool to find the most affected semantic classes (e.g., dense vegetations, urban areas etc.) and produce a data-driven estimation of per-class changes due to fire [7].

In future, we plan to fuse other data sources (e.g., wind speed information [5]) to help practical applications.

Reference:  

[1] Lasaponara, A. M. Proto, A. Aromando, G. Cardettini, V. Varela and M. Danese, "On the Mapping of Burned Areas and Burn Severity Using Self Organizing Map and Sentinel-2 Data," in IEEE Geoscience and Remote Sensing Letters, vol. 17, no. 5, pp. 854-858, May 2020, doi: 10.1109/LGRS.2019.2934503.

[2] Karmakar, C. O. Dumitru, G. Schwarz and M. Datcu, "Feature-Free Explainable Data Mining in SAR Images Using Latent Dirichlet Allocation," in IEEE Journal of Selected Topics in Applied Earth Observations and Remote Sensing, vol. 14, pp. 676-689, 2021, doi: 10.1109/JSTARS.2020.3039012.

[3] California Wildfires Live Updates: 24 Dead in L.A. as Dangerous Winds Threaten Fire Growth - The New York Times

[4] Sentinel-2 mission. Available online: https://sentinel.esa.int/web/sentinel/missions/sentinel-2

[5] Global Wind Atlas. Available online: https://globalwindatlas.info/en/about/dataset

[6] ESA news based on Sentinel-2. Available online: https://www.esa.int/ESA_Multimedia/Missions/Sentinel-2/(offset)/100/(sortBy)/published/(result_type)/images

[7] Karmakar, C.O. Dumitru, N. Hughes and M. Datcu, "A Visualization Framework for Unsupervised Analysis of Latent Structures in SAR Image Time Series", IEEE Journal of Selected Topics in Applied Earth Observations and Remote Sensing, 16, pp. 5355-5373, 2023.

How to cite: Dumitru, O., Karmakar, C., and Goyal, S.: Explainable Machine Learning for Forest Fire Detection with Remote Sensing for Effective Rescue Planning, EGU General Assembly 2025, Vienna, Austria, 27 Apr–2 May 2025, EGU25-16843, https://doi.org/10.5194/egusphere-egu25-16843, 2025.

EGU25-17615 | ECS | Orals | ESSI4.11

Automated detection of tuta absoluta (Meyrik) lesions on tomato plants using artificial intelligence 

Andrés Felipe Almeida-Ñauñay, Ernesto Sanz, Juan José Martín-Sotoca, Ruben Moratiel, Esther Hernández-Montes, and Ana M. Tarquis

The invasive tomato pest Tuta absoluta (Meyrik) poses a significant threat to global agriculture, often resulting in severe yield losses if not detected and managed early. This study investigates the application of artificial intelligence (AI) to develop an automated system for detecting T. absoluta (Meyrik) lesions on tomato plants. Leveraging open-source computational tools such as Google Colab, the research aims to provide an accessible and efficient solution through computational experiments, without requiring field trials.

A curated dataset of tomato plant images is prepared for training and evaluation. The YOLO (You Only Look Once) model is utilized for its proven effectiveness in small-object detection tasks, making it an ideal choice for identifying pest lesions. Model performance is assessed using metrics such as mean Average Precision (mAP), precision, recall, and F1-score, ensuring robust and reliable results across varying conditions. Prior research has highlighted the success of similar AI-based approaches in agricultural pest detection, achieving high accuracy while supporting sustainable farming practices  

This work emphasises leveraging multi-source data and advanced modelling approaches to enhance agricultural sustainability. By integrating sensing data and AI techniques, the study supports improved Integrated Pest Management (IPM) strategies, offering a scalable and environmentally friendly solution for pest monitoring in tomato production. Furthermore, the approach demonstrates how AI-driven insights from remote sensing can contribute to the broader goals of ecosystem productivity and nature-based solutions for climate change mitigation.

Acknowledgements: The authors acknowledge the support of the Project “LIFE23-CCA-ES-LIFE ACCLIMATE: Cultivating Resilience: Climate Change Adaptation Strategies for Greenhouses to Enhance Yield and Resource Efficiency from the Programme for the Environment and Climate Action (LIFE-EU) (project number: 101157315).

How to cite: Almeida-Ñauñay, A. F., Sanz, E., Martín-Sotoca, J. J., Moratiel, R., Hernández-Montes, E., and Tarquis, A. M.: Automated detection of tuta absoluta (Meyrik) lesions on tomato plants using artificial intelligence, EGU General Assembly 2025, Vienna, Austria, 27 Apr–2 May 2025, EGU25-17615, https://doi.org/10.5194/egusphere-egu25-17615, 2025.

EGU25-17735 | ECS | Orals | ESSI4.11

A multi-sensor remote sensing approach to monitor illegal charcoal production sites in Somalia’s forests 

Luca de Guttry, Iqro Abdi Olow, Paolo Paron, Michele Bolognesi, Ugo Leonardi, Laura Stendardi, Giovanni Argenti, Marco Moriondo, and Camilla Dibari

Illegal charcoal production, by means of indiscriminate logging activities, poses significant threats to the stability of the drylands’ ecosystem in the Somali territory. In addition, the revenues from the charcoal trade often serve further illegal activities, exacerbating the already complex socio-political context of the country. In this work, we investigated the application of freely available multi-sensor remote sensing products (Sentinel-1 and Sentinel-2) and machine learning techniques to detect the presence of charcoal production sites (i.e., kilns) over large areas. Exploiting Google Earth Engine and open-source tools, we were able to develop a binary classification of kilns’ presence-absence for the years 2019, 2020, and 2021 in a remote area (approximately 32000 km2) north-west of Mogadishu, Somalia. Concerning the workflow, we first computed median images, spanning the first three months of each year, composed of numerous optical, SAR (Synthetic Aperture Radar), and combined vegetation indices. Images were then subtracted between consecutive years and a Support Vector Classification (SVC) algorithm was trained and validated on the indices’ values extracted from those. As a reference dataset, we employed known kilns’ locations from a preceding study by FAO-SWALIM, where photointerpretation of very high resolution images was used to individuate the appearance of illegal charcoal kilns. The evaluation of the classifications showed that our approach has great capabilities for the automatic individuation and the monitoring of illegal charcoal production sites, with R2 values and accuracy metrics ranging between 0.80-0.88 for the three considered years (2019, 2020, 2021). Moreover, mappings of the predicted presence-absence of kilns (at 10 m spatial resolution) were produced starting from the trained SVC model, giving a spatial representation of the phenomenon and allowing an assessment of the most impacted areas. In conclusion, our results represent a significant advancement in monitoring illegal charcoal production activities in Somalia, offering a reliable and transferable methodology based on accessible satellite imagery and tools.

How to cite: de Guttry, L., Abdi Olow, I., Paron, P., Bolognesi, M., Leonardi, U., Stendardi, L., Argenti, G., Moriondo, M., and Dibari, C.: A multi-sensor remote sensing approach to monitor illegal charcoal production sites in Somalia’s forests, EGU General Assembly 2025, Vienna, Austria, 27 Apr–2 May 2025, EGU25-17735, https://doi.org/10.5194/egusphere-egu25-17735, 2025.

EGU25-17743 | ECS | Orals | ESSI4.11

Remote sensing applied to phenology monitoring in vineyards: testing through field observations 

Eduardo Jiménez-Jiménez, Guillermo Muñoz-Gómez, Beatriz Lara, Federico Fernández-González, and Rosa Pérez-Badia

In this paper we study the relationship between vegetative phenology obtained from satellite-derived vegetation indices (VIs) and vegetative and floral phenology based on field observations. The work was conducted during 2023 and 2024 in vineyards belonging to the Designation of Origin Uclés, located in the west of Cuenca province (Castilla-La Mancha region, central Spain). The field work was carried out in seven plots that are frequently ploughed and lack cover crops and green covers. All plots grow under similar conditions and the maximum distance between plots is less than 2 kilometers. Phenological sampling was carried out weekly on 20 grapevines per plot, using the BBCH scale.

Different VIs (NDVI, EVI, SAVI and SAVI2) were calculated using Google Earth Engine (GEE) and Sentinel-2 data, but EVI was selected due to its greater amplitude in the index curves. The R package Phenofit was used to clean the data, curve fitting and extraction of phenology metrics. For curve fitting, the Elmore method was used, and for phenology metrics extraction, the Threshold, Inflection and Gu methods from the Phenofit package were applied. Although Inflection and Gu differ in their approach, they both divide the curve into four phenological metrics: greenup, when index starts to growth; maturity, when the index value remains stable; senescence, when it decreases; and dormancy, when it stops decreasing and remains at a low value. Threshold considers only greenup and dormancy.

The results show that greenup is associated with the inflorescence development. This phase starts in a similar day of the year (DOY) in all plots and in the two studied years. Maturity, marked by Inflection and Gu methods, occurs between flowering and fruit development stages, that is, between DOY 140–198. The senescence period is marked between fruit development and leaf discoloration (178–310 DOY), and despite its amplitude, 75% of the observations place senescence between the final stages of the fruit and leaf discoloration. Finally, dormancy occurs between leaf discoloration and the leaf fall which is correct but usually it is marked excessively late.

Phenological metrics derived from Vegetation Indices (VIs) such as greenup (potentially related to inflorescence development), senescence (potentially related to leaf discoloration), and dormancy (potentially related to leaf discoloration and fall) can be linked to the grapevine cycle on the BBCH scale. However, more studies are needed to accurately link field phenological observations with satellite-derived vegetation indices.

This work has been funded by the Junta de Comunidades de Castilla-La Mancha (JCCM) through the project SBPLY/ 21-180501-000172 and by the University of Castilla-La Mancha (UCLM) through the project 2022-GRIN-34507. EJJ thanks to the Investigo Program for a contract co-financed by the European Social Fund Plus.

How to cite: Jiménez-Jiménez, E., Muñoz-Gómez, G., Lara, B., Fernández-González, F., and Pérez-Badia, R.: Remote sensing applied to phenology monitoring in vineyards: testing through field observations, EGU General Assembly 2025, Vienna, Austria, 27 Apr–2 May 2025, EGU25-17743, https://doi.org/10.5194/egusphere-egu25-17743, 2025.

EGU25-18129 | ECS | Orals | ESSI4.11

Temporal and Spatial Analysis of Critical Field Points Using High-Resolution Soil Water Content Estimation Employing Remote Sensing and Deep-Learning 

Mehdi Rafiei, Muhammad Rizwan Asif, Michael Nørremark, and Claus Aage Grøn Sørensen

This study presents a novel deep-learning approach for estimating Soil Water Content (SWC) with high spatial resolution across multiple soil depths. Additionally, the study identifies critical field points based on their drying-out times analyzed by SWC estimations over extended periods. Understanding potential critical points regarding SWC allows operators of heavy agricultural equipment to gain insight into the field's traits and prevent excessive soil compaction. Additionally, this information can support more strategic and efficient harvesting plans by accounting for the impact of varying drying patterns on crop growth and soil strength to not only minimize soil degradation but also maximize yield production, offering a more productive and sustainable crop production.

In this regard, our proposed method offers a practical approach to integrating diverse data types, including:

  • Spatial data: remote sensing data (Synthetic Aperture Radar (SAR) and vegetation index), land elevation, and soil profiles at various depths (soil content and bulk density).
  • Temporal data: historical weather information (precipitation, temperature, wind, and global radiation).
  • Contextual data: date, groundwater level, and crop type.

Previous machine learning and numerical models primarily used temporal and contextual data alongside point-based parameter values as inputs. In contrast, we incorporated spatial information instead of point values, allowing the model to capture better the surrounding influences—such as elevation, water flow, and vegetation shadows—on SWC.

To be able to estimate the SWC using the comprehensive analysis of spatial, temporal, and relevant contextual factors, these inputs are processed by a novel multi-model deep learning framework comprising:

  • U-Net to capture spatial features and the impacts of 2D image data.
  • Temporal Convolutional Network (TCN) to extract temporal dependencies from weather data.
  • Feed-Forward Network (FFN) to model the influence of contextual inputs.

Our model is trained and validated using ground truth data from site measurements in the HOBE dataset. These measurements are conducted at 30 locations within the Skjern River Catchment in Western Denmark, with each data sample containing SWC at different depths: surface, 20cm, and 50cm. By utilizing data collected between 2014 and 2018 from point 1.09 in the HOBE dataset, we demonstrated that the proposed model achieved a mean absolute error (MAE) of 0.0207. For comparison, a numerical model (Daisy) and a machine learning approach that did not account for spatial context produced higher MAEs of 0.0382 and 0.0269, respectively.

Subsequently, the developed model is employed to estimate SWC over extended periods and identify critical points within fields. To achieve this, we collaborated with several farmers who manually classified their field maps into regular, late-drying, and critical parts. The distinction between the latter two categories is crucial, as our observations revealed that "not every wet point is a critical point." The collected temporal SWC data is analyzed with land elevation to differentiate between these two classes. This aspect of the study remains under investigation, and further research is being conducted to refine the classification process and validate its effectiveness.

How to cite: Rafiei, M., Asif, M. R., Nørremark, M., and Sørensen, C. A. G.: Temporal and Spatial Analysis of Critical Field Points Using High-Resolution Soil Water Content Estimation Employing Remote Sensing and Deep-Learning, EGU General Assembly 2025, Vienna, Austria, 27 Apr–2 May 2025, EGU25-18129, https://doi.org/10.5194/egusphere-egu25-18129, 2025.

EGU25-18174 | ECS | Orals | ESSI4.11

Innovative Approaches to Carbon Stock Assessment in Agroecosystems: The Potential of TLS 

Martina Leoni, Maria Vincenza Chiriacò, Simona Castaldi, and Riccardo Valentini

The European Union’s Carbon Removal Certification Framework (CRCF) establishes robust quality standards and transparent monitoring, reporting, and verification (MRV) systems to ensure the credibility of carbon removal initiatives. Reliable MRV systems are critical for maintaining the environmental integrity of European carbon farming efforts and building stakeholder confidence in carbon accounting and reporting. Achieving these objectives requires the integration of innovative technologies with traditional methods to enhance accuracy and scalability carbon stock estimations.

Within this framework, growing attention is being directed toward methodologies for estimating carbon stocks across various pools in agroecosystems. While soil carbon estimation methods are well-established, the estimation of above-ground biomass (AGB) in agroforestry systems remains underexplored. Significant challenges in this domain include the difficulty of conducting destructive sampling in productive agricultural systems, the lack of species-specific allometric equations for woody crops, and the variability in tree structure introduced by pruning and other anthropogenic interventions.

This study applies terrestrial laser scanning (TLS) in a plum (Prunus domestica L.) orchard to address these challenges and perform non-destructive sampling of AGB for carbon stock assessment. The research employs quantitative structure modeling (QSM) to estimate tree volume and AGB with high precision, demonstrating TLS's ability to overcome limitations associated with destructive sampling, offering a scalable and repeatable approach for accurate biomass estimation in agroforestry systems. Furthermore, the study highlights the role of agroforestry in carbon sequestration efforts.

The findings highlight TLS as a valuable tool for improving the precision and reliability of carbon accounting in agroforestry systems. Its ability to provide accurate, non-destructive AGB estimates supports the effective implementation of the CRCF and advances the EU’s climate goals. Moreover, the scalability and adaptability of TLS make it a promising addition to MRV frameworks, offering stakeholders practical solutions for enhancing carbon removal initiatives.

How to cite: Leoni, M., Chiriacò, M. V., Castaldi, S., and Valentini, R.: Innovative Approaches to Carbon Stock Assessment in Agroecosystems: The Potential of TLS, EGU General Assembly 2025, Vienna, Austria, 27 Apr–2 May 2025, EGU25-18174, https://doi.org/10.5194/egusphere-egu25-18174, 2025.

EGU25-18417 | ECS | Orals | ESSI4.11

An Intercomparison of Two Satellite-Based Hyperspectral Imagery (PRISMA & EnMAP) for Agricultural Mapping: Potential of these sensors to produce hyperspectral time-series essential for tracking crop phenology and enhancing crop type mapping 

Mohamed Bourriz, Ahmed Laamrani, Ali El-Battay, Hicham Hajji, Nadir Elbouanani, Hamd Ait Abdelali, François Bourzeix, Abdelhakim Amazirh, and Abdelghani Chehbouni

In recent decades, space-borne hyperspectral sensors have demonstrated significant potential for agricultural monitoring by providing rich spectral information, improved feasibility, and cost-effectiveness compared to multispectral satellite imagery. In this study, we investigated the consistency of two hyperspectral satellite sensors, PRISMA and EnMAP, for agricultural mapping during the 2025 growing season in the Meknes region: one of the most fertile and productive areas for cereals and vegetables at the national level of Morocco. The primary objective was to conduct a comparative analysis of the two datasets and perform a binary classification (crop vs. no-crop) to support land use monitoring, inform decision-making, and enable advanced crop type mapping.

Our methodology included a correlation analysis of reflectance values across the visible to near-infrared (VNIR) and shortwave infrared (SWIR) ranges, as well as the evaluation of NDVI indices using two methods: band averaging and hyperspectral NDVI (hNDVI). Classification was performed using three machine learning algorithms—Support Vector Machine (SVM), Random Forest (RF), and CatBoost—based on 16 optimal hyperspectral narrow-bands (i.e., 427,  535, 567, 714, 775, 805, 839, 913, 977, 1175, 1246, 1295, 1717, 2077, 2191, 2343 nm) from PRISMA and EnMAP that best capture the variability of vegetation biophysical and biochemical characteristics.

Results demonstrated high Pearson correlation coefficients between the two sensors, with r=0.93 in the VNIR and r=0.91 in the SWIR ranges. NDVI comparison also showed strong consistency results, with correlations of r=0.84 using the hNDVI method and r=0.85 using band averaging. The utilization of optimal hyperspectral narrow-bands achieved superior classification accuracies of 99.95% with PRISMA and 99.65% with EnMAP, with SVM outperforming other algorithms, followed by RF and CatBoost. Moreover, an Explainable Artificial Intelligence (XAI) based analysis indicated that bands in the NIR and SWIR regions were the most critical features driving these high classification performances.

These findings highlight the consistency and complementarity of PRISMA and EnMAP for agricultural monitoring. They also demonstrate the potential of these sensors to produce hyperspectral time-series essential for tracking crop phenology and enhancing crop type mapping, thereby overcoming the constraints posed by limited revisit intervals in current imaging spectroscopy missions.

How to cite: Bourriz, M., Laamrani, A., El-Battay, A., Hajji, H., Elbouanani, N., Ait Abdelali, H., Bourzeix, F., Amazirh, A., and Chehbouni, A.: An Intercomparison of Two Satellite-Based Hyperspectral Imagery (PRISMA & EnMAP) for Agricultural Mapping: Potential of these sensors to produce hyperspectral time-series essential for tracking crop phenology and enhancing crop type mapping, EGU General Assembly 2025, Vienna, Austria, 27 Apr–2 May 2025, EGU25-18417, https://doi.org/10.5194/egusphere-egu25-18417, 2025.

EGU25-18748 | ECS | Posters on site | ESSI4.11

Species Distribution Models: Application to the Identification of Populations and Potential Distribution Areas of the Forage Plant Bituminaria bituminosa 

Javier San Martin Loren, Jesús Fernandez Habas, and Pilar Fernandez Rebollo

The species Bituminaria bituminosa (L.) C.H. STIRT has been studied over the past two decades to be integrated as a forage crop in agro-silvo-pastoral systems due to its nutritional qualities and low water requirements (<200 mm). These efforts have led to the development of new varieties using genotypes from the Canary Islands. These varieties are expected to be utilized in mixed or monoculture systems, leveraging their drought tolerance to extend the availability of high-quality feed, thus reducing costs during the forage shortages of the summer season. The ability of Bituminaria to fulfill this role in Mediterranean basin farms will largely depend on its adaptation to environmental conditions.

This study aims to explore the circum-Mediterranean distribution of Bituminaria using Species Distribution Models (SDMs) and 33,132 occurrences from the GBIF platform on natural populations of the species. Bioclimatic, edaphic, geomorphological, and satellite-derived variables were used in model development through the biomod2 package in R, achieving ensemble model metrics with a mean True Skill Statistic (TSS) of 0.78. Eight clusters have been proposed to group occurrences based on the most important variables identified in the ensemble model, which also aids in identifying isolated populations or localized scenarios that may serve as a foundation for breeding programs aimed at improving specific traits. These results will contribute to a deeper understanding of the ecology, phenotypic plasticity, population dynamics, movement patterns, and evolutionary processes within the genus Bituminaria.

How to cite: San Martin Loren, J., Fernandez Habas, J., and Fernandez Rebollo, P.: Species Distribution Models: Application to the Identification of Populations and Potential Distribution Areas of the Forage Plant Bituminaria bituminosa, EGU General Assembly 2025, Vienna, Austria, 27 Apr–2 May 2025, EGU25-18748, https://doi.org/10.5194/egusphere-egu25-18748, 2025.

Scalably sensing/estimating local information of environment, management, and crop at the field level is the first step of a System-of-Systemssolution to quantify field-level agroecosystem dynamics (Guan et al., Earth-Science Reviews, 2023). This sensing effort involves two major and inherently connected tasks: (1) ground truth collection, and (2) cross-scale sensing. Agricultural ground truth is scarce and expensive to collect, however, the need for ground truth data is non-negotiable and should be a major investment with public funding. We have developed cross-scale sensingapproaches to scale-up ground truthcollection to large scales. In this talk, we will review our recent progress in using "cross-scale sensing" to accurately estimate critical variables of agroecosystem dynamics, covering management practices (e.g. tillage practice, crop rotation, cover crop adoption, irrigation), environmental conditions (e.g. soil properties), and crop traits and conditions (e.g. LAI, Vmax, phtosynthesis, crop yield). We will also identify current challenges and future opportunities to further advance remote sensing for sustainable and precision agriculture. 

How to cite: Guan, K.: Recent progress in remote sensing for advancing sustainable and precision agriculture, EGU General Assembly 2025, Vienna, Austria, 27 Apr–2 May 2025, EGU25-19065, https://doi.org/10.5194/egusphere-egu25-19065, 2025.

EGU25-19406 | ECS | Posters on site | ESSI4.11

Assessment of Retention Basin Potential Using Active Remote Sensing 

Dávid Pásztor, Attila Nagy, Zsolt Fehér, and János Tamás

The increasing frequency of drought periods and the intensification of precipitation distribution extremes in Central Europe, particularly in eastern Hungary, pose significant challenges for water resource management. The Great Hungarian Plain (Alföld) experiences an annual precipitation deficit of 150–250 mm, exacerbating the adverse effects of drought. The Eastern Main Canal (Keleti-főcsatorna) plays a crucial role in water supply, transporting 300–400 million m³ of water annually as part of the Civaqua program. This initiative aims to channel water from the Tisza River to the Tócó stream, ensuring sustainable water supply for the region and maintaining critical water levels in local reservoirs, including the Vezér Street Retention Basin. The basin serves not only water retention and flood control purposes but also provides recreational opportunities for the local community.
This study aims to evaluate strategies for maximizing the capacity and efficiency of retention basins by optimizing the water supply from the Tisza River and the Eastern Main Canal, particularly during drought periods. Additionally, the research explores the potential of basin retention for the storage of precipitation and excess water within the basin and surrounding landscapes. Such retention solutions contribute to efficient water resource management, mitigating drought impacts and enhancing the long-term sustainability of water management practices.
The research employed active remote sensing technologies, including the Apache 3 unmanned surface vessel equipped with a monobeam sonar, providing depth measurement accuracy within 1% of the measured depth. For terrestrial surveys, the Stonex X120GO SLAM Laser Scanner was utilized, delivering millimeter-level precision in 3D mapping. The integration of these technologies enabled the development of detailed basin models, capturing both underwater and aboveground features of the retention basin. The primary focus was the Vezér Street Retention Basin, which serves flood control, water retention, and recreational functions in the Debrecen area.
The lowest point of the Vezér Street Retention Basin is at an elevation of 110.65 m above Baltic Sea level, while the highest point of the basin crown is 114.39 m, resulting in a maximum depth of 3.74 m. The basin’s total storage capacity, when fully saturated, is 39,213.59 m³, with a water surface area of 16,354.93 m². At the average water level of 113.69 m, the basin holds approximately 28,253.2 m³ of water, with a water surface area of 15,000.08 m². During the summer, under conditions of 20°C, average atmospheric pressure, and humidity, evaporation rates reach 3 mm/day/m², resulting in a daily water loss of 45,000.24 mm/day. The aquatic biodiversity of the basin is characterized by the presence of Typha species, which serve as critical ecological indicators.
The preliminary findings highlight that active remote sensing methods, such as sonar and the Stonex X120GO SLAM Laser Scanner, provide reliable tools for maximizing basin capacity and developing efficient water retention strategies.


The research presented in the article was carried out within the framework of the Széchenyi Plan Plus program with the support of the RRF 2.3.1 21 2022 00008 project.

How to cite: Pásztor, D., Nagy, A., Fehér, Z., and Tamás, J.: Assessment of Retention Basin Potential Using Active Remote Sensing, EGU General Assembly 2025, Vienna, Austria, 27 Apr–2 May 2025, EGU25-19406, https://doi.org/10.5194/egusphere-egu25-19406, 2025.

EGU25-19560 | ECS | Orals | ESSI4.11

Assessment of phenology of winter wheat using Sentinel 2 multispectral data for varying sowing dates  

Hitesh Upreti, Chinthamaneni Sriyodh, and Manoj Yadav

Wheat is one most widely grown and consumed crops globally. Region-wise, the north Indian plains are one of the largest producers of wheat in the world. However, there remains a substantial variation in the sowing dates and thus the phenology of wheat grown in the area owing to variation in cropping patterns, soil type and agricultural practices. In this study, field data including the extent of wheat crops along with their sowing and harvest dates were collected in the Gautam Buddha Nagar district of Uttar Pradesh, India during the 2022-23 crop season. The study region is then classified into croplands and further into wheat and non-wheat areas using the random forest classifier in the Google Earth Engine. On the basis of the sowing dates, the study region is divided into early sowing (sowing date before 10 November 2022) and late sowing (sowing date after 25 November 2022) areas. The phenology of the wheat agricultural fields is analyzed using the normalized difference vegetation index (NDVI) derived using the Sentinel 2 surface reflectance data product available in the Google Earth Engine. Results showed that the early sowing wheat has the largest period (6 to 7 weeks) in which canopy cover was near maximum. The same period for late sown wheat was found as 4 to 5 weeks for late sown wheat. In general, the peak vegetation density for the crop season decreased as the sowing time of the wheat was delayed. The average value of peak normalized difference red-edge index (NDRE) was found as 0.67 (in second week of February 2023) and 0.62 (in first week of March 2023) for the early and late sown wheat, respectively. The lengths of the crop seasons of the early and late sown wheat were found as 140 and 120 days, respectively. The findings of the present study can be extrapolated to understand the phenology as well as the yield patterns of the wheat in one largest wheat producing regions in the world.

How to cite: Upreti, H., Sriyodh, C., and Yadav, M.: Assessment of phenology of winter wheat using Sentinel 2 multispectral data for varying sowing dates , EGU General Assembly 2025, Vienna, Austria, 27 Apr–2 May 2025, EGU25-19560, https://doi.org/10.5194/egusphere-egu25-19560, 2025.

EGU25-19779 | ECS | Posters on site | ESSI4.11

Integrating Orthophotos and Field Data for Precision Vineyard Yield Prediction: A Case Study of Tempranillo Grapevines 

Maite Novellón, Sara Lacalle, Ana María Tarquis, and Pilar Baeza

Anticipating the response of grapevines to environmental variability is crucial for opti-mizing field management practices. This study explores the interaction between vines and their habitat across the growing cycle to inform more effective vineyard management. The research was conducted at the "Alhambra" plot in Ciudad Real (38.8089720, -3.0705830), which spans approximately 6 hectares of irrigated Tempranillo (Vitis vinifera L.) vines. Vine spacing is 3.05x1.54 m², and the training system is a double guyot pruned, vertical shoot positioning. The study utilizes data collected over 2024.


Within the plot, three replicates of 30 plants each were sampled. Measurements were taken from consecutive rows, 15 plants each. At the phenological stage of separated clus-ters, the number of clusters was recorded, while berry weight and the number of berries per cluster were assessed at veraison and harvest. Yield partitioning was determined at harvest. Additional parameters were also measured, including total soluble solids, surface area, pruning and shoot weight.


A custom script was developed to analyze the orthophotos of the vineyard to quantify the trellis length occupied by vines, excluding gaps where vines were missing. This method enables precise calculation of the vine-covered productive area. By combining these or-thophoto analyses with field-estimated yields per linear meter of vine, the study could provide accurate vineyard yield predictions. The accuracy and effectiveness of this inte-grated methodology are thoroughly evaluated.


Acknowledgements BigPrediData

How to cite: Novellón, M., Lacalle, S., Tarquis, A. M., and Baeza, P.: Integrating Orthophotos and Field Data for Precision Vineyard Yield Prediction: A Case Study of Tempranillo Grapevines, EGU General Assembly 2025, Vienna, Austria, 27 Apr–2 May 2025, EGU25-19779, https://doi.org/10.5194/egusphere-egu25-19779, 2025.

Andean communities in central Peru play a key role in the conservation of vicuñas (Vicugna vicugna), a protected species that depends on puna grass and flooded vegetation for food and access to water throughout the year. This study focuses on seven communities of Lucanas in Ayacucho, a dry mountainous region of Peru, emphasizing the need for accurate information to monitor resources in a context of climate change and support community decision-making. In this research, based on Google Earth Engine (GEE), we evaluated the performance of classification algorithms using Sentinel-1 (S1) and Sentinel-2 (S2) image data for rangelands classification. The process used ground-based and image-based points to train and validate the models, a filter to minimize spatial autocorrelation between training and validation sets; and spectral separability measurements using the Jeffries-Matusita (JM) distance, all of steps allowed an adequate discrimination and representation of the classes. Additionally, we used 64 feature variables (including vegetation, texture, topographic, snow, water, minerals, radar features) and applied Cloud Score+, quality assessment (QA) processor in S2 image collection, to improve classification accuracy. Random Forest (RF) algorithm achieved an overall accuracy (OA) of 92% and a Kappa coefficient of 0.908 outperforming the Support Vector Machine (SVM) algorithm, which obtained an OA of 90.9% and a Kappa coefficient of 0.895. The results show that, in the semi-captivity sectors, 1,777.5 hectares of puna grass and 319.1 hectares of flooded vegetation were identified, while in wild management areas 5,431.1 hectares of puna grass and 843.8 hectares of flooded vegetation were recorded. These findings highlight the importance of integrating remote sensing tools and machine learning algorithms to generate key information in the management of natural resources in communities.

How to cite: Ochoa, J., Juarez, H., Sotomayor, D., and De Haan, S.: Mapping Rangeland Vegetation Using Sentinel-1 and Sentinel-2 Imagery with Machine Learning: A Case Study of Vicuña Conservation in the Central Andes of Perú, EGU General Assembly 2025, Vienna, Austria, 27 Apr–2 May 2025, EGU25-21573, https://doi.org/10.5194/egusphere-egu25-21573, 2025.

EGU25-21604 | ECS | Orals | ESSI4.11

Leaf Area Index and Leaf Chlorophyll Content estimation from hyperspectral imaging using SCOPE model inversion 

Chiara Rivosecchi, Aya Amar, Paola A. Deligios, Eline Eeckhout, Matteo Francioni, Geert Haesaert, Luigi Ledda, Adriano Mancini, and Wouter H. Maes

Leaf Area Index (LAI) and Leaf Chlorophyll Content (LCC) are key vegetation indices for modeling energy and mass exchange between the atmosphere and land surfaces and can therefore be utilized for yield prediction. Consequently, suitable methods have been developed to retrieve LAI and LCC from remotely sensed data. Among these, the inversion of Radiative Transfer Models stands out as a promising approach, as it addresses the issue of limited transferability and minimizes the need for extensive field measurements also accounting for crop variability.

The objective of this study is to assess the applicability of the Soil Canopy Observation of Photochemistry and Energy Fluxes (SCOPE) model for estimating LAI and LCC of potato (Solanum tuberosum L.) using time series of hyperspectral images captured by an uncrewed aerial vehicle. A field experiment was conducted in Belgium from June to October 2024, involving two potato varieties, early and late, subjected to two nitrogen fertilization levels and six different biostimulants. Throughout the crop growth cycle, hyperspectral UAV images were captured biweekly using the Specim AFX10 camera. On the same days, in situ measurements of LAI and LCC were performed. LAI and LCC were estimated using a look-up table (LUT) approach based on the inversion of the SCOPE model. A cost function (norm2 distance) was employed to sort the LUT and identify a set of spectra that minimized the distance between measured reflectance and simulated reflectance in the LUT. The estimated LAI and LCC values were then compared with their corresponding in situ measurements.

Preliminary results indicate that simulated LAI and LCC showed potential for use in designing models to predict measured LAI and LCC (R2=0.26 and R2=0.30, respectively, p<0.001). In conclusion, simulated LAI and LCC correlated well with measured values for the late variety at the beginning of the crop cycle. Future work will focus on extending the analysis to cover the entire season, incorporating remote sensing observations into the parametrization of a crop growth model for yield predictions.

How to cite: Rivosecchi, C., Amar, A., Deligios, P. A., Eeckhout, E., Francioni, M., Haesaert, G., Ledda, L., Mancini, A., and Maes, W. H.: Leaf Area Index and Leaf Chlorophyll Content estimation from hyperspectral imaging using SCOPE model inversion, EGU General Assembly 2025, Vienna, Austria, 27 Apr–2 May 2025, EGU25-21604, https://doi.org/10.5194/egusphere-egu25-21604, 2025.

EGU25-21750 | ECS | Posters on site | ESSI4.11 | Highlight

PANGEOS COST action: Uncertainty propagation in remote sensing  

Egor Prikaziuk, Gary Llewellyn, Laura Mihai, Agnieszka Bialek, Andreas Hueni, Mike Werfeli, Jose Luis Gomez-Dans, Jochem Verrelst, Jose Luis Garcia-Soria, Joseph Fennell, Dessislava Ganeva, and Shawn Carlisle Kefauver


Pan-European Network of Green Deal Agriculture and Forestry Earth Observation Science (PANGEOS) funded by the European Cooperation in Science and Technology (COST) organisation brings together researchers to share their expertise and bring up a new generation of scientists. In October 2024 PANGEOS conducted an intensive 5-day summer school where more than 20 participants learnt how to propagate uncertainty of spectral measurements to uncertainty in higher-level products. The training material in the form of Python Jupyter notebooks is publicly available on GitHub https://github.com/pangeos-cost/uq-training.

This presentation is going to highlight the steps of uncertainty propagation from ground measurements through vegetation indices and retrieved plant traits towards higher-level model estimates, like gross primary productivity and evapotranspiration. All three pathways of retrieval uncertainty estimation, regression-based (vegetation indices), radiative transfer model-based and hybrid, are demonstrated. In addition, challenges of uncertainty propagation through satellite imagery are discussed in a separate block.

Finally, a highlight of current and future activities of the PANGEOS COST action will be given.

Acknowledgement

This abstract is supported by the EU COST (European Cooperation in Science and Technology) Action CA22136 “Pan-European Network of Green Deal Agriculture and Forestry Earth Observation Science” (PANGEOS).

How to cite: Prikaziuk, E., Llewellyn, G., Mihai, L., Bialek, A., Hueni, A., Werfeli, M., Gomez-Dans, J. L., Verrelst, J., Garcia-Soria, J. L., Fennell, J., Ganeva, D., and Kefauver, S. C.: PANGEOS COST action: Uncertainty propagation in remote sensing , EGU General Assembly 2025, Vienna, Austria, 27 Apr–2 May 2025, EGU25-21750, https://doi.org/10.5194/egusphere-egu25-21750, 2025.

EGU25-2144 | PICO | GM2.5

Mapping fractures in 3D from airborne LiDAR: comparison with field mapping 

Sara Carena and Anke Friedrich

We tested whether public high-resolution airborne LiDAR data could be suitable for structural geology applications by comparing fracture orientation measurements on Virtual Outcrop Models (VOMs) to field measurements from the same outcrops. We found that the fundamental requirement for taking full advantage of such data is good bedrock exposure, which is also dependent on lithology. Whenever this requirement is satisfied, VOM measurements are comparable to field measurements. VOMs can help considerably in both reducing the time it takes to collect measurements, and in expanding the area in which measurements can be collected without adding significantly to the time budget. They are also especially useful in remote regions and at high elevations, where access is more difficult and yet good exposures are more likely to be found, and they should always be used when planning field work. At present  the main limitations, apart from LiDAR coverage not yet existing in places, are due to the hardware and software capabilities needed to create and especially to analyze VOMs. 

How to cite: Carena, S. and Friedrich, A.: Mapping fractures in 3D from airborne LiDAR: comparison with field mapping, EGU General Assembly 2025, Vienna, Austria, 27 Apr–2 May 2025, EGU25-2144, https://doi.org/10.5194/egusphere-egu25-2144, 2025.

EGU25-2736 | PICO | GM2.5

Extraction and Orientation Analysis of Rock Mass Discontinuities Using UAV-Assisted Photogrammetry 

Xianquan Han, Ruoming Zhai, Yuewen Huang, and Bangning Ding

The stability of rock masses is crucial for the safety of hydraulic engineering, as the integrity of the rock mass directly influences the stability of structures such as dams, reservoirs, and tunnels. Accurate extraction and orientation of rock mass discontinuities plays a key role in stability analysis, providing essential geometric data for assessing rock mass behavior. However, traditional manual measurement methods used to extract these orientations are not only time-consuming and labor-intensive but also fraught with safety risks, especially when working on large and steep slopes. These limitations hinder the efficiency and accuracy of rock mass stability assessments.

To address these challenges, this paper proposes a novel approach for acquiring 3D rock mass scenes using unmanned aerial vehicles (UAVs), coupled with oblique photogrammetry technology for 3D scene reconstruction. With UAVs equipped with high-resolution cameras to capture image sequences from various angles, the Structure from Motion (SfM) algorithm is then applied to reconstruct the 3D scene. This method allows for the generation of high-precision point cloud data through geometric uniform sampling, ensuring accurate representation of rock mass. Once the 3D scene is reconstructed, local geometric features (including surface curvature, planarity, scattering, and verticality) are calculated based on neighborhood search. Combined with RGB texture information, machine learning method is employed to analyze the importance of these features, and further identify and differentiate rock mass features from vegetation and outliers within the large-scale slope scene, followed by a region-growing and merging algorithm for the segmentation of rock mass patches. For each individual patch, a local planar coordinate system is established to generate a grayscale image, which is then used for edge detection to identify structural boundaries. Following this, line extraction is carried out using an energy-optimization-based graph cut algorithm, and the closed contours of the structural patches are delineated through vectorization, ensuring an accurate and detailed mapping of the rock mass structure.

The effectiveness of the proposed method was validated through experiments conducted on a large-scale rock mass slope scene. The results demonstrate that the method can accurately extract the rock mass structural regions, identify the fracture network, and provide crucial geometric features, such as dip, strike, and trace information for each structural plane. The extracted features significantly contribute to evaluating the structural integrity and stability of large-scale slopes, offering a more efficient, accurate, and safer alternative to traditional manual measurement methods. Moreover, this method can be applied to a wide range of geological environments, providing a valuable tool for real-time monitoring and assessment in engineering projects.

How to cite: Han, X., Zhai, R., Huang, Y., and Ding, B.: Extraction and Orientation Analysis of Rock Mass Discontinuities Using UAV-Assisted Photogrammetry, EGU General Assembly 2025, Vienna, Austria, 27 Apr–2 May 2025, EGU25-2736, https://doi.org/10.5194/egusphere-egu25-2736, 2025.

EGU25-4331 | PICO | GM2.5

An Introduction to Fully Automated Co-Alignment - FACA 

Nick Schüßler, Jewgenij Torizin, Claudia Gunkel, Michael Fuchs, Karsten Schütze, Lars Tiepolt, and Dirk Kuhn

Well-aligned point cloud time series data generated with Unmanned Aerial Vehicles (UAVs) can be a significant asset to geoscientists.
Practitioners benefit from multi-temporal point clouds with high comparative accuracy, e.g. to evaluate landscape changes after landslides and quantify mass wasting.
Two approaches are usually applied to achieve the accurate alignment of point clouds: indirect and direct georeferencing.
Indirect georeferencing uses well distributed Ground Control Points (GCPs) in the study area.
While this method significantly enhances the precision and accuracy of time series point clouds, the placement and measurement of GCPs are time-intensive and may even be impossible in difficult terrain.
Direct georeferencing depends on highly precise and accurate location information embedded in images, which is often viable only with expensive real-time kinematic (RTK) positioning equipment or post-processed kinematic (PPK) services.
Beyond the extra cost, this approach faces the same challenges as indirect georeferencing, particularly in the placement of equipment and scalability for large areas.

Recent research has introduced an alternative method called Co-Alignment, which enables the alignment of point clouds with high local precision without GCPs and RTK data. Moreover, when GCPs or RTK are used, co-alignment can further enhance accuracy of the point cloud alignment.
This method aligns multiple point clouds with good local precision without requiring GCPs or RTK equipment, though it lacks global accuracy.
The workflow uses common, unchanged features in the study area, such as anthropogenic structures or boulders, to establish spatial references across multiple epochs using computer vision algorithms.

We developed FACA - Fully Automated Co-Alignment to implement the Co-Alignment workflow.
With FACA, we aim to offer easy access to a scalable point cloud alignment method.
FACA is automatable from the command line and user-friendly through a custom graphical user interface, making it adaptable to common point cloud generation workflows.
Released as open-source software under the GNU General Public License v3, FACA is freely accessible and modifiable to meet diverse user requirements.
By integrating with Agisoft Metashape Professional, FACA leverages advanced photogrammetric features to enhance performance and output quality.
We present the FACA workflow, emphasizing its ease of use, scalability, performance, supported by results from data acquired at Germany's Baltic Sea coast and in Svalbard.

Furthermore, we discuss the potential for custom software solutions to further improve and expand the workflow’s capabilities.

How to cite: Schüßler, N., Torizin, J., Gunkel, C., Fuchs, M., Schütze, K., Tiepolt, L., and Kuhn, D.: An Introduction to Fully Automated Co-Alignment - FACA, EGU General Assembly 2025, Vienna, Austria, 27 Apr–2 May 2025, EGU25-4331, https://doi.org/10.5194/egusphere-egu25-4331, 2025.

EGU25-5168 | PICO | GM2.5

Unlocking the potential of historical aerial and spy satellite stereo-imagery in geosciences: access, processing, and applications 

Livia Piermattei, Robert McNabb, Melanie Elias, Camillo Ressl, Amaury Dehecq, Luc Girod, Thomas Dewez, and Anette Eltner

Historical imagery captured from aeroplanes since the early 1900s and from spy satellites from the 1960s onwards have long been used in natural sciences for military, civil, and research purposes. These images have the unequalled potential for documenting and quantifying past environmental changes caused by natural and anthropogenic factors. Especially when acquired in stereo mode, these images enable the generation of point clouds and digital elevation models (DEMs), allowing us to quantify surface elevation changes over the past century.

Recent advancements in digital photogrammetry and the increasing availability of historical photographs as digitised/scanned images have heightened the interest in these data for reconstructing long-term surface evolution from local to regional scale. However, despite the large archive of historical images, their full potential is not yet widely exploited. Key challenges include accessibility, lack of metadata, image degradation, limited resolution and accuracy and lack of standardised workflows for generating DEMs and orthophotos.

We reviewed 198 journal articles published between 2001 and 2023 that processed historical aerial and spy satellite imagery. Our review spans methodological advancements in photogrammetric reconstruction and applied research analysing past 2D and 3D environmental changes across geoscience fields, such as geomorphology, cryosphere, volcanology, forestry, etc. We provide a comprehensive overview of these studies, summarise the image archives, applications, and products, and compare the methods used to process historical aerial and spy satellite imagery. Furthermore, we highlight emerging workflows and offer recommendations for image processing and accuracy assessment for future research and applications.

How to cite: Piermattei, L., McNabb, R., Elias, M., Ressl, C., Dehecq, A., Girod, L., Dewez, T., and Eltner, A.: Unlocking the potential of historical aerial and spy satellite stereo-imagery in geosciences: access, processing, and applications, EGU General Assembly 2025, Vienna, Austria, 27 Apr–2 May 2025, EGU25-5168, https://doi.org/10.5194/egusphere-egu25-5168, 2025.

The project's goal is to create a software tool for detecting and predicting a higher form of (rill) erosion on agricultural land. The planned tool's innovative potential is the use of neural networks on the joint remote sensing and erosion-hydrological modelling data. Morphological parameters and erosion-hydrological causal event response thus enhance common inputs for the neural network-driven semantic segmentation.

By combining morphological parameters, event-based hydrological responses, and a calculated critical water layer thickness (hcrit) from physical SMODERP model - the threshold at which rill erosion begins - the tool enhances the precision of high-risk area delineation, supporting smart agriculture and climate adaptation.

The project utilizes a unique dataset of manually digitized erosion rills from over 20 years of aerial orthophotos, enabling comprehensive training of neural networks. Multi-resolution data, including satellite imagery, aerial orthophotos, and UAV images, are combined to identify and refine morphological properties critical for rill erosion detection. Several types of neural networks were tested, notably FCN, U-Net, SegNet, DeepLabv3+, to evaluate their effectiveness in handling diverse input data and optimizing predictive accuracy. Automated workflows for dataset expansion and retraining ensure adaptability to new data.

Validation of the model will be performed using the original dataset of manually digitized erosion rills as a benchmark for accuracy. By comparing the predicted rill locations with this dataset, the model’s performance can be rigorously evaluated and adjusted. Real-time erosion event mapping, supported by the Agricultural Land Erosion Monitoring system, will complement this process by incorporating contemporary data to further enhance model reliability. This innovative tool addresses gaps in existing methods by combining predictive capabilities with detailed spatial data, improving erosion detection accuracy for sustainable land management under changing climatic conditions.

The research is funded by the Technological Agency of the Czech Republic research project (TQ03000408)- Detection of Increased Erosion Damage Using Neural Networks on a Combination of Remote Sensing Imagery and Erosion-Hydrological Modeling and an internal student CTU grant (SGS23/155/OHK1/3T/11).

How to cite: Tejkl, A., Kavka, P., Pesek, O., and Landa, M.: Detection of Increased Erosion Damage Using Neural Networks on a Combination of Remote Sensing Imagery and Erosion-Hydrological Modeling, EGU General Assembly 2025, Vienna, Austria, 27 Apr–2 May 2025, EGU25-5875, https://doi.org/10.5194/egusphere-egu25-5875, 2025.

EGU25-6611 | ECS | PICO | GM2.5

The use of computer vision to relocate historical aerial photographs that enhance the understanding of hydrogeomophic changes in Ethiopia 

Michiel De Baets, Lore Lamote, Jonathan Sterckx, Sofie Annys, Jan Nyssen, Hiep Luong, Tesfaalem Gebreyohannes, and Amaury Frankl

The digitisation of historical aerial photograph archives offers a unique opportunity to analyse long-term environmental changes. One such valuable resource is the archive of 1935-1941 aerial photographs of Ethiopia, one of the largest and oldest collections in Africa, comprising 34,000 images. While a portion of these images has been localized, many remain without known coordinates. To address this, we developed a computer vision approach that combines scale invariant feature transform (SIFT) keypoint matching and nearest-neighbour search, achieving 99% accuracy and 80% recall in matching images. This method increased the localization rate from 40% to approximately 70%, though manual verification and coordinate determination remain necessary. A proof-of-concept further demonstrated the potential of utilizing depth information to localize photographs: by leveraging the spatial proximity of images within the quite erratic flight lines, we significantly reduced the search area. Additionally, we show that 3D scene reconstruction from consecutive images, matched to a digital elevation model using the ICP algorithm, is feasible.

We demonstrate the potential of historical aerial archives for studying long-term environmental change through a case study on river geomorphology. At 70 locations where aerial photographs intersect major unconfined rivers, we analysed key hydrogeomorphological variables to assess river dynamics. By comparing river morphology in 1935-1941 with that on the most recent Google Earth imagery, our results reveal significant morphological changes, including channel widening, gullying, bank erosion, and in-stream sediment accumulation. These findings highlight how a detailed understanding of local river dynamics, derived from historical and modern imagery, can enhance the broader understanding of environmental changes and their impacts on catchment behaviour.

Key words: Aerial Photographs, Environmental Change, Hydrogeomorphology, Environmental Change, River

How to cite: De Baets, M., Lamote, L., Sterckx, J., Annys, S., Nyssen, J., Luong, H., Gebreyohannes, T., and Frankl, A.: The use of computer vision to relocate historical aerial photographs that enhance the understanding of hydrogeomophic changes in Ethiopia, EGU General Assembly 2025, Vienna, Austria, 27 Apr–2 May 2025, EGU25-6611, https://doi.org/10.5194/egusphere-egu25-6611, 2025.

EGU25-6774 | ECS | PICO | GM2.5

Historical photogrammetry for DoDs in deglaciating environments: challenges and opportunities 

Leona Repnik, Arnaud Breillad, Alessandro Giovanardi, Francesco Comiti, Mattia Gianini, Anne-Laure Argentin, Felix Pitscheider, and Stuart N. Lane

Climate change is resulting in rapidly increasing temperatures in the European Alps, rising twice as fast compared to the global average, and leading to unprecedented glacier retreat. Deglaciating alpine landscapes are considered extremely dynamic, evolving rapidly over space and time. The use of DEMs (Digital Elevation Models) of Difference (DoDs) to study changes occurring in these environments has significantly increased in the last years and has been used for a wide range of disciplines. This approach builds on the growing availability of datasets (e.g. historical imagery), accessibility of drones and their sensors (e.g. LiDAR) and facilitated use of digital photogrammetry through commercial and open-source Structure-from-Motion software. However, DoDs of deglaciating landscapes tend to disregard the diversity and complexity of processes in these environments. 

In this research, DEMs were obtained using aerial archival photogrammetry (1977) for the Turtmann basin, a rapidly deglaciating Alpine valley in the Canton of Valais (southwestern Switzerland. A 2021 DEM was used as a reference to create a DoD of the basin (28km2), in order to determine net sediment erosion and deposition during this 44-year time period. 

Most changes identified in the DoD could not be attributed to sediment displacement, but rather to various ecological (e.g. tree growth), glacial (e.g. glacier ice melt) and periglacial (e.g. rock glacier and buried ice melt) processes, as well as error in the photogrammetry. The latter is amplified by the inherently steep topography of alpine basins, which means that small georeferencing errors can cause significant apparent vertical change. A series of post-processing steps were required to obtain precise sediment volumes from the DoD. 

DoDs are extremely valuable for assessing changes in rapidly deglaciating environments. However, challenges exist when applying them to such topographically complex and dynamic landscapes. These challenges must be identified and thoroughly dealt with through DoD post-processing in order to exploit DoDs to their full potential and obtain precise volumes of change. The specific post-processing steps will depend on (1) the research objective, which determines the desired precision as compared to the limits of detection, and (2) the spatial and temporal scales of the DoD, which influence the detectability of changes. In this research, the large temporal (decades) and spatial (basin-wide) scales exposed the challenges and opportunities of using DoDs in rapidly deglaciating environments. The workflow developed to overcome these challenges can be applied to other alpine basins for more precise change detection and thus allow for a better quantitative understanding of processes in deglaciating environments. 

How to cite: Repnik, L., Breillad, A., Giovanardi, A., Comiti, F., Gianini, M., Argentin, A.-L., Pitscheider, F., and Lane, S. N.: Historical photogrammetry for DoDs in deglaciating environments: challenges and opportunities, EGU General Assembly 2025, Vienna, Austria, 27 Apr–2 May 2025, EGU25-6774, https://doi.org/10.5194/egusphere-egu25-6774, 2025.

EGU25-11270 | ECS | PICO | GM2.5

Landscape attractiveness – It depends on the observer 

Magdalena Koschmieder, Christina Pfeuffer, Sebastian Mikolka-Flöry, and Tobias Heckmann

Different people perceive landscapes in various ways depending on their cultural and social background as well as their own values. However, characteristics inherent in the landscapes also have an impact on their perceived beauty. Accordingly, it remains unclear to what extent personal assessments and landscape properties influence how much people appreciate landscapes. In this study, we had 50 test subjects evaluate alpine landscapes represented by 30 historic and recent rendered pictures each. Since the recent pictures should display the exact same part of the landscape as the historic ones, digital elevation models (DEMs) and orthophotos were used to render the current scene in the same greyscale range as in the historic photographs. Additionally, DEMs and landcover maps for the captured images were analysed. These results were used to explain the test subjects’ values of the appreciation of and desire to travel to the landscapes using linear mixed models.

The key finding is that perceived landscape attractiveness depends more on the people assessing the landscapes than the landscape characteristics themselves. The number of distance zones (surrounding, near, middle and far zone) present in the viewshed has a significant impact on the appreciation of the landscape. The maximum slope affects the desire to travel to the landscapes, and the relief energy, the viewshed size and the ratio of the recently glaciated area influence both the appreciation of and the desire to travel to the landscape. Furthermore, the historic photographs are perceived as more beautiful than the recent rendered ones. Taking into account the ratio of the glaciated area, this difference is even more pronounced for the desire to travel to the landscape. The bigger the difference in the glaciated area between the historic and recent image is – hence the more glacier has melted – the more the test subjects desire to travel to the scene shown in the historic picture than in the recent one.

How to cite: Koschmieder, M., Pfeuffer, C., Mikolka-Flöry, S., and Heckmann, T.: Landscape attractiveness – It depends on the observer, EGU General Assembly 2025, Vienna, Austria, 27 Apr–2 May 2025, EGU25-11270, https://doi.org/10.5194/egusphere-egu25-11270, 2025.

EGU25-12156 | ECS | PICO | GM2.5

Deep Learning-based Terrain Data Completion with Geomorphological Constraints 

Tianxin Lu and Michel Jaboyedoff

Raw terrain data acquired by sensing techniques such as SfM or LiDAR typically contain non-terrain components that require filtering, such as vegetation occlusion and other non-terrain features. While filtering helps remove non-terrain data, it can introduce discontinuities and local voids in the dataset. These data gaps can affect both the completeness of the terrain representation and subsequent analysis tasks. Therefore, it is crucial to develop effective terrain data completion methods for reliable terrain analysis.

Traditional terrain data completion methods, such as interpolation-based algorithms and Poisson surface reconstruction, typically model and optimize data continuity from a mathematical perspective. Although these methods address local voids to some extent, they generally fail to exploit terrain features and semantic information, limiting their effectiveness in completing complex terrain scenarios.

To address these issues, we propose a deep learning-based framework for terrain data completion. Our methodology explores different neural network designs with supervised and unsupervised learning, incorporating geomorphological constraints to improve terrain feature representation and semantic understanding. The framework leverages the representational capabilities of deep learning to improve the robustness of terrain data completion, contributing to a more consistent and reliable basis for subsequent terrain analysis and applications.

How to cite: Lu, T. and Jaboyedoff, M.: Deep Learning-based Terrain Data Completion with Geomorphological Constraints, EGU General Assembly 2025, Vienna, Austria, 27 Apr–2 May 2025, EGU25-12156, https://doi.org/10.5194/egusphere-egu25-12156, 2025.

EGU25-15301 | ECS | PICO | GM2.5

Multiple airborne sensors to monitor rafts and beached Sargassum in the Mexican Caribbean: Documenting different UAVs applications for management actions. 

Napoleon Gudino-Elizondo, Eduardo Cuevas, Abigail Uribe-Martinez, Hector Garcia-Nava, Xavier Flores-Vidal, and Orlando Avendaño-Gastelum

The assemblage of multiple sensors on Unmanned Aerial Systems (UAS) to collect high resolution geospatial data represents one of the most significant advances in remote sensing, including oceanographic applications. Coastal inundation of pelagic Sargassum has been thoroughly documented as a natural hazard that jeopardizes the ecological integrity of coastal ecosystems, unbalancing several livelihoods and local economies. Sargassum patches (rafts) are drifted offshore by surface ocean currents, with distinct drivers at different geographic and time scales. UAVs have revolutionized the immediate local remote sensing of Sargassum as they can identify rafts that are expected to reach the coast in terms of hours, becoming a strategic tool for rapidly management actions, bridging the on-site actions with high and medium resolution satellite detections. To obtain primary data on the extent, frequency, and magnitude of floating and beached Sargassum in the Mexican Caribbean, a rapid assessment protocol based on aerial photogrammetric techniques was implemented in the Yucatan Peninsula. We documented the arrival of sargassum rafts in the nearshore environment used to perform statistical comparisons with other remote sensing products. High resolution orthomosaics, DSMs, and 3D reality models were created to document the extent and quantity of beached Sargassum and the contiguous “brown tide” areas. Floating sargassum rafts were also identified in real time using long-range telemetry UAVs between 2 and 20 km offshore, that were consistent with field-based observations. Ocean circulation model outputs are also presented, which demonstrate that including UAV-mounted multi-sensors data acquisition is fundamental towards a comprehensive description and monitoring of the Sargassum coastal dynamics. These results strongly suggest that UAV-derived cartographic products represent an efficient tool for Sargassum-management actions, downscaling satellite detections and linking them with local observations, a strategy that needs to keep addressing as the future research agenda in Operational oceanography.

How to cite: Gudino-Elizondo, N., Cuevas, E., Uribe-Martinez, A., Garcia-Nava, H., Flores-Vidal, X., and Avendaño-Gastelum, O.: Multiple airborne sensors to monitor rafts and beached Sargassum in the Mexican Caribbean: Documenting different UAVs applications for management actions., EGU General Assembly 2025, Vienna, Austria, 27 Apr–2 May 2025, EGU25-15301, https://doi.org/10.5194/egusphere-egu25-15301, 2025.

EGU25-15820 | ECS | PICO | GM2.5

Constraining centennial to sub-annual sediment dynamics on alpine alluvial fans – first insights from the Friedergries (Germany) 

Philipp Gewalt, Thomas C. Wagner, and Michael Krautblatter

Alpine alluvial fans are important storages in the alpine sediment cascade. It is to be expected that climate change and the resulting changes in precipitation will have a massive impact on the dynamics of alpine alluvial fans. In order to differentiate between short-term and long-term dynamics, we compile a dataset quantifying sediment redistribution of a small mountain river and its alluvial fan on centennial, decadal and sub-annual scales. Our dataset comprises historical topographic maps from 1826 to 1912, 25 sets of historical aerial images collected between 1945 and 2024, and 17 high-resolution UAV-campaigns collected between September 2018 and October 2024. We identify the spatial changes in the sediment body, quantify the sediment redistribution and relate both to precipitation.

On centennial timescales, our data show a shift from presumably low geomorphic activity that persisted for at least 100 years (1820s-1930s) in the eastern sector of the fan, to high geomorphic activity with rapid channel migration across the central fan within the past 60 years. The onset of intense geomorphic activity may be contemporaneous to the increase in debris flow activity at nearby lake Plansee in the 1920s (Kiefer, Oswald et al., 2021). Decadal changes to the active area are largely explained by median precipitation (r2 = 0.66, p < 0.002) measured at a weather station c. 10 km east. Since the 1960s, incision at the apex and deposition at the toe of the fan can be observed. Sub-annual change detections show that for most epochs, erosion and deposition balance out within the uncertainty margin and the main channel gradually shifts its position by bank erosion and gravel bar construction. However, following an extreme deposition event between August and September 2019 with a net deposition of 8000 ± 3500 m3, the course of the main channel abruptly shifted. Our preliminary results show that while historical maps and aerial images are useful to reconstruct long-term trends, repeat topographic surveys with a close temporal spacing are needed to understand the processes behind these trends.

Kewords: alpine alluvial fan, sediment redistribution, geomorphic change detection, multiscale investigation

Kiefer, C., Oswald, P. Moernaut, J., Fabbri, S.C., Mayr, C., Strasser, M. & Krautblatter, M. (2021): A 4000-year debris flow record based on amphibious investigations of fan delta activity in Plansee (Austria, Eastern Alps). – Earth Surface Dynamics, 9: 1481–1503. DOI: 10.5194/esurf-9-1481-2021

How to cite: Gewalt, P., Wagner, T. C., and Krautblatter, M.: Constraining centennial to sub-annual sediment dynamics on alpine alluvial fans – first insights from the Friedergries (Germany), EGU General Assembly 2025, Vienna, Austria, 27 Apr–2 May 2025, EGU25-15820, https://doi.org/10.5194/egusphere-egu25-15820, 2025.

EGU25-16381 | PICO | GM2.5 | Highlight

A new high resolution historical aerial image dataset from East Greenland 

Anders Bjork, Anna Deichmann, and Tobias Socher

During the last decades the high Arctic has undergone substantial changes as a result of global warming and arctic amplification. Melt seasons are expanding rapidly, and landscape and ecosystems are shifting into new states. To quantify these changes from the historical baseline requires datasets on pre-warming states, which can be extremely rare in the high Arctic. Prior to the satellite era, starting in the 1990s, a commonly used data source for baselines in geosciences is aerial photographs, which if one is lucky can reach back to the 1930s. These aerial images are most often recorded at high elevation and perhaps also obliquely which results in spatial resolutions of 2-10 meters, limiting the level of detail that can be resolved on the ground.  

With this presentation we reveal a new exciting dataset of aerial images from East Greenland recorded in the 1950s and ‘60s. Contrary to other aerial campaigns, these images were recorded at very low elevation in order to conduct geological mapping, ultimately yielding spatial resolutions surpassing those of the newest high resolution satellites.

The images were recorded by geologist John Haller during the Lauge Koch expeditions to central East Greenland in the 1950s and 1960s, and comprise a dataset of c. 3600 high resolution oblique images recorded at low elevation from plane and helicopter. The images are recorded in stereo, which allows us to recreate the terrain surface in 3D and construct orthorectified imagery that allows a direct comparison with modern satellite images, for use in all aspects of landscape- and ecosystem evolution.

How to cite: Bjork, A., Deichmann, A., and Socher, T.: A new high resolution historical aerial image dataset from East Greenland, EGU General Assembly 2025, Vienna, Austria, 27 Apr–2 May 2025, EGU25-16381, https://doi.org/10.5194/egusphere-egu25-16381, 2025.

EGU25-17688 | ECS | PICO | GM2.5

Advances in Historical Aerial Image Analysis: Boosting SfM Pipelines with Learned Models 

Lucas Kugler, Francesco Ioli, Jan Dirk Wegner, Inés Dussaillant, Camilo Rada, and Livia Piermattei

Trend determination for earth surface processes requires long and continuous and certain measurements, but long-term records of landscape change are often limited in temporal and spatial extent. Scanned historical aerial imagery serve as a valuable resource to derive data products like digital elevation models (DEMs) to document the historical state of the Earth's surface and to calculate trends for different processes e.g. glacier dynamics.

Classic Structure-from-Motion (SfM) photogrammetry workflows have demonstrated the capability to automatically generate DEMs and orthoimage mosaics from such historical images, as highlighted in a few studies. These workflows typically consist of the following steps: (a) pre-processing, (b) tie-point extraction, (c) matching, (d) bundle adjustment, (e) dense reconstruction, (f) co-registration, and (g) orthoimage mosaic generation. However, classic methods struggle with the challenges historical imagery coming with. For example: inconsistent image quality, limited metadata documentation, image distortions and distinct viewpoint geometries.

Recently, advances in robotics and computer vision have introduced learned models for tasks such as tie-point identification, matching, dense reconstruction as well as part of the co-registration stage (e.g. SuperPoint, ALIKE, SuperGlue, LoFTR and more). These networks have shown promising results in different stereo-matching scenarios by outperforming classic SfM methods. However, since they were primarily developed for modern robotics and computer vision tasks, their performance on scanned historical aerial imagery remains uncertain. As historical imagery exhibits the properties described above, these networks were not optimised with them during training.

We boost existing pipelines in tie-point extraction and matching with these models and compare the quality of resulting DEMs from different model combinations together. We also highlight issues encountered when applying these learned models to historical aerial imagery and proposes solutions to address them. We demonstrate our findings using scanned historical images from the Southern Patagonian Ice Field (Chile) recorded in 1980, particularly for the Grey & Dickson Glacier area, as well the south-west flank of Cordon Mariano Moreno Mountain and adjacent fjords. These two sites providing different acquisition geometries and overlaps. The results evaluate the average RMS reprojection error following the bundle adjustment, to determine the quality of different extractors and matchers as well as the median distance between closest points to evaluate the co-registration.

How to cite: Kugler, L., Ioli, F., Wegner, J. D., Dussaillant, I., Rada, C., and Piermattei, L.: Advances in Historical Aerial Image Analysis: Boosting SfM Pipelines with Learned Models, EGU General Assembly 2025, Vienna, Austria, 27 Apr–2 May 2025, EGU25-17688, https://doi.org/10.5194/egusphere-egu25-17688, 2025.

Along many coastlines worldwide, a variety of direct and indirect anthropogenic influences are influencing natural processes of coastal erosion and deposition.  Both traditional change reconstruction and monitoring techniques (e.g. repeat surveys) and increasingly sophisticated approaches (e.g. photogrammetry, LiDAR, drone imagery) require specialist knowledge and equipment, can be time consuming to apply, and may be restricted to assessing relatively recent changes over short timeframes (e.g. typically years to a few decades).  Here, we evaluate the potential for archival visual sources - maps, paintings, geological sketches, and historical photographs – to help document changes in the coastal environment of Ceredigion County, west Wales, over the past 100-150 years.  Two extant sites of geoscientist interest, both located within 20 km of Aberystwyth, were investigated: Harp Rock (Craig y Delyn), which represents the westward-dipping limb of a synclinal fold, and Monk’s Cave (Twll Twrw), which has essentially now developed into a coastal arch.  Egg Rock (Tŵr Gweno), a coastal stack which was previously located near to Monk’s Cave but has since disappeared, was also investigated.  All three sites were well-known tourist attractions in the late 1800s and early 1900s, and various maps, paintings, sketches and photographs help to provide both qualitative and quantifiable insights into the nature of coastal change, including the sequencing, rates, and timing of key changes, as well as volumes of mass loss.  For example, Harp Rock is retreating landward as sandstone strata of ~37 cm thickness are removed by wave action and mass movement; for every 1 m2 of stratal loss, a mass of 858.4 kg is removed.  For Monk’s Cave, the average vertical erosion rate of the cave entrance is estimated to ~0.65 cm/yr over a timespan of 139 years.  Based on the last known photograph of Egg Rock (early 1900s), the total mass loss is approximated to be 197.70 t.  Collectively, the findings from these three sites provide insights into rates of Holocene shore platform development along this dynamic coastline.

Wider use of archival visual sources clearly has potential for complementing more technically sophisticated short-term change reconstruction and monitoring approaches.  Key challenges include sourcing well-dated, high-quality archival visual sources to enable establishment of robust timelines of change and the generation of quantitative data, and safely accessing potentially hazardous locations to enable new paintings, sketches, or photography.  If these challenges are surmounted, opportunities include enhanced potential for: i) providing quantified landscape change case studies for inclusion in school/university geoscience syllabi; ii) demonstrating the relevance of geoscience for local/regional natural and cultural heritage; and iii) enhancing public engagement with coastal geoscience (e.g. through citizen science projects or science-art collaborations).


How to cite: Goode, C. and Tooth, S.: Can archival visual sources be used to quantify coastal change?: insights from the dynamic coastline of Ceredigion, west Wales, EGU General Assembly 2025, Vienna, Austria, 27 Apr–2 May 2025, EGU25-18399, https://doi.org/10.5194/egusphere-egu25-18399, 2025.

EGU25-6148 | Posters on site | GI4.5

HALO airborne measurements; PERCUSION’s contribution to EarthCARE validation 

Silke Gross, Florian Ewald, Martin Wirth, André Ehrlich, Lutz Hirsch, Konstantin Krüger, Anna Luebke, Bernhard Mayer, Sophie Rosenburg, Lea Volkmer, Manfred Wendisch, Julia Windmiller, and Bjorn Stevens

In May 2024 the EarthCARE satellite mission EarthCARE was launched. For the first time, the satellite combines a high spectral resolution lidar and a cloud radar with doppler capability as key instruments on one single platform. In addition, it is equipped with a multi spectral imager and a broadband radiometer. This unique combination makes EarthCARE the most complex satellite mission to study aerosol, clouds, precipitation, and radiation. To fully use these new and advanced data for science applications, a careful validation of the measurements and data products is required. We have implemented an EarthCARE-like payload onboard the German research aircraft HALO (High Altitude and LOng range) to prepare and validate the EarthCARE data. This instrumentation was flown during PERCUSION (Persistent EarthCARE underflight studies of the ITCZ and organized convection) as a contribution to ORCESTRA (Organized Convection and EarthCARE Studies over the Tropical Atlantic).

ORCESTRA is a network of different campaigns conducted to better understand the organized tropical convection at the mesoscale, e.g. including the interaction of convective organization with tropical waves and air-sea interaction, and the impact of convective organization on the Earth’s climate and radiation budget. In addition, ORCESTRA helps to validate satellite remote sensing (especially EarthCARE). To achieve these objectives, ORCESTRA combines several sub-campaigns taking place on the Cape Verde Islands and Barbados in August and September 2024.

One of the campaigns within ORCESTRA is the PERCUSION campaign. PERCUSION aims to test factors hypothesized to influence the organization of deep maritime convection in the tropics and the influence of convective organization on its larger-scale environment. One focus of PERCUSION was to establish confidence in the EarthCARE measurements and products. For this purpose, we conducted one EarthCARE underpass within each research flight HALO measurements were performed during the EarthCARE commissioning phase in August 2024 out of Sal, Cape Verde, and out of Barbados in September 2024. In addition, we performed flights out of Oberpfaffenhofen, Germany in November 2024 for validation of conditions that could not be captured in the two first campaign parts. Altogether, 33 EarthCARE underpasses were carried out in different aerosol and cloud situations. Some of the flights were coordinated with in-situ measurements onboard other aircrafts (e.g. the French ATR42), with shipborne measurements onboard the German research vessel METEOR, or with ground-based radar and lidar measurements at Mindelo (Cape Verde), Barbados, and the ACTRIS stations Antikythera, Leipzig, Lindenberg and Munich. Four underpasses under NASA’s PACE mission were also performed.

In our presentation we will give an overview of ORCESTRA with the main focus on PERCUSION. We will present the HALO PERCUSION measurements and will show first comparisons of HALO lidar and radar and EarthCARE lidar and radar measurements.

How to cite: Gross, S., Ewald, F., Wirth, M., Ehrlich, A., Hirsch, L., Krüger, K., Luebke, A., Mayer, B., Rosenburg, S., Volkmer, L., Wendisch, M., Windmiller, J., and Stevens, B.: HALO airborne measurements; PERCUSION’s contribution to EarthCARE validation, EGU General Assembly 2025, Vienna, Austria, 27 Apr–2 May 2025, EGU25-6148, https://doi.org/10.5194/egusphere-egu25-6148, 2025.

EGU25-7050 | Orals | GI4.5

Spectroradiometric and Stray light characterization of the Pushbroom Imager for Cloud and Aerosol Research and Development (PICARD) Airborne Imager 

Alok Shrestha, Tom Ellis, Roseanne Domingues, Gary Hoffmann, Haiping Su, James Jacobson, Kerry Meyer, Julia Barsi, and Steven Platnick

The PICARD (Pushbroom Imager for Cloud and Aerosol Research and Development) instrument, developed by the NASA Ames Research Center in partnership with Brandywine Photonics, LLC, is an airborne imager consisting of dual Offner spectrometers and an all-reflective telescope with a 50° full field-of-view (FOV). The instrument operates over a wavelength range of 400 – 2400 nm in more than 200 bands. PICARD has already flown multiple engineering flights on NASA ER-2 high altitude aircraft, the most recent during 2023 Western Diversity Time Series (WDTS) spring campaign where near co-incident measurements with spaceborne sensors such as MODIS and VIIRS were obtained including those over railroad valley (RRV) calibration site.  In addition, PICARD has recently flown during the 2024 Plankton, Aerosol, Cloud, Ocean Ecosystem Postlaunch Airborne eXperiment (PACE-PAX) field campaign to gather data for the validation of the recently launched PACE mission. A recent analysis comparing PICARD measurements with RadCalNet dataset from RRV revealed excellent agreement for most of the bands except in the UV and blue region, where PICARD generally under reported. To better characterize these bands and improve this under reporting, detailed PICARD spectroradiometric characterization measurements were collected at Goddard Laser for Absolute Measurement of Radiance (GLAMR) laboratory at Goddard Space Flight Center (GSFC) in February 2024. The initial analysis of this characterization suggested that this under-report during flight is due to a stray light sensitivity inherent in the low signal-to-noise (SNR) bands of array spectroradiometers. Correcting for the GLAMR measured stray light reconciles the under report. In addition, poor SNR bands in SWIR atmospheric absorptions are recovered when corrected for stray light. In this presentation, we will share findings from our recent PICARD spectroradiometric characterization over GLAMR including updated results comparing PICARD flight radiances with RadCalNet at RRV.

How to cite: Shrestha, A., Ellis, T., Domingues, R., Hoffmann, G., Su, H., Jacobson, J., Meyer, K., Barsi, J., and Platnick, S.: Spectroradiometric and Stray light characterization of the Pushbroom Imager for Cloud and Aerosol Research and Development (PICARD) Airborne Imager, EGU General Assembly 2025, Vienna, Austria, 27 Apr–2 May 2025, EGU25-7050, https://doi.org/10.5194/egusphere-egu25-7050, 2025.

EGU25-7774 | Posters on site | GI4.5

In-Situ Hyperspectral Absorption and Backscattering Sensors for Ocean Color and Biogeochemistry Research 

Kirby Simon, Wayne Slade, Christopher Strait, Alberto Tonizzo, Michael Twardowski, Thomas Leeuw, Chuck Pottsmith, Ravi Chandrasiri, and Ole Mikkelsen

Accurate measurements of in-water inherent optical properties (IOPs) such as absorption and backscattering, along with coincident in-situ and satellite-measured radiometry, are key to refining and calibrating algorithms used by hyperspectral satellite missions such as NASA PACE to derive ocean color data products. The accuracy of hyperspectral ocean color products, such as phytoplankton community composition, is therefore linked to the accuracy of in-situ IOP measurements. However, current instrumentation for in-situ absorption and backscattering measurements has been limited to either single- or multi-spectral wavelengths or to hyperspectral wavelengths that do not entirely meet the wavelength range and resolution requirements of PACE and other hyperspectral remote sensing missions. Advancements in instrumentation are therefore necessary to expand the range, resolution, and sensitivity of in-situ absorption and backscattering measurements to support these missions and the development and distribution of accurate ocean color data products. Additionally, advancements in hyperspectral absorption and backscattering sensors can offer new insights into studying particulate and dissolved materials in the ocean in support of biogeochemistry research.

We have recently developed and commercialized submersible hyperspectral absorption (Hyper-a) and backscattering (Hyper-bb) instruments to meet the needs of current (e.g., PACE) and future (e.g., GLIMR, SBG) hyperspectral remote sensing missions. The Hyper-bb is a single-angle backscatter sensor that utilizes a broadband LED source, scanning linear variable filter assembly, and sensitive photomultiplier tube detector. The Hyper-a is an absorption sensor that utilizes a xenon flash lamp, dual spectrometers (signal and reference), and a pump-through Lambertian integrating cavity that reduces measurement uncertainty due to scattering errors characteristic in a reflective tube design. Both sensors are designed to enable user calibration, reducing cost and downtime typically associated with sending the instrument back for factory calibration.

We will present details related to the development of these two hyperspectral instruments as well as their engineering specifications and recent test results from laboratory studies and field work.

How to cite: Simon, K., Slade, W., Strait, C., Tonizzo, A., Twardowski, M., Leeuw, T., Pottsmith, C., Chandrasiri, R., and Mikkelsen, O.: In-Situ Hyperspectral Absorption and Backscattering Sensors for Ocean Color and Biogeochemistry Research, EGU General Assembly 2025, Vienna, Austria, 27 Apr–2 May 2025, EGU25-7774, https://doi.org/10.5194/egusphere-egu25-7774, 2025.

EGU25-7777 | Orals | GI4.5

Simultaneous aerosol and ocean retrievals from PACE multi-angle polarimeters: data products and validation 

Meng Gao, Kirk Knobelspiesse, Bryan Franz, Peng-wang Zhai, Kamal Aryal, Andrew Sayer, Amir Ibrahim, and Jeremy Werdell

The NASA Plankton, Aerosol, Cloud, ocean Ecosystem (PACE) mission, successfully launched on February 8, 2024, with aims to advance our understanding of global ocean ecology, biogeochemistry, atmospheric aerosols, and clouds. PACE features cutting-edge instruments, including the Ocean Color Instrument (OCI), a hyperspectral scanning radiometer, and two Multi-Angle Polarimeters (MAPs): the UMBC Hyper-Angular Rainbow Polarimeter (HARP2) and the SRON Spectro-Polarimeter for Planetary EXploration one (SPEXone). These instruments offer valuable data for simultaneous retrievals of aerosol, cloud, and surface properties.

This talk will focus on simultaneous aerosol and ocean retrievals derived from PACE MAP measurements, emphasizing data products, uncertainties, and validation. The retrieved products encompass aerosol properties such as complex refractive index, effective radius and variance, layer height, optical depth, and single-scattering albedo, as well as oceanic and surface properties. To streamline operational processing, we have incorporated deep neural network-based radiative transfer models into the PACE polarimetric retrieval algorithms via the FastMAPOL framework. Preliminary validation against in-situ measurements will be presented, along with potential applications of MAP data, including the study of ocean color bidirectional reflectance signals and multi-angle cloud masking.

How to cite: Gao, M., Knobelspiesse, K., Franz, B., Zhai, P., Aryal, K., Sayer, A., Ibrahim, A., and Werdell, J.: Simultaneous aerosol and ocean retrievals from PACE multi-angle polarimeters: data products and validation, EGU General Assembly 2025, Vienna, Austria, 27 Apr–2 May 2025, EGU25-7777, https://doi.org/10.5194/egusphere-egu25-7777, 2025.

EGU25-7979 | Posters on site | GI4.5

Heat-island-effect of ship-based bulk measurements for evaporation duct estimation 

Xiaofeng Zhao, Yuxing Wang, Pinglv Yang, Yibin Chen, and chunshan Wei

Because the evaporation duct profile is difficult to measure, different empirical surface layer models have been developed to compute the average refractivity profile near the ocean surface using four bulk measurements: pressure, temperature, humidity, wind speed at a single height (e.g., the ship’s bridge), and sea surface temperature (SST). Although these parameters can be conveniently measured using standard equipment, the measurement accuracy is usually influenced by inherent factors, such as the movement of the ship or the heat island effect. To analyze the heat island effect of ship-based bulk measurements for evaporation duct estimation, an open cruise observation over the Tropical Eastern Indian Ocean from 23 Aug 2024 to 14 Oct 2024 is used. The ship weather station measurements and the corresponding evaporation duct profiles, computed by the NPS evaporation duct model, are compared with 48 low-altitude rocketsonde profiles, which sample a high vertical resolution of air temperature, air humidity, air pressure, and wind parameters. The sensors for air temperature, humidity, pressure, and wind vector are deployed at 13.4 m above the mean sea level, and the SST is measured by an infrared thermometer. The results show that the mean air temperature and relative humidity of the ship measurements are 1.03 K and 4.07% higher than the rocketsonde measurements at the same altitude (i.e., 13.4 m), and the evaporation duct height and strength computed from the ship-based measurements are 1.98 m and 10.07 M-units lower than those from the rocketsonde measurements.

How to cite: Zhao, X., Wang, Y., Yang, P., Chen, Y., and Wei, C.: Heat-island-effect of ship-based bulk measurements for evaporation duct estimation, EGU General Assembly 2025, Vienna, Austria, 27 Apr–2 May 2025, EGU25-7979, https://doi.org/10.5194/egusphere-egu25-7979, 2025.

EGU25-8293 | Posters on site | GI4.5

Radiometric Calibration using Artificial Intelligence: Constituting Uniform Observing Systems for Infrared Satellites 

Boyang Chen, Aiqun Wu, Wen Hui, Peng Rao, Xuang Feng, Fansheng Chen, Changpei Han, Qichao Ying, Yapeng Wu, Miao Liu, Damian Moss, and Zhenxing Qian
Radiometric Calibration (RC) is a critical process in aerospace infrared remote sensing that establishes the relationship between the radiation energy of observed objects and the Digital Number (DN) output from sensors, which is fundamental for ensuring high-precision applications of infrared remote sensing data. At present, Source-Based RC (SBRC) is the predominant method, relying on a variety of Radiometric Sources (RS) including in-orbit blackbodies, or natural targets such as lakes, oceans. This approach, while effective, imposes constraints on remote sensing systems such as space & weight allocation for RS and additional observation time for RC. Moreover, the reliance on physical calibration sources can introduce uncertainties due to factors such as imperfect emissivity of in-orbit blackbodies, lack of data consistency due to varied RS types, and variations in environmental conditions. In this paper, we propose a novel RC method named Artificial Intelligence Radiometric Calibration (AIRC), which directly generates RC coefficients for the in-orbit remote sensing satellites using the physical and environmental parameters of the sensor. We first theoretically prove that RC coefficients can be derived as functions of the sensor states. Next, we propose our Neural Networks for infrared Radiometric Calibration (RCNN), to learn this relationship based on historical high-accuracy calibration data, enabling a shift from Reference Traceability (RT) to States Traceability (ST). Then, to verify the feasibility of the proposed scheme, we train and test an Multi-layered Perceptron (MLP) as a simple implementation of RCNN based on our long-term well-curated RC data from our FengYun-4A Avanced Geosynchronous Radiation Imager (FY-4A AGRI), and the experiments show that the proposed method achieves high-accuracy RC comparable with the official RC method applied on FY-4A AGRI that uses an in-orbit blackbody. Our study showcases how to conduct RC using the “reason (the states of sensor) - results (calibration coefficient)” logic, as supplement to the existing “result (observation to RS) - reason (calibration coefficient)” logic, which promotes constituting a uniform observing system for cross-platform infrared satellites.

How to cite: Chen, B., Wu, A., Hui, W., Rao, P., Feng, X., Chen, F., Han, C., Ying, Q., Wu, Y., Liu, M., Moss, D., and Qian, Z.: Radiometric Calibration using Artificial Intelligence: Constituting Uniform Observing Systems for Infrared Satellites, EGU General Assembly 2025, Vienna, Austria, 27 Apr–2 May 2025, EGU25-8293, https://doi.org/10.5194/egusphere-egu25-8293, 2025.

EGU25-8313 | Posters on site | GI4.5

Advanced cloud products from NASA’s PACE mission 

Bastiaan van Diedenhoven, Chamara Rajapakshe, Andrzej Wasilewski, Andrew Sayer, Brian Cairns, Otto Hasekamp, Kirk Knobelspiesse, Mikhail Alexandrov, Daniel Miller, Kenneth Sinclair, Brent McBride, and Vanderlei Martins

The sensitivities of cloud properties to changes in the climate and to anthropogenic aerosol emissions are crucial for understanding Earth’s climate but remain highly uncertain. Global cloud observations from satellites are needed to advance our knowledge on processes related to the formation and evolution of clouds and precipitation. While long term satellite data records of cloud microphysical properties exist, largely obtained by multi-spectral imagers, they are known to be substantially biased or failing in particular situations, such as in regions of broken and/or mixed-phase clouds. The cloud products provided by NASA’s Plankton, Aerosol, Cloud, ocean Ecosystem (PACE) mission, which was launched on 8 February 2024, have several advantages over past missions. PACE caries the Ocean Color Instrument (OCI), which is a multi-spectral imager, the Hyper-angular Rainbow Polarimeter (HARP-2) and the Spectropolarimeter for Planetary Exploration (SPEXone). Advanced, pixel-level cloud microphysical products are produced from the polarimeters, including cloud top phase and full droplet size distributions, while collocated retrievals are provided by OCI using more traditional methods. Instrument-synergy products include liquid water path and droplet number concentrations. We present first global advanced cloud products from PACE. We present validation using airborne campaigns that indicates that the polarimetry products are much less affected by the presence of broken and mixed-phase clouds than OCI observations, consistent with previous studies using simulations and observations. These observations provide new insights on the microphysical properties of global clouds, including their drop size distribution width and bi-modality which may be linked to precipitation formation. Furthermore, we show that the polarimeter retrievals along with OCI’s unique combination of three commonly-used shortwave infrared wavelength bands allows to assess some of the biases in traditional bi-spectral retrievals in unprecedented detail and on a global scale. We show that the biases in bi-spectral results depend on cloud structure and on the wavelength used for the droplet size retrievals. The PACE data provides crucial information to reduce biases in traditional bi-spectral cloud retrievals by essentially all multi-spectral imagers in the program of record that result from, e.g., sub-pixel cloudiness, mixed-phase cases and 3D radiative transfer effects. We make recommendations on how biases in bi-spectral results may be mitigated.

How to cite: van Diedenhoven, B., Rajapakshe, C., Wasilewski, A., Sayer, A., Cairns, B., Hasekamp, O., Knobelspiesse, K., Alexandrov, M., Miller, D., Sinclair, K., McBride, B., and Martins, V.: Advanced cloud products from NASA’s PACE mission, EGU General Assembly 2025, Vienna, Austria, 27 Apr–2 May 2025, EGU25-8313, https://doi.org/10.5194/egusphere-egu25-8313, 2025.

EGU25-9811 | Orals | GI4.5

ACROSS Mediterranean activities for EarthCARE validation and exploitation 

Eleni Marinou and the ACROSS team

The ESA-JAXA EarthCARE satellite mission, launched in May 2024, delivers vertical profiles of aerosols, clouds, and precipitation properties together with radiative fluxes, utilizing an instrumental suite of a high spectral resolution lidar (ATLID), a Doppler cloud radar (CPR), a multi-spectral imager (MSI), and a broadband radiometer (BBR). The simultaneous measurements will be utilized to improve our understanding of aerosol-cloud interactions (ACI) and their radiative effects and to assess the representation of clouds, precipitation, aerosols, radiative fluxes, and heating rates in weather and climate models [1]. Due to the multi-sensor complexity/diversity and the innovation of its standalone and synergistic products, the EarthCARE mission has several validation challenges and strong sub-orbital synergies are needed to address Cal/Val and science objectives.

The Mediterranean basin provides a complex aerosol-cloud environment for the exploitation EarthCARE's capabilities. For the validation of the EarthCARE products in the Mediterranean, the ACROSS validation activity will be implemented, which would increase synergies towards achieving the following objectives: (i) validate EarthCARE aerosol and cloud products using state-of-the-art ground-based and airborne facilities, (ii) implement science studies targeting radiative closures, ACI, and data assimilation experiments, (iii) and provide information for harmonizing and bridging past and future missions, to deliver Climate Data Records on aerosols and clouds.

The rationale for ACROSS is based on lessons learned from the JATAC campaign in the Atlantic [2]. Following the JATAC example, we target to implement 3 Intensive Observational Periods, including large-scale field experiments in the Mediterranean. The suborbital component follows the ASKOS [3] example. It includes (i) ACTRΙS Aerosol and Cloud remote sensing facilities and high-precision radiation measurements (Potenza site in Italy, Limassol Cyprus, as well as Pyrgos, Thessaloniki, and PANGEA sites in Greece), (ii) radiation measurements for closure studies, (iii) UAV and aircraft in-situ flights collocated with the remote sensing measurements. ACROSS activities will be clustered with the ARCHIMEDES experimental activities in the Mediterranean, foreseen between late 2026 and late 2027. ACROSS seeks synergies with airborne activities. To this end, the first synergistic measurements were collected during the PERCUSION campaign in November 2024, during which HALO underpass two EarthCARE tracks close to the Thessaloniki and PANGEA sites. More airborne activities are envisioned in the Mediterranean area for Spring/September 2025/2026.

ACROSS is a collaborative effort between NOA, DLR, the University of Nova Gorica, CyI, INOE, FMI, CNR-IMAA, PMOD, ERATOSTHENES CoE, CUT, and TROPOS. ACROSS is supported by ACTRIS RI and the dataset collected will support assimilation experiments and science activities in the framework of the PANGEA4CalVal, ATMO-ACCESS, and CERTAINTY EC projects and collaborations within.

References:

[1] Wehr T. et al., https://doi.org/10.5194/amt-16-3581-2023, 2023.

[2] Fehr, T., et al., https://doi.org/10.5194/egusphere-egu23-7249, 2023. 

[3] Marinou, E. Et al., https://doi.org/10.3390/environsciproc2023026200, 2023.

Acknowledgments: This research was financially supported by the PANGEA4CalVal project (Grant Agreement 101079201) funded by the European Union, and the CERTAINTY project (Grant Agreement 101137680) funded by the Horizon Europe program. Part of the wok was financed through the Core Program within the Romanian National Research Development and Innovation Plan 2022-2027, carried out with the support of MCID, project no. PN 23 05.

How to cite: Marinou, E. and the ACROSS team: ACROSS Mediterranean activities for EarthCARE validation and exploitation, EGU General Assembly 2025, Vienna, Austria, 27 Apr–2 May 2025, EGU25-9811, https://doi.org/10.5194/egusphere-egu25-9811, 2025.

EGU25-11760 | ECS | Orals | GI4.5

Aerosol Validation in NASA's PACE mission: Deployment of the SPEX Airborne Polarimeter in the PACE-PAX Field campaign 

Brecht Simon, Jasper Mens, Martijn Smit, Guangliang Fu, Jeroen Rietjens, Martin Grim, Tim Vonsée, Jelle Talsma, Rob Wolfs, Otto Hasekamp, and Bastiaan van Diedenhoven

The Plankton, Aerosol, Cloud, Ocean Ecosystem Postlaunch Airborne eXperiment (PACE-PAX) is a multi-platform, multi-instrument field campaign designed to validate NASA’s PACE mission. Two research aircraft participated in this month-long campaign: the CIRPAS Twin Otter, conducting in situ observations of aerosols and clouds, and NASA’s high-altitude research aircraft ER-2, equipped with remote sensing instruments. Among these instruments is SPEX airborne, an airborne proxy for the Dutch SPEXone instrument onboard PACE. SPEX airborne, like SPEXone, is a multi-angle spectropolarimeter for wavelengths between 400 and 780 nm, designed to characterize aerosols in the Earth’s atmosphere. It has nine viewing angles (nadir, ±14°, ±28°, ±42°, and ±56°) and an across-track swath of about 2.1 km at nadir at nominal ER-2 flight altitudes. SPEX airborne radiance and polarization data are formatted identically to SPEXone data, enabling the use of the same RemoTAP algorithm to retrieve aerosol properties such as aerosol optical depth, size distributions, refractive index, layer height, and composition. During multiple flights, totaling over 80 flight hours, the ER-2 frequently flew under PACE and ESA’s EarthCARE satellite, as well as over the Twin Otter, calibration sites, and aerosol ground stations, facilitating extensive data comparisons. In this presentation, we present preliminary validation of publicly released SPEX airborne level-1 data and collocate these with SPEXone observations. Additionally, we present validation of SPEX airborne aerosol retrievals against AERONET stations and other instruments deployed during PACE-PAX. The RemoTAP aerosol retrievals from SPEX airborne data emphasize the key role of PACE-PAX in confirming aerosol properties derived from SPEXone.

How to cite: Simon, B., Mens, J., Smit, M., Fu, G., Rietjens, J., Grim, M., Vonsée, T., Talsma, J., Wolfs, R., Hasekamp, O., and van Diedenhoven, B.: Aerosol Validation in NASA's PACE mission: Deployment of the SPEX Airborne Polarimeter in the PACE-PAX Field campaign, EGU General Assembly 2025, Vienna, Austria, 27 Apr–2 May 2025, EGU25-11760, https://doi.org/10.5194/egusphere-egu25-11760, 2025.

EGU25-12925 | ECS | Posters on site | GI4.5

From PACE to PLACE: Results from the First Months of Land Data Products 

Skye Caplan, Antonio Mannino, Morgaine McKibben, Fred Huemmrich, Kirk Knobelspiesse, Jeremy Werdell, Meng Gao, Otto Hasekamp, and Guangliang Fu

Although “land” is not included the acronym for NASA’s Plankton, Aerosol, Cloud, ocean Ecosystem (PACE) satellite, the mission is actively supporting terrestrial science. Two new global, daily product suites were recently released using land data from PACE’s Ocean Color Instrument (OCI). The first, termed SFREFL, is a hyperspectral collection of surface reflectances from the ultraviolet into the shortwave infrared. SFREFL currently employs L2gen for atmospheric correction, ensuring continuity with heritage missions processed by the Ocean Biology Processing Group. ISOFIT is also being considered for use as a standard surface reflectance algorithm. Both algorithms make PACE terrestrial data directly applicable to future hyperspectral missions like SBG, and ease collaboration with current missions producing similar products. The second suite, LANDVI, includes 10 vegetation indices: 6 multispectral (NDVI, EVI, NDWI, NDII, CCI, and NDSI) and 4 which are hyperspectral-enabled, or narrowband (PRI, Car, CIRE, and mARI). Narrowband indices leverage OCI’s unique capabilities to provide previously uncharacterized insights into the status of terrestrial ecosystems across the globe. Having been in production for several months, preliminary results from both SFREFL and LANDVI will be presented here. The integration of these terrestrial products as outputs from PACE positions the mission as pivotal for global environmental monitoring and establishes it as an important part of the terrestrial hyperspectral data record.

How to cite: Caplan, S., Mannino, A., McKibben, M., Huemmrich, F., Knobelspiesse, K., Werdell, J., Gao, M., Hasekamp, O., and Fu, G.: From PACE to PLACE: Results from the First Months of Land Data Products, EGU General Assembly 2025, Vienna, Austria, 27 Apr–2 May 2025, EGU25-12925, https://doi.org/10.5194/egusphere-egu25-12925, 2025.

EGU25-12978 | Orals | GI4.5

NASA’s PACE Mission Status Updates: Advancing Science and Data Products 

Amir Ibrahim, Jeremy Werdell, Ivona Cetinic, Bryan Franz, Brian Cairns, Susanne Craig, Otto Hasekamp, Antonio Mannino, Vanderlei Martin, Gerhard Meister, and Andrew Sayer

Following its launch from Kennedy Space Center in February 2024, NASA’s Plankton, Aerosol, Cloud, ocean Ecosystem (PACE) mission has been revolutionizing our understanding of Earth’s systems. The observatory hosts three cutting-edge instruments: the Ocean Color Instrument (OCI), a hyperspectral radiometer, and two multi-angular polarimeters, SpexOne and HARP2. Together, these instruments are collecting unprecedented data on our living oceans, atmospheric aerosols and clouds, and land.

PACE extends NASA’s legacy of over 20 years of global satellite observation while initiating an advanced suite of climate-relevant data records. For the first time, daily global measurements are enabling improved predictions of fisheries dynamics, the emergence of harmful algal blooms, and other critical factors impacting commercial and recreational industries. Furthermore, PACE provides key insights into cloud properties and aerosols—tiny airborne particles that influence air quality and regulate Earth's energy balance by absorbing and reflecting sunlight.

Since its launch, the PACE science team, in collaboration with the broader scientific community, has focused on implementing, testing, and validating mission data products. Performance assessments through the PACE Validation Science Team (PVST) and field campaigns, such as the Post-launch Airborne eXperiment (PACE-PAX), have been pivotal in refining data quality and enhancing the mission’s scientific outcomes.

This presentation provides an overview of the current status of PACE science products, highlighting key achievements, ongoing validation efforts, and future goals aimed at maximizing the mission’s contributions to Earth science.

How to cite: Ibrahim, A., Werdell, J., Cetinic, I., Franz, B., Cairns, B., Craig, S., Hasekamp, O., Mannino, A., Martin, V., Meister, G., and Sayer, A.: NASA’s PACE Mission Status Updates: Advancing Science and Data Products, EGU General Assembly 2025, Vienna, Austria, 27 Apr–2 May 2025, EGU25-12978, https://doi.org/10.5194/egusphere-egu25-12978, 2025.

EGU25-13069 | Posters on site | GI4.5

PACE Mission validation with the PACE-PAX field campaign 

Ivona Cetinic, Kirk Knobelspiesse, Brian Cairns, and Jeremy Werdell

NASA's Plankton, Aerosol, Clouds, and Ocean Ecosystems (PACE) Mission, launched a year ago, provides data on ocean color, aerosols, clouds, and land surfaces through its three advanced sensors. Some of these data products rely on established "heritage" algorithms, ensuring continuity with previous and ongoing missions, while others are novel, leveraging recent algorithmic advancements and PACE's unique measurement capabilities. To validate PACE's data products, the PACE Postlaunch Airborne eXperiment (PACE-PAX) was conducted in September 2024 in California. This campaign featured coordinated operations involving multiple aircraft, ocean vessels, and surface-based instruments, particularly timed with PACE satellite overpasses. Additionally, PACE-PAX supported similar activities for ESA's EarthCARE (Cloud, Aerosol, and Radiation Explorer) Mission. This presentation highlights the campaign's achievements, discusses the current status of the data, and outlines future plans for utilizing this valuable dataset.

How to cite: Cetinic, I., Knobelspiesse, K., Cairns, B., and Werdell, J.: PACE Mission validation with the PACE-PAX field campaign, EGU General Assembly 2025, Vienna, Austria, 27 Apr–2 May 2025, EGU25-13069, https://doi.org/10.5194/egusphere-egu25-13069, 2025.

EGU25-13336 | ECS | Posters on site | GI4.5

PACE Applications Program: Putting PACE remote sensing data to work for societal benefit across the Earth System  

S. Morgaine McKibben and Skye Caplan

Launched in February 2024 and serving data to the public as of April 2024, the NASA Plankton, Aerosol, Cloud, ocean Ecosystem (PACE) satellite provides a novel set of hyperspectral and polarimetric Earth observation (EO) capabilities across aquatic, terrestrial, and atmospheric domains-- an interdisciplinary span not matched by other EO missions. With these observations, PACE data can support multiple applications areas such as water resource management, public health and air quality, climate science, terrestrial and agricultural, post-disaster monitoring, and more. The PACE Applications Program has the primary goal of fostering and accelerating the translation of PACE’s advanced data into actionable applications that benefit society. To achieve this, we support bridging of researchers and applied end users through programming such as the PACE Community of Practice, Early Adopters Program, and information-sharing and co-production activities such as workshops and focus sessions. In this presentation we describe the interdisciplinary applications capabilities of PACE and opportunities for you to engage with our program.

How to cite: McKibben, S. M. and Caplan, S.: PACE Applications Program: Putting PACE remote sensing data to work for societal benefit across the Earth System , EGU General Assembly 2025, Vienna, Austria, 27 Apr–2 May 2025, EGU25-13336, https://doi.org/10.5194/egusphere-egu25-13336, 2025.

EGU25-14131 | Orals | GI4.5

First comparison between EarthCARE’s CPR and airborne W-band cloud radar observations during ECALOT campaign 

Paloma Borque, Cuong Nguyen, Zhipeng Qu, Pavlos Kollias, Bernat Puigdomenech, Keyvan Ranjbar, Kenny Bala, Natalia Bliankinshtein, Leonid Nichman, Sudesh Boodoo, and Norman Donaldson

Improving future climate predictions requires enhancing the current meteorological numerical models for which a better understanding of the roles that clouds and aerosols (and their interactions) play in Earth’s weather and climate is crucial.  Along these lines, the European Space Agency (ESA) and the Japan Aerospace Exploration Agency (JAXA) successfully launched the Earth Cloud, Aerosol, and Radiation Explorer (EarthCARE) satellite in May 2024. This satellite mission aims to advance the studies of global aerosol and cloud properties via novel active and passive spaceborne observations.  EarthCARE carries four instruments: the ATmospheric LIDar (ATLID), the Cloud Profiling Radar (CPR), the Multi-Spectral Imager (MSI), and the Broadband Radiometer (BBR).  Of particular interest to this work are the CPR observations providing significant observations of clouds’ vertical structure, including the first ever in-cloud Doppler Velocity profiles from space.

As part of ESA’s global calibration/validation initiative, the EarthCARE Commissioning Calibration/Validation Campaign in Ottawa (ECALOT) took place in Canada from October 2024 to January 2025.  ECALOT collected essential airborne and surface observations to calibrate and validate key EarthCARE products. These include CPR and ATLID Level 1 and Level 2 products, composite and synergy products, as well as EarthCARE’s scene construction algorithm and radiation products.  ECALOT successfully observed fall and winter weather conditions with dedicated flights targeted to sample relevant weather underflying the EarthCARE path.  The National Research Council Canada’s (NRC) Convair-580 aircraft, equipped with W- and X- band radars (NAWX), 355nm Lidars, and a full array of state-of-the-art in-situ cloud microphysics and aerosol probes, provided critical independent observations to support EarthCARE validation efforts.  These observations were complemented by surface-based sites deployed by Environment and Climate Change Canada and McGill University near Ottawa airport and two Climate Sentinels network stations operated by McGill University and Université du Québec à Montréal in the Montreal region.

In this presentation, we will provide an initial evaluation of EarthCARE’s CPR performance during the ECALOT campaign.  A comprehensive analysis of the cloud vertical structure as seen by the CPR and NAWX observations and an intercomparison of vertical cross sections of reflectivity and Doppler velocity will be presented.  In addition, an assessment of the behavior of CPR under stratiform and convective conditions will be provided.

How to cite: Borque, P., Nguyen, C., Qu, Z., Kollias, P., Puigdomenech, B., Ranjbar, K., Bala, K., Bliankinshtein, N., Nichman, L., Boodoo, S., and Donaldson, N.: First comparison between EarthCARE’s CPR and airborne W-band cloud radar observations during ECALOT campaign, EGU General Assembly 2025, Vienna, Austria, 27 Apr–2 May 2025, EGU25-14131, https://doi.org/10.5194/egusphere-egu25-14131, 2025.

EGU25-14414 | Posters on site | GI4.5

PACE Observatory validation plan, data sources, and results  

Inia M Soto Ramos, James Allen, Ivona Cetinić, Amir Ibrahim, Christopher W. Proctor, Kirk D. Knobelspiesse, and Jeremy Werdell

The success of Earth Science space-borne missions relies on the availability of optical field measurements, as well as a solid validation plan to assess and verify the in-orbit quality of the data products. Since the late 1990s, NASA’s SeaBASS has served the ocean color community as the primary repository for in situ radiometric and pigment observations, facilitating robust product validation across multiple missions. The PACE science data validation program is responsible for making sure data products meet mission-specified requirements and for assessing uncertainties across various water types, cloud conditions, and aerosol distributions. In addition to SeaBASS, the PACE validation plan includes 24 PACE Validation Science Teams and a targeted field campaign called PACE-PAX. Nonetheless, an ongoing challenge remains the limited number of matchups between in situ and satellite measurements due to cloud cover, data quality issues, and other constraints. Here, we discuss the limitations and challenges of ocean color validation and present the current PACE validation plan, data sources, and early validation results. 

How to cite: Soto Ramos, I. M., Allen, J., Cetinić, I., Ibrahim, A., Proctor, C. W., Knobelspiesse, K. D., and Werdell, J.: PACE Observatory validation plan, data sources, and results , EGU General Assembly 2025, Vienna, Austria, 27 Apr–2 May 2025, EGU25-14414, https://doi.org/10.5194/egusphere-egu25-14414, 2025.

EGU25-14437 | ECS | Posters on site | GI4.5

The First Year of the Hyper-Angular Rainbow Polarimeter (HARP2) on the NASA PACE mission: Performance, Science, and Synergy 

Brent McBride, J. Vanderlei Martins, Xiaoguang Xu, Anin Puthukkudy, Roberto Fernandez-Borda, Noah Sienkiewicz, Rachel Smith, Meng Gao, Bastiaan van Diedenhoven, Snorre Stamnes, Kirk Knobelspiesse, Andrew Sayer, Chamara Rajapakshe, Bryan Franz, Frederick Patt, Carissa Arillo, Brian Cairns, Jeremy Werdell, and Lorraine Remer

Over the past year, the Hyper-Angular Rainbow Polarimeter (HARP2) multi-angle imaging polarimeter instrument on the NASA Plankton Aerosol Cloud ocean Ecosystem (PACE) mission observed the entire Earth every two days. HARP2 measures total and polarized radiances over four spectral channels (440/550/670/870 nm), at up to 90 distinct viewing directions, and over a 114° field-of-view (1550 km cross-track swath). This large volume of daily information requires new approaches to on-orbit operations, data processing, calibration, and science. In this work, we celebrate and recap the first year of HARP2 on PACE – from pre-launch to on-orbit calibration (solar/lunar/vicarious), exciting new and synergistic science products for cloud, aerosol, and ocean properties, and co-located intercomparisons with OCI, SPEXone, and AirHARP2 underflights during the recent NASA PACE-PAX field campaign. We close with a look ahead to HARP2 as a pathfinder for upcoming polarimetry missions.

How to cite: McBride, B., Martins, J. V., Xu, X., Puthukkudy, A., Fernandez-Borda, R., Sienkiewicz, N., Smith, R., Gao, M., van Diedenhoven, B., Stamnes, S., Knobelspiesse, K., Sayer, A., Rajapakshe, C., Franz, B., Patt, F., Arillo, C., Cairns, B., Werdell, J., and Remer, L.: The First Year of the Hyper-Angular Rainbow Polarimeter (HARP2) on the NASA PACE mission: Performance, Science, and Synergy, EGU General Assembly 2025, Vienna, Austria, 27 Apr–2 May 2025, EGU25-14437, https://doi.org/10.5194/egusphere-egu25-14437, 2025.

EGU25-15557 | Posters on site | GI4.5

Validation of Aerosol Products from Polarimetric Sensors – Application to PARASOL and 3MI 

Bertrand Fougnie, Soheila Jafariserajehlou, and David Huerta Valcarce

With the launch of EPS-SG in 2025, a new era for a long-term operational Near-Real-Time provision of aerosol product is starting. If most of the potential for such a new remote sensing polarimetry has been demonstrated since 1996 with the 3 POLDER and PARASOL missions, the recent advance in term of retrieval but also analysis and exploitation of the data reveal more and more the potential. Indeed, polarimeters allow the observation of aerosols with a significantly improved information content which will feed the retrieval. On top of the aerosol optical thickness classically retrieved, an additional set of parameters characterizing the aerosol properties can now be derived. This specificity of polarimeters requires a more demanding effort in term of validation. We will overview the different aspects to be considered for the validation, describe the methodology for most of the parameters, and focus on some examples.   

How to cite: Fougnie, B., Jafariserajehlou, S., and Huerta Valcarce, D.: Validation of Aerosol Products from Polarimetric Sensors – Application to PARASOL and 3MI, EGU General Assembly 2025, Vienna, Austria, 27 Apr–2 May 2025, EGU25-15557, https://doi.org/10.5194/egusphere-egu25-15557, 2025.

EGU25-20586 | ECS | Orals | GI4.5

Liquid Water Cloud Retrievals from HARP2 and AirHARP2 Measurements from the PACE-PAX Validation Campaign 

Rachel Smith, Xiaoguang Xu, Brent McBride, and Vanderlei Martins

The Hyper Angular Rainbow Polarimeter 2 (HARP2), developed at UMBC, is a state-of-the-art wide field-of-view polarimeter capable of measuring total and polarized radiances with fine angular resolution (≥2 degrees) and high polarization accuracy in four spectral channels (440, 550, 670, 870 nm). HARP2 was successfully launched in February 2024 aboard NASA’s Plankton Aerosol Cloud and ocean Ecosystem (PACE) satellite and has since been collecting critical science data on Earth’s atmospheric, oceanic, and surface properties. In September 2024, UMBC’s AirHARP2, an advanced airborne polarimeter closely resembling the orbital HARP2, participated in the PACE Postlaunch Airborne eXperiment (PAX). This campaign provides a unique opportunity to validate radiometric and polarimetric measurements and derived science products from the PACE satellite by conducting direct cross-platform comparisons using co-located scenes. This study focuses on the retrieval comparisons of liquid water cloud microphysical properties from HARP2 and AirHARP2 during PACE-PAX using a novel look-up-table retrieval algorithm that leverages the geometric features of the polarized cloudbow to infer the cloud droplet size distribution. The retrievals will be performed using a novel look-up-table retrieval algorithm that uses the geometric parameters of the polarized cloudbow to retrieve the cloud droplet size distribution. With AirHARP2’s Level-1C grid resolution (~120 m) approximately 42 times finer than HARP2’s (~5 km), we will also examine the impact of spatial resolution on retrieval performance. The results will be further validated by cross-comparisons with official cloud products from the Ocean Color Instrument, the primary instrument aboard PACE.

How to cite: Smith, R., Xu, X., McBride, B., and Martins, V.: Liquid Water Cloud Retrievals from HARP2 and AirHARP2 Measurements from the PACE-PAX Validation Campaign, EGU General Assembly 2025, Vienna, Austria, 27 Apr–2 May 2025, EGU25-20586, https://doi.org/10.5194/egusphere-egu25-20586, 2025.

EGU25-20694 | Posters on site | GI4.5

System Vicarious Calibration of the PACE Ocean Color Instrument 

Robert Frouin, Jing Tan, Andrew Barnard, Alexander Bailess, Emmanuel Boss, Nils Haëntjens, Andrew Banks, Paul Chamberlain, and Matthew Mazloff

System vicarious calibration (SVC) of satellite ocean-color sensors involves comparing retrievals of water-leaving radiance (Lw) with in-situ measurements at the time of overpass and adjusting the calibration coefficients to ensure agreement between retrieved and measured quantities. This approach is designed to reduce uncertainties associated with purely radiometric calibration techniques, which lack the accuracy required for science applications, and to minimize biases introduced by atmospheric correction. For the recently launched PACE Ocean Color Instrument (OCI), the methodology utilizes hyperspectral Lw measurements from HyperNav radiometer systems deployed at various locations (Crete, Moorea, Puerto Rico, Hawaii) and from the Marine Optical Buoy (MOBY) near Lanai. Match-ups are rigorously selected based on criteria for atmospheric, surface, water, and geometry conditions. Top-of-atmosphere (TOA) radiance derived from onboard calibration techniques is compared to TOA radiance calculated from in-situ Lw measurements, resulting in calibration adjustment gains. The application of these adjusted gains to OCI imagery in diverse oceanic regions demonstrates more realistic values for water reflectance, enhancing the accuracy of retrieved ocean color data for scientific analyses.

How to cite: Frouin, R., Tan, J., Barnard, A., Bailess, A., Boss, E., Haëntjens, N., Banks, A., Chamberlain, P., and Mazloff, M.: System Vicarious Calibration of the PACE Ocean Color Instrument, EGU General Assembly 2025, Vienna, Austria, 27 Apr–2 May 2025, EGU25-20694, https://doi.org/10.5194/egusphere-egu25-20694, 2025.

Long-term, global ocean-color observations are needed for biogeochemistry and climate applications and require integration across multiple satellite sensors. This study proposes a methodology for cross-calibrating polar-orbiting ocean-color sensors using a geostationary reference sensor. The geostationary sensor serves as an intermediary, offering numerous coincidences in time and geometry with polar-orbiting sensors, particularly over oceanic regions where radiance levels are typical for ocean-color remote sensing. The methodology is applied to cross-calibrate current ocean-color sensors, including the recently launched OCI, using AHI, a sensor expected to remain stable over short cross-calibration intervals. Accuracy is evaluated based on radiometric noise, acquisition time differences, solar and viewing geometry variations, and spectral band mismatch uncertainties. Cross-calibration coefficients derived from suitable imagery provide a foundation for consistent, normalized calibration of polar-orbiting sensors, enabling the generation of reliable long-term ocean-color products from multiple satellites.

How to cite: Tan, J. and Frouin, R.: Cross-Calibration of Polar-Orbiting Satellite Ocean-Color Sensors Using a Geostationary Reference Sensor, EGU General Assembly 2025, Vienna, Austria, 27 Apr–2 May 2025, EGU25-20712, https://doi.org/10.5194/egusphere-egu25-20712, 2025.

EGU25-366 | Posters on site | CL4.13

Linking carbon cycling to climate feedbacks in a simple climate model for decarbonization 

Greta Shum, Abigail Swann, Dargan Frierson, and Charles Koven

Complex models of the Earth system are increasingly able to represent processes that make up the carbon-climate system, but a variety of simple climate models (SCMs) use parameterized representations of the Earth system, which make them easily deployed tools for climate mitigation assessment and accessible tools for conceptual understanding. However, SCMs vary in their approach to simplifying the Earth system, especially in their representation of the carbon cycle. We examine how two distinct carbon cycle structures within one SCM, FaIR, produce differing constrained projections of future climate under idealized decarbonization. We find that differences in carbon cycle structure lead to differences in the timescales of carbon uptake, which do not directly lead to or explain differences in warming under the same decarbonization emissions scenario. Differences in the metrics of warming are instead primarily explained by assumptions about climate feedbacks and non-carbon cycle forcing, which are parameterized separately from carbon cycling. When we introduce a physically-motivated link reflecting the connection between ocean circulation and energy balance, we see a change in the set of climate feedbacks necessary to explain our observed carbon-climate system. The result is a shift in TCRE, ZEC, and consequent necessary mitigation.

How to cite: Shum, G., Swann, A., Frierson, D., and Koven, C.: Linking carbon cycling to climate feedbacks in a simple climate model for decarbonization, EGU General Assembly 2025, Vienna, Austria, 27 Apr–2 May 2025, EGU25-366, https://doi.org/10.5194/egusphere-egu25-366, 2025.

EGU25-2921 | Orals | CL4.13

TCRE, ZEC and ocean heat uptake efficacy response to AMOC 

Anastasia Romanou

Remaining carbon budgets consistent with limiting global warming below certain temperature thresholds are estimated from the transient climate response to emissions (TCRE) and the zero emissions commitment (ZEC). TCRE is the amount of warming per unit of cumulative carbon dioxide emissions, while ZEC is the amount of warming that would occur following a complete cessation of emissions. IPCC AR 6 (Canadell et al, 2023, Chapter 5) concluded with medium confidence that TCRE is nearly constant with time and independent of the rate of emissions (or emissions pathway) and therefore it is a good predictor of CO2-induced warming after emissions reductions, although some studies (MacDougal 2017; Seshadri 2017) have pointed towards pathway dependence at very high and very low emissions rates. In all studies there is the implicit assumption that the cumulative fraction of carbon taken up by the terrestrial biosphere is constant, and that the climate feedback parameter and ocean heat uptake efficacy do not change in time. Using a suite of emissions-driven Earth system model simulations, we explore the impact of immediately halting CO2 emissions under different levels of global warming. We show that the climate system undergoes state shifts when AMOC weakens substantially due to forcing and/or internal variability, and only then significant cooling occurs following CO2 emissions cessation but with considerable consequences for regional climates.  We identify ranges of non-zero likelihood for AMOC collapse and the associated global warming levels, emissions thresholds and a possible mechanism linked to high latitude sea ice transport variability. We demonstrate that TCRE, ZEC and ocean heat uptake efficiency are state dependent and, while fast feedbacks control ZEC when mitigation occurs at lower emissions levels, AMOC weakening becomes the leading driver setting ZEC at higher emissions levels. Even the most ambitious mitigation of climate change would be ineffective if action is delayed and the climate system is too close to a tipping point of the Atlantic Meridional Overturning Circulation, since there would be significant differences in the committed warming. 

How to cite: Romanou, A.: TCRE, ZEC and ocean heat uptake efficacy response to AMOC, EGU General Assembly 2025, Vienna, Austria, 27 Apr–2 May 2025, EGU25-2921, https://doi.org/10.5194/egusphere-egu25-2921, 2025.

EGU25-8578 | ECS | Orals | CL4.13

Implications of permafrost carbon cycle feedbacks for TCRE: evidence from Earth system modeling 

Rémi Gaillard, Patricia Cadule, Philippe Peylin, Nicolas Vuichard, and Bertrand Guenet

TCRE – the linearity between global warming and cumulative anthropogenic CO2 emissions – underpins the concept of remaining carbon budgets and is critical for designing mitigation policies in line with the Paris Agreement. The future response of carbon sinks to anthropogenic perturbations is a major source of uncertainty in estimates of future TCRE. In particular, the strong Arctic warming is expected to lead to permafrost thaw, exposing the large amounts of soil organic carbon stored in permafrost to decomposition, and eventually releasing CO2 and CH4 to the atmosphere in a positive climate-carbon feedback. On the other hand, CO2 fertilisation and permafrost nitrogen release are likely to enhance vegetation carbon uptake by counteracting negative feedbacks. However, both the amplitude and the timing of the resulting future net carbon balance in permafrost regions remain highly uncertain. In particular, previous studies, using either land surface or intermediate complexity models, have shown no consensus on the strength of the nitrogen-mediated feedback. In addition, future TCRE estimates are based on (fully coupled) Earth system model (ESM) projections. However, only two ESMs in the CMIP6 ensemble represent permafrost carbon and the last IPCC assessment of TCRE used external estimates of permafrost carbon cycle feedbacks. The inclusion of permafrost carbon cycle processes in ESMs is therefore necessary to improve the reliability of future projections and inform policy decisions.

Based on the CMIP6 version of the Institut Pierre-Simon Laplace ESM, we developed IPSL-Perm-LandN, a new ESM that includes an explicit land nitrogen cycle and key permafrost physical and biogeochemical processes. Under future increasing atmospheric CO2 concentrations, the permafrost region remains a carbon sink in IPSL-Perm-LandN despite significant soil carbon losses due to permafrost thaw. In particular, we show a strong negative feedback arising from permafrost nitrogen release, which supports a large land carbon uptake and prevents the carbon-climate feedback parameter γ from increasing (negatively) by more than 10 PgC.°C-1. However, this is likely to be overestimated by our representation of soil nitrogen dynamics and plant nitrogen uptake. Our findings highlight the importance of better constraining the nitrogen cycle in permafrost regions and better representing permafrost carbon processes in ESMs to reduce the uncertainty in TCRE and remaining carbon budgets.

How to cite: Gaillard, R., Cadule, P., Peylin, P., Vuichard, N., and Guenet, B.: Implications of permafrost carbon cycle feedbacks for TCRE: evidence from Earth system modeling, EGU General Assembly 2025, Vienna, Austria, 27 Apr–2 May 2025, EGU25-8578, https://doi.org/10.5194/egusphere-egu25-8578, 2025.

EGU25-8653 | ECS | Posters on site | CL4.13

After 'Net Zero': Tracing uncertainties in the Zero Emissions Commitment signal 

Tabea Rahm, David Hohn, and Nadine Mengis

One of the defining challenges of our century is to limit global warming. Reducing anthropogenic carbon dioxide emissions to net zero has been understood to be a central measure in achieving this climate goal. Still, after achieving net zero CO2 emissions, the climate system could show a delayed temperature response. This temperature response is called Zero Emissions Commitment (ZEC) and has been estimated to be approximately 0±0.3 K in the ZECMIP multi-model mean (Jones et al., 2019; MacDougall et al., 2020). Understanding and constraining ZEC remains relevant, especially when considering the remaining carbon budget for reaching ambitious climate targets. However, individual climate models show a high level of uncertainty in the ZEC response.

ZEC is closely related to the carbon cycle, the planetary heat uptake and their respective distance to their equilibrium states at the point of net zero. Therefore, we investigate how the pre-industrial state and responsiveness of these processes to anthropogenic climate change relate to their ZEC response in Earth system models simulating the ZECMIP experiments. We aim to characterise the models' ZEC response as a function of the chosen, observable climate variables (e.g., overturning strength at 26° N, global carbon project (Friedlingstein et al., 2023) carbon fluxes, or ocean heat content of the upper 700 m), that will then later serve as basis for observationally constrained ZEC estimates. We will show first preliminary results and invite feedback on the study design.


References

Friedlingstein, P. et al. (2023). “Global Carbon Budget 2023” Earth System Science Data 15 (12): 5301–69. https://doi.org/10.5194/essd-15-5301-2023.

Jones, C.D. et al. (2019). “The Zero Emissions Commitment Model Intercomparison Project (ZECMIP) Contribution to C4MIP: Quantifying Committed Climate Changes Following Zero Carbon Emissions” Geoscientific Model Development 12 (10): 4375–85. https://doi.org/10.5194/gmd-12-4375-2019.

MacDougall, A.H. et al. (2020). “Is There Warming in the Pipeline? A Multi-Model Analysis of the Zero Emissions Commitment from CO2Biogeosciences 17 (11): 2987–3016. https://doi.org/10.5194/bg-17-2987-2020.

How to cite: Rahm, T., Hohn, D., and Mengis, N.: After 'Net Zero': Tracing uncertainties in the Zero Emissions Commitment signal, EGU General Assembly 2025, Vienna, Austria, 27 Apr–2 May 2025, EGU25-8653, https://doi.org/10.5194/egusphere-egu25-8653, 2025.

Simple models have been used in a variety of ways to summarize Earth system processes related to global warming and its mitigation. This poster will provide a pedagogical survey of the many uses to which these models have been put, focusing especially their role in understanding the regime of prolonged low carbon dioxide (CO2) emissions following emissions peak and decline.  We will show that the low emissions regime is exactly where path independence between global warming and cumulative CO2 emission breaks down, giving rise to the possibility of a substantial zero emissions commitment (ZEC). Using a few different simple models, the factors affecting the ZEC in low emissions scenarios and its relation to path dependence will be described, and we will furthermore examine the observability of respective model parameters affecting the magnitude of ZEC.     

How to cite: Seshadri, A. K.: The role of simple models in understanding the low CO2 emissions regime and the ZEC, EGU General Assembly 2025, Vienna, Austria, 27 Apr–2 May 2025, EGU25-10543, https://doi.org/10.5194/egusphere-egu25-10543, 2025.

EGU25-10573 | ECS | Posters on site | CL4.13

Understanding the mechanisms driving the ocean’s anthropogenic carbon reservoir under changing emissions 

Hwa-Jin Choi, Bo Liu, and Tatiana Ilyina

Understanding the mechanisms governing the evolution of the ocean’s anthropogenic carbon reservoir is critical for assessing its role in the global carbon cycle and susceptibility of the ocean carbon sink to climate change. Anthropogenic carbon, primarily from fossil fuel burning, interacts with and alters the natural carbon cycle, increasing the vulnerability of surface waters to natural carbon leaks. To address these dynamics, we quantify the mechanisms affecting oceanic anthropogenic carbon, including ocean circulation, biological production, and carbonate chemistry, using the Max Planck Institute Earth System Model. By disentangling the multi-factors through separating the evolutions of natural carbon—pre-industrial oceanic carbon pools—and anthropogenic carbon, we aim to develop a clearer and more comprehensive understanding of the ocean carbon cycle. Utilizing idealized emissions-driven simulations, we assess the sensitivity of the ocean carbon sink under varying emission pathways, such as increasing and decreasing CO2 emissions. This mechanistic understanding is crucial to understanding the vulnerability of the ocean carbon sink and monitoring the carbon budget. By linking these insights to the Transient Climate Response to cumulative CO2 Emissions (TCRE), this study contributes to a framework for evaluating carbon cycle feedback under diverse emission pathways.

How to cite: Choi, H.-J., Liu, B., and Ilyina, T.: Understanding the mechanisms driving the ocean’s anthropogenic carbon reservoir under changing emissions, EGU General Assembly 2025, Vienna, Austria, 27 Apr–2 May 2025, EGU25-10573, https://doi.org/10.5194/egusphere-egu25-10573, 2025.

EGU25-11301 | ECS | Orals | CL4.13

The reforestation-TCRE: A metric to quantify the effect of reforestation on global temperature 

Alexander MacIsaac, Kirsten Zickfeld, Damon Matthews, and Andrew MacDougall

With a well-studied potential to remove CO2 from the atmosphere, reforestation is a CO2 removal intervention common to net-zero CO2 pathways, policies, and the voluntary CO2 offset market. However, the relationship between a reforestation-based CO2 removal and temperature change is complicated by the biogeophsyical effects of reforestation on temperature, which have a demonstrated uncertainty across climate models. Furthermore, reforestation is a land-based intervention occurring in specific geographic locations and the relationship between reforestation within a specific locality and global temperature change is not well-defined.

Here we address these concerns by asking whether the TCRE framework - the fundamental metric relating anthropogenic CO2 emissions to global temperature change - and its regional variant can be applied to measure the effect of reforestation-based CO2 removal on global temperature. We conduct idealized net-zero CO2 simulations in a climate model of intermediate complexity (the UVic ESCM) to quantify the reforestation-TCRE across large-scales of reforestation. We measure reforestation-based CO2 removals by assessing both the change in above-ground and the change in above and below-ground CO2 in reforested areas as compared to a counter-factual simulation without reforestation. We further isolate the biogeophyical effects of reforestation to constrain the reforestation-TCRE to only the carbon-effects of reforestation. We expect our results to show that the reforestation-TCRE is not equal and opposite to the TCRE, which is accountable to the biogephsical effects of reforestation and asymmetries between the climate effects of a reforestation-based CO2 removal and an anthropogenic CO2 emission. Despite the short-coming, we expect our results to provide a metric for calculating a direct relationship between reforestation-based CO2 removal and global temperature change that is relatable to net-zero frameworks and potentially reproducible across climate models.

How to cite: MacIsaac, A., Zickfeld, K., Matthews, D., and MacDougall, A.: The reforestation-TCRE: A metric to quantify the effect of reforestation on global temperature, EGU General Assembly 2025, Vienna, Austria, 27 Apr–2 May 2025, EGU25-11301, https://doi.org/10.5194/egusphere-egu25-11301, 2025.

EGU25-12149 | ECS | Orals | CL4.13

Knowing what we know now: predicting ZEC with observables in a simple climate model 

Sofia Palazzo Corner, Joeri Rogelj, Zebedee Nicholls, Chris Jones, and Chris Smith

The Zero Emissions Commitment (ZEC) is understood to be the result of two evolving processes in the time after net zero: cooling due to carbon uptake by the land and ocean, and warming due to decreasing heat uptake by the ocean. The balance between these warming and cooling effects is what determines whether we can expect additional global temperature change after emissions stop, or whether zero emissions marks the point of temperature stabilisation. But are there observables prior to net zero that can predict which way this balance will fall?

Using the simple climate model MAGICC, we find ZEC to be a function of a handful of variables in the years leading up to net zero: global surface temperature, carbon uptake, ocean heat uptake and effective radiative forcing. This simple regression performs well for predicting additional global temperature change 50 years after net zero, with reasonable predictability 100, 200 and 1000 years after emissions stop. We find that higher warming at net zero increases the probability of a positive ZEC. We test the predictability of this model in FAIR, and assess the agreement with ESM and EMIC results from ZECMIP. We investigate the potential for constraining ZEC using this model and observables available today.

How to cite: Palazzo Corner, S., Rogelj, J., Nicholls, Z., Jones, C., and Smith, C.: Knowing what we know now: predicting ZEC with observables in a simple climate model, EGU General Assembly 2025, Vienna, Austria, 27 Apr–2 May 2025, EGU25-12149, https://doi.org/10.5194/egusphere-egu25-12149, 2025.

EGU25-12981 | Posters on site | CL4.13

Toward an observational constraints on the Transient Climate Response to Cumulative Emission 

Roland Séférian, Aurélien Ribes, and Saïd Qasmi

The relationship between CO2-induced warming and global mean temperature, known as the Transient Climate Response (TCR) to cumulative CO2 emissions (TCRE), is anemergent property of the Earth system. It allows to derive allowable CO2 emissions, or carbon budget, for a given anthropogenic warming threshold, such as the Paris Agreement warming target. The assessment of the TCRE in IPCC AR6 makes use of the theoretical framework as proposed by Jones and Friedlingstein (2020), which separate TCRE in two major drivers: the Transient Climate Response (TCR) and the airborne fraction (AF) of anthropogenic CO2 emissions. While published works have allowed to account for a constrained TCR range in the assessment of the TCRE, estimated of AF results only from unconstrained multi-model outputs.

The present work applies a novel methodology based on Bayesian statistics to integrate multiple lines of historical evidences to constrain future AF. Bayesinas statistics allows to exploits the time-varying relationship between the total anthropogenic emissions of CO2 and AF over the historical period and propagate this relationship in the future to constrain the AF range at CO2 doubling. The narrower very likely range for AF at CO2 doubling 41-59% (50% as Best estimates) results in a constrained very likely range for the TCRE, 1-2.1 K EgC-1 (1.5 as Best estimates). This constrained range is about 20% smaller than the latest assessed range for the TCRE and shines light on how novel observations and monitoring of anthropogenic emissions and airborne fraction of CO2 could results in even stronger constrain on TCRE estimates in the near future.

How to cite: Séférian, R., Ribes, A., and Qasmi, S.: Toward an observational constraints on the Transient Climate Response to Cumulative Emission, EGU General Assembly 2025, Vienna, Austria, 27 Apr–2 May 2025, EGU25-12981, https://doi.org/10.5194/egusphere-egu25-12981, 2025.

EGU25-13389 | Orals | CL4.13

Effect of land carbon accounting methods on the climate response to cumulative CO2 emissions 

H. Damon Matthews, Kirsten Zickfeld, Alexander MacIsaac, and Mitchell Dickau

The proportionality between global temperature change and cumulative CO2 emissions underpins our understanding of how climate will respond to future emissions, and what level of emissions reductions will be needed to stabilize global temperatures. Typically, fossil fuel and land-use CO2 emissions are treated as equivalent drivers of this global temperature response, and emissions reductions from both sources are assumed to contribute similarly to mitigation targets. However, measuring land-use CO2 emissions in the real world is complicated by the difficulty in separating direct emissions (those caused by deforestation and other human land-use activities) from indirect carbon fluxes caused by CO2 fertilization and other land carbon responses to changing climate conditions. Consequently, an emission (or removal) of CO2 from land use activities as measured and reported in national emissions inventories is not equivalent to a land-use emission as defined in modelling studies that have been used to quantify the climate response to cumulative fossil fuel and land-use CO2 emissions. Here we assess the impact of these different land carbon accounting conventions on two key metrics of the climate response to cumulative CO2 emissions: the Transient Climate Response to cumulative CO2 Emissions (TCRE) and the Zero Emissions Commitment (ZEC). Using a spatially-explicit intermediate complexity Earth system model, we quantify these two metrics as a function of (1) fossil fuel CO2 emissions only; (2) fossil fuel + direct land-use CO2 emissions; and (3) fossil fuel + net land-use CO2 fluxes including indirect land carbon sinks. We show that both the magnitude and time-dependence of the TCRE and ZEC metrics is sensitive to the inclusion and definition of land carbon emissions. This finding underscores the need for improved clarity and care in the application of scientific findings to real-world mitigation efforts related to land carbon emissions and removals.

How to cite: Matthews, H. D., Zickfeld, K., MacIsaac, A., and Dickau, M.: Effect of land carbon accounting methods on the climate response to cumulative CO2 emissions, EGU General Assembly 2025, Vienna, Austria, 27 Apr–2 May 2025, EGU25-13389, https://doi.org/10.5194/egusphere-egu25-13389, 2025.

EGU25-15339 | Posters on site | CL4.13

Southern Ocean heat burp in a cooling world 

Ivy Frenger, Svenja Frey, Andreas Oschlies, Julia Getzlaff, Torge Martin, and Wolfgang Koeve

The ocean accumulates carbon and heat under anthropogenic CO2 emissions and global warming. In net-negative emissions scenarios, where more CO2 is extracted from the atmosphere than emitted, we expect global cooling. Little is known about how the ocean will release heat and carbon under such a scenario. Here we use an Earth system model of intermediate complexity and show results of an idealized climate change scenario that, following global warming forced by an atmospheric CO2 increase of 1% per year and CO2 doubling at year 70, subsequently features decreasing atmospheric CO2 at a rate of -0.1% per year, implying sustained net-negative emissions. After four hundred years of net-negative emissions and gradual global cooling, abrupt reemergence of heat from the ocean interior leads to a global mean surface temperature increase of several tenths of degrees that lasts for more than a century. The ocean heat "burp" originates in heat that has previously accumulated under global warming in the Southern Ocean at depths and emerges to the ocean surface via deep convection. Surprisingly, this heat burp is largely devoid of CO2. This is because changes in ocean circulation affect heat more than carbon, with an additional muting effect of CO2 loss due to particularities of sea water carbon chemistry. As the ocean heat loss causes a global mean surface temperature increase that is independent of atmospheric CO2 concentrations or emissions, it  presents a mechanism that introduces a break down of the quasi-linear relationship of the TCRE.

How to cite: Frenger, I., Frey, S., Oschlies, A., Getzlaff, J., Martin, T., and Koeve, W.: Southern Ocean heat burp in a cooling world, EGU General Assembly 2025, Vienna, Austria, 27 Apr–2 May 2025, EGU25-15339, https://doi.org/10.5194/egusphere-egu25-15339, 2025.

EGU25-15995 | Orals | CL4.13

Constraining uncertainties of the Zero Emissions Commitment with a large ensemble of UVic 2.10 climate model simulations 

David Hohn, Giang Tran, Makcim De Sisto, and Nadine Mengis

Achieving global temperature stabilisation requires net-zero CO₂ emissions, a goal widely recognised within the scientific community. However, a critical and contested question remains: will the Earth's climate continue to warm due to thermal and biogeochemical inertia even after emissions cease? This phenomenon, known as Zero Emissions Commitment (ZEC), has been estimated to likely be 0.0 ºC with a multi-model spread of 0.3°C. Considering its magnitude, ZEC may represent a significant fraction of the remaining warming before the 1.5°C threshold is reached.

In an attempt to constrain uncertainties in ZEC estimates, this study presents findings from a large ensemble of simulations conducted using the University of Victoria Earth System Climate Model (UVic ESCM v2.10). The ensemble design systematically varies model parameters within observationally constrained ranges, targeting processes identified as having the largest potential influence on ZEC (Palazzo-Corner et al., 2023). These parameters include carbon cycle feedbacks, ocean heat uptake, and CO2 fertilisation effects, which are represented with appropriate and acceptable levels of complexity within the UVic ESCM.

In line with the CMIP7 emissions-driven experimental design focus, we employ the esm-flat10-zec as well as esm-flat20-zec, which uses a constant emission rate of 10 PgC/yr and 20 PgC/yr, respectively (Sanderson et al., 2024), with varying cumulative emission budgets. This approach allows for the exploration of ZEC parameter uncertainty under varying emission rates and carbon budgets, increasing our process-based understanding of the metric.


References

Sanderson, B. M. et al. The need for carbon-emissions-driven climate projections in CMIP7. Geoscientific Model Development 17, 8141–8172 (2024).

Palazzo Corner, S. et al. The Zero Emissions Commitment and climate stabilization. Frontiers in Science 1, 1170744 (2023).

How to cite: Hohn, D., Tran, G., De Sisto, M., and Mengis, N.: Constraining uncertainties of the Zero Emissions Commitment with a large ensemble of UVic 2.10 climate model simulations, EGU General Assembly 2025, Vienna, Austria, 27 Apr–2 May 2025, EGU25-15995, https://doi.org/10.5194/egusphere-egu25-15995, 2025.

EGU25-16501 | Orals | CL4.13

Asymmetric carbon-climate responses to cumulative emissions under different CO2 pathways 

Hongmei Li, Lennart Ramme, Chao Li, and Tatiana Ilyina

While previous research has extensively explored the effects of rising CO2 levels, the response of the climate and carbon cycle to reductions in CO2 remains less understood. In this study, we are going to uncover the asymmetric carbon-climate responses and underlying processes under different emission pathways, including decreasing and negative CO2 emissions.

Based on the Max Planck Institute Earth System Model (MPI-ESM1-2-LR), we have run a large ensemble of simulations incorporating an interactive carbon cycle under different future scenarios to quantify variations in atmospheric CO2 growth, along with carbon sinks in response to changing emissions. We found asynchronous changes in the atmospheric CO2 and emissions driven by carbon sinks, and the ocean and land become CO2 sources after ~2100 under negative emissions. While the climate responses to cumulative emissions along increasing pathways overlap, the responses along decreasing pathways are asymmetric and show uncertainties in the presence of internal climate variability.

Further idealized flat10 simulations with constant positive and negative CO2 emissions allow us to quantify the response of the carbon sink and climate under deep decarbonization. The climate and carbon cycle is irreversible even under the accumulation of zero emissions, featuring a lower global temperature and atmospheric CO2 concentration. An asymmetric response in the carbon uptake and release, and the ocean storage of carbon and heat intervene in the transient responses of climate to the cumulative CO2 emissions.

By leveraging these simulations under diverse scenarios, we seek to enhance our understanding of the transient climate response, providing insights into the potential impacts of emission reduction strategies and the role of negative emissions in climate mitigation.

How to cite: Li, H., Ramme, L., Li, C., and Ilyina, T.: Asymmetric carbon-climate responses to cumulative emissions under different CO2 pathways, EGU General Assembly 2025, Vienna, Austria, 27 Apr–2 May 2025, EGU25-16501, https://doi.org/10.5194/egusphere-egu25-16501, 2025.

EGU25-18370 | ECS | Orals | CL4.13

Understanding the Mechanisms Behind Zero Emissions Commitment (ZEC) at Different Warming Levels 

Laura Gibbs, Andy Wiltshire, Chris Jones, Colin Jones, Spencer Liddicoat, Ric Williams, Timothy Andrews, Eddy Robertson, Andrea Dittus, Ranjini Swaminathan, Lee DeMora, Jeremy Walton, Paulo Ceppi, and Till Kuhlbrodt

The Zero Emissions Commitment (ZEC) describes the climate response following the cessation of emissions and is critical for understanding long-term climate projections and remaining carbon budgets. Using simulations from the UK Earth System Model (UKESM), we explore ZEC behaviour across stabilized warming levels (WLs) following the protocol developed for TIPMIP. UKESM simulations reveal a strong dependence of ZEC on WL: while ZEC is near zero for WL <=2K, it becomes increasingly positive at higher WLs. This behaviour underscores the importance of disentangling the contributions of the different underlying processes to understand the mechanisms driving ZEC variability.

To explore the drivers of this behaviour, we analyse ZEC across a range of WLs focusing on both the thermal response and carbon cycle dynamics. We find that changes in physical feedbacks dominate the WL dependence of ZEC. However, the carbon cycle response still exhibits notable dynamics: land carbon uptake saturates after a few decades, while ocean uptake persists for centuries, shifting the balance between land and ocean contributions over time. While the climate response is approximately linear during the ramp-up phase, we hypothesize that ZEC is influenced by both the magnitude and duration of warming, reflecting a dependence on the system’s distance from equilibrium. These results highlight the critical role of WL-dependent responses in shaping long-term climate commitment and provide new insights into the mechanisms driving the variation in ZEC across scenarios.

How to cite: Gibbs, L., Wiltshire, A., Jones, C., Jones, C., Liddicoat, S., Williams, R., Andrews, T., Robertson, E., Dittus, A., Swaminathan, R., DeMora, L., Walton, J., Ceppi, P., and Kuhlbrodt, T.: Understanding the Mechanisms Behind Zero Emissions Commitment (ZEC) at Different Warming Levels, EGU General Assembly 2025, Vienna, Austria, 27 Apr–2 May 2025, EGU25-18370, https://doi.org/10.5194/egusphere-egu25-18370, 2025.

EGU25-19007 | Orals | CL4.13

A normalised framework for the Zero Emission Commitment: competing controls by thermal and carbon processes 

Ric Williams, Phil Goodwin, Paulo Ceppi, Chris Jones, and Andrew MacDougall

Climate models reveal a range of global surface temperature responses after net zero, generally a slight cooling, but sometimes a slight continued warming. This post emission response is affected by a range of processes including carbon uptake by the land and ocean, planetary heat uptake and time-varying climate feedback. To reveal their relative importance, a normalised framework is set out for the Zero Emissions Commitment (ZEC),  connecting the change in surface temperature (normalised by the change at net zero)  to changes in the atmospheric carbon inventory, radiative forcing, planetary heat uptake and climate feedback. Whether the temperature decreases or continues to rise after net zero is controlled by opposing contributions from (i) a weakening in radiative forcing due to a decrease in atmospheric carbon from the uptake by the land and ocean carbon sinks versus (ii) a strengthening in the surface warming due to a decline in ocean heat uptake and sometimes augmented by time-varying climate feedbacks. Inter-model differences in the post emission temperature response for the ZEC Model Intercomparison Project scenario are primarily determined by differences in the ocean uptake of heat and the land uptake of carbon, followed by differences in the ocean uptake of carbon and time-varying climate feedbacks.

How to cite: Williams, R., Goodwin, P., Ceppi, P., Jones, C., and MacDougall, A.: A normalised framework for the Zero Emission Commitment: competing controls by thermal and carbon processes, EGU General Assembly 2025, Vienna, Austria, 27 Apr–2 May 2025, EGU25-19007, https://doi.org/10.5194/egusphere-egu25-19007, 2025.

EGU25-21870 | Orals | CL4.13

AERA-MIP: TCRE, emission pathways and remaining budgets compatible with 1.5 and 2 °C global warming stabilization 

Yona Silvy and Thomas Frölicher and the AERA-MIP author team

While international climate policies now focus on limiting global warming to well below 2 °C or pursuing a 1.5 °C level of global warming, the climate modelling community has not provided an experimental design in which all Earth system models (ESMs) converge and stabilize at the same prescribed global warming levels. This gap hampers accurate estimations based on comprehensive ESMs of the carbon emission pathways and budgets needed to meet such agreed warming levels and of the associated climate impacts under temperature stabilization. Here, we apply the Adaptive Emission Reduction Approach (AERA) with ESMs to provide such simulations in which all models converge at 1.5 and 2.0 °C warming levels by adjusting their emissions over time. These emission-driven simulations provide a wide range of emission pathways and resulting atmospheric CO2 projections for a given warming level, uncovering uncertainty ranges that were previously missing in the traditional Coupled Model Intercomparison Project (CMIP) scenarios with prescribed greenhouse gas concentration pathways. Meeting the 1.5 °C warming level requires a 40 % (full model range: 7 % to 76 %) reduction in multi-model mean CO2-forcing-equivalent (CO2-fe) emissions from 2025 to 2030, a 98 % (57 % to 127 %) reduction from 2025 to 2050, and a stabilization at 1.0 (−1.7 to 2.9) PgC yr−1 from 2100 onward after the 1.5 °C global warming level is reached. Meeting the 2.0 °C warming level requires a 47 % (8 % to 92 %) reduction in multi-model mean CO2-fe emissions until 2050 and a stabilization at 1.7 (−1.5 to 2.7) PgC yr−1 from 2100 onward. The on-average positive emissions under stabilized global temperatures are the result of a decreasing transient climate response to cumulative CO2-fe emissions over time under stabilized global warming. This evolution is consistent with a slightly negative zero emissions commitment – initially assumed to be zero – and leads to an increase in the post-2025 CO2-fe emission budget by a factor of 2.2 (−0.8 to 6.9) by 2150 for the 1.5 °C warming level and a factor of 1.4 (0.9 to 2.4) for the 2.0 °C warming level compared to its first estimate in 2025. The median CO2-only carbon budget by 2150, relative to 2020, is 800 GtCO2 for the 1.5 °C warming level and 2250 GtCO2 for the 2.0 °C warming level. These median values exceed the median IPCC AR6 estimates by 60 % for the 1.5 °C warming level and 67 % for 2.0 °C. Some of the differences may be explained by the choice of the mitigation scenario for non-CO2 radiative agents. Overall, this new type of warming-level-based emission-driven simulation offers a more coherent assessment across climate models and opens up a wide range of possibilities for studying both the carbon cycle and climate impacts, such as extreme events, under climate stabilization.

How to cite: Silvy, Y. and Frölicher, T. and the AERA-MIP author team: AERA-MIP: TCRE, emission pathways and remaining budgets compatible with 1.5 and 2 °C global warming stabilization, EGU General Assembly 2025, Vienna, Austria, 27 Apr–2 May 2025, EGU25-21870, https://doi.org/10.5194/egusphere-egu25-21870, 2025.

EGU25-957 | ECS | Posters on site | CL4.4

Exploring Dynamics of Climate and Atmosphere Employing the Temperature Indices Using Bias-Corrected GCMS and Ensemble Model Approach 

Gupta Abhishek Rajkumar, Manish Kumar Nema, and Deepak Khare

Urban areas significantly influence planetary processes by altering heat, moisture and chemical budgets and it plays a pivotal role in modifying planetary processes through their unique interactions with the environment. The reduction in natural vegetation and permeable surfaces limits evapotranspiration and alters the hydrological balance, often leading to increased surface runoff, reduced groundwater recharge and changes in local humidity levels. The current study evaluates the spatial and temporal variation of temperature extremes for the historical period (1951–2014) and the future scenarios of two Shared Socioeconomic Pathways; SSP245 and SSP 585 for the future periods of 2015-2100, divided into two periods; near future (2015-2050) and far future (2051-2100) for the major tributary of The River Godavari; The Wainganga Basin, India. The temperature data for the basin is sourced from five General Circulation Models (GCMs) and an ensemble model derived from them. The ensemble model incorporates climate forecasts and accounts for anticipated space-weather-related atmospheric perturbations, resulting in a more complete knowledge of fluctuations in temperature in the Wainganga River Basin. The temperature variation due to climate change is evaluated using the extreme climate indices influenced by minimum and maximum temperature, recommended by the Expert Team on Climate Change Detection and Indices (ETCCDI) and Expert Team on Sector-Specific Climate Indices (ET-SCI). These indices provide a standardized framework for assessing the impacts of driving forces of dynamic temperature and atmospheric processes. The findings will showcase the impact of changes in temperature and their effects temporally, and spatially on the sub-basin level also address the change in atmosphere strongly with the type of driver, time, and location. As global urbanization continues, insights from studies like this are crucial for developing and evaluating adaptive strategies. Conclusively, findings can inform policies aimed at climate resilience, drawing parallels with urban climate adaptation efforts. 

How to cite: Rajkumar, G. A., Nema, M. K., and Khare, D.: Exploring Dynamics of Climate and Atmosphere Employing the Temperature Indices Using Bias-Corrected GCMS and Ensemble Model Approach, EGU General Assembly 2025, Vienna, Austria, 27 Apr–2 May 2025, EGU25-957, https://doi.org/10.5194/egusphere-egu25-957, 2025.

Understanding future changes in temperature variability and extremes is an important scientific challenge. Here, the response of daily near-surface temperature distributions to warming is explored using an idealised global climate model.  Simulations of a wide range of climate states are performed with a slab-ocean aquaplanet configuration and with a simple land continent using a bucket-style model for hydrology. In the tropics, the responses of temperature extremes (i.e., high percentiles of daily near-surface temperature) to climate change contrast strongly over land and ocean. Over land, warming is amplified for hot days relative to the average day. But over ocean, warming is suppressed for hot days, implying a narrowing of the temperature distribution. 

Previous studies have developed theories based on convective coupling to interpret changes in temperature extremes over land. Building on this work, here the contrasting temperature distribution responses over land and ocean are investigated using a new theory based on strict convective equilibrium, which assumes moist adiabatic lapse rates. The theory highlights four physical mechanisms with the potential to drive differential warming across the temperature distribution: hot-get-hotter mechanism, drier-get-hotter mechanism, relative humidity change mechanism, and the free tropospheric temperature change mechanism.  Hot days are relatively dry over land due to limited moisture availability, which drives the drier-get-hotter mechanism and  amplified warming of the warm tail of the distribution. This mechanism is the dominant factor explaining the contrasting responses of hot days over land and ocean to climate change. An extended version of the theory, which relaxes the strict convective equilibrium assumption, is introduced and applied to the simulations to understand the influence of convective available potential energy (CAPE) on changes in the temperature distribution. 

How to cite: Duffield, J. and Byrne, M.: Tropical temperature distributions over a range of climates: theory and idealised model simulations, EGU General Assembly 2025, Vienna, Austria, 27 Apr–2 May 2025, EGU25-1397, https://doi.org/10.5194/egusphere-egu25-1397, 2025.

EGU25-1648 | ECS | Orals | CL4.4

Different Roles of Land-atmosphere Coupling in Compound Drought-heatwave Events 

Donghyuck Yoon, Jan-Huey Chen, Hsin Hsu, and Kirsten Findell

Droughts and heatwaves are inherently linked through land-atmosphere (L-A) coupling, where the interactions between surface energy and water availability play critical roles in their evolution. In energy-limited regimes, anomalously high surface air temperature (T) intensifies evapotranspiration (ET), leading to rapid depletion of soil moisture (SM). Conversely, in water-limited regimes, reduced SM suppresses ET, exacerbating surface warming. The transition between these two regimes, characterized by critical soil moisture thresholds, governs the progression of compound drought-heatwave events.

This study analyzed the spatiotemporal variability of L-A coupling mechanisms during six extreme compound drought-heatwave events. In all cases, SM exhibited a consistent negative temporal correlation with T, declining from the onset to the peak of the heatwave and recovering during the decay phase. However, the behavior of ET varied, with SM-ET coupling dominating in some cases and T-ET coupling prevailing in others. These distinctions in coupling regimes demonstrated regional heterogeneity, even within individual events. As regimes shifted from T-ET to SM-ET coupling, evaporative fraction (EF) on heatwave peak days significantly decreased, underscoring that the drivers of drought-heatwave interactions differ spatially. Furthermore, correlation analysis between SM and EF revealed that critical soil moisture thresholds are key determinants of these coupling behaviors. This highlights the role of critical soil moisture in modulating L-A feedbacks and controlling the transition between coupling regimes.

Using the GFDL SHiELD global 13-km model configuration, we evaluated the predictability of two prominent events in 2022 and 2023, which displayed contrasting dominant regimes. SHiELD effectively captured the spatial distribution and temporal evolution of L-A coupling regimes in both cases. Notably, the SM-ET coupling-dominated 2023 event demonstrated superior forecast skill for SM and TMAX compared to the T-ET coupling-dominated 2022 event. This result emphasizes the importance of soil moisture memory in water-limited regions for enhancing predictability in compound drought-heatwave scenarios.

How to cite: Yoon, D., Chen, J.-H., Hsu, H., and Findell, K.: Different Roles of Land-atmosphere Coupling in Compound Drought-heatwave Events, EGU General Assembly 2025, Vienna, Austria, 27 Apr–2 May 2025, EGU25-1648, https://doi.org/10.5194/egusphere-egu25-1648, 2025.

EGU25-1850 | ECS | Orals | CL4.4

Nonlinear interactions amplify the most extreme midlatitude heatwaves  

Yinglin Tian, Jiangong Liu, Yu Huang, Pierre Gentine, and Kai Kornhuber

Recent occurrences of record-breaking heat extremes and their profound societal impacts on health, infrastructure, food systems, and the energy sector underscore the urgent need to improve our physical understanding and modeling capacities for future projections. In mid-latitude regions, persistent high-pressure systems and dry soils have been identified as key contributors to heatwave severity. Moreover, non-linear interactions between these two drivers and temperature have been suggested to play a critical role in some of the most extreme recent heat events, such as the 2021 Pacific-North America heatwave (Bartusek et al., Nat. Clim., 2022). However, the universality and regional significance of such non-linear interactions remain largely unquantified.

Using an explainable machine learning approach, we quantitatively decompose surface air temperature anomalies during heat extremes into three components: direct contributions from (i) geopotential height anomalies, (ii) soil moisture deficits, and (iii) the interaction between the two. Our analysis reveals that non-linear interactions make statistically significant contributions across 19% of the land area in the northern hemisphere mid-latitudes (40°N–60°N). In these regions, the interactive contribution increases with temperature at a rate of 0.1 K/K when temperatures exceed a critical threshold of 4.0 K above the local summer mean. Hotspots of such behavior are especially pronounced in Central Europe, where 40% of the land area exhibits significant non-linear interactions, amplifying the most extreme heatwave events by up to 13%.

Furthermore, we identify a 2.4-fold increase in the regional mean non-linearity of interactions in Central Europe over the past 45 years, accompanied by a 25% expansion in the affected area. This accounts for 18% of the observed widening in the temperature distribution’s upper tail reported in other studies (Kornhuber et al., PNAS, 2024). Additionally, our findings show that CMIP6 climate models underestimate the non-linearity of extratropical interactions by 80%, contributing to biases in projections of extreme heat changes. Our findings underscore the critical role of these non-linear physical processes in amplifying extreme heatwave events, emphasizing the need to account for these processes in climate models to better anticipate and mitigate the impacts of climate extremes in current and future climates.

How to cite: Tian, Y., Liu, J., Huang, Y., Gentine, P., and Kornhuber, K.: Nonlinear interactions amplify the most extreme midlatitude heatwaves , EGU General Assembly 2025, Vienna, Austria, 27 Apr–2 May 2025, EGU25-1850, https://doi.org/10.5194/egusphere-egu25-1850, 2025.

EGU25-2239 | ECS | Orals | CL4.4

A simple complementary framework for evaluating evaporation base on land-atmosphere coupling 

Zhuoyi Tu, Yuting Yang, Michael Roderick, and Tim McVicar

Evaporation (E) is a key process in land-atmosphere water and energy exchanges. Among the evaporation methods, the complementary relationship (CR) approach builds upon the dynamic feedbacks of water and heat fluxes between the land-atmosphere interface, providing a straightforward framework for estimating evaporation using basic meteorological inputs, without relying on complex land surface information. Although CR is a simple and effective method, traditional CR mechanisms/models still face two main challenges. First, the wet boundary condition of CR is inaccurately characterized. When the land surface is not water-limited, evaporation is defined as potential evaporation (Epo). However, Epo estimates using conventional methods often do not align with its fundamental definition, as meteorological variables observed under real conditions differ from those over a hypothetical wet surface. Here, we estimate Epo using the maximum evaporation approach (Epo_max) that does follow the original Epo definition. Our findings show that using Epo_max significantly reduces the asymmetry in the CR. Second, traditional CR mechanisms focus on the feedback between water vapor and temperature in the land-atmosphere system, while overlooking the impact of these changes on radiation. As the surface transitions from dry to wet, enhanced actual evaporation and reduced sensible heat flux lead to cooler and wetter air above the surface, reducing the vapor pressure deficit and further decreasing atmospheric evaporative capacity (or apparent potential evaporation, Epa). Building on this, we found temperature reduction overall increases the radiation term in Epa and partially offsets the traditional view that water vapor weakens the aerodynamic term. Based on the above modifications, we developed a physically-based, calibration-free CR model, which requires few input variables and thus facilitates evaporation estimation. More importantly, the CR method, grounded in land-atmosphere coupling, offers a simpler framework for studying the feedback of evaporation on climate, making it a promising tool compared to complex coupled climate models.

How to cite: Tu, Z., Yang, Y., Roderick, M., and McVicar, T.: A simple complementary framework for evaluating evaporation base on land-atmosphere coupling, EGU General Assembly 2025, Vienna, Austria, 27 Apr–2 May 2025, EGU25-2239, https://doi.org/10.5194/egusphere-egu25-2239, 2025.

Tropical regions have undergone extensive deforestation in recent decades, significantly impacting local, regional, and global water cycles; however, detailed studies on their hydroclimatic effects remain limited. This study employs a regional climate model coupled with a water vapor tracking tool to investigate the effects of deforestation on local and regional precipitation from 2000 to 2020 in three major tropical deforestation hotspots: the Amazon, Africa, and Southeast Asia. Results indicate that deforestation affects precipitation with distinct scale-dependent and seasonal variations. In the Amazon, contrasting precipitation responses to deforestation were observed between wet and dry seasons (Yingzuo Qin et al., Nature, 2025, in press). During the wet season, deforested areas exhibited a notable increase in precipitation (0.96 mm month-1 per percentage point of forest loss), primarily due to enhanced mesoscale atmospheric circulation (i.e., nonlocal effects). These nonlocal effects weakened with distance from deforested areas, resulting in significant precipitation reductions beyond 60 km. Conversely, during the dry season, precipitation decreased in deforested areas and across all analysis buffers, with local effects from reduced evapotranspiration (ET) dominating. In Africa, due to the dispersibility of deforestation across the continent, the scale-dependency and seasonality of precipitation effects caused by deforestation are influenced by elevation and deforestation patch size. In Southeast Asia, under the strong influence of oceanic water vapor, deforestation-induced positive precipitation effects prevail throughout the year. These findings underscore the complex interplay between local and nonlocal effects in driving tropical deforestation-precipitation responses across different seasons and scales, highlighting the urgent need to address the rapid and extensive loss of forests in tropical regions to mitigate their nonnegligible climatic impacts.

How to cite: Qin, Y.: Tracking tropical deforestation impacts on local and regional hydroclimate, EGU General Assembly 2025, Vienna, Austria, 27 Apr–2 May 2025, EGU25-2431, https://doi.org/10.5194/egusphere-egu25-2431, 2025.

EGU25-3078 | Orals | CL4.4

Soil moisture controls on convective initiation across the diverse landscapes and hydro-climates of Africa 

Christopher Taylor, Cornelia Klein, and Emma Barton

A wealth of studies exist analysing the feedback between soil moisture and convective precipitation across a broad range of time and space scales, encompassing theoretical, numerical modelling and observational approaches. A critical step in this feedback is an understanding of how soil moisture, via its control on sensible and latent heat fluxes, influences the initiation of deep convective clouds. Knowledge of where soil moisture conditions favour triggering of new storms is also important for short-term weather forecasting. Whilst many analyses consider how soil moisture affects the vertical profiles of temperature and humidity (1-D perspective), other studies examine the role of spatially-varying soil moisture on convective initiation via surface-induced mesoscale circulations. Here we use a 20-year observational dataset of convective initiations across sub-Saharan Africa to draw more general conclusions about how soil moisture impacts convective initiation and subsequent rainfall across a diversity of hydro-climatic, topographic and wind conditions.

We use cloud-top temperature data from the geostationary Meteosat Second Generation (MSG) series of satellites to identify afternoon convective initiations for the period 2004-2023 and relate these to pre-storm observations of land surface state (land surface temperature from MSG, and surface soil moisture from the Advanced Scatterometer). Both datasets reveal a consistent Africa-wide picture of initiations favoured at the downwind end of elliptical dry soil structures, as found in previous analyses over the Sahel (Taylor et al, Nature Geoscience, 2011). The soil moisture signal weakens with stronger topographic variability, and in wetter climates and times of year, but outside of the Congo Basin and East African Highlands, the signal of initiation over locally dry soils is clear. Moreover, we show that the along-wind length scale of the dry soil feature increases with low-level wind speed. Our results, valid on scales of up to ~200km, fit with understanding of mesoscale circulations driven by soil moisture heterogeneity, and cannot be explained by 1-D consideration of thermodynamic profiles alone. We also show how the overall soil moisture-precipitation feedback from these events is influenced by wind conditions at storm steering level. In regions (including the Sahel) where winds at low and steering levels are in opposing directions, the feedback is strongly negative. Alternatively, when low and mid-level winds are aligned, the negative feedback weakens, and can become positive.

How to cite: Taylor, C., Klein, C., and Barton, E.: Soil moisture controls on convective initiation across the diverse landscapes and hydro-climates of Africa, EGU General Assembly 2025, Vienna, Austria, 27 Apr–2 May 2025, EGU25-3078, https://doi.org/10.5194/egusphere-egu25-3078, 2025.

The vegetation-temperature feedback significantly influences local climate variability. While previous studies have assessed the responses of local temperature to vegetation biomass changes, they often suffer from the mix of long-term global warming trends and localized vegetation-temperature interactions. More importantly, the temporal evolutions of this feedback remain elusive. Here, we use a novel approach to analyze spatiotemporal variations of this local feedback while controlling for global warming trends. Our findings reveal a weakening role of vegetation in cooling the earth over the past four decades, with a nonlinear feedback change modulated by background climatologic conditions. Furthermore, an evaluation of state-of-the-art climate models shows a systematic overestimation of vegetation cooling effects, particularly in densely vegetated regions. This overly optimistic bias contributes to a significant underestimation of global warming, highlighting the need to improve the representation of vegetation-climate interactions in climate models.

How to cite: Liu, Z., Peng, X., and He, X.: Spatiotemporal dynamics in vegetation-temperature feedback and overly optimistic representations in climate models, EGU General Assembly 2025, Vienna, Austria, 27 Apr–2 May 2025, EGU25-3628, https://doi.org/10.5194/egusphere-egu25-3628, 2025.

EGU25-4252 | Orals | CL4.4

Soil moisture–precipitation feedbacks in Central Europe: Fully coupled WRF-Hydro simulations evaluated with cosmic-ray neutron soil moisture measurements 

Joël Arnault, Benjamin Fersch, Martin Schrön, Heye Reemt Bogena, Harrie-Jan Hendricks Franssen, and Harald Kunstmann

The skill of regional climate models partly relies on their ability to represent land–atmosphere feedbacks in a realistic manner, through the coupling with a land surface model. However, these models often suffer from insufficient or erroneous information on soil hydraulic parameters. In this study, the fully coupled land–atmosphere model WRF-Hydro driven with ERA5 reanalysis is employed to reproduce the regional atmospheric conditions over Central Europe with a horizontal resolution of 4 km for the period 2017–2020. Simulated soil moisture is compared with data from cosmic-ray neutron sensors (CRNS) at three terrestrial environmental observatories of the TERENO network. Soil hydraulic parameters from the European digital soil dataset EU-SoilHydroGrids, together with hydraulic conductivity functions from the Campbell and van Genuchten–Mualem models, are used to test the impact of different representations of soil infiltration on modeled land–atmosphere feedbacks. An updated method to disentangle the proportion of convective precipitation being favored over wet, dry and mixed soils is provided, in order to shed more light on the soil moisture–precipitation feedback mechanism. It is found that WRF-Hydro with van Genuchten–Mualem and EU-SoilHydroGrids best reproduces CRNS soil moisture daily variations, in association with enhanced soil moisture in the root zone and a larger proportion of convective precipitation favored over wet soils. This study demonstrates the importance of adequately considering infiltration processes to realistically reproduce land–atmosphere feedbacks.

How to cite: Arnault, J., Fersch, B., Schrön, M., Bogena, H. R., Hendricks Franssen, H.-J., and Kunstmann, H.: Soil moisture–precipitation feedbacks in Central Europe: Fully coupled WRF-Hydro simulations evaluated with cosmic-ray neutron soil moisture measurements, EGU General Assembly 2025, Vienna, Austria, 27 Apr–2 May 2025, EGU25-4252, https://doi.org/10.5194/egusphere-egu25-4252, 2025.

EGU25-4419 | ECS | Posters on site | CL4.4

Identification of climatic extremes by multi-fractal analysis of long climate data series 

Carl Tixier, Pierre-Antoine Versini, and Benjamin Dardé

Shrinking and swelling of clays (SSC), occur as a result of water content fluctuations in expansive clayey soils, governed by seasonal cycles of precipitation and drought. This hazard causes ground movement, which can affect foundations and infrastructures. In France, where 54% of constructions are exposed to this hazard, SSC is the second largest category for natural disaster compensation.

With climate change, modification in the intensity and frequency of droughts, heat waves and precipitation are likely to exacerbate this phenomenon. In this context, further research is needed to anticipate the influence of climatic changes on the evolution of the SSC hazard and its impact on constructions in the next decades.

In particular, it is crucial to understand soil-atmosphere interactions on some appropriate spatial and temporal scales, but also through scales. Climate impact studies use hydrological or agricultural models, fed by global climate data adapted locally by statistical adjustments or downscaling. These methods improve local accuracy but increase bias and uncertainty, as they are often based on stationarity assumptions, which are not always valid in the context of climate change. The modeling of extreme values, essential for risk management, thus becomes more complex.

In response to the difficulties of climate models in representing extreme events at high spatio-temporal resolutions, and in understanding hydro-climatic interactions with clay soil, several geostatistical approaches are proposed.

An in-depth study of the existing literature has enabled us to compare the various downscaling methods. This state of the art is complemented by the study of data (extreme meteorological phenomena, humidity, soil displacements, etc.) acquired by various organizations concerned by the SSC problem (sources: BRGM, INRAE, SNCF, Météo-France, etc.).

This presentation will include the results of geostatistical analyses based on (multi)fractals conducted on this data (spatiotemporal variability, scale breaks, estimation of extreme values, spectral analysis, etc.). The data analyzed will cover the main parameters influencing soil moisture, i.e., precipitation and temperature.

These analyses may reveal the statistical signatures of climatic extremes. By identifying them, it will then be possible to research the different climate scenarios, and thus represent the extremes with precision. This step is essential to understanding SSC phenomena.

The final objective of this research work is to propose a soil-atmosphere interaction model, capable of generating the input data required for a numerical SSC behavior model. This model will take into account the various hydro-climatic parameters mentioned above, focusing mainly on evaporation and infiltration processes, as well as soil heterogeneity.

How to cite: Tixier, C., Versini, P.-A., and Dardé, B.: Identification of climatic extremes by multi-fractal analysis of long climate data series, EGU General Assembly 2025, Vienna, Austria, 27 Apr–2 May 2025, EGU25-4419, https://doi.org/10.5194/egusphere-egu25-4419, 2025.

Tibetan Plateau has been experiencing profound warming and slight wetting over recent decades, which have contradictive effects on soil organic carbon by enhancing plant growth and thereafter carbon input into the soil and increasing the soil organic carbon (SOC) decomposition rate. In this study, we developed a SOC model (WetlandC model) for wetlands, considering also the process of litterfall decomposition and parameterizing the effect of grazing on SOC accumulation. We also established a modelling framework to combine WetlandC model with TEM (Terrestrial Ecosystem Model) model to simulate the changes in SOC of the alpine wetlands on the Tibetan Plateau from 2000 to 2018. Results showed that spatially, the soil organic carbon density (SOCD) of alpine wetlands was higher in the southeast and lower in the northwest, ranging from 1358.22 to 22571.81 g C m-2. The SOCD spatial pattern coincided with the northernmost and southernmost northern boundary of Asian summer monsoon. The SOCD was higher in region with precipitation ranging from 450 to 900 mm, suggesting that the precipitation played an important role in regulating the spatial heterogeneity of SOCD. The temporal trends of SOCD varied from -55.84 to 407.59 g C m-2 yr-1 over the plateau, and 97.98% of the wetland area was accumulating SOC. Temperature, precipitation and actual livestock carrying capacity, as the top influencing factors of the temporal trend of SOCD, accounted for 35.06%, 34.52% and 30.41% of the area in the alpine wetlands, respectively. The 0–30 cm SOC stock of the alpine wetlands on the Tibetan Plateau increased from 518.06 Tg C in 2000 to 607.67 Tg C in 2018. Surface soil in the alpine wetlands acts as a carbon sink of 4.98 Tg C yr-1. Our results indicated that in the context of climate change, additional soil carbon sequestration in the alpine wetlands was facilitated by enhanced plant growth, in spite that grazing consumed the above-ground biomass. Future climate warming and wetting is likely to benefit the SOC accumulation in the alpine wetlands on the Tibetan Plateau if not overgrazed.

How to cite: Zhang, Q.: Effects of climate change and grazing on soil organic carbon stock of alpine wetlands on the Tibetan Plateau, EGU General Assembly 2025, Vienna, Austria, 27 Apr–2 May 2025, EGU25-4887, https://doi.org/10.5194/egusphere-egu25-4887, 2025.

Soil moisture (SM) is a crucial factor in land-atmosphere interactions and climate systems, affecting surface energy, water budgets, and weather extremes. In the Three Rivers Source Region (TRSR) of China, rapid climate change necessitates precise SM monitoring. This study employs a novel UNet-Gan model to integrate and downscale SM data from 17 CMIP6 models, producing a high-resolution (0.1◦) dataset called CMIP6UNet−Gan. This dataset includes SM data for five depth layers (0-10 cm, 10-30 cm, 30-50 cm, 50-80 cm, 80-110 cm), four Shared Socioeconomic Pathways (SSP1-2.6, SSP2-4.5, SSP3-7.0, SSP5-8.5). The UNet-Gan model demonstrates strong performance in data fusion and downscaling, especially in shallow soil layers. Analysis of the CMIP6UNet−Gan dataset reveals an overall increasing trend in SM across all layers, with higher rates under more intense emission scenarios. Spatially, moisture increases vary, with significant trends in the western Yangtze and northeastern Yellow River regions. Deeper soils show a slower response to climate change, and seasonal variations indicate that moisture increases are most pronounced in spring and winter, followed by autumn, with the least increase observed in summer. Future projections suggest higher moisture increase rates in the early and late 21st century compared to the mid-century. By the end of this century (2071-2100), compared to the Historical period (1995-2014), the increase in SM across the five depth layers ranges from: 5.5% to 11.5%, 4.6% to 9.2%, 4.3% to 7.5%, 4.5% to 7.5%, and 163.3% to 6.5%, respectively.

How to cite: Luo, S. and Li, Z.: Trend Analysis of High-Resolution Soil Moisture Data Based on GAN in the Three River Source Region During the 21st Century, EGU General Assembly 2025, Vienna, Austria, 27 Apr–2 May 2025, EGU25-5586, https://doi.org/10.5194/egusphere-egu25-5586, 2025.

The representation of snow in land surface models is critical for accurate seasonal forecasting, yet traditional single-layer snow schemes fail to capture the full insulating properties of deep snowpacks. These limitations result in pronounced seasonal biases, including excessive winter cooling and springtime warming. This study explores the impact of introducing a multi-layer snow scheme within the Global Seasonal Forecast System (GloSea) to address these biases. Using 24 years of retrospective forecasts (1993–2016), we compare the latest version, GloSea6, incorporating the multi-layer scheme, with GloSea5, which relies on a single-layer approach. The multi-layer snow scheme in GloSea6 improves the onset of snowmelt, delaying it by approximately two weeks. This delay moderates spring soil moisture depletion, promoting greater latent heat flux and surface evaporative cooling. The wetter surface reduces the overestimation of water-limited processes and mitigates near-surface warming biases during summer. Additionally, the enhanced representation of snow improves the simulation of precipitation, particularly in snowmelt-driven regions such as the Great Plains, Europe, and South and East Asia, leading to substantial error reductions. These findings highlight the critical role of a multi-layer snow scheme in advancing seasonal forecast accuracy, not only for temperature and precipitation during snowmelt but also for subsequent summer climatic conditions through improved land-atmosphere feedback processes.

How to cite: Seo, E. and Dirmeyer, P.: Unveiling the influence of multi-layer snowpack in seasonal forecast system on model climatological bias, EGU General Assembly 2025, Vienna, Austria, 27 Apr–2 May 2025, EGU25-5714, https://doi.org/10.5194/egusphere-egu25-5714, 2025.

EGU25-5959 | ECS | Orals | CL4.4

Recurring and Co-Occurring Climate Extremes in Eastern Africa. A Normalcy? 

Peter K. Musyimi, Tamás Weidinger, Tímea Kalmár, Lucia Mumo, and Balázs Székely

Recurring and co-occurring extreme climate events exacerbate adverse effects on human livelihoods, regional and local economy, and the environment. Previous studies have extensively researched on the frequency, intensity, and duration of single climate extremes. However, recurring and co occurrence compound extremes remain scantly addressed in the East Africa Region. Here, we examine spatial variations of the precipitation and temperature extremes events from 1991 to 2022 (32 years) in East Africa, where agriculture is the main economic mainstay. We used high-resolution (0.25° x 0.25°) precipitation and temperature ERA5-reanalysis data. Three agriculturally relevant precipitation events: consecutive dry days (CDD), consecutive wet days (CWD), annual total precipitation that is wet-days annual amount (RR ≥ 1 mm)(PRCPTOT),  and three core temperature metrics: summer days with temperature > 25°C (SU25), extremely hot days with maximum temperature > 35°C (SU35) and diurnal temperature range (DTR) are examined. Our results show that the mean annual CDD ranges between 0 and 240 days in DR Congo, Uganda, Kenya, and the Ethiopian Highlands. The CWD annual averages were the longest, and the maximum was observed in some parts of DR Congo, Ethiopian, and Kenya highlands (365 days). However, minimum CWD events were experienced in the whole of Somalia and arid and semi-arid lands (ASALs) of Kenya, Southern Sudan, and Tanzania. The highest PRCPTOT was experienced in high altitudes and rainforest biomes. Mean annual SU25 were low, predominating in mountainous regions with less than 100 days. Most parts of Kenya show the annual DTR between 10 °C to 12 °C, and few areas with values between 8 °C to 10 °C and between 12 °C and 15 °C. Rwanda and Burundi had values between 8 °C and 10 °C while Tanzania experienced values between 8 °C to 10 °C and between 10 °C and 12 °C. These agriculturally relevant climate extremes threaten people’s livelihood, which is highly dependent on rainfed agriculture. Therefore, contextual-specific adaptation strategies are imperative in minimizing socioeconomic loss and damaging adverse effects in the agriculture and water sectors. Early warning systems should be enforced over East Africa to minimize compounded climate risks.

Keywords: Climate Extremes; East Africa region; ERA5; Precipitation; Temperature.

How to cite: Musyimi, P. K., Weidinger, T., Kalmár, T., Mumo, L., and Székely, B.: Recurring and Co-Occurring Climate Extremes in Eastern Africa. A Normalcy?, EGU General Assembly 2025, Vienna, Austria, 27 Apr–2 May 2025, EGU25-5959, https://doi.org/10.5194/egusphere-egu25-5959, 2025.

EGU25-7299 | ECS | Orals | CL4.4

Land climate under warming in radiative-convective equilibrium simulations 

Tara Gallagher and Kaighin McColl

A simple way to model Earth’s climate is to assume radiative-convective equilibrium (RCE), where surface fluxes transport heat and water vapor away from the surface, and radiative cooling balances this energy in the atmosphere. This framework has provided basic insight into the effect of warming on climate over oceans with both fixed and interactive surface temperatures, but it is seldom applied over land. Unlike oceans, land surfaces have a limited water supply and a small heat capacity, and may respond quite differently given these features. Here, we run a suite of cloud-permitting simulations in RCE over land both with interactive soil moisture and fixed at saturation. In contrast to the most relevant previous studies, our simulations span a wide range of climates, obtained by varying the top-of-atmosphere insolation and atmospheric CO2 concentrations. Several notable patterns emerge as surface temperatures rise including non-monotonic trends in precipitation and steady declines in soil moisture, neither of which can be explained with existing theory. The results demonstrate distinctions between land and ocean responses to warming, with implications for land climate sensitivity and hydrological sensitivity.

How to cite: Gallagher, T. and McColl, K.: Land climate under warming in radiative-convective equilibrium simulations, EGU General Assembly 2025, Vienna, Austria, 27 Apr–2 May 2025, EGU25-7299, https://doi.org/10.5194/egusphere-egu25-7299, 2025.

EGU25-7752 | ECS | Orals | CL4.4

Causal Dynamics of Land–Atmosphere Coupling under Compound Dry–Hot Events 

Yikui Zhang, Daniel Hagan, Diego G. Miralles, Klaus Goergen, and Stefan Kollet

The increasing frequency and magnitude of compound dry–hot events (CDHEs) pose significant risks to natural and managed systems. While the role of land–atmosphere coupling in determining the magnitude and evolution of CDHEs has been highlighted, the causal interactions between variables within the coupled system under external forcing remain poorly understood. This study investigates the causal relationships between soil moisture and 2m air temperature, as well as between absorbed shortwave solar radiation and 2m air temperature during CDHEs, based on information flow theory. Using two fully coupled simulations with the Terrestrial Systems Modeling Platform (TSMP), one with and one without irrigation, the information flow analysis provides an interpretable framework to characterize the spatiotemporal variability of the land–atmosphere coupling strength in response to the perturbations such as CDHEs and irrigation. 

The results show that concurrent dry and hot conditions are characterized by temporal shifts in the evaporative regime towards increased soil moisture–temperature information flow driven by the shift in surface energy partitioning, such that decreases in soil moisture lead to increased temperatures. Meanwhile, irrigation can significantly reduce the frequency and magnitude of CDHEs by directly increasing soil moisture variability and indirectly affecting surface energy fluxes, and thus altering land–atmosphere coupling. However, the impact of irrigation in Europe is predominantly local and limited by the volumes applied. These findings highlight the potential of targeted, region-specific irrigation strategies to attenuate dry and hot extremes. In addition, the information flow framework provides a robust and interpretable tool for diagnosing the functional performance of regional climate models under perturbations, offering new insights for analyzing the impacts of human interventions on the climate system and enhancing our understanding of extreme hydroclimatic events in future studies.

How to cite: Zhang, Y., Hagan, D., Miralles, D. G., Goergen, K., and Kollet, S.: Causal Dynamics of Land–Atmosphere Coupling under Compound Dry–Hot Events, EGU General Assembly 2025, Vienna, Austria, 27 Apr–2 May 2025, EGU25-7752, https://doi.org/10.5194/egusphere-egu25-7752, 2025.

EGU25-8597 | ECS | Orals | CL4.4

Dynamic Impacts of Eurasian Spring Snowmelt on Summer Heat Extremes in Northern East Asia 

Yulong Yang, Qinglong You, and Taylor Smith

Eurasian spring snowmelt (ESS) significantly influences climate, yet its effects on climate extremes and their dynamic variations remains poorly understood. This study investigates the dynamic impact of ESS on summer heat extremes in Northern East Asia (NEA) during 1979–2018 and examines the underlying mechanisms driving long-range links between snowmelt and temperature anomalies. We find that ESS has a notable positive impact on NEA summer heat extremes, primarily driven by snow-hydrological effects (soil-moisture). Increased ESS drives positive local soil-moisture anomalies in summer, which cool the near-surface atmosphere, facilitating the eastward propagation of anomalous wave patterns. This process strengthens the anomalous anticyclone over NEA, amplifying summer heat extremes. We also find that the Atlantic Multidecadal Oscillation modulates this impact, with its positive phase significantly enhancing the ESS effect by altering atmospheric circulation, strengthening the coupling between spring snowmelt and summer soil moisture, and intensifying NEA heat extremes. This study underscores the critical role of ESS in driving atmospheric circulation over wide regions, and highlights the coupled impacts of multi-scale and multi-temporal climate variability.

How to cite: Yang, Y., You, Q., and Smith, T.: Dynamic Impacts of Eurasian Spring Snowmelt on Summer Heat Extremes in Northern East Asia, EGU General Assembly 2025, Vienna, Austria, 27 Apr–2 May 2025, EGU25-8597, https://doi.org/10.5194/egusphere-egu25-8597, 2025.

EGU25-8944 | ECS | Posters on site | CL4.4

How shallow and deep groundwater impact environmental parameters correlated with global heatwaves 

Anastasia Vogelbacher, Mehdi H. Afshar, Milad Aminzadeh, Kaveh Madani, Amir AghaKouchak, and Nima Shokri

Heatwaves present serious challenges to ecosystems, human health, and a wide range of socioeconomic activities. As the frequency and intensity of heatwaves increase, understanding the mechanisms driving their dynamics and interactions with land surface processes become more important. While extensive research has investigated the influence of various land and atmospheric parameters on heatwaves, less is known about how groundwater depth influences heatwave dynamics through their effects on soil moisture and surface evaporative fluxes (Vogelbacher et al., 2024, Sadeghi et al., 2012). To address this knowledge gap, we investigated how the groundwater depth affects the key parameters controlling heatwave dynamics on a global scale. Specifically, we developed more than 200,000 localized Artificial Intelligence (AI) models to represent the spatial distribution of heatwave frequency over the past 21 years across the world. For each model, a radius of 1.5 degrees (approximately 149 neighboring pixels) is considered in the computation to identify key parameters contributing to heatwaves in that region. We analyzed surface fluxes, as well as atmospheric, hydrological, and local environmental variables, to understand their correlation to heatwaves. Our findings suggest that geopotential height representing atmospheric drivers, is the key predictor of heatwave events in regions with deep groundwater tables (>100 m). In contrast, in areas with shallow groundwater (<10 m), surface fluxes emerge as important contributor to the onset of heatwaves. These findings highlight the less-discussed impact of groundwater depth on atmospheric processes and the important role of soil in linking groundwater and the atmosphere. Our results have important implications for water and land management, emphasizing the need for integrated approaches to understand and address the increasing risks posed by heatwaves.


References:
Sadeghi, M., Shokri, N., Jones, S.B. (2012). A novel analytical solution to steady-state evaporation from porous media. Water Resour. Res., 48, W09516, https://doi.org/10.1029/2012WR012060

Vogelbacher, A., Aminzadeh, M., Madani,K., Shokri, N. (2024). An analytical framework to investigate groundwater‐ atmosphere interactions influenced by soil properties. Water Resour. Res., 60, e2023WR036643. https://doi.org/10.1029/2023WR036643

How to cite: Vogelbacher, A., Afshar, M. H., Aminzadeh, M., Madani, K., AghaKouchak, A., and Shokri, N.: How shallow and deep groundwater impact environmental parameters correlated with global heatwaves, EGU General Assembly 2025, Vienna, Austria, 27 Apr–2 May 2025, EGU25-8944, https://doi.org/10.5194/egusphere-egu25-8944, 2025.

The global land carbon sink is reduced by climate change, in particular by extreme events such as droughts, heatwaves, and fires1,2. Soil moisture, including its feedback on atmospheric conditions (SA), was identified as one of key drivers of these climate extremes3-6 and contributes to the negative climate effects on the land carbon uptake7,8. However, the extent to which the total climate impact on land carbon uptake can be explained by SA feedback remains unknown. Here, we develop an analytical framework utilizing multiple factorial model experiments to show that SA feedback contributes more than half (–61.6 ± 10.4%) of the total climate effect on land carbon uptake at a global scale during 1981–2014, with the largest contributions from hot and dry regions. The strengthened SA feedback has shifted the climate impact on land carbon uptake from near-neutral during 1981–1997 to largely negative during 1998–2014, primarily by weakening photosynthesis. By the end of the twenty-first century, projected reductions in land carbon uptake caused by the SA feedback could even double under a high emission scenario relative to the historical period, driven by increased soil moisture variability. Our findings highlight that SA feedback will potentially dominate the response of long-term land carbon uptake to climate change.

How to cite: Zeng, Z.: Soil moisture-atmosphere feedback controls more than half of total climate effects on land carbon uptake, EGU General Assembly 2025, Vienna, Austria, 27 Apr–2 May 2025, EGU25-10175, https://doi.org/10.5194/egusphere-egu25-10175, 2025.

EGU25-12031 | ECS | Orals | CL4.4

Buffering of climate extremes within riparian forest corridors: a theoretical study with practical applications 

Myrtille Grulois, Sylvain Dupont, Caroline Bidot, Rémi Lemaire-Patin, and Jérôme Ogée

Riparian forests in tropical and temperate regions often act as climatic microrefugia for many species and taxa, buffering climate extremes relative to their surroundings. For example, during a summer heatwave, maximum air temperatures can vary by several degrees between the edge and the core of the riparian forest understory. This buffering of climate extremes within riparian corridors is well documented, but the processes behind it are not well understood because they involve complex turbulent air flows throughout the convective atmospheric boundary layer interacting with the forest canopy and landscape microtopography. To better understand how forest cover and microtopography influence the microclimate within and above riparian corridors, we performed in silico experiments using a 3-dimensional Large Eddy Simulation (LES) vegetation-atmosphere model to simulate air flows and microclimate below and above the trees, and across the entire convective boundary layer. Simulations were performed for different atmospheric stability conditions, and for different corridor widths. The tree species composition in the riparian corridor and its microtopography (slope, aspect) were chosen to be representative of an old-growth temperate riparian forest known to act as a climate refugium for European beech in south-west France. In this context, we first investigated the effect of microtopography alone on the air flows below and above the forest canopy during a typical summer heatwave. We also investigated the impact of replacing maritime pine plantations on the plateau with a strip of deciduous trees extending beyond the riparian corridor, with the aim to evaluate the minimum strip size required to mitigate climate extremes in the riparian understory.

How to cite: Grulois, M., Dupont, S., Bidot, C., Lemaire-Patin, R., and Ogée, J.: Buffering of climate extremes within riparian forest corridors: a theoretical study with practical applications, EGU General Assembly 2025, Vienna, Austria, 27 Apr–2 May 2025, EGU25-12031, https://doi.org/10.5194/egusphere-egu25-12031, 2025.

EGU25-12438 | Orals | CL4.4

Identifying regional drivers shaping daily maximum temperatures and their extremes   

Sarosh Alam Ghausi and Axel Kleidon

Daily maximum air temperatures (Tmax) are shaped by radiation, advection, atmospheric circulation, and land-surface processes, all interacting through complex feedbacks but essentially reflecting changes in the local surface energy budget. Here, we use a land-atmosphere systems approach to derive an analytical expression for daily maximum temperatures that depends solely on observed radiative and surface-evaporative conditions, requiring no additional parameters. We do this by accounting for the surface energy balance, heat storage variations within the lower atmosphere and explicitly constrain vertical turbulent exchange using the thermodynamic limit of maximum power. This approach reproduces observations very well with residual errors comparable to the reanalysis data. We then applied it to understand variations in Tmax and found that its day-to-day variability is predominantly shaped by shortwave cloud radiative effects and longwave water-vapor emissivity in the humid tropics, while heat advection and storage effects are the primary contributors in drier subtropics and high latitudes. Hot extremes, however, are mostly shaped by anomalies in land-surface characteristics including soil water stress and turbulent fluxes, with secondary contributions from heat advection and radiative effects. Both variability and extremes in the tropics were linked to changes in moisture, while the heat-storage and advective effects dominate in dry subtropics and high-latitude regions. These findings reveal the regional radiative and hydrological drivers of temperature variations within the thermodynamic energy budget and provide a baseline for understanding biases and inter-model variability in climate models. It can further help in assessing first-order changes in daily maximum temperatures due to various aspects of global change.

How to cite: Ghausi, S. A. and Kleidon, A.: Identifying regional drivers shaping daily maximum temperatures and their extremes  , EGU General Assembly 2025, Vienna, Austria, 27 Apr–2 May 2025, EGU25-12438, https://doi.org/10.5194/egusphere-egu25-12438, 2025.

EGU25-12862 | Orals | CL4.4

Tailoring Land Use, Land-Use Change, and Forestry (LULUCF) Impacts for Stakeholder-Centric Climate Policy 

Julia Pongratz, Suqi Guo, Felix Havermann, Michael Windisch, Steven De Hertog, Amali Amali, Fei Luo, Iris Manola, Quentin Lejeune, and Carl-Friedrich Schleussner

The land sector plays an important role in addressing global climate change: Land use, land-use change, and forestry (LULUCF) is currently responsible for about 10-15% of annual anthropogenic CO2 emissions, including the only notable origins of negative emissions to date; both emissions and removals aspects make LULUCF a key focus of future climate mitigation policies. However, LULUCF also acts via changing albedo, roughness and other surface properties and thus impacts the surface energy balance and water fluxes (the biogeophysical (BGP) effects). Through the BGP effects, LULUCF has a direct impact on local climate and may counteract global warming through local cooling and mitigate extreme weather events like heatwaves and droughts. LULUCF thus also plays a role in helping communities adapt to its effects.

However, decision-makers often focus only on direct emissions and carbon storage from LULUCF. These are called local biogeochemical (BGC) effects. To make sound climate policies, it is important to consider other processes of LULUCF as well: (i) Local BGP effects, which are BGP effects acting at the site the LULUCF happens; (ii) nonlocal BGP effects, which are remote climate changes caused by advection and large-scale changes in atmospheric circulation; (iii) nonlocal BGC effects, which are remote changes in carbon storage driven by the climate changes from nonlocal BGP effects.

The complexity of these LULUCF effects, with their different spatial scales and mechanisms, often prevents stakeholders from fully incorporating them into decision-making. In this study, we create a system that helps tailor the assessment of LULUCF effects to the specific concerns of different stakeholders. This system makes it possible to distinguish the combinations of LULUCF effects that should be considered in decision-making of different purposes: For example, the interest of a farmer will focus more on the local changes in climate (predominantly influenced by BGP effects) and additionally, if farmers get credits for emission reductions or CO2 removals, on local BGC effects. International negotiations under the UNFCCC, by contrast, focus predominantly on the combined local and nonlocal BGC effects.

In our study, we carefully identify different combinations of LULUCF effects exemplarily for 5 key stakeholders’ perspectives. We analyze model results from three advanced Earth system models to give an idea of how important the negligence or incorporation of one or the other LULUCF effect is. We do so for stylized large-scale scenarios of three common forms of LULUCF: global cropland expansion, global cropland expansion with irrigation, and global afforestation. We show that the answer to whether or not a LULUCF change brings desirable effects to climate and may help mitigation and/or adaptation is very much dependent on the perspective, with our system providing a tool to translate between the different perspectives.

This study gives a detailed look at how LULUCF affects both climate and the carbon cycle, providing a foundation for incorporating these impacts into policy at different levels. It helps guide climate action that balances land use with the Sustainable Development Goals, especially considering the growing interest in nature-based solutions for future climate strategies.

How to cite: Pongratz, J., Guo, S., Havermann, F., Windisch, M., De Hertog, S., Amali, A., Luo, F., Manola, I., Lejeune, Q., and Schleussner, C.-F.: Tailoring Land Use, Land-Use Change, and Forestry (LULUCF) Impacts for Stakeholder-Centric Climate Policy, EGU General Assembly 2025, Vienna, Austria, 27 Apr–2 May 2025, EGU25-12862, https://doi.org/10.5194/egusphere-egu25-12862, 2025.

EGU25-13001 | ECS | Orals | CL4.4

The delayed onset of South American monsoon under global warming in convection-permitting regional climate simulations. 

Jerry B Samuel, Marcia T Zilli, Neil C G Hart, and Fran Morris

Under a warmer scenario, several monsoon regimes are projected to have a delayed onset
of the rainy season. We employ state-of-the-art convection permitting regional climate
model (CPRCM) simulations performed at the UK Met Office to explore potential drivers of
this projected delay over South America. The simulations correspond to a present-day
climate (CPRM-PD) and an RCP8.5 scenario (CPRCM-2100). CPRCM-PD is downscaled
from an atmospheric general circulation model (AGCM) simulation forced with sea surface
temperatures (SSTs) for the period 1998-2007. CPRCM-2100 is driven by an AGCM
simulation forced with SSTs and greenhouse gas concentrations corresponding to an
RCP8.5 scenario. In CPRCM-2100, the onset of the rainy season is delayed, with several
regions exhibiting a delay of up to one month. The rainfall during September and October
shows approximately 50% decline over Central East Brazil, accompanied by coherent
changes in atmospheric thermodynamics. A larger relative increase in near-surface moist
static energy (MSE) is required of atmospheric destabilization in the RCP8.5 scenario, which
however, crosses the necessary threshold for significant rainfall to begin only in late
October/early November. The increase in MSE is primarily due to low-level moisture
enhancement during the onset phase which is also found to be delayed in the RCP8.5
scenario. Precipitation-moisture relationship over the region during the onset phase
indicates a 20% increase (relative to present-day) in near-surface specific humidity
requirement for a daily rainfall rate of 5 mm/day in the RCP8.5 scenario. However, there is a
substantial reduction in evapotranspiration during September and October, in addition to
the absence of any significant changes in moisture flux convergence. This hampers the
moisture build-up and delays the transition to the rainy season in these months. The decline
in evapotranspiration is despite larger soil moisture content in the soil column which
suggests reduced plant transpiration. An increase in stomatal closure in the future
environmental conditions leads to this decline in the RCP8.5 simulation. These changes are
also accompanied by changes in both surface and top of the atmosphere energy fluxes. The
results call for the urgency to develop land use policies to mitigate climate change effects,
given the increasing intensity of droughts in Brazil during recent times. The findings also
highlight the role of local processes in modulating climate projections and the necessity to
improve their representation in climate models.

How to cite: Samuel, J. B., Zilli, M. T., Hart, N. C. G., and Morris, F.: The delayed onset of South American monsoon under global warming in convection-permitting regional climate simulations., EGU General Assembly 2025, Vienna, Austria, 27 Apr–2 May 2025, EGU25-13001, https://doi.org/10.5194/egusphere-egu25-13001, 2025.

EGU25-13687 | Orals | CL4.4

What is the compound effect of re/af-forestation and extreme heat on summer land-atmosphere coupling across Europe?    

Rita M. Cardoso, Luana C. Santos, Elena García Bustamante, Daniela C.A. Lima Lima, Pedro MM Soares, Carlos da Camara Camara, Diana Rechid, and Ana Russo and the Lucas Team

Through soil moisture and vegetation exchanges, land-atmosphere coupling contributes significantly to the evolution of extreme events. Land use/land cover changes (LUC) modify local land surface properties that control the land-atmosphere mass, energy, and momentum exchanges. The Flagship Pilot Study LUCAS (Land Use & Climate Across Scales) provides a coordinated effort to study LUC using an ensemble of 11 regional climate models (RCMs). In the first phase of the project, three reanalyses-driven experiments were performed for continental Europe: eval (with each RCM using its standard land use / land cover distribution), forest (maximised forest cover), and grass (trees replaced by grassland. An analysis of the impact on the coupling between temperature and evapotranspiration is performed using the usual correlation metric, while a new coupling metric based on the product of normalised variables was developed to analyse the coupling between extreme heat (TX90p) or heat wave (TX90p for at least five consecutive days) and evapotranspiration (LH) or soil moisture (TX90p*LH or TX90p*SMOIS). Whenever its values are lower than -1, then LH (SMOIS) is concurrently in deficit, and soil is uncoupled from the atmosphere. Conversely, when its values are greater than 1, then land-atmosphere coupling occurs.

For all RCMs, a positive correlation between near-surface maximum temperature and latent heat prevails over northern Europe, while the negative correlation dominates over southern and southeastern Europe. Forestation (forest-grass) will lead to higher correlations between latent heat and near-surface maximum temperature due to the different transition zone belt locations and weaker correlations in the grass experiment.

Extreme heat and evapotranspiration are positively coupled in forests across the whole continent except in the Mediterranean.  In the grass experiment, the Mediterranean areas are negatively coupled in most models, whilst northern Europe is positively coupled. This coupling (positive/negative) is amplified under heat wave events. Overall, forestation induces increased coupling in central Europe.  In the forest experiment, extreme temperature and soil moisture are negatively coupled across Europe, indicating that the increase in evapotranspiration is associated with the ability of the trees to source water from deeper soil layers.  In the grass experiment, the ensemble mean shows very weak un/coupling in central/ southern Europe, indicating the inability of grasses to source water in deeper soil layers and a broadening of the transition zone.


Acknowledgements

The authors wish to acknowledge the financial support  from the Portuguese Fundação para a Ciência e Tecnologia, (FCT, I.P./MCTES) through national funds (PIDDAC): UID/50019/2025 and LA/P/0068/2020 (https://doi.org/10.54499/LA/P/0068/2020), DHEFEUS (https://doi.org/10.54499/2022.09185.PTDC), and through project references https://doi.org/10.54499/UIDB/00239/2020, https://doi.org/10.54499/UIDP/00239/2020 ,  LS, RMC, AR, and DCAL are supported by FCT, financed by national funds from the MCTES through grant UI/BD/154675/2023, and https://doi.org/10.54499/2021.01280.CEECIND/CP1650/CT0006, https://doi.org/10.54499/2022.01167.CEECIND/CP1722/CT0006, and https://doi.org/10.54499/2022.03183.CEECIND/CP1715/CT0004, respectively

How to cite: Cardoso, R. M., Santos, L. C., García Bustamante, E., Lima, D. C. A. L., Soares, P. M., Camara, C. D. C., Rechid, D., and Russo, A. and the Lucas Team: What is the compound effect of re/af-forestation and extreme heat on summer land-atmosphere coupling across Europe?   , EGU General Assembly 2025, Vienna, Austria, 27 Apr–2 May 2025, EGU25-13687, https://doi.org/10.5194/egusphere-egu25-13687, 2025.

EGU25-13907 | ECS | Posters on site | CL4.4

How do land-use changes shape the occurrence of extreme temperatures across Europe?    

Luana Santos, Rita Cardoso, Elena García Bustamante, Daniela C.A. Lima, Pedro MM Soares, Carlos da Camara, Diana Rechid, and Ana Russo and the Lucas Team

In recent years, an increase in the frequency of occurrence of heatwaves and in the number of hot days in Europe is undeniable. Hence, there is an increased need to understand the feedback mechanisms relevant to their development. Due to their localised impact and although they modify local land surface properties that control the land-atmosphere mass, energy, and momentum exchanges, the influence of land use/land cover changes (LUC) at regional scales still needs to be better represented in coordinated downscaling experiments. The Flagship Pilot Study LUCAS (Land Use & Climate Across Scales) provides a coordinated effort to study LUC using an ensemble of 11 regional climate models (RCMs). In the first phase of the project, three experiments were performed for continental Europe: eval (current climate), grass (trees replaced by grassland), and forest (grasses and shrubs replaced by trees). Heat events can be defined using percentiles, and heat waves are periods of consecutive hot days where temperatures exceed a certain percentile. Here, we use P85, P90 and P95 for maximum temperature thresholds and consider durations of 5, 7, and 10 days.  To facilitate the comparison of the intensity of these extreme events and their evolution over time, we normalise the daily maximum temperature, latent heat and soil moisture using a seasonal interquartile range. An analysis of frequency, magnitude, duration and extension is performed for the three percentiles and for the different land covers.

The results suggest that model responses to afforestation and deforestation exhibit some variability, particularly during summer months. While a substantial proportion of the models indicate a potential enhancement in the intensity and magnitude of heat extremes under forest scenarios, others demonstrate more muted or contrasting effects. The objective of the present analysis is to understand these discrepancies among models and their implications for land-atmosphere interactions under various land use scenarios. The findings will be discussed in terms of their relevance to climate extremes, providing insights into the role of LUC in modulating heat events across Europe.

How to cite: Santos, L., Cardoso, R., García Bustamante, E., Lima, D. C. A., Soares, P. M., Camara, C. D., Rechid, D., and Russo, A. and the Lucas Team: How do land-use changes shape the occurrence of extreme temperatures across Europe?   , EGU General Assembly 2025, Vienna, Austria, 27 Apr–2 May 2025, EGU25-13907, https://doi.org/10.5194/egusphere-egu25-13907, 2025.

EGU25-14418 | Posters on site | CL4.4

Estimating the impact of irrigation and groundwater pumping on regional hydroclimate using an Earth System Model 

Yusuke Satoh, Yadu Pokhrel, Hyungjun Kim, Tomohiro Hajima, and Tokuta Yokohata

Irrigation is a significant anthropogenic forcing to the Earth system, altering water and heat budgets at the land surface and inducing changes in regional hydro-climate conditions across various spatiotemporal scales. These impacts of irrigation are expected to intensify in the future due to growing food demand and the pervasive effects of climate change. Therefore, it is imperative to better understand its nature, extent, and mechanisms through which irrigation affects the Earth system. However, despite its increasing importance, irrigation remains an emerging component in Earth system modeling community, necessitating further advancements in modeling approaches and a deeper understanding.

Our research aims to improve the quantitative understanding of how irrigation and groundwater use, as anthropogenic drivers, affect regional climate and environmental changes. To achieve this, we developed an enhanced Earth system modeling framework based on MIROC-ES2L (Hajima et al., 2020, GMD), integrated with hydrological human-activity modules (Yokohata et al., 2020, GMD). This framework enables simulations of coupled natural-human interactions, including hydrological dynamics associated with irrigation processes. Using this Earth system model, we carried out numerical experiments at T85 spatial resolution with an AMIP-style setup. Our large ensemble simulations allow statistical quantification of irrigation impacts, statistically distinguishing them from uncertainties arising due to natural variability.

Our investigation identified specific regions and seasons where irrigation exerts notable influences on regional hydro-climate. In particular, our results reveal substantial disparities—comparable to or exceeding inter-annual variability—between simulations with and without irrigation processes, especially in heavily irrigated regions such as Pakistan and India. Our model demonstrates that artificially wet soils due to irrigation alter the land surface hydrological balance, which consequently impacts the overlying atmosphere. However, significant uncertainties remain in the impact estimates for several variables in some regions, even those heavily irrigated, including the central United States and eastern China. This highlights the necessity of employing appropriate statistical approaches to evaluate irrigation impacts, accounting for inherent natural variability.

Additionally, our study estimates regional variations in the contributions of groundwater and surface water use to irrigation impacts. Our estimate indicates that approximately two-fifths of global irrigation water depend on groundwater resource, while this groundwater dependency ratio may still be underestimated. By emphasizing the importance of understanding regional and seasonal characteristics, our study underscores the importance of comprehending the complex interactions between irrigation-related human activities and the Earth's climate system. Nevertheless, we may still underestimate the full impacts of irrigation because irrigation water demand estimated by our coupled simulations is lower than that derived from preceding offline simulations or reported statistics. In this presentation, we will discuss this challenge as well.

How to cite: Satoh, Y., Pokhrel, Y., Kim, H., Hajima, T., and Yokohata, T.: Estimating the impact of irrigation and groundwater pumping on regional hydroclimate using an Earth System Model, EGU General Assembly 2025, Vienna, Austria, 27 Apr–2 May 2025, EGU25-14418, https://doi.org/10.5194/egusphere-egu25-14418, 2025.

Human activities have a significant impact on the climate by altering vegetation types and modifying surface properties, resulting in more frequent and intense extreme weather events, which pose a threat to the sustainable development of the environment. However, the specific effects of vegetation change on extreme temperature events are not fully understood. To address this gap, we conducted evaluations with both in-situ observations and the regional climate model to determine the contributions of different vegetation transitions to extreme temperature changes over China. Our findings indicate that vegetation plays an important role in local heatwaves. Cropland have a stronger heating effect than grassland and forests in lifting the daily maximum temperature but present shorter hot day durations. Uncertainties are high in grassland than those of forest due to more diverse background climatic conditions of grassland sites. Numerical simulations revealed a decrease in extreme temperatures such as a 0.85℃ decrease in the daily maximum temperature and 2.65 fewer hot days, which can be attributed to changes of cloud radiation and sensible heat flux resulting from large-scale deforestation in the southern region and cropland expansion in central China. Converting forests to woody savannas led to a significant reduction in leaf area index and latent heat flux in the southern and northeastern regions. Changes in surface property have a stronger relationship with the average temperature changes than with extreme temperature changes. Overall, our study quantitatively evaluates the impact of different vegetation types and their property changes on regional extreme temperature changes, which have important implications for ecological protection and policy-making in China.

How to cite: Dong, N. and Liu, Z.: Comparing responses of summer extreme temperature to vegetation changes in China between satellite observations and numerical simulations, EGU General Assembly 2025, Vienna, Austria, 27 Apr–2 May 2025, EGU25-14702, https://doi.org/10.5194/egusphere-egu25-14702, 2025.

EGU25-15325 | ECS | Posters on site | CL4.4

Role of Pre-Monsoon Showers in the Evolution of Indian Heatwaves 

Manali Saha, Vishal Dixit, and Karthikeyan Lanka

Heatwaves constitute one of the most lethal weather phenomena, presenting substantial risks to millions of individuals. Characterized by extended periods of extreme temperatures, these events significantly impact ecosystems, economies, and human mortality rates. When coupled with high humidity, these events pose high heat stress over the heatwave domain. India, being one of the significant hotspots, experiences heatwaves during the pre-monsoon season. These heatwaves are associated with both moist and dry mechanisms. Moist heatwaves have high wet bulb temperatures and cause high fatalities among humans and mammals. With high population loading and the context of climate change, the origin or source of these moist heat waves has not been examined thoroughly till now. 

In the study, we investigate the precursors of the moist and dry heat waves in the Indo-Gangetic Plains using the Eulerian temperature decomposition equation to find out the dominant processes responsible for the formation of these events. The past literature says that advection is the major component in triggering these events, but our analysis proves that the effect of advection is minimal and supports the weak temperature gradient (WTG) theory in the tropics. To study the precursors, we extend our analysis from the pre-heatwave time to the onset of the heatwaves. Our analysis shows that pre-monsoon showers are responsible for forming moist heat waves. These showers are associated with nighttime low-level clouds that trap the outgoing long-wave radiation, further accumulating the heat content and causing the temperatures to rise. Further, these rainfall activities must be supported by the mid-tropospheric dryness (MTD) for it to be sustained throughout the period. The MTD helps the low-level clouds resulting from shallow convection remain as they are and does not promote deep convection. We emphasize the importance of local atmospheric conditions along with large-scale activities (that trigger anticyclones in the upper troposphere) in sustaining the heatwave intensity. The findings of this study will help in developing heatwave early warning systems at localized scales.

Keywords: Moist heatwaves, Pre-Monsoon showers, Mid Tropospheric Dryness, Weak Temperature Gradient, Advection

How to cite: Saha, M., Dixit, V., and Lanka, K.: Role of Pre-Monsoon Showers in the Evolution of Indian Heatwaves, EGU General Assembly 2025, Vienna, Austria, 27 Apr–2 May 2025, EGU25-15325, https://doi.org/10.5194/egusphere-egu25-15325, 2025.

EGU25-15489 | ECS | Orals | CL4.4

Revisiting the link between soil moisture deficits and heatwaves 

Dominik L. Schumacher, Emanuele Bevacqua, Mathias Hauser, and Sonia I. Seneviratne

Severe heatwaves tend to strike during drought conditions, primarily considered a consequence of persistent, often quasi-stationary anticyclonic circulation. A key mechanism for heatwave intensification is the positive feedback between rapidly desiccating soils through elevated atmospheric evaporative demand and the associated enhanced surface sensible heating. The effect of such enhanced sensible heating is often quantified by comparing the evolution of heatwaves in climate model simulations with freely evolving soil water to additional simulations in which soil moisture is kept at climatological levels, and can reach up to several degrees Celsius. With this approach, one can gauge the effect of deviations from present-day average soil moisture, but this becomes increasingly hypothetical as we shift away from climatological norms and toward a future marked by widespread projected increases in agro-ecological drought during summer months. In such a climate change context, a general key question to address is: How does heatwave intensity depend on the initial state of soil moisture? To investigate this, we re-simulate historical heatwaves using CESM2, a state-of-the-art global Earth System Model, and examine how these events would have unfolded under different land surface conditions. We also explore the long-noted — yet never fully quantified — effect of soil drought on anticyclonic circulation itself.

How to cite: Schumacher, D. L., Bevacqua, E., Hauser, M., and Seneviratne, S. I.: Revisiting the link between soil moisture deficits and heatwaves, EGU General Assembly 2025, Vienna, Austria, 27 Apr–2 May 2025, EGU25-15489, https://doi.org/10.5194/egusphere-egu25-15489, 2025.

EGU25-16332 | Orals | CL4.4

How much does afforestation’s impact on local land surface temperature vary in space, in time, and during dry and hot extreme events?  

Gregory Duveiller, Daniel E. Pabon-Moreno, Luca Caporaso, Daniel Loos, Di Xie, Melanie Weynants, Alexander J. Winkler, and Alessandro Cescatti

Changing the properties of the land surface may be one of the most direct ways to modulate local (and possibly non-local) land-atmosphere interactions, which in turn is of great interest for designing proper land-based climate mitigation and adaptation strategies. When we change the type of vegetation across a landscape, the biophysical properties of that land surface will change, potentially altering both radiative and non-radiative fluxes. Land surface temperature (LST), as measured from remote sensing satellites, provides a useful diagnostic, integrating the effects of these changes in fluxes. When combined with space-for-time substitution approaches, it is possible to derive data-driven estimations of what a given land cover transition could lead to in terms of LST before the actual land cover change occurs. However, the interannual variability of such biophysical effects of land use and land cover change is still understudied, which is an important prerequisite to understand the role these effects may have in alleviating or aggravating the occurrence and impacts of extreme events. 

In this study we present a global analysis of potential afforestation on local afternoon clear-sky LST across the MODIS Aqua record (from 2002 until 2024). This allows us to explore the interannual variability of local increases in forest cover on local LST, which in turns helps us estimate the sensitivity of the effects of afforestation in a changing climate. By combining these results with a dedicated dataset identifying hot and dry extremes from ERA5, we further explore how the effect of afforestation on LST changes under extreme conditions, which the trees would be increasingly more susceptible to encounter once they reach maturity.

Additionally, we take the opportunity to present the processing pipeline that has been developed within the Open-Earth-Monitor cyberinfrastructure (OEMC) project to make such analysis possible and reproducible. This includes improvements to better handle local topographic effects and testing the capacity to run the entire pipeline within a Discrete Global Grid System (DGGS) framework that preserves area and neighbourhood properties within the space-for-time moving window. We expect that these tools will facilitate data integration and model evaluation, thereby assisting research in land-atmosphere interactions and climate extremes.

How to cite: Duveiller, G., Pabon-Moreno, D. E., Caporaso, L., Loos, D., Xie, D., Weynants, M., Winkler, A. J., and Cescatti, A.: How much does afforestation’s impact on local land surface temperature vary in space, in time, and during dry and hot extreme events? , EGU General Assembly 2025, Vienna, Austria, 27 Apr–2 May 2025, EGU25-16332, https://doi.org/10.5194/egusphere-egu25-16332, 2025.

EGU25-16372 | Orals | CL4.4

On the definition of extreme evaporation events 

Yannis Markonis

Even though evaporation is a crucial component of the energy and water cycles, its extremes remain largely unexplored. To address this gap, this study introduces a statistical framework defining Extreme Evaporation Events (ExEvEs) as individual events with onset and termination. Despite their statistical definition, ExEvEs are shown to have a physical basis, as they relate to radiation and/or precipitation—the main energy and water sources for land evaporation. By applying this methodological approach over Czechia, we can see that ExEvEs tend to form clusters of heightened evaporation lasting several days which fluctuate differently than the average evaporation resulting to significant implications for water availability and regional water cycle's acceleration. The proposed event-based framework provides a systematic way to detect, characterize, and analyse evaporation extremes, which helps to improve our understanding of their drivers and impacts.

How to cite: Markonis, Y.: On the definition of extreme evaporation events, EGU General Assembly 2025, Vienna, Austria, 27 Apr–2 May 2025, EGU25-16372, https://doi.org/10.5194/egusphere-egu25-16372, 2025.

EGU25-16413 | Posters on site | CL4.4

A Holistic Multi-Index Approach to Quantify Land Feedback Strength Across Evapotranspiration Regimes 

Sandipan Paul and Karthikeyan Lanka

Soil moisture (SM) is a critical Earth system variable that regulates the cyclicity of water, energy, and carbon, through which SM determines the evolution and thermodynamic state of the atmosphere. Land and atmospheric is tightly coupled in the water-limited regime (WLR), while the coupling strength diminishes in the energy-limited regime (ELR). Specifically, in response to progressive SM drying in the WLR, SM fractionates the net insolation into a greater proportion of sensible heat flux (SHF) and a smaller amount of latent heat flux (LHF), owing to the depletion of moisture. This phenomenon results in reduced land surface cooling, increased air temperature, expansion of the boundary layer, and subsequently enhances the land-atmosphere feedback. Further continuation of SM depletion leads to dry hydroclimatic extremes such as droughts and heatwaves. Consequently, understanding regime-specific coupled water-energy dynamics is fundamental to comprehending such extremes.

We propose a new metric called Land Feedback Strength (LFS) that combines three indices: sensitivity index (SI), variability index (VI) and regime persistence index (RPI). This formulation over the past attempts facilitates to effectively characterise the important components of LFS, which holistically quantify the terrestrial leg of land-atmospheric coupling. SI quantifies the responsiveness of SM to surface energy partitioning and is defined as the slope between SM and EF (LHF/LHF+SHF) in the WLR. Specifically, we observe higher SM sensitivity in semi-arid and sub-humid regions than in wet regions, indicating that the landscape rapidly responds to SM losses and begins influencing the atmosphere instantaneously. In addition, VI quantifies the sufficiency of SM to act as a dominant forcing and is calculated as the ratio of the standard deviation of SM in the WLR to WLR and ELR. While strong coupling is expected where higher sensitivity and sufficient SM variation are present, the coupling strength is exacerbated with the increasing persistence of the WLR. Thus, the RPI is formulated to indicate the likelihood of a landscape remaining in the WLR within a certain period. Furthermore, to quantify the LFS, we initially delineate global regimes using the coverability of SM and EF data pairs during drydowns.

This study’s findings indicate the following: (1) the highest sensitivity is observed during the dry seasons, whereas sensitivity is lowest during the summer; (2) SM variability is predominantly confined to WLR during winter and spring, with approximately equal variability in both regimes noted during autumn, and variability predominantly occurring in ELR during summer; (3) ELR is prevalent during summer in response to precipitation pulses, WLR and ELR demonstrate comparable likelihood in autumn, and WLR becomes predominant during winter and spring; (4) consequently, LFS is at its lowest during summer, increases in autumn, and further intensifies in winter; (5) LFS has facilitated the identification of two groups of strong coupling hotspots – with relatively higher intensity over the western USA and Austrian shrubland, African and Brazilian savannah, and lower intensity over Sahelian grassland, and peninsular India (6) LFS is found to be higher in semi-arid and sub-humid regions or savanna and grassland areas than forested or humid regions.

How to cite: Paul, S. and Lanka, K.: A Holistic Multi-Index Approach to Quantify Land Feedback Strength Across Evapotranspiration Regimes, EGU General Assembly 2025, Vienna, Austria, 27 Apr–2 May 2025, EGU25-16413, https://doi.org/10.5194/egusphere-egu25-16413, 2025.

EGU25-16565 | ECS | Orals | CL4.4

Expanding Amazon dry-hot season under anthropogenic climate change 

Mengxin Pan, Shineng Hu, Mark M. Janko, Benjamin F. Zaitchik, and William K. Pan

The Amazon rainforest, a crucial global carbon sink, plays a vital role in the global climate system. As ongoing climate change and local deforestation push the Amazon toward a critical tipping point, understanding the region's changing climate patterns becomes increasingly important. In this study, we reveal a significant expansion of the dry-hot season across the Amazon rainforest from 1980-2022, creating prolonged adverse climate conditions for the ecosystem and local communities. A machine learning clustering algorithm is used to define the dry-hot season automatically by considering the temperature, precipitation, and soil moisture simultaneously.

The land-atmosphere interaction predominates the dry-hot season expansion in the Amazon. During the dry season (Aug-Oct), the daily maximum temperature has warmed by ~1 degree per decade, much faster than that in the wet seasons (~0.4 degree per decade). By the surface heat budget analysis, we found that intensive dry-season warming is predominantly driven by reduced evapotranspiration, leading to decreased surface latent heat flux and increased shortwave radiation due to diminished cloud cover. The declining evapotranspiration rates stem from a combination of increasing soil moisture deficits and local deforestation.

By large-ensemble climate model simulations, we further demonstrate that this dry-hot season expansion is highly unlikely to occur without anthropogenic climate change and this expansion will exacerbate under future warming scenarios. By single-forcing experiment, we further confirm the critical role of local deforestation in amplifying this expansion. These findings emphasize the urgent need for targeted mitigation and adaptation strategies to protect this vital ecosystem from the compounding effects of climate change and deforestation.

How to cite: Pan, M., Hu, S., Janko, M. M., Zaitchik, B. F., and Pan, W. K.: Expanding Amazon dry-hot season under anthropogenic climate change, EGU General Assembly 2025, Vienna, Austria, 27 Apr–2 May 2025, EGU25-16565, https://doi.org/10.5194/egusphere-egu25-16565, 2025.

EGU25-16957 | Orals | CL4.4

Heat capacity, cooling efficiency and drought stress of vegetated surfaces 

Matteo Zampieri, Matteo Piccardo, Guido Ceccherini, Marco Girardello, Ibrahim Hoteit, and Alessandro Cescatti

Drought stress has profound impacts on ecosystems and societies, particularly in the context of climate change. Traditional drought indicators, which rely on integrated surface water budget anomalies at various time scales and thresholds derived from past climate variability, provide valuable insights but often fail to deliver clear and direct real-time assessments of drought stress on vegetation.

This study introduces the Cooling Efficiency Factor (CEF), a novel metric derived from geostationary satellite observations, to detect drought stress by analyzing daytime surface warming anomalies. The CEF is based on the principle that dry surfaces warm more rapidly than wet ones under identical radiative forcing due to reduced evapotranspiration caused by soil moisture limitation and by stomatal closure, altering the effective heat capacity of the land surface.

By leveraging high-frequency, high-resolution retrievals of land surface temperature (LST) and radiation data from geostationary satellites, this study demonstrates the CEF's ability to assess drought stress conditions. The CEF correlates strongly with evapotranspiration anomalies from established datasets, including GLEAM, ERA5-Land, and TerraClimate. Results underscore the CEF's sensitivity to vegetation type, soil moisture variability, and environmental conditions, illustrating its effectiveness in identifying drought stress compared to traditional indicators.

The CEF represents a promising tool for real-time drought monitoring and integration into early warning systems, particularly for arid and semi-arid regions. By complementing existing drought assessment methods, the CEF paves the way for advancements in land-surface process studies and improved drought risk management.

How to cite: Zampieri, M., Piccardo, M., Ceccherini, G., Girardello, M., Hoteit, I., and Cescatti, A.: Heat capacity, cooling efficiency and drought stress of vegetated surfaces, EGU General Assembly 2025, Vienna, Austria, 27 Apr–2 May 2025, EGU25-16957, https://doi.org/10.5194/egusphere-egu25-16957, 2025.

EGU25-17114 | ECS | Orals | CL4.4

Increases in extreme ET leading to a higher risk of flash droughts 

Marius Egli, Vincent Humphrey, Sebastian Sippel, and Reto Knutti

Evapotranspiration (ET) is a crucial process liking the surface energy balance, the hydrological and the carbon cycles. However, ET often remains underexplored due to climate model limitations as well as sparse and poor observational coverage.

While mean ET projections of CMIP6 models are highly uncertain, we explore whether climate models are in clearer agreement in terms of extreme ET, similar to what has been shown for mean versus extreme precipitation. We first define extreme ET (ETxx) as the annual 7-day ET maximum and investigate the physical drivers behind such events in a mid-latitude region (Central Europe). Typically, extreme ET events are characterized by high temperatures and incoming surface radiation, characteristic of a heat wave.  

We find an increase in extreme ET during the recent historical period and throughout scenario SSP5-8.5 in most CMIP6 models, together with a shift of these extremes from summer towards spring. We also find a higher degree of climate model agreement in the ET extremes, partially due to constraints in the boundary conditions of such an event, meaning that the drivers behind an extreme ET event are better constrained than the drivers of annual mean ET. This is a somewhat expected result due to the increase in vapor pressure deficit with higher temperature. The agreement also extends to all considered observational products, which agree on an increase in extreme ET, however the magnitude of this increase remains uncertain across observations-based products. We find that the observed trends lie outside the likely range of trends found in unforced climate simulations, indicating that the recent shift in observed extreme ET is attributable to climate change. We further find that records in extreme ET have been disproportionally set in more recent years, compared to what would be expected in a stationary climate in both observations and CMIP6 models.

Overall, mean ET projections and trends are complex and notoriously uncertain. Here we show that extreme ET events are better constrained than mean ET projections, making them a natural target for more robust inference from observations, attribution studies and emergent constraints. Our findings indicate an elevated risk for flash drought due to higher evaporative demand. The fact that future changes in peak water demand are less uncertain than changes in the mean demand is a highly relevant information for decision-makers and for the design of future water supply infrastructure (such as irrigation systems).

How to cite: Egli, M., Humphrey, V., Sippel, S., and Knutti, R.: Increases in extreme ET leading to a higher risk of flash droughts, EGU General Assembly 2025, Vienna, Austria, 27 Apr–2 May 2025, EGU25-17114, https://doi.org/10.5194/egusphere-egu25-17114, 2025.

EGU25-18334 | ECS | Posters on site | CL4.4

Assessing soil moisture-induced changes in land carbon sink projections of CMIP6 models 

Lea Gabele, Petra Sieber, Mathias Hauser, Martin Hirschi, and Sonia Seneviratne

The terrestrial biosphere absorbs about one third of anthropogenic carbon dioxide emissions and thereby dampens human-induced climate change. However, its capacity to act as a carbon sink depends on climate conditions, including temperature and water availability. Uncertainties in both future climate conditions and the response of the terrestrial biosphere lead to greatly diverging projections of the land carbon sink among state-of-the-art Earth System Models (ESMs).

Previous research identified soil moisture (SM) as a critical factor that can restrict land carbon uptake through water limitation and the intensification and prolongation of heat extremes. Green et al. (2019) demonstrated the severe negative impact of reduced SM on long-term land carbon sink projections of the 5th Coupled Model Intercomparison Project (CMIP5) using dedicated experiments isolating the effects of SM.

Here, we use equivalent experiments performed with four ESMs participating in CMIP6 to investigate the impact and uncertainty of SM-induced changes in land carbon sink projections by the end of the century (2070-2099). Our results demonstrate a substantial reduction in the negative impact of SM on the global land carbon sink compared to the previous model generation. Models agree on a SM-induced reduction in land carbon uptake in summer, consistent with an overall SM decline across models, while intermodel uncertainty remains high in spring, particularly regarding the effects of SM variability at mid-to-high latitudes. Additionally, high uncertainty in SM-induced impact on annual carbon uptake persists in the tropics and northern mid-latitudes, driven by differences in the sensitivity of carbon uptake to SM but also disagreement in SM projections across models.

We extend our analysis to a larger ensemble of CMIP6 models that have not performed the SM experiments. To this end, we employ the methods of Schwingshackl et al. (2018), which utilize the distinct link between SM and the evaporative fraction in the different SM regimes. Using this relationship we emulate the impact of SM on the land carbon sink in regions where land carbon uptake is controlled by SM.

The study aims to gain insights into SM-induced impacts and related uncertainties in land carbon sink projections of CMIP6 models, highlighting the ongoing challenge of accurately projecting SM-induced changes in the land carbon sink.


References:


Green, J. K., Seneviratne, S. I., Berg, A. M., Findell, K. L., Hagemann, S., Lawrence, D. M., & Gentine, P. (2019). Large influence of soil moisture on long-term terrestrial carbon uptake. Nature, 565(7740), 476-479. https://doi.org/10.1038/s41586-018-0848-x 

Schwingshackl, C., Hirschi, M., & Seneviratne, S. I. (2018). A theoretical approach to assess soil moisture–climate coupling across CMIP5 and GLACE-CMIP5 experiments. Earth System Dynamics, 9(4), 1217-1234. https://doi.org/10.5194/esd-9-1217-2018

How to cite: Gabele, L., Sieber, P., Hauser, M., Hirschi, M., and Seneviratne, S.: Assessing soil moisture-induced changes in land carbon sink projections of CMIP6 models, EGU General Assembly 2025, Vienna, Austria, 27 Apr–2 May 2025, EGU25-18334, https://doi.org/10.5194/egusphere-egu25-18334, 2025.

EGU25-19778 * | ECS | Orals | CL4.4 | Highlight

Observed and projected increase of extreme precipitation events on dry soils 

Damián Insua Costa, Chiara M. Holgate, and Diego G. Miralles

Dry soils are associated with low infiltration capacity and increased runoff due to surface crust formation. Therefore, the occurrence of heavy rainfall on dry soils poses a higher risk of flooding. In recent years, abrupt changes from extremely dry to extremely wet conditions have attracted the attention of researchers, and terms such as precipitation whiplash or precipitation volatility have gained currency to refer to these phenomena. Most studies have focused on investigating these episodes on seasonal or annual scales, i.e. changes from very dry to very wet seasons or years. Here, we focus on analysing these events on a daily scale, i.e. the change from very dry to very wet conditions from one day to the next. For this purpose, dry conditions are detected using a threshold in soil moisture and not the rainfall deficit, which would be meaningless on a daily scale. We argue that this approach is more closely related to flash flood risk. Our results based on reanalysis data show that the global frequency of extreme precipitation events on dry soils has increased dramatically in recent decades, at a rate higher than predicted by historical climate model simulations. Furthermore, we show that this trend will continue to increase based on future projections. Specifically, we estimate that the global probability of such an event will more than double by the end of the present century compared to the pre-industrial era under a high-emissions scenario. Finally, we shed light on whether this trend is dominated by an increase in the probability of occurrence of extreme precipitation and dry soils independently, or rather is related to an increase in the probability of concurrence of both, which could be indicative of a negative soil moisture–precipitation feedback.

How to cite: Insua Costa, D., M. Holgate, C., and G. Miralles, D.: Observed and projected increase of extreme precipitation events on dry soils, EGU General Assembly 2025, Vienna, Austria, 27 Apr–2 May 2025, EGU25-19778, https://doi.org/10.5194/egusphere-egu25-19778, 2025.

EGU25-1822 | ECS | Posters on site | AS3.44

Global CO2 flux estimation using NISMON-CO2 and GOSAT for carbon cycle analysis improvement 

Suman Maity, Yosouke Niwa, Tazu Saeki, Yu Someya, and Yukio Yoshida

Accurate estimation of carbon dioxide (CO2) flux is essential for better understanding of the global carbon budget and its impact on climate changes, which would further suggest strategies for emission reduction. Bottom-up approaches, while fundamental, often face challenges in capturing the complexities of CO2 fluxes due to uncertainties in emission inventories and limitations in representing spatio-temporal variability of CO2 flux across diverse regions. In contrast, top-down methods, which combine simulations and observations with inverse modeling approach, offer powerful tools for dynamically constraining CO2 flux estimates. In comaparison to limited in-situ observations, satellite provides broader spatial coverage and therefore it is expected to enhance the flux estimation. In this study, we apply an integrated flux inversion framework NISMON-CO2 to a CO2 inversion with column-averaged dry air mole fraction of CO2 (XCO2), stored in NIES Level 2 product from the Greenhouse gases Observing SATellite (GOSAT) measurements and assess general features of the inversion results by comparing with an already established surface in-situ data inversion. NISMON-CO2 incorporates NICAM-TM (Nonhydrostatic ICosahedral Atmospheric Model-based Transport Model) for forward simulation, coupled with a 4DVar (four dimensional variational) data assimilation system for inverse computations. The 4DVar leverages the adjoint of NICAM-TM alongside the quasi-Newtonian optimization scheme. GOSAT, a Japanese satellite launched in 2009 by Japan Aerospace Exploration Agency (JAXA) in collaboration with the Ministry of the Environment (MOE) and the National Institute for Environmental Studies (NIES), provides high quality greenhouse gas mesurements from space to study their global distribution.

The prior flux data include four fluxes: fossil fuel emissions from GridFED (Gridded Fossil Emission Dataset), biomass burning emissions from Global Fire Emission Database (GFED), biospheric fluxes (gross primary production, respiration and land use change) from the Vegetation Integrative SImulator for Trace gases (VISIT) and air-sea exchange flux data from Japan Meteorological Agency (JMA). In this study, meteorological data that drive NICAM-TM is updated to the Japanese Reanalysis for Three Quarters of a Century (JRA-3Q) from JRA-55. Several numerical experiments are conducted for the period since April, 2009 till date to understand the performance of the inversion by analyzing the consistency of the resultant flux and concentration. This study illustrates the power of integrating satellite-derived products to provide comprehensive CO2 flux estimates, significantly enhancing our understanding of CO2 dynamics at global and regional scales.

Keywords: CO2 flux estimation, GOSAT, XCO2, 4DVar, NICAM, transport model, satellite data assimilation.

How to cite: Maity, S., Niwa, Y., Saeki, T., Someya, Y., and Yoshida, Y.: Global CO2 flux estimation using NISMON-CO2 and GOSAT for carbon cycle analysis improvement, EGU General Assembly 2025, Vienna, Austria, 27 Apr–2 May 2025, EGU25-1822, https://doi.org/10.5194/egusphere-egu25-1822, 2025.

EGU25-2991 | ECS | Posters on site | AS3.44

Impact of Global Climatic Phenomena on the Carbon Exchange Dynamics of the Indian Terrestrial Biosphere 

Emili Singha Roy, Sajeev Philip, and Matthew S. Johnson

A better understanding of the country-scale terrestrial biospheric carbon dioxide (CO2) budget is crucial for formulating national climate policies aimed at limiting carbon emissions. The scarcity of continuous and dense regional CO2 measurements in India poses a significant challenge to accurately quantifying its carbon budget. Moreover, there are no observation-based studies investigating the regional carbon-climate interactions and carbon cycle response due to large-scale climatic events currently exist. In this study, we use the OCO-2 satellite atmospheric CO2 column (XCO2) retrievals, Solar Induced Fluorescence (SIF) and various observational data to study the Indian terrestrial biosphere’s response to large-scale climatic events such as El Niño-Southern Oscillation and Indian Ocean Dipole (IOD). The XCO2 data was assimilated in an ensemble of eight global top-down CO2 flux inverse models as part of the OCO-2 v10-Ext multi-model intercomparison project. We found a decrease in Indian terrestrial biosphere carbon uptake during El Niño and an increase during La Niña and positive IOD events. The increase in carbon uptake, driven by pIOD and La Niña events (~150 TgC) accounts for approximately one-quarter of India's annual fossil fuel carbon emissions. Studies indicate that the frequency of pIOD and La Niña events may rise under future global warming scenarios. This can potentially enhance the capacity of the Indian terrestrial biosphere to sequester more atmospheric carbon. Satellite-derived carbon-climate constraints over India as found in this study provide critical insights for developing effective strategies to achieve net-zero emissions in the future.

Acknowledgements: OCO-2 v10-Ext MIP modelers.

How to cite: Singha Roy, E., Philip, S., and S. Johnson, M.: Impact of Global Climatic Phenomena on the Carbon Exchange Dynamics of the Indian Terrestrial Biosphere, EGU General Assembly 2025, Vienna, Austria, 27 Apr–2 May 2025, EGU25-2991, https://doi.org/10.5194/egusphere-egu25-2991, 2025.

EGU25-3937 | ECS | Posters on site | AS3.44

Improved estimates of net ecosystem exchanges in mega-countries using GOSAT and OCO-2 observations 

Lingyu Zhang, Fei Jiang, Wei He, Mousong Wu, Jun Wang, Weimin Ju, Hengmao Wang, Yongguang Zhang, Stephen Sitch, and Jing M. Chen

Accurate national terrestrial net ecosystem exchange estimates are crucial for the global stocktake. Net ecosystem exchange estimates from different inversion models vary greatly at national scale, and the relative impacts of prior fluxes and observations on these inversions remain unclear. Here we estimate the net ecosystem exchange of 51 land regions for the 2017-2019 period, focusing on the 10 largest countries, using prior fluxes from 12 terrestrial biosphere models and XCO2 retrievals from GOSAT and OCO-2 satellites as constraints. The average uncertainty reduction for the 10 countries increases from 37% with GOSAT and 45% with OCO-2 to 50% with combined observations, indicating a trend towards robust estimates. At finer spatial scales, even with combined observations, the uncertainty reduction is only 33%, i.e., the prior flux dominates the estimates. This finding underscores the critical importance of integrating multi-source observations and refining prior fluxes to improve the accuracy of carbon flux estimates.

This study provides valuable insights for improving atmospheric inversions in the future, and offers a deeper understanding of the inversion results for the carbon cycle community. Additionally, the improved estimates of carbon fluxes for the 10 largest countries presented here can inform policy makers in making more informed decisions regarding climate and carbon management strategies.

How to cite: Zhang, L., Jiang, F., He, W., Wu, M., Wang, J., Ju, W., Wang, H., Zhang, Y., Sitch, S., and Chen, J. M.: Improved estimates of net ecosystem exchanges in mega-countries using GOSAT and OCO-2 observations, EGU General Assembly 2025, Vienna, Austria, 27 Apr–2 May 2025, EGU25-3937, https://doi.org/10.5194/egusphere-egu25-3937, 2025.

EGU25-4002 | ECS | Orals | AS3.44

Can radon-222 help to improve methane emission estimates? Results from a dual-tracer inversion 

Fabian Maier, Christian Rödenbeck, Ute Karstens, Frank-Thomas Koch, Maksym Gachkivskyi, and Christoph Gerbig

Atmospheric transport models cause a large part of the uncertainty in top-down estimates of greenhouse gas fluxes derived by atmospheric inversions. In particular, deficits in transport models, such as inadequate description of vertical mixing in the planetary boundary layer (PBL), can lead to systematic biases in the flux estimates. While their quantification is critical for reliable flux estimation, such model biases and uncertainties are difficult to assess. One way of evaluating the performance of atmospheric transport models is to compare the modelled with the measured activity concentration of the radioactive noble gas radon-222 (Rn), provided that the Rn fluxes are sufficiently well known. Rn is produced by the decay of radium-226 in the soil and diffuses through the soil pores into the atmosphere. As the Rn lifetime (3.8 days) is comparable to the ventilation time scale of the PBL, atmospheric measurements of Rn activity concentrations provide sensitive information on vertical mixing.

By comparing the mismatch between the modelled (using the Stochastic Time-Inverted Lagrangian Transport model, STILT, and posterior flux estimates) and measured concentrations of methane (CH4) with that of Rn, we found significant correlations for many sites in Europe (the median correlation coefficient of all sites is r=0.6), indicating that a large part of the variability in the CH4 and Rn model-data mismatch can be explained by transport model errors. To exploit this information, we set up a joint inversion for (the targeted tracer) CH4 and Rn, taking into account realistic prior uncertainties and making use of the fact that the transport model error is correlated between the two gases. By comparing the results of the CH4-Rn inversion with those of a single-tracer CH4-only inversion, we assess the potential of Rn to improve CH4 emission estimates and highlight the importance of having accurate Rn flux maps. 

How to cite: Maier, F., Rödenbeck, C., Karstens, U., Koch, F.-T., Gachkivskyi, M., and Gerbig, C.: Can radon-222 help to improve methane emission estimates? Results from a dual-tracer inversion, EGU General Assembly 2025, Vienna, Austria, 27 Apr–2 May 2025, EGU25-4002, https://doi.org/10.5194/egusphere-egu25-4002, 2025.

EGU25-4375 | ECS | Posters on site | AS3.44

Reconstruction and downscaling of historical land surface boundary conditions with Machine Learning 

Amirpasha Mozaffari, Stefano Materia, Vinayak Huggannavar, Lina Teckentrup, Iria Ayan, Etienne Tourigny, and Markus Donat

Understanding the role of land surface physics and biogeochemistry is crucial for improving climate models and weather prediction, particularly in the context of long-term variability, local feedbacks, and extreme events. Accurate boundary conditions—such as land cover (LC) and land use (LU)—are key to enhancing the realism of climate simulations by better representing land-atmosphere interactions that influence surface energy balance, and ecosystem processes. Moreover, they provide the substratum for a realistic representation of the terrestrial carbon cycle components, such as vegetation and soil biogeochemistry.

The CERISE project aims to produce high-resolution (1 km) LC and Leaf Area Index (LAI) datasets covering the period 1925–2020, contributing to novel reanalysis datasets (e.g., ERA6-Land), and seasonal forecasts (e.g., SEAS6). In the first phase, we reconstructed historical LU and LAI by leveraging machine learning (ML) models to downscale coarse-resolution LU datasets (LUH2f, HILDA+). Our workflow integrates multiple ML techniques, such as Random Forest and XGBoost, to train models over high-resolution LC and LAI satellite observations, while actively exploring methods to enhance both performance and interpretability. To capture monthly LAI variations from annual LU inputs, we developed an auxiliary network to model intra-annual variability. Initial results show promising performance in reconstructing LC and LAI across various test years and regions, demonstrating the feasibility and robustness of this ML-based approach for historical reconstructions.

Future phases, including the CONCERTO and TerraDT projects, will extend this work to generate consistent high-resolution LU datasets for the historical (1850-present) and future scenarios (present–2100), supporting CMIP7 climate simulations and scenario-based studies. These efforts will incorporate additional auxiliary data (e.g., elevation, soil types, climate indices) to improve feature representation and develop autoregressive models that account for long-term temporal dependencies and dynamic changes. Ultimately, our goal is to build a robust ML-based emulator for generating scalable, high-resolution land surface boundary conditions to support digital twin applications, thereby enhancing climate simulation and prediction capabilities.

How to cite: Mozaffari, A., Materia, S., Huggannavar, V., Teckentrup, L., Ayan, I., Tourigny, E., and Donat, M.: Reconstruction and downscaling of historical land surface boundary conditions with Machine Learning, EGU General Assembly 2025, Vienna, Austria, 27 Apr–2 May 2025, EGU25-4375, https://doi.org/10.5194/egusphere-egu25-4375, 2025.

EGU25-4834 | Orals | AS3.44 | Highlight

A decade of progress in carbon cycle science from NASA’s Orbiting Carbon Observatory (OCO-2 and OCO-3) missions 

Abhishek Chatterjee, Vivienne Payne, and Junjie Liu and the OCO-2 and OCO-3 Science and Project Team

As pathfinder missions, NASA’s Orbiting Carbon Observatory-2 (OCO-2) and its sister mission Orbiting Carbon Observatory-3 (OCO-3) have significantly expanded global CO2 observation coverage, providing high-quality atmospheric CO2 data at unprecedented spatial and temporal resolutions. Additionally, both missions retrieve solar-induced chlorophyll fluorescence (SIF), an indicator of photosynthetic activity. The OCO-2/3 team have achieved the extraordinary accuracy and precision requirement of delivering single-column CO2 retrievals with errors less than 1.0 ppm (less than 0.25%), making this data the "gold-standard" of remotely sensed atmospheric CO2. Both missions are now operating well beyond their designed lifetimes, showcasing technological excellence and demonstrating the value of space-based atmospheric CO2 measurements for improving our understanding of the carbon cycle at a variety of spatiotemporal scales, ie., from global carbon budgets to monitoring regional carbon cycle response to extreme events and tracking local emissions from urban areas and power plants. Our extended operations have allowed the project and science team to continuously improve all aspects of the missions, thus enabling the scientific community to investigate long-term trends in the carbon cycle and pursue policy-level applications that would not have been possible with only two-three years of data.

In this talk, we will synthesize the major scientific achievements and breakthroughs in applications from the scientific community using the OCO-2/3 data, emphasizing how the science achievements and requirements on the data accuracy have evolved during the last decade. We will also address current challenges and limitations of the data as well as discuss new scientific and application areas that this growing data record can advance. In the end, we will briefly touch on the synergistic scientific questions that can be addressed by combining the OCO-2/3 data record with the growing constellation of CO2 satellites, such as ESA's CO2M, JAXA's GOSAT-GW and others. 

How to cite: Chatterjee, A., Payne, V., and Liu, J. and the OCO-2 and OCO-3 Science and Project Team: A decade of progress in carbon cycle science from NASA’s Orbiting Carbon Observatory (OCO-2 and OCO-3) missions, EGU General Assembly 2025, Vienna, Austria, 27 Apr–2 May 2025, EGU25-4834, https://doi.org/10.5194/egusphere-egu25-4834, 2025.

The extensively distributed grasslands of the Qinghai-Tibet Plateau (QTP) play a vital role in the global carbon cycle and climate regulation. Gross primary productivity (GPP), a crucial indicator of ecosystem carbon sequestration capacity, remains highly uncertain partly due to neglecting the memory effects of environmental conditions (i.e., the influence of past states on current GPP). Moreover, existing models have difficulty in simultaneously handle multidimensional spatio-temporal data and dynamic climate responses, leading to simulation deviations and exacerbating uncertainties. Here, we integrated climate and vegetation data with time series characteristics and spatial characteristics to simulate the GPP of alpine grassland on the QTP, by developing a deep learning model CNN-LSTM that combined Convolutional Neural Networks (CNNs) and Long Short-Term Memory networks (LSTM). The conclusions were as follows: (a) The CNN-LSTM model effectively captured spatial patterns using CNNs and temporal dependencies with LSTMs, incorporating memory effects to consider the impact of past environmental conditions. This integration enhanced GPP simulation accuracy and improved the model's ability to capture interannual variability. (b) The training and optimization of the CNN-LSTM models revealed that the comprehensive memory effect length of GPP on historical climate and vegetation dynamics operates in a 4-month timescale, with the memory effects of GPP varied across environmental variables in both duration and intensity. (c) During 2001–2021, The mean annual GPP of the alpine grassland in QTP was 332.29 g C m-2 a-1, with a growth rate of 1.84 g C m-2 a-2. (d) Precipitation exhibited relatively longer durations and higher intensities compared to other factors, and the interannual variability of GPP was mainly influenced by water conditions. This study highlights the importance of integrating environmental memory into GPP modeling, which would enhance our comprehension of the mechanisms driving GPP and the impacts of climate change on carbon cycling in terrestrial ecosystems.

How to cite: Zhang, Q. and Zhou, T.: Deep learning-based identification of environmental memory effects on gross primary productivity of alpine grasslands in Qinghai-Tibetan Plateau, EGU General Assembly 2025, Vienna, Austria, 27 Apr–2 May 2025, EGU25-5574, https://doi.org/10.5194/egusphere-egu25-5574, 2025.

In this study, a high-resolution CO2 data assimilation (DA)-forecast system was developed to improve atmospheric CO2 concentration simulations in East Asia. The Weather Research and Forecasting model coupled with Chemistry (WRF-Chem) was used for simulating regional CO2 concentrations and the ensemble adjusted Kalman filter (EAKF) in modified Data Assimilation Research Testbed (DART) was used for assimilating CO2 concentration observations. To evaluate the performance of the developed DA-forecast system, observing system simulation experiment (OSSE) was performed in January and July 2019. Four experiments, which assimilated pseudo surface CO2 observations from four observation site networks, were conducted to avoid the influence of observation site distributions. In January and July 2019, the ratios of the root mean square error (RMSE) to the ensemble total spread for surface CO2 concentrations were 1.00 and 0.97, respectively. By assimilating surface CO2 concentrations, the bias and RMSE of simulated CO2 concentrations reduced by 1.23 ppm and 1.24 ppm in January and 1.41 ppm and 1.84 ppm in July, implying the stability of the developed DA-forecast system. Among four experiments, the experiment with an evenly distributed observation site network showed the smallest RMSE for surface CO2 concentration. The RMSE of the experiment with the existing CO2 observation network was greater than that with the evenly distributed observation network, but was smaller than that without DA. While the DA using the evenly distributed observation network showed the best performance for simulating CO2 concentrations in East Asia, the DA using the existing surface CO2 observation network also improved CO2 simulation performance compared to the experiment without DA.

Acknowledgments

This study was supported by a National Research Foundation of Korea (NRF) grant funded by the South Korean government (Ministry of Science and ICT) (Grant 2021R1A2C1012572) and the Yonsei Signature Research Cluster Program of 2024 (2024-22-0162).

How to cite: Seo, M.-G. and Kim, H. M.: Development and evaluation of high-resolution regional CO2 data assimilation-forecast system in East Asia, EGU General Assembly 2025, Vienna, Austria, 27 Apr–2 May 2025, EGU25-5697, https://doi.org/10.5194/egusphere-egu25-5697, 2025.

EGU25-6531 | ECS | Posters on site | AS3.44

Using explainable machine learning to study restored peatland CH4 flux heterogeneity 

Ilona Tamm, Kadir Yildiz, Evelyn Uuemaa, Mihkel Pindus, Ain Kull, and Kuno Kasak

Eddy Covariance (EC) method provides a valuable opportunity to monitor greenhouse gases, enabling informed decisions on climate change mitigation. Despite the abundance of EC data, explainable machine learning (ML) methods have not been effectively utilized to study the complex nature of methane (CH4) fluxes, especially heterogeneity of emissions within ecosystems. This study explores the application of random forest ML model to analyse CH4 flux spatiotemporal heterogeneity using flux data from the Ess-soo restored peatland in Estonia. This site, 30 years ago abandoned peat extraction area, was restored in 2021. To study CO2 and CH4 fluxes, open path EC analysers (LI-7500 and LI-7700, LICOR Biosciences) were installed in 2023. Additionally, CO2 and CH4 fluxes were measured biweekly using chamber method with the LI-7810 trace gas analyser (LICOR Biosciences) from 12 sampling spots in the EC footprint area. Other parameters such as water pH, electrical conductivity, dissolved oxygen concentration, temperature, oxidation reduction potenital, pH, and water level were conducted.

Chamber measurements revealed significant spatial CH4 heterogeneity within EC flux footprint. The mean CH4 flux from chamber measurement points during the summer months was 0.052 ± 0.013 µmol m-2 s-1 with a range of -0.001 to 0.555 µmol m-2 s-1. Looking into whole year EC dataset, main driver for CH4 flux was water temperature. Day and nighttime fluxes responded differently to environmental changes, with air temperature and wind speed being significant drivers for day and night, respectively. The random forest model predicted CH4 heterogeneity considerably better than general linear models performed (R² = 0.31 and 0.10, respectively). Besides identifying the main drivers, ML models can also combine EC and chamber measurements to detect hotspots and moments that are overlooked by EC alone. In that case, high spatial or temporal resolution  remote sensing data (e.g. LiDAR, Sentinel-1, Sentinel-2) was used. For instance, topographic wetness index calculated from LiDAR data in all points within EC flux footprint, was combined with water level—an important driver of both EC and chamber CH4 fluxes. This information, together with chamber data was used to train ML models to estimate CH4 fluxes spatially and temporally.

This work brings out the advantages in using ML and high spatial and temporal resolution remote sensing data to study CH4 flux heterogeneity in wetlands. However, more testing is needed to see if these methods give similar results in other wetland sites.

How to cite: Tamm, I., Yildiz, K., Uuemaa, E., Pindus, M., Kull, A., and Kasak, K.: Using explainable machine learning to study restored peatland CH4 flux heterogeneity, EGU General Assembly 2025, Vienna, Austria, 27 Apr–2 May 2025, EGU25-6531, https://doi.org/10.5194/egusphere-egu25-6531, 2025.

EGU25-8137 | ECS | Posters on site | AS3.44

Coupling large-eddy simulations with UAV measurement through inversion technique to estimate patch-level fluxes from heterogeneous tundra landscapes 

Theresia Yazbeck, Mark Schlutow, Abdullah Bolek, Nathalie Ylenia Triches, Elias Wahl, Martin Heimann, and Mathias Göckede

Land cover change has direct implications on natural greenhouse gas emissions, as land-atmosphere interactions are function of the changing heterogeneity of the surface. Rapidly changing ecosystems, such as the Arctic, where permafrost wetting and draining is taking place in different regions in the northern latitudes, underlines the necessity of assessing patch-level emissions of greenhouse gases to better estimate net total fluxes. In this study, we combine high-resolution modelling of the atmospheric boundary layer with inverse modelling concepts to constrain land-atmosphere exchange fluxes at local to landscape scales, and explore relationships between different land cover types within heterogeneous landscapes and the net exchange processes between surface and atmosphere. We use EULAG (EUlerian LAGrangian), an established Large-Eddy Simulation model, to simulate high-resolution flow patterns induced by heterogeneous permafrost surfaces, and apply inversion techniques to infer the fluxes of the corresponding patch type forming the mixed land cover. Uncrewed Aerial Vehicles (UAV)-based grid surveys of gas concentrations are used to benchmark the spatial variability of modeled concentrations using EULAG, where we optimize for surface fluxes associated with each patch. We present a case study at Stordalen Mire in subarctic Sweden, where we use UAV measurements of methane and carbon dioxide mole fractions, and implement this inversion method to differentiate the flux rate signatures from different patch types, namely palsa, bog, and lakes. The inferred fluxes were validated with patch-level chamber measurements of methane and carbon dioxide. Our model evaluation shows a good match between modeled and observed concentrations while the resulting patch-level fluxes agree with the observed fluxes from chamber measurements. Our novel technique shows promising results in inferring patch type flux heterogeneity while facilitating the application of inversion methods to high resolution atmospheric models.

How to cite: Yazbeck, T., Schlutow, M., Bolek, A., Triches, N. Y., Wahl, E., Heimann, M., and Göckede, M.: Coupling large-eddy simulations with UAV measurement through inversion technique to estimate patch-level fluxes from heterogeneous tundra landscapes, EGU General Assembly 2025, Vienna, Austria, 27 Apr–2 May 2025, EGU25-8137, https://doi.org/10.5194/egusphere-egu25-8137, 2025.

EGU25-9204 | ECS | Posters on site | AS3.44

Modelling atmospheric CO2 and CH4 mixing ratios over mixed natural-agricultural wetlands in the Ebre River Delta  

Ricard Segura-Barrero, Alba Badia, Gara Villalba, and Ariane Arias-Ortiz

Terrestrial ecosystems play a crucial role in mitigating climate change by reducing greenhouse gas (GHG) emissions and sequestering significant amounts of atmospheric carbon dioxide (CO2). Wetlands, particularly coastal wetlands, are highly efficient carbon sinks but can also be large sources of methane (CH4). Natural and agricultural wetlands, such as rice paddies, contribute to 37 % of global CH4 emissions. Monitoring wetland-atmosphere carbon exchange is essential to evaluate the effectiveness of natural climate solutions (NCS), such as wetlands restoration and sustainable agricultural practices, in reducing GHG emissions and increasing soil carbon storage. Traditional methods for quantifying GHG emissions from wetlands include chamber flux measurements and eddy-covariance flux towers. These techniques provide valuable insights into carbon dynamics at the plot and ecosystem scale levels but fail to capture carbon fluxes at a regional scale, where policy decisions are often made. Recently, atmospheric composition observations have been used at regional scales and over urban areas to constrain the spatial and temporal distribution of GHG fluxes derived from land surface models. Applying similar methodologies to wetland regions, provided sufficient atmospheric observations are available, could enhance understanding of atmospheric carbon dynamics in these areas. The Ebre River Delta, a mixed natural-agricultural wetland system of international importance in terms of sustaining economic activities and biodiversity, offers a unique opportunity to investigate carbon sequestration and GHG emissions. This potential is enhanced by the availability of atmospheric GHG observations from in situ site tower and vehicle transects conducted across the regions.

Here, we integrate advanced modelling techniques and observational data to refine our understanding of GHG fluxes in the Ebre Delta. Biogenic GHG emissions over the Delta are estimated using a high-resolution Vegetation Photosynthesis and Respiration Model (VPRM) adapted for wetland ecosystems for CO2, and the Kaplan model embedded in the Weather Research and Forecasting (WRF) Greenhouse Gas (WRF-GHG) model to estimate CH4 emissions.  A sensitivity analysis is performed to compare VPRM CO2 emissions from different model configurations, entailing a default and a wetland-adapted model versions, and two sources of input satellite-vegetation indices, MODIS and Sentinel-2, with contrasting  spatial resolutions. Then, modelled atmospheric CO2 and CH4 mixing ratios with WRF-GHG during growing season are compared with in situ observations from the site tower and vehicle transects to assess their accuracy. The framework developed in this study will provide the basis for investigating sequestration and emission hotspots over a mosaic of wetland land-uses and evaluate the region's potential for climate change mitigation and adaptation. 

How to cite: Segura-Barrero, R., Badia, A., Villalba, G., and Arias-Ortiz, A.: Modelling atmospheric CO2 and CH4 mixing ratios over mixed natural-agricultural wetlands in the Ebre River Delta , EGU General Assembly 2025, Vienna, Austria, 27 Apr–2 May 2025, EGU25-9204, https://doi.org/10.5194/egusphere-egu25-9204, 2025.

EGU25-10249 | ECS | Posters on site | AS3.44

Uncertainty in Land Carbon Fluxes Simulated by CMIP6 Models from Treatment of Crop Distributions and Photosynthetic Pathways 

Joseph Ovwemuvwose, Heather Graven, and Colin Prentice

A reliable representation of the diversity and variability of terrestrial ecosystems, both natural and managed, is crucial to the accurate simulation of their present and future roles in biogeochemical cycles and global climate. In this study we compare the treatment of vegetation distributions and of photosynthetic pathways (C3 versus C4) of both natural vegetation and crops across Earth System Models (ESMs) in the 6th Coupled Model Intercomparison Project (CMIP6). Of the 11 CMIP6 models reporting variables on crop and C3 versus C4 distribution use, 10 models use the crop distributions of the Land Use Harmonization v2 (LUH2) dataset, which has an increase of ~188 and ~254% in C3 and C4cropland, respectively, from 1850 to 2014. The models simulate a 10% decrease in the area coverage of natural vegetation with the C3 photosynthetic pathway but disagree on the trend of C4. The impact on carbon isotopic discrimination from simulated C3 and C4 GPP trends only, not accounting for physiological effects, is generally to drive a decreasing trend in discrimination, especially in models with increasing C4 vegetation cover, opposite to the trend derived from atmospheric data. Our findings suggest that implementation of C3 and C4 vegetation area abundance and GP of C3 and C4 vegetation contribute to uncertainty in land carbon fluxes and need further constraints and improvement in ESMs.


How to cite: Ovwemuvwose, J., Graven, H., and Prentice, C.: Uncertainty in Land Carbon Fluxes Simulated by CMIP6 Models from Treatment of Crop Distributions and Photosynthetic Pathways, EGU General Assembly 2025, Vienna, Austria, 27 Apr–2 May 2025, EGU25-10249, https://doi.org/10.5194/egusphere-egu25-10249, 2025.

EGU25-10599 | ECS | Posters on site | AS3.44

Investigating ecosystem respiration CO2 signals using night-time ICOS tower observations 

Yang Xu, Michal Galkowski, Saqr Munassar, David (Tzu-Hsin) Ho, Frank-Thomas Koch, and Christoph Gerbig

The biosphere-atmosphere CO2 exchange is the largest carbon flux in the global carbon cycle, yet substantial uncertainties remain in quantifying gross primary production (GPP) and ecosystem respiration (Re). Top-down atmospheric inversion modeling provides a powerful approach to reduce the uncertainties in surface fluxes through a combination of atmospheric observations and transport modeling. However, as during nighttime mixing process of the atmosphere is weakly developed and hard to simulate in atmospheric transport models, atmospheric inversions typically rely on afternoon observations when both GPP and Re occur simultaneously, making it challenging to isolate their individual contributions.  In order to disentangle the respiration signals and simultaneously utilize previously unused observational data, we established a novel algorithm for the identification of night-time mixing height, based on the temporal variation of virtual potential temperature from ICOS tower measurements. The method is validated using profile information on greenhouse gases. We then integrated CO2 signals below the diagnosed mixing height and incorporated these partial column increment as observational operators in CarboScope-Regional (CSR), a Bayesian inverse modeling framework. This enhanced inversion scheme enables improved quantification of ecosystem respiration (and, by extension, GPP), bringing about a better understanding and constrains on the the role of biological fluxes in European carbon budgets.

How to cite: Xu, Y., Galkowski, M., Munassar, S., Ho, D. (.-H., Koch, F.-T., and Gerbig, C.: Investigating ecosystem respiration CO2 signals using night-time ICOS tower observations, EGU General Assembly 2025, Vienna, Austria, 27 Apr–2 May 2025, EGU25-10599, https://doi.org/10.5194/egusphere-egu25-10599, 2025.

EGU25-12471 | Orals | AS3.44

BenchFlux: Advancing Nature-Based Climate Solutions through Scale-Aware CO2 Flux Benchmarks 

Emma Izquierdo-Verdiguier, Álvaro Moreno-Martínez, Paul Stoy, Oliver Sonnentag, Christopher Pal, Yanghui Kang, Trevor Keenan, Ankur R Desai, Stefan Metzger, Jingfeng Xiao, Matthew Fortier, Maoya Bassiouni, Sadegh Ranjbar, Samuel Bower, Sophie Hoffman, Danielle Losos, and Nicholas Clinton

Addressing the escalating climate crisis necessitates precise tools for evaluating nature-based climate solutions (NbCS). The BenchFlux project represents a significant advancement by developing scale-aware benchmarks for carbon dioxide (CO₂) fluxes, leveraging flux tower measurements and Earth Observation (EO) data. Unlike existing scale-agnostic approaches, BenchFlux introduces a methodology that explicitly accounts for the emergent, nonlinear behaviors inherent in carbon flux dynamics across spatial and temporal scales.

The objective of this project is to harmonize bottom-up CO2 inventories with top-down atmospheric inversions, thereby providing substantial tools for precise carbon accounting on global-to-local scales. By integrating flux tower ground-truth data and multi-source EO datasets, BenchFlux employs machine learning (ML) and cloud computing tools to develop ML-ready benchmarks with enhanced precision and uncertainty quantification. By transitioning from scale-agnostic to scale-aware data joins, the project optimizes the statistical power of flux tower measurements while maintaining consistency across various scales.

BenchFlux is built on three pillars:

  • Observational Inputs: Nested integration of flux tower ground-truth and EO predictors to produce a harmonized, ML-ready dataset. This includes multi-resolution, spatialized CO₂ flux data with uncertainties across spatial-temporal scales, enabled by Google Earth Engine and cloud-optimized workflows.
  • Models: Development of advanced ML models, such as Bayesian and knowledge-guided approaches, to improve predictive accuracy and functional consistency for carbon flux estimation.
  • Benchmark Outputs: Comprehensive datasets, baseline models, and uncertainty-aware evaluation metrics to foster collaboration and inform NbCS policies from local to global scales.

BenchFlux is a collaborative project across six international research teams, integrating expertise in flux tower data processing, remote sensing, and ML. By fostering open science practices, the project will provide accessible tools, tutorials, and datasets to empower the global scientific community. The project outcomes will catalyze the adoption of NbCS, ensuring accountability in net-zero pledges and advancing climate solutions grounded in scientific rigor.

How to cite: Izquierdo-Verdiguier, E., Moreno-Martínez, Á., Stoy, P., Sonnentag, O., Pal, C., Kang, Y., Keenan, T., Desai, A. R., Metzger, S., Xiao, J., Fortier, M., Bassiouni, M., Ranjbar, S., Bower, S., Hoffman, S., Losos, D., and Clinton, N.: BenchFlux: Advancing Nature-Based Climate Solutions through Scale-Aware CO2 Flux Benchmarks, EGU General Assembly 2025, Vienna, Austria, 27 Apr–2 May 2025, EGU25-12471, https://doi.org/10.5194/egusphere-egu25-12471, 2025.

EGU25-13541 | ECS | Orals | AS3.44

Constraining interannual variability of terrestrial carbon fluxes using proxy data in the CarbonTracker long-window data assimilation system 

Xiaoting Huang, Joram Hooghiem, Auke Van Der Woude, Remco De Kok, Peiyi Peng, Zhu Liu, and Wouter Peters

Interannual variability (IAV) represents a critical aspect of understanding changes in the terrestrial carbon cycle. Climate drivers such as temperature and water availability mainly influence the IAV of terrestrial carbon fluxes. Their contributions vary spatiotemporally across different regions and seasons and are simulated with various bottom-up and AI-based terrestrial ecosystem models. However, significant uncertainties remain in simulating terrestrial carbon flux IAV using such models, particularly in the tropics where correlations between temperature and/or water anomalies and atmospheric CO₂ observations were shown to be large. This study demonstrates a data assimilation system that decomposes net ecosystem exchange (NEE) into components across different timescales, with a specific focus on optimizing the poorly constrained IAV. Instead of directly optimizing NEE fluxes, this framework replaces the IAV component with a regression that links NEE IAV to proxy data, such as temperature and water-related variables, as well as light interception by the canopy. This approach allows the system to optimize the sensitivity of NEE IAV to these proxies, providing a robust method to simulate IAV in NEE also for locations and times where the IAV is not directly observed from atmospheric CO₂, or properly simulated by terrestrial biosphere models. This presentation will demonstrate the selection of proxy data and assess their robustness for use in CTE long-window system. The first results from the data assimilation system will be presented and compared to outputs from the regular Carbon Tracker Europe approach (CTE2024). The comparison will focus on quantifying the IAV of NEE and evaluating ecosystem responses to representative extreme events (e.g., heatwaves and droughts), highlighting differences in the system's ability to capture the impacts of such extreme events.

How to cite: Huang, X., Hooghiem, J., Van Der Woude, A., De Kok, R., Peng, P., Liu, Z., and Peters, W.: Constraining interannual variability of terrestrial carbon fluxes using proxy data in the CarbonTracker long-window data assimilation system, EGU General Assembly 2025, Vienna, Austria, 27 Apr–2 May 2025, EGU25-13541, https://doi.org/10.5194/egusphere-egu25-13541, 2025.

EGU25-13589 | ECS | Posters on site | AS3.44

Towards a high-resolution inversion system over France using in-situ observations  

Carla D'angeli, Thomas Lauvaux, David Matajira Rueda, Ke Che, Charbel Abdallah, Hassan Bazi, Philippe Ciais, Michel Ramonet, Morgan Lopez, and Leonard Rivier

The global Stocktake, a fundamental component of the Paris Agreement tracking progress on national mitigation actions, collects the Nationally Determined Contributions (NDCs) generated through the means of annual national inventories. Carbon capture through the natural ecosystem is essential to reach the Paris Agreements and thus it is crucial to understand the interaction of the atmosphere/biosphere and its changes with global warming. We present the model performances of our regional inversion system over France for the year 2022, with a special focus on an extreme drought event that impacted southern Europe during the summer. Our inversion system optimizes CO2 fluxes from fossil fuel and biogenic fluxes at higher spatiotemporal resolutions over France (3km, hourly). The Lagrangian Particle Dispersion Model (LPDM) developed running in a backward-in-time model, driven by meteorological inputs from a 3-km run of the Weather Research Forecast Model (WRF-Chem), establishes the transport of CO2 molecules. Employing a Bayesian inversion technique, we optimize prior CO2 flux estimates by integrating tower footprints and ICOS atmospheric measurements into a newly developed inversion framework, combining block matrix decomposition and adaptive mesh refinement. We infer the prior flux estimates using the TNO high-resolution fossil fuel inventory and biogenic CO2 fluxes produced by the Vegetation Photosynthesis Respiration Model (VPRM). We start by evaluating the WRF-chem model performances at high resolution compared to low resolution simulations. Then we assess the meteorology and CO2 exchanges over continental France throughout the year 2022. With the Lagrangian Model, we can explore the actual ICOS network constraints by determining the share of biogenic and fossil fuel sources at each tower of the ICOS network. We discuss here how our inversion system could help constrain the regional distribution of CO2 fluxes, including sub-annual variations at seasonal and monthly timescales to track current climate change impacts (forest fires, droughts), and the effects of emission mitigation policies. Finally, we determine potential networks of surface stations (extension of the current ICOS network) to enable the monitoring of CO2 fluxes and emissions at policy-relevant scales over continental France.

How to cite: D'angeli, C., Lauvaux, T., Matajira Rueda, D., Che, K., Abdallah, C., Bazi, H., Ciais, P., Ramonet, M., Lopez, M., and Rivier, L.: Towards a high-resolution inversion system over France using in-situ observations , EGU General Assembly 2025, Vienna, Austria, 27 Apr–2 May 2025, EGU25-13589, https://doi.org/10.5194/egusphere-egu25-13589, 2025.

EGU25-13739 | ECS | Orals | AS3.44

Optimizing CO2 emission estimates in Paris through enhanced urban atmospheric monitoring 

Ke Che, Thomas Lauvaux, Ingrid Chanca, William Morrison, Laura Bignotti, Theo Glauch, Pedro Coimbra, Benjamin Loubet, Samuel Hammer, Andreas Christen, Simone Kotthaus, Olivier Perrussel, Philippe Ciais, Leonard Rivier, Michel Ramonet, and Olivier Laurent

As part of the EU-funded PAUL project (ICOS Cities), the metropolitan area of Paris, in parallel with Munich and Zurich, has been instrumented with various observing systems to define the most-suitable approaches for CO2 emissions monitoring. This effort is underpinned by an extensive urban atmospheric monitoring network, comprising nine towers equipped with high-accuracy and mid-cost sensors designed to capture  variations in atmospheric concentrations. Driven by 1-km meteorological fields (from WRF), the Stochastic Time-Inverted Lagrangian Transport (STILT) model has been employed for backward simulations of CO2 enhancements based on state-of-the-art high-resolution inventories for 2023. Transport errors have been significantly reduced ( from about 4-5 m/s to  1~2 m/s) through the assimilation of three-dimensional wind profiles obtained from multiple Lidar data over Paris (Urbisphere project), using 3DVar data cycling assimilation. Fossil fuel emissions (TNO, AirParif) and biogenic emissions (using offline VPRM MODIS and Sentinel-2) serve as prior inventories in our inverse modeling framework. This framework employs a Bayesian inversion technique producing hourly fluxes with time-varied adaptive mesh grids (1 km in the downtown area, gradually aggregated to 100 km across the region), balancing computational efficiency with inversion accuracy near monitoring sites. However, direct comparisons revealed systematic discrepancies in the inversion results, particularly in the adjustments between anthropogenic and biogenic emissions. To address this, radiocarbon (14C) observations from two Parisian sites were incorporated as additional constraints, improving the partitioning of fossil fuel and biogenic contributions in the inversion.

How to cite: Che, K., Lauvaux, T., Chanca, I., Morrison, W., Bignotti, L., Glauch, T., Coimbra, P., Loubet, B., Hammer, S., Christen, A., Kotthaus, S., Perrussel, O., Ciais, P., Rivier, L., Ramonet, M., and Laurent, O.: Optimizing CO2 emission estimates in Paris through enhanced urban atmospheric monitoring, EGU General Assembly 2025, Vienna, Austria, 27 Apr–2 May 2025, EGU25-13739, https://doi.org/10.5194/egusphere-egu25-13739, 2025.

Terrestrial ecosystems gain carbon through photosynthesis and lose it through respiration in autotrophs and heterotrophs. Continuously measured values of carbon fluxes of a forest ecosystem, particularly net ecosystem exchange (NEE) could be used as a general indicator of forest ecosystem functioning. Subsequently, quantification of the ecosystem functioning as a response to changes in the microclimate and environmental variables is necessary to frame sustainable adaptive measures and conservation policies. The Himalayan Chir- Pine (Pinus roxburghii Sarg.) is a gregarious, fire-resistant, indigenous tree species, often form pure forests and having the characteristics of high regeneration potential.  The Chir-Pine is widely distributed across the western and central part of the Indian Himalayan Region and thereby acts as a major control of land-atmosphere processes. In the recent years, studies have provided insights on sub-daily to annual scale interactions of Chir-Pine ecosystem with microclimatic and environmental variables, and it was reported that Chir-Pine ecosystem is a heat dominating ecosystem with high carbon sequestration potential. However, almost no information is available on environmental drivers resulting carbon sequestration of Himalayan Chir-Pine ecosystem. In this context, it is widely reported that the data driven models are well suited for identifying and prioritizing drivers for ecosystem carbon exchange. Therefore, this study is aimed at developing a data-driven model for predicting day-time net ecosystem exchange of a Chir-Pine forest of central Himalaya, Uttarakhand, India. And further aims to quantify driver-response relationship between net ecosystem exchange (NEE) and micro-climatic variables using machine learning classifiers. In order to address the objectives, high frequency (30-min) day-time observations of NEE and micrometeorological parameters during March, 2020 to December, 2022 are collected and compiled from a 30 m eddy covariance tower situated at Kosi-Katarmal, Almora, Uttarakhand, India (29º38'22"N, 79º37'2"E). Subsequently, four machine learning algorithms such as K-nearest neighbor, Naïve Bayes, support vector machine and decision trees are used to predict the day-time NEE using individual and combinations of predictors such as rainfall, net radiation, air temperature, soil moisture and soil temperature. To obtain a robust model, 100 times bootstrapping has been performed in each simulation where 2/3rd of the dataset is used for training the model and rest is used for testing.  The model performance during training and testing has been assessed using receiver operator characteristics and the prioritization of the driver impacting NEE is carried out by identifying highest area under curve (AUC) value during model testing. The initial results indicate that the decision tree classifier is the best model amongst the four selected model for predicting day-time NEE of Chir-Pine ecosystem, and the best predictors having high AUCs are air-temperature, net-radiation and soil moisture. The prediction of the NEE through data-driven models of Chir-Pine ecosystem is expected to be beneficial for quantifying the regional scale extent of change in carbon fluxes under warmer scenarios.

How to cite: Lohani, P., Mukherjee, S., and Pundir, S.: Investigation of eco-hydrogical processes influencing Himalayan Chir-Pine net ecosystem exchange using machine learning classifiers, EGU General Assembly 2025, Vienna, Austria, 27 Apr–2 May 2025, EGU25-14709, https://doi.org/10.5194/egusphere-egu25-14709, 2025.

Achieving sustainable urban development necessitates a significant reduction in carbon dioxide (CO2) emissions from transportation. Urban road traffic CO2 concentrations display intricate spatial patterns influenced by street layouts, mobile sources, and human activities. However, a comprehensive grasp of these patterns, which entail complex interactions, remains elusive due to the omission of human perspectives on road interface characteristics.

Our research team has developed an innovative integrated AI carbon emission monitoring technology through vehicle-based surveys. This technology utilizes panoramic visual sensors and various greenhouse gas (GHG) analyzers for spatiotemporal collaborative observations, data processing, and modeling. It provides insights into the dynamic connections between the physical urban space and road traffic emissions, offering a precise and refined carbon and pollutant emission source tracing system. This method automatically extracts attributes of objects and landscapes in urban scenes, aiding in evaluating the relative importance of built environments and road traffic to emission intensities in real scenarios. Based on a thorough understanding of in-situ conditions, this approach aims to identify coordinated development paths for buildings and transportation to enhance emission reduction effects.

In this study, a mobile travel platform was constructed to collect on-road navigation Street View Panoramas (OSVPs) and corresponding CO2 concentrations, obtaining over 100,000 sample pairs covering 675.8 km of roads in Shenzhen, China. Four ensemble learning (EL) models were used to establish nonlinear connections between the semantic and object features of streetscapes and CO2 concentrations. After EL fusion modeling, the predictive R2 in the test set exceeded 90%, and the mean absolute error (MAE) was <3.2 ppm. The model was applied to Baidu Street View Panoramas (BSVPs) in Shenzhen to generate a 100 m resolution map of average on-road CO2, and the Local Indicator of Spatial Association (LISA) was used to identify high CO2 intensity spatial clusters. Light Gradient Boost-SHapley Additive exPlanation (LGB-SHAP) analysis revealed that vertically planted trees can reduce on-road CO2 emissions. Moreover, factors affecting on-road CO2 exhibit interaction and threshold effects. Street View Panoramas (SVPs) and Artificial Intelligence (AI) were used to enhance the spatial measurement of on-road CO2 concentrations and the understanding of driving factors. This approach facilitates the assessment and design of low-emission transportation in urban areas, which is critical for promoting sustainable traffic development.

How to cite: Wang, L. and Zhang, Y.: Vehicle-based monitoring and AI unravel patterns of on-road carbon and pollutant emissions, EGU General Assembly 2025, Vienna, Austria, 27 Apr–2 May 2025, EGU25-14732, https://doi.org/10.5194/egusphere-egu25-14732, 2025.

EGU25-16220 | ECS | Posters on site | AS3.44

X-BASE: terrestrial carbon and water flux products from FLUXCOM-X 

Jacob A. Nelson, Sophia Walther, Basil Kraft, Fabian Gans, Gregory Duveiller, Ulrich Weber, Zayd Hamdi, Weijie Zhang, and Martin Jung and the FLUXCOM-X Team

Mapping in-situ eddy covariance measurements (EC) of terrestrial carbon and water fluxes to the globe is a key method for diagnosing terrestrial fluxes from a data-driven perspective. We describe the first global products (called X-BASE) from a newly implemented up-scaling framework, FLUXCOM-X. The X-BASE products cover the globe at 0.05° spatial resolution for every hour and include estimates of CO2 net ecosystem exchange (NEE) and gross primary productivity (GPP).

Compared to previous FLUXCOM products, the new X-BASE NEE better reconciles the bottom-up EC-based NEE and estimates from top-down atmospheric inversions (global X-BASE NEE is -5.75±0.33 PgC yr-1). The improvement of global NEE was likely only possible thanks to the international effort to improve the precision and consistency of eddy covariance collection and processing pipelines, as well as to the extension of the measurements to more site-years resulting in a wider coverage of bio-climatic conditions. However, X-BASE NEE shows low inter-annual variability, which is common to state-of-the-art data-driven flux products and remains a scientific challenge. With 124.7±2.1 PgC yr-1, X-BASE GPP is slightly higher than previous FLUXCOM estimates, mostly in temperate and boreal areas, and temporal patterns agree well with TROPOMI-based SIF.

Many further opportunities for development exist. We will outline how the new FLUXCOM-X framework provides the necessary flexibility to experiment, diagnose, and converge to more accurate global flux estimates. Pathways of exploration include methodological choices in the selection and processing of eddy-covariance and satellite observations, their ingestion into the framework, and the configuration of machine learning methods.

How to cite: Nelson, J. A., Walther, S., Kraft, B., Gans, F., Duveiller, G., Weber, U., Hamdi, Z., Zhang, W., and Jung, M. and the FLUXCOM-X Team: X-BASE: terrestrial carbon and water flux products from FLUXCOM-X, EGU General Assembly 2025, Vienna, Austria, 27 Apr–2 May 2025, EGU25-16220, https://doi.org/10.5194/egusphere-egu25-16220, 2025.

EGU25-16327 | Orals | AS3.44

Towards reconciliation of top-down and bottom-up national-scale N2O emission estimates in Europe 

Stephan Henne, Hélène De Longueville, Alison Redington, Shauna-kay Rainford, Clemens Weber, Peter Andrews, Eric Saboya, Daniela Brito Melo, Alice Ramsden, Brendan Murphy, Joseph Pitt, Alexandre Danjou, Matthew Rigby, Lukas Emmenegger, Sonja G. Keel, Benjamin Wolf, Alistair Manning, and Anita Ganesan

Nitrous oxide (N2O) is the third most important anthropogenic greenhouse gas (GHG). In Europe, N2O contributes about 6 % to total GHG emissions and about 75 % of these emissions are from the agricultural sector. More than half of agricultural emissions arise from microbial production in managed soils with the amount of added fertilizer nitrogen, soil properties, and soil environmental conditions controlling the emissions. These drivers lead to large spatio-temporal variability in N2O fluxes, which is only poorly accounted for by simple bottom-up methods relying on emission factor approaches (IPCC Tier 1 and Tier 2 methods), and which are commonly used in national GHG inventory estimates.

The Horizon Europe project Process Attribution of Regional emISsions (PARIS) strives to improve national-scale flux estimates by employing regional-scale inverse modelling to atmospheric observations of N2O (top-down) and biogeochemical soil models. In recent years (2018 onwards), the density and quality of atmospheric observations in Western and Central Europe have improved to the point where inverse modelling at the temporal and spatial scales required for the comparison to nationally reported emissions (UNFCCC) and biogeochemical model output becomes feasible. Here, we report inverse modelling results for the period 2018-2023 for Western and Central Europe derived from three inverse modelling systemsnTEM, UK MetOffice; RHIME, University of Bristol; ELRIS, Empa. These were operated with two different atmospheric transport models: NAME-UM and FLEXPART-ECMWF. Overall, the total N2O fluxes agreed well, but were larger than in the national reporting to UNFCCC for several countries in Western and Central Europe. Results confirmed strong seasonality in N2O fluxes for the UK, Benelux, and Germany. In comparison, fluxes from France exhibited less pronounced seasonality. The variability in N2O fluxes was analysed with respect to environmental drivers, corroborating the important role of soil temperature and soil water content. Finally, the results allow a first comparison of the inversely obtained N2O fluxes and fluxes simulated by two biogeochemistry models for agricultural soils in Switzerland (DayCent, Agroscope) and Germany (LandscapeDNDC, KIT).

How to cite: Henne, S., De Longueville, H., Redington, A., Rainford, S., Weber, C., Andrews, P., Saboya, E., Brito Melo, D., Ramsden, A., Murphy, B., Pitt, J., Danjou, A., Rigby, M., Emmenegger, L., Keel, S. G., Wolf, B., Manning, A., and Ganesan, A.: Towards reconciliation of top-down and bottom-up national-scale N2O emission estimates in Europe, EGU General Assembly 2025, Vienna, Austria, 27 Apr–2 May 2025, EGU25-16327, https://doi.org/10.5194/egusphere-egu25-16327, 2025.

EGU25-17063 | Posters on site | AS3.44

Machine Learning and the Carbon Cycle: Chasing the Holy Grail 

Markus Reichstein

Over the past two decades, machine learning (ML) has become a key tool in carbon cycle research, offering new methods to quantify fluxes, map carbon stocks and turnover, and disentangle processes like photosynthesis and respiration. Early efforts with classical ML models enabled scalable integration of remote sensing and ground-based observations, significantly reducing uncertainties. More recent advancements in deep learning and hybrid modeling approaches now support multi-scale analyses, integrating diverse datasets across terrestrial, oceanic, and atmospheric domains.

However, the quest for a comprehensive ML framework faces persistent challenges. Confounding factors in observational data complicate the identification of key drivers of carbon fluxes, while causal modeling remains underexploited. Extrapolation in space and time, integrating heterogeneous data sources, ensuring robust uncertainty quantification, and balancing predictive power with interpretability are further challenges.

This talk reviews major milestones and explores whether an all-encompassing ML solution is within reach—or if tailored approaches addressing specific challenges are the more realistic path forward.

How to cite: Reichstein, M.: Machine Learning and the Carbon Cycle: Chasing the Holy Grail, EGU General Assembly 2025, Vienna, Austria, 27 Apr–2 May 2025, EGU25-17063, https://doi.org/10.5194/egusphere-egu25-17063, 2025.

EGU25-17324 | ECS | Orals | AS3.44

Using machine learning to enable national methane emissions inference from large satellite datasets 

Elena Fillola, Raul Santos-Rodriguez, Rachel Tunnicliffe, Jeff Clark, Nawid Keshtmand, Anita Ganesan, and Matthew Rigby

The growing volume of methane measurements from space provides new opportunities for evaluating and improving countries' self-reported emissions. Surface emissions can be estimated from atmospheric observations using inverse modelling systems, which often rely on Lagrangian Particle Dispersion Models (LPDMs) to simulate how methane is transported through the atmosphere. Ensembles of particles are transported backwards in time from the measurement point, to define source-receptor relationships (“footprints”), which reflect the sensitivity of a measurement to all potential upwind sources within the domain. However, LPDM-based techniques are computationally costly, struggling to scale to the size of modern satellite datasets and limiting the amount of data that can be used for emissions inference. Previously, we presented a machine learning-driven LPDM emulator that can approximate satellite footprints using only meteorology and topography, and demonstrated its use over the South American continent, achieving speed-ups of over three orders of magnitude compared to the LPDM. We integrated the emulator into an emissions inference pipeline to estimate Brazil’s methane emissions from GOSAT observations in 2016 and 2018, and found that the emulator-based estimates were consistent with those obtained using the more expensive physics-based LPDM. Here, we show preliminary results of applying the emulator to other regions with high natural methane emissions, like North Africa and India. We compare the emulator’s performance across the selected time periods and geographical domains as well as the estimated emissions. Furthermore, we discuss solutions to improve performance and reduce the training data needed, like transfer learning across domains.

How to cite: Fillola, E., Santos-Rodriguez, R., Tunnicliffe, R., Clark, J., Keshtmand, N., Ganesan, A., and Rigby, M.: Using machine learning to enable national methane emissions inference from large satellite datasets, EGU General Assembly 2025, Vienna, Austria, 27 Apr–2 May 2025, EGU25-17324, https://doi.org/10.5194/egusphere-egu25-17324, 2025.

EGU25-17329 | ECS | Posters on site | AS3.44

Recalibrating neural network estimates of net ecosystem exchange in a Bayesian synthesis inversion 

Vitus Benson, Martin Jung, Theo Glauch, Yuming Jin, Basil Kraft, Julia Marshall, Christian Reimers, Alexander J. Winkler, and Markus Reichstein

Using neural networks to upscale eddy covariance measurements is a common approach to obtain global estimates of net ecosystem exchange (NEE) and thereby the land carbon sink. Unfortunately, this approach suffers from a limited representativeness of eddy covariance sites of the global picture, resulting in discrepancies between such data-driven bottom-up estimates of the land-atmosphere fluxes in comparison to independent top-down products from atmospheric inversions. Here, we introduce a novel method to bridge both approaches: recalibrating the last neural network layer in a Bayesian synthesis inversion. In other words, we find the least squares estimate of the last neural network layer weights, by first transporting the deep features and then inverting the covariance matrix of transported features to obtain a least squares estimator against atmospheric observations. This approach is possible because atmospheric tracer transport of CO₂ is a linear operator with respect to the surface fluxes. It is also computationally tractable due to a small number of degrees of freedom, namely just the regression coefficients for the approximately 50 deep features. For comparison, modern CO₂ inversions typically model the land surface flux with over 1000 parameters, which requires them to leverage variational or ensemble approaches for optimization.


The NEE estimates recalibrated using atmospheric data differ significantly from those obtained through pure eddy covariance training within the FLUXCOM-X framework. Namely, the recalibrated estimates show increased agreement with observational data from atmospheric measurement stations, when transported with the atmospheric transport model TM3. Surprisingly, this agreement does not necessarily arise from a greater agreement of global flux maps with results from the Jena CarboScope inversion. Here, the approach may suffer from low robustness of deep features or from regridding fluxes to a lower resolution before transporting them. We discuss ways to alleviate these limitations and outline what our results mean for improving neural network estimates of NEE.


How to cite: Benson, V., Jung, M., Glauch, T., Jin, Y., Kraft, B., Marshall, J., Reimers, C., Winkler, A. J., and Reichstein, M.: Recalibrating neural network estimates of net ecosystem exchange in a Bayesian synthesis inversion, EGU General Assembly 2025, Vienna, Austria, 27 Apr–2 May 2025, EGU25-17329, https://doi.org/10.5194/egusphere-egu25-17329, 2025.

EGU25-17604 | ECS | Posters on site | AS3.44

Hybrid modelling for crop carbon cycle 

Yunan Lin, Maximilian Gelbrecht, Maha Badri, Philipp Hess, Sebastian Bathiany, and Niklas Boers

Given the ongoing climate change and the increasing frequency of extreme weather events, accurately assessing their impacts on crop productivity is crucial for developing adaptation strategies to mitigate negative impacts and ensure sustainable food security in the future. Process-based crop models are the preferred tools to simulate and predict crop yields under climate change. However, due to the simplified representations of complex biophysical processes, these models generally introduce uncertainty when used to account for crop yield losses. Integrating process-based crop models with data-driven machine learning methods shows great promise. In our study, we are developing a hybrid crop model, particularly the carbon cycle components (photosynthesis, carbon allocation, soil carbon decomposition, etc.), based on the state-of-the-art process-based vegetation model LPJmL (Lund-Potsdam-Jena managed Land). The empirical processes and parameters in the carbon cycle of LPJmL are replaced or augmented with neural networks. The resulting hybrid crop model can leverage information from observational data to simulate previously unresolved processes while maintaining the process-based understanding. We showcase how the hybrid crop model generalizes from the LPJmL to capture the carbon cycle under unseen climate conditions.

How to cite: Lin, Y., Gelbrecht, M., Badri, M., Hess, P., Bathiany, S., and Boers, N.: Hybrid modelling for crop carbon cycle, EGU General Assembly 2025, Vienna, Austria, 27 Apr–2 May 2025, EGU25-17604, https://doi.org/10.5194/egusphere-egu25-17604, 2025.

EGU25-18007 | ECS | Posters on site | AS3.44

Towards a greenhouse gas emission monitoring and Verification system for Belgium (VERBE): Evaluation of WRF-GHG simulations with observational data 

Jiaxin Wang, Sieglinde Callewaert, Filip Desmet, Minqiang Zhou, and Martine De Mazière

Belgium’s national greenhouse gas (GHG) inventory currently relies on a bottom-up approach, but incorporating top-down methods using atmospheric observations and inverse modeling offers significant potential to improve the understanding of CO2 and CH4 emissions. The VERBE project aims to develop such a system tailored for Belgium by combining satellite, ground-based remote sensing, and in situ observations from the Integrated Carbon Observation System (ICOS) network with inverse modeling techniques. As part of this effort, we start by assessing the ability of the atmospheric transport model to accurately reproduce the spatiotemporal distribution of GHGs in this region.  

We employed the Weather Research and Forecast model coupled with chemistry in its Greenhouse Gas configuration (WRF-GHG) to simulate the Western Europe region, with a focus over Belgium, from June to August 2018. Simulations were conducted at horizontal resolutions of 9 km and 3 km over two domains. In comparison with meteorological data from Automatic Weather Stations in Belgium and ICOS sites, our results indicate that the WRF-GHG simulation is capable to capture the variations of the near surface meteorological fields (temperature, wind speed and wind direction) very well, especially for temperature.

The simulated CO2 and CH4 are compared with near-surface concentrations at different heights from four ICOS sites around Belgium and with column-averaged dry-air concentrations from the Total Carbon Column Observing Network (TCCON) site in Orléans, France. While WRF-GHG successfully reproduces most observed variations, discrepancies were identified. These include an overestimation of the CO2 peak values at most ICOS sites and an overall underestimation of near-surface CH4 concentrations by 20-30 ppb at three of the four ICOS sites. Additionally, the TCCON comparison revealed a significant deviation in XCO2 in early June, likely due to inaccuracies in biogenic fluxes which are calculated based on the Vegetation Photosynthesis and Respiration Model (VPRM). For XCH4, we find an increasing bias towards the end of summer, possibly related to the background signal.

We will present the latest results of our analysis, including additional observational data and updates to the model configuration aimed at improving model-data agreement such as the integration of the TNO high-resolution fossil fuel inventory and refinements to the VPRM fluxes.

How to cite: Wang, J., Callewaert, S., Desmet, F., Zhou, M., and De Mazière, M.: Towards a greenhouse gas emission monitoring and Verification system for Belgium (VERBE): Evaluation of WRF-GHG simulations with observational data, EGU General Assembly 2025, Vienna, Austria, 27 Apr–2 May 2025, EGU25-18007, https://doi.org/10.5194/egusphere-egu25-18007, 2025.

EGU25-18221 | ECS | Posters on site | AS3.44

Investigating the Benefits of Large-Eddy Simulation for Simulating Urban CO2 Emissions Using WRF-LES Over the Paris Area 

Alohotsy Rafalimanana, Thomas Lauvaux, Charbel Abdallah, Ke Che, Michel Ramonet, Josselin Doc, Olivier Laurent, Morgan Lopez, Anja Raznjevic, Maarten Krol, Leena Järvi, Leslie David, Olivier Sanchez, Andreas Christen, Sue Grimmond, and Will Morrison

Urban areas are significant contributors to global CO2 emissions, and simulating CO2 dispersion in these regions, especially near emission hotspots, presents considerable challenges due to the complex dynamics at small scales. High-resolution simulations are crucial for accurately capturing the dispersion of CO2 in urban environments. As part of the Carbon Atmospheric Tracer Research to Improve Numerics and Evaluation (CATRINE) project, this study employs the Weather Research and Forecasting model with the Large-Eddy Simulation mode (WRF-LES) to simulate CO2 concentrations over the Paris area, aiming to improve plume simulation accuracy. The study evaluates the model's performance in urban environments and investigates the added value of LES by comparing simulation results with those from mesoscale configurations. A series of simulations using five nested domains, with resolutions ranging from 8.1 km to 100 m, were performed to examine the sensitivity of plume structures to model resolution. The study also investigates the propagation of errors when running a pseudo-data CO2 inversion using high-resolution 100-m resolution WRF outputs to generate data, but inverting using lower resolution simulations (300-m and 900-m resolutions). The focus is on understanding how resolution influences inversion model results and quantifying aggregation errors introduced when aggregating higher-resolution outputs to coarser resolutions. 

Preliminary findings emphasize the advantages of LES in capturing complex plume features, reducing numerical diffusion, and producing more concentrated, well-defined CO2 plumes. Resolution intercomparisons highlight that higher resolutions better capture sharp concentration gradients, localized dispersion patterns, significantly outperforming traditional mesoscale models. Additionally, WRF model outputs were validated against observations from various sources, including the Paris Mid-cost CO2 sensor network, total column of CO2 measurements from EM27 and Total Carbon Column Observing Network (TCCON), and wind LIDAR data from six stations across Paris and Île-de-France, collected during the URBISPHERE project. Future studies will extend this research to other urban cities, utilizing different LES models such as WRF-LES, Micro-HH, and Parallelized Large-Eddy Simulation Model (PALM). Intercomparing these models will provide performance metrics on model resolution when assimilating complex urban plumes combining multiple diffuse sources and point sources, thereby further refining the accuracy of CO2 dispersion models for urban emissions monitoring and climate mitigation strategies.

How to cite: Rafalimanana, A., Lauvaux, T., Abdallah, C., Che, K., Ramonet, M., Doc, J., Laurent, O., Lopez, M., Raznjevic, A., Krol, M., Järvi, L., David, L., Sanchez, O., Christen, A., Grimmond, S., and Morrison, W.: Investigating the Benefits of Large-Eddy Simulation for Simulating Urban CO2 Emissions Using WRF-LES Over the Paris Area, EGU General Assembly 2025, Vienna, Austria, 27 Apr–2 May 2025, EGU25-18221, https://doi.org/10.5194/egusphere-egu25-18221, 2025.

EGU25-18419 | ECS | Orals | AS3.44

Predictive models of ecosystem productivity in water-limited conditions 

Samantha Biegel, Konrad Schindler, and Benjamin Stocker

Accurate predictions of environmental controls on ecosystem photosynthesis are essential for understanding the impacts of climate change and extreme events on the carbon cycle and the provisioning of ecosystem services. Widely used machine learning models for simulating ecosystem photosynthesis do not consider temporal dependencies in the data, even though process-understanding suggests these should exist through effects such as soil moisture stress. Here, we investigate the impact of accounting for temporal structure in modelling ecosystem photosynthesis.

Using time-series measurements of ecosystem fluxes paired with measurements of meteorological variables from a network of globally distributed sites and remotely sensed vegetation indices, we train three different models to predict ecosystem gross primary production (GPP): a mechanistic, theory-based photosynthesis model, a straightforward multilayer perceptron (MLP) and a recurrent neural network (Long-Short-Term Memory, LSTM). Through comparisons of patterns in model error, we assess the ability of these models to account for temporal dependencies that arise through effects such as soil moisture stress and cold acclimation. We further investigate the influence of different environmental factors on the generalisability across space.

We find that both deep learning models outperform the mechanistic model, and that the LSTM performs best with an R2 of 0.74. In particular, model skill is consistently good across moist sites with strong seasonality. Model error tends to increase with increasing potential cumulative water deficit, in particular in ecosystems with evergreen vegetation. Generalisation patterns reveal that the LSTM tends to be more successful than the MLP in adapting to arid environments and to ecosystems with seasonal dryness, suggesting an advantage of recurrent models for GPP modelling in those conditions. However, there remains a large variability in model skill across arid sites.

Our findings reveal the impacts on model error due to unknown effects of water limitation when predicting fluxes across different ecosystems. Due to climate change, temporal dependencies such as water limitation are becoming more prevalent, making an accurate representation of such processes increasingly important for modelling ecosystem function.

How to cite: Biegel, S., Schindler, K., and Stocker, B.: Predictive models of ecosystem productivity in water-limited conditions, EGU General Assembly 2025, Vienna, Austria, 27 Apr–2 May 2025, EGU25-18419, https://doi.org/10.5194/egusphere-egu25-18419, 2025.

EGU25-20406 | ECS | Posters on site | AS3.44

An uncertainty quantification framework for data-driven carbon flux upscaling 

Qi Yang, Sophia Walther, Jacob Nelson, Gregory Duveiller, Zayd Hamdi, and Martin Jung

Data-driven upscaling of biogenic fluxes from eddy covariance (EC) sites to the global scale is a powerful complementary approach to process-based models for the derivation of global flux estimates. Nevertheless, significant uncertainties arise due to specific methodological choices such as data availability, data source differences, machine learning model differences, and feature selection. Accurately quantifying these uncertainties from diverse sources is essential for providing error estimates of the simulated fluxes. These uncertainties not only improve our general understanding of carbon cycle processes but also directly inform atmospheric inversions, which can use the upscaled net ecosystem exchange (NEE) as a prior. However, most existing data-driven global carbon flux products focus solely on flux estimates or provide incomplete uncertainty assessments limited to a few sources.

In this study, we introduce a comprehensive framework for quantifying the uncertainties associated with carbon flux upscaling across potential sources. The framework involves three key steps: (1) pre-ensemble generation, (2) screening, and (3) uncertainty attribution. First, we construct ensemble members by training machine learning models with varying configurations, which include climate forcing datasets, feature combinations, subsets of EC sites, machine learning algorithms, and their hyperparameters. The experiments are supported by the recently developed data-driven modeling framework FLUXCOM-X, which enables a wide range of experiments with diverse methodological choices. We crafted a feature set that includes about 300 features to capture both current and historical state information. To capture the site representativeness uncertainty, we sample subsets from global EC sites based on geolocation and feature space. Additionally, we will also investigate different machine learning models and the variation of hyperparameters to generate the ensemble. Second, ensemble members that have a low contribution to the ensemble variance will be eliminated while we retain the most representative ones. We employ a feature selection algorithm, HybridGA, to screen important subfeature sets from near-infinite combinations. Moreover, we screen other ensemble members by assessing the distribution and spread of members. Finally, we will attribute uncertainties to various categories from the perspectives of machine learning and process-based modeling, and potential strategies to reduce these uncertainties are discussed. The framework is initially used to evaluate spatiotemporal NEE uncertain patterns in Europe, and will subsequently expand globally. Additionally, the estimated biogenic carbon flux uncertainty will be assessed with independent products. This work not only advances our understanding of the sources and patterns of upscaled flux uncertainties but also enhances the robustness of posterior estimates in atmospheric inversion models.

How to cite: Yang, Q., Walther, S., Nelson, J., Duveiller, G., Hamdi, Z., and Jung, M.: An uncertainty quantification framework for data-driven carbon flux upscaling, EGU General Assembly 2025, Vienna, Austria, 27 Apr–2 May 2025, EGU25-20406, https://doi.org/10.5194/egusphere-egu25-20406, 2025.

CC BY 4.0